Abstract
This study develops a globally adaptable and scalable methodology for high-resolution, building-level population mapping, integrating Earth observation techniques, geospatial data acquisition, and machine learning to enhance population estimation in rapidly urbanizing cities, particularly in developing countries. Using Bangkok, Thailand, as a case study, this research presents a problem-driven approach that leverages open geospatial data, including Overture Maps and OpenStreetMap (OSM), alongside Digital Elevation Models, to overcome limitations in data availability, granularity, and quality. This study integrates morphological terrain analysis and machine learning-based classification models to estimate building ancillary attributes such as footprint, height, and usage, applying micro-dasymetric mapping techniques to refine population distribution estimates. The findings reveal a notable degree of accuracy within residential zones, whereas performance in commercial and cultural areas indicates room for improvement. Challenges identified in mixed-use and townhouse building types are attributed to issues of misclassification and constraints in input data. The research underscores the importance of geospatial AI and remote sensing in resolving urban data scarcity challenges. By addressing critical gaps in geospatial data acquisition and processing, this study provides scalable, cost-effective solutions in the integration of multi-source remote sensing data and machine learning that contribute to sustainable urban development, disaster resilience, and resource planning. The findings reinforce the transformative role of open-access geospatial data in Earth observation applications, supporting real-time decision-making and enhanced urban resilience strategies in rapidly evolving environments.
1. Introduction
1.1. Background
Access to population data is essential for comprehensively understanding demographic dynamics, which is crucial for analyzing residents’ needs and planning policies accordingly. While population growth rates in many developed countries have slowed, urbanization continues to accelerate, particularly in the cities of developing countries where population growth remains significant [1,2,3,4,5]. In addition, the United Nations’ initiatives aim to systematically record national populations to monitor progress toward the 2030 Agenda for Sustainable Development [6].
For example, Figure 1 illustrates the trends in urban and rural populations worldwide, in Japan (a developed country), and in Thailand (a developing country and the study area of this study). In Japan, the rural population began to decline rapidly around 2000, while urban population growth also plateaued around 2010. In contrast, in Thailand, the rural population started to decline gradually around 2000, whereas rapid urban population growth began, surpassing the rural population in the late 2010s. Such urban population growth trends are not unique to Thailand but are widely observed in many developing countries worldwide, showing a surpassing urban population share around 2000 [1,7]. This transition has underscored critical urban planning difficulties, especially in rapidly expanding metropolitan areas like Bangkok, where infrastructure deficits, environmental degradation, and social disparities have become increasingly pronounced. These issues, explored in greater detail in the subsequent sections, highlight the urgent need for robust and accurate population mapping to address urbanization challenges effectively.
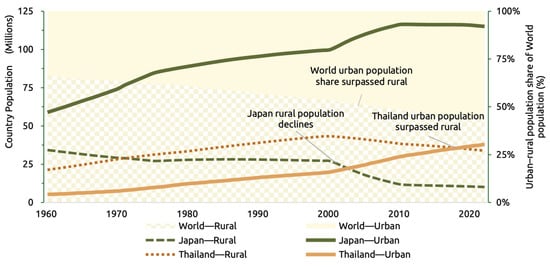
Figure 1.
Urban and rural population trends from 1960 to 2020 in the world, Japan, and Thailand.
1.2. Challenges Posed by Urban Population Growth
Urban population growth imposes significant challenges, including excessive infrastructure burdens, increased environmental impacts, and widening social inequalities. In rapidly urbanizing regions, existing urban planning frameworks and public services often struggle to keep pace with the escalating population, leading to severe issues such as traffic congestion, housing shortages, and unstable water and electricity supply systems [8]. Moreover, higher population densities exacerbate air pollution and waste management issues, further compromising urban sustainability [9]. These challenges not only diminish overall quality of life but also negatively affect economic activities and public health. Additionally, abrupt urban expansion alters land use patterns, intensifying environmental risks such as flooding and land subsidence. Many cities are experiencing reduced green spaces and wetlands due to population-driven urban sprawl, resulting in increased impervious surfaces that degrade natural drainage systems and heighten flood risks [10]. These issues are particularly pronounced in regions vulnerable to climate change, underscoring the urgent need to enhance urban resilience.
The situation is especially critical in developing countries, where rapid urbanization exacerbates existing deficiencies in urban planning, infrastructure, and housing [11]. The shortage of adequate housing has led to the proliferation of informal settlements, where access to fundamental public services such as potable water, sanitation, and electricity remains severely limited [12,13,14]. Consequently, deteriorating public health conditions and entrenched poverty cycles further deepen social inequalities. Additionally, inadequate transportation infrastructure results in prolonged commuting times and higher mobility costs, diminishing economic productivity while also contributing to worsening air pollution [15,16]. From a disaster risk perspective, unregulated urban expansion often leads to the clustering of structurally weak buildings in hazard-prone areas, such as floodplains and landslide-prone slopes, amplifying vulnerability to natural disasters [17,18].
Thus, urban population growth, particularly in developing regions, manifests as a complex interplay of infrastructure deficits, escalating environmental degradation, expanding social disparities, and increased disaster risks. Addressing these multifaceted challenges requires accurate and high-resolution population distribution data, which are essential for effective urban planning and informed policymaking.
1.3. Existing Studies and Challenges in Population Mapping
Understanding urban population distribution is critical for effective urban planning, and population mapping has been widely recognized as an essential tool in this context. Traditional approaches have relied on government-conducted population censuses, leading to the development of choropleth maps, which aggregate population data by administrative units; dasymetric mapping, which redistributes population estimates based on ancillary data; and gridded population datasets, which provide spatially disaggregated estimates [19,20,21]. However, these methods are heavily dependent on census data, which are often updated infrequently and may suffer from accuracy limitations. The challenge is particularly pronounced in developing countries, where access to up-to-date census data is limited, and significant discrepancies between official statistics and actual population distributions have been reported [22,23].
Numerous nations have faced significant challenges in ensuring timely updates to their census data, a situation further complicated by disruptions caused by the COVID-19 pandemic, which have impacted both data collection capabilities and funding [24,25,26,27,28]. Thailand, which serves as the study area for this research, has not conducted a comprehensive update of its national population census since 2010. While these datasets offer a broad overview, their temporal relevance has been compromised due to delays exacerbated by the pandemic, limiting their applicability in dynamic urban analysis [24,25]. In addition to census data, many governments, including Thailand’s, have adopted resident registration systems to maintain population records. However, an evaluation of these datasets within the Bangkok Metropolitan Region revealed notable inconsistencies, indicating that resident registration data do not accurately reflect actual population figures (Figure 2). A comparative analysis between the 2010 national census and concurrent resident registration data demonstrates significant statistical divergence (a 32.3% lower registered population than enumerated, representing approximately 2.8 million individuals, with R2 of 0.66) [23]. These discrepancies suggest the presence of extensive informal settlements, a common phenomenon in many rapidly urbanizing regions of the Global South.

Figure 2.
Spatial visualization of the population difference between the 2010 household registration records and the 2010 population census in the Bangkok Metropolitan Region, Thailand, at the district level.
The challenges associated with obtaining accurate population data in developing countries stem from multiple interrelated factors. The fundamental dataset for population analysis is typically derived from official population records [21,29,30] but the data collection process is fraught with obstacles, including financial constraints [28,31,32,33], privacy concerns [31,34], limited accessibility [33,35,36], and significant temporal lags between data collection and publication [37]. Such delays significantly undermine the accuracy of demographic analyses and subsequently impair effective policy formulation. For example, India has postponed its national census until 2026 despite projections indicating that its population would surpass China’s within this period. This reliance on outdated demographic information has negatively impacted policy planning and welfare distribution [26,27]. Such temporal discrepancies often result in inaccuracies, as traditional census data may fail to reflect real-time population densities and distributions accurately. In contrast, some high-income regions, such as Japan [38] and EU countries [39], have been developing and maintaining gridded population datasets with finer spatial resolutions, often made available as open data. However, in most other countries, population data continue to be aggregated at coarser administrative levels, such as municipalities or districts, limiting their applicability for detailed spatial analyses. These limitations include temporal lags between censuses that can introduce significant biases, particularly in rapidly urbanizing areas undergoing substantial demographic shifts. Such temporal discrepancies often result in inaccuracies, as traditional census data may fail to reflect real-time population densities and distributions accurately [27].
Furthermore, while some commercially available population datasets exist [40,41,42], cost remains a significant barrier to their widespread adoption in developing countries. The financial burden associated with procuring and maintaining high-resolution, proprietary population datasets poses a substantial challenge, making it infeasible for many governments and research institutions to integrate such data into large-scale, long-term urban planning and management frameworks [43].
1.4. Research Objectives
Taking these challenges into account, this study aims to address the aforementioned challenges, particularly those related to the development and maintenance of high-precision population datasets in developing countries. To achieve this, we propose a cost-effective and globally applicable approach that leverages open data to facilitate the accurate and sustainable collection, update, and analysis of population information. Specifically, we developed a micro-dasymetric population mapping method at the building level, which enables fine-scale population estimation. The dataset generated through this approach is referred to as “Micro Population Data”. By implementing this building-scale population mapping, we enhanced the ability to conduct micro-scale analyses [44], providing valuable insights into community needs, infrastructure demands, and environmental impacts.
To achieve these goals, this study focuses on:
- Developing a globally applicable micro-dasymetric population mapping framework to enable high-resolution, building-level population estimation by incorporating methods for imputing missing attributes.
- Leveraging open geospatial data and remote sensing technologies to enhance the accuracy and scalability of population mapping while integrating advanced data processing techniques to refine missing or incomplete building attributes.
- Testing and validating the model using openly available datasets and integrating advanced population mapping techniques with geospatial tools and machine learning-based imputation methods to enhance estimation accuracy.
- Establishing a cost-effective and continuously updatable population estimation model to overcome the limitations of traditional census-based approaches, ensuring scalability and long-term applicability in data-scarce environments, particularly in developing countries.
Our methodology integrates advanced population mapping techniques with multiple open-source data streams to develop a scalable and cost-effective solution for data-scarce environments. Given the absence of temporally consistent reference data, the effectiveness of this approach will be assessed using multiple population datasets as benchmarks. By leveraging a method initially developed in Japan, where high-quality reference data were available, we aimed to extend and test the model in Bangkok, Thailand. This region exhibits contrasting levels of data reliability, allowing us to evaluate the model’s adaptability across diverse urban contexts. To address potential discrepancies, we incorporated modifications to the framework, ensuring alignment with the characteristics of regions where the original model may encounter limitations.
By integrating innovative machine learning techniques with openly accessible datasets, this research seeks to bridge critical gaps in population mapping. It contributes to sustainable urban planning and policymaking by providing high-resolution, actionable insights into population distribution while ensuring accessibility for resource-constrained communities worldwide.
2. Material
This study aims to evaluate the transferability of Japan’s established urban analysis methodology to Thailand, testing its applicability. Japan represents an optimal methodological baseline due to its exceptionally comprehensive spatial data infrastructure, characterized by fine-resolution building attribute data derived from systematic surveys [45] and population data available at granular mesh sizes of 250 m [46]. In contrast, developing regions typically operate with significantly constrained data environments. This research extends previous frameworks by implementing an analysis in Bangkok using alternative open datasets, thereby investigating methodological adaptability in data-limited contexts.
2.1. Study Area
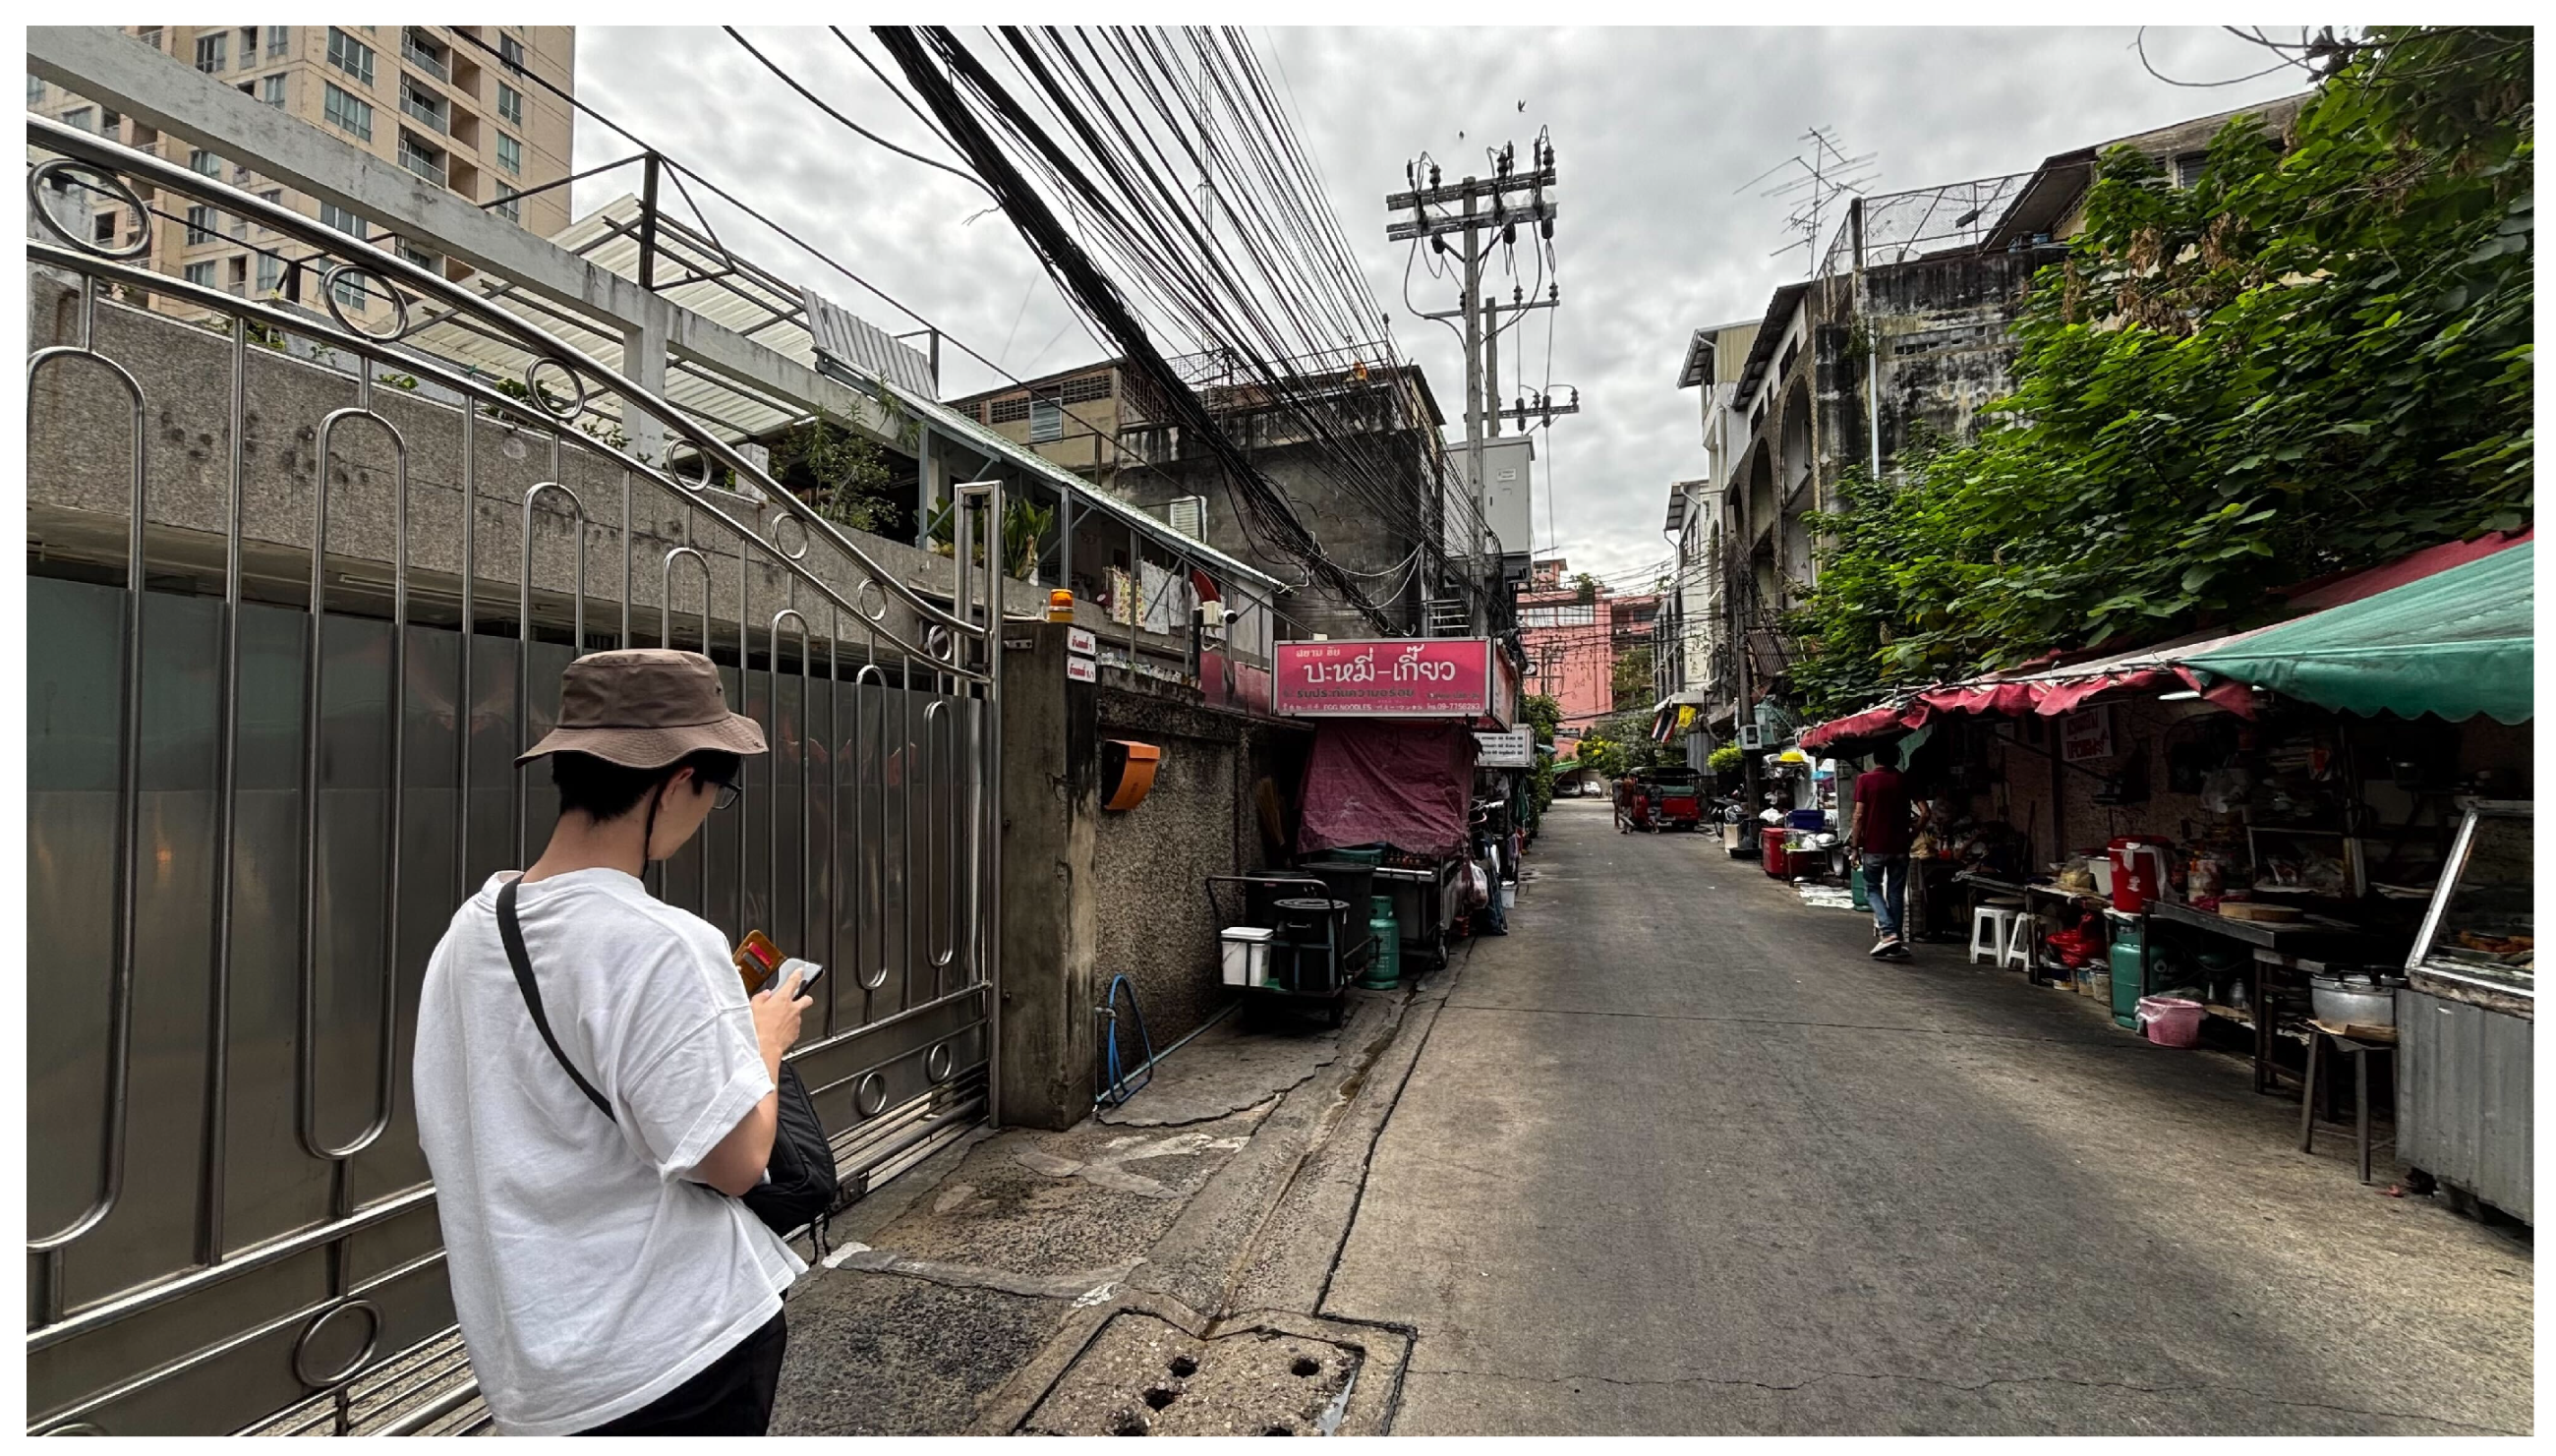
This study was conducted in Bangkok, the capital of Thailand, located in Central Thailand, which was selected as the study area due to its rapid urbanization and significant population growth. Bangkok is geographically situated along the banks of the Chao Phraya River, covering an area of approximately 1566 square kilometers. The city is home to over 5 million registered residents, with an additional 3 million unregistered migrants [23], collectively accounting for approximately 15% of the country’s total population. With a population density exceeding 6600 people per square kilometer, Bangkok ranks among the most densely populated cities in Southeast Asia. It serves as a political, cultural, and economic hub for the region, experiencing intense urban expansion and significant land use changes over the past few decades. Its combination of rapid urban growth, high population density, and dynamic land use changes presents unique challenges for urban planning, disaster risk management, and environmental sustainability.
Bangkok’s rapid population increase, driven by both natural growth and large-scale rural-to-urban migration, has placed immense pressure on urban infrastructure, public services, and environmental sustainability. The city has experienced widespread land cover transformations, with former agricultural and green areas converted into dense urban developments. These changes have led to increased impervious surfaces, which exacerbate flood risks, a critical issue in low-lying urban regions [47]. Given these dynamics, high-resolution population data and advanced geospatial analysis techniques are essential to understanding the evolving urban landscape and supporting sustainable development planning.
From a geospatial perspective, the study area consists predominantly of a low-lying alluvial plain with relatively flat terrain, as illustrated in Figure 3. Terrain complexity was identified as an important factor influencing spatial variability, particularly in terms of flood susceptibility and urban heat island effects. This complexity was quantified using the Terrain Ruggedness Index (TRI), which measures the standard deviation of elevation differences between a point and its adjacent points. TRI values for the area were derived from NASADEM data with a spatial resolution of 30 m. The analysis yielded a mean TRI value of 4.20 m with a standard deviation of 2.76 m, indicating moderate variability in terrain ruggedness across the study area.
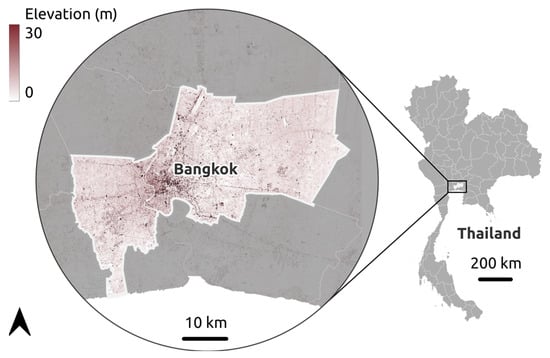
Figure 3.
Study area.
2.2. Data Sources
The dataset employed in this study consists of Overture Map Building Footprints, OpenStreetMap (OSM) Point-of-Interest (POI) data, household size and composition, and Digital Elevation Models (DEM), including both the Digital Surface Model (DSM) and the Digital Terrain Model (DTM), as detailed in Table 1. These datasets, derived from Earth observation and open geospatial sources, facilitate the acquisition of high-resolution spatial information, essential for modeling urban population distributions.

Table 1.
Information on the source data of this study.
To support building height estimation for this study, among many available global DEMs, ALOS AW3D30 and NASADEM were selected based on key criteria such as open access, temporal coverage, spatial resolution, and alignment with this study’s objectives. While advanced DEMs like LiDAR offer unparalleled spatial resolution and accuracy for urban studies [53,54,55,56], their limited global accessibility is highly constrained [56], making them unsuitable for broad-scale applications or scenarios prioritizing open data use in many of the regions. The choice of ALOS AW3D30 and NASADEM is based on the balance between resolution, accuracy, and data accessibility, as detailed in Table 2. ALOS AW3D30 is known for its high accuracy, with a vertical resolution of 5 m, a spatial resolution of 30 m, and global coverage up to March 2016 [50]. NASADEM, in contrast, serves as a DTM and provides terrain data from February 2000, maintaining a comparable spatial resolution [51]. While NASADEM’s temporal coverage is older, it remains relevant due to minimal changes in urban ground surfaces over time. Both models provide global spatial coverage and are widely used in urban and regional planning, each offering distinct advantages in terms of resolution and accuracy. Although NASADEM is nominally a DTM, our analysis revealed the presence of surface objects in the data, not presenting ground elevation exclusively. Therefore, ALOS AW3D30 is used as the primary source for height estimation, and NASADEM is used as a supplement ground reference.
Aerial imagery from Google Earth presents a challenge in balancing accessibility with the precision required for this study. While alternatives may offer more openly licensed data, Google Earth provides high-quality satellite imagery that is valuable for geospatial analysis. As this research is categorized as academic, its use is permissible [57]. However, careful attention must be given to licensing restrictions when replicating this study.
Building footprint data used in this study were sourced from Overture Maps, which extends OSM through machine learning techniques applied by major technology companies [48]. OSM, as a crowdsourced geospatial database, provides critical building information, including footprints, usage, and height or number of floors [49]. However, global data completeness remains a significant limitation, as the overall utilization of OSM building data is estimated at less than 20%, while height-related attributes are available for fewer than 5% of structures [58,59]. Moreover, these attributes are predominantly available in well-maintained regions, restricting their broader applicability [59]. To address these limitations, Overture Maps enhances OSM by supplementing its attributes, thereby making it a more comprehensive resource for urban spatial analysis [48].
Table 2.
Detailed information on the selected DEMs [60].
Table 2.
Detailed information on the selected DEMs [60].
| Characteristic | AW3D30 | NASADEM |
|---|---|---|
| Spatial resolution (m) | 30 | 30 |
| Vertical accuracy (m) | <5 | 3.5 |
| Datum | ITRF97 and GRS80, using EGM96 | WGS84/EGM96 |
| Methodology | Photogrammetry | Interferometric SAR |
| Data source | ALOS PRISM | SRTM, ASTER GDEM, ICESat |
Household size and composition, as reported by the United Nations, are derived from meticulously maintained census data and global coverage and are available for public access [52].
2.3. Validation and Training Data
The validation data used in this study originates from our field survey conducted to gather comprehensive building information for model evaluation and accuracy assessment. The survey was necessary as there were no public or open-access data available. These data serve as a crucial benchmark for assessing the accuracy of building footprint extraction and height estimation, and the collection methodology and attribute details are outlined in Appendix A. The survey area was selected based on recent urban expansion trends in the Bangkok Metropolitan Region, as reported by the Policy and Planning Division, Office of City Planning and Development, Bangkok [61].
To further enhance validation, high-accuracy building height data were incorporated from NTT Data Corporation, providing a robust reference for evaluating the performance of remote sensing-based height estimations. This dataset is commercially available and considered proprietary, offering high-precision building height information derived from the stereo image processing of satellite data. Given the limited availability of globally consistent LiDAR data, this dataset provides an alternative high-resolution validation source for urban-scale applications.
The geographical coverage of the validation data encompasses the Vadhana District and the Saphan Sung District of Bangkok, representing a diverse urban morphology with varying building densities and land use patterns. The dataset includes approximately 110,000 buildings, offering a significant sample for model evaluation. The height data were extracted from the ALOS AW3D Enhanced DSM, a commercial dataset with a maximum spatial resolution of 0.5 m and a vertical accuracy of 1 m. The integration of high-resolution DEMs and satellite-derived elevation models ensures a rigorous validation framework for population estimation and urban planning applications.
By leveraging multi-source validation data, including our field survey observations and high-resolution DSM-based dataset, this study ensures a robust evaluation framework that aligns with the objectives of remote sensing-based urban analysis. These validation datasets provide key insights into the accuracy of open-source geospatial data and their applicability to scalable population mapping models.
3. Methods
The methodology section begins with an overview of population distribution modeling, followed by the development of attribute data, a critical component in this study. Attribute data serve as essential input variables for the population estimation framework, enabling a more accurate and spatially refined representation of urban population distribution. This study integrates remote sensing-derived datasets, open geospatial data, and advanced spatial analysis techniques to enhance the precision and scalability of the estimation framework. The methodology employs a combination of machine learning-based data imputation, remote sensing data fusion, and high-resolution spatial modeling, ensuring that missing attributes are effectively compensated for while enhancing the reliability and scalability of population estimation in diverse urban environments. This problem-driven approach directly addresses data availability and granularity challenges that hinder traditional census-based methods. The overall workflow of the research is illustrated in Figure 4. It demonstrates how multi-source data are integrated into a structured and reproducible analytical pipeline for urban population mapping.
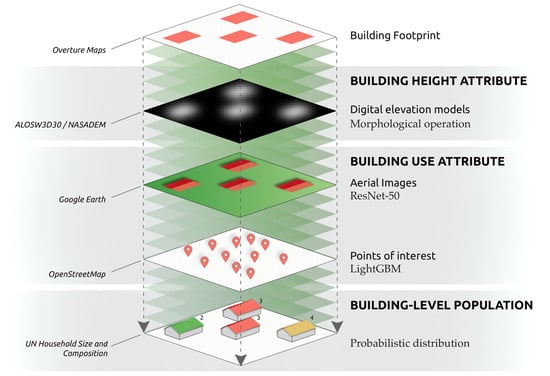
Figure 4.
Workflow of this study.
3.1. Population Distribution
This study builds upon previous research that leverages building information datasets [60,62] for high-resolution population distribution mapping. The key attributes considered include building location, footprint, height, number of floors, usage, and realistic population fluctuations. These attributes play a crucial role in accurately estimating population distribution, particularly in densely populated and rapidly urbanizing regions. Table 3 outlines the different scenarios for population distribution analysis under varying levels of data availability, demonstrating how data completeness influences the accuracy of the population estimation framework. The population distribution algorithm employs a dasymetric pro rata approach, integrating population statistics and household numbers, which are then allocated at the individual building level based on building-specific attributes.
Table 3.
Population distribution analysis considering data availability constraints.
In this study, open data sources such as Overture Maps, which extends to OpenStreetMap (OSM) [63], provided comprehensive building footprint data, ensuring the accuracy of building location information. However, a major limitation of these datasets is the lack of detailed building attributes, particularly height and usage [59]. Since these attributes significantly impact the accuracy of population distribution modeling, further refinement is required. To address this limitation, machine learning-based imputation techniques and classification methods were employed to enhance the completeness of building height and usage data, enabling a more robust and scalable population estimation framework. By integrating remote sensing-derived elevation models and auxiliary geospatial datasets, the availability and accuracy of these essential building attributes can be significantly improved.
The initial step in the population distribution methodology involves determining the volume of each building (vij) by multiplying the building’s area (sij) by its number of floors (fij), expressed as follows:
where
- vij: volume of the building j in subarea i.
- sij: area of the building j in subarea i.
- fij: number of floors of building j in subarea i.
In cases where the floor number is not specified, the building height was utilized to estimate the number of floors. This estimation follows the guidance provided by the Building Control Act, B.E. 2522 [64] and assumes an average floor height of 3.0 m, consistent with the study area standards.
Subsequently, the number of households was allocated to each building based on its relative volume within the subarea. The number of households assigned to a building (hij) is calculated as follows:
where
- hij: number of households assigned to building j in subarea i.
- Hi: total number of households in subarea i.
- m: number of buildings in the subarea.
To refine the population distribution estimates further, the estimated area of each household is derived from the building volume and the number of households allocated to that building for each building category. The estimated household area is calculated as:
where is the estimated area of each household in building j in subarea i.
Finally, the number of residents allocated to each household (rij) is determined based on the estimated household area. This is expressed as:
where
- rij: number of residents assigned to building j in subarea i.
- Ri: total number of residents in subarea i.
This methodological approach allows for an accurate estimation of population distribution by accounting for the relative volumes of buildings and the corresponding household areas within each subarea. This approach improves the reliability of population allocation by incorporating variations in building sizes, household distributions, and subarea characteristics.
3.2. Building Attributes
3.2.1. Building Height Estimation
Ensuring reproducibility and accessibility, this study utilized open-access remote sensing datasets to estimate building heights. Specifically, photogrammetry-derived Digital Surface Models (DSM) were employed to extract building heights, while Interferometric Synthetic Aperture Radar (InSAR)-derived Digital Elevation Models (DEM) served as ground reference data. The methodology was adapted to leverage the globally available and openly accessible ALOS AW3D30 dataset [60,65].
There have been numerous studies on estimating building heights using machine learning-based approaches [66,67], as well as research focusing on the utilization of remote sensing-derived products [65,68,69]. Additionally, several investigations have employed high-resolution DEMs and point cloud data, including InSAR and LiDAR techniques [54,56,70,71,72]. While these methods have demonstrated high accuracy, their applicability is often constrained by data accessibility, high computational costs, and the lack of global coverage. Current state-of-the-art research often employs high-resolution elevation data (up to 10 m) to produce lower-resolution building height maps (90 m) [69,72] or covers extensive US areas using LiDAR [56], indicating the demand for high-quality input for the estimation. In contrast, this study prioritizes the use of open-source datasets, allowing for a scalable, cost-effective, and globally applicable approach. While this may result in lower data quality compared to proprietary datasets, a comprehensive evaluation of its performance is conducted to ensure the feasibility and reliability of open-access remote sensing data for urban analysis.
The core principle of the methodology involves calculating the difference between ground and non-ground elevation points [53,55]. This study employs a DSM and a Digital Terrain Model (DTM) to derive the Surface Height Model (SHM), which represents the height of surface objects:
where
- fSHM: surface height model.
- fAW3D30: surface elevation from AW3D30, non-ground points.
- fDTM: terrain elevation derives from AW3D30, ground points.
The DTM, used to represent the terrain for calculating surface object height, was derived from the ALOS AW3D30 dataset via morphological erosion, which can be expressed as:
where
- εB(∙): morphological erosion operation with structuring element B.
- B: structuring element (SE).
To account for terrain variations, a terrain correction was then performed, particularly for slopes exceeding 10 percent [65], which were identified using Horn’s slope algorithms [73]. The correction was based on NASADEM as the reference DTM. In terrain areas with steep slopes, the overestimation of building heights may occur. The height correction for a slope () is determining by computing the differences between the eroded , which represents the “bottom of the slope (BOS)”, and the dilated , which represents the “top of the slope (TOS)”. The corrected surface height model at a given location is expressed as:
where
- cSHMij: corrected SHM at position (i,j).
- SHMij: SHM at position (i,j).
- slopeij: slope value at position (i,j).
- : slope correction based on terrain.
- x: threshold slope percentage.
Building height estimates were computed as gross height , and net usable height used the following equations:
where
- SHM(x,y): elevation value at a given pixel location (x,y).
- BFi: building footprint i.
- N: total number of pixels within the building footprint.
By integrating open-access DSM and DTM datasets, combined with robust spatial modeling techniques, this study ensured that building height estimation remained scalable, cost-effective, and globally applicable. Despite potential data quality limitations compared to proprietary datasets, the methodology emphasizes repeatability, adaptability, and validation to enhance the usability of open-source remote sensing data in urban analysis.
3.2.2. Building Use Classification
Several approaches for urban building use classification methods exist in the literature, utilizing aerial photographs, street-view imagery, and graph-based methods [58,74,75]. While these methods have demonstrated considerable success, they are often limited by data accessibility, computational requirements, and scalability issues. Despite advances in these technologies, balancing data quality, cost, and global applicability remains a critical consideration for practical implementation in urban analysis. To address these challenges, this study prioritizes the use of open-source and widely accessible datasets, ensuring that the methodology remains scalable, cost-effective, and globally reproducible, particularly for rapidly urbanizing regions with limited data availability.
This study implements a dual-modal classification framework that integrates geospatial feature analysis and computer vision techniques to enhance the accuracy and scalability of urban building use classification. Given the diversity of the available data modalities, two distinct model architectures were developed [60,76], as visualized in Figure 5:
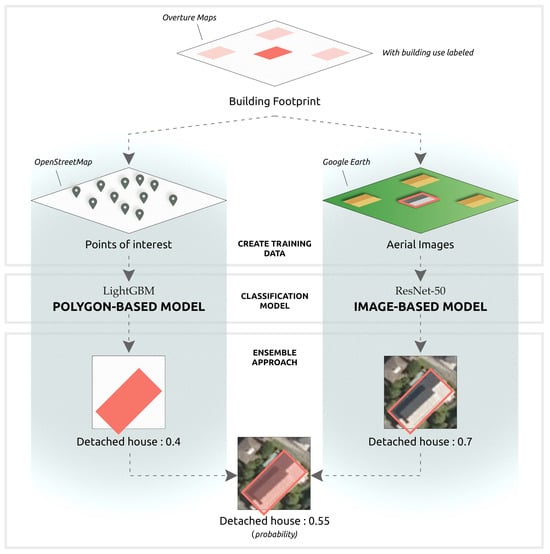
Figure 5.
Building use classification workflow.
- Polygon-Based Classification Model.
- Image-Based Classification Model.
An ensemble approach was applied to derive building use classifications, combining polygon-based and image-based classification models through an arithmetic averaging of their predicted probabilities. This strategy minimizes individual bias and enhances overall classification robustness.
The Polygon-Based Classification Model processes tabular data derived from building polygons and urban context features using LightGBM (Light Gradient Boosting Machine), as depicted in Figure 6. The features relevant to classification include geometric attributes (area, perimeter-to-area ratio, footprint complexity), proximity metrics to POIs, and road network characteristics [76]. A detailed description of these attributes is provided in Appendix B (Table A7 and Table A8).
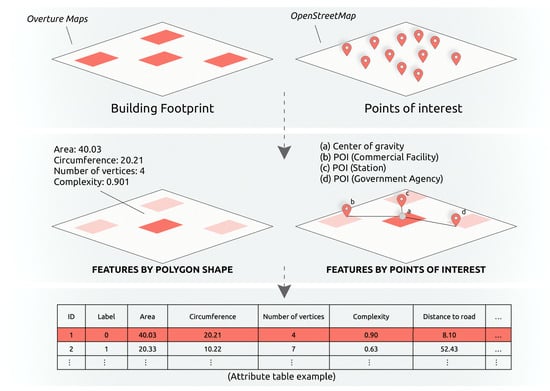
Figure 6.
Polygon-based classification scheme.
The selection of LightGBM as the classification model was guided by the consideration of model capabilities. Traditional linear classifiers (e.g., logistic regression) are inadequate for modeling complex nonlinear spatial relationships inherent in urban datasets [77]. Although alternative nonlinear methods like Random Forests and Support Vector Machines (SVM) are effective at modeling complex interactions, they often benefit from preprocessing steps to address missing data. Given that urban datasets, particularly POI and road network data, often contain missing values at broader spatial scales, it was essential to select a model capable of inherently managing incomplete records.
Compared to other gradient-boosting decision tree (GBDT) implementations like XGBoost or CatBoost, LightGBM offers the native handling of missing values, computational efficiency through histogram-based algorithms, and an asymmetric tree-growth strategy, making it especially suitable for large-scale urban analytics [78]. Thus, LightGBM aligns closely with this study’s goals of scalability, accuracy, cost-effectiveness, and global reproducibility.
The Image-Based Classification Model (Figure 7) was implemented using ResNet-50, a Convolutional Neural Network (CNN) architecture, with transfer learning initialization. This model processes aerial imagery validated through field-collected ground truth data, enhancing classification accuracy by leveraging deep feature representations extracted from this high-resolution aerial imagery, making it an effective complement to polygon-based classification. This model’s ability to analyze spatial texture and visual patterns extends the framework’s precision in urban contexts, particularly where geospatial tabular features alone may not provide sufficient granularity.
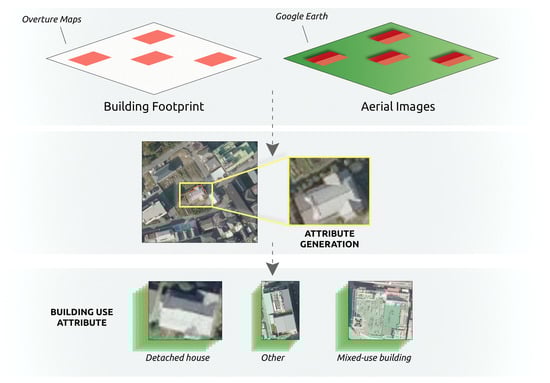
Figure 7.
Image-based classification scheme.
By integrating these two complementary classification models and utilizing remote sensing and geospatial data, this study establishes a highly scalable, cost-efficient, and globally applicable building use classification framework. Unlike existing methodologies that require high-cost proprietary data or computationally intensive deep learning models [74,75], this approach maintains a balance between accuracy, affordability, and accessibility, making it particularly valuable for developing regions experiencing rapid urban expansion.
4. Results
4.1. Building Height Estimation Results
An experiment was undertaken to approximate building heights using an open data source, which encompassed building footprints from the Overture Map. The primary Digital Surface Model (DSM) dataset utilized was ALOS AW3D30. The visualization is presented in Figure 8.
Figure 8.
Visualization of the estimated building height in Bangkok (over the Pathum Wan and Vadhana Districts).
The estimation process is performed using erosion techniques on Digital Surface Model (DSM) data. It was verified that the DSM pixel size substantially surpasses the building size. However, the building patch is deemed significant in relation to both the building size and the pixel size. The footprint of detached houses relative to the pixel size is illustrated in Figure 9. By examining the average footprint size of buildings, the optimal size for the structuring element is established.
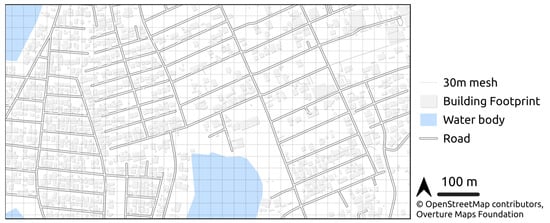
Figure 9.
A 30 m (equivalent to 1 pixel of DEMs used) mesh over the building footprint.
Bangkok’s relatively flat geographical characteristics suggest that smoother terrain facilitates better estimation of building heights. Previous studies indicate that building height estimation is more accurate in less complex terrains, thus providing a positive expectation for our results. Table 4 presents a detailed evaluation of determining the optimal size of the structuring element (B) utilized for detecting surface objects, ranging from 3 × 3 pixels (equivalent to 90 m side-length) to 33 × 33 pixels (990 m).
Table 4.
Building height estimation accuracy assessment.
Considering the size of the structuring element that yields the lowest MAE and RMSE and the highest accuracy, an accuracy of 5 m was used in the assessment, as it aligns with the quality of the input DSM data. The 19 × 19 structuring element was found to perform best. It is important that the structuring member be relatively large compared to the building, allowing us to infer that the general building patch is approximately 570 m.
Despite satisfactory MAE and RMSE values, the coefficient of determination (R2) remains relatively low, consistent with findings in similar geospatial applications. Morphological operations at our operational resolution inevitably homogenize complex building structures toward local means. This aligns with our observation that very high building structures may not be well captured, resulting in smoothed-out height details. This explains the reduced predictive variance while maintaining acceptable absolute errors.
This resolution-induced constraint could potentially be mitigated by scaling the resolution or employing modifiers to improve the accuracy of building block estimation. Based on our evaluation, we selected the structuring element B of 19 × 19 for subsequent height estimation phases.
4.2. Building Use Classification Results
The classification results are presented in Table 5 and Table 6, providing a structured evaluation of the building use classification model. The classification categories analyzed in this study include townhouses, detached houses, mixed-use buildings, and others, derived from training data obtained through field surveys.
Table 5.
Performance metrics for building use classification.
Table 6.
Building use classification normalized confusion matrix.
The model achieved the highest performance for detached houses, with a precision of 0.777, recall of 0.905, and F1-score of 0.836. Subsequently, its performance was validated with a corrected classification rate of 90.54% considering that this category constitutes the largest portion of the dataset at 58.21% (1194 out of 2051). This demonstrates the model’s robust capability to manage this class effectively.
For mixed-use buildings, the model achieved moderate performance metrics (precision: 0.716, recall: 0.653, F1-score: 0.683). The classification model demonstrated promising results by correctly identifying 65.29% of buildings within this specific class. This performance is particularly noteworthy because the building class itself possesses inherent ambiguities that challenge even human observation. The model’s capability to accurately recognize approximately two-thirds of instances within this ambiguous building category suggests significant potential for this classification approach.
Furthermore, the “others” category showed high precision (0.791) but lower recall (0.447), resulting in an F1-score of 0.571. The classification model was able to identify buildings of this class correctly 44.74% of the time. This type of building is often situated amidst structures of other kinds, which are also challenging for human observation. This performance indicates the model’s capability to recognize non-conventional building uses within common structures.
Notable classification challenges are evident with townhouses, which exhibited the lowest performance metrics (precision: 0.646, recall: 0.316, F1-score: 0.424), and only 31.56% of townhouses were correctly classified. This outcome prompted a thorough investigation into the factors contributing to these misclassifications. For instance, 48.89% of buildings were categorized as detached houses and 18.67% as mixed-use buildings, highlighting the complexity of this category.
A plausible explanation is the variability in the quality of the building footprint input data, which may have influenced the classification accuracy. This insight provides a promising opportunity for refining data quality and enhancing the overall performance of the classification model.
Overall, the model achieved an overall accuracy of 0.755, indicating that it performs strongly in certain categories, particularly for detached houses, and demonstrates a promising ability to classify mixed-use buildings. While some misclassifications occur between similar categories, such as townhouses and detached houses, as well as mixed-use buildings and detached houses, these findings highlight valuable areas for further refinement. Future improvements in feature selection, model optimization, or the integration of additional data sources may enhance classification accuracy and further refine the model’s ability to distinguish between complex building types.
4.3. Population Estimation Results
After determining building height and usage, unit ratios were calculated using survey data on building usage and household characteristics to aid in population distribution. Initially, the floor area required for a single household in each building type is established based on our survey information (see Appendix A). These unit ratios represent the attributes of the surveyed area and serve as benchmarks for estimating populations at the building level. In Bangkok, the floor area per household differs across various building types:
- One household per unit in detached houses.
- A total of 16.16 m2 per household in mixed-use buildings.
- A total of 78.66 m2 per household in townhouses.
Household numbers were then assigned to residential buildings by type, with the method varying based on building usage due to differences in household distribution. For instance, mixed-use buildings usually have one household per floor, whereas townhouses allocate households along the building’s length, with the floor count generally not being related to household numbers. Adjustments were made to account for these differences.
Subsequently, a population was assigned to each household probabilistically using data from the UN’s 2019 Household Size and Composition for Thailand [52], shown in Table 7. Specifically, household sizes of two to three and four to five people are allocated based on probabilities, with sizes selected randomly within these ranges. For households of six or more, a fixed value of six people is assigned. This method generates building-level population statistics for Bangkok, as shown in Figure 10.
Table 7.
Household size and composition (excerpted).
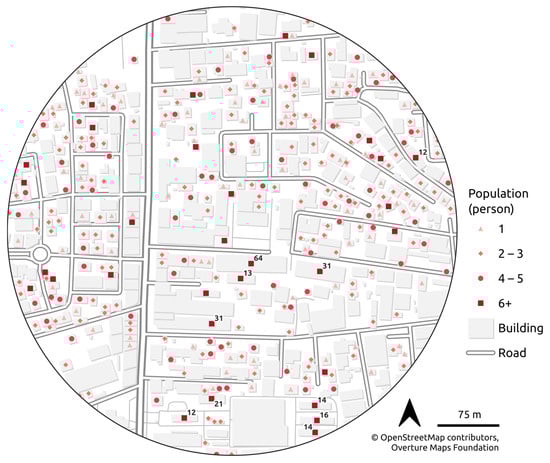
Figure 10.
Building population estimate in Vadhana district.
The accuracy assessment of the population estimation was conducted by comparing this study’s estimates with various authoritative sources, including census data, registration records, and existing gridded datasets (Table 8 and Table 9). Notably, the household count by the registration record was not disclosed, indicating a gap in the available validation data sources. An aggregate analysis of the population count for Bangkok reveals significant variance compared to the existing population data.
Table 8.
Estimated population and population data references.
Table 9.
Household estimation and household data references.
Specifically, our analysis using planning zones (zones 1–6; see Table 10) uncovered meaningful patterns regarding estimation precision. Urban centers, particularly the Cultural Conservation area (zone 1) and the Central Business and Commercial District (zone 2), exhibited lower population figures compared to the known census and settlement data, indicating spatial methodological challenges in dense, dynamic, inner-city environments.
Table 10.
Bangkok’s six planning zones [61].
However, in suburban and residential contexts (notably zone 3, as depicted in Figure 11 and the peri-center area in Figure 12), our population estimations demonstrated notably higher accuracy. Significantly, urban–suburban transitional zones displayed the greatest correspondence, likely due to clearly identifiable settlement typologies (e.g., detached houses), which facilitated accurate classification (confirmed by observed high classification accuracy in Table 5 and Table 6).
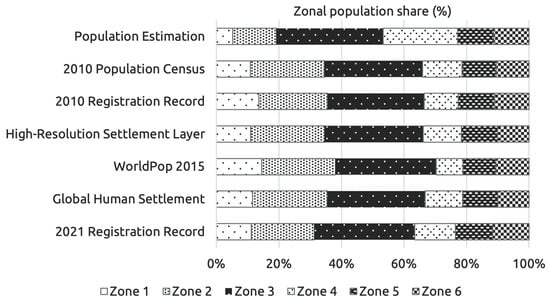
Figure 11.
Zonal share of the population comparison.
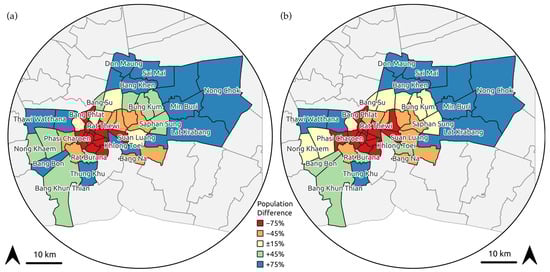
Figure 12.
A map of estimated population compared to (a) 2010 population census and (b) Global Human Settlement Layer.
These spatial patterns convincingly align with the documented urban development processes, specifically the ongoing suburbanization characterized by outward residential expansion, alongside complementary inner-city gentrification trends. Consequently, the observed population distribution patterns provide robust empirical support for current urbanization theories and underscore the model’s practical applicability for urban planning and socioeconomic forecasting.
Additionally, comparative validation against the Global Human Settlement dataset (Figure 13) revealed similar spatial correlation patterns and moderate correlation coefficients with the authoritative population census (0.48–0.50) when contextualized against a correlation of approximately 0.66 observed between the official population records and authoritative census data [23]. Such congruence enhances methodological confidence, particularly given that Global Human Settlement data synthesize census-derived and alternative data sources [30,81].
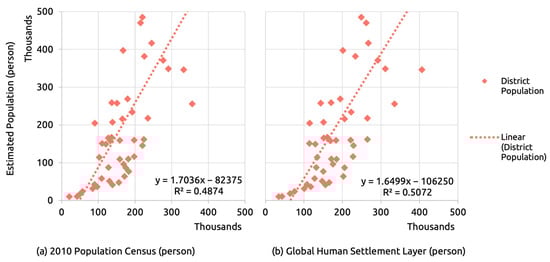
Figure 13.
Estimated population compared to (a) 2010 population census and (b) Global Human Settlement Layer.
Overall, despite inherent methodological complexities identified with population enumeration in highly dynamic urban settings, these findings provide valuable confirmation of both the robustness of the estimation approach and its relevance to understanding contemporary urbanization and gentrification dynamics.
5. Discussion
This discussion is structured into three key aspects: the morphological approach for building height estimation, machine learning-based building use classification, and population distribution analysis. These components collectively demonstrate the scalability and applicability of our methodology, particularly in the context of rapidly urbanizing regions where high-resolution data are often limited.
5.1. Morphological Approach for Estimating Building Height Estimation
The morphological erosion approach using ALOS AW3D30 demonstrated moderate accuracy (MAE: 3.91 m, RMSE: 9.34 m) but faced inherent limitations associated with low-resolution (30 m) DEMs (Figure 9). Previous studies have applied morphological operations on neighboring pixels using a 3 × 3 structuring element (covering 90 m2) [65]. However, our findings indicate that such structuring elements are too large to precisely identify individual buildings yet are too small to effectively detect clustered structures, particularly in urban environments where buildings are densely arranged in patches. These results align with previous research [82,83], reinforcing that structuring element size significantly impacts the performance of morphological approaches.
While the 19 × 19 structuring element optimized the performance in Bangkok’s predominantly flat terrain, a dynamic structuring element size and higher-resolution DEMs (e.g., <5 m) would be more effective in resolving mixed-use high-rises in central business districts such as Vadhana. Furthermore, our results suggest a systematic underestimation of building height at the pixel level, particularly in high-density areas. Future implementations could prioritize multi-scale morphological operators to mitigate the resolution-to-footprint mismatch and further enhance building height estimation accuracy.
Challenges remain, particularly regarding the limitations of current open geospatial data and computational workflows. The application of morphological operations to open-source DEM data presents certain inaccuracies in building height estimation, primarily due to resolution constraints. The selection of structuring elements in morphological analysis was found to be highly sensitive to terrain complexity, necessitating further refinement for applications in diverse urban landscapes.
5.2. Machine Learning for Building Use Classification
The findings underscore critical challenges in urban environments, particularly where mixed-use developments and informal spatial arrangements [84] pose significant difficulties for conventional building use classification frameworks. This emphasizes the importance of adaptability to spatially diverse environments. Previous research [58,75] has demonstrated the potential of integrating contextual data such as proximity to points of interest (POIs) and street-level imagery to improve classification performance, especially in distinguishing between commercial and residential structures. However, such methods, including advanced approaches like graph neural networks for facade analysis, are computationally intense, posing a scalability challenge in cities with a large volume of unstructured data. This underscores the necessity of employing locally tuned training data, particularly in regions with weak zoning enforcement.
This study achieved 90.5% classification accuracy for detached houses, yet performance was notably lower for townhouses (31.6%) and mixed-use buildings (65.3%). A key factor of misclassifications includes errors in footprint segmentation from open datasets where terraced structures in Overture Maps were frequently mis-segmented as merged units, as shown in Figure 14b, a problem that was not observed in datasets derived from proprietary sources such as ALOS-derived footprints, as shown in Figure 14a.
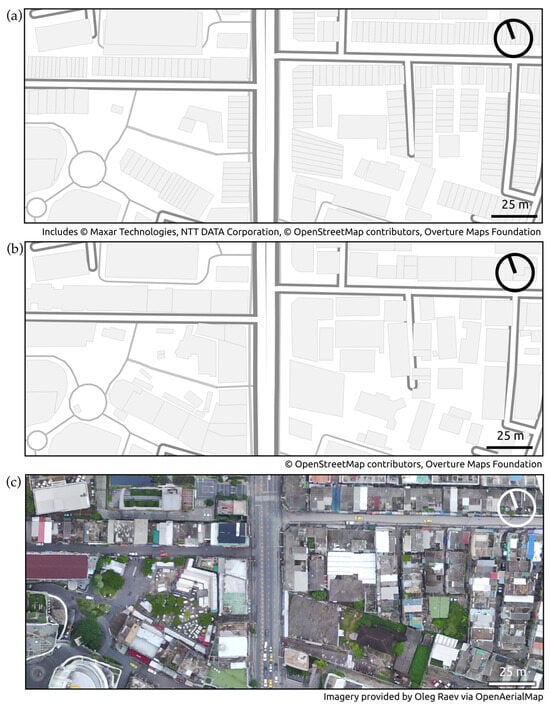
Figure 14.
Building footprint comparison between (a) proprietary dataset, (b) ML-segmented open dataset, and (c) aerial image.
By integrating the estimated building height with the classified building uses, we can further utilize the data. It is also important to consider the temporal appropriateness of the building footprint, especially in regions experiencing rapid development [44].
5.3. Analysis of Population Distribution
This study advanced the population distribution analysis using a hybrid methodological framework, integrating data from multiple geospatial population layers with household composition data to mitigate census data limitations common in rapidly urbanizing regions. By prioritizing openly accessible datasets, the methodology balances high-resolution output with global scalability, offering a replicable model for data-scarce environments.
Implementing a high-resolution population distribution analysis presents significant challenges regarding data completeness [36], accessibility, and computational feasibility [38]. Our methodology addresses these constraints by leveraging openly available datasets, enabling a viable solution, and thereby providing cost-effectiveness and globally applicable alternatives that reduce dependence on infrequently updated census data.
The methodology’s geographic scalability and temporal consistency are the primary constraints where sampling biases may limit generalizability across urban forms, while infrequent population dataset updates hinder real-time validation. These limitations intertwine with rapid socioeconomic shifts, and Bangkok’s transit-driven gentrification and upscale urban development have demonstrably displaced lower-income populations [85,86,87], creating dynamic demographic patterns that challenge conventional estimation frameworks.
While theoretical consistency between our analysis and the observed urban processes provides provisional validation, definitive confirmation requires future census data to resolve spatiotemporal and socioeconomic complexities. Nevertheless, the framework synergistically addresses conventional census limitations through open-access data integration and advanced spatial modeling. Future work should explore the integration of multi-source remote sensing data and machine learning-based approaches to refine the accuracy and applicability of population distribution estimations in rapidly urbanizing contexts.
6. Conclusions
This study demonstrates the effectiveness and future potential of integrating open geospatial data (crowdsourced building footprints and satellite-derived geomorphology) with machine learning to enhance localized population estimation. By leveraging scalable, cost-effective, and globally accessible methodologies, this research provides valuable insights for urban analytics and spatial planning, particularly in data-scarce environments.
Our approach enables more granular population distribution mapping than spatial resolution-dependent grid. While validation remains challenging due to outdated reference data, the performance was notably robust in urban–suburban transitional zones, which aligns with areas that are overrepresented in validation datasets. The generalizability across various urban morphologies should be heavily taken into consideration for machine learning applications.
Our integrated approach combining morphological erosion with machine learning classification achieved moderate building height estimation accuracy (MAE: 3.91 m, RMSE: 9.34 m) and heterogeneous building use classification performance (90.5% for detached houses, 31.6% for townhouses). Nonetheless, this provides a foundation for developing adaptive and scalable methodologies capable of addressing complex urban spatial patterns. While challenges related to data availability, methodological trade-offs, and local contextual variability persist, this research emphasizes the importance of fostering greater accessibility to high-quality, up-to-date geospatial and demographic data.
Future advancements in this field will require not only technical refinements, such as higher-resolution DEMs and enhanced classification frameworks but also the continuous evolution of Earth observation-based methodologies and geospatial artificial intelligence (AI) for improved population modeling. By incorporating automated data acquisition techniques, cloud computing, and geospatial AI, future research can further refine problem-driven solutions that support sustainable urban development and disaster resilience strategies. Additionally, strengthening interdisciplinary collaboration between geospatial scientists, urban planners, and policymakers will be crucial in harnessing the full potential of Earth observation data and analytical tools. By addressing these challenges, this research advances the broader goal “Towards High-Resolution Population Mapping in Developing Country Cities”, contributing to a more data-driven, sustainable, and resilient approach to urban development worldwide.
Author Contributions
Conceptualization, K.M. and Y.A.; methodology, K.M., R.Y. and Y.A.; software, K.M. and R.Y.; validation, K.M. and R.Y.; formal analysis, K.M.; investigation, R.Y.; data curation, K.M., R.Y. and H.M.; writing—original draft preparation, K.M.; writing—review and editing, R.Y., Y.A. and C.M.A.; visualization, K.M.; supervision, H.M., S.M. and C.M.A.; project administration, Y.A.; funding acquisition, Y.A. All authors have read and agreed to the published version of the manuscript.
Funding
This research was funded by JSPS KAKENHI, Grant Numbers JP24K00243 and JP20H01483; Prioritized Studies of Advanced Research Laboratories, Tokyo City University; and the project of “Smart Transport Strategy for Thailand 4.0—Realizing better quality of life and low-carbon society-” by SATREPS (JST).
Data Availability Statement
The original contributions presented in the study are included in the article, further inquiries can be directed to the corresponding author.
Acknowledgments
We extend our heartfelt gratitude to the individuals, communities, and organizations advancing the open data. Your invaluable contributions, whether through data sharing or collaborative efforts, have inspired us, propelling this work and the broader scientific endeavor.
Conflicts of Interest
Author Hiroyuki Miyazaki was employed by the company GLODAL, Inc.; author Satoshi Miyazawa was employed by the company Location Mind Inc. The remaining authors declare that this research was conducted in the absence of any commercial or financial relationships that could be construed as a potential conflict of interest.
Abbreviations
The following abbreviations are used in this manuscript:
| DEM | Digital Elevation Model |
| DSM | Digital Surface Model |
| DTM | Digital Terrain Model |
| POI | Points of Interest |
| OSM | OpenStreetMap |
| SHM | Surface Height Model |
Appendix A
Appendix A.1. Validation Data Collection
The data collection was based on the building footprint from the Overture Map. In the field documentation stage, buildings are classified by their appearance characteristics, such as detached houses, detached offices, commercial buildings, condominiums, and mixed-use structures [64], detailed in Table A1 and Figure A2. Additionally, the number of households is identified by address and number of visible mailboxes to imply the number of households; building conditions are assessed with categories like clean, intermediate, and deteriorated; and building height is recorded by the number of floors. The survey sites encompass urban, transitional urban–suburban, and suburban areas, as shown in Table A2, featuring detached housing, townhouses, and high-rise residential neighborhoods. Figure A3 and Figure A4 highlight the buildings informing the informal utilization of the area. This is evident in the random emergence of building uses among other types, which presents one of the challenges considered in this study. Furthermore, the survey in progress is depicted in Figure A5.
Table A1.
Survey attributes.
Table A1.
Survey attributes.
| Attribute | Description |
|---|---|
| Building Use Classification | Commercial, condominium, detached commercial, detached residential, mixed-use (primarily commercial), mixed-use (primarily residential), other, townhouse |
| Building Condition | Clean, intermediate, or deteriorated |
| Building Height | The height of the building, expressed as the number of floors |
| Number of Posts | The count of visible utility or structural posts associated with the building or property |
| Vacant House Indicator | Identifying whether the property is vacant or unoccupied |
| X, Y Coordinates | The longitude–latitude value of the building’s geographic location |
Table A2.
Validation area characteristics.
Table A2.
Validation area characteristics.
| Area | Land Use Characteristics | Characteristics |
|---|---|---|
| 1. Phaya Thai District | Central Business and Commercial Area | The district is notable for its condominium and commercial development, attracting young workforces. The west side boasts businesses, mid-to-high-end townhouses, shops, and detached buildings. In contrast, the east side features terraced houses and detached buildings. |
| 2. Bang Khen District | Residential Area | Transitional urban–suburban residential area located near the military base and airport. It features smaller enterprises in the townhouses and detached residential units. |
| 3. Bang Kapi District | Residential Area | Located on the eastern side of Bangkok. It boasts a prominent shopping center that serves as a transportation hub, connecting the canal and rail networks. The area also features townhouses along the primary road and large detached residences. |
| 4. Vadhana District | Central Business and Commercial Area | Prominent central business and commercial area. Mix of office buildings, condominiums, and mid- and high-end residential buildings. Features vibrant retail, dining, and entertainment hubs, making it a hotspot for both residents and visitors. |
| 5. Saphan Sung District | Residential Area | Quiet residential area on the east side of the Bangkok city center, comprising well-planned detached houses, townhouses, and gated communities. |

Figure A1.
A screenshot of the software used during the field survey.
Figure A1.
A screenshot of the software used during the field survey.
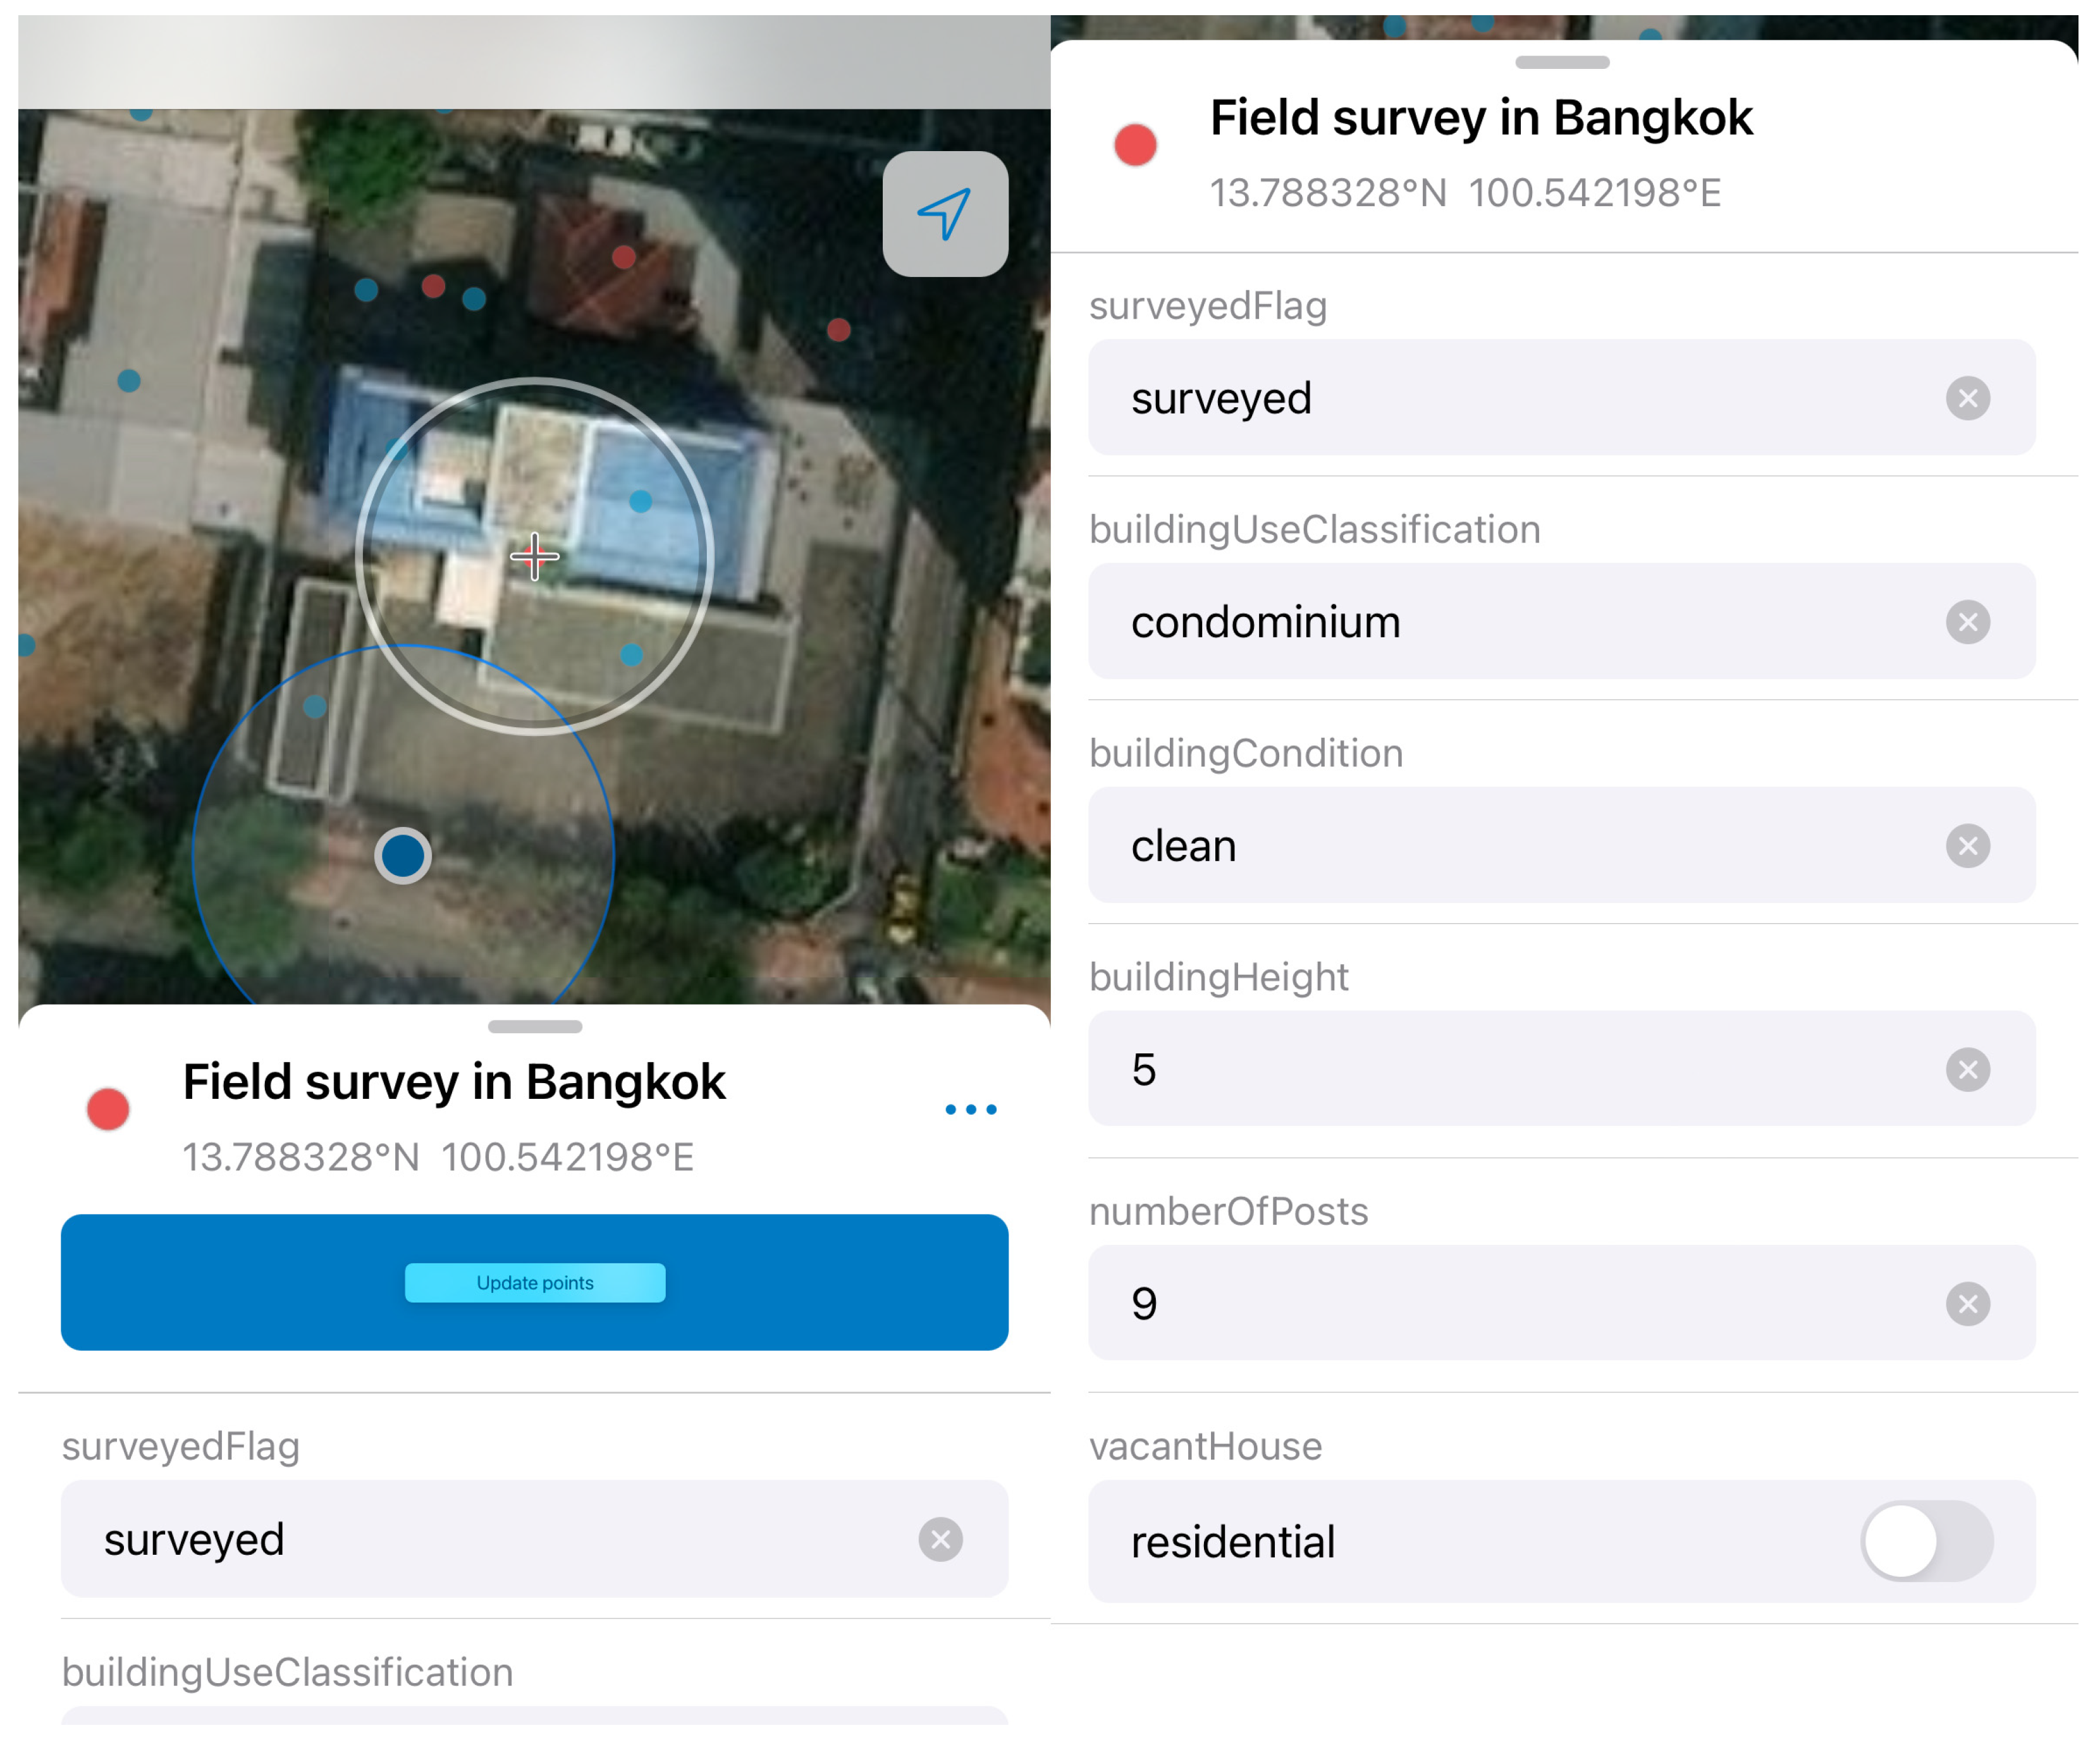
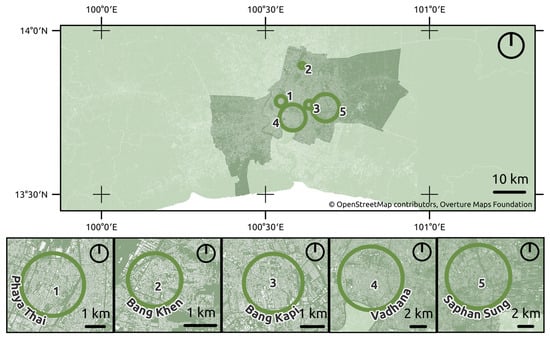
Figure A2.
Validating data survey sites.
Figure A2.
Validating data survey sites.
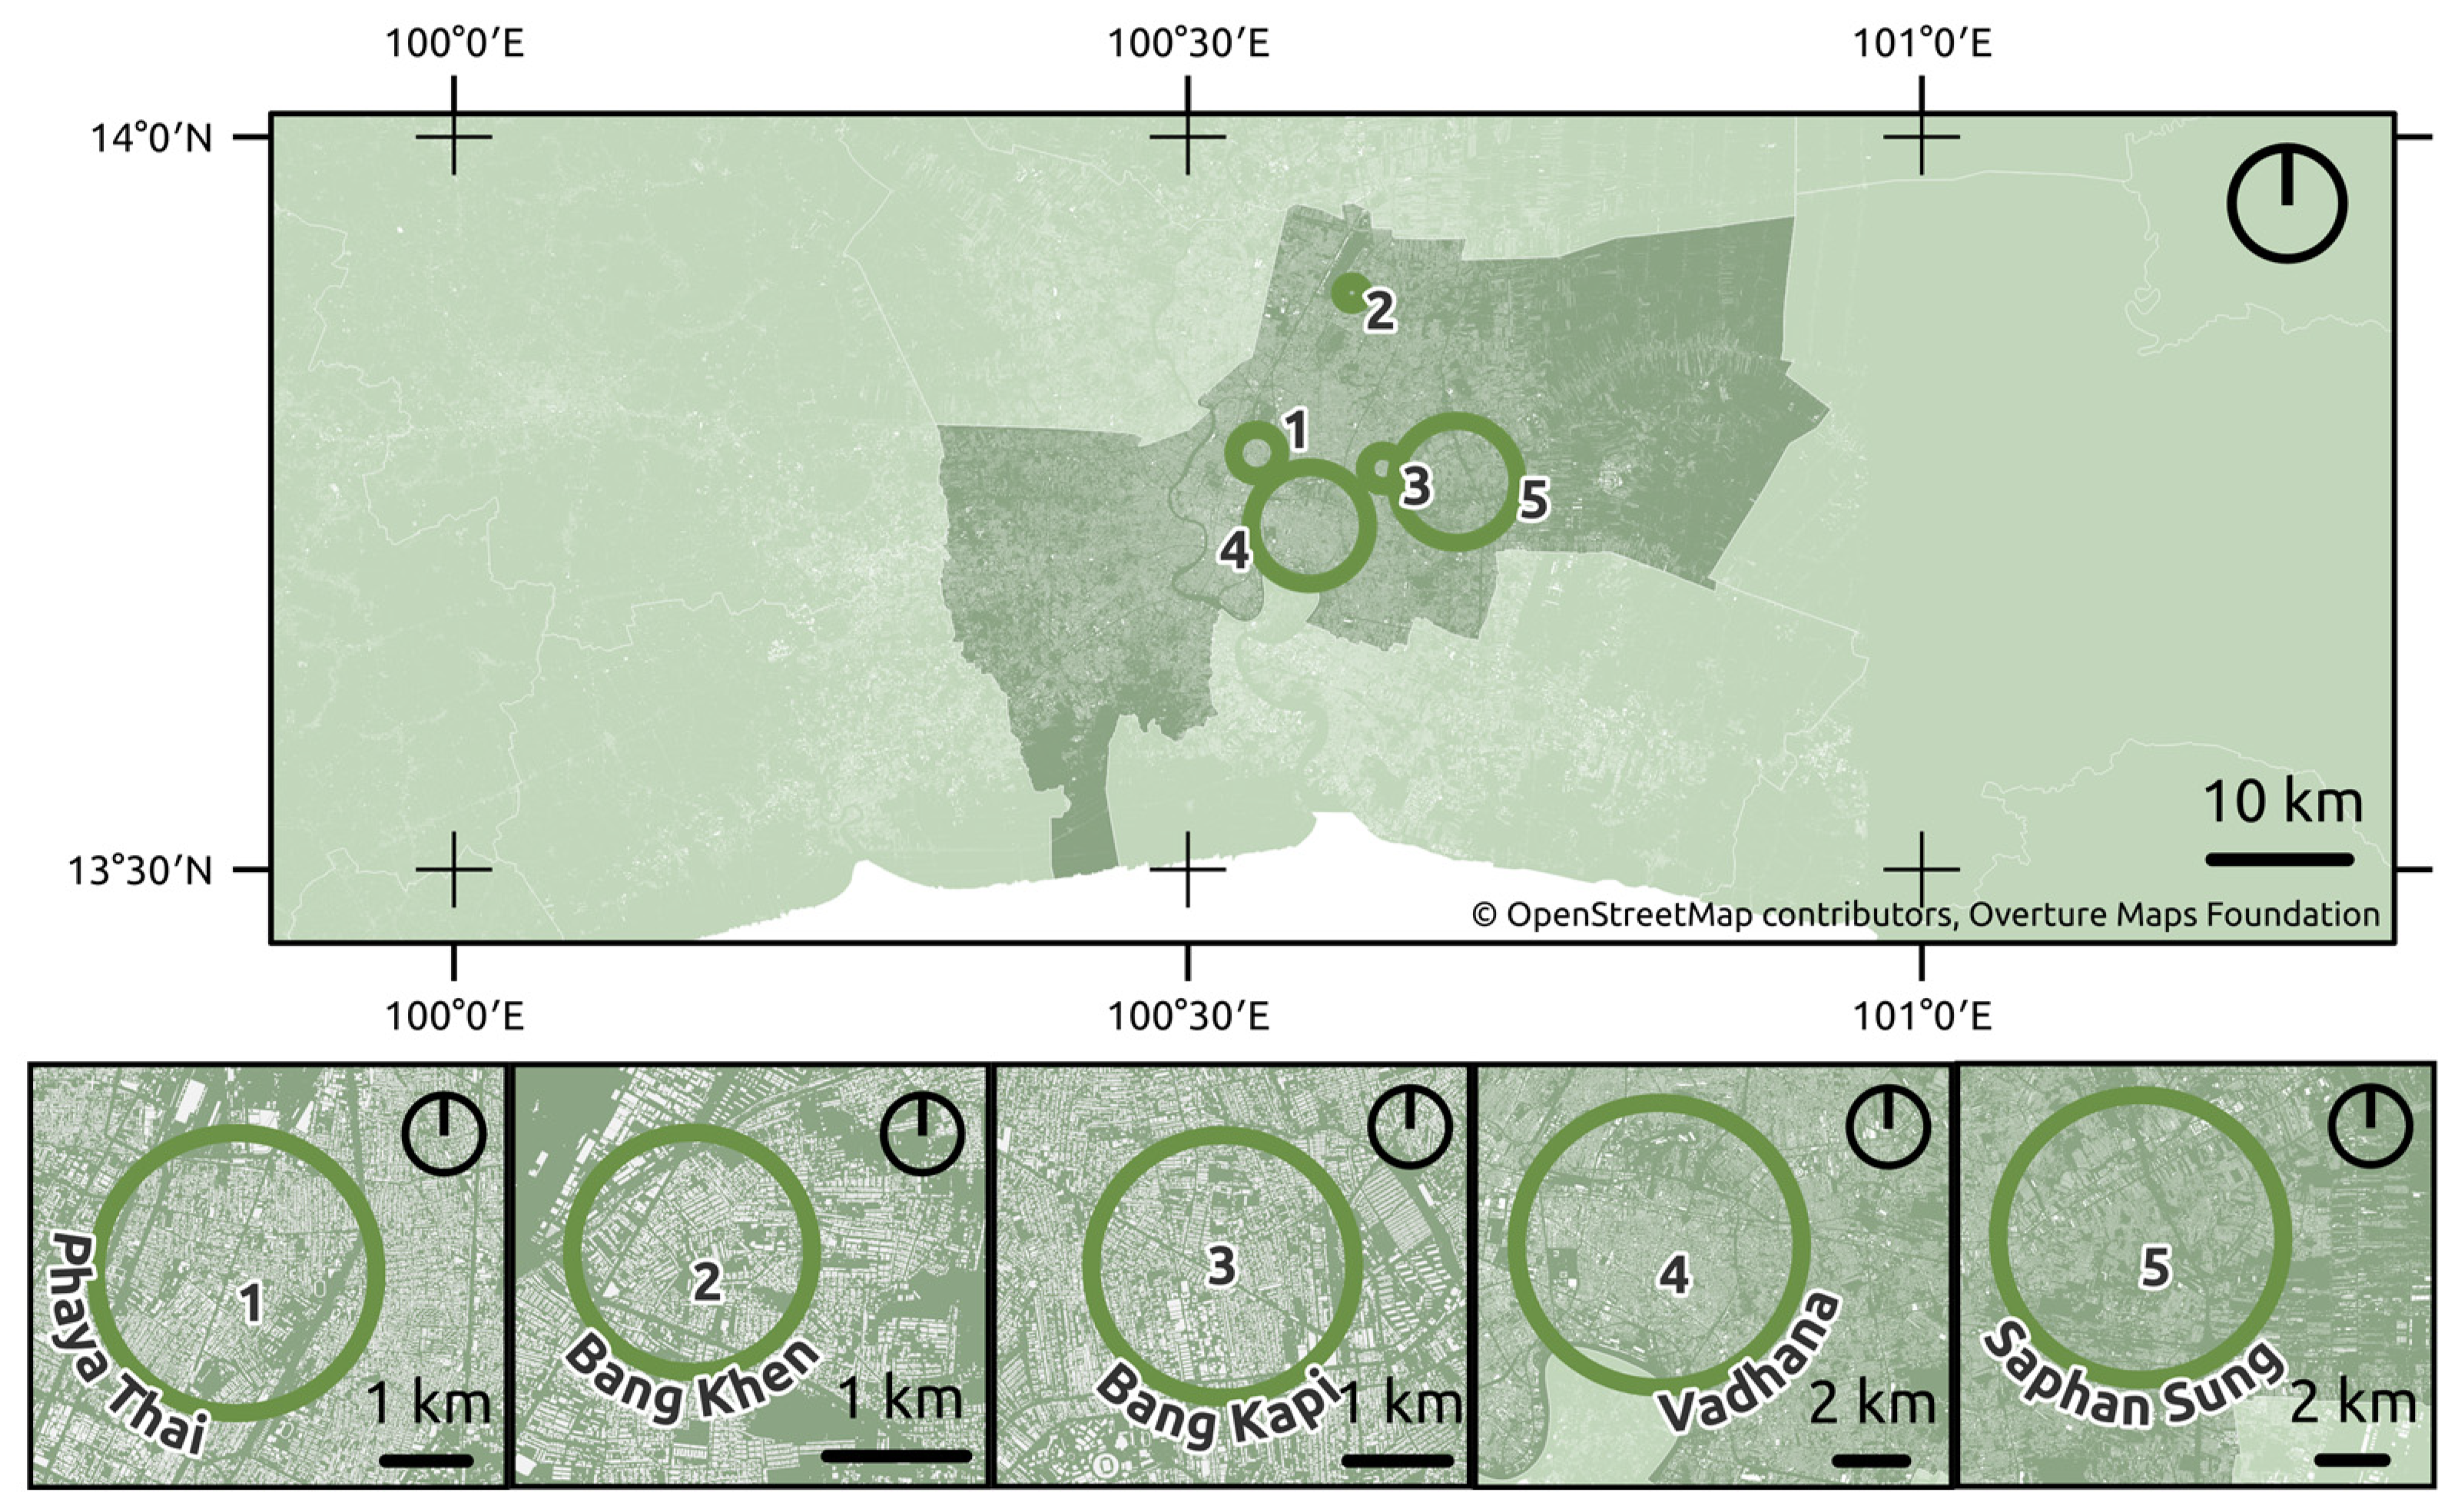
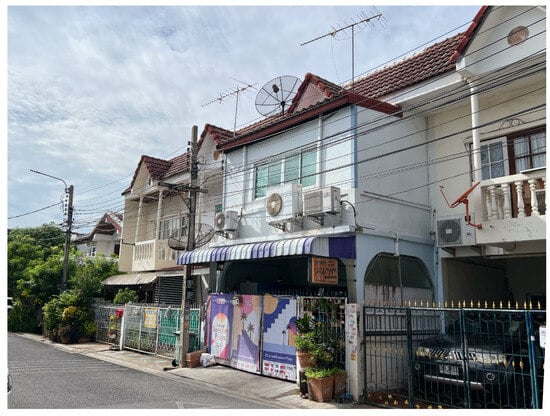
Figure A3.
Picture of townhouses in Bang Khen (area 2) being used as commercial buildings surrounded by residential buildings.
Figure A3.
Picture of townhouses in Bang Khen (area 2) being used as commercial buildings surrounded by residential buildings.

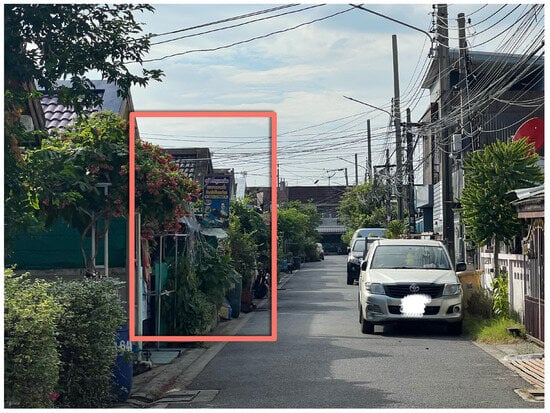
Figure A4.
Picture of a detached house (in the red box) in Bang Khen (area 2) being used as a commercial building surrounded by residential buildings.
Figure A4.
Picture of a detached house (in the red box) in Bang Khen (area 2) being used as a commercial building surrounded by residential buildings.
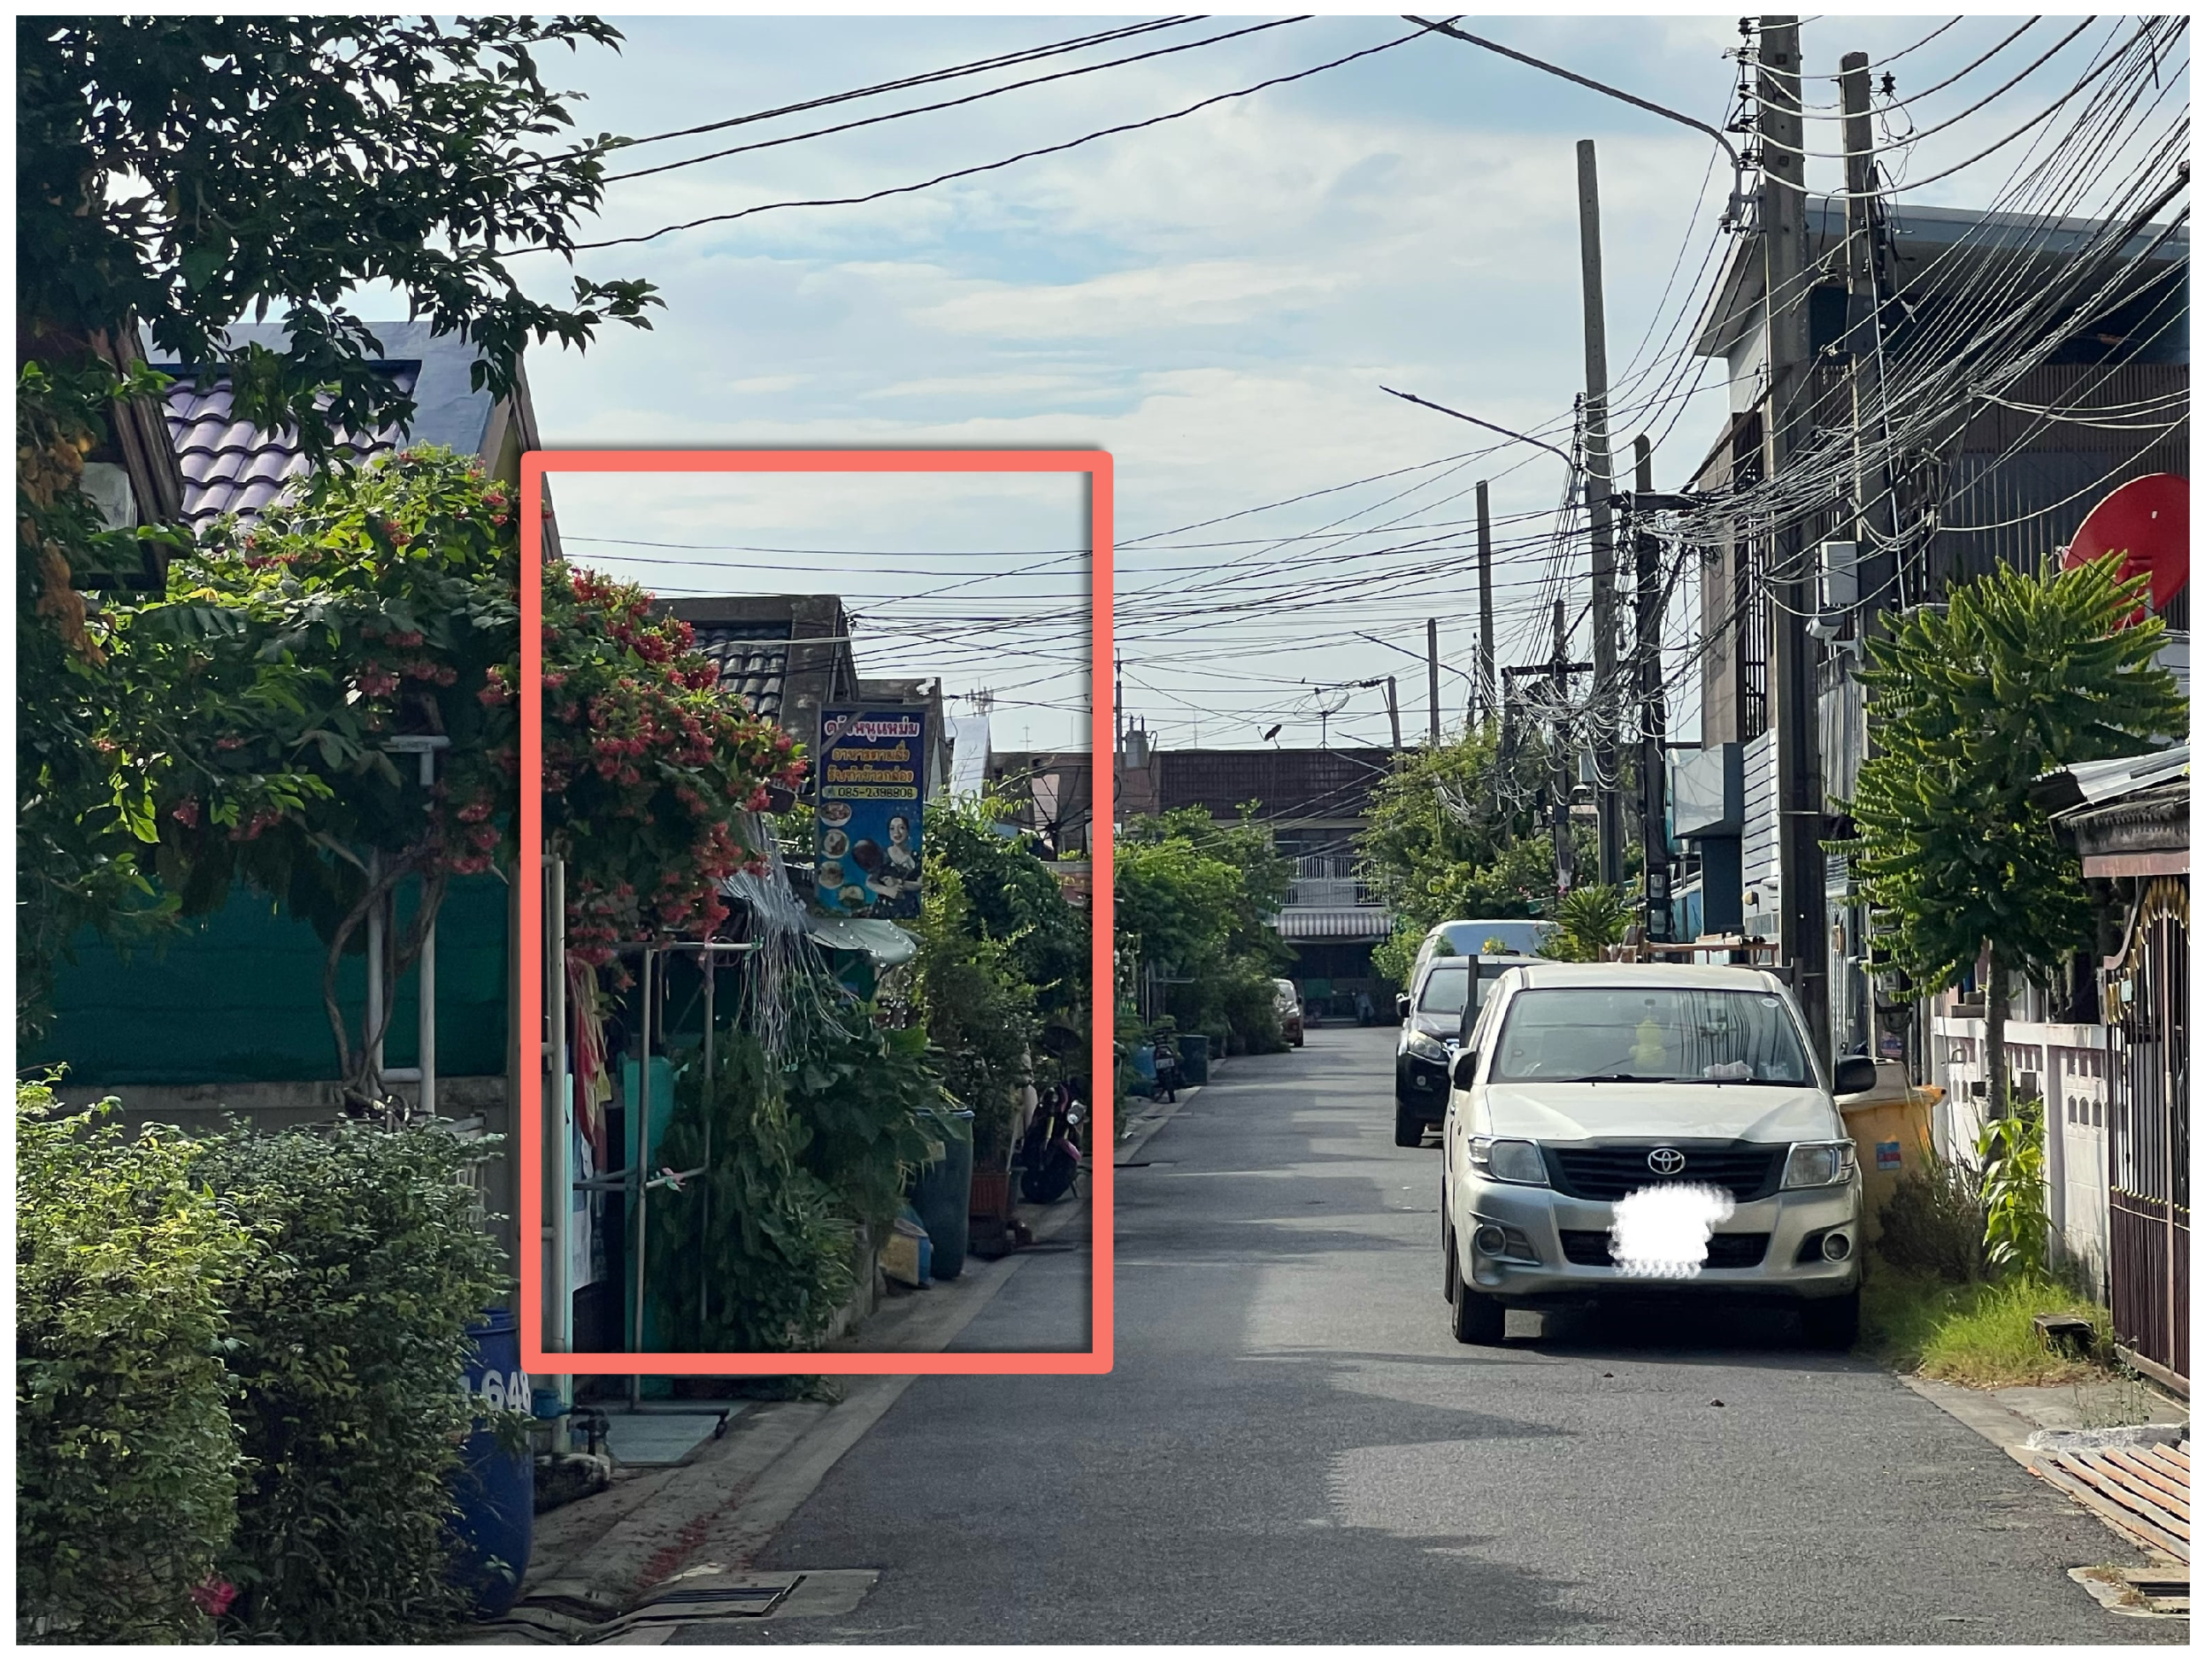
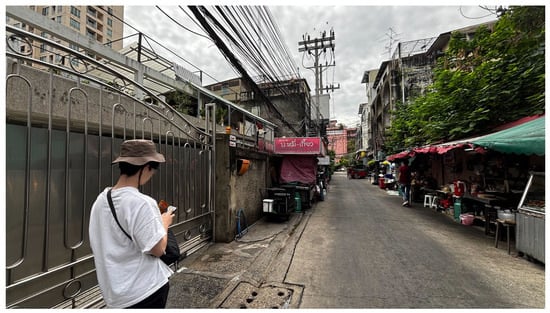
Figure A5.
The field survey in progress.
Figure A5.
The field survey in progress.
Appendix A.2. Validation Data Sample and Statistics
The data collection process involved a field survey conducted over 6 days from 2023 to 2024. A survey team consisting of four to five members utilized the ArcGIS Field Map for on-site data collection via mobile devices. The methodology employed direct observation and digital documentation of urban structures and their functional uses.
The challenges in surveying emerged during the data collection process, primarily related to the accurate identification of building structures and their functional classifications. These limitations stemmed from the complexity of urban typologies and the multifunctional nature of certain structures, which presented classification challenges even for human observers. Such challenges highlight the inherent difficulties in developing automated classification systems for complex urban environments. Table A3, Table A4, Table A5 and Table A6 show the surveying records and the summary of the results.
Table A3.
Surveyed data samples.
Table A3.
Surveyed data samples.
| ID | Surveyed Flag | Building Use Classification | Building Height | Number of Posts | x | y |
|---|---|---|---|---|---|---|
| 1 | Surveyed | Detached residential | 2 | 1 | 100.630983 | 13.7789598 |
| 2 | Surveyed | Condominium | 3 | 4 | 100.617464 | 13.8918068 |
| 3 | Surveyed | Mixed-use (primarily residential) | 3 | 2 | 100.605937 | 13.8933387 |
| 4 | Surveyed | Detached residential | 2 | 1 | 100.627159 | 13.7745783 |
| 5 | Surveyed | Detached residential | 1 | 1 | 100.626576 | 13.7747678 |
| … | … | … | … | … | … | … |
Table A4.
Surveyed building count by district.
Table A4.
Surveyed building count by district.
| District | Count | |
|---|---|---|
| 1 | Phaya Thai | 362 |
| 2 | Bang Khen | 424 |
| 3 | Bang Kapi | 636 |
| 4 | Vadhana | 675 |
| 5 | Saphan Sung | 767 |
Table A5.
Surveyed building count by type.
Table A5.
Surveyed building count by type.
| Building Type | Count |
|---|---|
| Detached residential | 1416 |
| Detached commercial | 71 |
| Condominium | 277 |
| Mixed-use (primarily residential) | 186 |
| Mixed-use (primarily commercial) | 199 |
| Commercial | 329 |
| Townhouse | 101 |
| Others | 285 |
| Total | 2864 |
Table A6.
Surveyed building count by floor group.
Table A6.
Surveyed building count by floor group.
| Building Floor | Count |
|---|---|
| 1–3 | 2344 |
| 4–6 | 419 |
| 7–10 | 55 |
| 11- | 46 |
Appendix B
This appendix provides detailed descriptions of the building polygon features (Table A7) and points of interest (POI) data (Table A8) utilized by the Polygon-Based Classification Model described in Section 3.2.2.
Table A7.
Features utilized in Polygon-Based Classification Model.
Table A7.
Features utilized in Polygon-Based Classification Model.
| Feature Types | Feature Name | Aggregation Methods | Summary |
|---|---|---|---|
| Derived from building polygons | Area | Calculated for each building | Building area |
| Circumference | Calculated for each building | Length of building perimeter | |
| Number of vertices | Calculated for each building | Number of vertices in the building (polygon) | |
| Shape complexity | Calculated for each building | ||
| Number of buildings in the vicinity | Calculated by straight-line distance from the center of gravity of the building | The number of buildings within a radius of 100 m from the center of gravity of the building is calculated and added | |
| Derived from OpenStreetMap | Distance to POI | Straight-line distance from the center of gravity of the building | Straight-line distance from the center of gravity of the building to the POI data of each type (see table) is calculated |
| Distance to the road | Straight-line distance from the center of gravity of the building | Calculated straight-line distance from the center of gravity of a building to a major road | |
| Types of roads | Calculated for each building | The type of road with the shortest distance | |
| Distance to rail | Straight-line distance from the center of gravity of the building | Calculated straight-line distance from the center of gravity of the building to the railway (line data) | |
| Distance to train station | Straight-line distance from the center of gravity of the building | Calculated straight-line distance from the center of gravity of a building to a railway station (including subway) | |
| Derived from DEM | Building height | Calculated for each building | From the previous section |
Table A8.
POI data used in this study.
Table A8.
POI data used in this study.
| Category | Specific POI Types | Summary |
|---|---|---|
| Public facilities | School, library, town hall, hospital, police, fire station, post office, government building | Facilities that provide public services such as education, administration, medical care, and public safety |
| Commercial facilities | Shop, restaurant, cafe, bar, fast food, market, hotel, hostel | Facilities related to daily commercial activities, such as shopping, dining, lodging, etc. |
| Transportation facilities | Bus stop, parking, bicycle parking, airport, terminal | Transportation-related infrastructure facilities used by people as a means of transportation |
| Tourist facilities | Museum, attraction, viewpoint, artwork, gallery, tourist information | Facilities for the purpose of tourism and cultural activities |
| Leisure facilities | Park, playground, sports center, stadium, swimming pool | Facilities that promote outdoor activities and recreation |
| Service facilities | Bank, ATM, pharmacy, clinic, dentist, veterinary clinic | Facilities that provide financial, medical, and other services necessary in daily life |
| Accommodation | Hotel, hostel, guesthouse, apartment, campsite | Facilities that provide accommodation |
| Emergency response facilities | Police station, fire station, hospital, first aid station | Facilities for responding to emergencies |
| Sports facilities | Stadium, sports center, pool, sports pitch, track | Facilities for sporting events and practices |
References
- Ritchie, H.; Samborska, V.; Roser, M. “Urbanization” Published Online at OurWorldinData.org. Available online: https://ourworldindata.org/urbanization (accessed on 31 December 2024).
- Gu, D.; Andreev, K.; Dupre, M.E.; United Nations Population Division, New York, USA. Department of Population Health Sciences & Department of Sociology, Duke University, North Carolina, USA Major Trends in Population Growth Around the World. China CDC Wkly. 2021, 3, 604–613. [Google Scholar] [CrossRef] [PubMed]
- Sun, L.; Chen, J.; Li, Q.; Huang, D. Dramatic Uneven Urbanization of Large Cities throughout the World in Recent Decades. Nat Commun 2020, 11, 5366. [Google Scholar] [CrossRef]
- United Nations. The Speed of Urbanization Around the World; United Nations: New York, NY, USA, 2018. [Google Scholar]
- Alirol, E.; Getaz, L.; Stoll, B.; Chappuis, F.; Loutan, L. Urbanisation and Infectious Diseases in a Globalised World. Lancet Infect. Dis. 2011, 11, 131–141. [Google Scholar] [CrossRef] [PubMed]
- UN. Economic and Social Council (2014–2015: New York and Geneva). 2020 World Population and Housing Census Programme: Resolution/Adopted by the Economic and Social Council; E/2015/24; 2015; 2p. Available online: https://digitallibrary.un.org/record/798584 (accessed on 30 December 2024).
- Mahtta, R.; Fragkias, M.; Güneralp, B.; Mahendra, A.; Reba, M.; Wentz, E.A.; Seto, K.C. Urban Land Expansion: The Role of Population and Economic Growth for 300+ Cities. npj Urban Sustain. 2022, 2, 5. [Google Scholar] [CrossRef]
- Park, J.; Gall, H.E.; Niyogi, D.; Rao, P.S.C. Temporal Trajectories of Wet Deposition across Hydro-Climatic Regimes: Role of Urbanization and Regulations at U.S. and East Asia Sites. Atmos. Environ. 2013, 70, 280–288. [Google Scholar] [CrossRef]
- Liang, L.; Wang, Z.; Li, J. The Effect of Urbanization on Environmental Pollution in Rapidly Developing Urban Agglomerations. J. Clean. Prod. 2019, 237, 117649. [Google Scholar] [CrossRef]
- Sancino, A.; Stafford, M.; Braga, A.; Budd, L. What Can City Leaders Do for Climate Change? Insights from the C40 Cities Climate Leadership Group Network. Reg. Stud. 2022, 56, 1224–1233. [Google Scholar] [CrossRef]
- Japan International Cooperation Agency; Infrastructure and Peacebuilding Department. Thematic Guidelines on Urban and Regional Development; Japan International Cooperation Agency: Tokyo, Japan, 2017. [Google Scholar]
- Dickson-Gomez, J.; Nyabigambo, A.; Rudd, A.; Ssentongo, J.; Kiconco, A.; Mayega, R.W. Water, Sanitation, and Hygiene Challenges in Informal Settlements in Kampala, Uganda: A Qualitative Study. Int. J. Environ. Res. Public Health 2023, 20, 6181. [Google Scholar] [CrossRef]
- Rahaman, M.A.; Kalam, A.; Al-Mamun, M. Unplanned Urbanization and Health Risks of Dhaka City in Bangladesh: Uncovering the Associations between Urban Environment and Public Health. Front. Public Health 2023, 11, 1269362. [Google Scholar] [CrossRef]
- Green, R. Informal Settlements and Natural Hazard Vulnerability in Rapid Growth Cities. In Hazards and the Built Environment; Routledge: London, UK, 2008; pp. 218–237. [Google Scholar]
- Guo, Y.; Zhang, Q.; Lai, K.K.; Zhang, Y.; Wang, S.; Zhang, W. The Impact of Urban Transportation Infrastructure on Air Quality. Sustainability 2020, 12, 5626. [Google Scholar] [CrossRef]
- Guo, Y.; Lu, Q.; Wang, S.; Wang, Q. Analysis of Air Quality Spatial Spillover Effect Caused by Transportation Infrastructure. Transp. Res. Part D Transp. Environ. 2022, 108, 103325. [Google Scholar] [CrossRef]
- Andreasen, M.H.; Agergaard, J.; Allotey, A.N.M.; Møller-Jensen, L.; Oteng-Ababio, M. Built-in Flood Risk: The Intertwinement of Flood Risk and Unregulated Urban Expansion in African Cities. Urban Forum 2023, 34, 385–411. [Google Scholar] [CrossRef]
- Bastos Moroz, C.; Thieken, A.H. Urban Growth and Spatial Segregation Increase Disaster Risk: Lessons Learned from the 2023 Disaster on the North Coast of São Paulo, Brazil. Nat. Hazards Earth Syst. Sci. 2024, 24, 3299–3314. [Google Scholar] [CrossRef]
- Yin, X.; Li, P.; Feng, Z.; Yang, Y.; You, Z.; Xiao, C. Which Gridded Population Data Product Is Better? Evidences from Mainland Southeast Asia (MSEA). Int. J. Geo-Inf. 2021, 10, 681. [Google Scholar] [CrossRef]
- Cartagena-Colón, M.; Mattei, H.; Wang, C. Dasymetric Mapping of Population Using Land Cover Data in JBNERR, Puerto Rico during 1990–2010. Land 2022, 11, 2301. [Google Scholar] [CrossRef]
- Pirowski, T.; Szypuła, B. Dasymetric Population Mapping Using Building Data. Ann. Am. Assoc. Geogr. 2024, 114, 1001–1019. [Google Scholar] [CrossRef]
- Pelletier, F. Census Counts, Undercounts and Population Estimates: The Importance of Data Quality Evaluation. Tech. Pap. 2020, 2, 10. [Google Scholar]
- Maneepong, K. High-Resolution Population Mapping: Challenges Where the Actual Residences Differ from the Records; Tokyo City University: Tokyo, Japan, 2022. [Google Scholar]
- National Statistical Office Thailand Population from the Census Categorized by Age Group, Gender. Available online: https://catalog.nso.go.th/dataset/4f98f5a8-f904-49f9-8665-b5975e0a6f3d (accessed on 14 January 2025).
- Office of the Official Information Commission. Meeting Report of the Academic Advisory Committee 1/2021; Office of the Official Information Commission—National Statistical Office: Bangkok, Thailand, 2021. [Google Scholar]
- Hrishikesh, S. Census in India: Baffling Lack of Data Is Hurting Indians. Available online: https://www.bbc.com/news/world-asia-india-64282374 (accessed on 5 March 2025).
- Nair, A. A Nation in the Dark: Census Delay Risks India’s Future. Available online: https://www.policycircle.org/policy/india-census-2021-and-policy/ (accessed on 6 March 2025).
- United Nations. Population Fund Technical Brief on the Implications of COVID-19 on Census. Available online: https://www.unfpa.org/resources/technical-brief-implications-covid-19-census (accessed on 8 March 2025).
- WorldPop. Gridded Population Estimate Datasets and Tools. Available online: https://www.worldpop.org/methods/populations/ (accessed on 10 September 2024).
- European Commission. Joint Research Centre. In GHSL Data Package 2019: Public Release GHS P2019; Publications Office: Luxembourg, 2019. [Google Scholar]
- Skinner, C. Issues and Challenges in Census Taking. Annu. Rev. Stat. Appl. 2018, 5, 49–63. [Google Scholar] [CrossRef]
- Emeh, I.E.; Olise, C.N.; Idam, M.O.; Nwokolo, C.C. Regular Population Census and Sustainable National Development in Nigeria; A Cost And Benefit Analysis. J. Public Adm. Gov. 2020, 10, 53. [Google Scholar] [CrossRef]
- Jain, G.; Espey, J. Lessons from Nine Urban Areas Using Data to Drive Local Sustainable Development. npj Urban Sustain. 2022, 2, 7. [Google Scholar] [CrossRef]
- Ruggles, S.; Magnuson, D.L. “It’s None of Their Damn Business”: Privacy and Disclosure Control in the U.S. Census, 1790–2020. Popul. Dev. Rev. 2023, 49, 651–679. [Google Scholar] [CrossRef] [PubMed]
- Gonçalves, H.; Tomasi, E.; Tovo-Rodrigues, L.; Bielemann, R.M.; Machado, A.K.F.; Ruivo, A.C.C.; Bortolotto, C.C.; Jaeger, G.P.; Xavier, M.O.; Fernandes, M.P.; et al. Population-Based Study in a Rural Area: Methodology and Challenges. Rev. De Saúde Pública 2018, 52, 3s. [Google Scholar]
- Nnanatu, C.C.; Chaudhuri, S.; Adewole, W.A.; Yankey, O.; Tejedor, N.; Tatem, A.J. Small Area Population Estimates in High-Rise Buildings: A Case Study in Thailand. Available online: https://data.worldpop.org/repo/prj/Resources/Posters/THAI_Modelling_poster.pdf (accessed on 12 November 2024).
- Lansley, G.; Li, W.; Longley, P.A. Creating a Linked Consumer Register for Granular Demographic Analysis. J. R. Stat. Soc. Ser. A: Stat. Soc. 2019, 182, 1587–1605. [Google Scholar] [CrossRef]
- Li, C.; Managi, S. Gridded Datasets for Japan: Total, Male, and Female Populations from 2001–2020. Sci. Data 2023, 10, 81. [Google Scholar] [CrossRef] [PubMed]
- Eurostat Population and Housing Census 2021—Population Grids. Available online: https://ec.europa.eu/eurostat/statistics-explained/index.php?title=Population_and_housing_census_2021_-_population_grids (accessed on 9 January 2025).
- Synergos Technologies STI: PopStatsTM: Quarterly Demographic Data. Available online: https://www.synergos-tech.com/popstats/ (accessed on 21 February 2025).
- Globetech Co., Ltd. Demographic Contents. Available online: https://www.nostramap.com/demographiccontents/ (accessed on 21 February 2025).
- Environics Analytics DemoStats|Demographic Data. Available online: https://environicsanalytics.com/en-ca/data/demographic/demostats (accessed on 21 February 2025).
- Metzger, N.; Daudt, R.C.; Tuia, D.; Schindler, K. High-Resolution Population Maps Derived from Sentinel-1 and Sentinel-2. arXiv 2024, arXiv:2311.14006. [Google Scholar] [CrossRef]
- Boo, G.; Darin, E.; Leasure, D.R.; Dooley, C.A.; Chamberlain, H.R.; Lázár, A.N.; Tschirhart, K.; Sinai, C.; Hoff, N.A.; Fuller, T.; et al. High-Resolution Population Estimation Using Household Survey Data and Building Footprints. Nat. Commun. 2022, 13, 1330. [Google Scholar] [CrossRef] [PubMed]
- Seto, T.; Furuhashi, T.; Uchiyama, Y. Role of 3D City Model Data as Open Digital Commons: A Case Study of Openness in Japan’s Digital Twin “Project Plateau”. Int. Arch. Photogramm. Remote Sens. Spatial Inf. Sci. 2023, XLVIII-4/W7-2023, 201–208. [Google Scholar] [CrossRef]
- Ministry of Land, Infrastructure, Transport and Tourism 250m Mesh Future Population Projection Data (R6 National Policy Bureau Estimate). Available online: https://nlftp.mlit.go.jp/ksj/gml/datalist/KsjTmplt-mesh250r6.html (accessed on 12 March 2025).
- Darnkachatarn, S.; Kajitani, Y. Long-term Flood Exposure Assessment Using Satellite-based Land Use Change Detection and Inundation Simulation: A 30-year Case Study of the Bangkok Metropolitan Region. J. Flood Risk Manag. 2024, 17, e12997. [Google Scholar] [CrossRef]
- Overture Maps Foundation Overture Maps. Available online: https://overturemaps.org/ (accessed on 4 September 2024).
- OpenStreetMap OpenStreetMap. Available online: https://www.openstreetmap.org/ (accessed on 4 September 2024).
- Japan Aerospace Exploration Agency ALOS World 3D 30 Meter DEM. V3.2 2021. Available online: https://portal.opentopography.org/datasetMetadata?otCollectionID=OT.112016.4326.2 (accessed on 14 January 2025).
- NASA JPL NASADEM Merged DEM Global 1 Arc Second V001 2021. Available online: https://portal.opentopography.org/datasetMetadata?otCollectionID=OT.032021.4326.2 (accessed on 14 January 2025).
- United Nations Household Size and Composition. Available online: https://www.un.org/development/desa/pd/data/household-size-and-composition (accessed on 28 January 2025).
- Dehvari, A.; Heck, R.J. Removing Non-Ground Points from Automated Photo-Based DEM and Evaluation of Its Accuracy with LiDAR DEM. Comput. Geosci. 2012, 43, 108–117. [Google Scholar] [CrossRef]
- Ma, X.; Zheng, G.; Chi, X.; Yang, L.; Geng, Q.; Li, J.; Qiao, Y. Mapping Fine-Scale Building Heights in Urban Agglomeration with Spaceborne Lidar. Remote Sens. Environ. 2023, 285, 113392. [Google Scholar] [CrossRef]
- Chang, Y.; Habib, A.; Lee, D.; Yom, J. Automatic Classification of Lidar Data into Ground and Non-Ground Points. Int. Arch. Photogramm. Remote Sens. 2008, 37, 463–468. [Google Scholar]
- National States Geographic Information Council 3DEP FTN Interest Group Meeting (January 28, 2025). Available online: https://www.youtube.com/watch?v=SJKWFYe1zyw (accessed on 6 March 2025).
- Google Brand Resource Center. Available online: https://about.google/brand-resource-center/products-and-services/geo-guidelines/ (accessed on 1 February 2025).
- Fill, J.; Eichelbeck, M.; Ebner, M. Predicting Building Types and Functions at Transnational Scale. arXiv 2024, arXiv:2409.09692. [Google Scholar]
- Biljecki, F.; Chow, Y.S.; Lee, K. Quality of Crowdsourced Geospatial Building Information: A Global Assessment of OpenStreetMap Attributes. Build. Environ. 2023, 237, 110295. [Google Scholar] [CrossRef]
- Maneepong, K.; Yamanotera, R.; Akiyama, Y.; Miyazaki, H.; Miyazawa, S.; Akiyama, C.M. Open Data-Driven 3D Building Models for Micro-Population Mapping in a Data-Limited Setting. Remote Sens. 2024, 16, 3922. [Google Scholar] [CrossRef]
- Department of City Planning and Urban Development, Bangkok Metropolitan Administration. Study Report on the Expansion of Residential Areas in Bangkok Metropolitan Region; Year 2020; Bangkok Metropolitan Administration: Bangkok, Thailand, 2020. [Google Scholar]
- Akiyama, Y.; Miyazaki, H.; Sirikanjanaanan, S. Development of Micro Population Data for Each Building: Case Study in Tokyo and Bangkok. In Proceedings of the 2019 First International Conference on Smart Technology Urban Development (STUD), Chiang Mai, Thailand, 13–14 December 2019; pp. 1–6. [Google Scholar]
- Overture Maps Foundation Frequently Asked Questions. Available online: https://overturemaps.org/about/faq/ (accessed on 17 January 2025).
- Royal Thai Government Gazette. Ministerial Regulation No. 55 (B.E. 2543 [2000]) Issued under the Building Control Act, B.E. 2522 [1979]. 1979. Available online: https://asa.or.th/wp-content/uploads/2020/03/กฎกระทรวงฉบับที่-55-ออกตามความในพระราชบัญญัติควบคุมอาคาร-พ.ศ.-2522.pdf (accessed on 14 January 2025).
- Huang, H.; Chen, P.; Xu, X.; Liu, C.; Wang, J.; Liu, C.; Clinton, N.; Gong, P. Estimating Building Height in China from ALOS AW3D30. ISPRS J. Photogramm. Remote Sens. 2022, 185, 146–157. [Google Scholar] [CrossRef]
- Che, Y.; Li, X.; Liu, X.; Wang, Y.; Liao, W.; Zheng, X.; Zhang, X.; Xu, X.; Shi, Q.; Zhu, J.; et al. 3D-GloBFP: The First Global Three-Dimensional Building Footprint Dataset. Earth Syst. Sci. Data Discuss. 2024, 16, 1–28. [Google Scholar]
- Cao, Y.; Huang, X. A Deep Learning Method for Building Height Estimation Using High-Resolution Multi-View Imagery over Urban Areas: A Case Study of 42 Chinese Cities. Remote Sens. Environ. 2021, 264, 112590. [Google Scholar] [CrossRef]
- Chang, J.; Jiang, Y.; Li, J.; Tan, M.; Wang, Y.; Wei, S. Building Height Extraction Based on Joint Optimal Selection of Regions and Multiindex Evaluation Mechanism. IEEE Trans. Geosci. Remote Sens. 2024, 62, 5603113. [Google Scholar] [CrossRef]
- Pesaresi, M.; Schiavina, M.; Politis, P.; Freire, S.; Krasnodębska, K.; Uhl, J.H.; Carioli, A.; Corbane, C.; Dijkstra, L.; Florio, P.; et al. Advances on the Global Human Settlement Layer by Joint Assessment of Earth Observation and Population Survey Data. Int. J. Digit. Earth 2024, 17, 2390454. [Google Scholar] [CrossRef]
- Carrera-Hernández, J.J. Not All DEMs Are Equal: An Evaluation of Six Globally Available 30 m Resolution DEMs with Geodetic Benchmarks and LiDAR in Mexico. Remote Sens. Environ. 2021, 261, 112474. [Google Scholar] [CrossRef]
- Sun, Y.; Mou, L.; Wang, Y.; Montazeri, S.; Zhu, X.X. Large-Scale Building Height Retrieval from Single SAR Imagery Based on Bounding Box Regression Networks. ISPRS J. Photogramm. Remote Sens. 2022, 184, 79–95. [Google Scholar] [CrossRef]
- Esch, T.; Brzoska, E.; Dech, S.; Leutner, B.; Palacios-Lopez, D.; Metz-Marconcini, A.; Marconcini, M.; Roth, A.; Zeidler, J. World Settlement Footprint 3D—A First Three-Dimensional Survey of the Global Building Stock. Remote Sens. Environ. 2022, 270, 112877. [Google Scholar] [CrossRef]
- Horn, B.K.P. Hill Shading and the Reflectance Map. Proc. IEEE 1981, 69, 14–47. [Google Scholar] [CrossRef]
- Kang, J.; Körner, M.; Wang, Y.; Taubenböck, H.; Zhu, X.X. Building Instance Classification Using Street View Images. ISPRS J. Photogramm. Remote Sens. 2018, 145, 44–59. [Google Scholar] [CrossRef]
- Laupheimer, D.; Tutzauer, P.; Haala, N.; Spicker, M. Neural Networks for the Classification of Building Use from Street-View Imagery. ISPRS Ann. Photogramm. Remote Sens. Spatial Inf. Sci. 2018, IV–2, 177–184. [Google Scholar] [CrossRef]
- Wei, Y.; Luo, G.; Yu, L.; Huang, Z. Identification of Urban Building Functions Based on Points of Interest and Spatial Relationships between Geographic Entities. Appl. Sci. 2024, 14, 4544. [Google Scholar] [CrossRef]
- Feng, Y.; Liu, Y.; Batty, M. Modeling Urban Growth with GIS Based Cellular Automata and Least Squares SVM Rules: A Case Study in Qingpu–Songjiang Area of Shanghai, China. Stoch Env. Res Risk Assess 2016, 30, 1387–1400. [Google Scholar] [CrossRef]
- Sevgen, E.; Abdikan, S. Classification of Large-Scale Mobile Laser Scanning Data in Urban Area with LightGBM. Remote Sens. 2023, 15, 3787. [Google Scholar] [CrossRef]
- The Bureau of Registration Administration Official Statistics Registration Systems. Available online: https://stat.bora.dopa.go.th/stat/statnew/statMenu/newStat/home.php (accessed on 29 January 2025).
- Meta Facebook Data for Good High Resolution Population Density Maps Demographic. Available online: https://dataforgood.facebook.com/dfg/docs/methodology-high-resolution-population-density-maps (accessed on 4 September 2024).
- WorldPop Population Counts Thailand 100m. Available online: https://hub.worldpop.org/doi/10.5258/SOTON/WP00267 (accessed on 21 June 2022).
- Sridhar, V.; Breub, M. An Exact Fast Fourier Method for Morphological Dilation and Erosion Using the Umbra Technique. In Proceedings of the 2022 19th Conference on Robots and Vision (CRV), Toronto, ON, Canada, 31 May–2 June 2022; IEEE: Toronto, ON, Canada, 2022; pp. 190–196. [Google Scholar]
- Said, K.A.M.; Jambek, A.B. Analysis of Image Processing Using Morphological Erosion and Dilation. J. Phys. Conf. Ser. 2021, 2071, 012033. [Google Scholar] [CrossRef]
- Preyawanit, N. Controlling A Fast-Growing Urban Region: A Case Study in the Bangkok Metropolitan Region. Arch. SU J. 2016, 23, 219. [Google Scholar]
- Margono, R.B.; Zuraida, S.; Abadi, A.A. Transit-Induced Gentrification in Bangkok, Thailand: A Review. IOP Conf. Ser. Earth Environ. Sci. 2020, 532, 012013. [Google Scholar] [CrossRef]
- Pongprasert, P. Determinants of New Condominium Prices near MRT Orange Line Stations: Case Study of Estimating Housing Affordability in Bangkok, Thailand. HKJSS 2025, 64, 120–129. [Google Scholar] [CrossRef]
- Shelby, H.; Renwick, T. Displacement through the Commons: Community and Spatial Order in Bangkok. City Soc. 2023, 35, 191–202. [Google Scholar] [CrossRef]
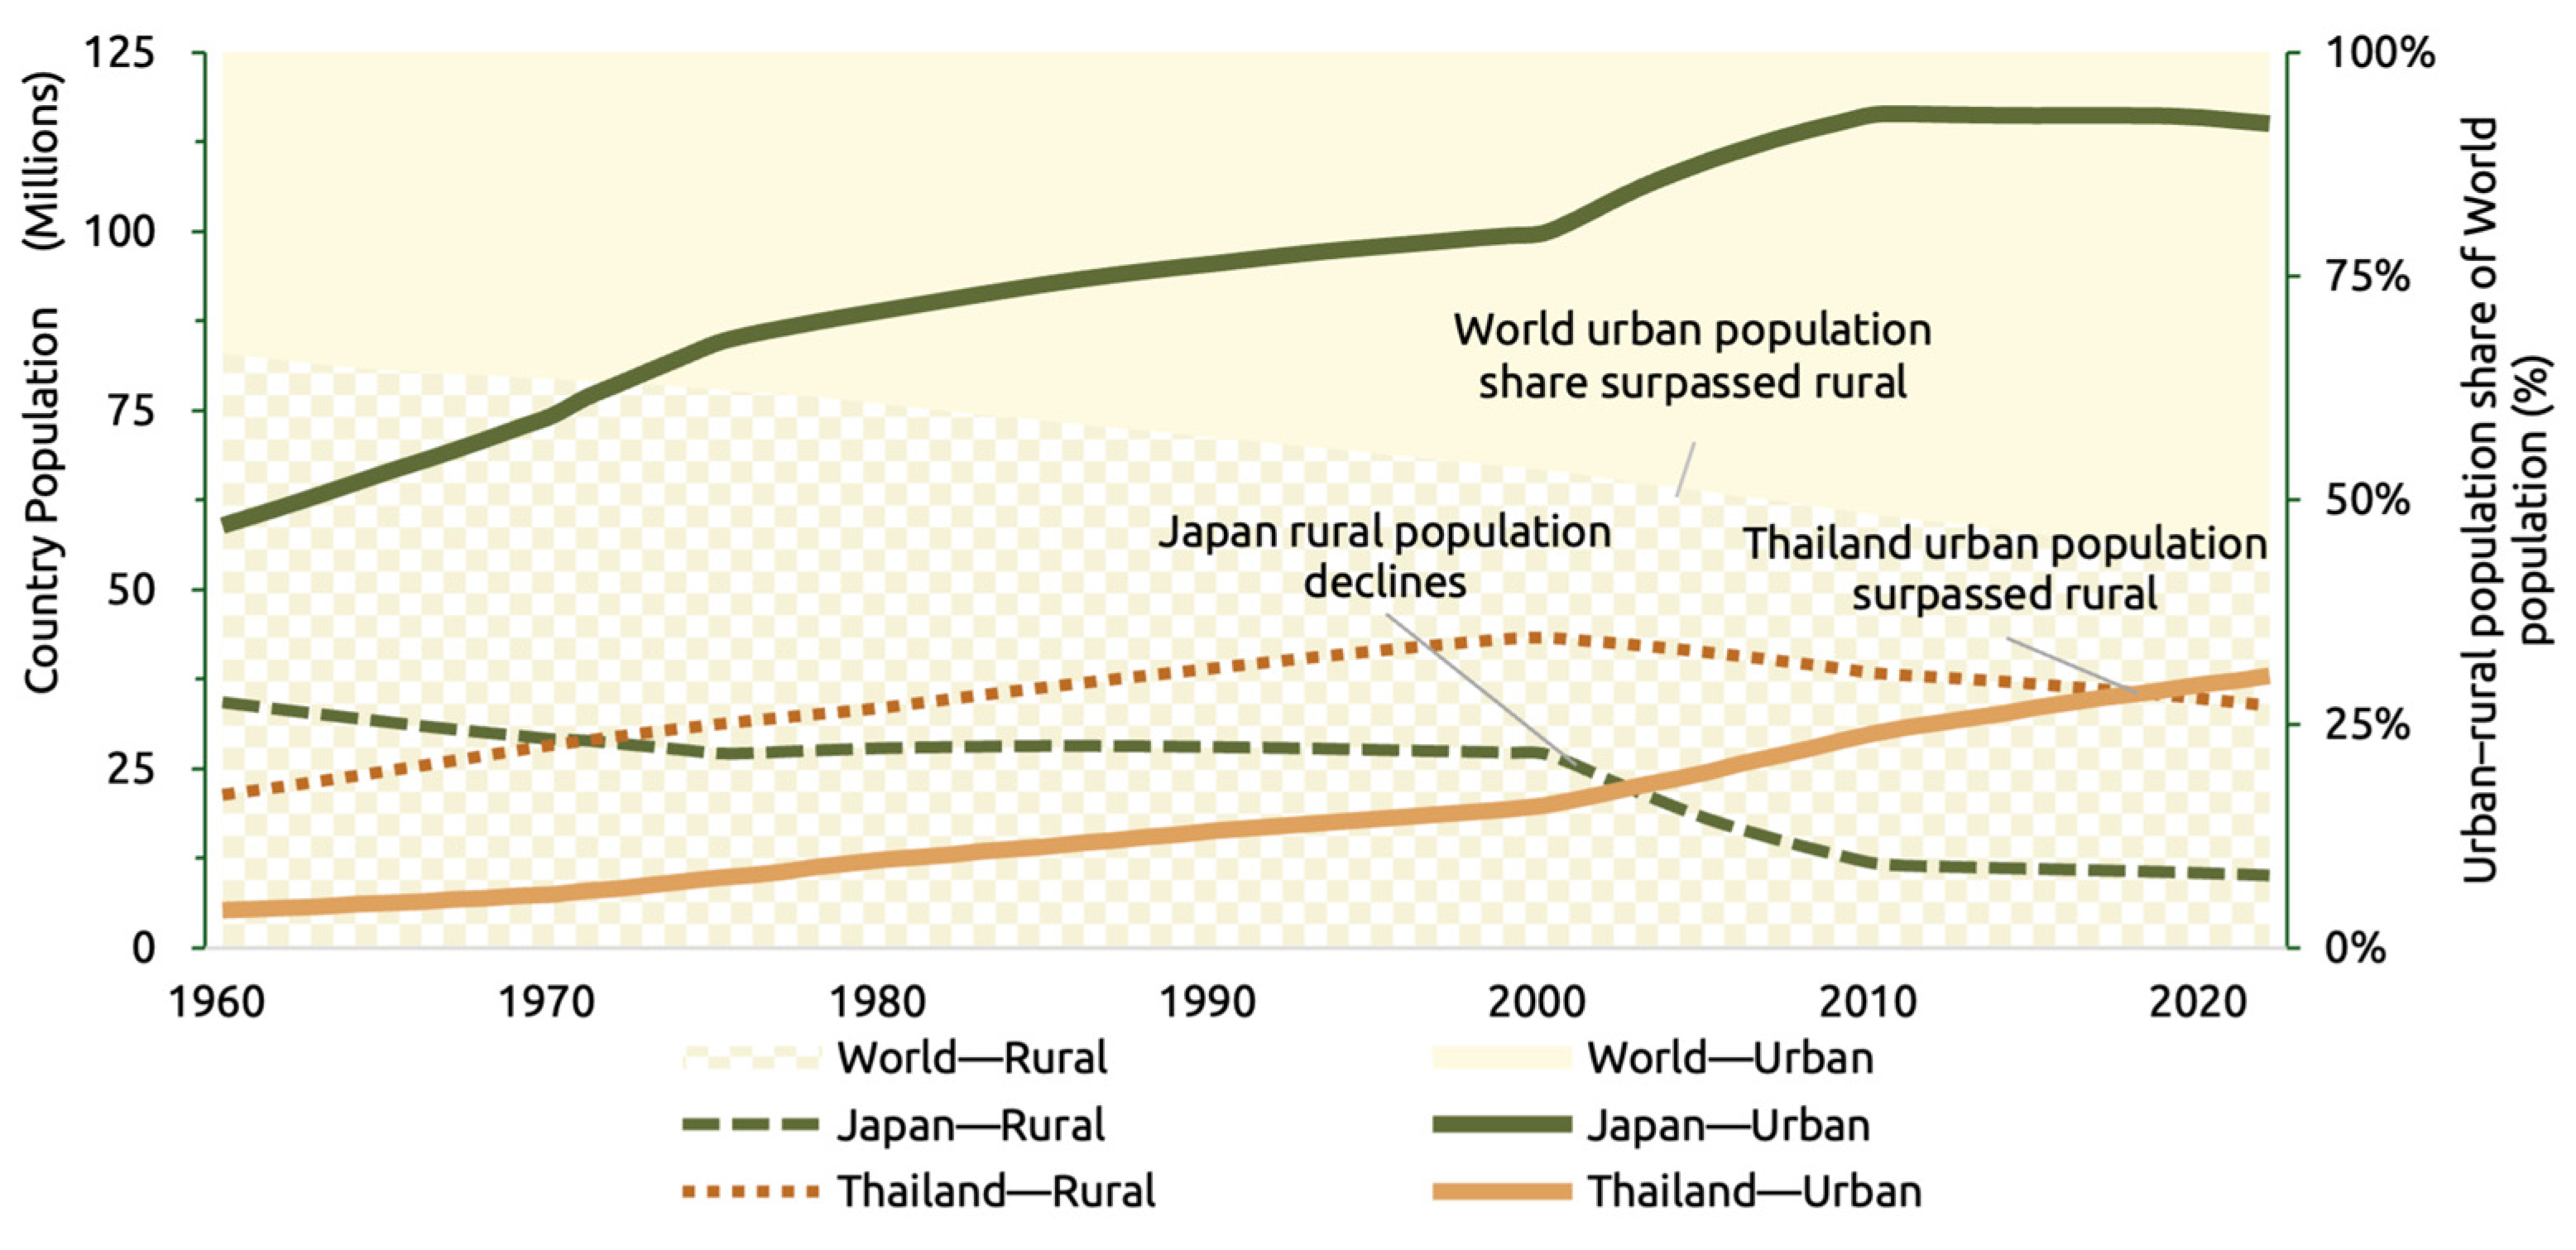
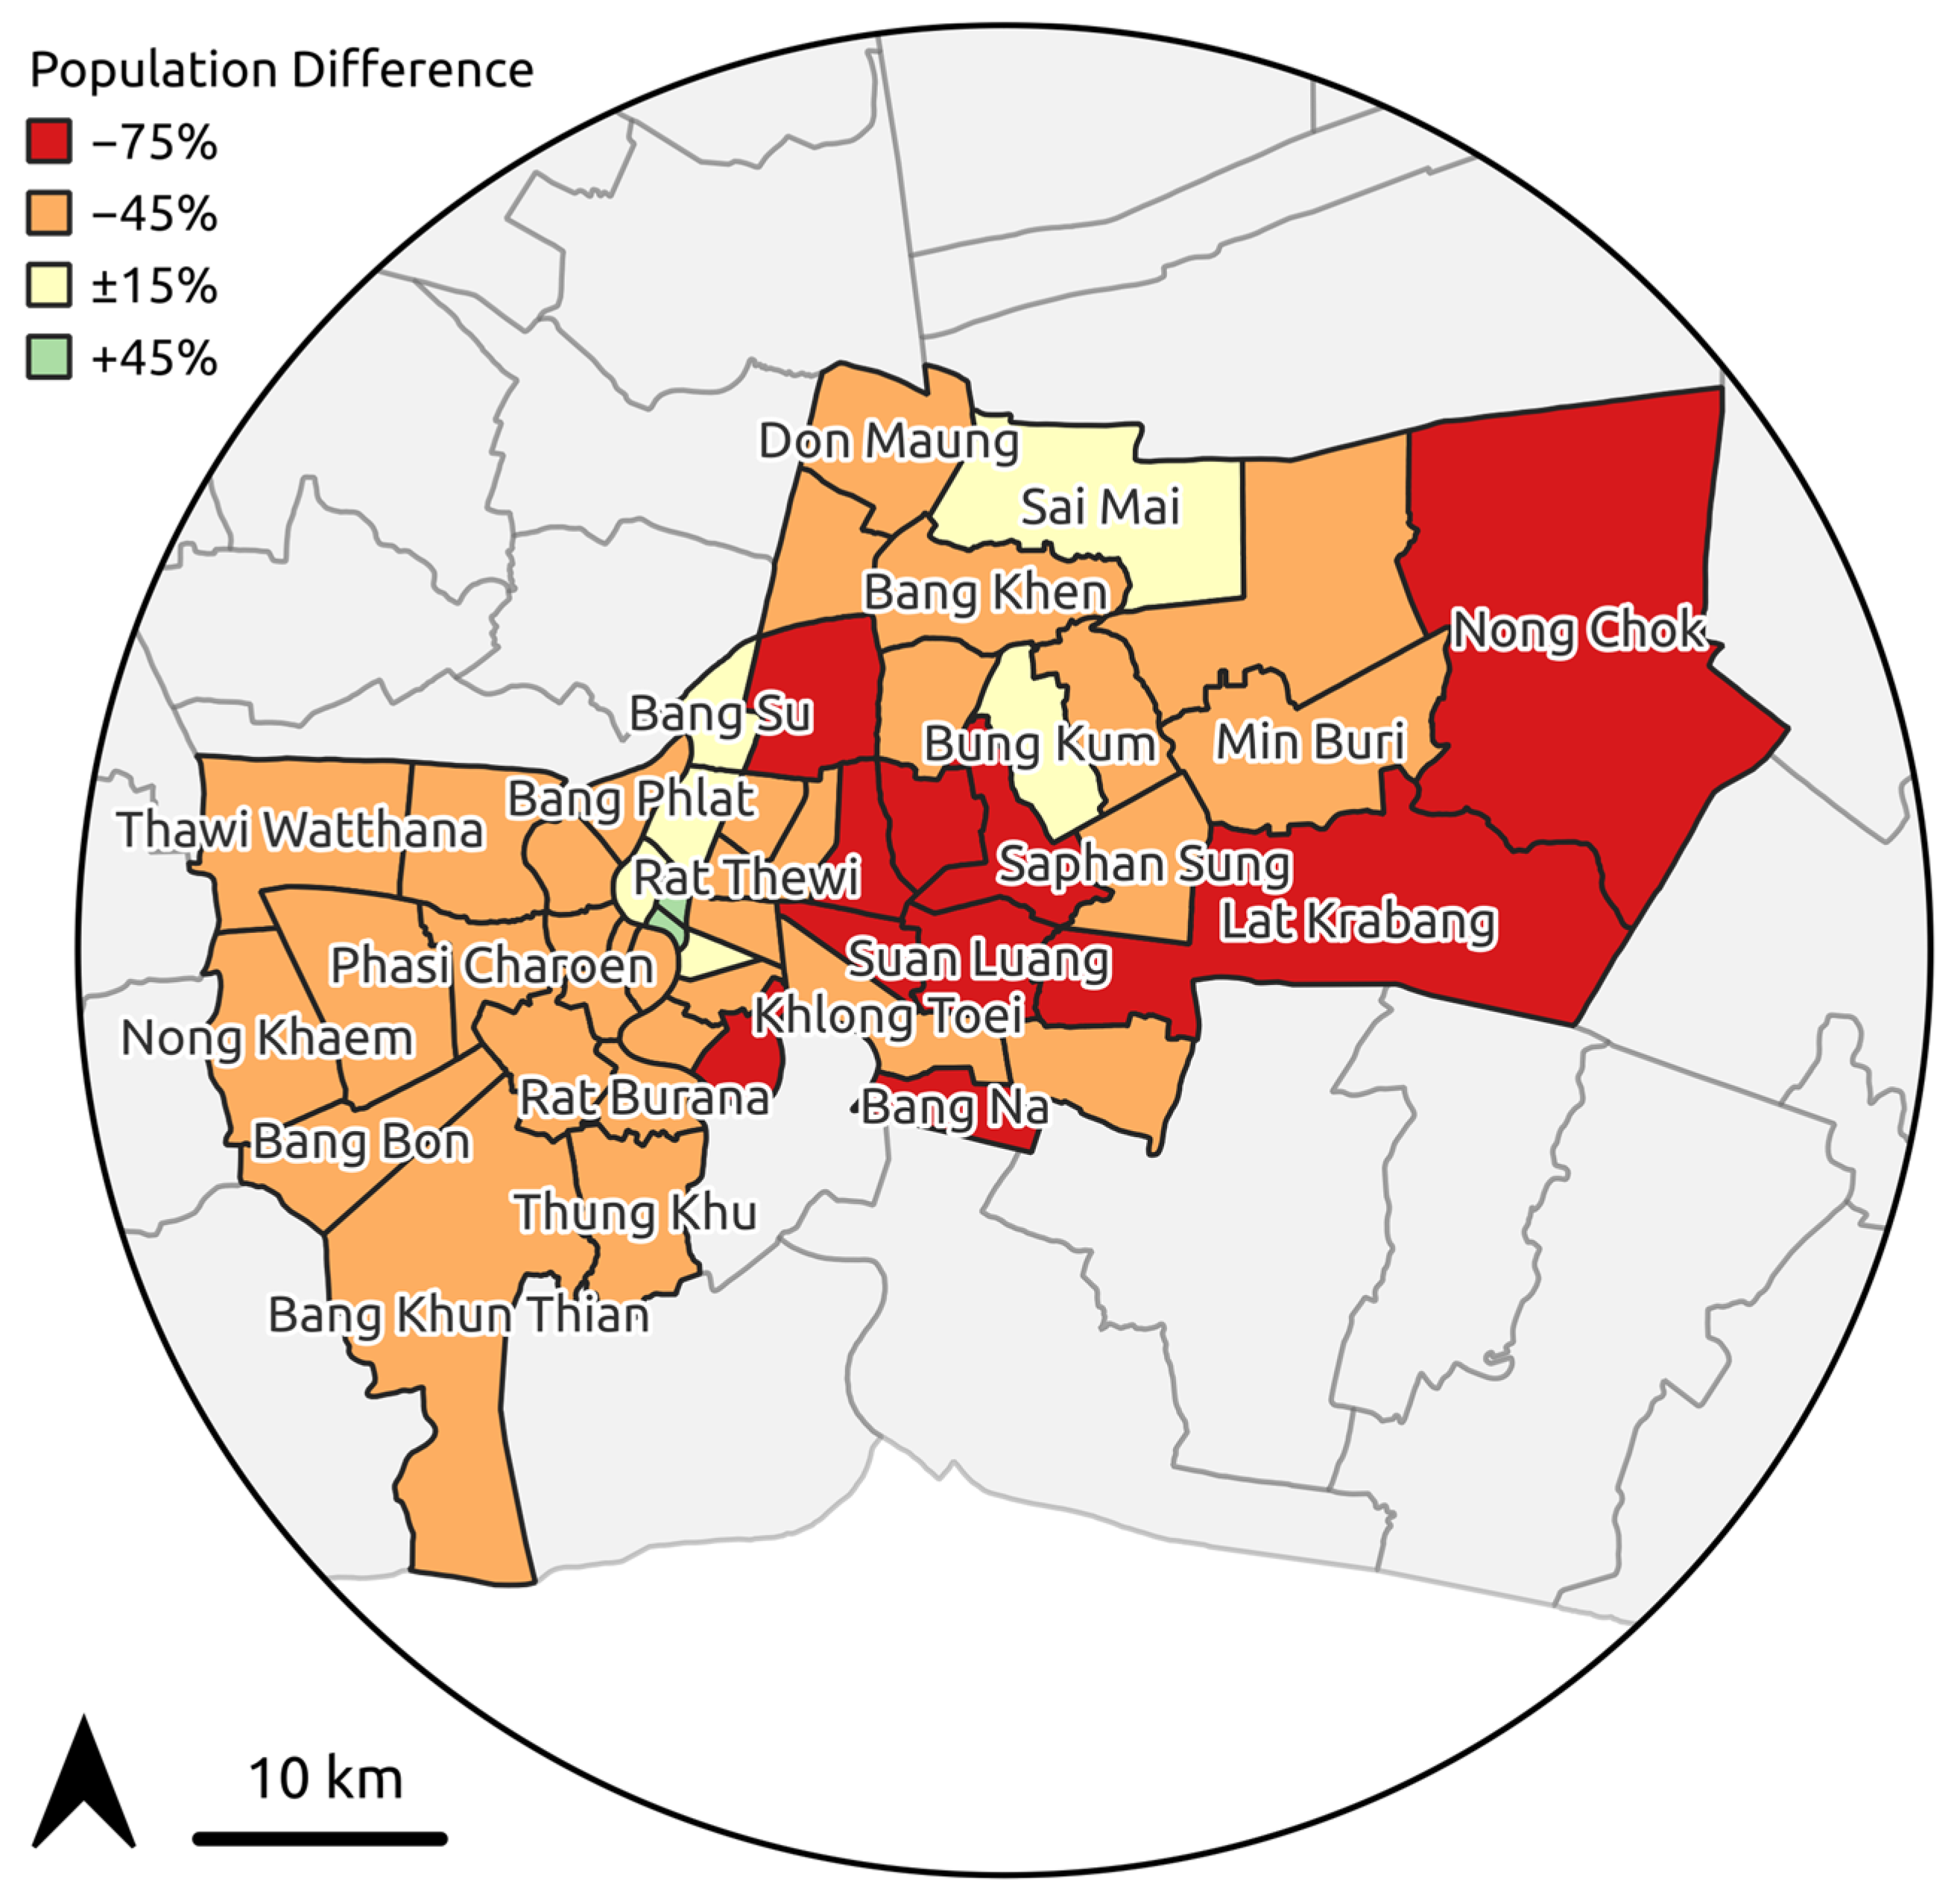
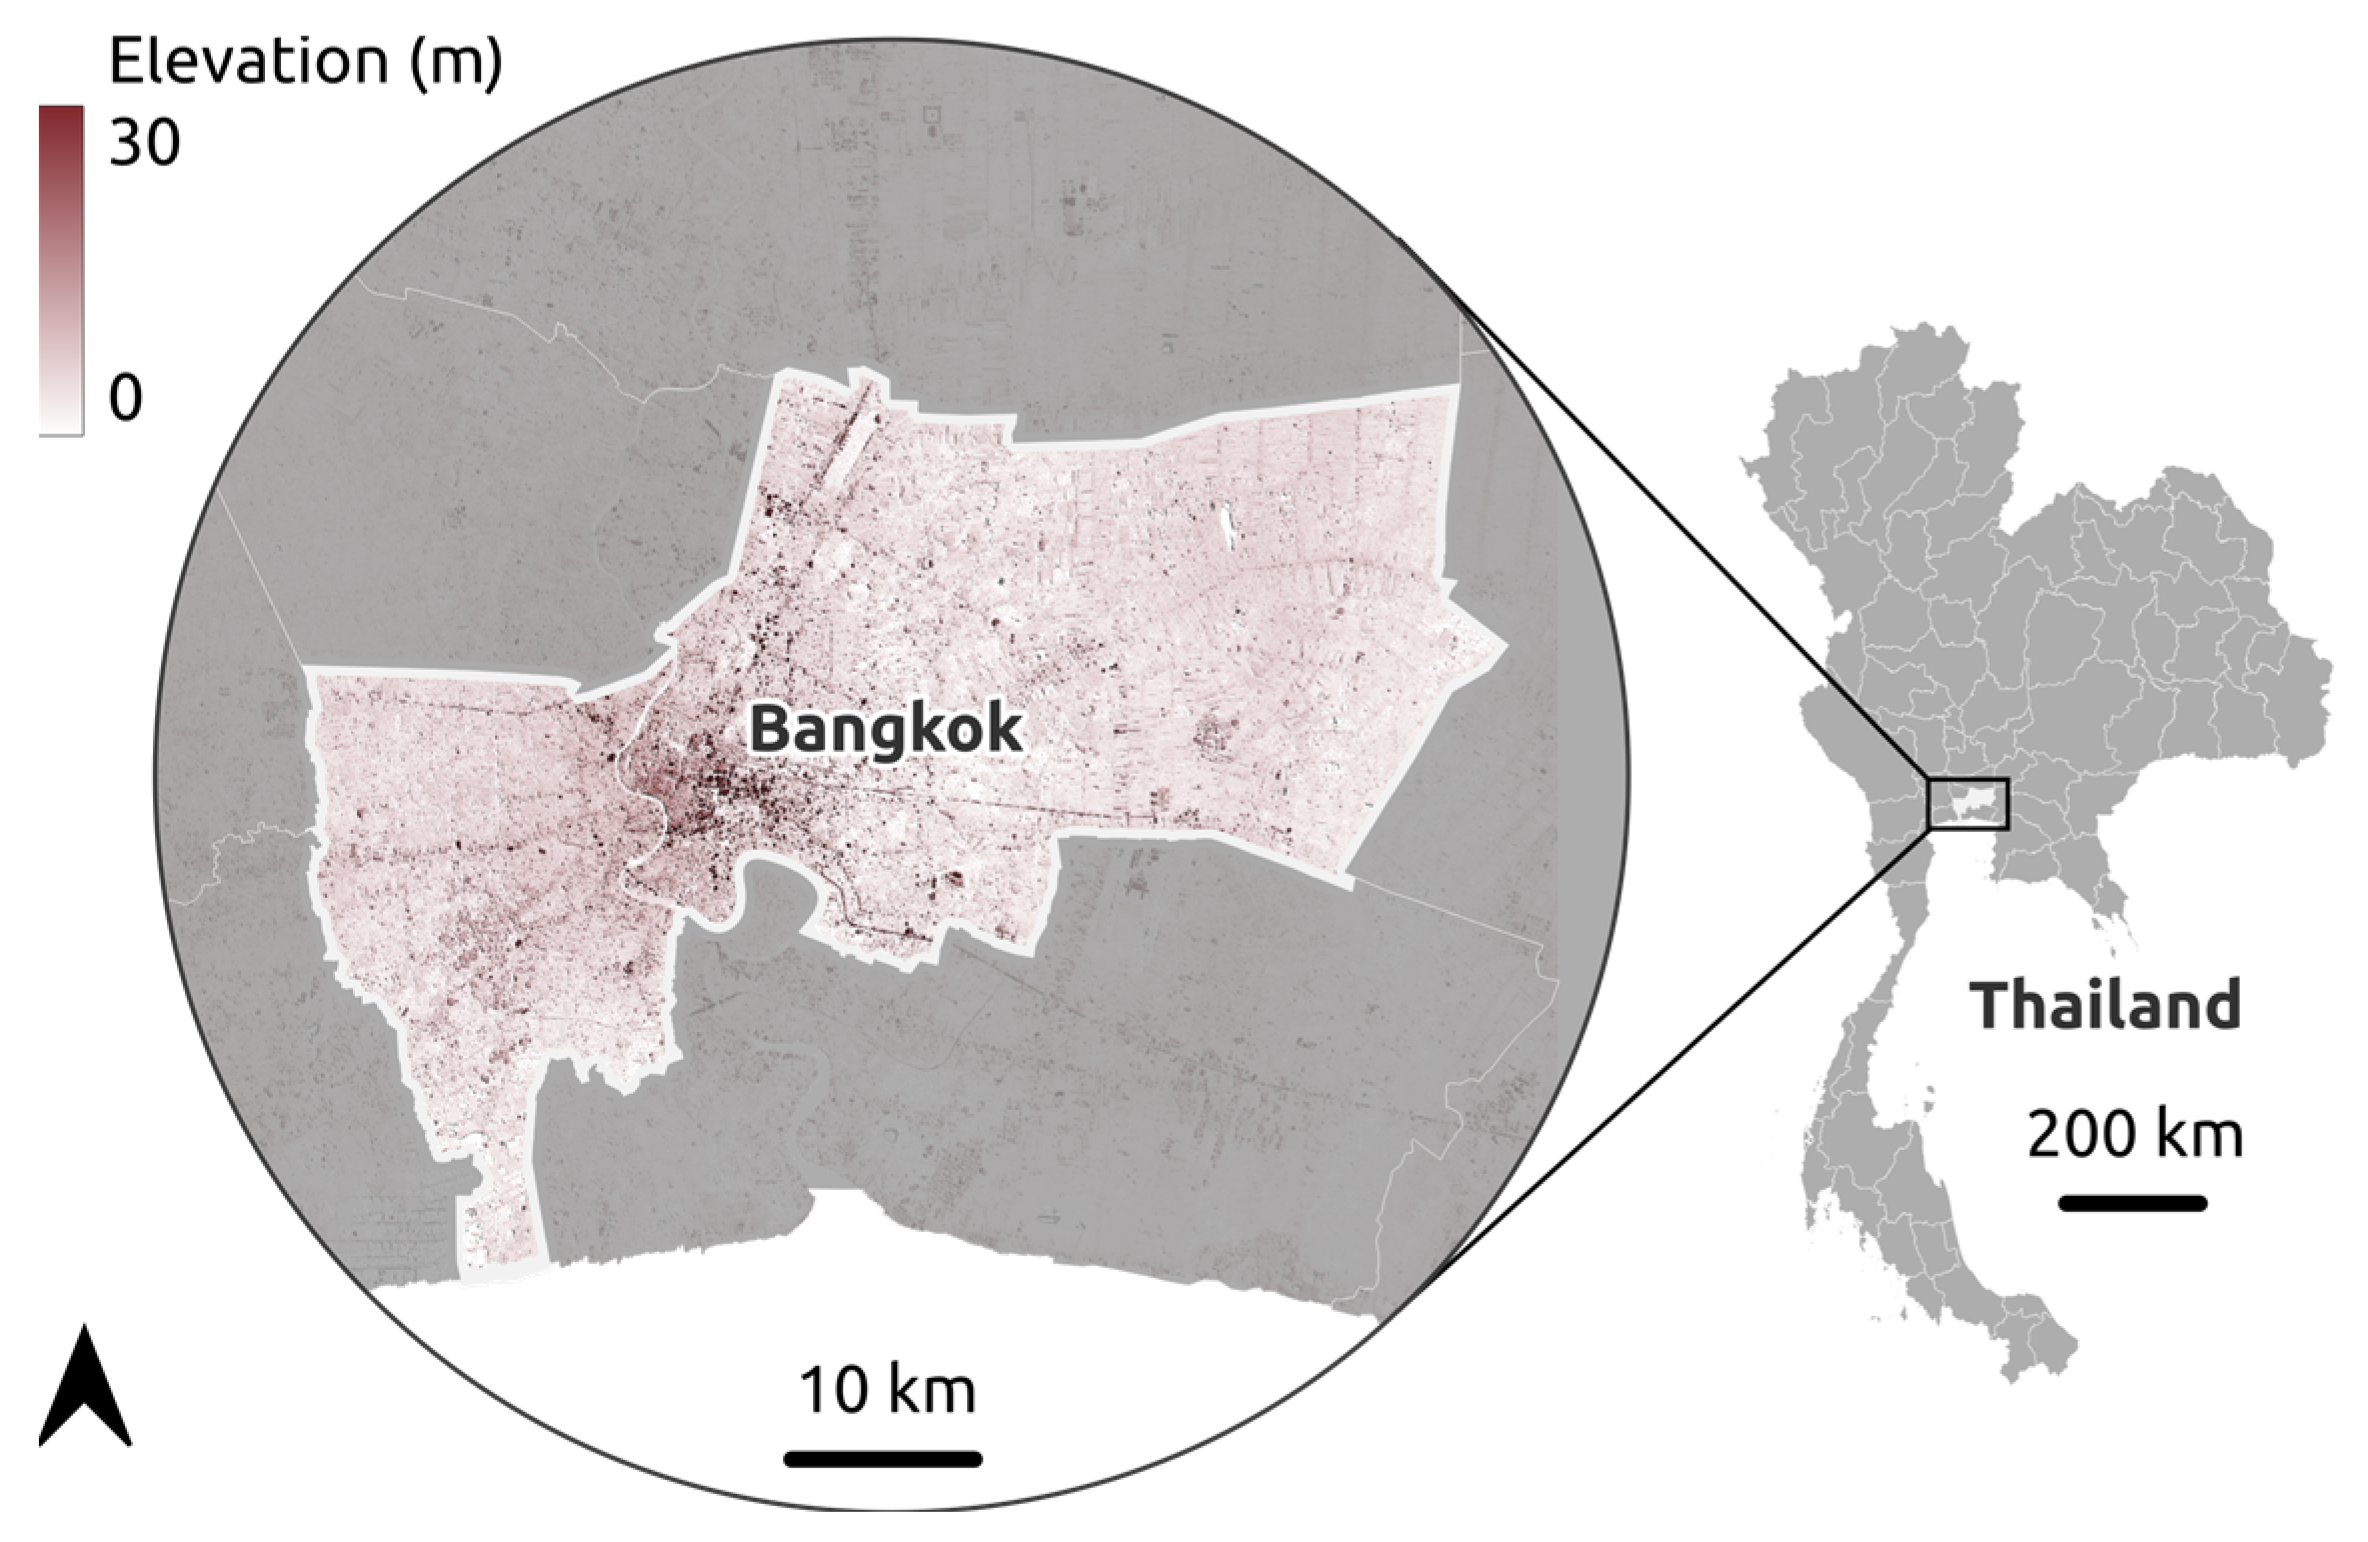
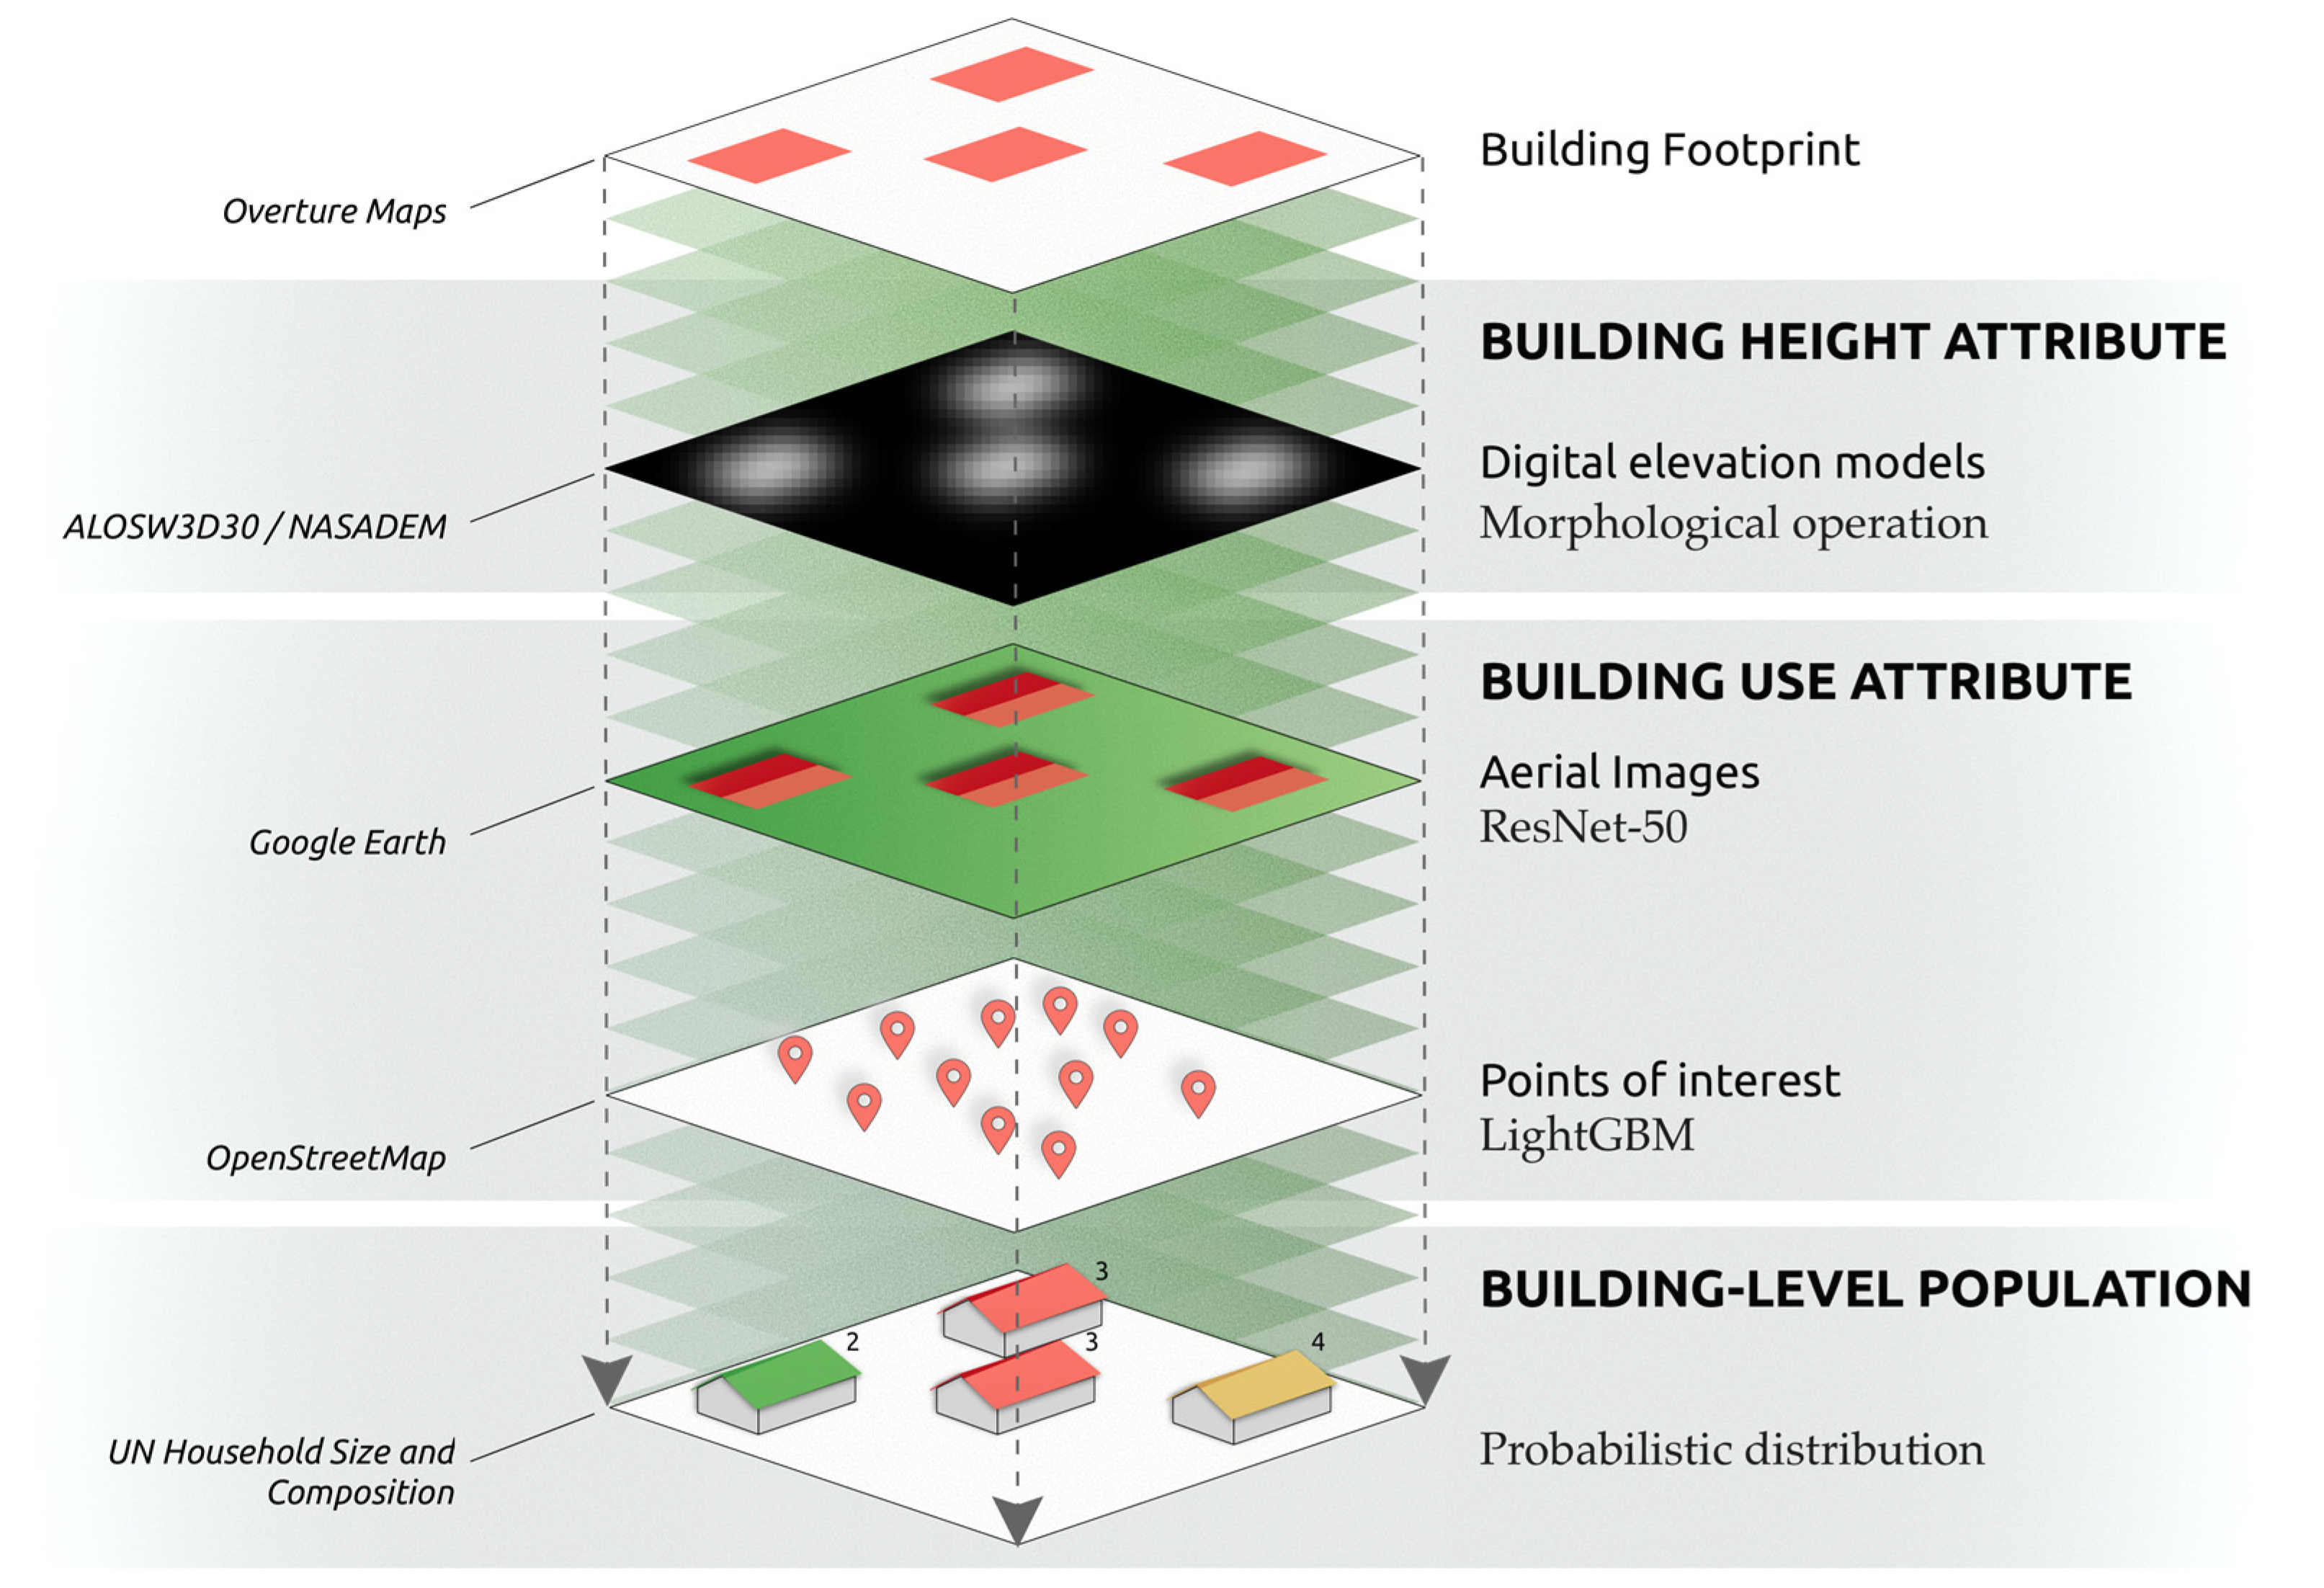
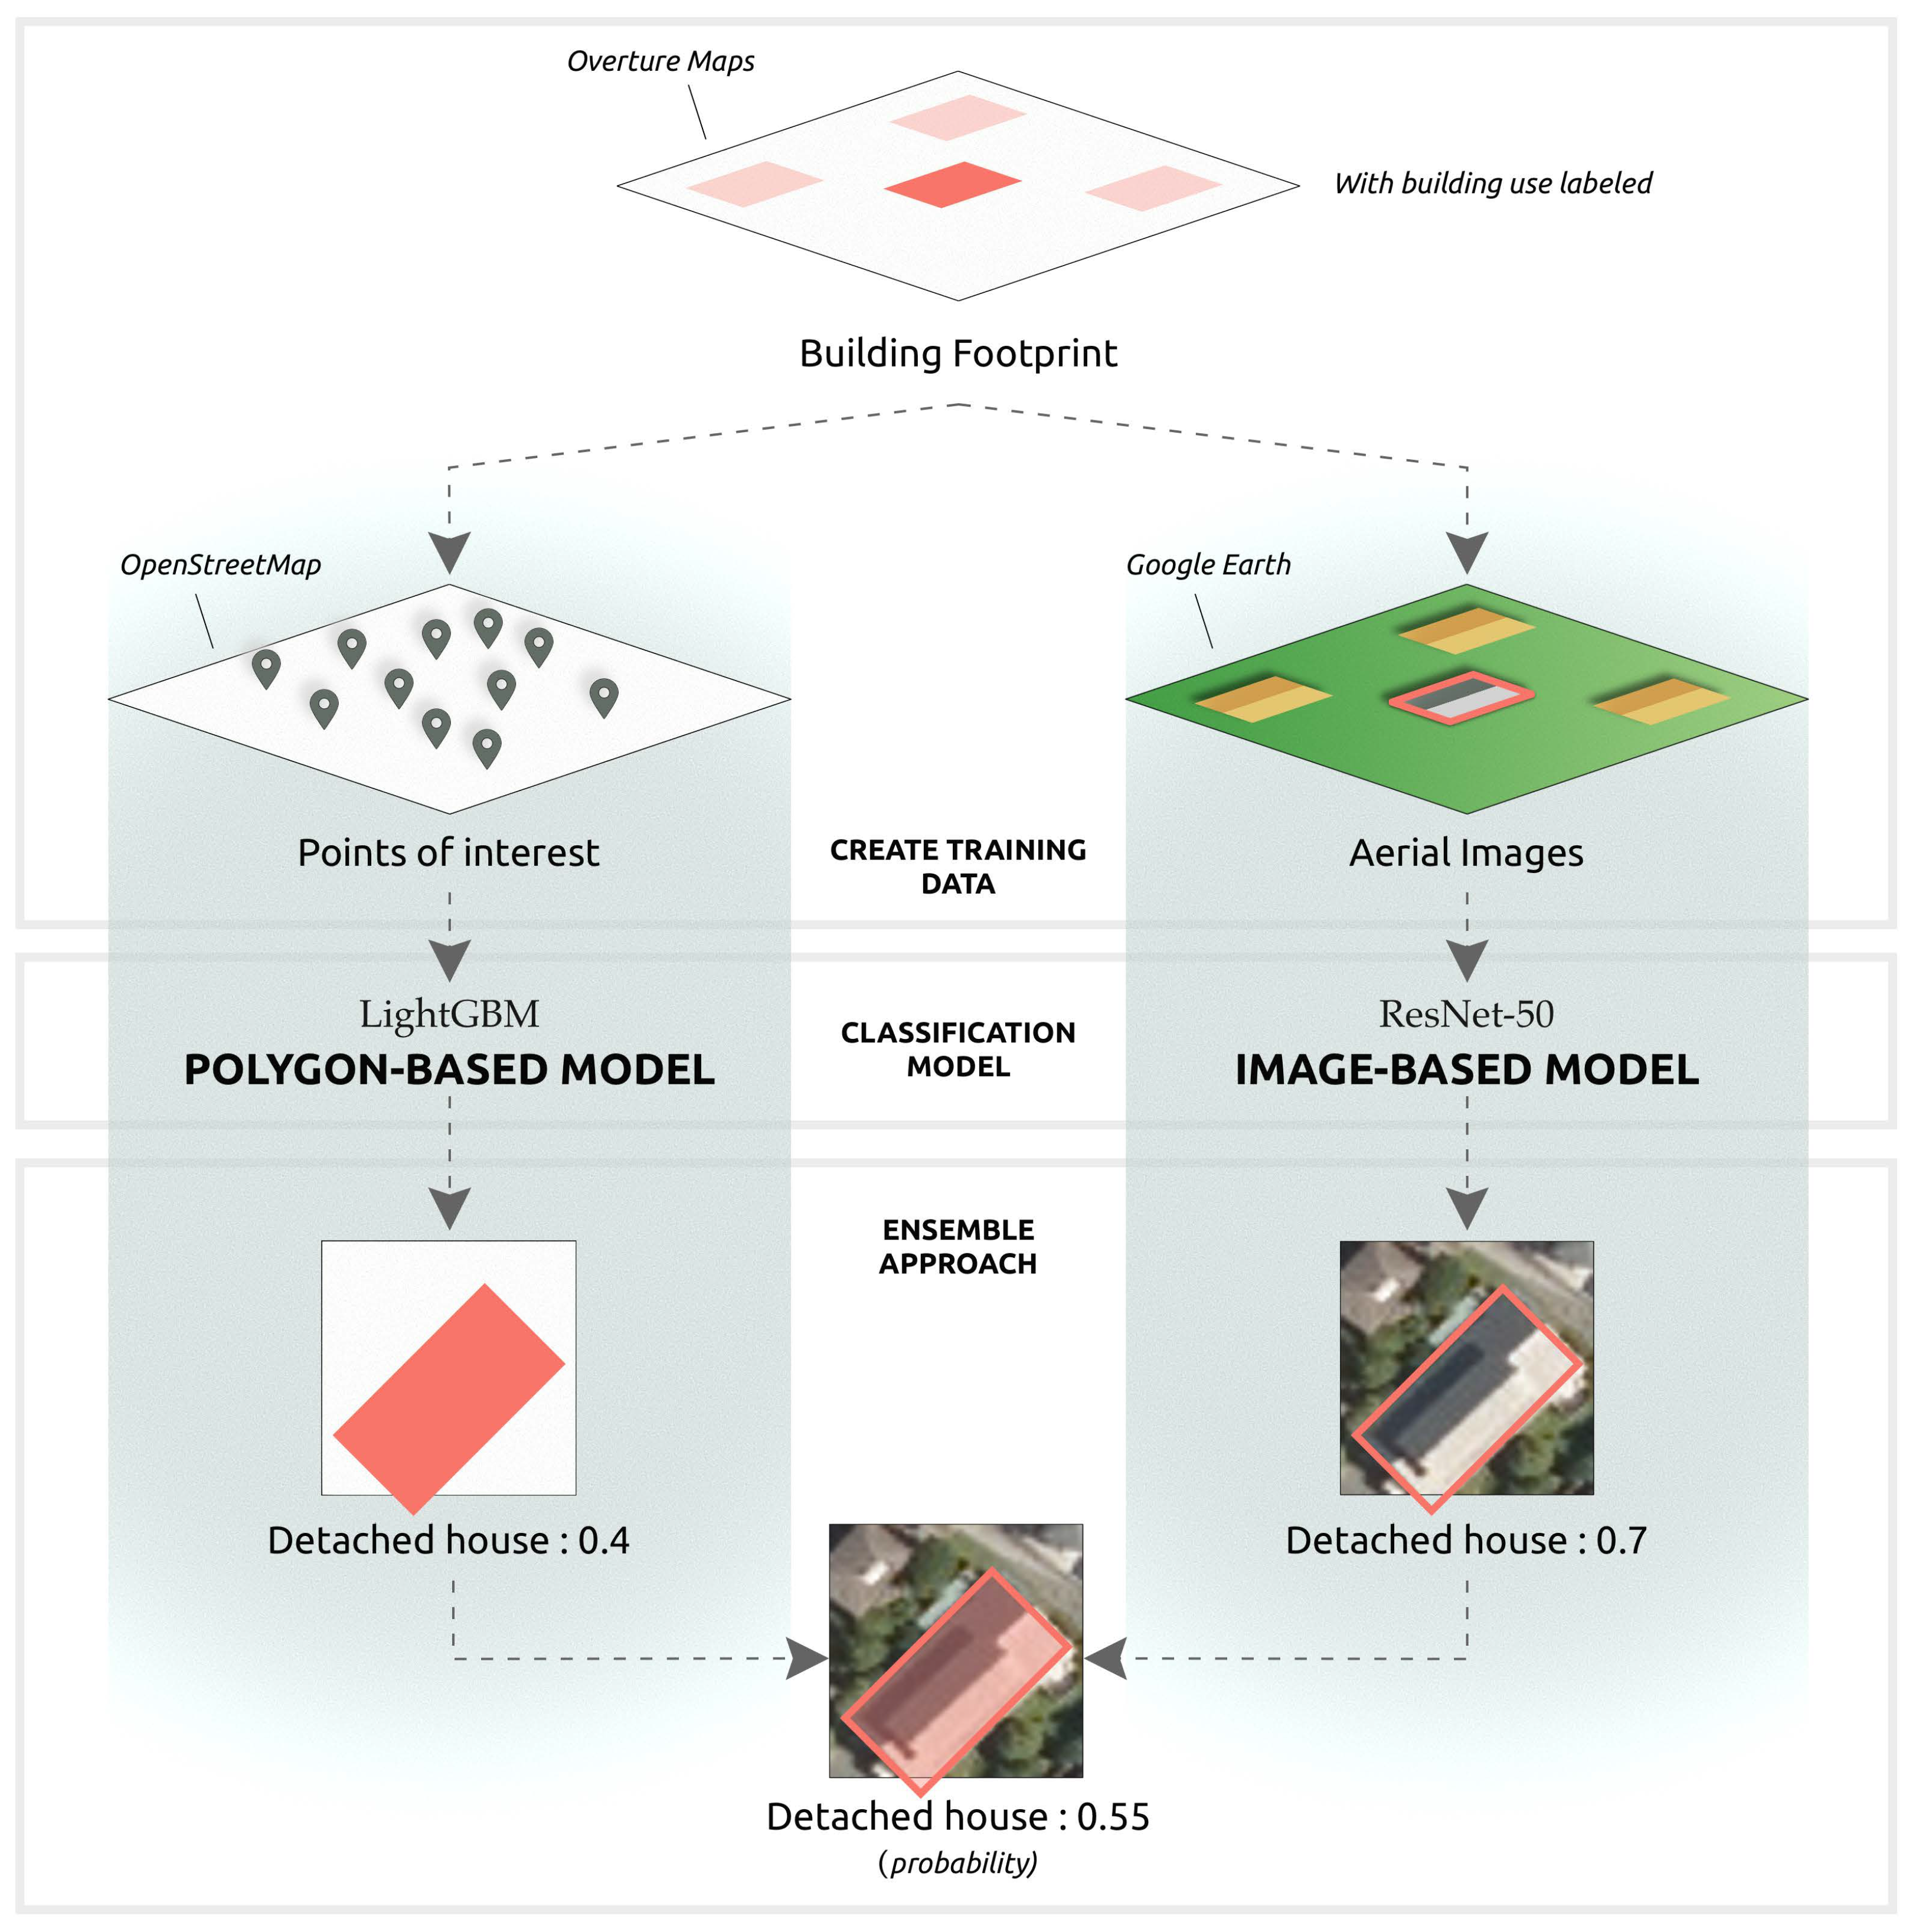

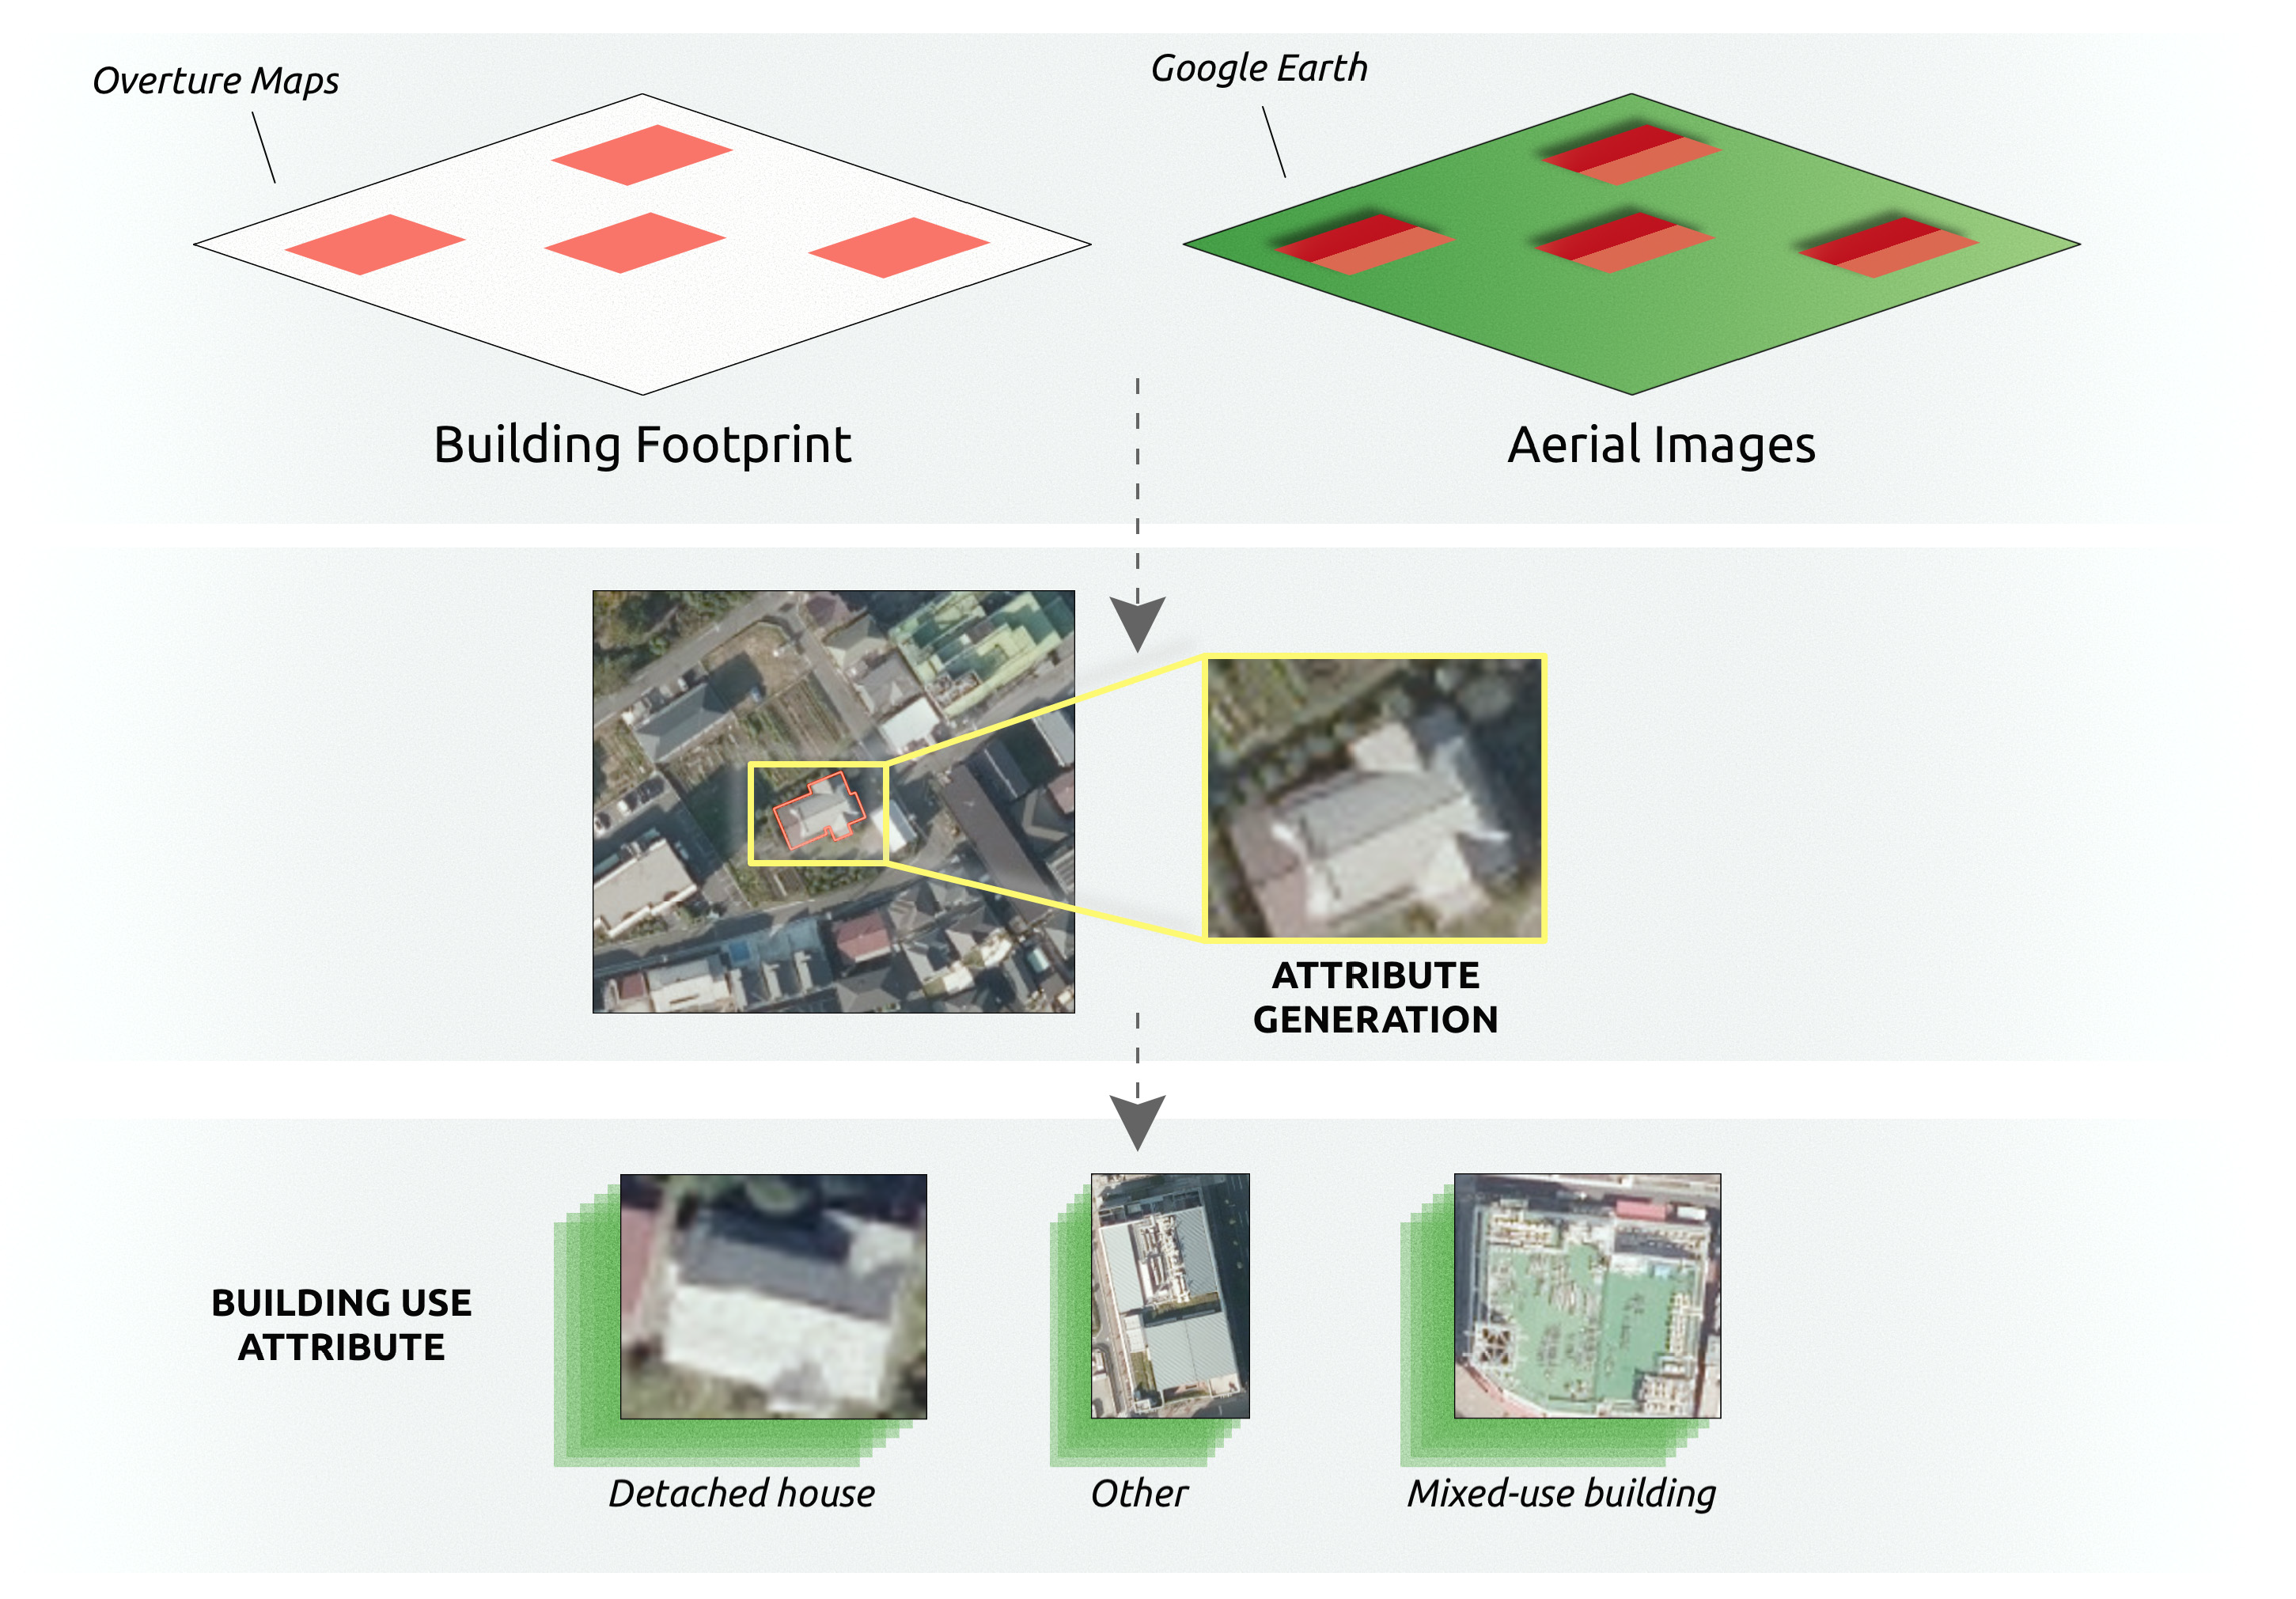
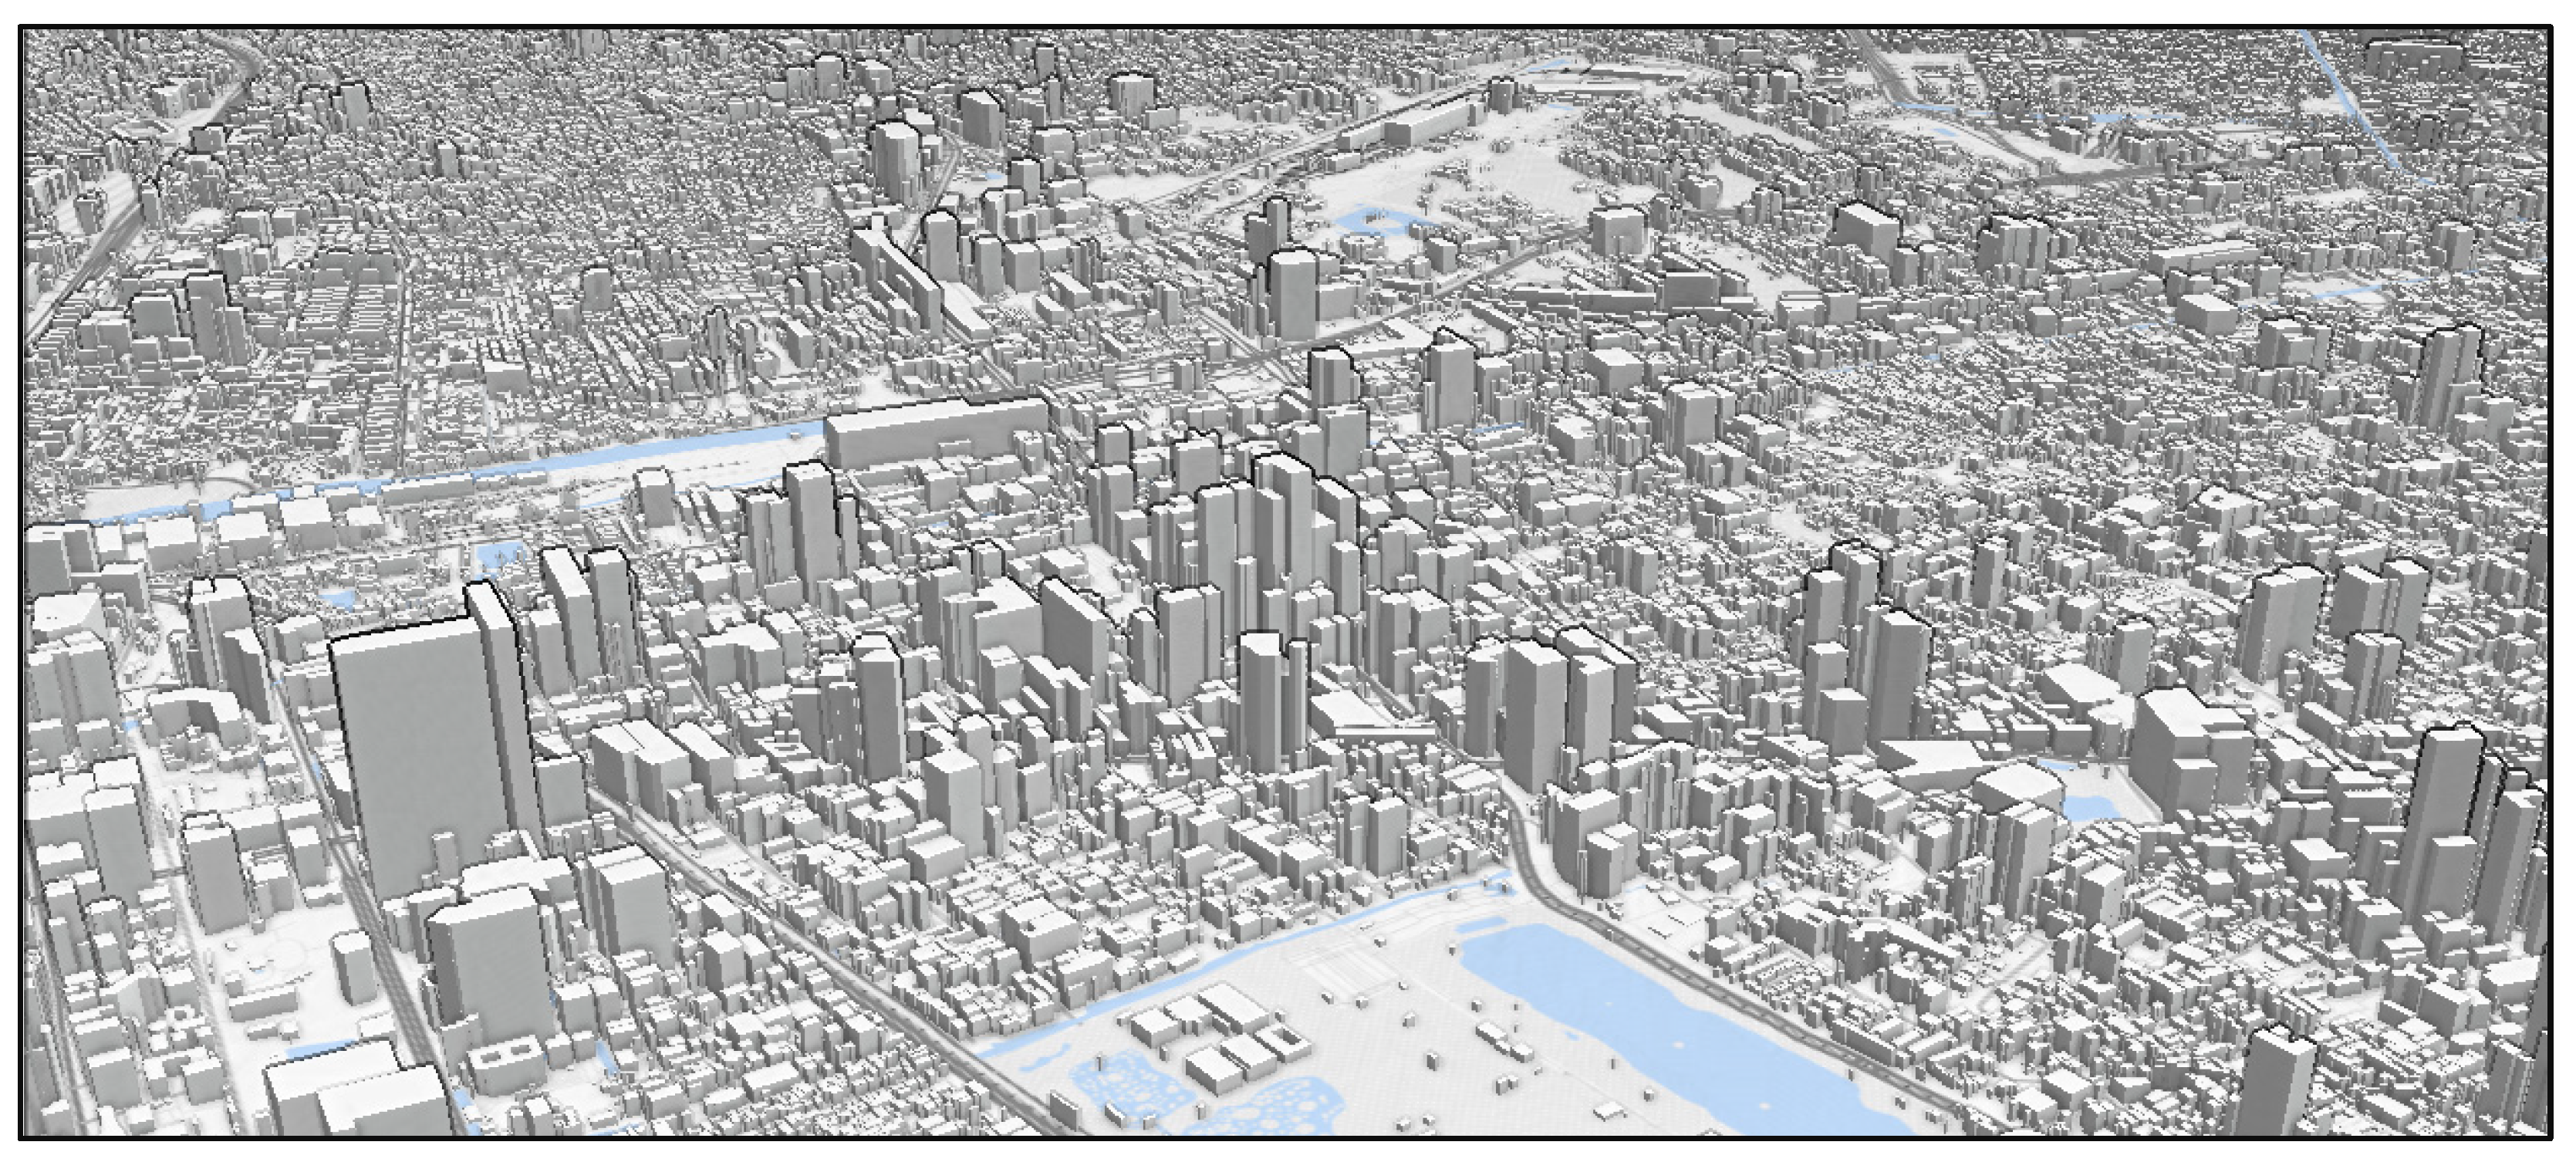
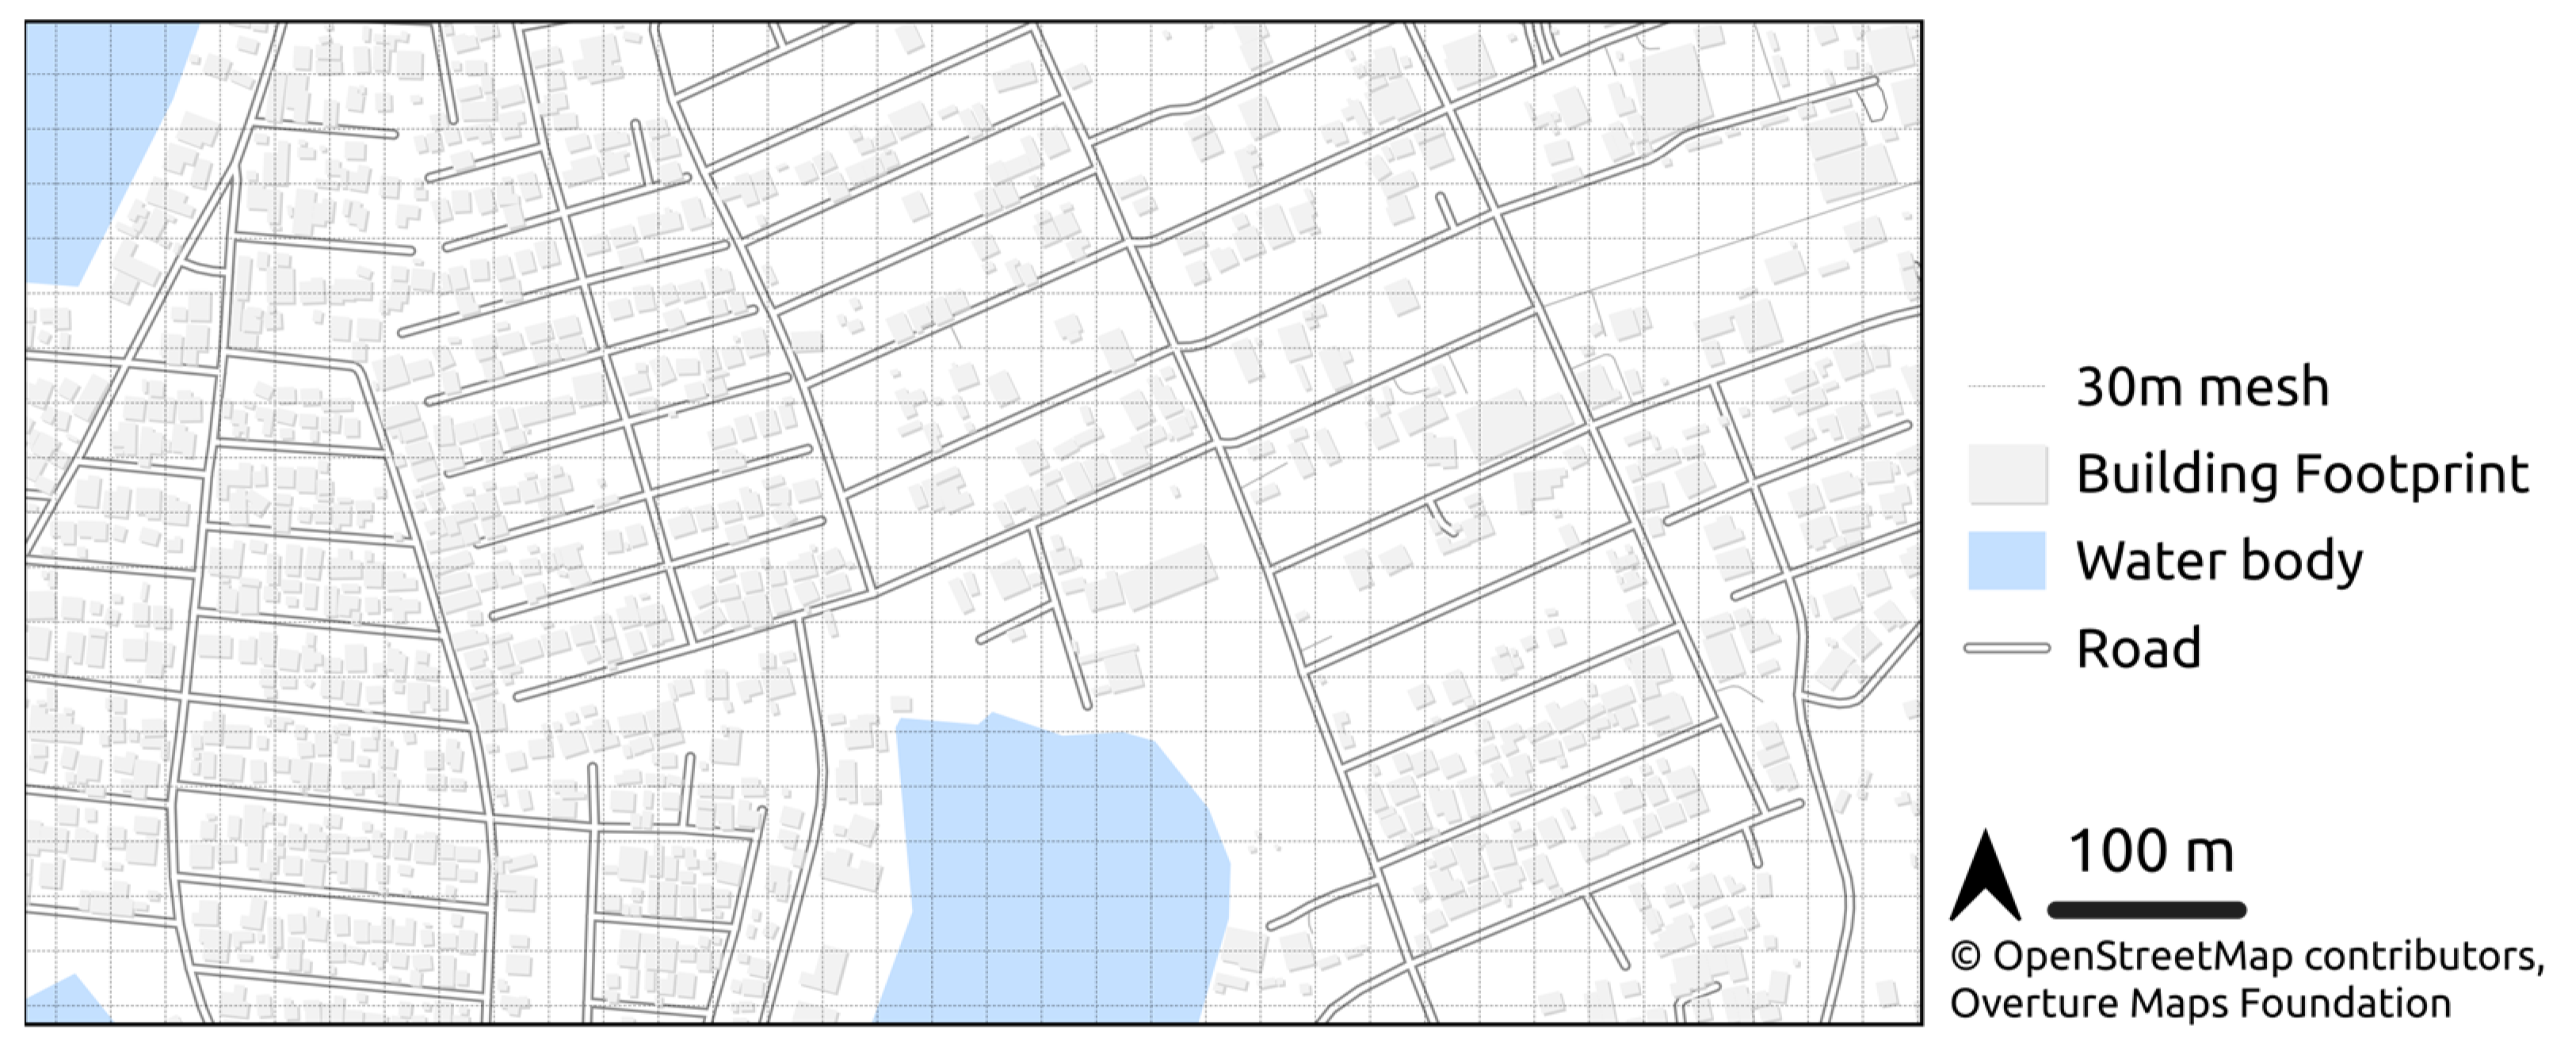
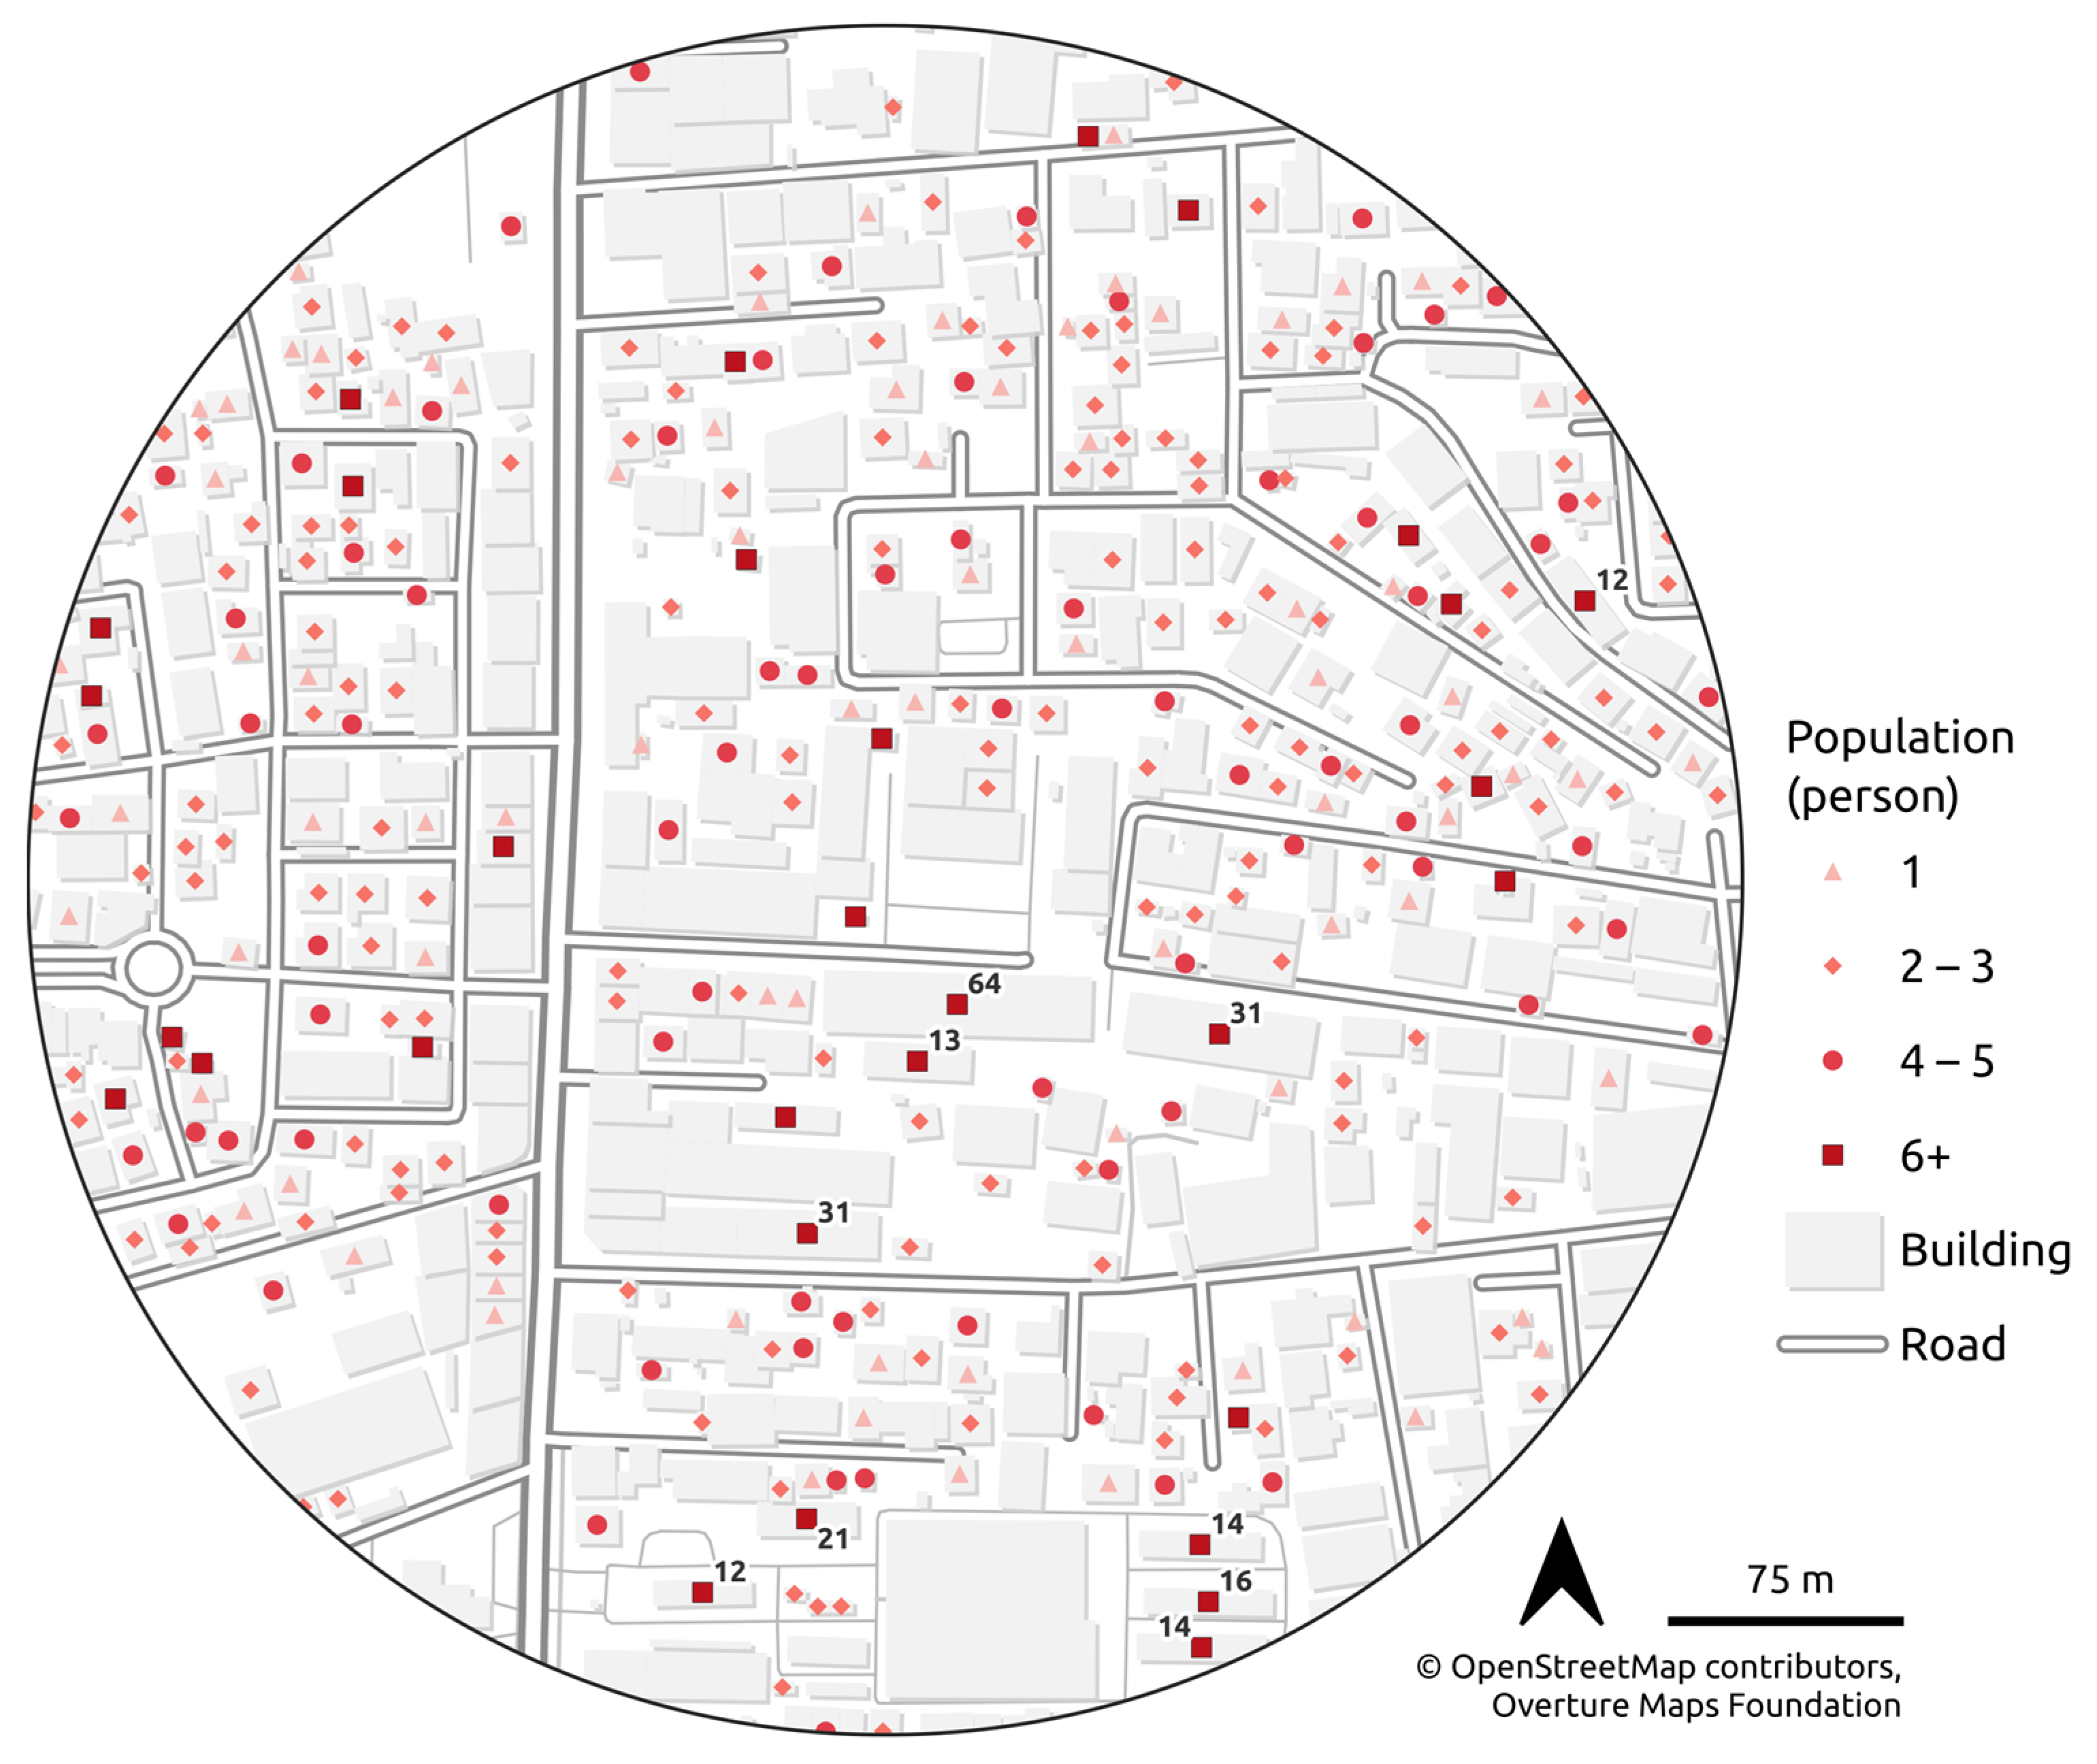
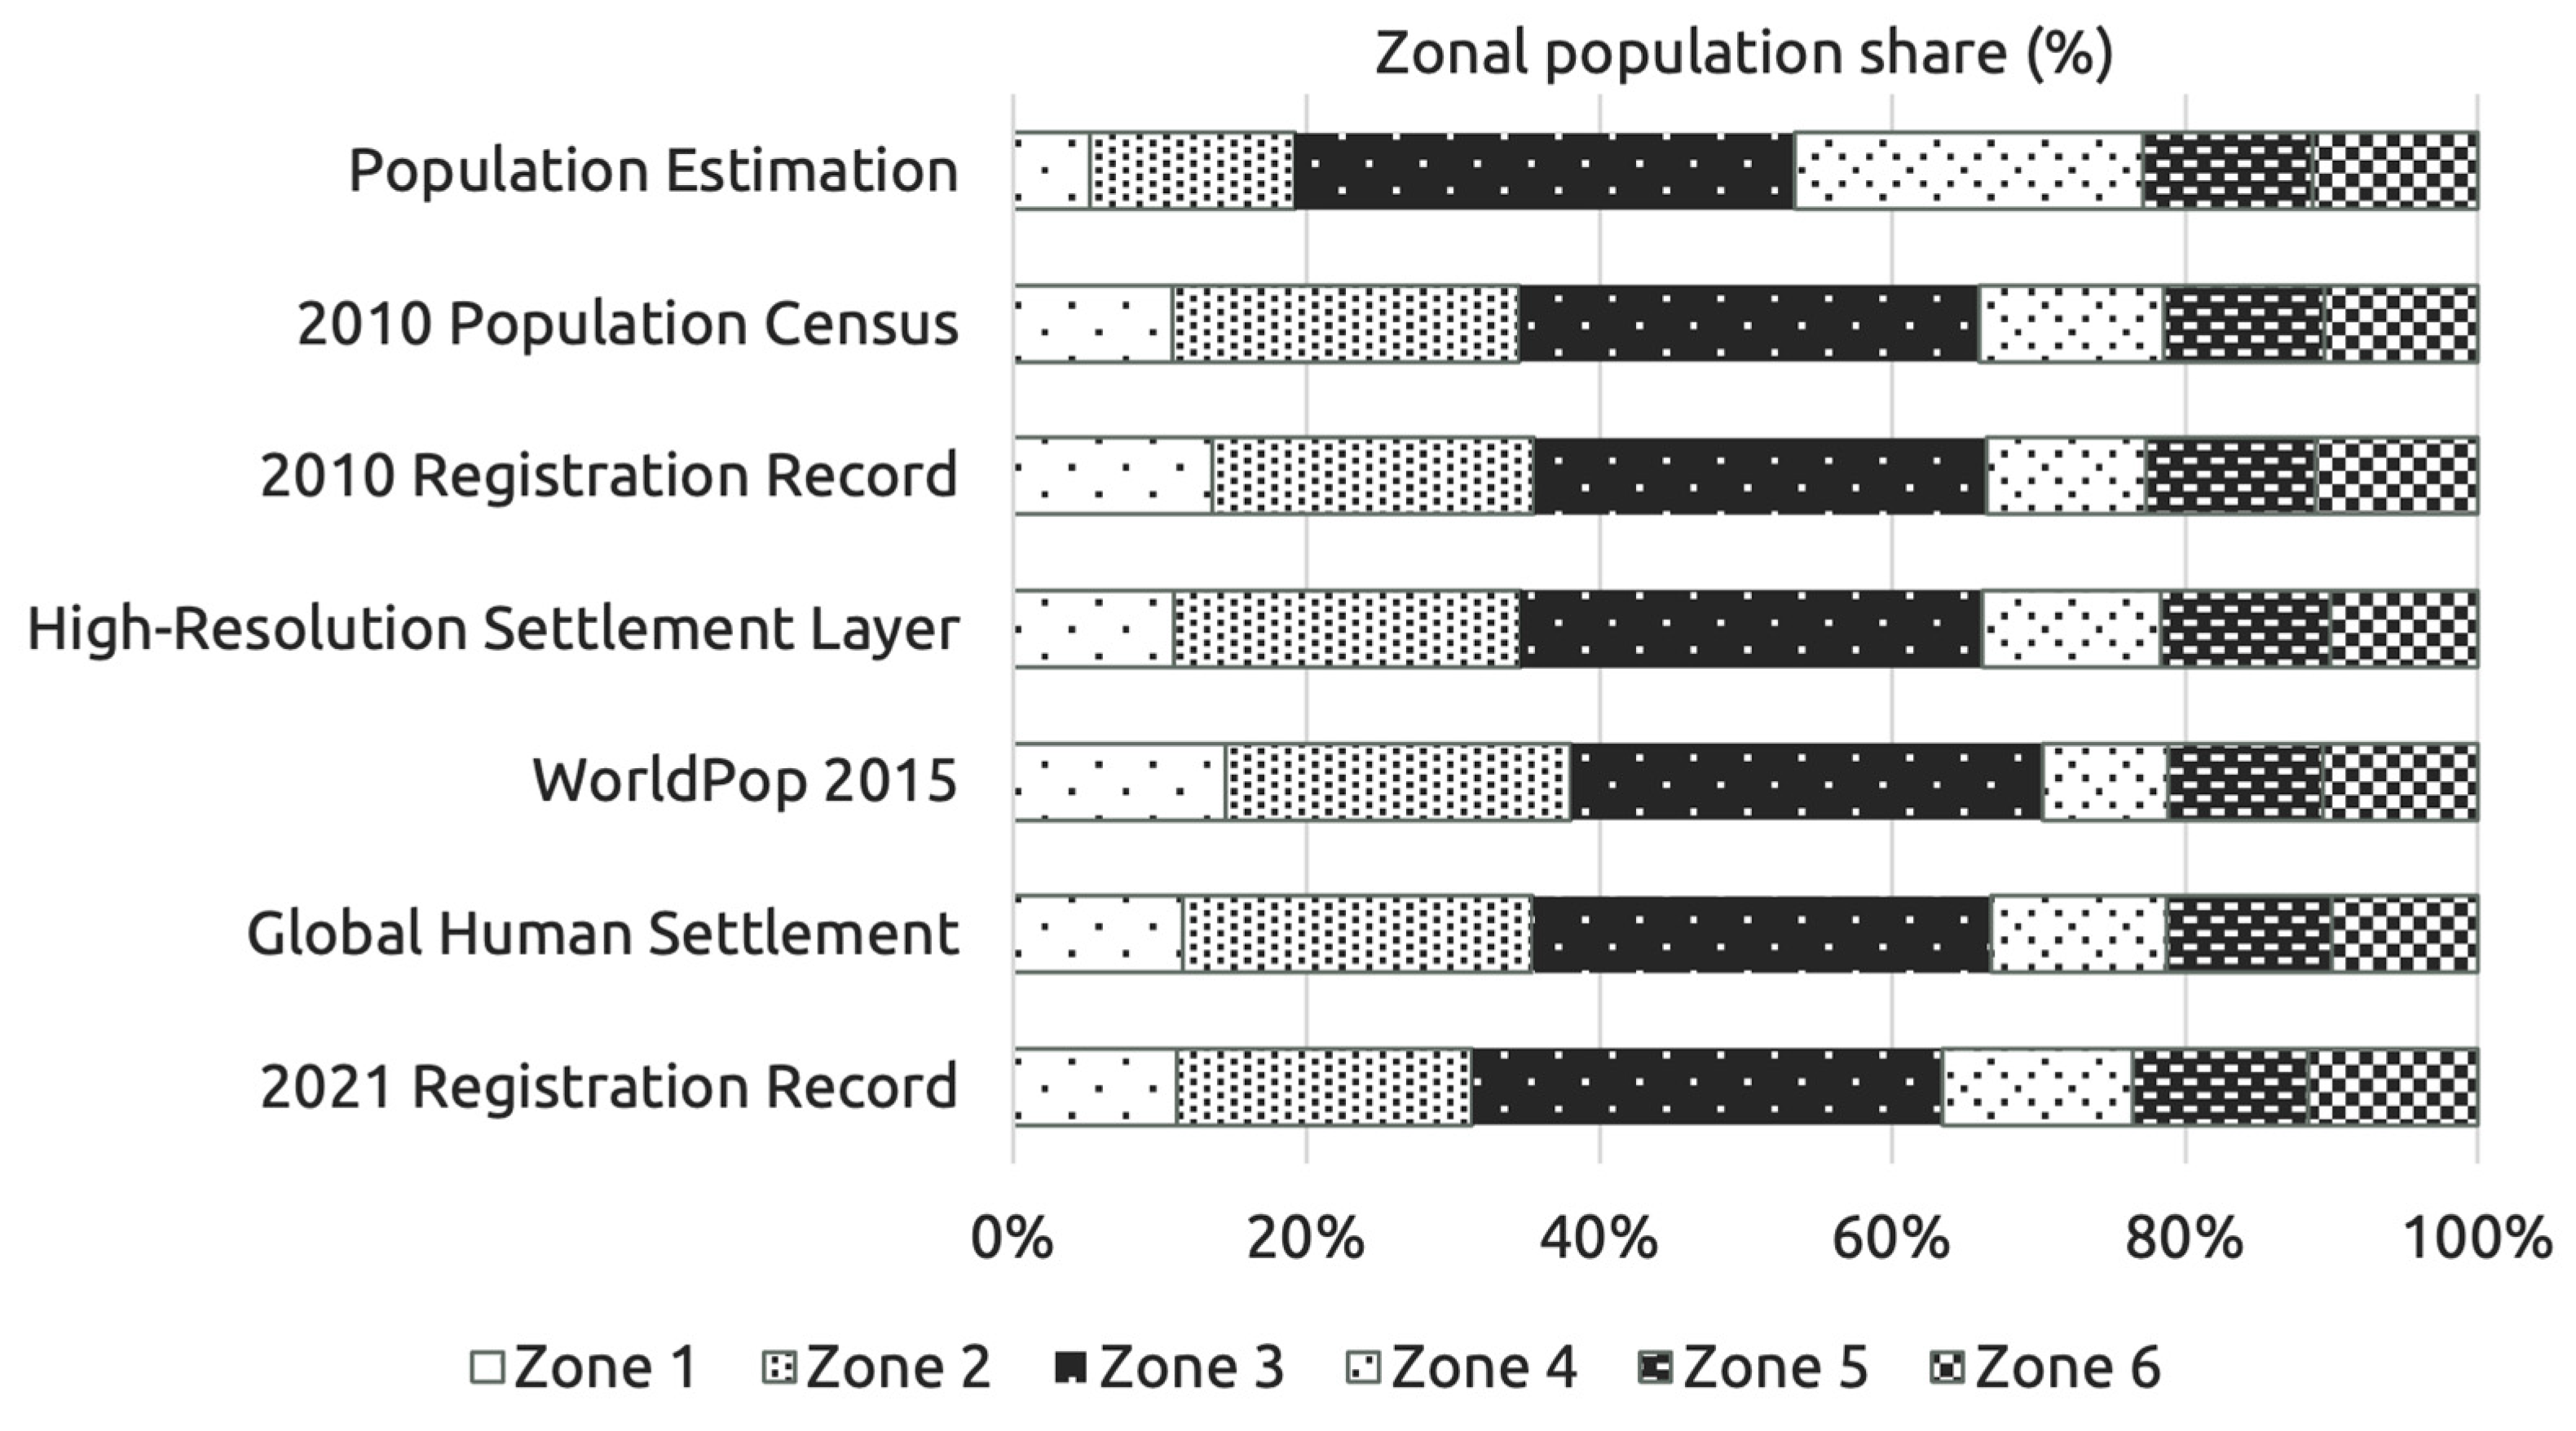

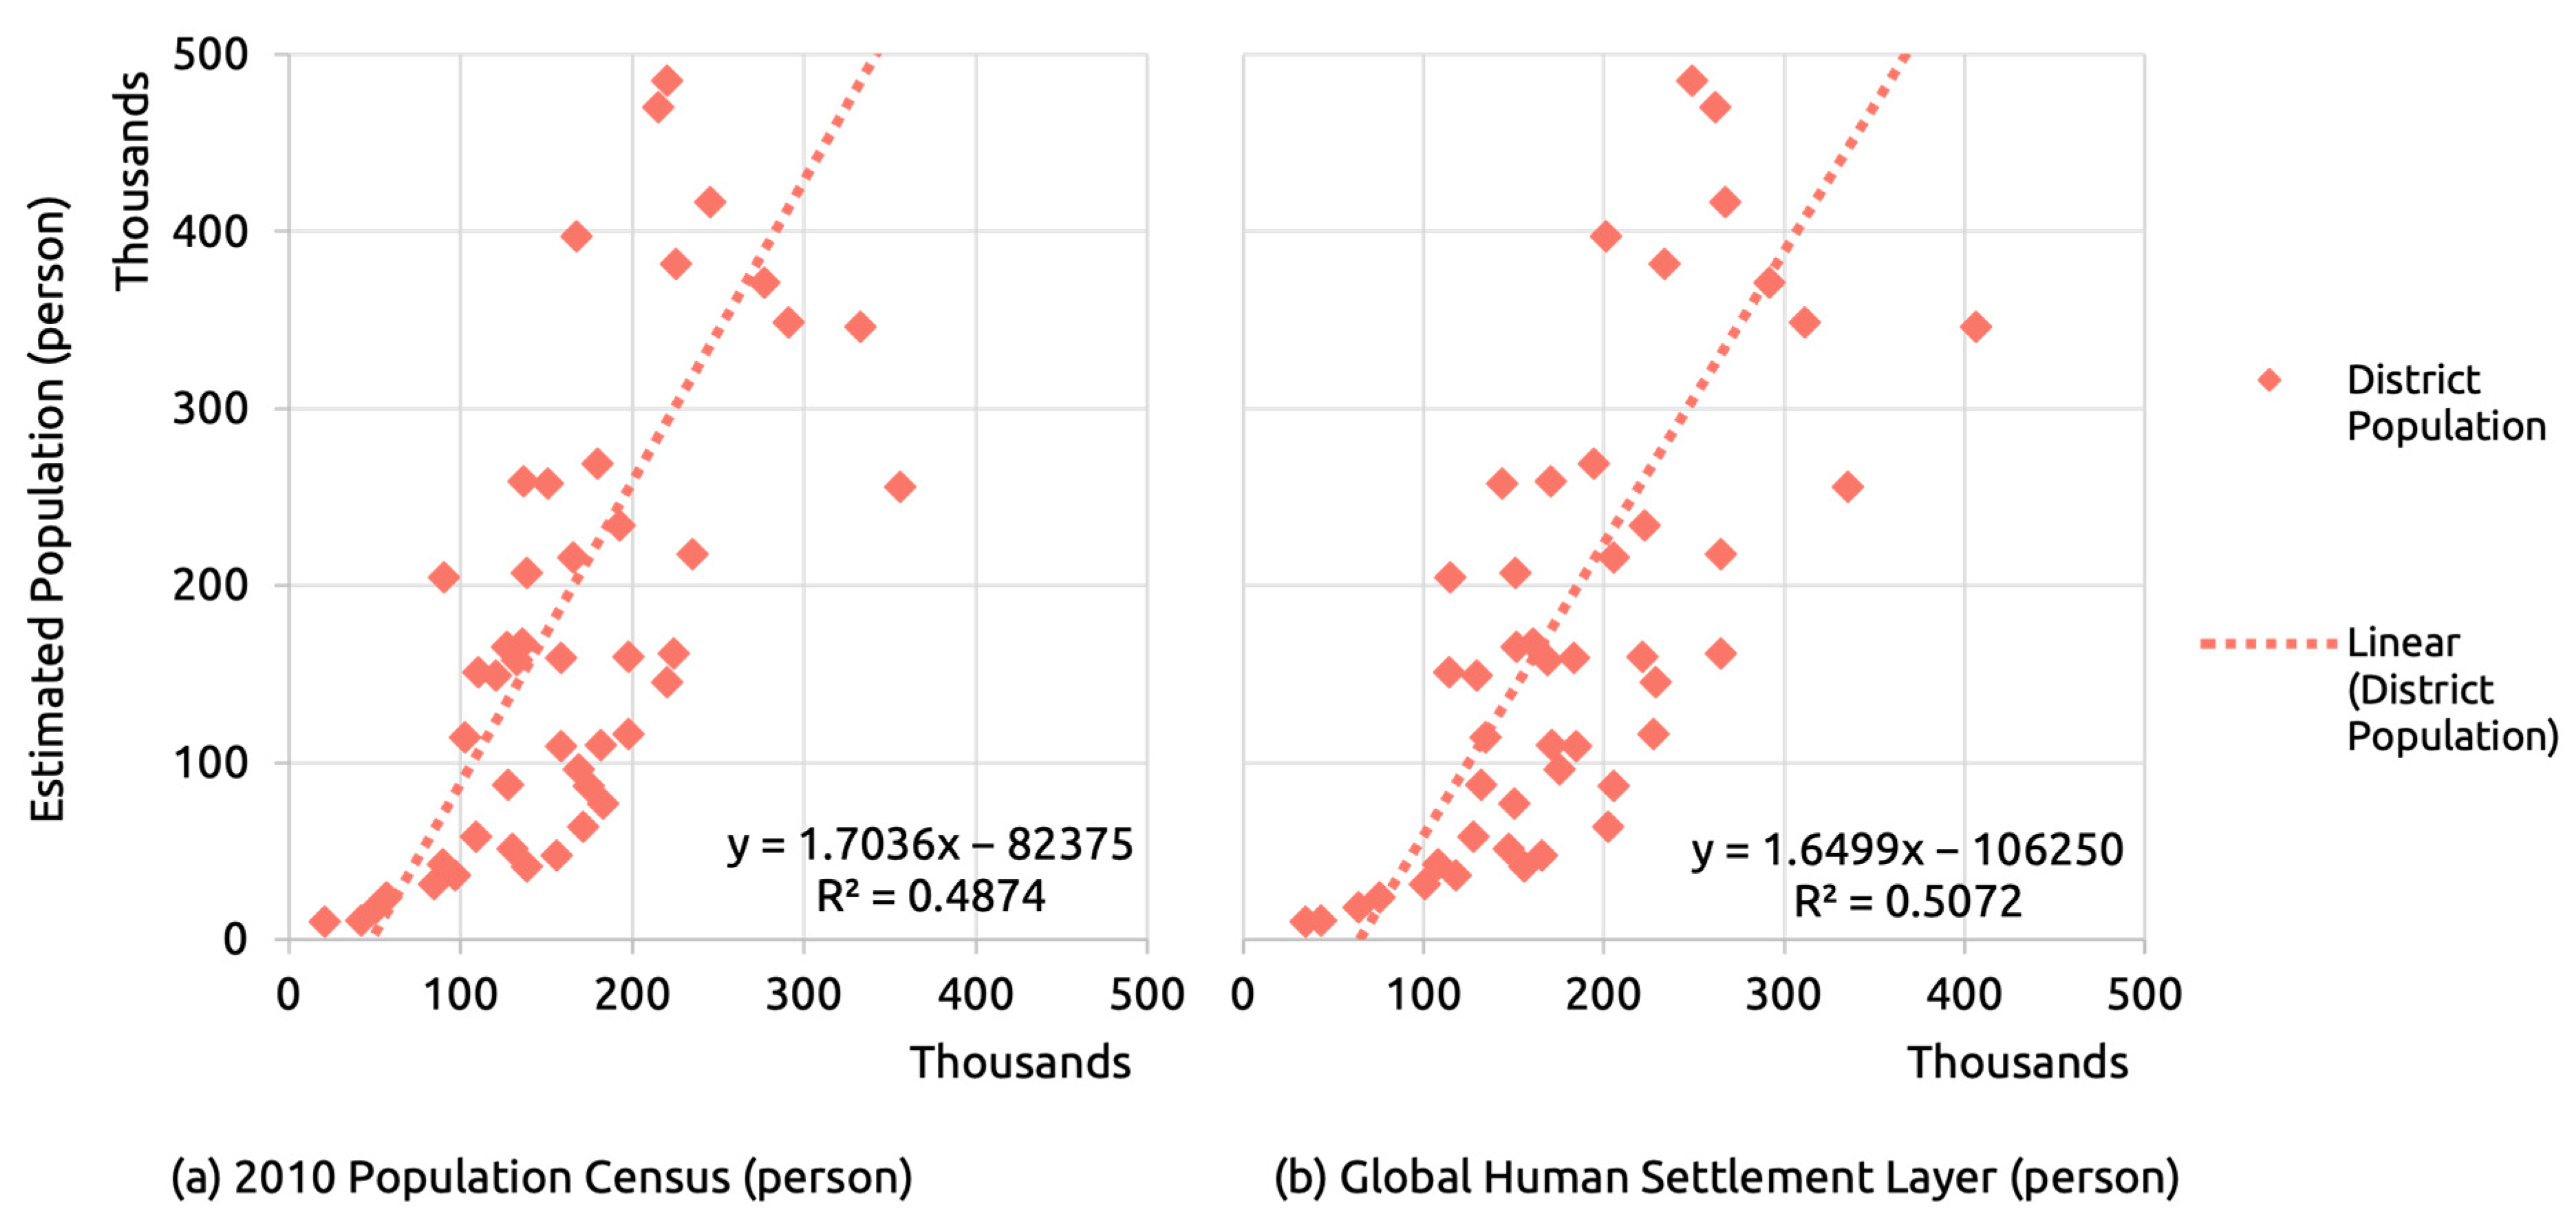
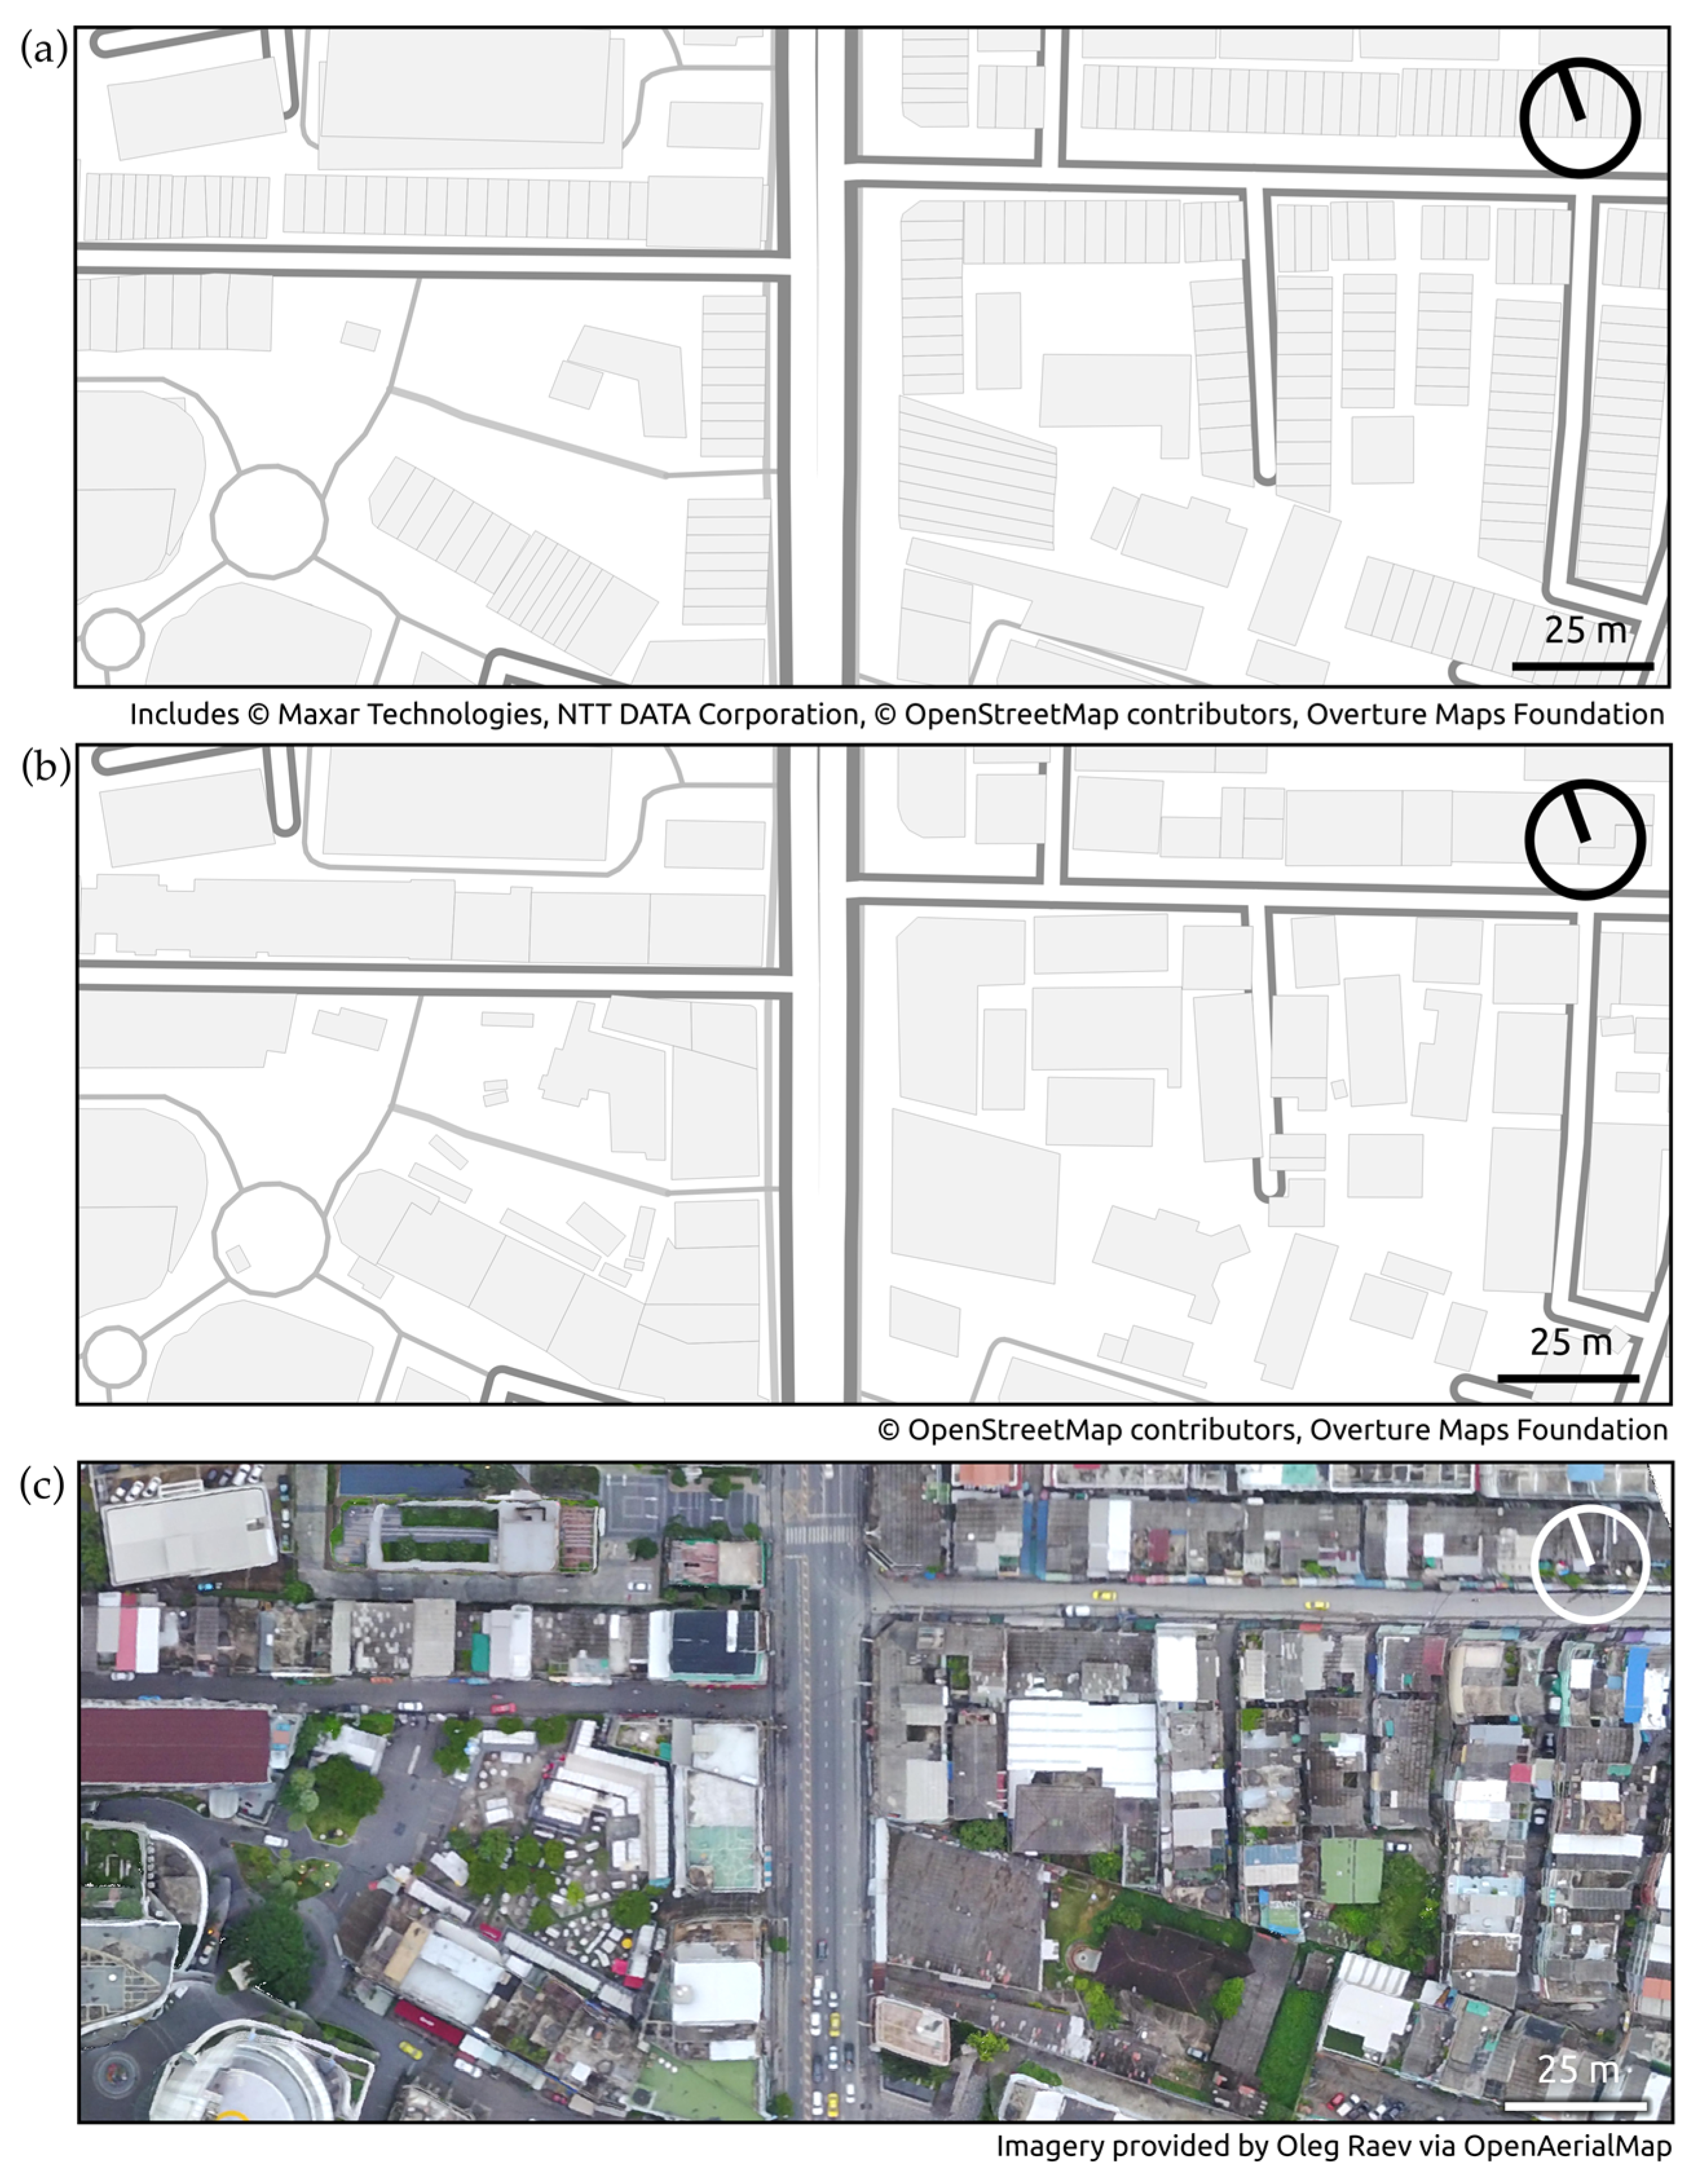
Disclaimer/Publisher’s Note: The statements, opinions and data contained in all publications are solely those of the individual author(s) and contributor(s) and not of MDPI and/or the editor(s). MDPI and/or the editor(s) disclaim responsibility for any injury to people or property resulting from any ideas, methods, instructions or products referred to in the content. |
© 2025 by the authors. Licensee MDPI, Basel, Switzerland. This article is an open access article distributed under the terms and conditions of the Creative Commons Attribution (CC BY) license (https://creativecommons.org/licenses/by/4.0/).