Communication

Microphysical Characteristics of Convective and Stratiform Precipitation Generated at Different Life Stages of Precipitating Cloud in the Pre-Summer Rainy Season in South China

1
College of Meteorology and Oceanography, National University of Defense Technology, Changsha 410073, China
2
Unit No. 95455 of Chinese People’s Liberation Army, Zunyi 563000, China
3
High Impact Weather Key Laboratory of China Meteorological Administration, Changsha 410073, China
4
Unit No. 92192 of Chinese People’s Liberation Army, Ningbo 315100, China
5
Unit No. 94595 of Chinese People’s Liberation Army, Gaomi 261500, China
*
Author to whom correspondence should be addressed.
Remote Sens. 2025, 17(7), 1250; https://doi.org/10.3390/rs17071250
Submission received: 24 December 2024 / Revised: 2 March 2025 / Accepted: 29 March 2025 / Published: 1 April 2025
(This article belongs to the Special Issue Synergetic Remote Sensing of Clouds and Precipitation II)

Abstract

:
This study uses GPM DPR and Himawari-8 cloud-top infrared data to classify the precipitating cloud (PC) into three life stages: developing, mature, and dissipating. Based on GPM DPR data from April to June 2018–2022, this research investigates the microphysical features of convective and stratiform precipitation over South China. The precipitation generated by the developing stage of the PC contains the largest proportion of convective precipitation, the largest precipitation area in the mature stage of PC, and the smallest precipitation area with the lowest convective precipitation proportion in the dissipating stage of the PC. For stratiform precipitation generated by the developing PC, the height of 0 °C level is marginally above the top height of Bright Band (BB), with both heights aligning in altitude during the mature and dissipating stages of the PC. The mass-weighted mean diameter (Dm) peaks at 1.2 mm below the BB, and near-surface Dm is positively correlated with the storm top height. For convective precipitation, raindrops with Dm of 1.9 mm and those exceeding 3.0 mm predominate. Notably, the near-surface Dm shows a positive correlation with storm top height, with the correlation coefficient for convective precipitation being greater than that for stratiform precipitation. Significantly, the average liquid and non-liquid water paths are larger in the dissipating stage as compared to the developing stage for both precipitation types. These findings suggest enhanced precipitation efficiency in South China and underscore the critical importance of stage-specific analyses in comprehending precipitating cloud microphysics.

Graphical Abstract

1. Introduction

Using precipitation microphysical features can depict the dynamic and microphysical processes of hydrometeors in the precipitation system [1,2,3]. These processes not only modulate precipitation efficiency but also fundamentally determine the overall precipitation volume [4]. Examining the vertical distribution of precipitation microphysics is essential for comprehending the macro- and microphysical properties of precipitating clouds, ultimately advancing precipitation forecasting capabilities. The microphysical processes of precipitation are affected by cloud structure [5]. Xu et al. [6] emphasized that cloud microphysical processes, by affecting the formation and transformation of ice-phase particles in clouds and releasing latent heat, modify the thermodynamic structure of cloud and precipitation systems. This, in turn, has a significant impact on precipitation microphysical processes. Similarly, Yin et al. [7] highlighted that the interaction between cloud microphysical processes and precipitation microphysical processes plays a crucial role in the occurrence of extreme precipitation events. Guilloteau and Foufou-la-Georgiou [8] found that the proportion of convective precipitation and precipitation intensity decrease continuously as the lifecycle of precipitating clouds develops. Meanwhile, they emphasized the potential of combining geostationary and polar-orbiting satellite observational data to improve the accuracy of global precipitation products. So, it is more reasonable to consider precipitation and clouds as a whole when studying the evolution of precipitation microphysical processes.
Microphysical characteristics of precipitation are different in each life stage of clouds, which will affect the intensity and range of precipitation. The life cycle of the PC is usually divided into three stages: developing, mature, and dissipating [9,10]. As the cloud top brightness temperature (CTBT) of the precipitating cloud (PC) gradually decreases and the cloud area increases, it indicates that the PC is in the developing stage, with cloud particles forming and growing. When the CTBT of the PC reaches a minimum value and remains there for a period of time, it indicates that the PC has reached the mature stage. As the CTBT of the PC gradually increases and the precipitation intensity weakens, it indicates that the cloud particles are beginning to dissipate, signaling that the PC is entering the dissipating stage [11]. Fu and Zhang [12] pioneered a method for identifying precipitating cloud life stages based on CTBT variations from Himawari-8 data, concurrently examining vertical precipitation structures through space-borne radar observations. Kumar et al. [13] subsequently applied this approach to characterize precipitation in Peru, revealing the precipitation characteristics during different stages of PC. They noted that in precipitation generated by the developing stage of PC, the area of convective precipitation is at its largest, with precipitation particles that are large and sparse. In PCs’ mature stage, the area of convective precipitation decreases slightly, while the precipitation particles remain large. During PCs’ dissipating stage, the area of convective precipitation is the smallest, and the precipitation particles are small [13]. Sun et al. [14] discovered that precipitation vertical structure characteristics have regional differences. The vertical structure of the precipitation occurring in summer precipitation over the Yangtze–Huai River Valley Region in China is similar to the ocean region in different stages but is different to that in the western United States. These studies show that the vertical microphysical structure of precipitation varies throughout the lifespan of the PC. Exploring the microphysical characteristics of precipitation generated in each life stage of PCs provides a basis for predicting the variation in precipitation.
South China is located in the East Asian monsoon area, one of the important areas of economic development and population concentration. Rainstorms occur frequently in South China, and 72% of the heavy rain occurs in the summer rainy season. Among them, the pre-summer rainy season (April–June) accounted for 45%, and the later-summer rainy season (July–September) accounted for 27% [15]. He et al. [16] conducted a comparison of the variances in stratiform precipitation between South China and the Tibetan Plateau, pointing out that the bright-band (BB) of stratiform precipitation in South China is higher and the particle radius at the bottom of the BB bottom is larger. According to the CTBT, Zhang et al. [17] divided PCs in South China into three categories: (~, 230 K), (230 K, 265 K), (265 K, ~), and found that the proportion of convective precipitation and the particle radius was the largest when it was below 230 K. PCs with CTBT arranged 230 K to 265 K mainly produced small rain with large raindrops and small particle sizes. PCs with CTBT exceeding 265 K mainly produced shallow convective precipitation, and the droplet density was small. Studies have shown that precipitating cloud characteristics and precipitation microphysical characteristics have a direct impact on the type and strength of precipitation.
Satellite-borne meteorological radar has provided a data foundation for exploring the vertical structure of precipitation. The dual-frequency precipitation radar (DPR) onboard the observatory of the Global Precipitation Measurement Mission satellite (GPM) can capture three-dimensional structure information of precipitation [18]. However, GPM is a polar-orbiting satellite and can only obtain instantaneous “Snapshot” information within precipitation. To explore the evolution of microphysical characteristics of precipitation in the life cycle of PC, CTBT data from Himawari-8 were time-matched to divide the life stages of PC. This method can obtain the evolution of precipitation microphysical characteristics in different life stages [17].
In this paper, the GPM DPR measurement and Himawari-8 infrared brightness temperature data are utilized to explore the physical properties of precipitation across the life stages of PCs during the pre-summer rainy season over South China. The structure of this paper is as follows: Section 2 presents the data and methods employed, while Section 3 outlines the primary findings. Conclusions and discussions are provided in Section 4.

2. Materials and Methods

2.1. GPM DPR

GPM DPR has been commonly utilized in precipitation research in specific areas and weather systems; its reliability and accuracy have been fully verified in previous studies [19,20,21]. GPM DPR consists of the Ku band and Ka band precipitation radar. Compared to the precipitation radar (PR) on the Tropical Rainfall Measuring Mission (TRMM), DPR adds the Ka-band based on Ku-band, which can provide more accurate microphysical information about precipitation. GPM DPR is a one-dimensional phased array system. Each scanning KuPR and KaPR has 49 sub-satellite point beams with a horizontal resolution of 5 km. DPR has a scanning width of about 245 km, whereas the detected height is from ground to 22 km and the vertical resolution is 125 m. Using the radar echo power, the radar reflectivity factor ( Z m ) can be calculated as
Z m = P r · λ 2 ( 4 π r ) 2 · G t · G r · θ 2
where P r is the received signal power, λ is the radar wavelength, r is the target distance, G t and G r are the gains of the transmitting and receiving antennas, and θ is the beam width. GPM can simultaneously receive radar signals in both Ka and Ku bands, and by combining signal power with attenuation correction, the effective radar reflectivity factor ( Z e ) can be derived. Based on the Z m obtained from the Ka and Ku bands, the dual-frequency ratio ( D F R m ) can be calculated as
DFRm = 10 log 10 ( Z m ( K u ) ) 10 log 10 ( Z m ( K a ) )
Due to the different scattering effects of electromagnetic waves on particles of varying sizes in the two bands, D F R m can reflect droplet size distribution (DSD) information. The DPR data processing algorithm uses a DSD database established from historical data and statistics, employing D F R m to estimate DSD. Through an iterative method, the optimal DSD parameters are determined. Finally, ground station data are used for validation and calibration to ensure the accuracy of DSD. Once the DSD parameters are established, the precipitation rate ( R ) can be estimated using the R-Dm relationship:
R = a ε b D m c
where D m is mass-weighted mean diameter, ε is an adjustment factor. a = 0.401, b = 4.649, c = 6.131 for stratiform precipitation, and a = 1.370, b = 4.258, c = 5.420 for convective precipitation. Additionally, the precipitation rate must also satisfy the constraints of the Z-R relationship:
R = a Z b
where Z is radar reflectivity factor, and a and b are empirical coefficients.
The GPM algorithms for distinguishing between stratiform and convective precipitation, as well as estimating storm top height (STH), are all based on the dual-frequency ratio. By setting thresholds and referencing historical data, these methods obtain the required physical quantities. This study uses GPM DPR Level 2 data from April to June 2018–2022. The physical information used in this paper mainly includes scanning time, radar reflectivity factor, the normalized scaling parameter for raindrop concentration log10(Nw), the mass-weighted mean diameter ( D m ), precipitation rate (R), liquid water path (LWP), non-liquid water path (IWP), storm top height, and precipitation type. The study region is South China (104–117°E, 21–28°N), as shown in Figure 1.
Near-surface precipitation intensity exceeding 0.5 mm/h is considered to be precipitation [22]. Precipitation occurring within the same locale at a given time constitutes a cohesive precipitation system, this study delineates contiguous precipitation pixels with a near-surface precipitation intensity exceeding 0.5 mm/h as a singular rain cell. Subsequently, the aggregate count of pixels surpassing the threshold of 50 is enumerated for further analysis. Similar identification methods have been used for many studies [17,19,23,24].

2.2. Himawari-8 AHI Data

Himawari-8 is the new generation of geostationary meteorological satellite from Japan. The spatial resolution of the advanced Himawari imager (AHI) is significantly larger than that of previous generations of geostationary satellite sensors, and it can detect electromagnetic wave spectrum information of 16 bands [25,26]. Among them, the spatial resolution of the visible and near-infrared channels is 0.5~1 km, and the spatial resolution of the infrared band is 2 km. The satellite has the characteristics of fast imaging speed (the full disk is about 10 min, and the sector area is about 2.5 min), wide observation area, and high resolution of space–time, which provides basic data for identifying the life cycle of PCs. The different channel data of AHI reflect the different attributes of the cloud. The long-wave infrared channel data with a central wavelength of 10.4 μm reflects the CTBT. Therefore, this paper uses the AHI 10.4 μm brightness temperature of the corresponding period to provide information for the division of life stages of precipitating clouds.

2.3. Identifying the Life Stage of Precipitating Cloud

Fiolleau and Roca [9] proposed a model to divide the cloud life stages based on cloud-top infrared brightness temperature. The minimum CTBT continues to decline in the developing stage, remains stable in the mature stage, and continues rising in the dissipating stage. According to the above theory, the life stages of PCs recognized by GPM and Himawari-8 are as follows: The occurrence time of the PC is denoted as t. The variation curve of average CTBT is fitted over nine time steps from t − 4 to t + 4, and the slope k of the curve at time t is calculated as follows:
(a)
When k < −0.3, the PC is considered to be in the developing stage.
(b)
When −0.2 < k < 0.2, the PC is considered to be in the mature stage.
(c)
When k > 0.3, the PC is considered to be in the dissipating stage.
Finally, manual verification is conducted to ensure the accuracy of the classification. Fu and Zhang [12] adopted a similar method to analyze the precipitation characteristics in Eastern China, concluding that the proportion of convective precipitation was maximum in the developing stage. The particle radius was the largest, but the distribution was sparse, while the dissipating stage had the largest precipitation area. It is essential to highlight that in the delineation of the life stages of the PCs, we must circumvent ambiguous temporal intervals between adjacent stages. To this end, the present study exclusively selected samples that exhibited the most pronounced alterations in CTBT during each stage for analysis.

2.4. Probability Density Function and Vertical Frequency Distribution

Probability density function (PDF) is a function used to describe the probability distribution of continuous random variables. It calculates the frequency of a variable within specified bins as a percentage relative to the total samples of that variable. The x-axis represents the values, while the y-axis represents the percentage. In this study, this method is applied to the analysis of radar reflectivity factor, Dm, log10(Nw), STH, LWP, and IWP.
Vertical frequency distribution is employed as a quantitative method to characterize the vertical variability of microphysical parameters. It calculates the frequency of occurrence of a certain variable within specified bins at various heights, expressed as a percentage of the total number of samples across all height levels. The x-axis represents the values, the y-axis represents the height, and the fill color indicates the percentage. In this study, this method is applied to the analysis of radar reflectivity factor, Dm, log10(Nw).
For all analyses in this study, the bin widths are specified as follows: 1 dBZ for radar reflectivity factor, 0.1 mm for Dm, 1 mm−1·m−3 for log10(Nw), 1 km for STH, 100 g·m−2 for both LWP and IWP, and 125 m for height.

3. Results

3.1. Particle Radius Structure and Specific Precipitation Microphysical Properties During Stages

Employing the methodology outlined in Section 2.3, we comprehensively analyzed 208 rain cells generated by PCs during the pre-summer rainy season (April–June) from 2018 to 2022. Table 1 encapsulates the pivotal parameters characterizing rain cells across different PC life stages. The number of rain cells in the developing stage is the largest, which may be attributed to the longest duration of PCs in the stage. The number of rain cells in the dissipating stage is the least. The proportion of convective precipitation in the PC’s developing stage is the maximum, and the precipitation area is the largest in the PC’s mature stage, indicating that stratiform precipitation rapidly extends with the growth of the PC. When PC enters the dissipating stage, convective precipitation gradually diminishes and the cloud area decreases.
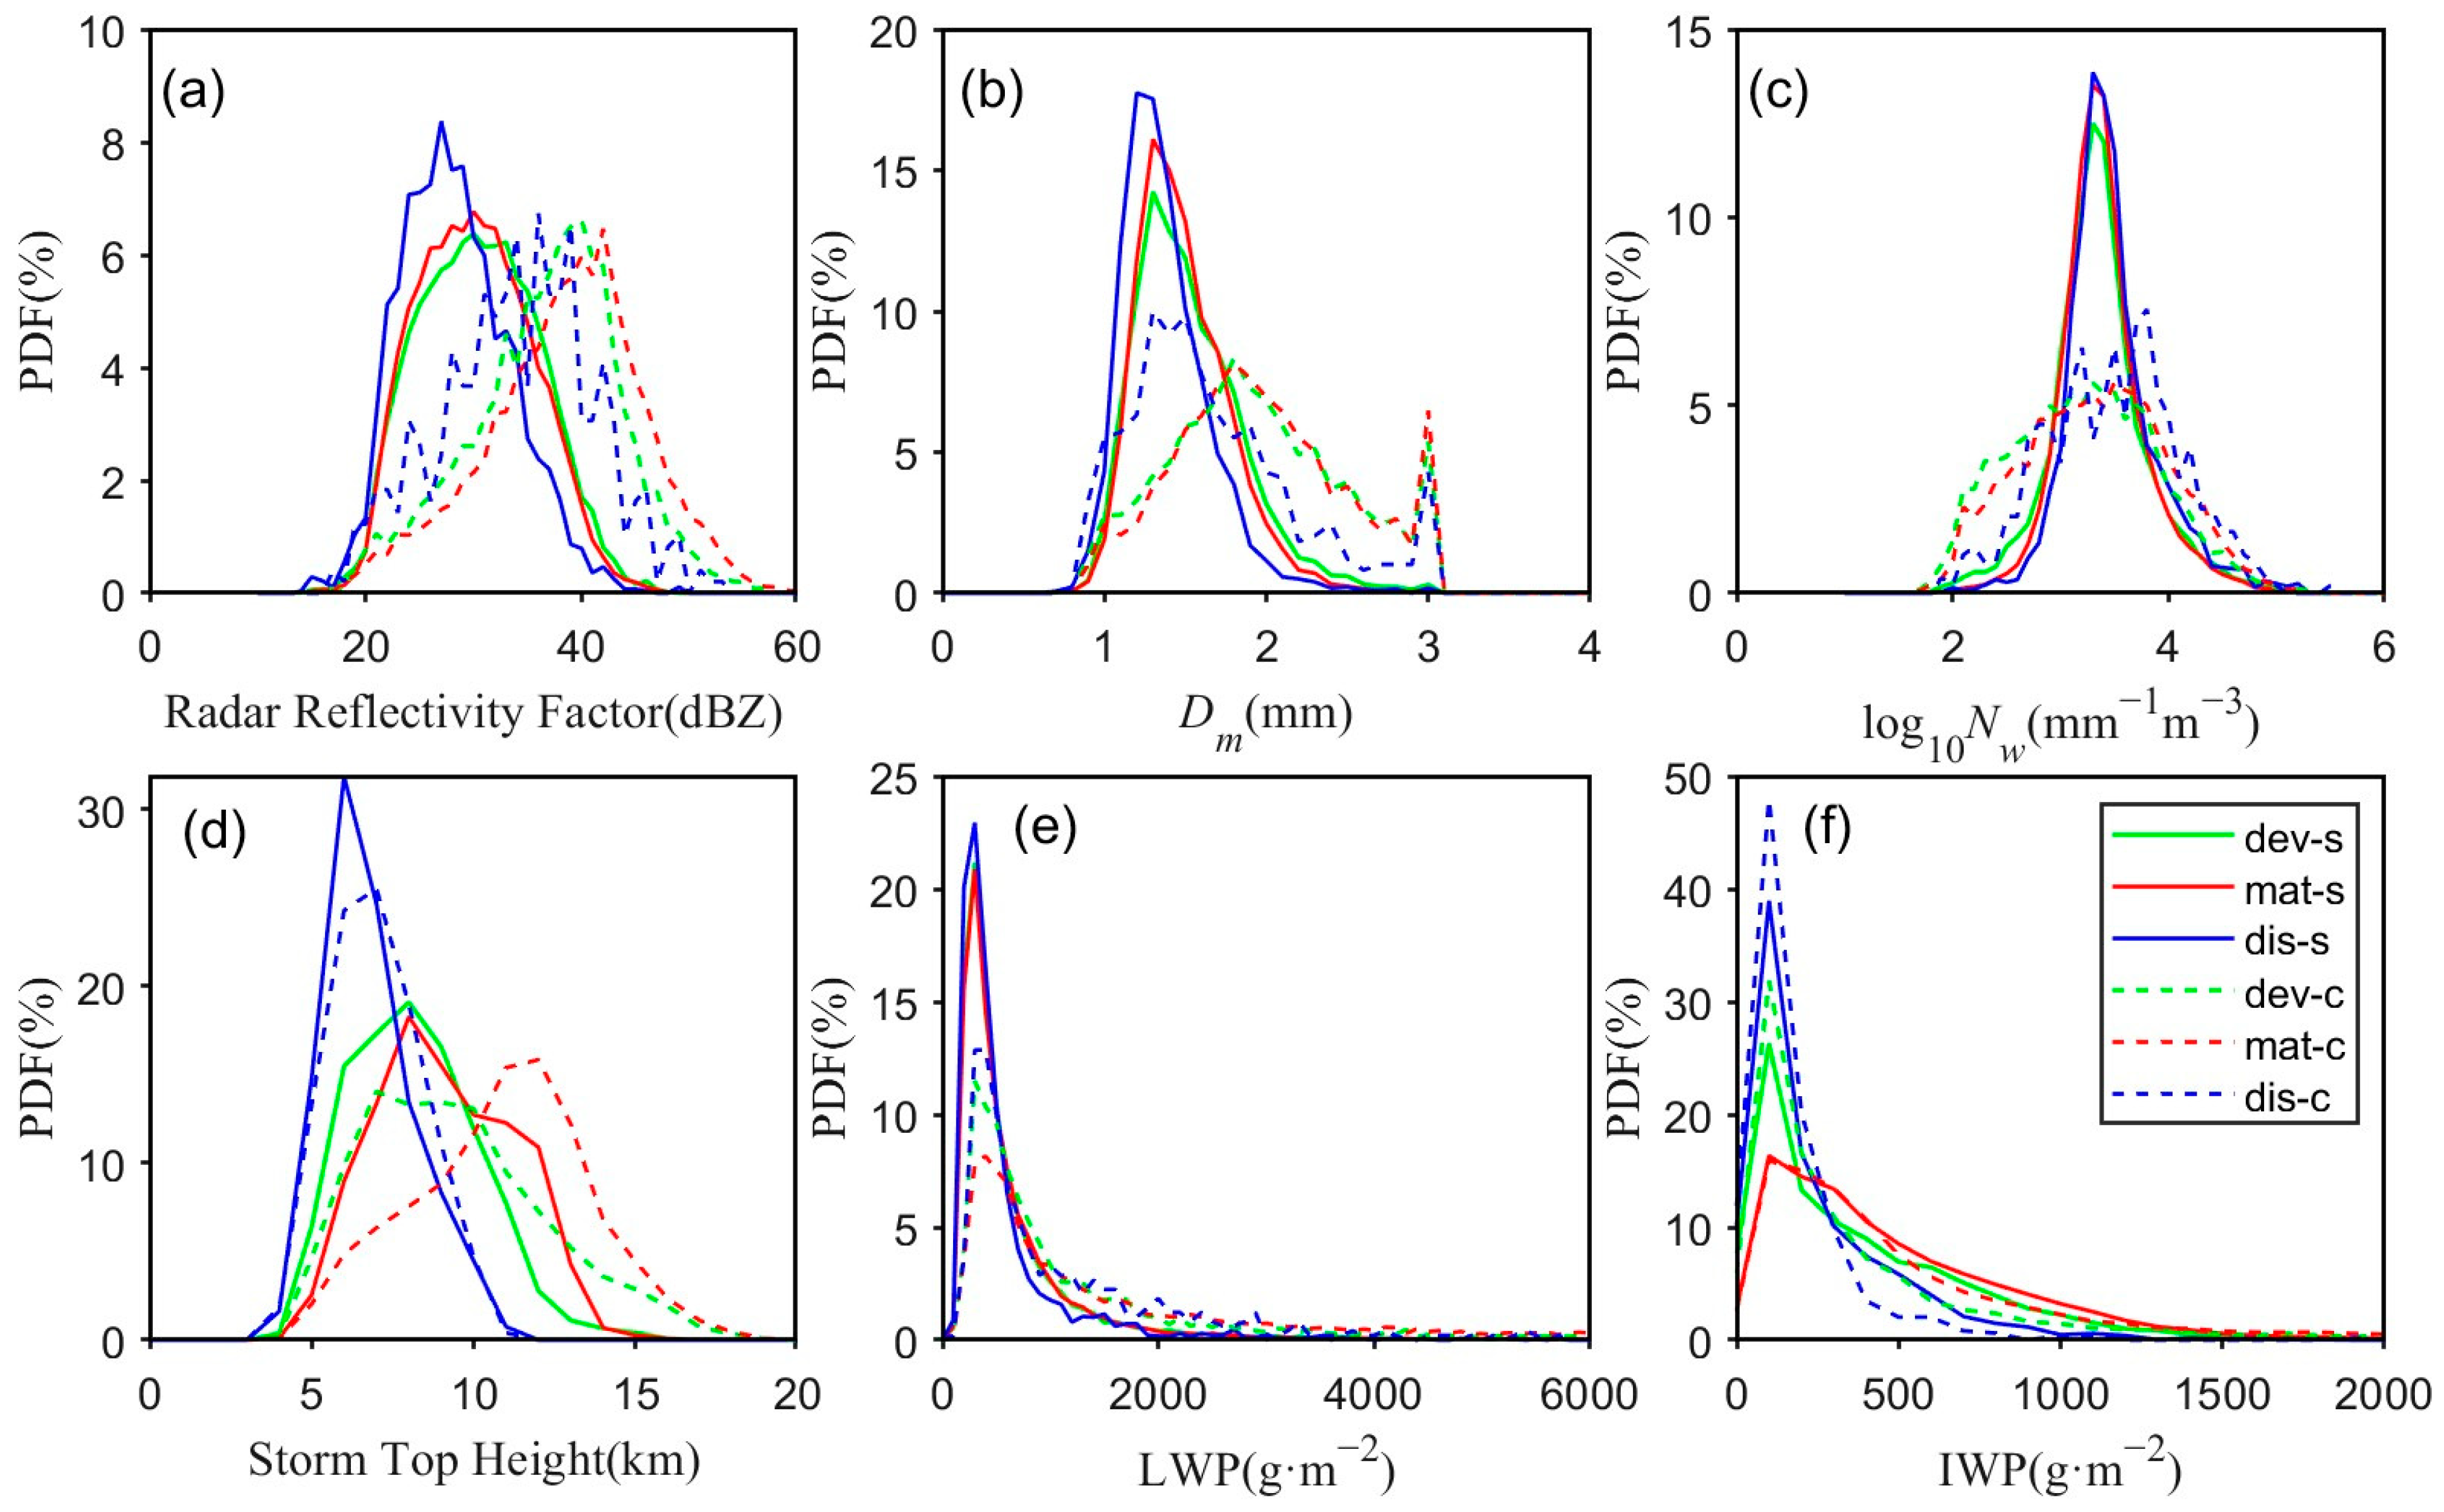
Figure 2 shows the PDF of various precipitation parameters during the pre-summer rainy season in South China. The radar reflectivity factor for stratiform precipitation is lower than that for convective precipitation, with the reflectivity peak during PCs’ dissipating stage of stratiform precipitation reaching 28 dBZ, which is lower than in the other two stages. (30 dBZ). Differences in convective precipitation are not obvious in three stages (Figure 2a). Additionally, to the right of the convective precipitation probability peak, the order of the PDF is as follows: mature stage, developing stage, and dissipating stage, which indicates that the mature stage has a higher proportion of larger radar reflectivity values. On the left side of the probability peak, the pattern is reversed. Figure 2b,c show the PDF of the DSD, including the normalized scaling parameter for raindrop concentration log10(Nw) and the mass-weighted mean diameter (Dm). The PDFs for the three stages are almost the same, with significant differences only between convective and stratiform precipitation. This suggests that raindrop density is not the primary reason for the differences between stages. The distribution of DSD for stratiform precipitation exhibits a higher concentration compared to that of convective precipitation. Stratiform precipitation often comes from the aggregation of uniformly sized droplets rather than larger raindrops or cloud droplets. In South China, the PDF of Dm for convective precipitation shows two peaks: one is 1.9 mm and the other is 3.0 mm. Due to the parameter settings of the DPR algorithm, the Dm larger than 3.0 mm is only displayed as 3.0 mm. Thus, the peak at 3.0 mm indicates that there is a certain proportion of larger precipitation particles with Dm larger than or equal to 3.0 mm. This characteristic is not observed in other regions analyzed using GPM DPR (V07) for particle size distribution, where most areas exhibit only a single peak below 3.0 mm [14,19,21]. This may be related to the distinct characteristics of different types of rainstorms in the South China region. Characteristics of the STH in the developing and mature stages of stratiform precipitation are similar, with peaks both at 8 km and reaching up to over 15 km. The peak of STH is at 6 km in the dissipating stage, with the highest not exceeding 12 km. The STH of convective precipitation also shows significant differences in different life stages of PC. The peak of STH in the mature stage is about 12 km, while the peak of the other two stages appears at 7–9 km. The top of STH in the dissipating stage does not exceed 13 km, while in the mature and developing stages, it can reach up to 20 km (Figure 2d). Physical processes in rain cells such as air entrainment, water vapor transport, and raindrop fall not only vary STH but also affect the LWP and IWP. Figure 2e,f present the PDF of LWP and IWP in convective and stratiform precipitation in different stages. The distribution of IWP is similar, but the LWP for convective precipitation is greater than that for stratiform precipitation. In both types of precipitation, LWP and IWP are larger during, suggesting a significant influx of water vapor as the PC transitions from the developing to the mature stage. In the dissipating stage, both LWP and IWP show a marked decrease, indicating a notable precipitation efficiency (Table 1).

3.2. Vertical Distribution of Radar Reflectivity and Particle Spectrum

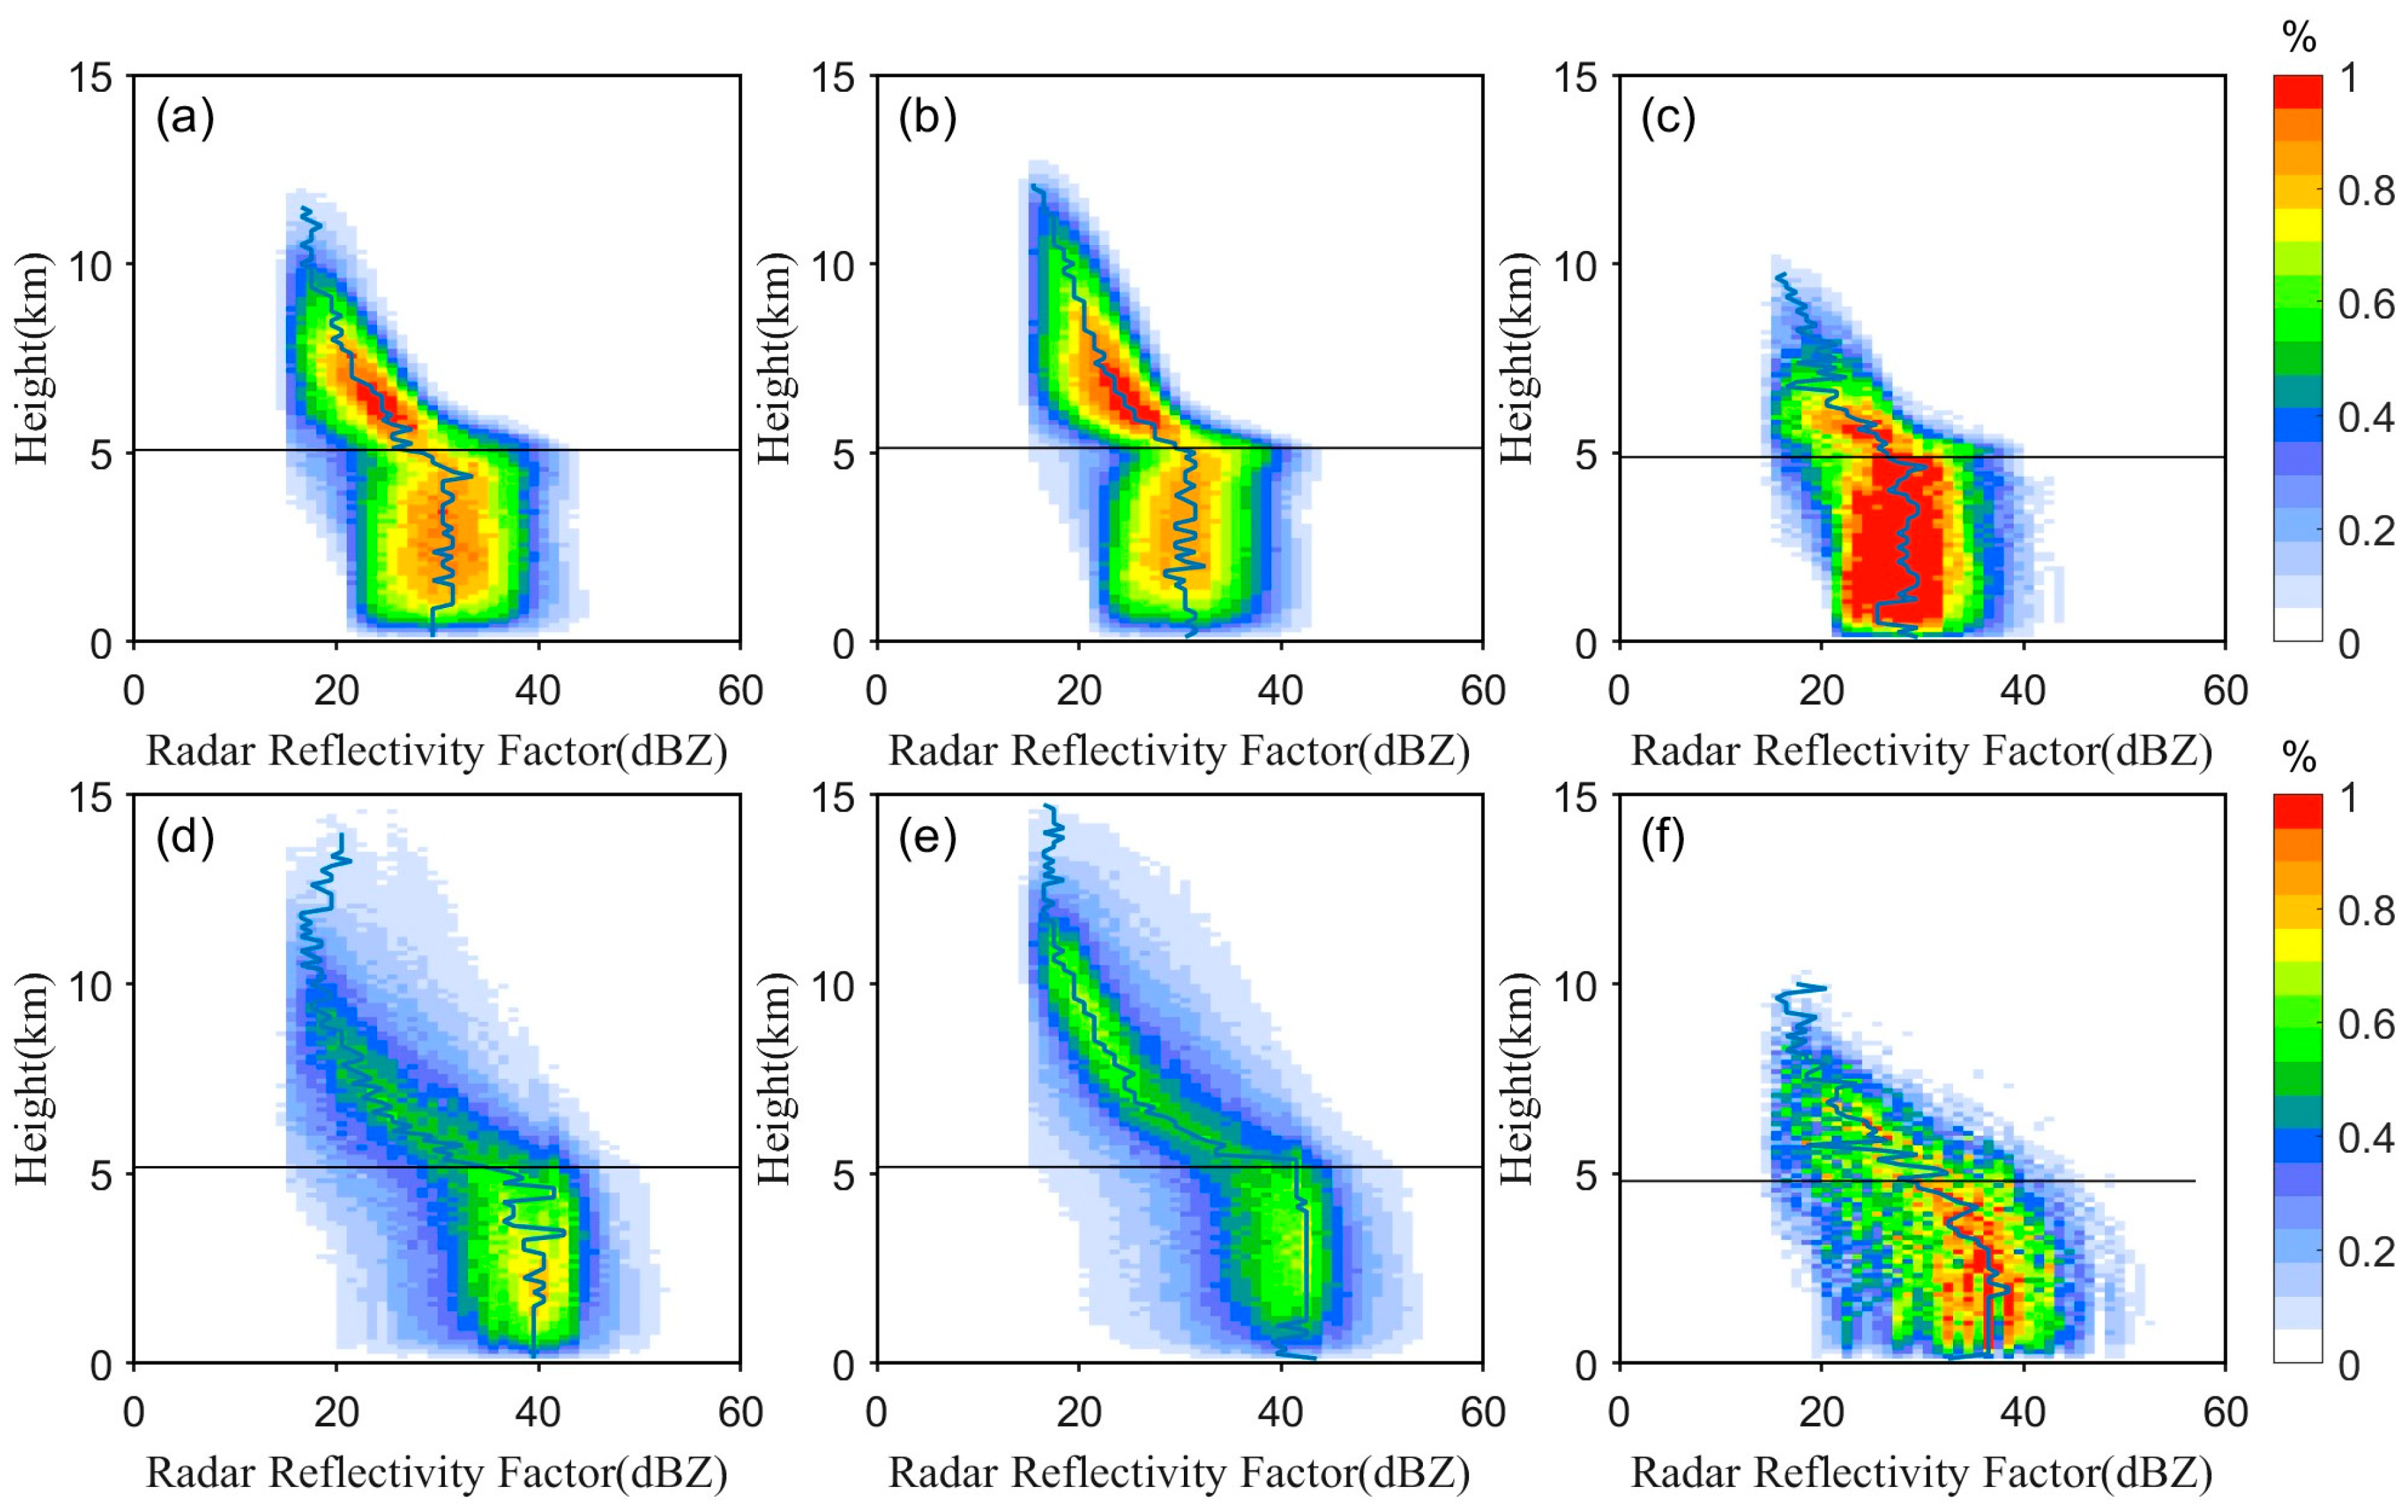
Vertical distribution of radar reflectivity factor can reflect precipitation structure. Stratiform precipitation (Figure 3a–c) exhibits a distinct BB (the location where the maximum frequency contour exhibits a sudden change) in its vertical structure. During the developing stage, the BB top marginally resided below the 0 °C level, whereas in mature and dissipating stages, it substantially coincided with the 0 °C level. Above the BB, the reflectivity increases with height, while remaining relatively constant or slightly decreasing with height below the BB. This is because the precipitation particles in stratiform clouds originate in the upper layer. As they fall from high to low levels, the ice crystals melt, causing the precipitation particles to grow and forming BB near the 0 °C layer. In the stratiform precipitation generated in PC’s mature stage, the melting process is more perfect, resulting in the heights of the BB and 0 °C layer being more consistent. The radar reflectivity center of stratiform precipitation is situated between 6–8 km in the developing and mature stages, subsequently descending below 5 km during the dissipating stage. Convective precipitation reflectivity profiles demonstrated pronounced variability. In the developing stage, the radar reflectivity center resided at 2–4 km (Figure 3d) with a maximum of 39 dBZ. Above 5 km, the higher the altitude, the smaller the radar reflectivity, which indicates that the precipitation particles of convective precipitation are generated in the lower levels, then particles aggregate and collide in strong updrafts. The radar reflectivity center is 42 dBZ below 5 km for convective precipitation in the mature stage (Figure 3e), larger than the developing stage (39 dBZ), but the proportion decreases and a new radar reflectivity center forms at 8–10 km. The radar reflectivity center in the dissipating stage is below 5 km (Figure 3f), with weakening of updraft, and the top of radar reflectivity is significantly lower than the other two stages.
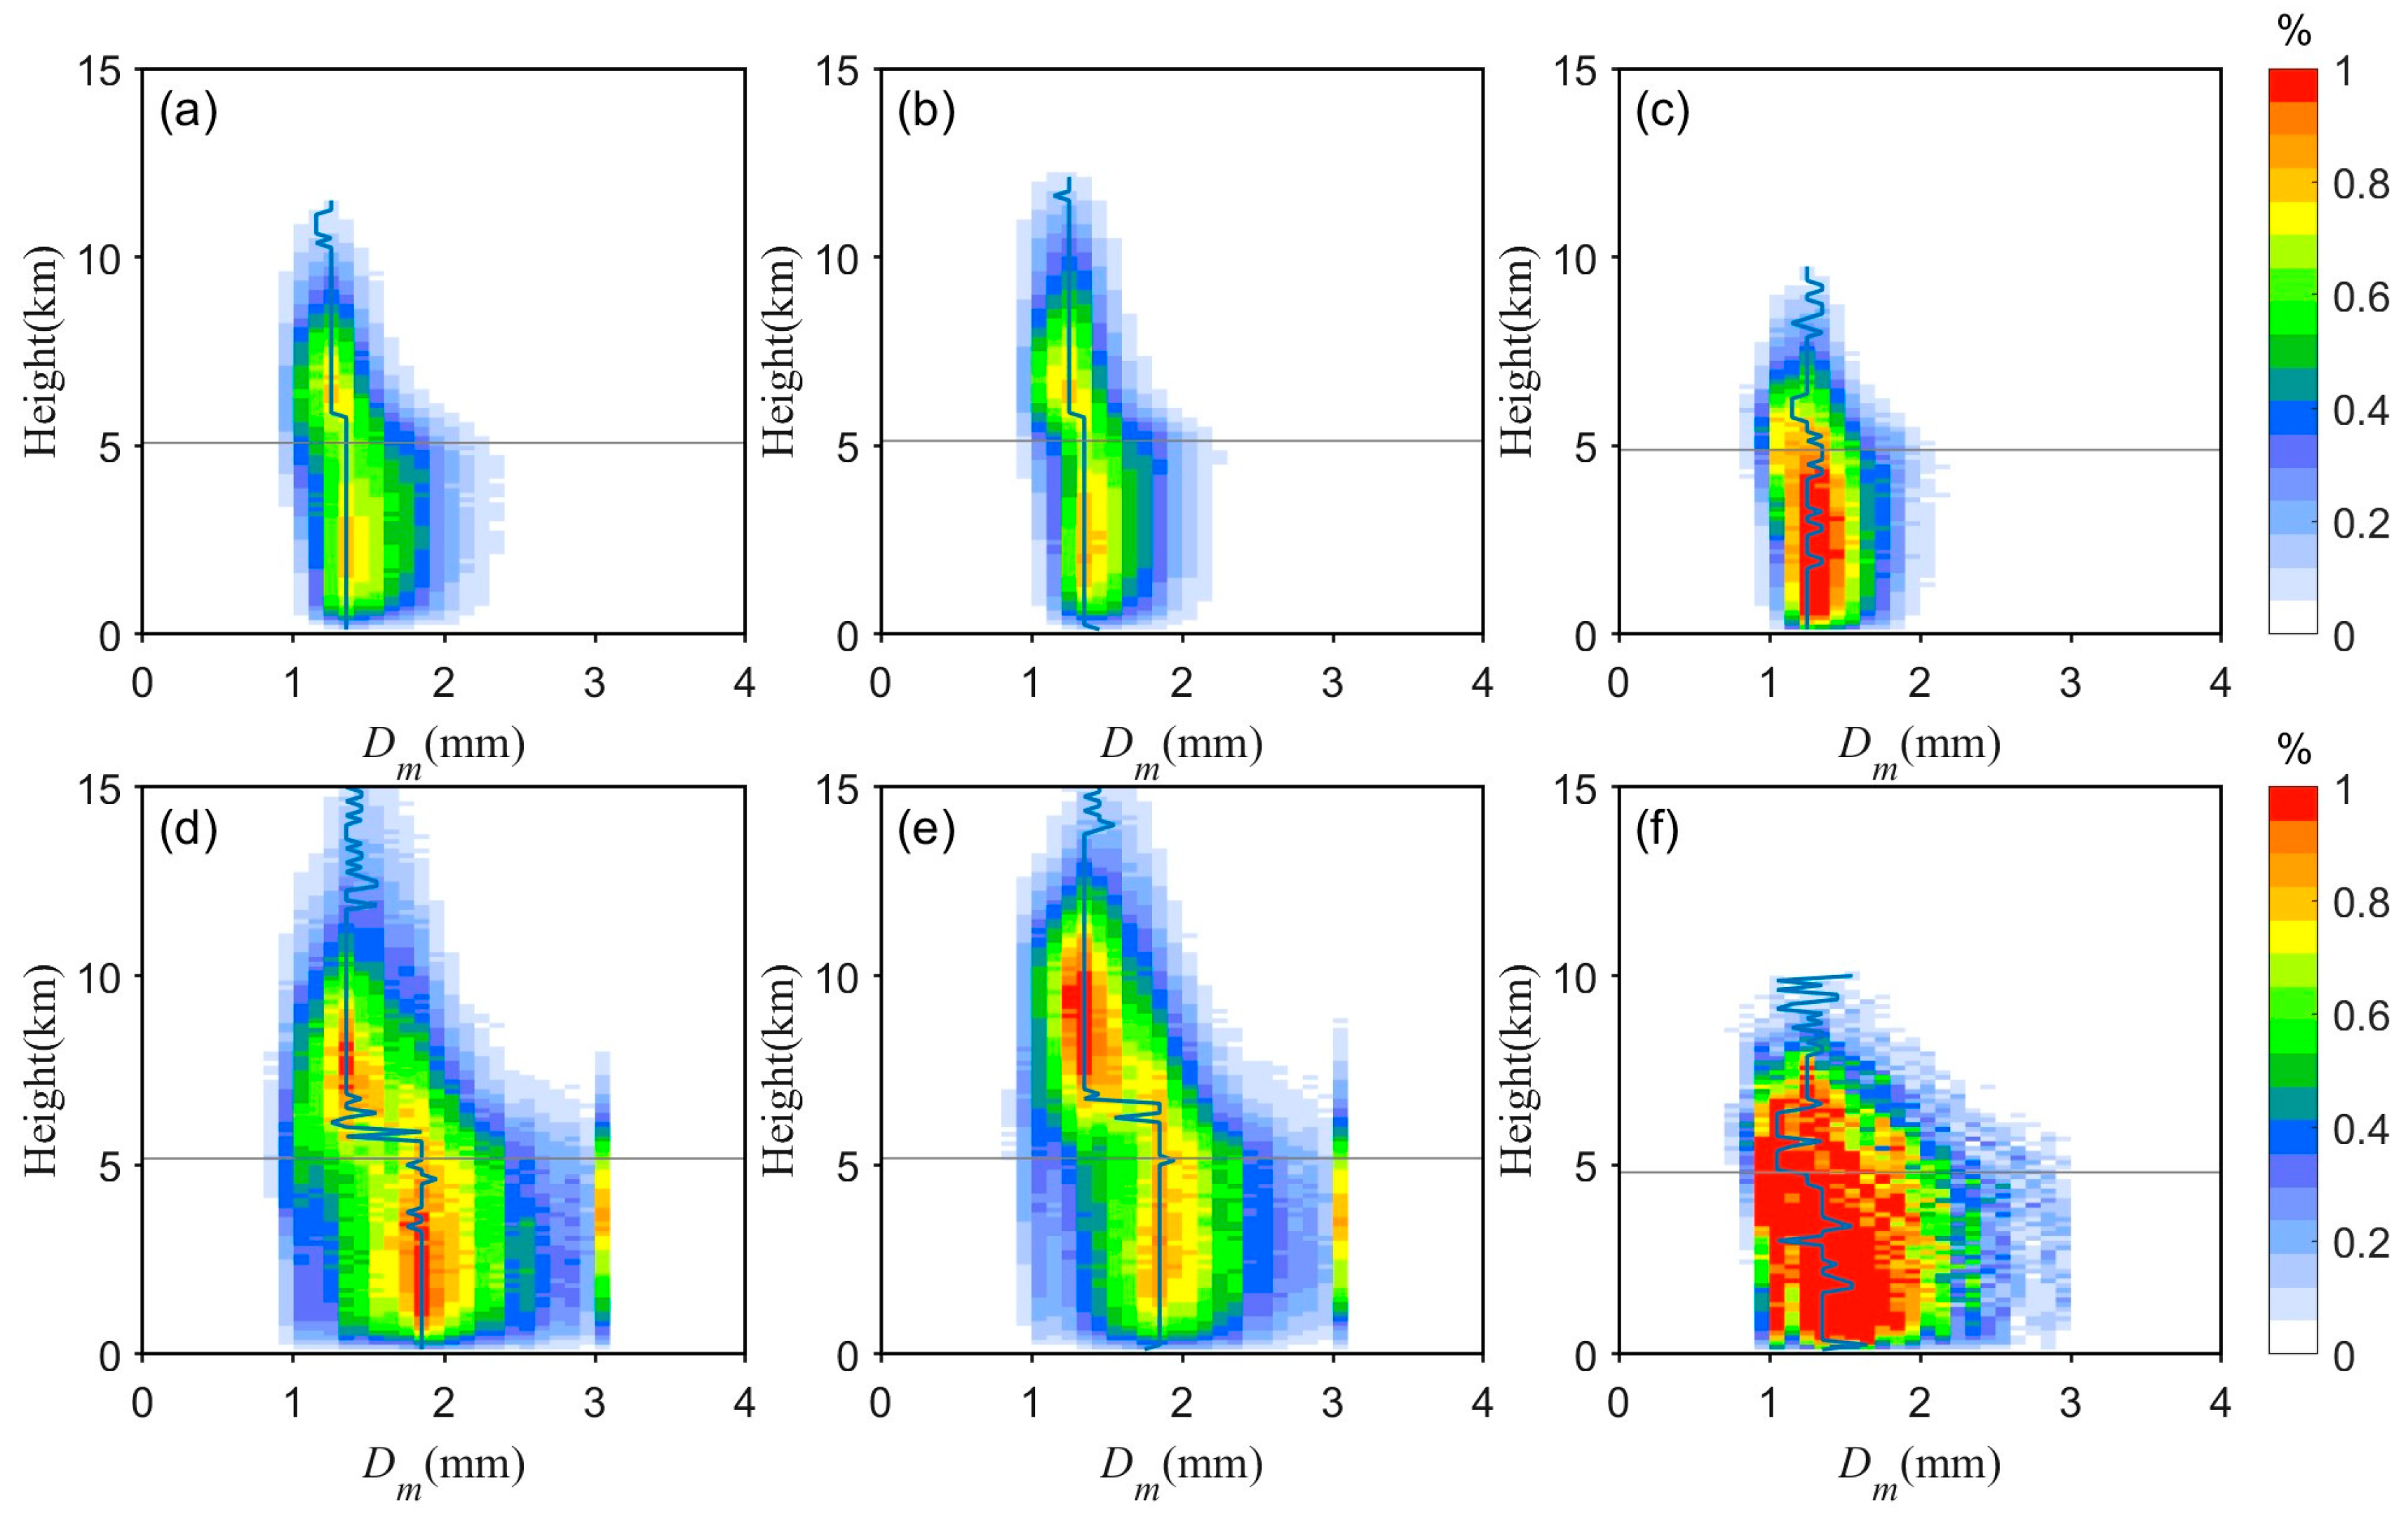
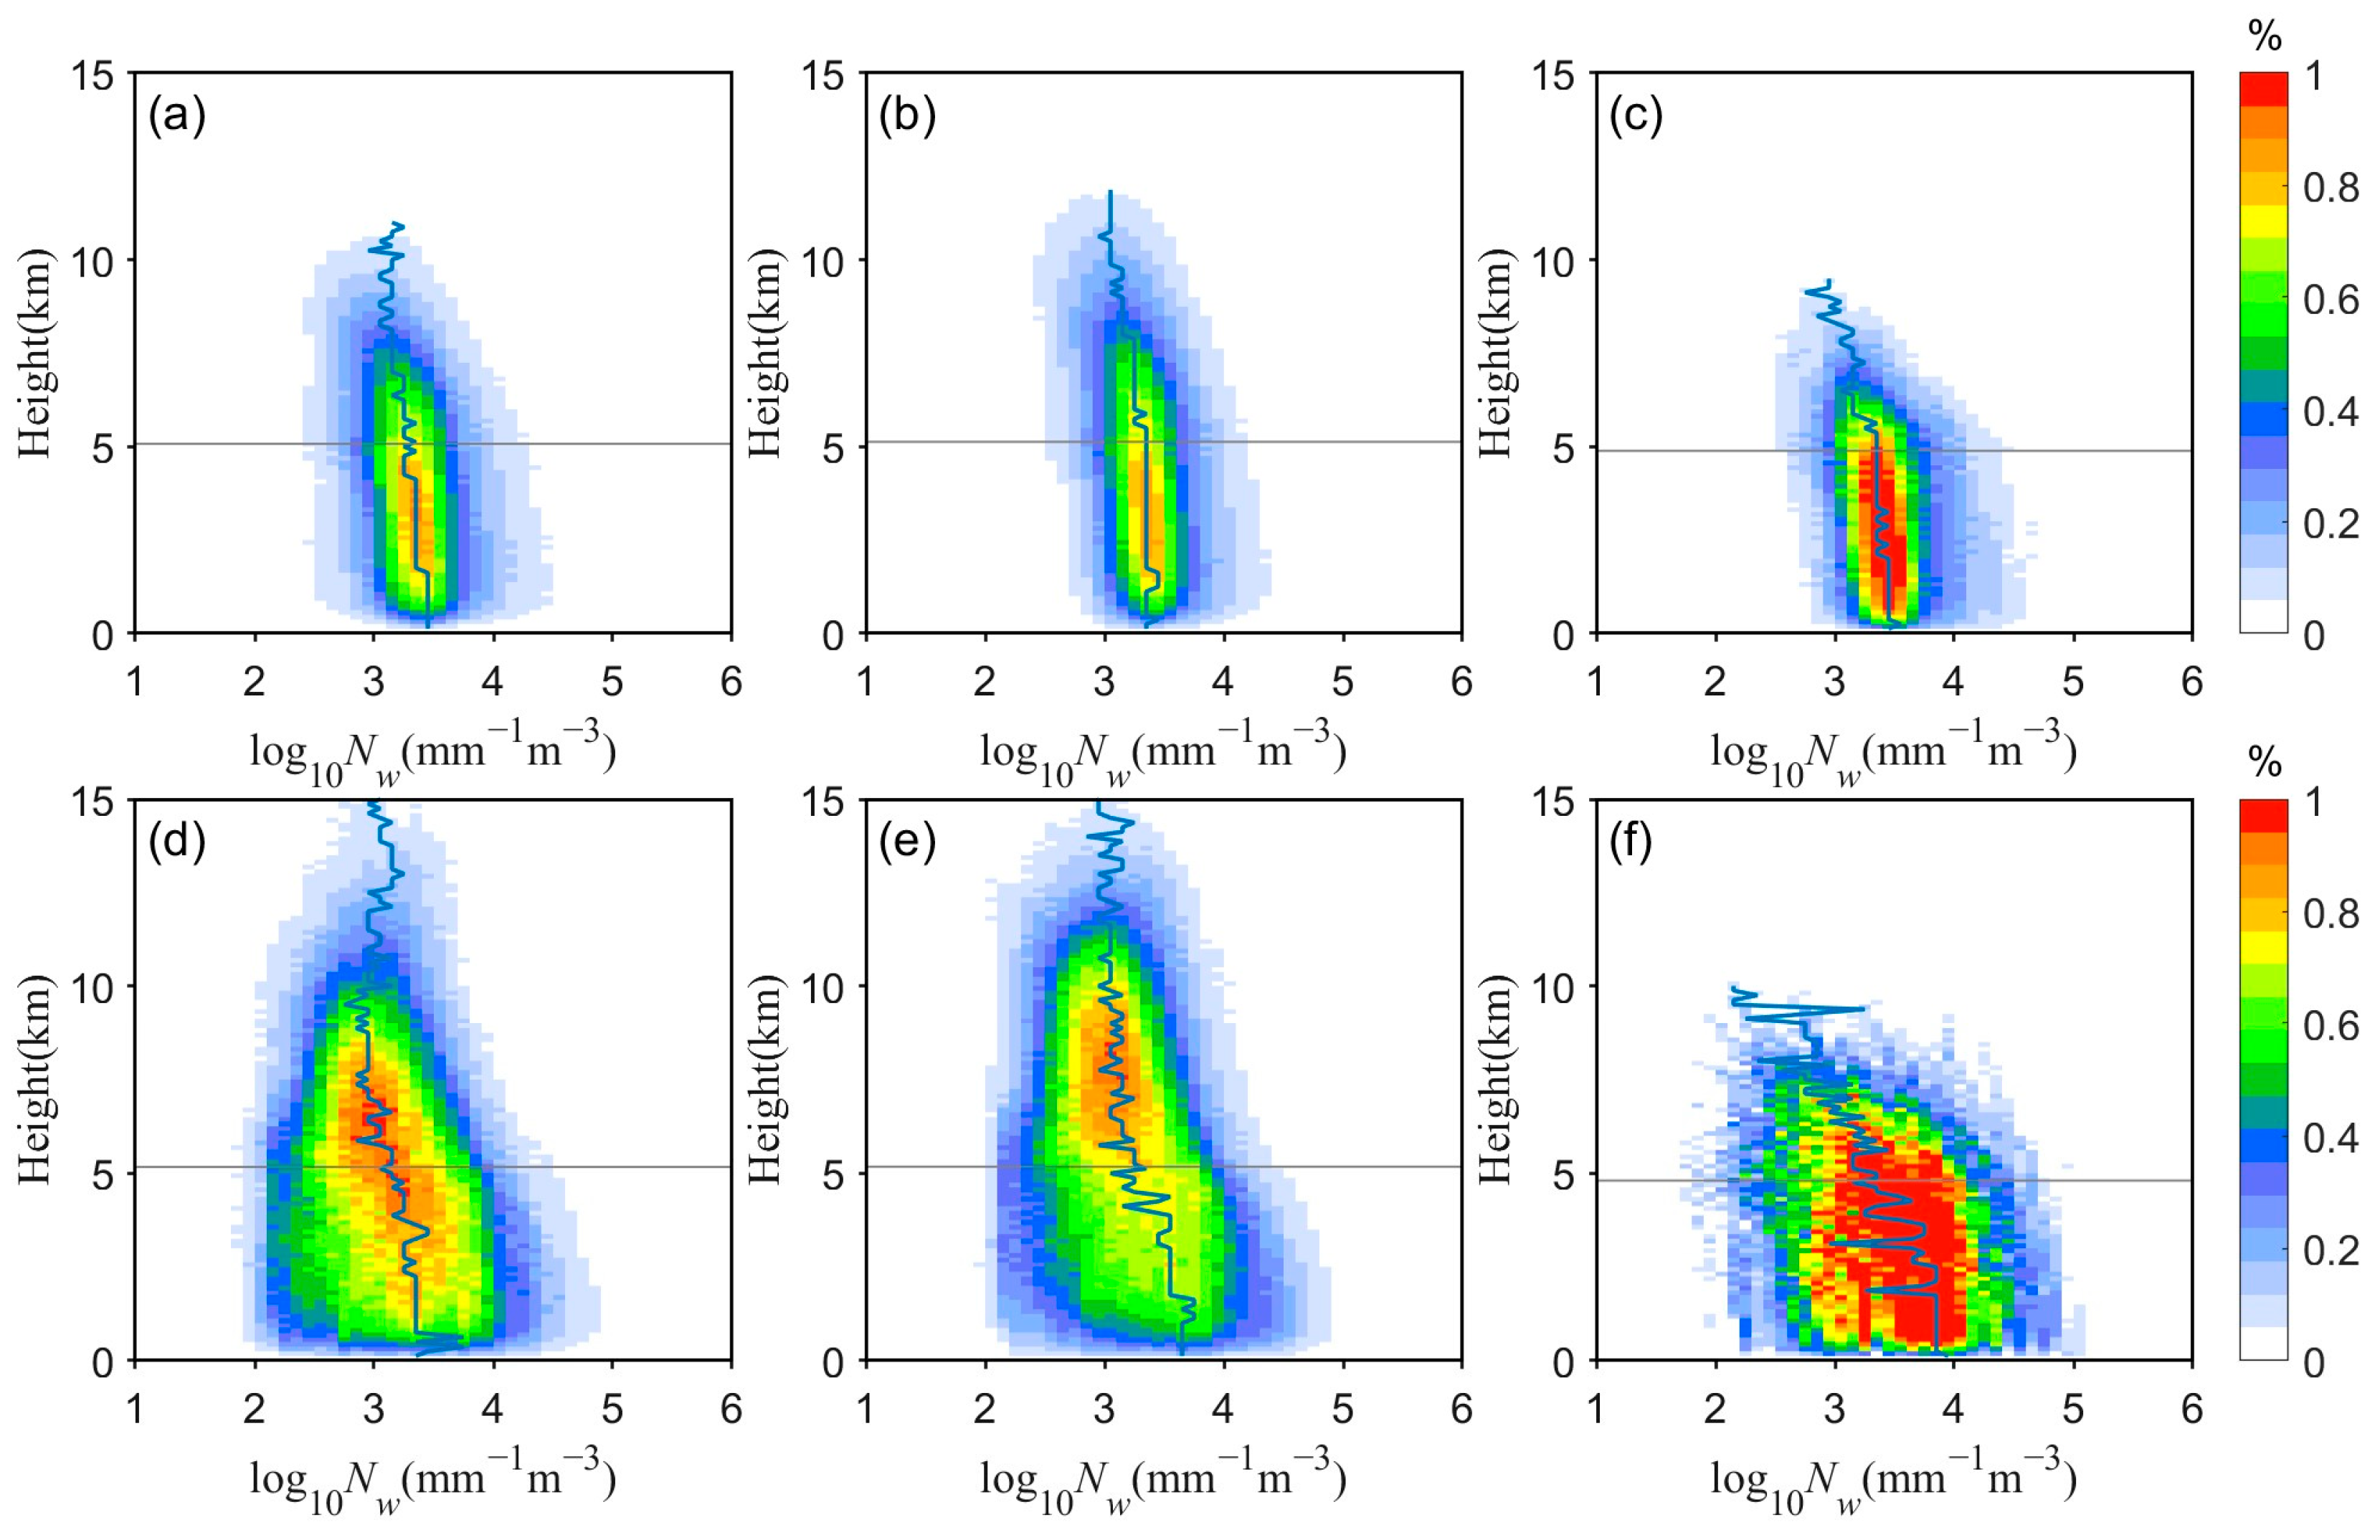
Figure 4 and Figure 5 show the vertical characteristics of DSD. For stratiform precipitation, Dm suddenly increases at the 0 °C layer (Figure 4a–c), but log10(Nw) shows no significant change (Figure 5a–c). During the developing and mature stages, Dm exhibits two distinct centers located at altitudes of 1–3 km and 6–7 km, respectively. In the dissipating stage, the center shifts to below the 0 °C layer. The log10(Nw) ranges from 2.7 to 4.4 mm−1·m−3 in the mature stage and from 2.5 to 4.5 mm−1·m−3 in the developing and dissipating stages. Larger values of log10(Nw) are observed in the developing stage, whereas the prevalence of larger particles decreases in the mature stage. For convective precipitation, Dm increases with decreasing altitude (Figure 4d–f). Two distinct Dm centers are observed below the average 0 °C layer, consistent with the PDF of Dm in Figure 2b. Meanwhile, log10(Nw) for convective precipitation continues to increase as altitude decreases (Figure 5d–f). The heights of log10(Nw) centers vary across the three stages: the center is near the average 0 °C layer in the developing stage, at 8 km in the mature stage, and expands to form a maximum frequency profile in the dissipating stage. It is indicated that convective precipitation has many particles near the 0 °C layer in the developing stage. As the system transitions from the developing to the mature stage, strong updrafts carry numerous small-sized precipitation particles to higher altitudes. These particles grow into larger ones through aggregation or collision processes before eventually falling. In the dissipating stage, weakened updrafts allow medium-sized particles to descend from higher altitudes to lower layers. Therefore, the particle radius is large and the density is small in the developing stage, and the particle radius and density are both relatively large in the mature stage, while the particle radius is small and the density is large in the dissipating stage.

3.3. High Precipitation Efficiency and Positive Correlation Between Particle Radius and Storm Top Height

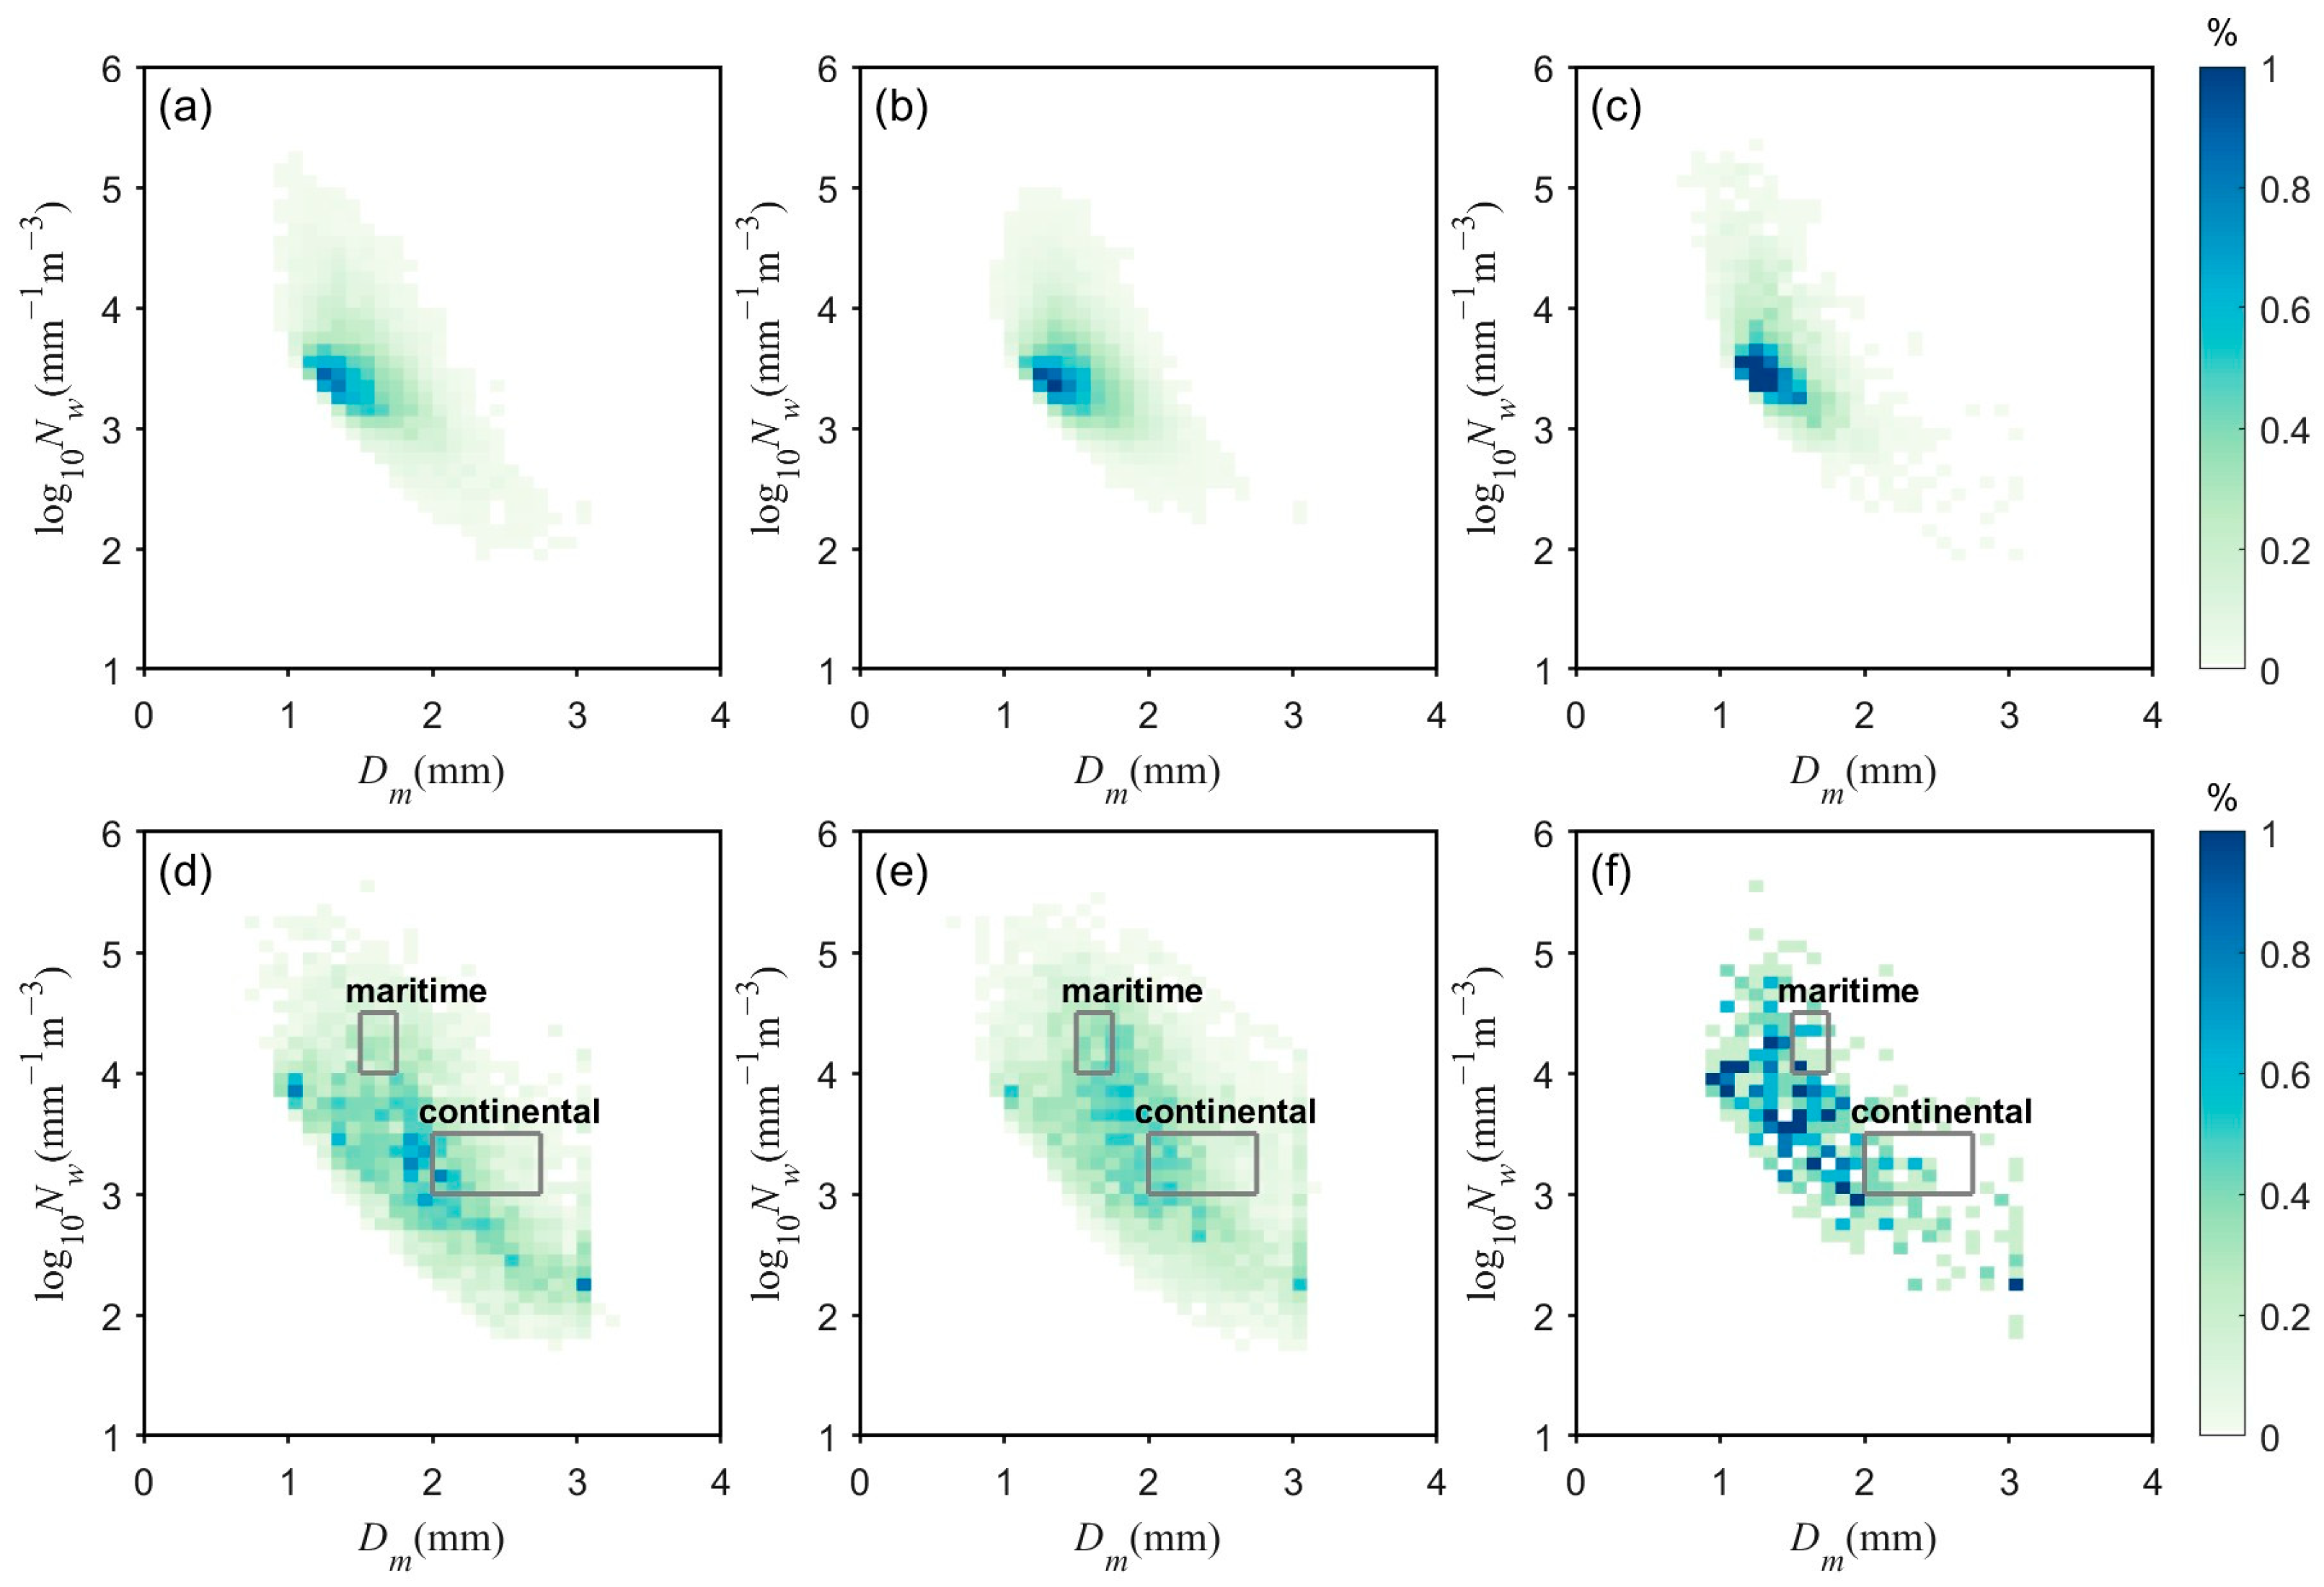
The frequency distributions of Dm and log10(Nw) are presented in Figure 6. The distribution of Dm-log10(Nw) for stratiform precipitation (Figure 6a–c) is more concentrated compared to convective precipitation (Figure 6d–f). Stratiform precipitation predominantly exhibits smaller particle sizes (less than 1.5 mm) and larger particle concentrations (larger than 3 mm−1·m−3), indicating that it is transformed from small precipitation particles. During the mature stage, the proportion of large particles decreases compared to the developing and dissipating stages, consistent with the characteristics shown in the PDF of the DSD. Under similar log10(Nw) conditions, convective precipitation demonstrates larger Dm compared to stratiform precipitation, reflecting different warm rain processes between the two precipitation types. The range of precipitation particle size is broader for convective precipitation, and the distribution of Dm-log10(Nw) is more concentrated than that of stratiform precipitation. For convective precipitation generated in PC mature stage, the probability of Dm exceeding 2.2 mm and log10(Nw) exceeding 3.2 mm−1·m−3 is higher than in the other stages. In the dissipating stage, the Dm-log10(Nw) distribution center shifts to regions with Dm less than 2 mm and log10(Nw) larger than 3 mm−1·m−3, indicating smaller particle sizes and higher concentrations. Bringi et al. [27] proposed the Dm-log10(Nw) relationship for continental-like convective precipitation and maritime-like convective precipitation (gray box in Figure 6d–f). Convective precipitation over south China exhibits characteristics of both maritime and continental convective precipitation, while the precipitation in the developing stage is more towards continental-like convective precipitation.
Figure 7 shows the vertical distribution of LWP and IWP in three stages. For stratiform precipitation, the maximum LWP ranges from 200 to 400 g·m−2, while the IWP ranges from 100 to 500 g·m−2 (Figure 7a–c). The IWP is significantly higher in the mature stage compared to the developing and dissipating stages, whereas the LWP in the dissipating stage is notably lower than in the developing and mature stages. This indicates that the growth of stratiform precipitation involves the formation of more ice particles. For convective precipitation, the average IWP in the dissipating stage is lower than that of stratiform precipitation (Figure 7f). However, in the developing and mature stages, the average LWP and IWP are greater than those of stratiform precipitation (Figure 7d,e), highlighting the dominant contribution of convective precipitation to total precipitation over South China. The maximum frequency of LWP for convective precipitation in the developing and dissipating stages is between 200 and 400 g·m−2, and that of IWP falls between 100 and 200 g·m−2. Compared to stratiform precipitation, convective precipitation exhibits a higher proportion of LWP exceeding 2000 g·m−2. Strong convective activity leads to the formation of taller precipitating clouds, generating larger quantities of ice crystals. As ice particles melt and are supplemented by water vapor, the liquid water content in rain cells increases significantly. In the dissipating stage, the convective system begins to disintegrate, resulting in most precipitation particles detaching from the cloud and causing a rapid decline in hydrometeor content. The difference in IWP and LWP between the developing and dissipating stages of stratiform precipitation is less pronounced than that observed in convective precipitation, indicating that convective precipitation is more sufficient.
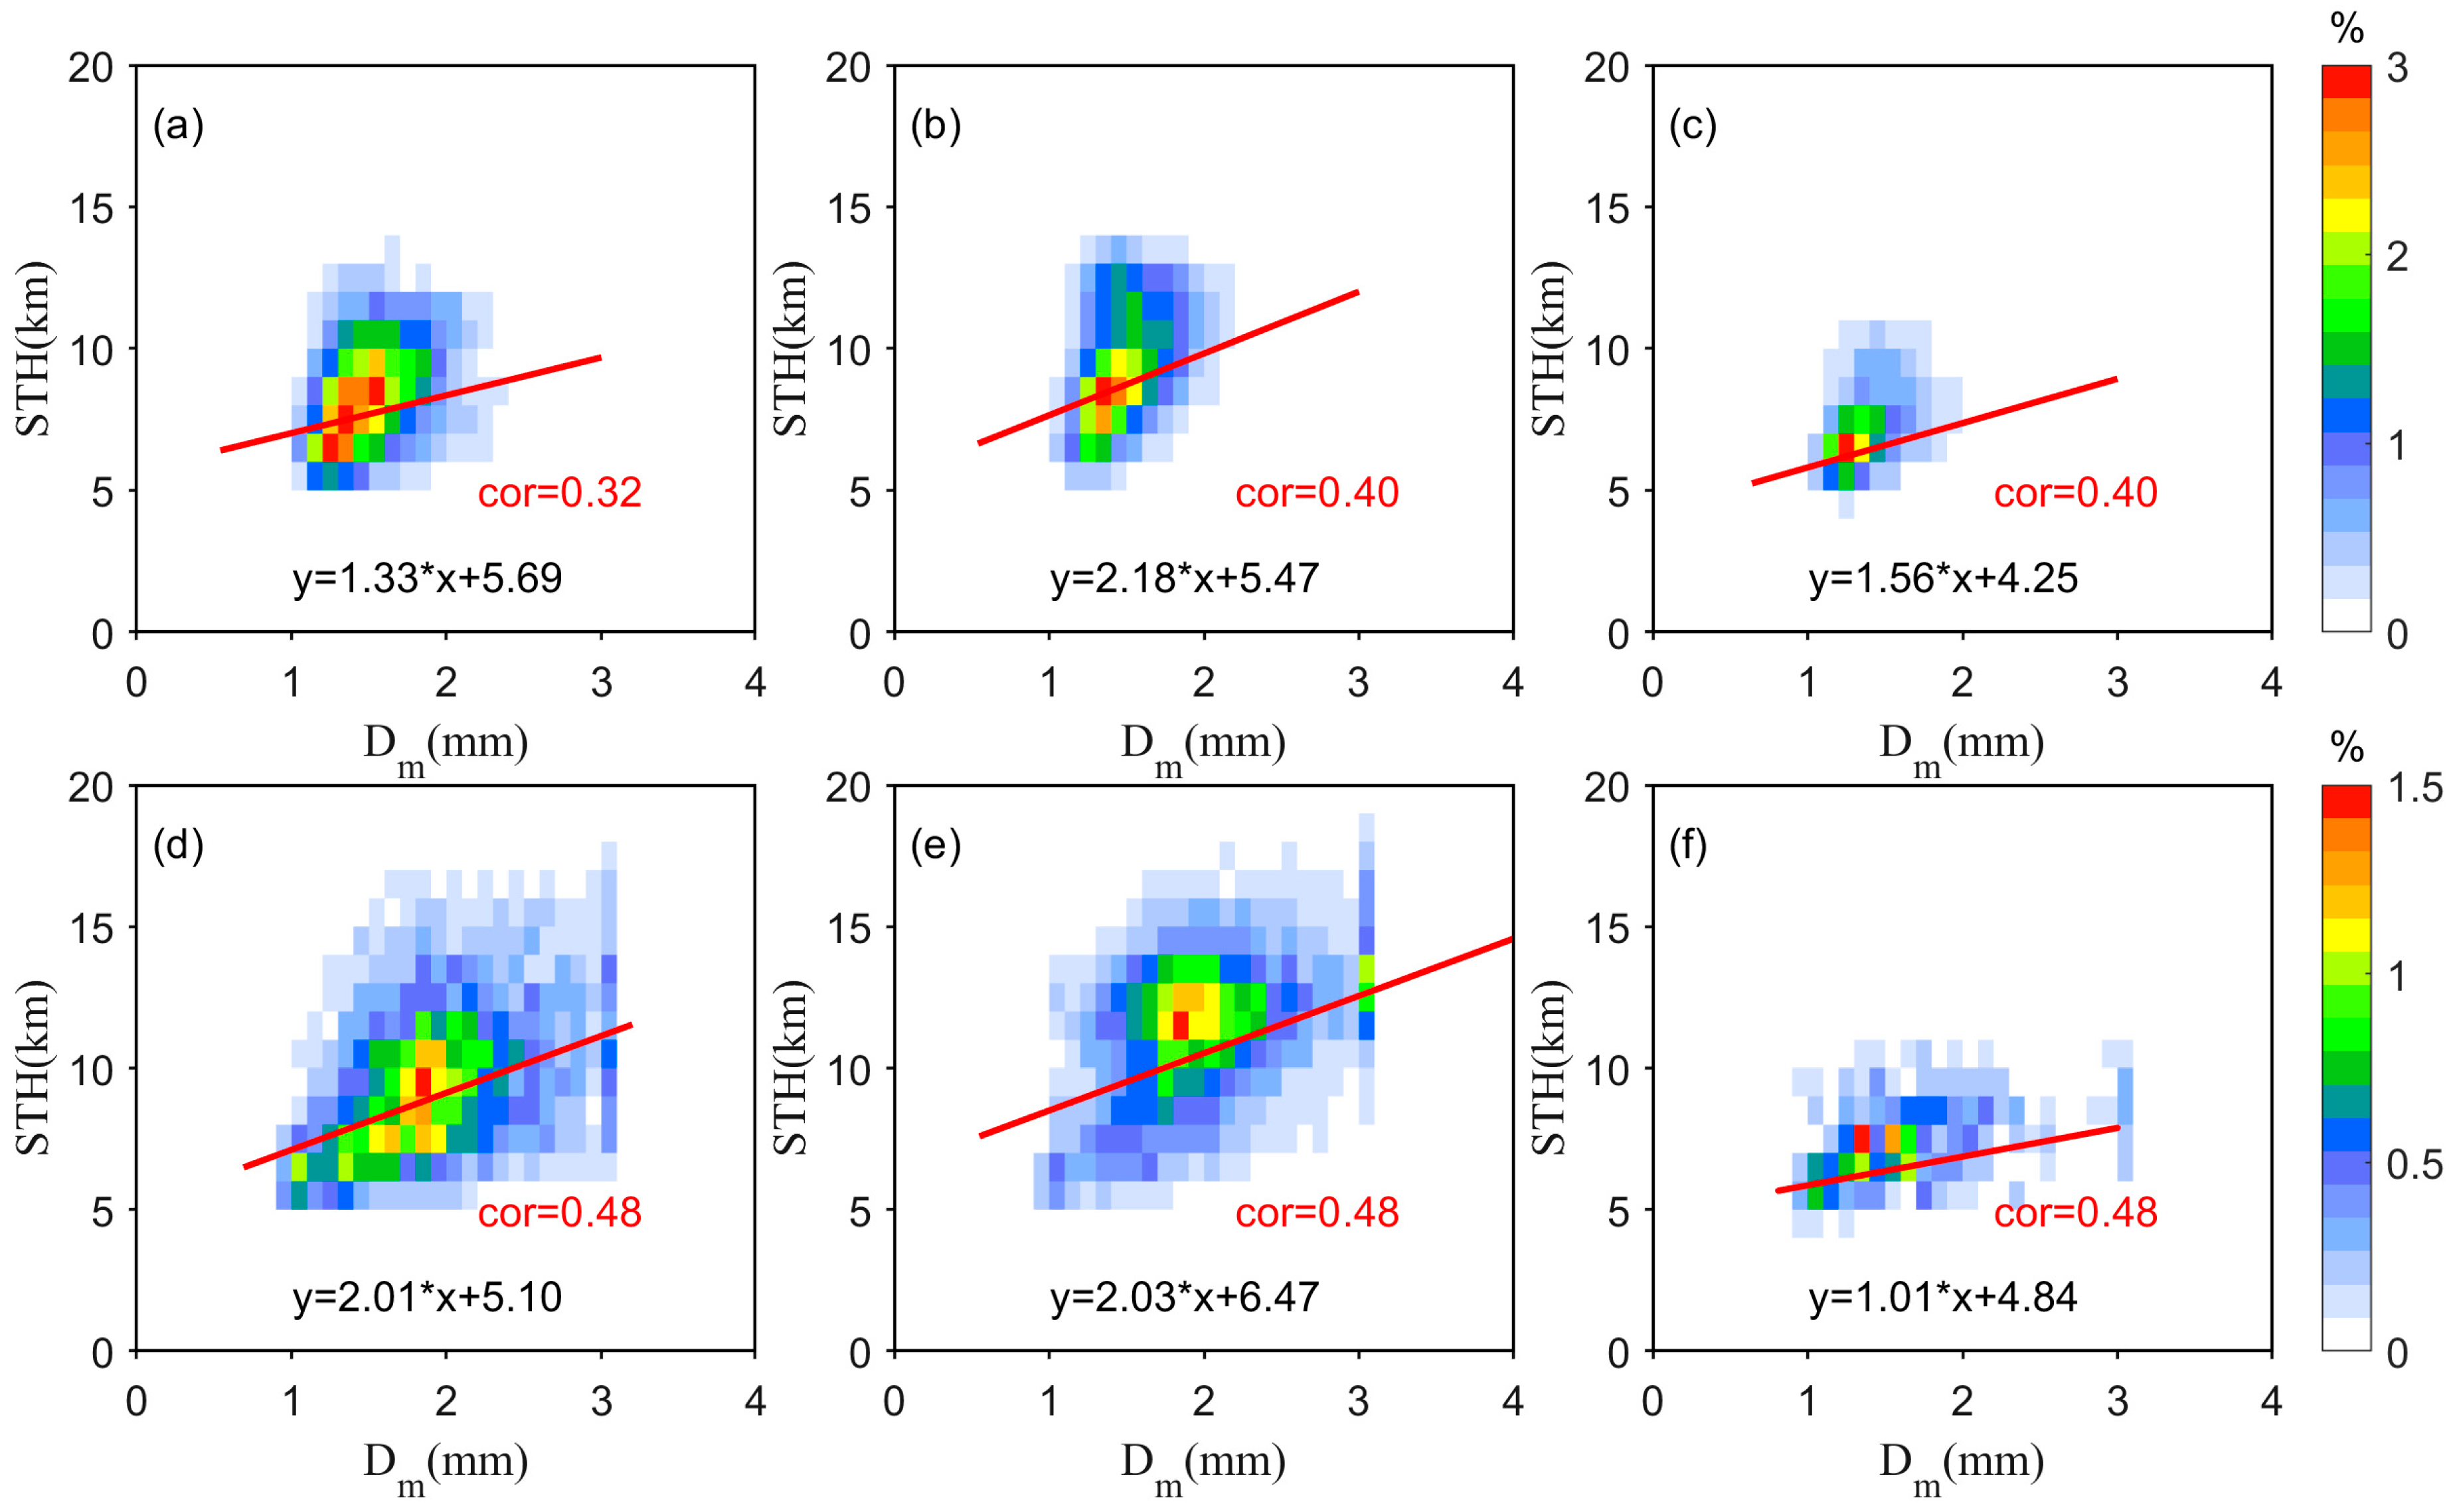
There are interactions between different physical quantities in precipitation. Figure 8 illustrates the two-dimensional probability density distribution of Dm-STH, revealing a positive correlation between these variables for both stratiform and convective precipitation. The correlation for convective precipitation is stronger than that for stratiform. For stratiform precipitation, the correlation coefficients for Dm-STH are 0.4 in the mature and dissipating stages and 0.32 in the developing stage. The slope of the fitting curve is largest in the mature stage, followed by the dissipating stage, and smallest in the developing stage (Figure 8a–c). In all three life stages, Dm concentrated in the range of 1.3–1.6 mm and STH concentrated in the range of 7–10 km. For convective precipitation, the correlation coefficients for Dm-STH remain consistent at 0.48 across all three stages. The slope of the fitting curve is largest in the mature stage, where the Dm is concentrated between 1.7–2.1 mm and STH is concentrated between 11–13 km (Figure 8d). The slope in the developing stage is slightly less than that in the mature stage, with the Dm concentrated in the range of 1.7–2.0 mm and STH concentrated in the range of 7–11 km (Figure 8e). The dissipating stage exhibits the smallest slope, with a more dispersed frequency distribution and a significant decrease in STH (Figure 8f). This reduction in STH during the dissipating stage reflects a weakening of upward airflow, which shortens the path for collision and coalescence processes, resulting in a decline in the number of large-sized precipitation particles.

4. Discussion

A substantial body of research has been conducted to evaluate and correct precipitation retrieval algorithms and assess products based on GPM DPR data, which has confirmed the reliability of the GPM DPR data. However, large-scale and long-term statistical studies using GPM DPR data remain relatively limited. Although there are certain biases in the retrieval of precipitation microphysical parameters by DPR, we argue that these retrieval errors only affect the analysis of individual precipitation cases and do not influence the conclusions of this study. This is because our conclusions are primarily based on statistical significance. Moreover, our classification is based on “rain cells”, which is more scientific than classification based on individual pixels. Additionally, affected by elements such as topography, monsoons, climatic regions, and other variables, the microphysical characteristics of South China differ from those of other regions in China. Though we do not distinguish the specific weather conditions, such as warm sector heavy rainfall, frontal rainfall, or tropical cyclones, this paper studies the microphysical characteristics of PCS in different life stages in the pre-summer rainy season over South China, and the statistical conclusions are favorable for understanding the precipitation forming. In future research, we will relate specific cloud properties with specific rainfall and/or flooding events and explore the microphysical evolution characteristics of specific precipitation.

5. Conclusions

This study found that microphysical characteristics of rain cells exhibit discernible variations in PCs’ different stages based on the GPM DPR and Himawari-8 collocated dataset. Additionally, distinct precipitation types present unique microphysical characteristics within the same life stage.
Both area and convective precipitation proportion of developing PCs is larger than that in the dissipating stage. The proportion of convective precipitation reduces persistently in PCs’ whole life cycle. The rain cell generated by developing PCs has the maximum proportion of convective precipitation, reaching up to 28.4%. The largest precipitation area is exhibited in the mature stage, reaching up to 111,325 km2, with convective precipitation accounting for 20.6%. The proportion of convective precipitation is the lowest at 13.9% in PCs’ dissipating stage, with a maximum precipitation area of 11,650 km2. Both IWP and LWP rapidly increase during PCs’ mature stage and decrease in PCs’ dissipating stage, even lower than the developing stage, indicating that the precipitation over South China has sufficient water vapor supply with its growth and the precipitation efficiency in this area is high.
For stratiform precipitation, the Radar reflectivity center gradually moves downward with the PC’s life cycle, and the STH is positively correlated with near-surface Dm in each stage. Stratiform precipitation particles experience rapid growth near the bright band as they gradually descend from higher altitudes, producing bright band effects near the freezing level. Its reflectivity center is located at 6–8 km in developing and mature stages, decreasing to below 5 km in the dissipating stage with a decrease in STH. The top height of BB is slightly below the height of 0 °C level for the stratiform precipitation generated by developing PCs, while it almost overlaps with the 0 °C level in mature and dissipating PCs. Raindrop size can reach over 2.2 mm in the developing stage but is almost no more than 2.1 mm in the mature stage. The Dm-log10(Nw) distribution of stratiform precipitation is centered around Dm smaller than 1.5 mm and log10(Nw) larger than 3 mm−1·m−3, indicating small size and high density. The near-surface Dm shows a positive correlation with STH, with correlation coefficients of 0.4 in both the mature and dissipating stages and a coefficient of 0.32 in the developing stage. The IWP and LWP in the dissipating stage are smaller than those in the developing stage, indicating higher precipitation efficiency in the pre-summer rainy season over South China.
The height of the radar reflectivity center of convective precipitation generated in developing and dissipating PC stages is lower than that in mature PCs. Convective precipitation particles form in the lower layer in PCs’ developing stage, with the reflectivity center located at 2–4 km. Strong updrafts bring precipitation particles to higher levels in the mature stage, resulting in a weakening for the low-level reflectivity center located at 2–4 km, and a new reflectivity center appears at 8–10 km. Weak updrafts limit the ascent of precipitation particles in the dissipating stage, leading to a decrease in STH. Unlike stratiform precipitation, the range of Dm for convective raindrops is the same in all three stages, with a peak at 1.9 mm and more raindrops with Dm larger than 3.0 mm. The Dm-log10(Nw) of precipitation exhibits both continental-like and maritime-like convective precipitation, leaning more towards continental-like convective precipitation in the developing stage. The near-surface Dm shows a positive correlation with STH, similar to stratiform precipitation. However, the correlation coefficient for convective precipitation is 0.48 in all three stages. The differences in LWP and IWP between the three stages are greater than that of stratiform precipitation, indicating convective precipitation has higher precipitation efficiency.

Author Contributions

Conceptualization, X.H. and J.Y.; methodology, X.H. and J.Y.; software, J.Y.; validation, Z.Z., X.H. and Y.L.; formal analysis, X.H. and J.Y.; investigation, J.Y. and X.H.; resources, X.H.; data curation, X.H.; writing—original draft preparation, J.Y. and X.H.; writing—review and editing, J.Y., X.H., Z.Z., X.K. and Y.L.; visualization, J.Y.; supervision, Y.L., X.K. and Z.Z.; project administration, Y.L. All authors have read and agreed to the published version of the manuscript.

Funding

This research was supported by the National Natural Science Foundation of China (Grant U2242201, No. 42075077), and Hunan Provincial Natural Science Foundation of China (Grant No. 2021JC0009).

Data Availability Statement

The DPR Level-2 product from the Global Precipitation Measurement (GPM) mission can be downloaded from https://doi.org/10.5067/GPM/DPR/GPM/2A/07. Himawari-8 data were provided by Japan Meteorological Agency (JMA, https://www.jma.go.jp/jma/jma-eng/satellite/index.html, accessed on 20 January 2023).

Acknowledgments

The authors thank the anonymous reviewers for their constructive comments and suggestions that greatly improved this paper.

Conflicts of Interest

The authors declare no conflicts of interest.

References

  1. Geerts, B.; Teferi, D. Regional and Diurnal Variability of the Vertical Structure of Precipitation Systems in Africa Based on Spaceborne Radar Data. J. Clim. 2005, 18, 893–916. [Google Scholar]
  2. Saikranthi, K.; Rao, T.N.; Radhakrishna, B.; Rao, S.V.B. Morphology of the Vertical Structure of Precipitation over India and Adjoining Oceans Based on Long-Term Measurements of Trmm Pr. J. Geophys. Res. Atmos. 2014, 119, 8433–8449. [Google Scholar]
  3. Wu, D.; Dong, X.; Xi, B.; Feng, Z.; Kennedy, A.; Mullendore, G.; Gilmore, M.; Tao, W.-K. Impacts of Microphysical Scheme on Convective and Stratiform Characteristics in Two High Precipitation Squall Line Events. J. Geophys. Res. Atmos. 2013, 118, 11119–11135. [Google Scholar]
  4. Huang, H.; Chen, F. Precipitation Microphysics of Tropical Cyclones over the Western North Pacific Based on Gpm Dpr Observations: A Preliminary Analysis. J. Geophys. Res. Atmos. 2019, 124, 3124–3142. [Google Scholar] [CrossRef]
  5. Sun, G.; Li, Y.; Li, S. The Differences in Cloud Vertical Structures between Active and Break Spells of the East Asian Summer Monsoon Based on Cloudsat Data. Atmos. Res. 2019, 224, 157–167. [Google Scholar]
  6. Xu, J.; Ping, F.; Li, J.Y.; Du, H. A Study of Cloud Microphysical Processes and a Mesoscale Environment in a Heavy Rainfall Case over Yan’an. Front. Earth Sci. 2023, 11, 1149856. [Google Scholar]
  7. Yin, J.; Gu, H.; Yu, M.; Bao, X.; Xie, Y.; Liang, X. Synergetic Roles of Dynamic and Cloud Microphysical Processes in Extreme Short-Term Rainfall: A Case-Study. Q. J. R. Meteorol. Soc. 2022, 148, 3660–3676. [Google Scholar]
  8. Guilloteau, C.; Foufoula-Georgiou, E. Life Cycle of Precipitating Cloud Systems from Synergistic Satellite Observations: Evolution of Macrophysical Properties and Precipitation Statistics from Geostationary Cloud Tracking and Gpm Active and Passive Microwave Measurements. J. Hydrometeorol. 2024, 25, 789–805. [Google Scholar]
  9. Fiolleau, T.; Roca, R. An Algorithm for the Detection and Tracking of Tropical Mesoscale Convective Systems Using Infrared Images from Geostationary Satellite. IEEE Trans. Geosci. Remote Sens. 2013, 51, 4302–4315. [Google Scholar]
  10. Witte, M.K.; Chuang, P.Y.; Feingold, G. On Clocks and Clouds. Atmos. Chem. Phys. 2014, 14, 6729–6738. [Google Scholar]
  11. Xiang, J.; Wang, H.; Li, Z.; Bu, Z.; Yang, R.; Liu, Z. Case Study on the Evolution and Precipitation Characteristics of Southwest Vortex in China: Insights from Fy-4a and Gpm Observations. Remote Sens. 2023, 15, 4114. [Google Scholar] [CrossRef]
  12. Fu, Y.; Zhang, A. Life Cycle Effects on the Vertical Structure of Precipitation in East China Measured by Himawari-8 and Gpm Dpr. Mon. Weather Rev. 2018, 146, 2183–2199. [Google Scholar]
  13. Kumar, S.; Del Castillo-Velarde, C.; Rojas, J.L.F.; Moya-Álvarez, A.; Castro, D.M.; Srivastava, S.; Silva, Y. Precipitation Structure During Various Phases the Life Cycle of Precipitating Cloud Systems Using Geostationary Satellite and Space-Based Precipitation Radar over Peru. GIScience Remote Sens. 2020, 57, 1057–1082. [Google Scholar]
  14. Sun, Y.; Dong, X.; Cui, W.; Zhou, Z.; Fu, Z.; Zhou, L.; Deng, Y.; Cui, C. Vertical Structures of Typical Meiyu Precipitation Events Retrieved from Gpm-Dpr. J. Geophys. Res. Atmos. 2020, 125, e2019JD031466. [Google Scholar]
  15. Wan, Q.; Wang, B.; Wong, W.K.; Hu, Z.; Jou, B.J.-D.; Lin, Y.; Johnson, R.H.; Chang, C.-P.; Zhu, Y.; Zhang, X.; et al. The Southern China Monsoon Rainfall Experiment (Scmrex). Bull. Am. Meteorol. Soc. 2017, 98, 999–1013. [Google Scholar] [CrossRef]
  16. He, J.; Zheng, J.; Zeng, Z.; Che, Y.; Zheng, M.; Li, J. A Comparative Study on the Vertical Structures and Microphysical Properties of Stratiform Precipitation over South China and the Tibetan Plateau. Remote Sens. 2021, 13, 2897. [Google Scholar] [CrossRef]
  17. Zhang, A.; Chen, Y.; Li, W.; Chen, S. Event-Based Precipitation Characteristics Related to Cloud-Top Temperature During Pre-Summer Rainy Season over South China. Int. J. Climatol. 2023, 43, 2271–2286. [Google Scholar] [CrossRef]
  18. Hou, A.Y.; Kakar, R.K.; Neeck, S.; Azarbarzin, A.A.; Kummerow, C.D.; Kojima, M.; Oki, R.; Nakamura, K.; Iguchi, T. The Global Precipitation Measurement Mission. Bull. Am. Meteorol. Soc. 2014, 95, 701–722. [Google Scholar] [CrossRef]
  19. Hu, X.; Ai, W.; Qiao, J.; Hu, S.; Han, D.; Yan, W. Microphysics of Summer Precipitation over Yangtze-Huai River Valley Region in China Revealed by Gpm Dpr Observation. Earth Space Sci. 2022, 9, e2021EA002021. [Google Scholar]
  20. Ryu, J.; Song, H.-J.; Sohn, B.-J.; Liu, C. Global Distribution of Three Types of Drop Size Distribution Representing Heavy Rainfall from Gpm/Dpr Measurements. Geophys. Res. Lett. 2021, 48, e2020GL090871. [Google Scholar]
  21. Wen, L.; Chen, G.; Yang, C.; Zhang, H.; Fu, Z. Seasonal Variations in Precipitation Microphysics over East China Based on Gpm Dpr Observations. Atmos. Res. 2023, 293, 106933. [Google Scholar]
  22. Gao, J.; Tang, G.; Hong, Y. Similarities and Improvements of Gpm Dual-Frequency Precipitation Radar (Dpr) Upon Trmm Precipitation Radar (Pr) in Global Precipitation Rate Estimation, Type Classification and Vertical Profiling. Remote Sens. 2017, 9, 1142. [Google Scholar] [CrossRef]
  23. Houze, R.A.; Wilton, D.C.; Smull, B.F. Monsoon Convection in the Himalayan Region as Seen by the Trmm Precipitation Radar. Q. J. R. Meteorol. Soc. 2007, 133, 1389–1411. [Google Scholar]
  24. Liu, C.; Zipser, E.J. The Global Distribution of Largest, Deepest, and Most Intense Precipitation Systems. Geophys. Res. Lett. 2015, 42, 3591–3595. [Google Scholar]
  25. Di, D.; Li, J.; Xue, Y.; Min, M.; Li, B.; Li, Z. Consistency of Tropospheric Water Vapor between Reanalyses and Himawari-8/Ahi Measurements over East Asia. Adv. Atmos. Sci. 2023, 41, 19–38. [Google Scholar]
  26. Yang, C.; Guan, L.; Sun, X. Comparison of Fy-4a/Agri Sst with Himawari-8/Ahi and in Situ Sst. Remote Sens. 2023, 15, 4139. [Google Scholar] [CrossRef]
  27. Bringi, V.N.; Chandrasekar, V.; Hubbert, J. Raindrop Size Distribution in Different Climatic Regimes from Disdrometer and Dual-Polarized Radar Analysis. Am. Meteorol. Soc. 2003, 60, 354–365. [Google Scholar]
Figure 1. (a) China border, red rectangle denotes South China, (b) topography of South China (104–117°E, 21–28°N, unit: m).
Remotesensing 17 01250 g001
Figure 2. Probability density function (PDF) of (a) radar reflectivity factor (dBZ), (b) Dm (unit: mm), (c) log10(Nw) (unit: mm−1·m−3), (d) storm top height (STH, unit: km), (e) LWP (unit: g·m−2), (f) IWP (unit: g·m−2) of convective precipitation (-c) and stratiform precipitation (-s) in PCs’ developing stage (dev), mature stage (mat), and dissipating stage (dis).
Remotesensing 17 01250 g002
Figure 3. Vertical frequency distribution of radar reflectivity factor (unit: dBZ) for stratiform (top row) and convective (bottom row) precipitation in PCs’ (a,d) developing stage, (b,e) mature stage, (c,f) dissipating stage. The blue solid line is the maximum frequency profile of the radar reflectivity factor, and the black solid line is the average height of 0 °C.
Remotesensing 17 01250 g003
Figure 4. Vertical frequency distribution of mass-weighted mean diameter, Dm (unit: mm) for stratiform (top row) and convective (bottom row) precipitation in PCs’ (a,d) developing stage, (b,e) mature stage, (c,f) dissipating stage, and the blue solid line is the maximum frequency profile of Dm; the black solid line is the average height of 0 °C.
Remotesensing 17 01250 g004
Figure 5. Vertical frequency distribution of raindrop concentration, log10(Nw) (unit: mm−1·m−3) for stratiform (top row) and convective (bottom row) precipitation in PCs’ (a,d) developing stage, (b,e) mature stage, (c,f) dissipating stage, and the blue solid line is the maximum frequency profile of log10(Nw); the black solid line is the average height of 0 °C.
Remotesensing 17 01250 g005
Figure 6. Frequency distribution of mass-weighted mean diameter, Dm (unit: mm) near surface, and raindrop concentration, log10(Nw) (unit: mm−1·m−3) for stratiform (top row) and convective (bottom row) precipitation in PCs’ (a,d) developing stage, (b,e) mature stage, (c,f) dissipating stage. The gray boxes represent maritime-like convective precipitation and continental-like convective precipitation.
Remotesensing 17 01250 g006
Figure 7. Frequency distribution of LWP (unit: g·m−2) and IWP (unit: g·m−2) for stratiform (top row) and convective (bottom row) precipitation in PCs’ (a,d) developing stage, (b,e) mature stage, (c,f) dissipating stage. Purple color represents the average value of IWP, and the blue color represents the average value of LWP.
Remotesensing 17 01250 g007
Figure 8. Frequency distribution between STH (unit: km) and near-surface Dm (unit: mm) for stratiform (top row) and convective (bottom row) precipitation in PCs’ (a,d) developing stage, (b,e) mature stage, (c,f) dissipating stage, the red line is the fitting curve of Dm-STH, cor is the correlation coefficient between Dm and STH.
Remotesensing 17 01250 g008
Table 1. Number, convective, and stratiform precipitation ratio; average liquid water path (LWP) and average non-liquid water path (IWP); maximum and average precipitation area of rain cells generated by PCs’ different life stages.
Life StageDevelopingMatureDissipating
Amount of rain cells1018720
Convective precipitation ratio28.4%20.6%13.9%
Stratiform precipitation ratio63.9%76.6%78.5%
Average LWP (g·m−2)888.04978.61642.89
Average IWP (g·m−2)347.72493.69176.03
Maximum precipitation area (km2)46,375111,32511,650
Average precipitation area (km2)537815,4434415
Disclaimer/Publisher’s Note: The statements, opinions and data contained in all publications are solely those of the individual author(s) and contributor(s) and not of MDPI and/or the editor(s). MDPI and/or the editor(s) disclaim responsibility for any injury to people or property resulting from any ideas, methods, instructions or products referred to in the content.