Abstract
This paper proposes a novel method for Direction of Arrival (DOA) estimation using a deep unfolded LISTA network in a non-uniform metasurface. Traditional DOA estimation methods often face challenges such as limited accuracy, high computational complexity, and poor adaptability to complex signal environments. To address these issues, we optimize a non-uniform metasurface array to reduce hardware costs and mutual coupling effects while enhancing resolution. Additionally, a deep unfolded Learned Iterative Shrinkage Thresholding Algorithm (LISTA) network is constructed by transforming Iterative Shrinkage Thresholding Algorithm (ISTA) iterative steps into trainable neural network layers, combining model-driven logic with data-driven parameter optimization. Simulation results prove that this method enhances higher precision and reduces computational complexity in comparison with traditional algorithms, especially under low SNR conditions. Furthermore, the method exhibits greater generalization ability, making it a reliable approach for high-precision DOA estimation in practical applications.
1. Introduction
Direction of Arrival (DOA) estimation, an essential technique in array signal processing, is extensively employed in smart antennas, radar detection, satellite communications, aerospace, and other systems, playing a vital role in a wide range of applications [1,2,3,4,5].
In terms of hardware implementation, He et al. proposed a framework for DOA estimation that uses Time-Modulated Linear Array (TMLA) [6]. This method achieves high-precision DOA estimation but requires multiple antenna array receiving channels, resulting in increased hardware costs. In the last few years, substantial breakthroughs have been achieved in the area of metamaterials, particularly their two-dimensional (2D) counterparts. These metasurfaces have attracted considerable attention due to their ultrathin thickness and ease of integration [7]. Metasurfaces are characterized by their low cost and simple design. Moreover, by designing their element structures, they can accurately modulate the phase and amplitude of electromagnetic waves. As a result, integrating metasurfaces with array signal processing techniques has become a burgeoning research area [8,9,10,11,12,13,14,15,16]. This integration holds the potential to realize an efficient and cost-effective method for DOA estimation. Currently, digital coding metasurfaces are predominantly designed with uniformly arranged elements. To avoid direction-finding blurring, the element spacing must be kept at or below half the wavelength. Consequently, the operating frequency directly dictates the maximum permissible interval between the elements. At elevated frequencies, accommodating two elements within a half-wavelength becomes infeasible [17]. Furthermore, expanding the physical aperture enhances the direction-finding resolution. However, the addition of physical elements also leads to higher hardware costs [18]. Ling et al. demonstrated DOA estimation using programmable metasurfaces with a single channel, significantly reducing hardware costs [19]. Nevertheless, under low signal-to-noise ratio (SNR) conditions, this approach suffers from significant DOA estimation errors. Moreover, when the element spacing is minimized, strong mutual coupling effects are triggered, which may result in the failure of DOA estimation. To meet these challenges, we propose an optimized non-uniform metasurface element design. This approach reduces the number of elements in the metasurface, thereby lowering hardware costs. Meanwhile, it mitigates the issue of blurred DOA estimation that occurs when the element spacing exceeds half a wavelength. Additionally, it enhances the accuracy of DOA estimation under low SNR conditions, boosting overall reliability.
The optimized non-uniform element design provides the hardware basis for efficient and cost-effective DOA estimation, while the choice of algorithms plays a crucial role in taking full advantage of its benefits. Traditional DOA estimation methods primarily include the Maximum Likelihood (ML) algorithm [20,21], Estimating Signal Parameters via Rotational Invariance Techniques (ESPRIT) algorithm [22,23], Multiple Signal Classification (MUSIC) algorithm [24,25], and others. Both MUSIC and ESPRIT are subspace-based techniques that decompose broadband signals into narrowband components for processing. These methods are computationally intensive, resulting in significant computational costs. As the volume of information continues to grow, data storage, transmission, and processing face significant challenges, placing increasing pressure on hardware resources. In recent years, the compressive sampling theory proposed by Candes et al. has introduced new approaches for the data acquisition of sparse signals [26]. Traditional DOA estimation algorithms are constrained by the Nyquist Sampling Theorem, which results in high computational effort and cost. In contrast, compressed sensing leverages the sparsity of signals to achieve accurate signal reconstruction at sampling rates lower than the Nyquist rate. It employs random sampling techniques and nonlinear reconstruction algorithms. This approach effectively reduces the number of required samples, significantly enhancing computational efficiency.
The aforementioned estimation algorithms are primarily model-driven. They rely on the construction of mathematical relationships between array receive data and signal parameters. They then achieve optimal directional estimation through matching criteria. Under ideal conditions, when the model fits the data well, model-driven methods approach the Cramer–Rao Lower Bound (CRLB) [27] and show excellent estimation performance. However, since the construction of the model relies heavily on a priori knowledge and assumptions, its adaptability to model mismatch is poor. This can lead to a serious degradation of DOA performance or even complete failure. In practice, however, complex signal environments and various types of errors can lead to model–data mismatches, which significantly affect the performance of model-driven methods. Given the variety and complexity of system modeling errors, correcting these discrepancies is particularly challenging. In recent years, with the rapid development of deep learning technology, data-driven methods have gradually shown their advantages in complex signal environments, providing new ideas to address the limitations of traditional methods. In contrast, data-driven methods, particularly those leveraging machine learning techniques, rely on substantial data for network training to establish the mapping relationships between inputs and outputs. These methods reduced computational complexity and enhanced real-time performance [28,29]. Recent developments in deep learning have catalyzed the development of neural network-based DOA estimation. Liu et al. achieved DOA estimation by designing a multitask autoencoder as well as a series of parallel multilayer classifiers. This method breaks down the input signal into various components within different spatial subregions and makes use of a deep neural network (DNN) to conduct the estimation [30]. Cong et al. utilized an autoencoder together with multiple parallel Directed Acyclic Graph Networks (DAGNs). They converted the DOA estimation issue into a regression task. This approach enhanced the accuracy of DOA estimation when dealing with mutual coupling among array elements and colored noise [31]. Deep neural networks, however, functioning as “black-box” models, frequently encounter difficulties in generalizing to unseen data and are susceptible to overfitting [32,33]. In order to tackle these challenges, a combination of model-driven and data-driven methods is employed to solve sparse linear inverse problems. To elaborate, this maps the iterative solving steps of the original algorithm into the hidden layers of the neural network. By cascading these hidden layers, a deep unfolded network is constructed. This significantly reduces the number of iterations, and the convergence rate is notably improved [34]. Compared with convolutional neural networks (CNNs) and traditional deep neural networks, the hidden layer parameters in deep unfolded networks are directly linked to the computational steps of the iterative solving process. As a result, their network structure has a clear mathematical interpretation [35], allowing them to capture underlying patterns in the data during training and to make reasonable predictions on unseen data [36]. Such networks integrate model-driven data processing logic with data-driven parameter optimization mechanisms, exhibiting robust error adaptation capabilities. Zheng et al. avoided the need for post-processing in semantic image segmentation by unfolding the iterative process of conditional random fields into a recurrent neural network and embedding it within a convolutional neural network [37]. Additionally, Hosseini et al. integrated the iterative steps of the Proximal Gradient Descent (PGD) algorithm into the hidden layers of the network and introduced a fully connected layer between non-adjacent layers, thereby further improving sparse reconstruction performance [38]. Gregor and LeCun unfolded the Iterative Shrinkage Thresholding Algorithm (ISTA) into a network cascade, constructing the Learned Iterative Shrinkage Thresholding Algorithm (LISTA) network. This method reduces iterations by orders of magnitude, while achieving performance nearly identical to that of the original ISTA algorithm [39].
In this paper, by taking full advantage of the benefits of both model-driven and data-driven algorithms, we propose an innovative method for DOA estimation using a deep unfolded LISTA network in a non-uniform metasurface. The method constructs a deep network architecture containing trainable parameters by unfolding the ISTA algorithm, [40] and optimizes the network parameters using training data. A key merit of the LISTA network is its ability to avoid the need for the pre-modeling of errors; instead, it automatically corrects the model parameters during iterative computation based on a rich set of training data, demonstrating enhanced error adaptation and robustness.
The remaining sections are organized as follows: Section 2 details the optimal design of non-uniform metasurface elements and the space–time-coding mathematical model. Section 3 outlines the framework construction of the deep unfolded LISTA network. In Section 4, the proposed method is verified through simulation experiments. Following this, a detailed comparison and analysis of the obtained results are presented. Finally, Section 5 offers a concise summary of the paper.
2. Signal Model
In this section, the digital coding metasurface elements are designed to be optimized to address the challenge of DOA estimation blurring when the element spacing exceeds half a wavelength at high frequencies. A non-uniform design approach is employed to arrange the elements of the digital coding metasurface. The number and spacing of the elements are optimized for different frequency bands.
2.1. Non-Uniform Metasurface Model
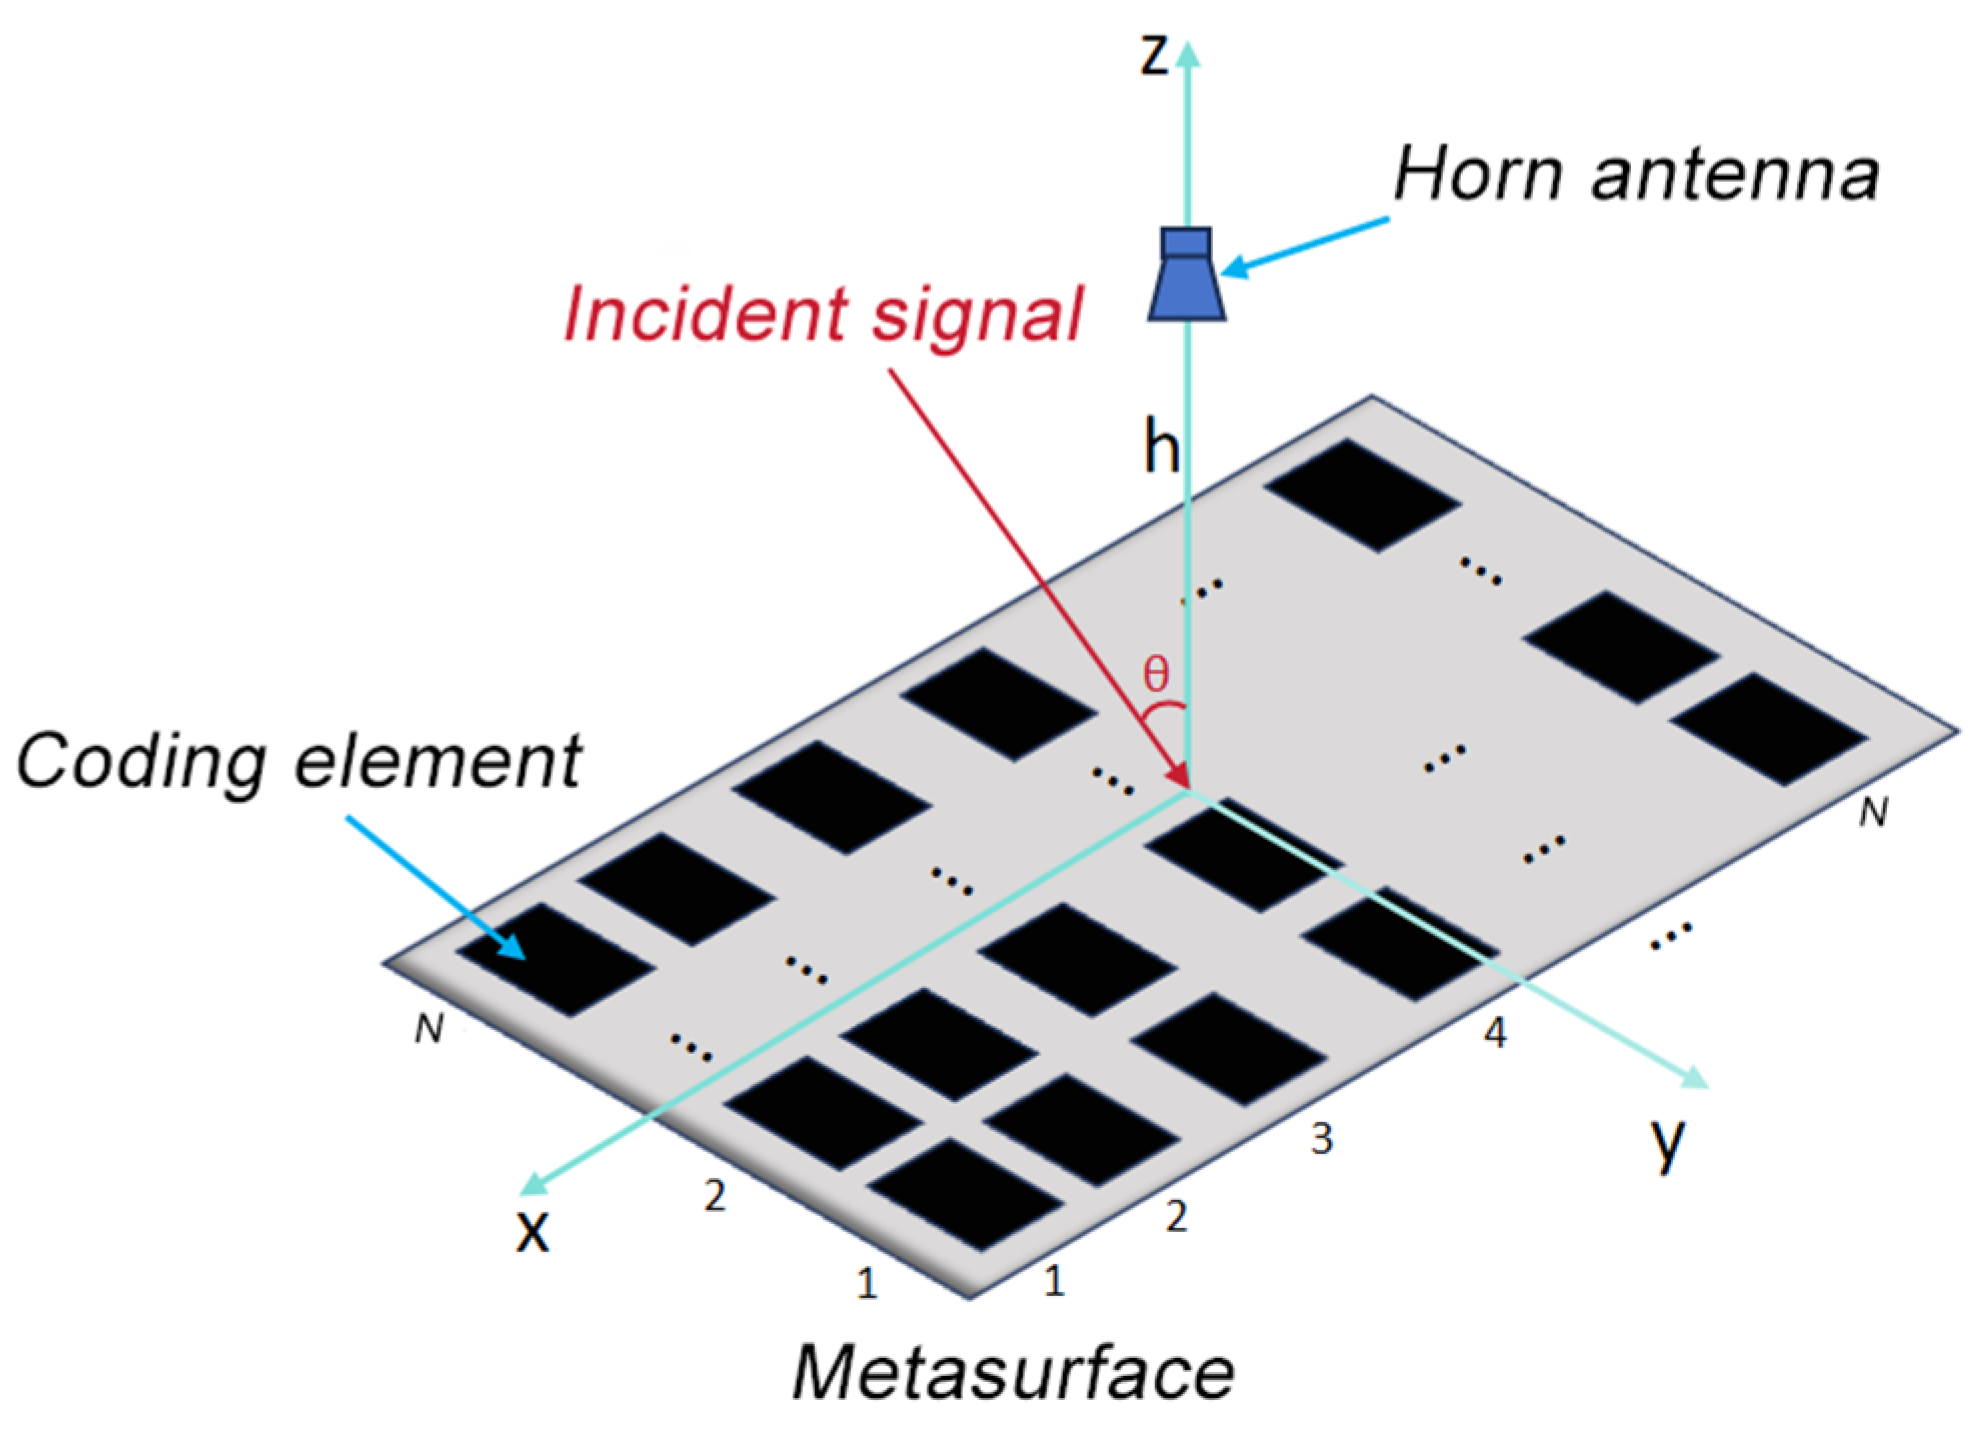
Figure 1 shows a metasurface model that is composed of a two-dimensional array of programmable elements with N rows and N columns. The elements in each row are uniformly spaced, with element No. 1 serving as the reference element in each column. The interval between element No. 2 and the reference element is limited to no more than half of the received signal wavelength, while the remaining elements are arranged non-uniformly. When setting the interval between element No. 1 and No. 2 as , then the interval between No. 2 and No. 3 is twice that between No. 1 and No. 2, and the interval between No. 3 and No. 4 is three times that between No. 1 and No. 2, and so on. represents the interval between element No. n and No. (n + 1). When setting , then by the arrangement properties, .
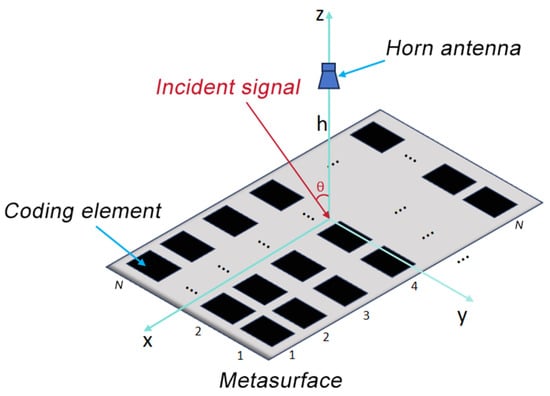
Figure 1.
Schematic diagram of DOA estimation in non-uniform metasurface.
When the signal with frequency enters the metasurface at an incidence angle , and each column is referenced to element No. 1, the received signal that is modulated by the th element can be described as follows:
where , . is the total element count and is the total number of signals. , with denoting snapshot sets. and represent the initial amplitude and phase, respectively. is the number of spatial waves. stands for Gaussian white noise when the th element is modulated.
2.2. Space–Time Modulation of Received Signal
The modulated coding is characterized as a periodic temporal function, and is formulated as a linear combination of multiple translational pulse functions within one cycle. The time-modulated reflection coefficients for the th element are denoted as follows:
where is the th modulated coding of the th element in one cycle, denotes the length of the coding sequence within one modulation cycle, is a pulse function with a period of , and its specific expression in each cycle is
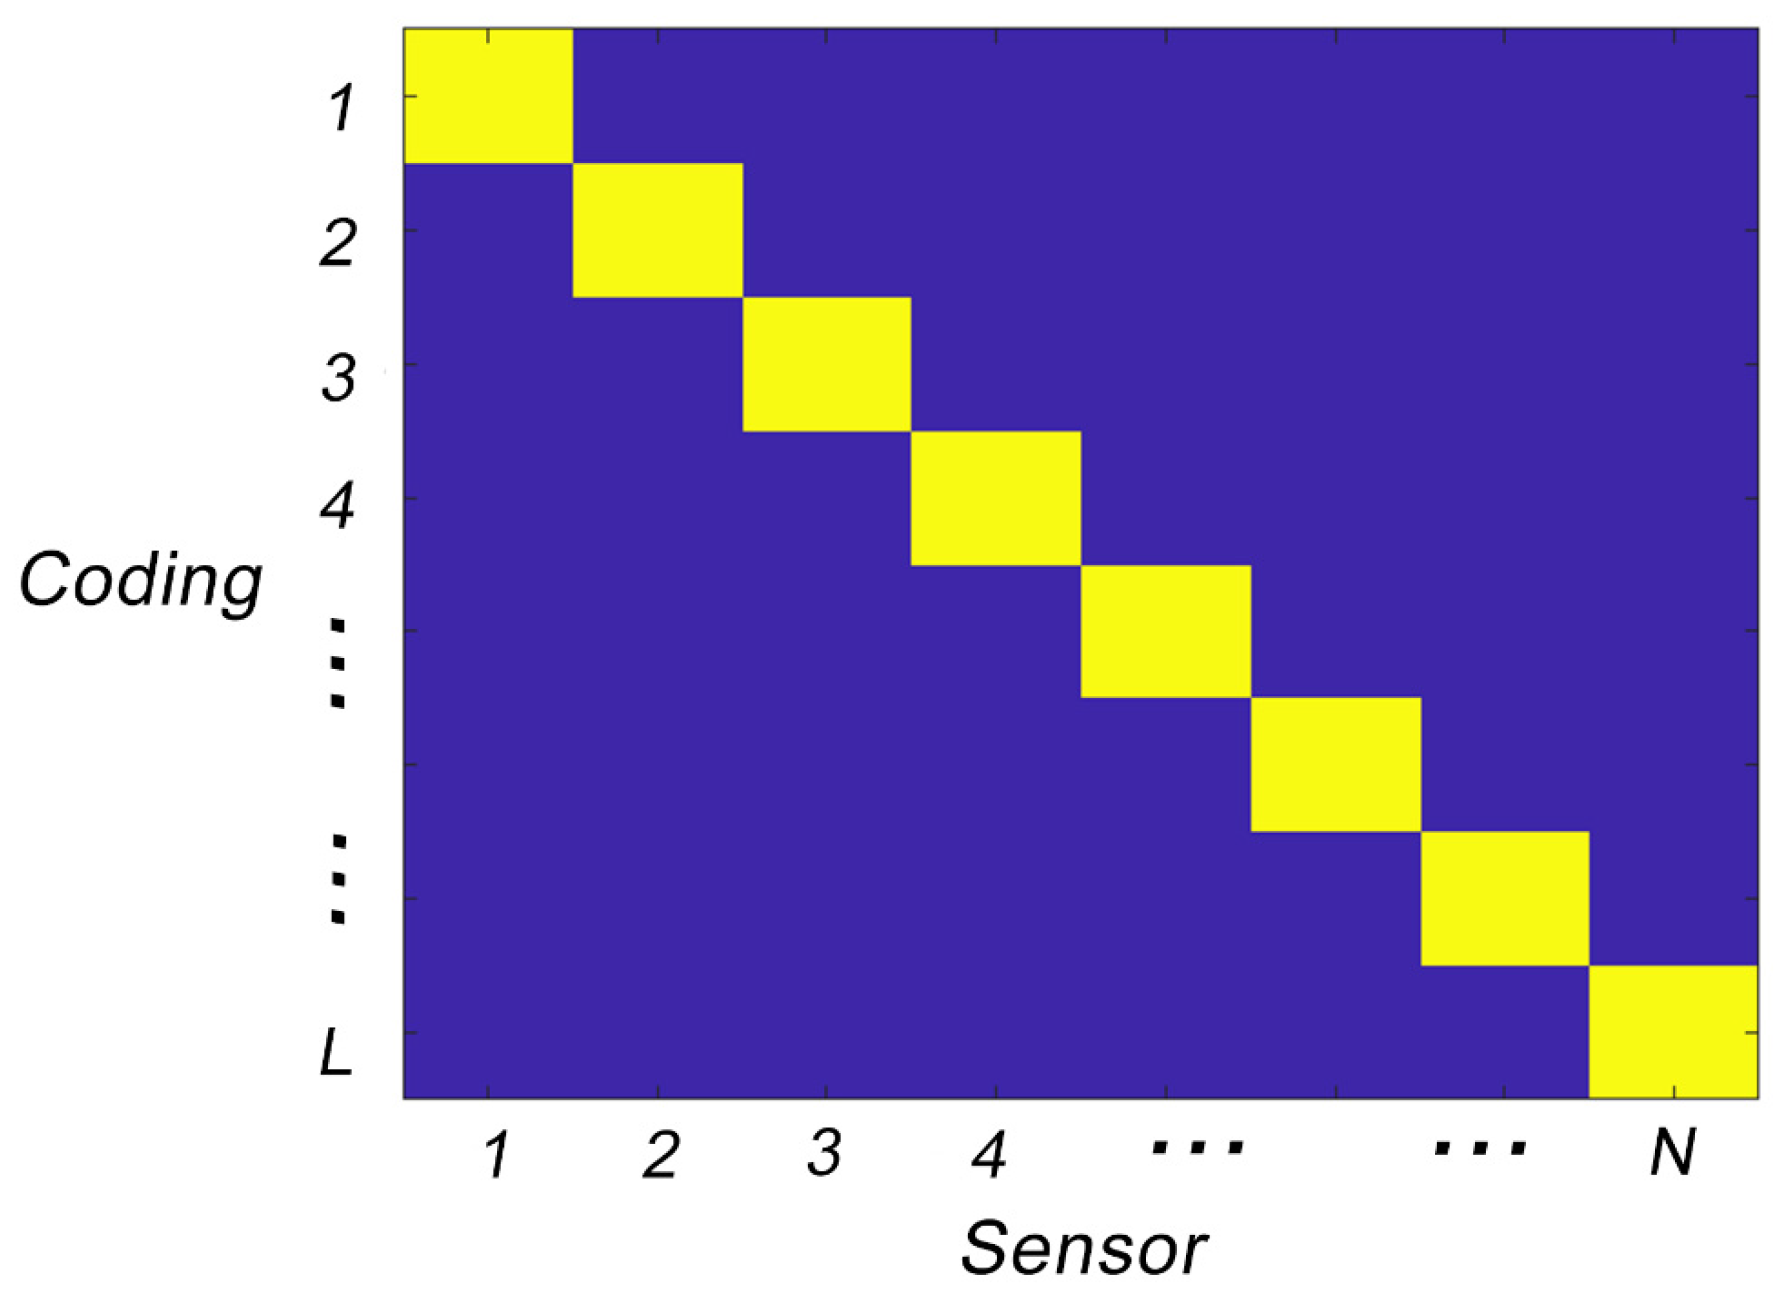
where denotes the number of modulation periods, and represent the moments when the modulated coding is set to “1” and “−1”, i.e., the phase is 0° and 180°, respectively. denotes the modulated coding number . Figure 2 shows the sequence diagram of space–time-coding metasurfaces.
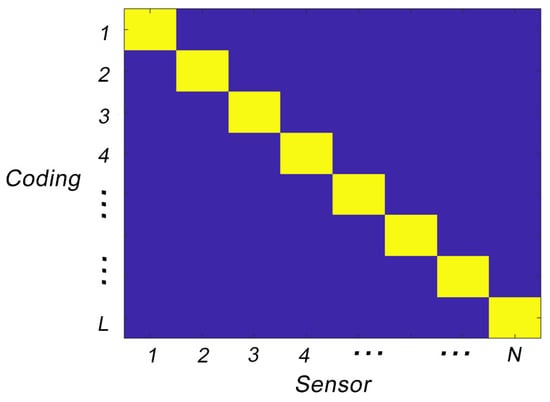
Figure 2.
Sequence diagram of space–time-coding metasurfaces.
The Fourier series expansion of the time-modulated signal is expressed as follows:
where is the modulation frequency, represents the th coefficient of the harmonic components formed by the th modulation element, and its expression is
After being modulated by the metasurface array with non-uniformly arranged elements, the signals modulated by each element are received by an antenna positioned at a height of above the center of the metasurface array. needs to satisfy the near-field distance condition, usually . The received signal can be displayed as follows:
By substituting Equations (1)–(5) into Equation (6), accumulating all the fundamental and harmonic components, then finally, the received signal model is formulated as
3. Proposed Algorithm
This section describes the LISTA algorithm used in this paper. It exploits the strengths of ISTA combined with deep learning by unfolding the iterative steps of the original ISTA algorithm. Each iterative step is considered as a layer of the neural network, and each layer involves linear transformations and nonlinear shrinkage. During the training process, the recovery performance and DOA estimation accuracy are evaluated by the loss function. Backpropagation (BP) is used for optimizing the network parameters. The network’s output spatial spectrum provides directional signal intensity distributions across multiple azimuths. Subsequent analysis of these directional patterns enables DOA estimation.
3.1. Data Preprocessing
The th harmonic component of the received signal is
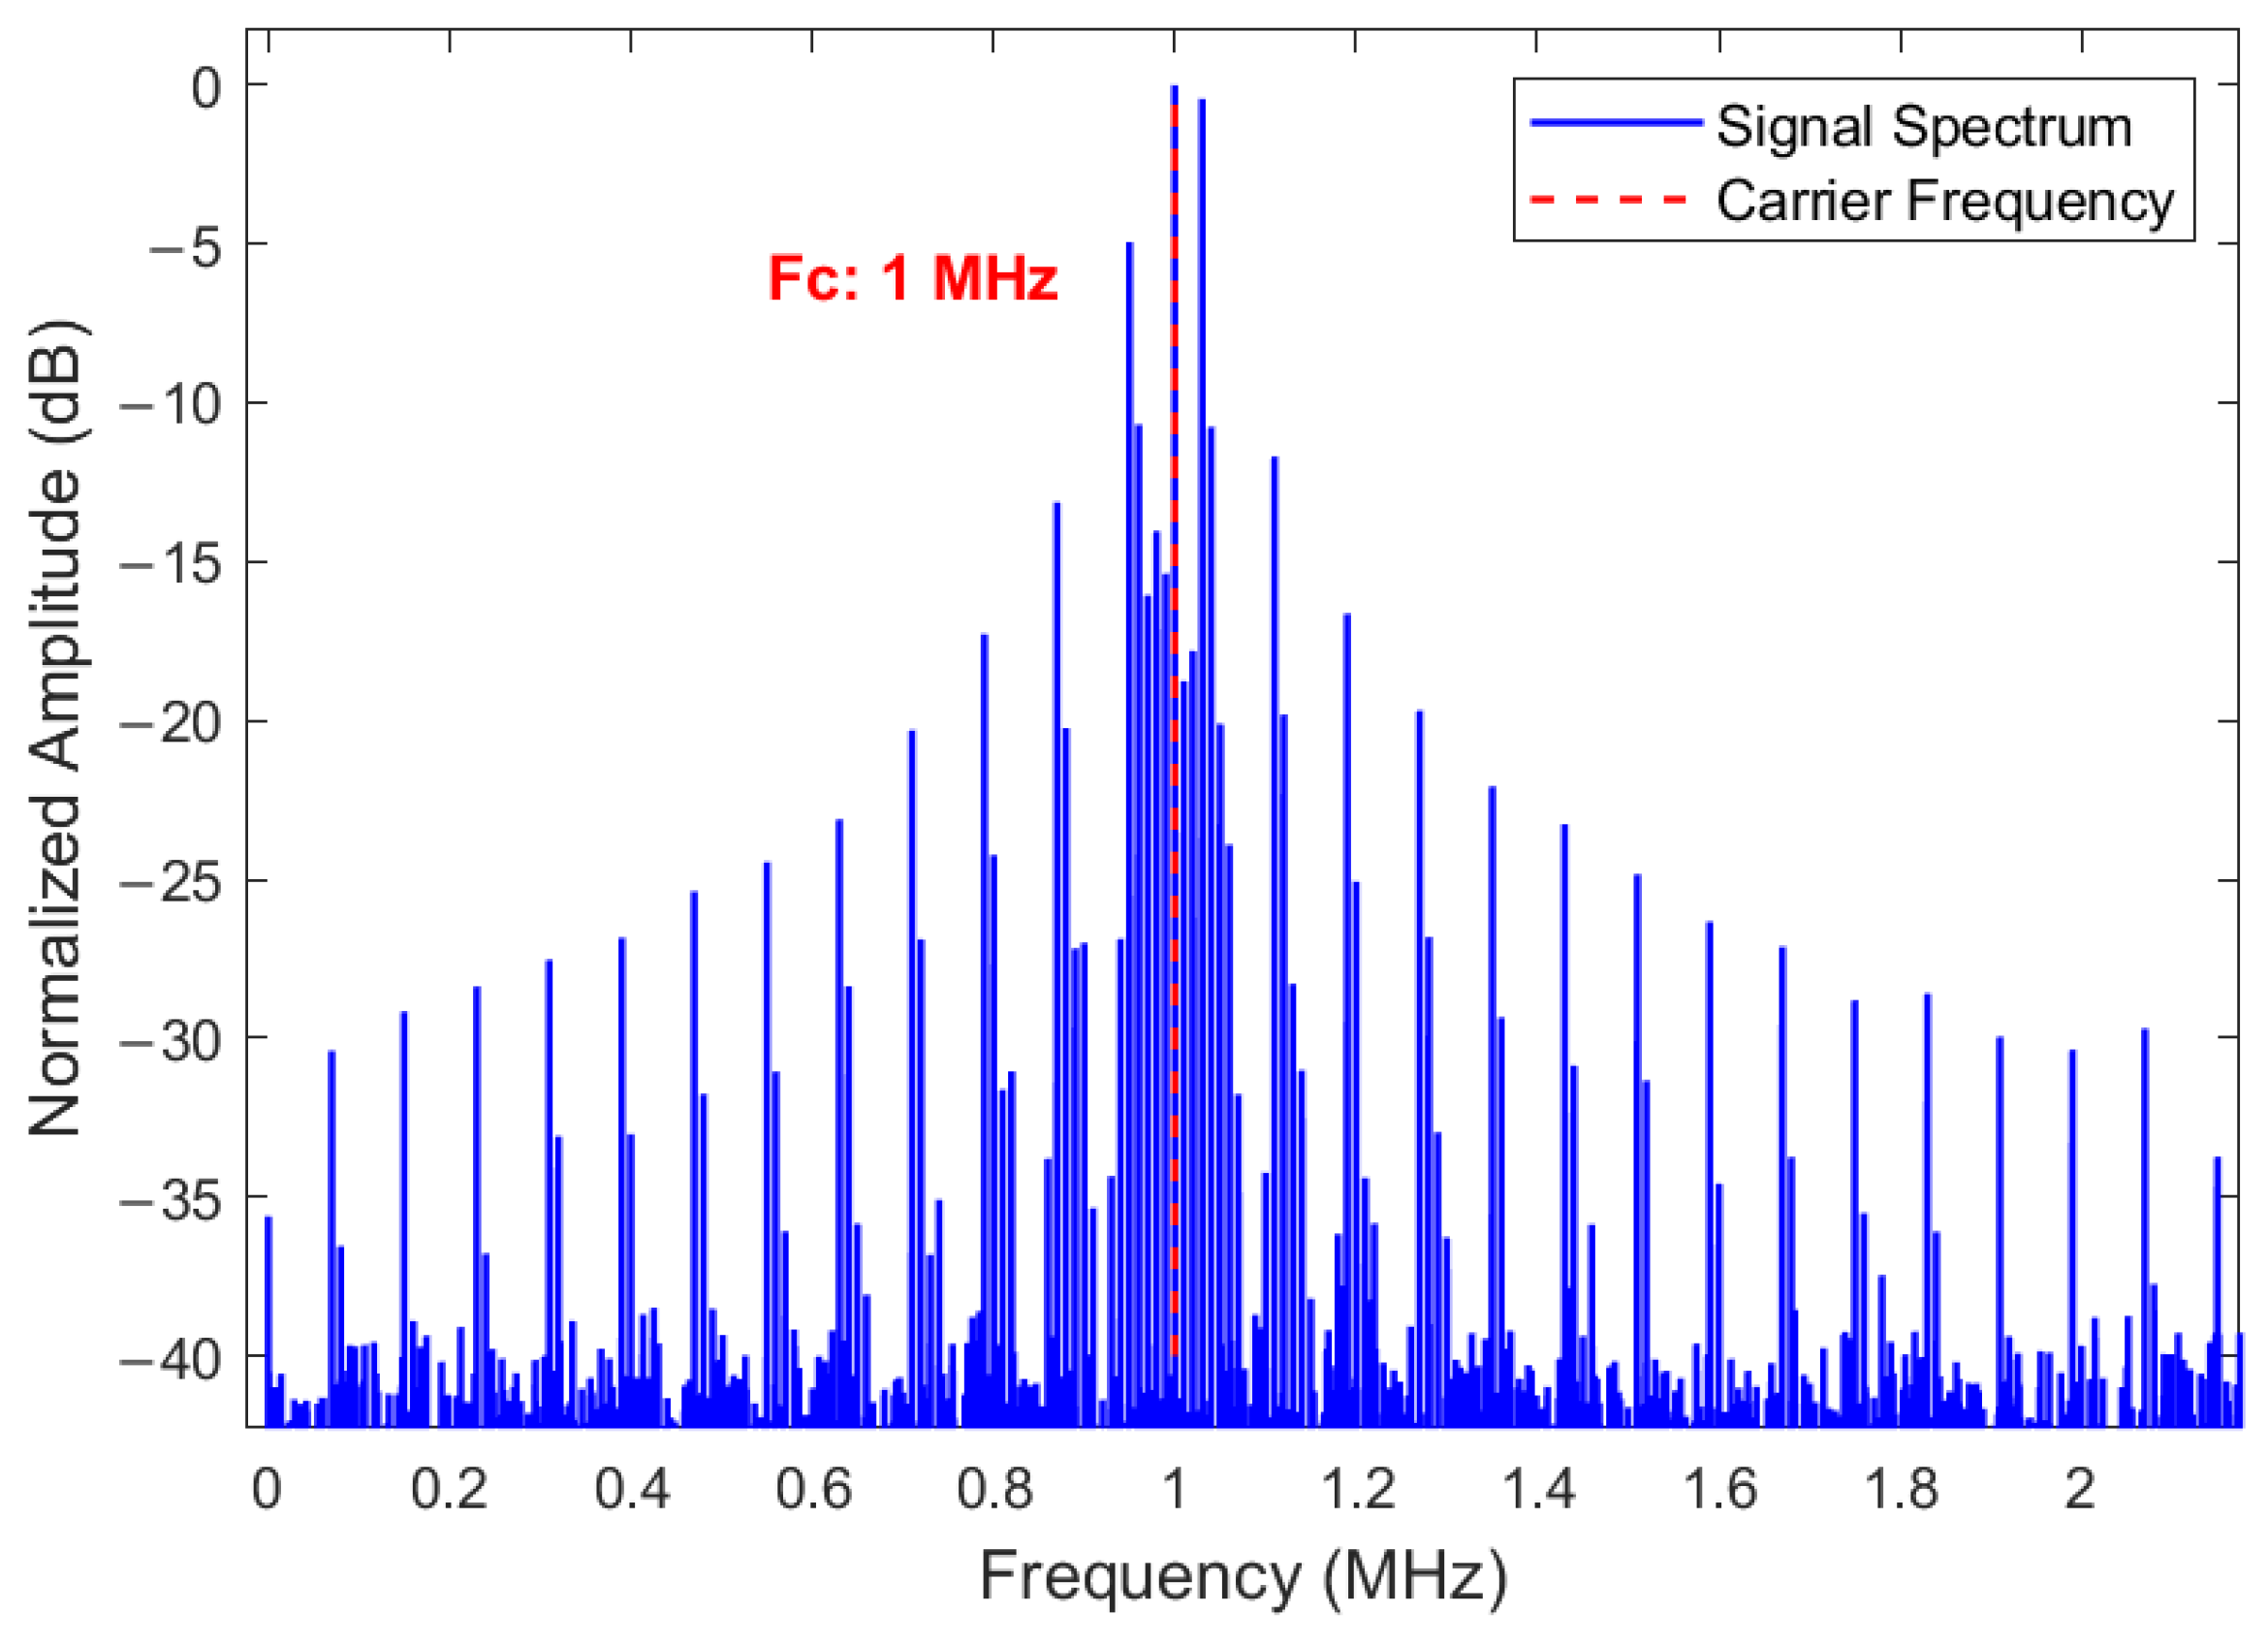
A Fast Fourier Transform (FFT) is employed on the received signal to obtain the spectrum, and the peaks of the spectrum are used to obtain the harmonic coefficients. Assume that the th harmonic component is , the equations can be derived as follows:
especially,
Figure 3 shows the normalized spatial spectrum of the received signal:
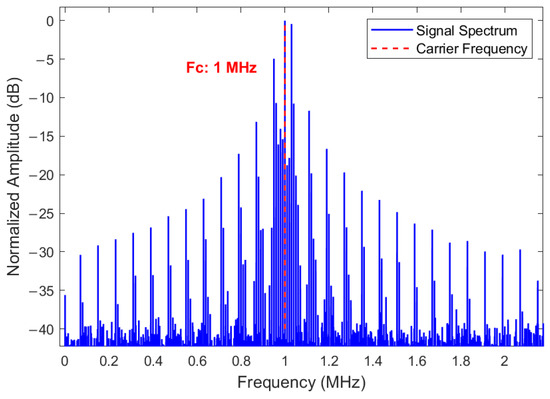
Figure 3.
Normalized spatial spectrum of the received signal.
This expands Equation (7) and limits the range of harmonic series from to , where is the number of harmonics at either end. In Equation (9), when extracting the harmonic components, in these conditions, Equations (7)–(9) can be expressed as follows:
where represents a order matrix. Given that possesses a generalized inverse matrix defined as , then the array manifold vector is quoted as
where is dictated by the space–time-coding modulation sequence implemented across the metasurface elements, and it is a matrix containing the harmonic coefficients of all orders. Assume that is denoted as
The array manifold vector is denoted as
is a vector of coefficients consisting of the th harmonic components; it is expressed as follows:
Then, based on the mathematical relationship, the equation can be written as follows:
where is the dictionary matrix consisting of the harmonic coefficients of each order for each grid angle under a predefined grid, with grid angles ranging from and a grid interval of , as follows:
especially,
is the sparse vector of the desired solution, i.e., the spatial spectrum, with non-zero elements only at the true source position as follows:
where is either “0” or “1”, with “1” indicating that the angle is in the direction of the incoming wave and “0” indicating the opposite.
3.2. Proposed Network
During the LISTA neural network training process with the dictionary matrix and conducting DOA estimation of the array manifold vector using the trained LISTA neural network, to reduce computational complexity, the dictionary matrix is reconfigured into a redundant dictionary matrix composed of its real and imaginary parts, which can be transformed as follows:
Here, and represent the real and imaginary operators, respectively. Similarly, the array manifold vector is expressed as follows:
Based on the manifold vector , is input into the LISTA network. The output is the spatial spectrum of the signal we calculate. Here, denotes the number of layers. The spatial spectrum is searched for spectral peaks, and the DOA estimate can be determined from the positions corresponding to the spectral peaks. Figure 4 shows the structure of the deep unfolded network.

Figure 4.
Schematic diagram of the deep unfolded network.
Here, the output of Layer 1 is
and the output of Layer is
where , denotes the total number of network layers. is the threshold parameter, denotes a nonlinear transformation function, which is expressed as
where denotes a symbolic function, and contains the symbols of every element of . denotes the Hadamard product.
The original ISTA uses predefined parameters , , , which are fixed at all layers. The network is initialized with the following parameters:
where represents the step size, denotes the maximum eigenvalue of , and is the unit matrix.
3.3. Network Training
The network parameters , , and update by using Stochastic Gradient Descent (SGD) during training. The optimized loss function is given by
where denotes the square of norm, and denotes norm. is the regularization parameter.
A key difference between deep unfolded networks and primitive model-driven algorithms is the training of the network parameters. By optimizing the network parameters, the network can achieve improved performance with fewer layers. In addition, the LISTA algorithm can automatically adjust the parameters based on the error due to the complexity and variability of real-world signal environments, thereby improving its adaptive capabilities. Moreover, after sufficient training, the deep unfolded network not only performs well on the data within the training set but also generalizes better to unseen data, which improves the robustness and reliability of the system.
Mini-batch training in deep learning can be used to increase efficiency, effectively utilize limited memory resources, and accelerate computation when training data are abundant. The mini-batch technique represents an optimization approach that partitions the training dataset into several smaller batches. This method accelerates convergence and improves generalization by integrating the advantages of full-batch training and SGD. Specifically, the data are randomly shuffled using a stochastic function and subsequently partitioned into small subsets, each containing samples. For each of them, the parameters are updated using the SGD method as follows:
where represents the set of learnable parameters , , is the total number of network layers, and the parameters are updated through training. is the output of layer with the th input . denotes the corresponding ideal spatial spectrum. is the mini-batch size, . is the learning rate.
After training, a set of optimized parameters is obtained, and DOA estimation can be achieved through spectral peak detection in its output spatial spectrum.
4. Simulation Results
In this section, the simulation results for DOA estimation using a deep unfolded LISTA network in a non-uniform metasurface are presented. Firstly, the learnable parameters are trained to optimize the network performance to its optimal level. Next, the trained unfolded LISTA network is analyzed and compared to the original ISTA algorithm in multiple dimensions, such as estimation accuracy, convergence rate, and generalization ability. Finally, the advantages of the proposed method are demonstrated through a comparative analysis with existing algorithms.
4.1. Details of Experiments
Assume that a far-field plane wave is incident on an 8 × 8 metasurface, and the elements are arranged non-uniformly. Directly above the center of the metasurface, the horn antenna was positioned at a height of . The modulation frequency and the sampling snapshots were configured at 800.
To simulate the complex conditions that may arise in real-world environments, we considered scenarios characterized by poor signal quality, subject to significant interference or attenuation. Accordingly, to represent an environment where it is difficult to accurately receive or detect the signal, the SNR of the input signal was set to −20 dB. This setting was chosen to fully evaluate the stability and reliability of the method under low SNR conditions.
In generating the training data, the spatial scope is uniformly divided into 121 grids with an interval of . For each sample, the number of signals , whose directions are generated by randomly sampling two different locations on these 121 grid points, and based on which the corresponding expectation spectrum is constructed, . The entire dataset contains a total of 5000 samples, of which 80% are used as training and the rest as validation. We build and train network models based on Pytorch deep learning framework. In the optimization strategy, the SGD optimization method is selected. To improve the computation efficiency, the learning rate is and the small sample batch size is .
The Mean Square Error (MSE) of the reconstructed spectrum is utilized as the evaluation metric, which is given by
where , is the output of the network, and is the real direction.
4.2. Determination of Parameters
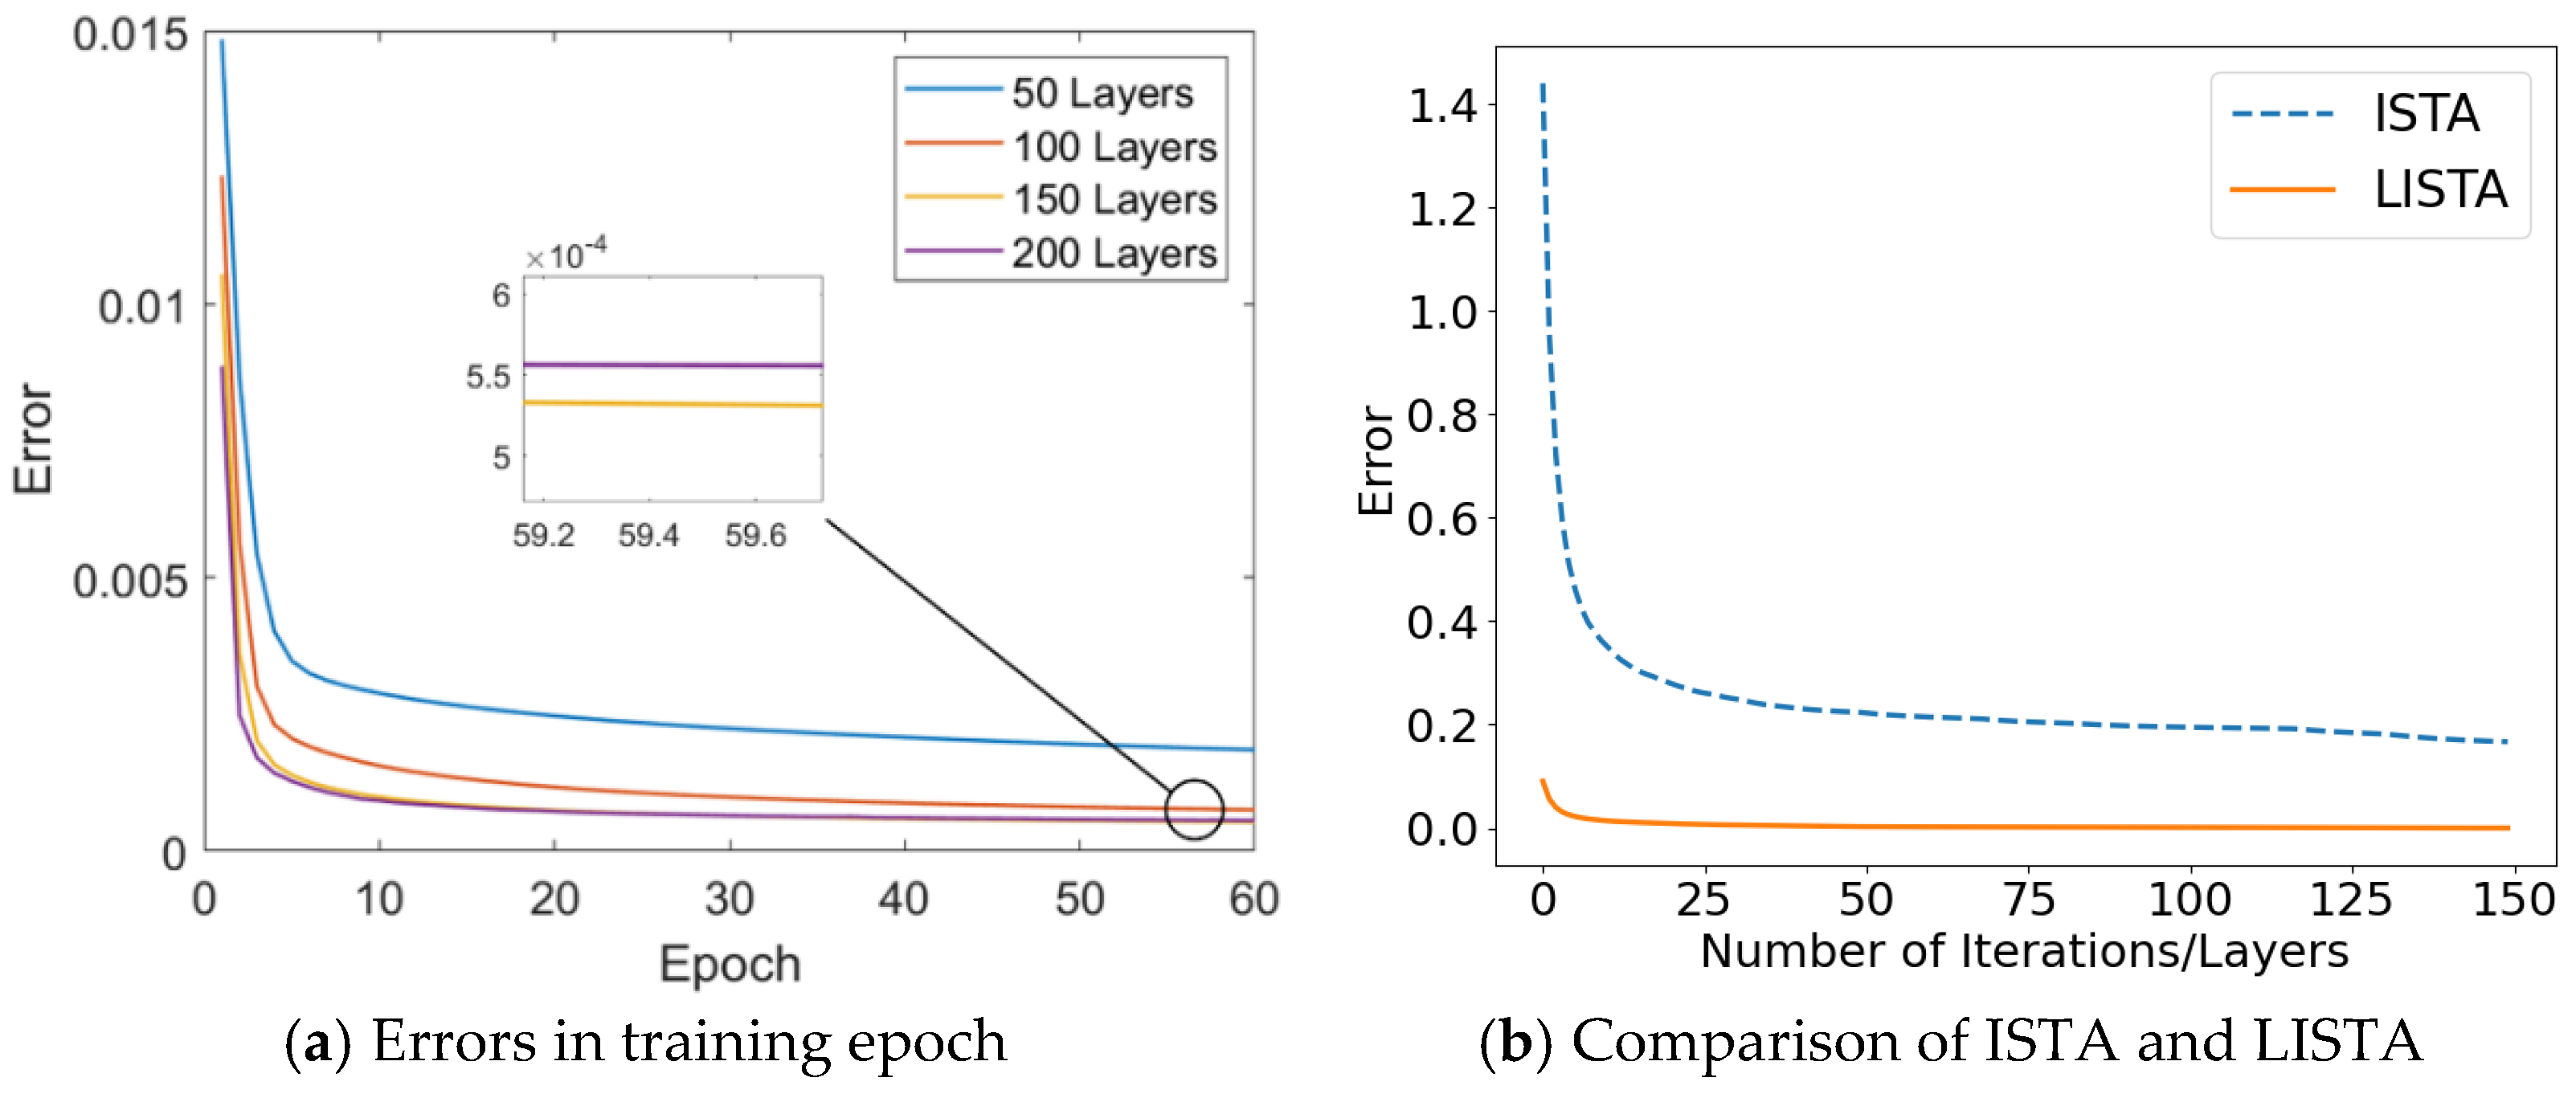
In choosing the appropriate network layers and training rounds , on the one hand, since too many training rounds can lead to overfitting, the optimal number of training epochs should be determined based on both training loss and validation loss values. On the other hand, increasing network layer numbers increases the training time, while fewer layers may lead to higher estimation errors.
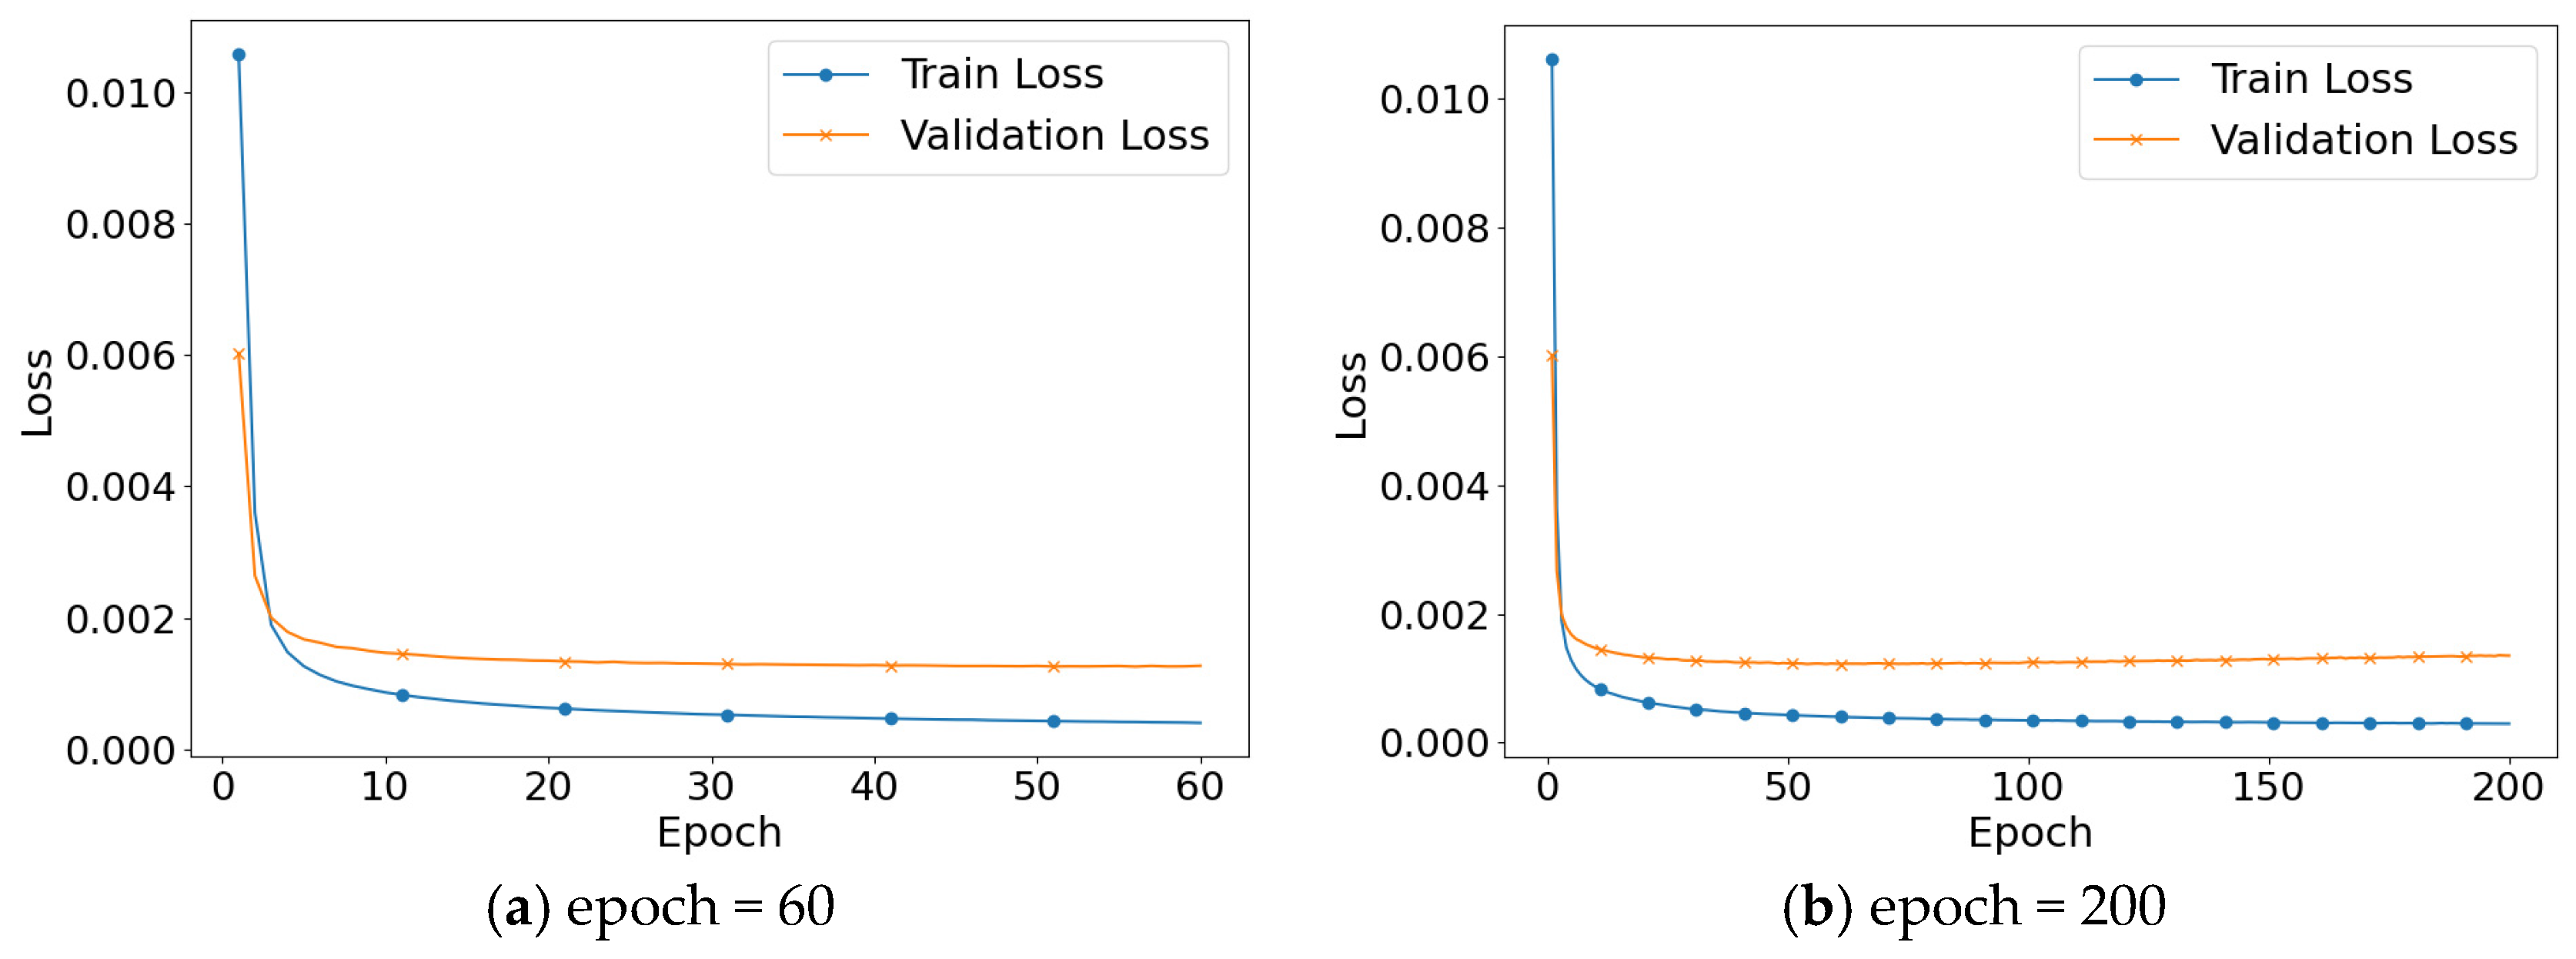
Figure 5 shows the loss change process in training and validation across epochs. In Figure 5a, both the training loss and validation loss decrease steadily as the model undergoes training, eventually leveling off after 60 epochs with reduced fluctuations. This suggests that the model is progressing along the correct optimization path. However, as shown in Figure 5b, the validation loss begins to increase when the number of epochs exceeds 60, indicating the onset of overfitting. At this stage, the model shows strong performance on the training data but its performance on unseen data starts to deteriorate. Based on the above analysis, was selected as the best number of training rounds.
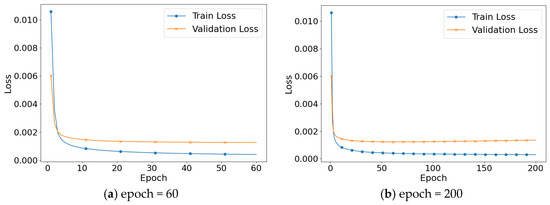
Figure 5.
Variation of training loss and validation loss.
Figure 6 illustrates the relationship between the number of network layers and the error. As the number of layers increases, the loss initially decreases. However, when the number of layers reaches 200, the error begins to rise, indicating overfitting. Based on the results shown in Figure 6a, a network with 150 layers is selected as the optimal configuration, striking a balance between model complexity and generalization ability. Figure 6b illustrates the correlation between the error and the number of iterations/layers. The figure demonstrates that the error associated with the trained LISTA algorithm is considerably lower than that of the ISTA algorithm. Compared with the ISTA algorithm, the LISTA algorithm is able to adjust the network parameters more efficiently through the introduction of a learning mechanism, thus achieving a lower error level within a smaller number of iterations, which further highlights its advantages in algorithm optimization and performance enhancement.
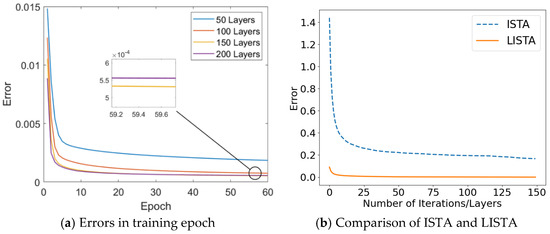
Figure 6.
DOA estimation performance with different layer numbers.
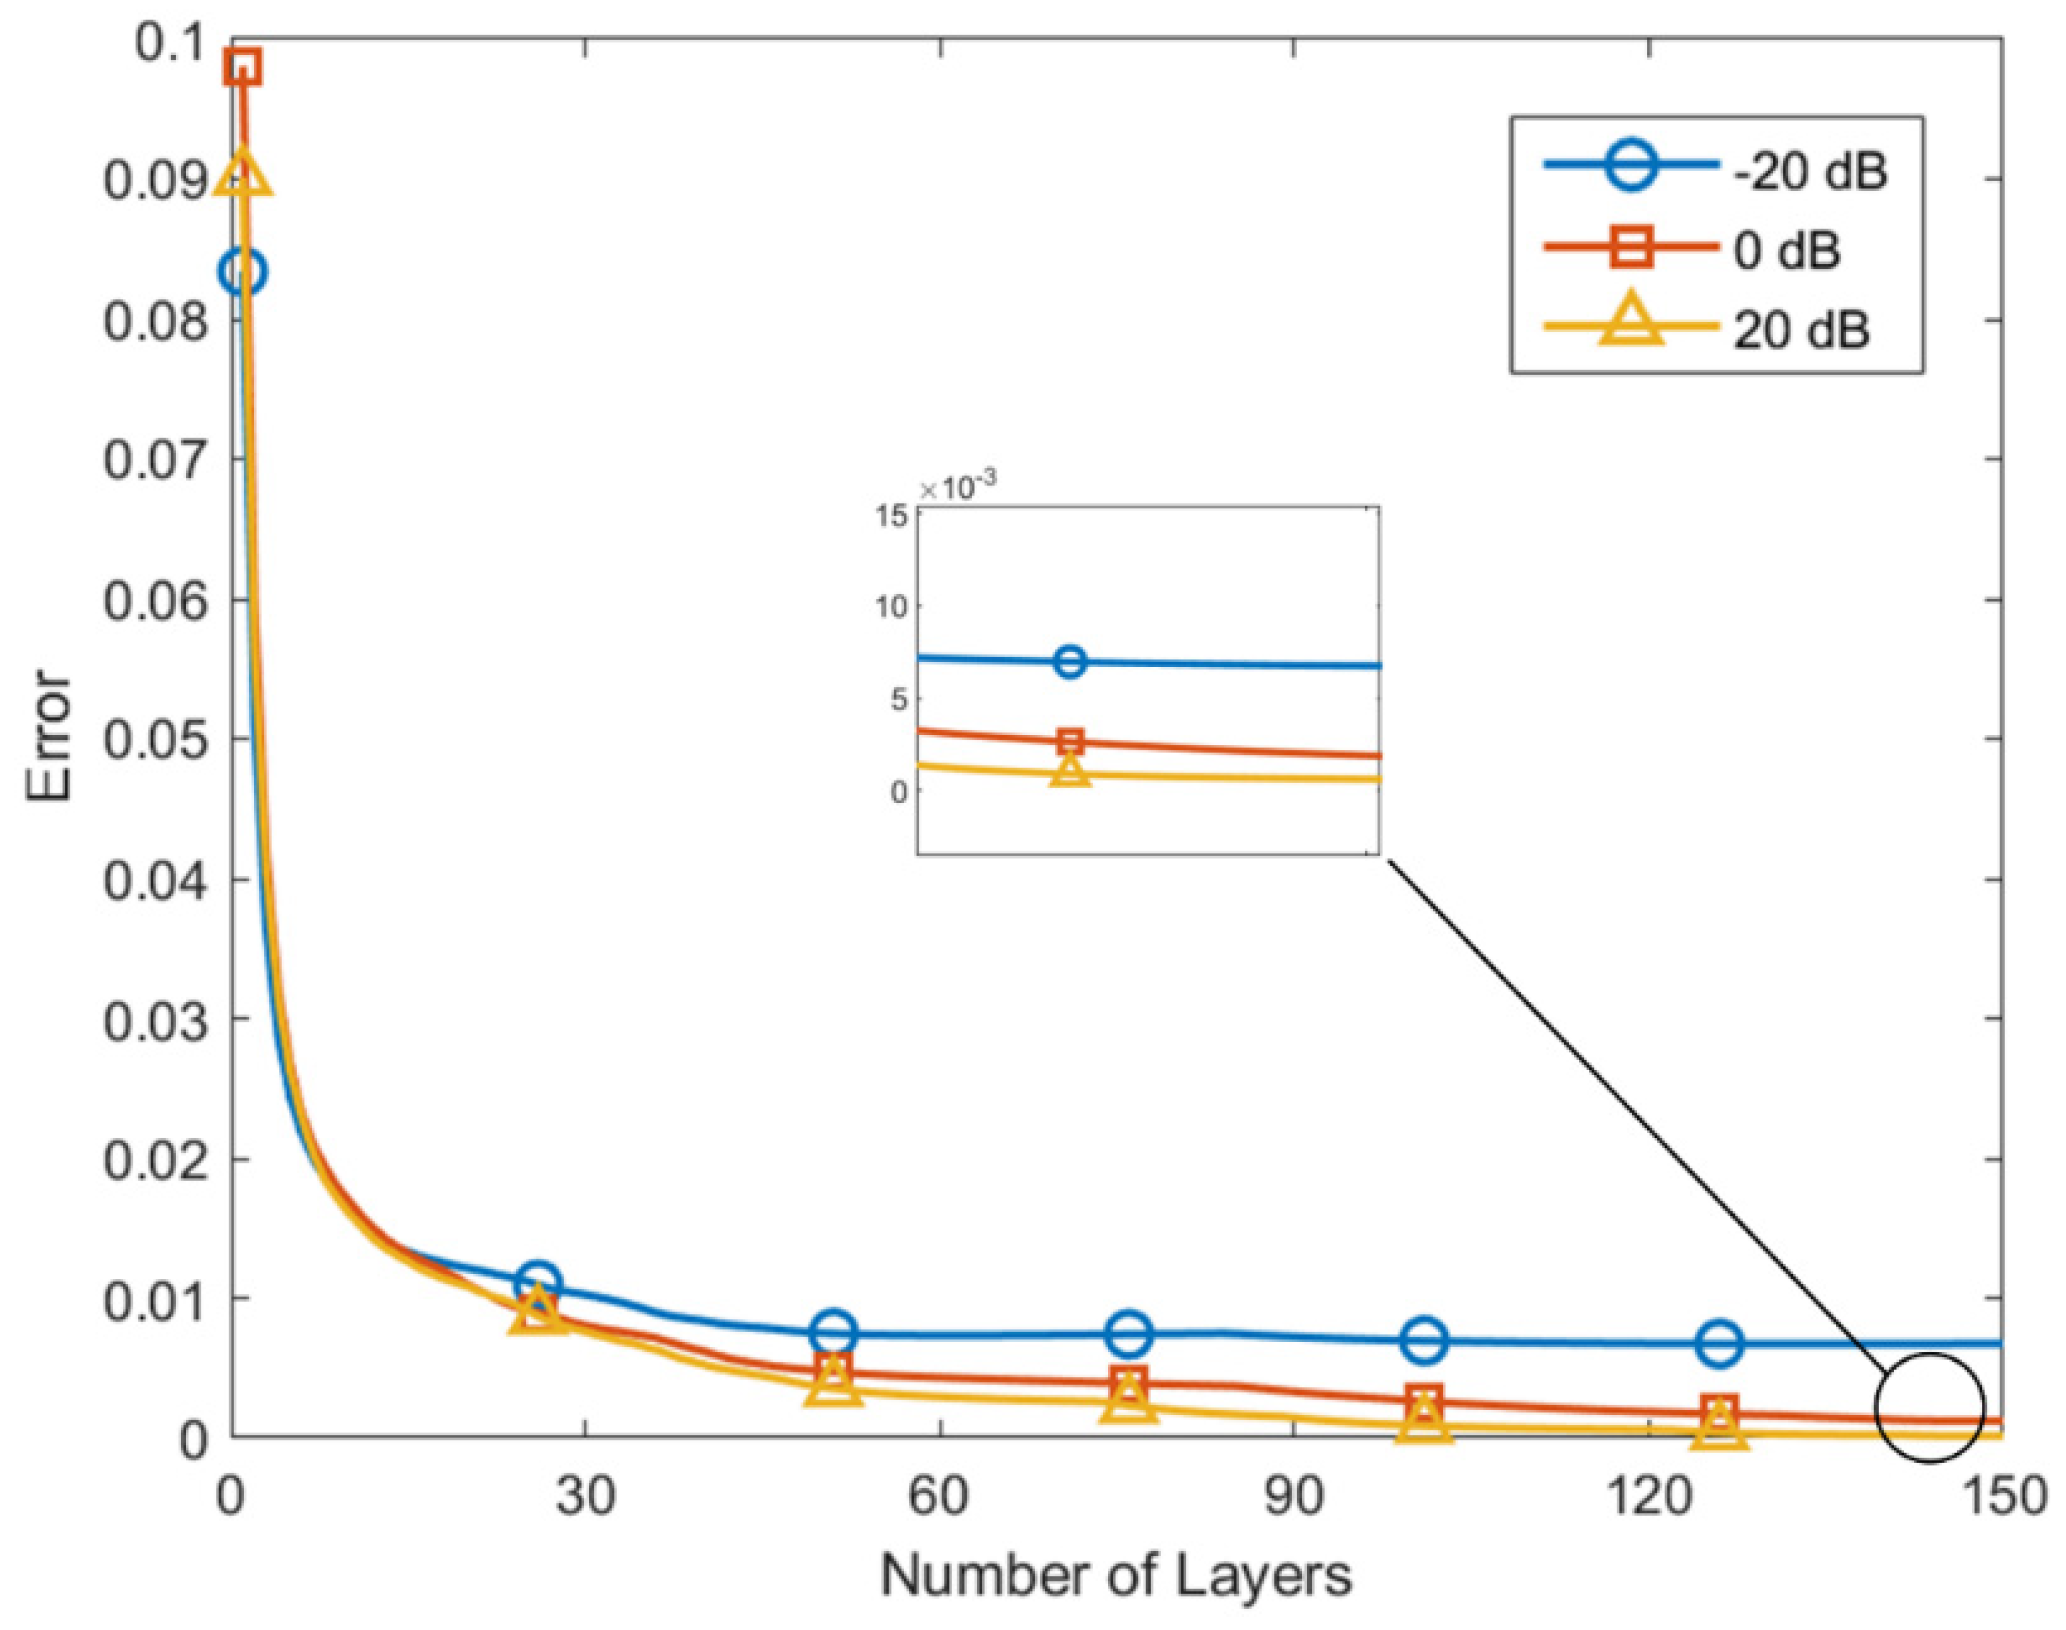
Figure 7 displays the relationship between the network layer numbers and the error for different SNRs. The effectiveness of the training process is strongly indicated by the observed decrease in loss with an increasing number of layers. Additionally, the error progressively reduces with an increase in SNR, which aligns with theoretical expectations.
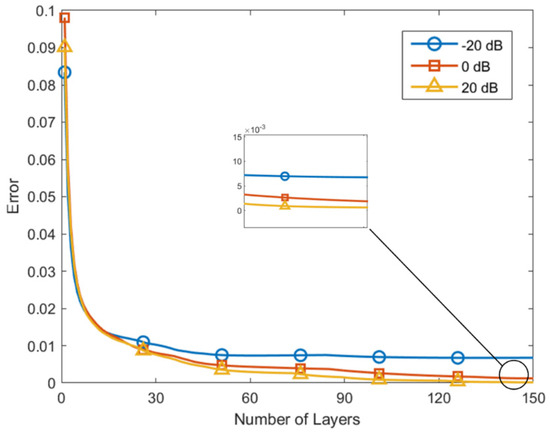
Figure 7.
DOA estimation performance with different layer numbers under various SNRs.
4.3. Determination of Hardware
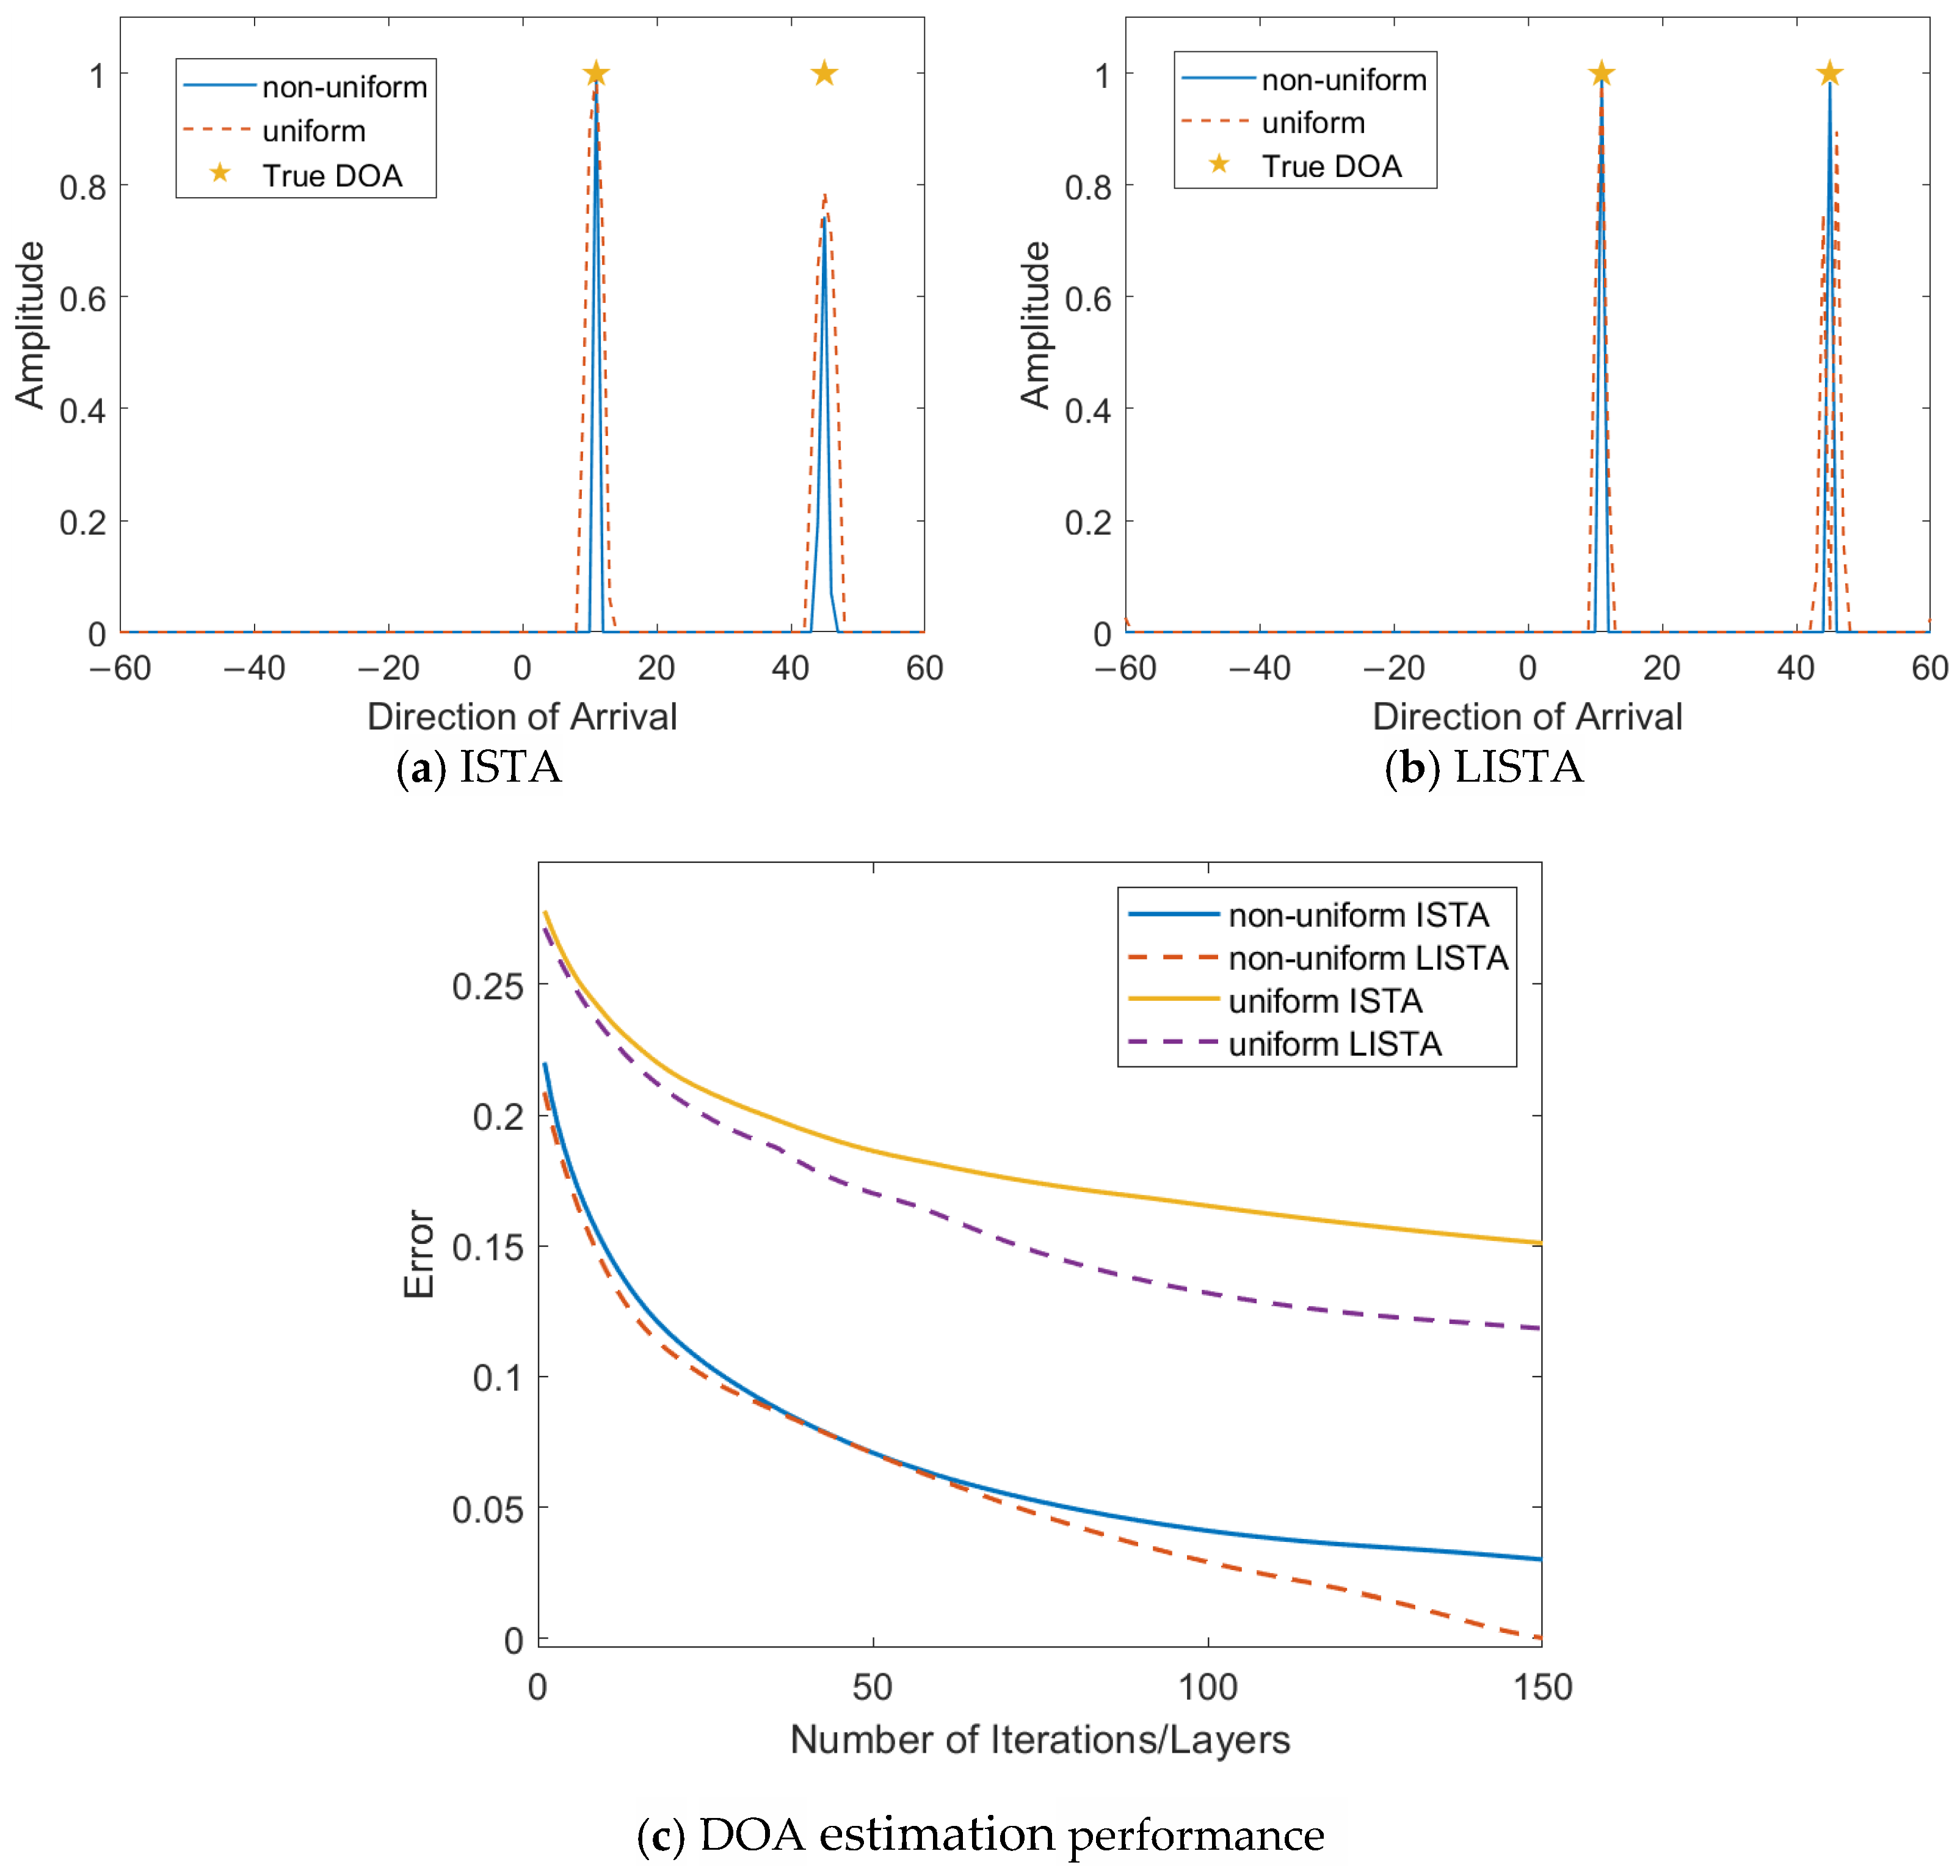
In terms of hardware design, the purpose of using a non-uniform metasurface array is to reduce the hardware cost and solve the problem of blurring when the element spacing is larger than half a wavelength. Figure 8 shows the DOA estimation performance of uniform and non-uniform metasurface elements for both the ISTA and LISTA algorithms. The simulation results show that the use of non-uniformly arranged metasurfaces can effectively improve the DOA estimation accuracy while balancing the cost.
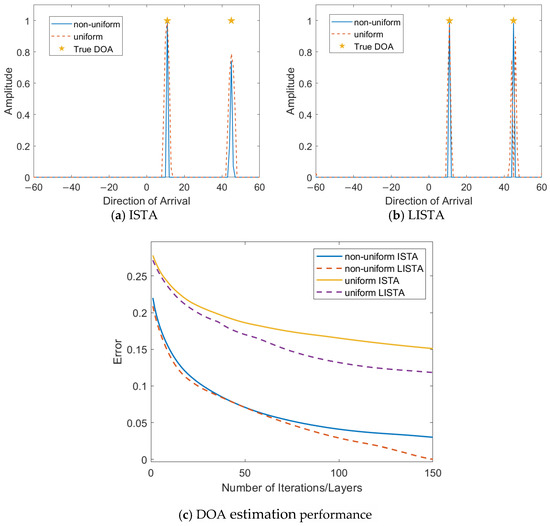
Figure 8.
Comparison of the uniform and non-uniform metasurfaces elements with ISTA and LISTA.
4.4. Performance Analysis
4.4.1. Validity Analysis
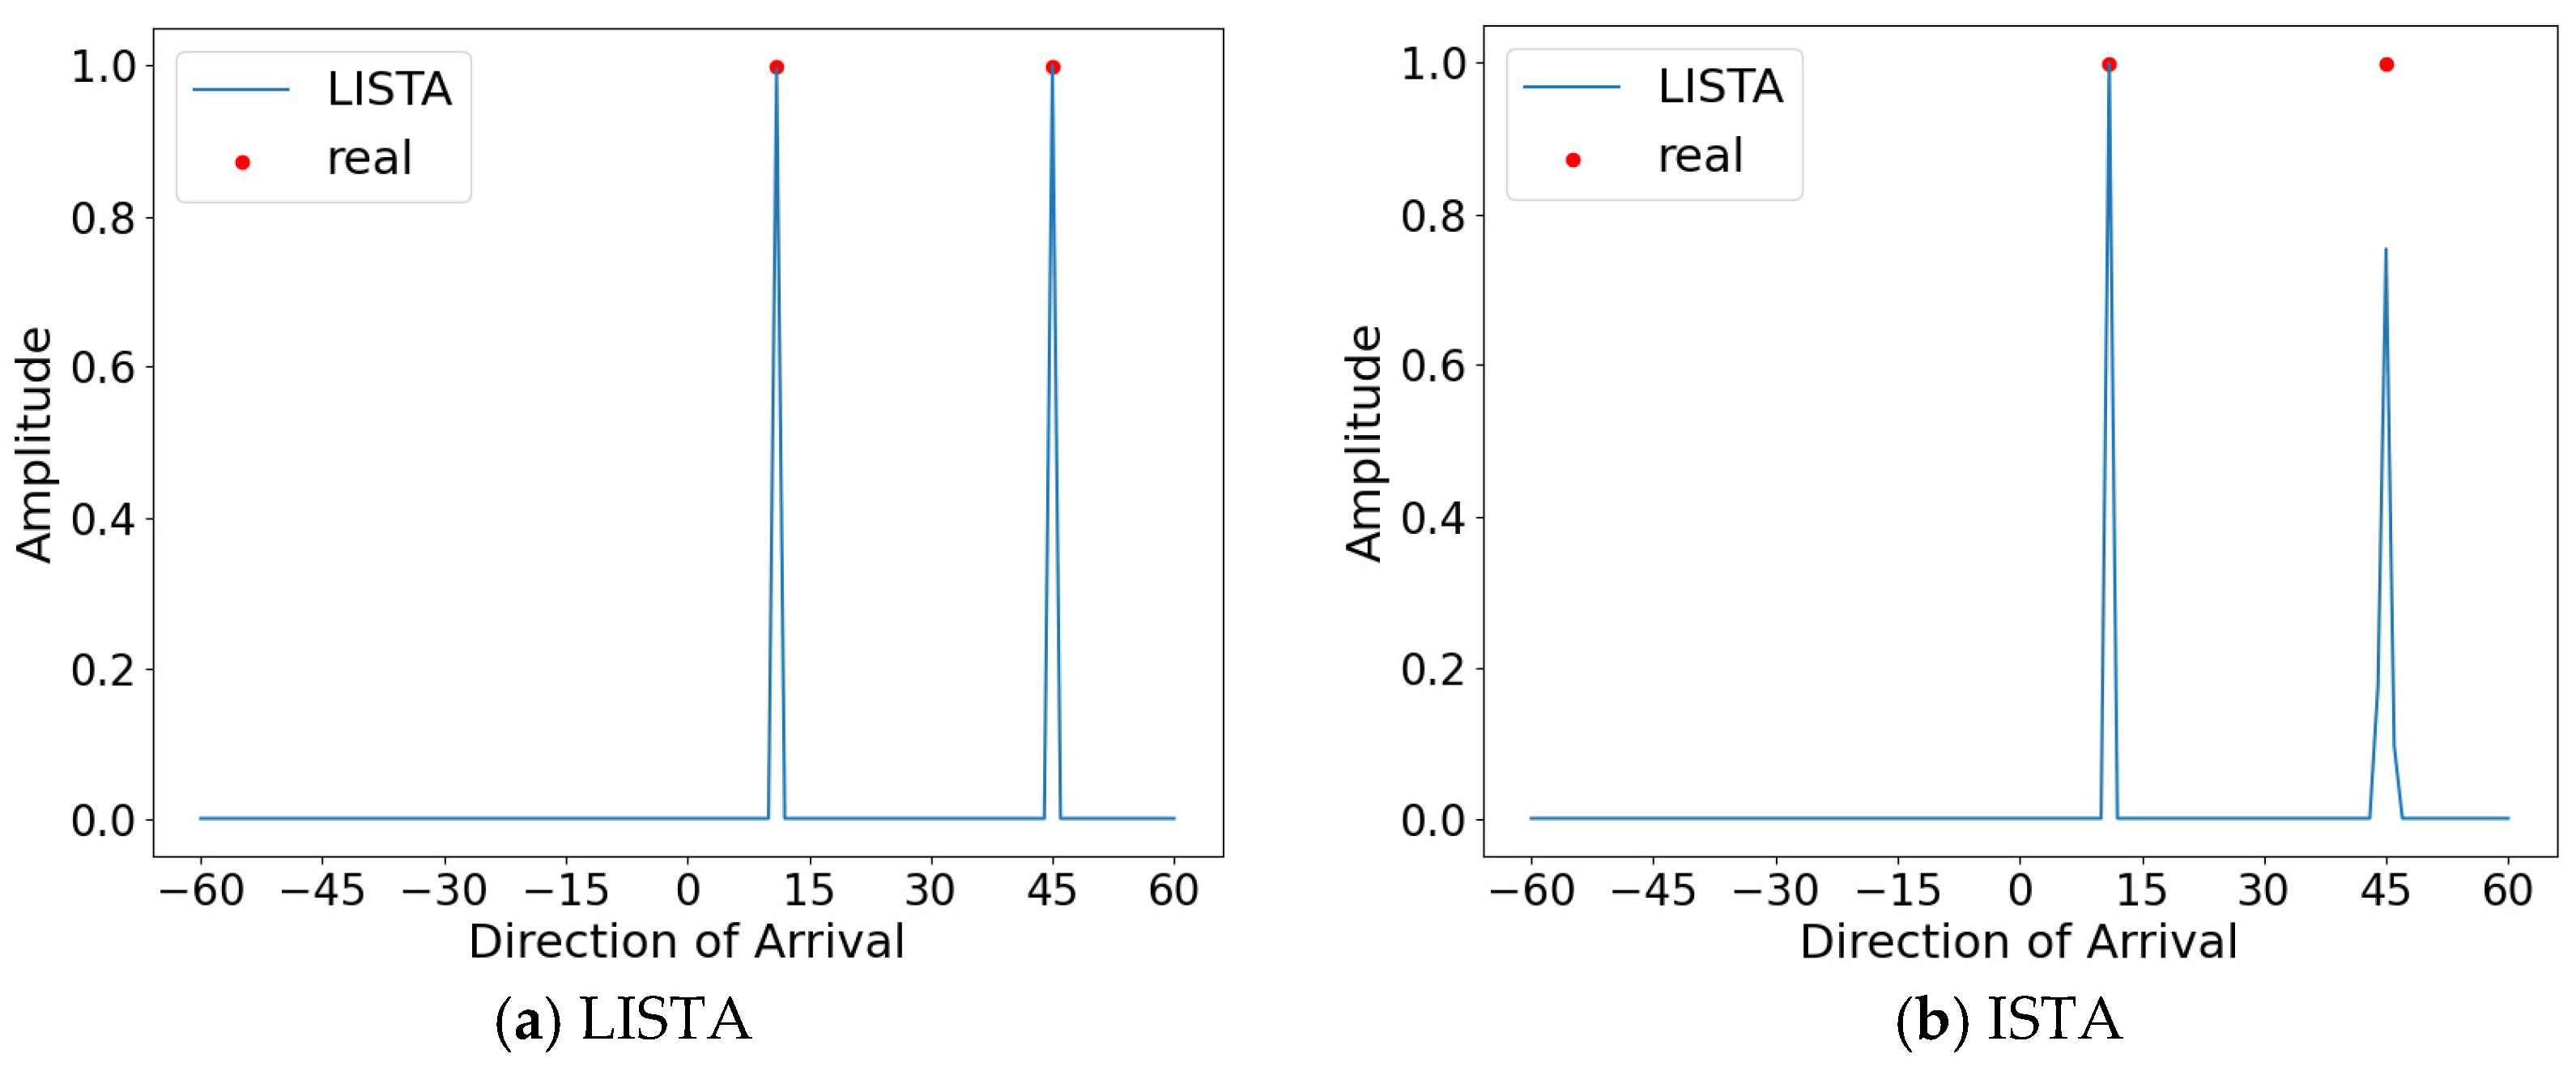
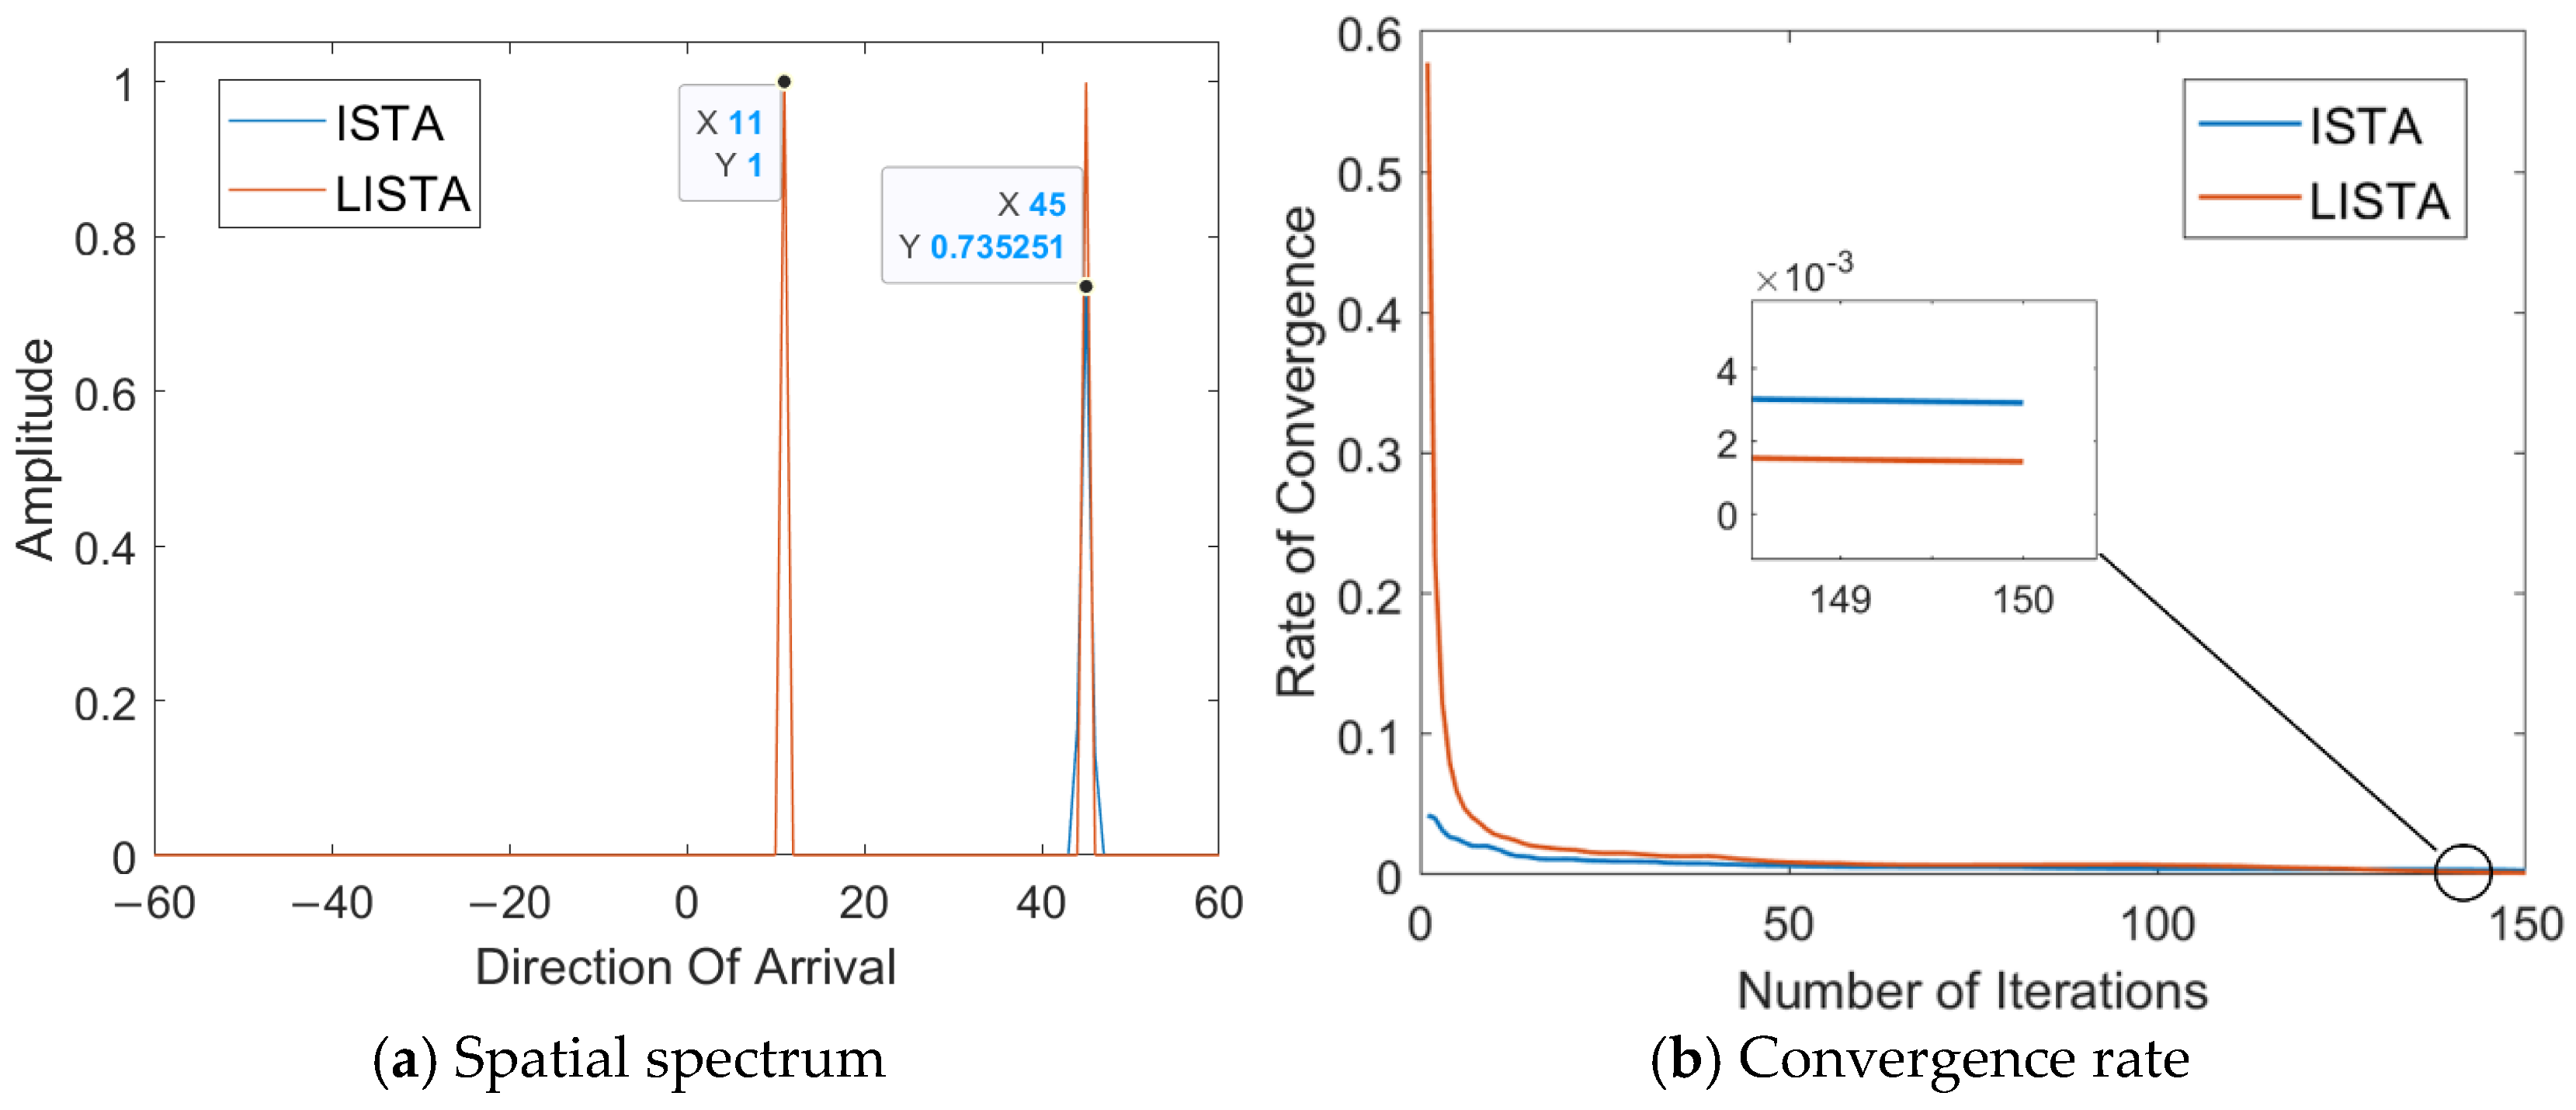
Based on the optimal parameters obtained above, the performance comparison of the LISTA and ISTA algorithms for the DOA estimation is displayed in Figure 9. The angles are set at 45° and 11°. By utilizing a well-trained LISTA network for estimation, we are able to accurately determine the azimuth of the received signal. Compared to the ISTA algorithm, which exhibits pseudo-peaks, the corresponding angles of the spectral peaks of the spatial spectrum output by the LISTA algorithm enable the accurate estimation of DOA.
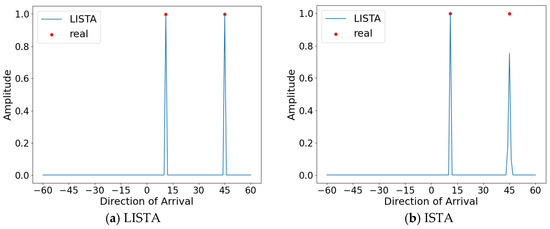
Figure 9.
Angles set at 11° and 45°.
4.4.2. Convergence Rate Analysis
Substituting the network parameters , , obtained under the optimal number of training rounds and network layers into the iteration step of the ISTA algorithm, Figure 10a shows the spatial spectra of the DOA direction computed using both the original ISTA parameters and the optimized parameters trained by the LISTA network, with the same number of iterations. Obviously, DOA estimation derived from LISTA network parameters is more accurate. Figure 10b shows the convergence rate of both methods during the iteration process. It can be seen that the LISTA algorithm achieves faster convergence. Thus, compared to the ISTA method, the LISTA algorithm improves both the accuracy and convergence rate, requiring fewer iterations to yield superior results.
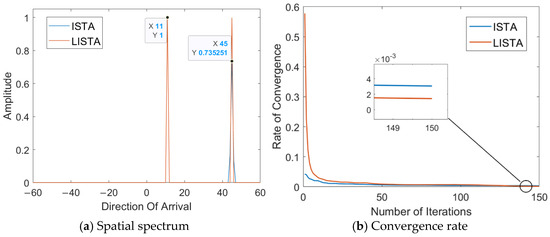
Figure 10.
Comparison of the LISTA and ISTA algorithms.
4.4.3. Generalization Capability Analysis
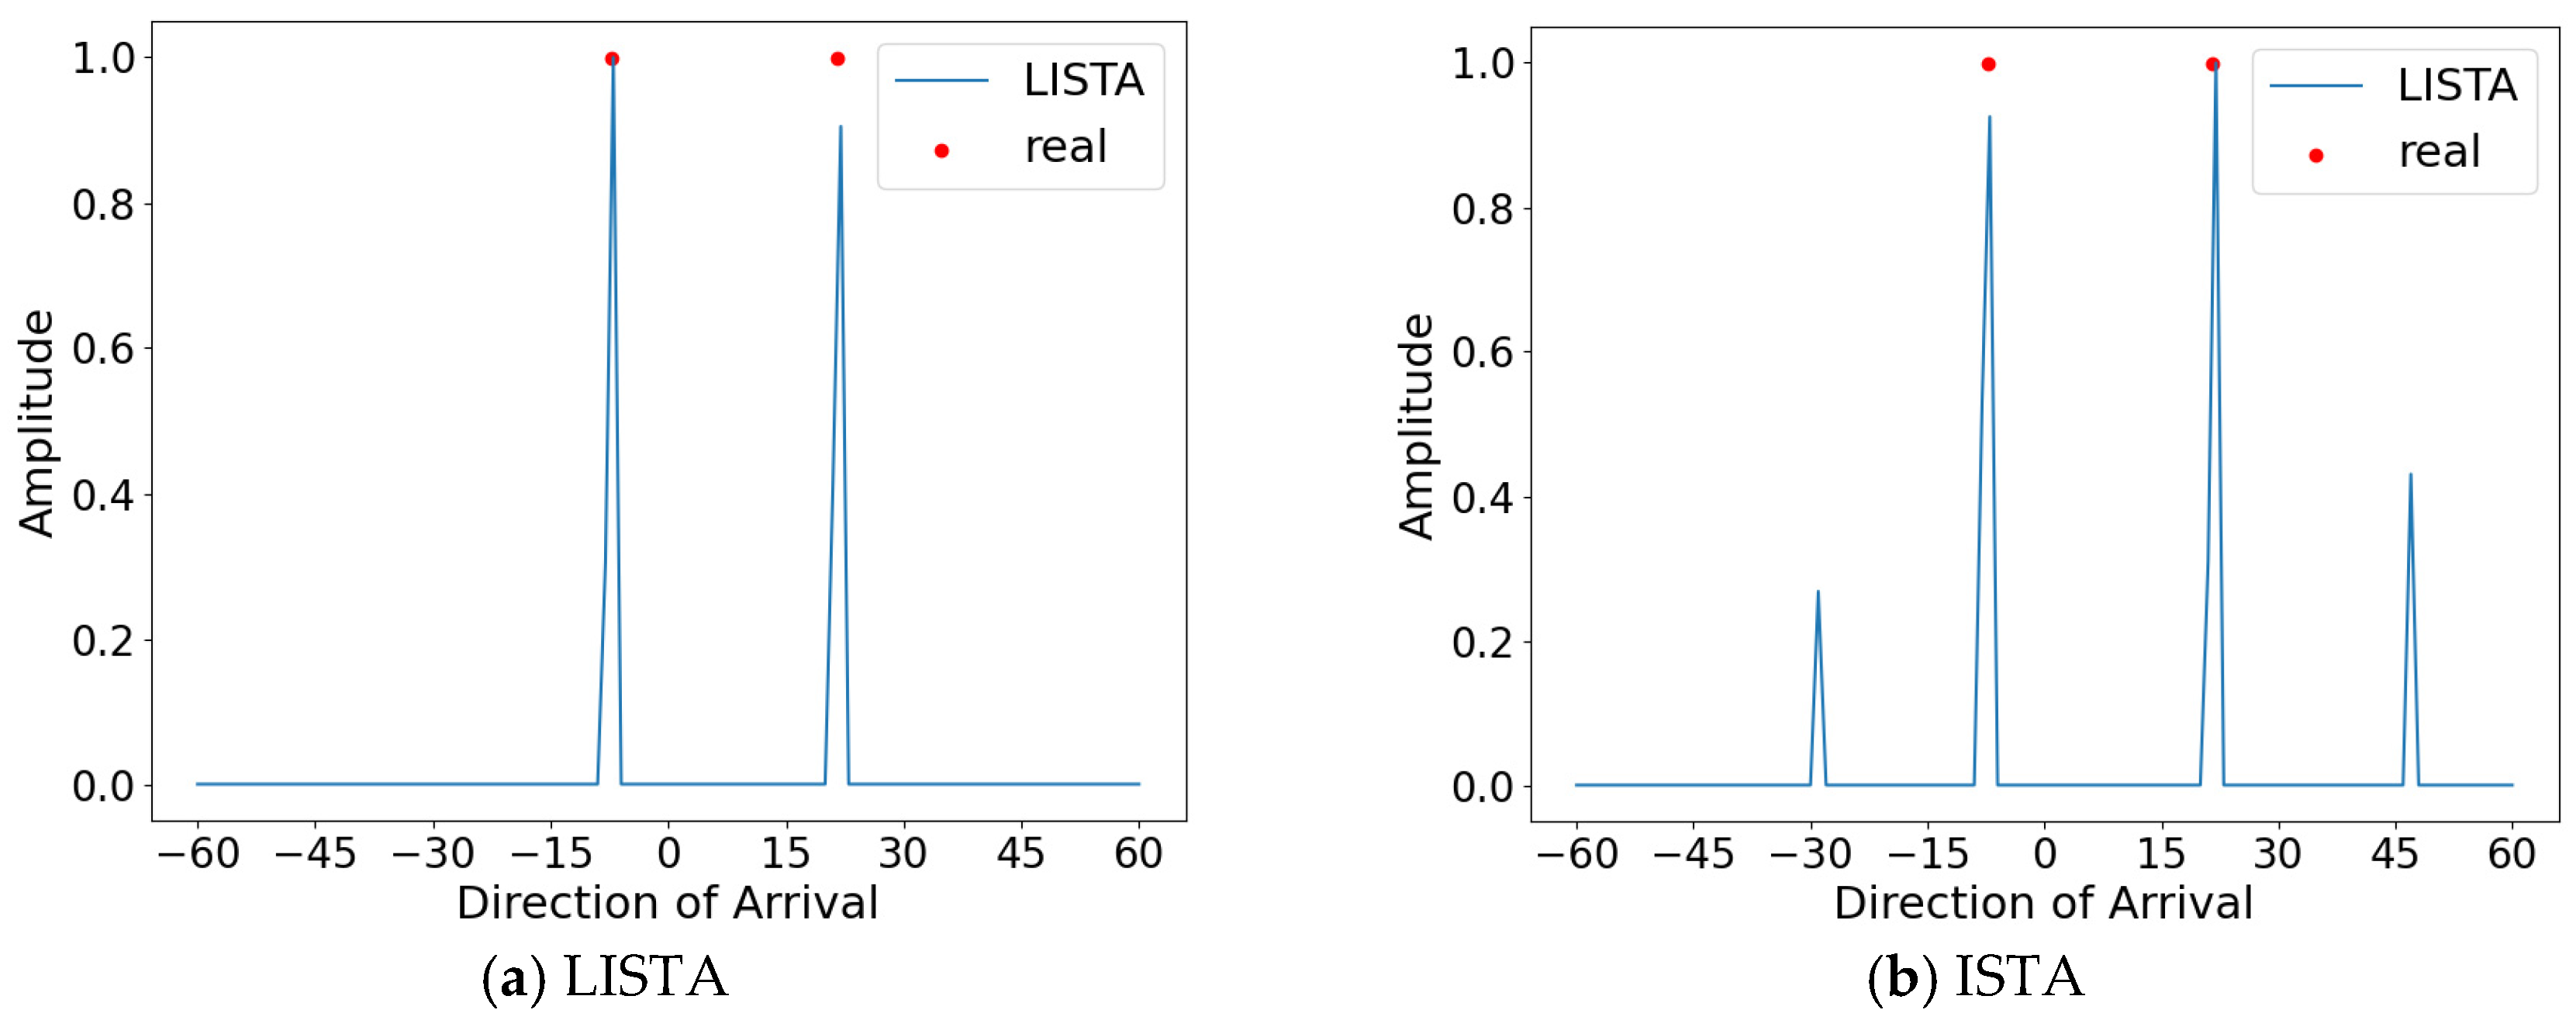
As shown in Figure 11, the spatial spectrum of the DOA direction obtained by estimating the untrained off-grid angles of −7.2° and 21.6° using the LISTA network is plotted. This shows that the proposed method is effective in estimating the off-grid angles and the degree of generalization ability.
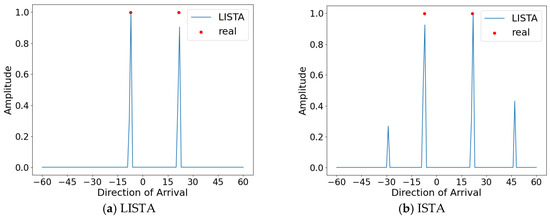
Figure 11.
Angles set at −7.2° and 21.6°.
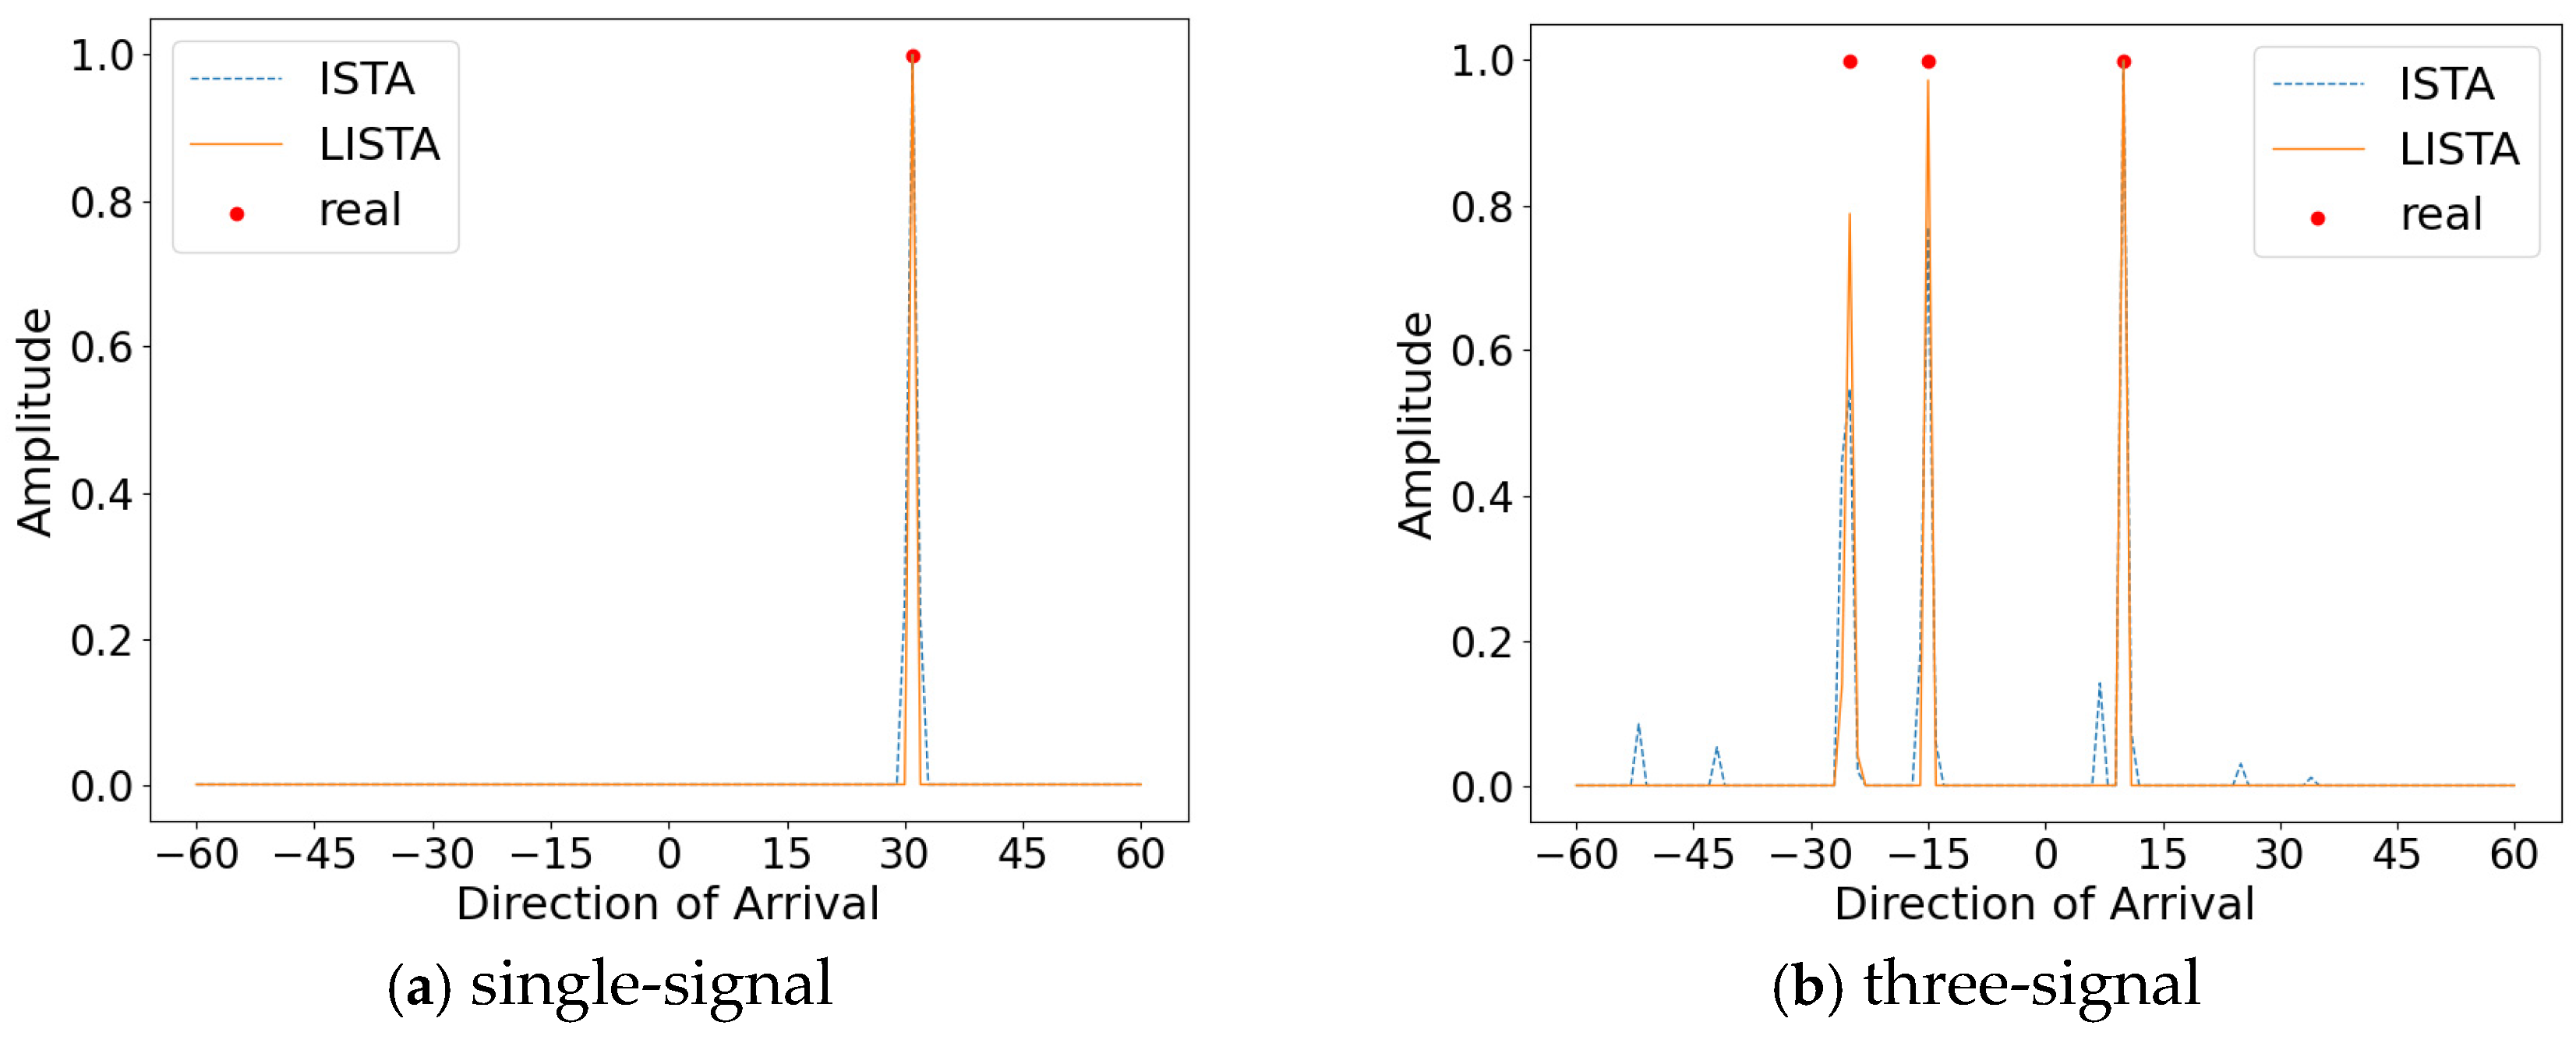
As shown in Figure 12, when limiting the number of training signals to one or three, the LISTA algorithm is still able to accurately reconstruct the spatial spectra for both single-signal and three-signal incident scenarios. This demonstrates that the method exhibits a certain degree of generalization ability with respect to the number of signals, thereby enhancing its flexibility for practical applications.
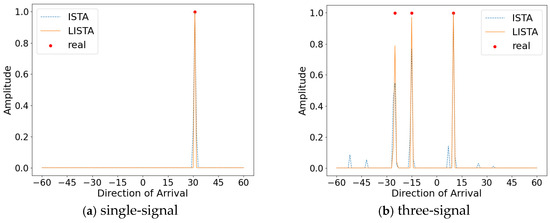
Figure 12.
Inconsistent number of trains and tests.
4.5. Estimated Accuracy Comparison
To explore the advantages of the LISTA network, a comparison is made with the ISTA, MUSIC, and L1-SVD algorithms. To quantify the accuracy of these algorithms in DOA estimating, we use the following formula as a performance evaluation metric:
To improve reliability, we set the experiment count at .
4.5.1. Performance Analysis Under Different SNRs
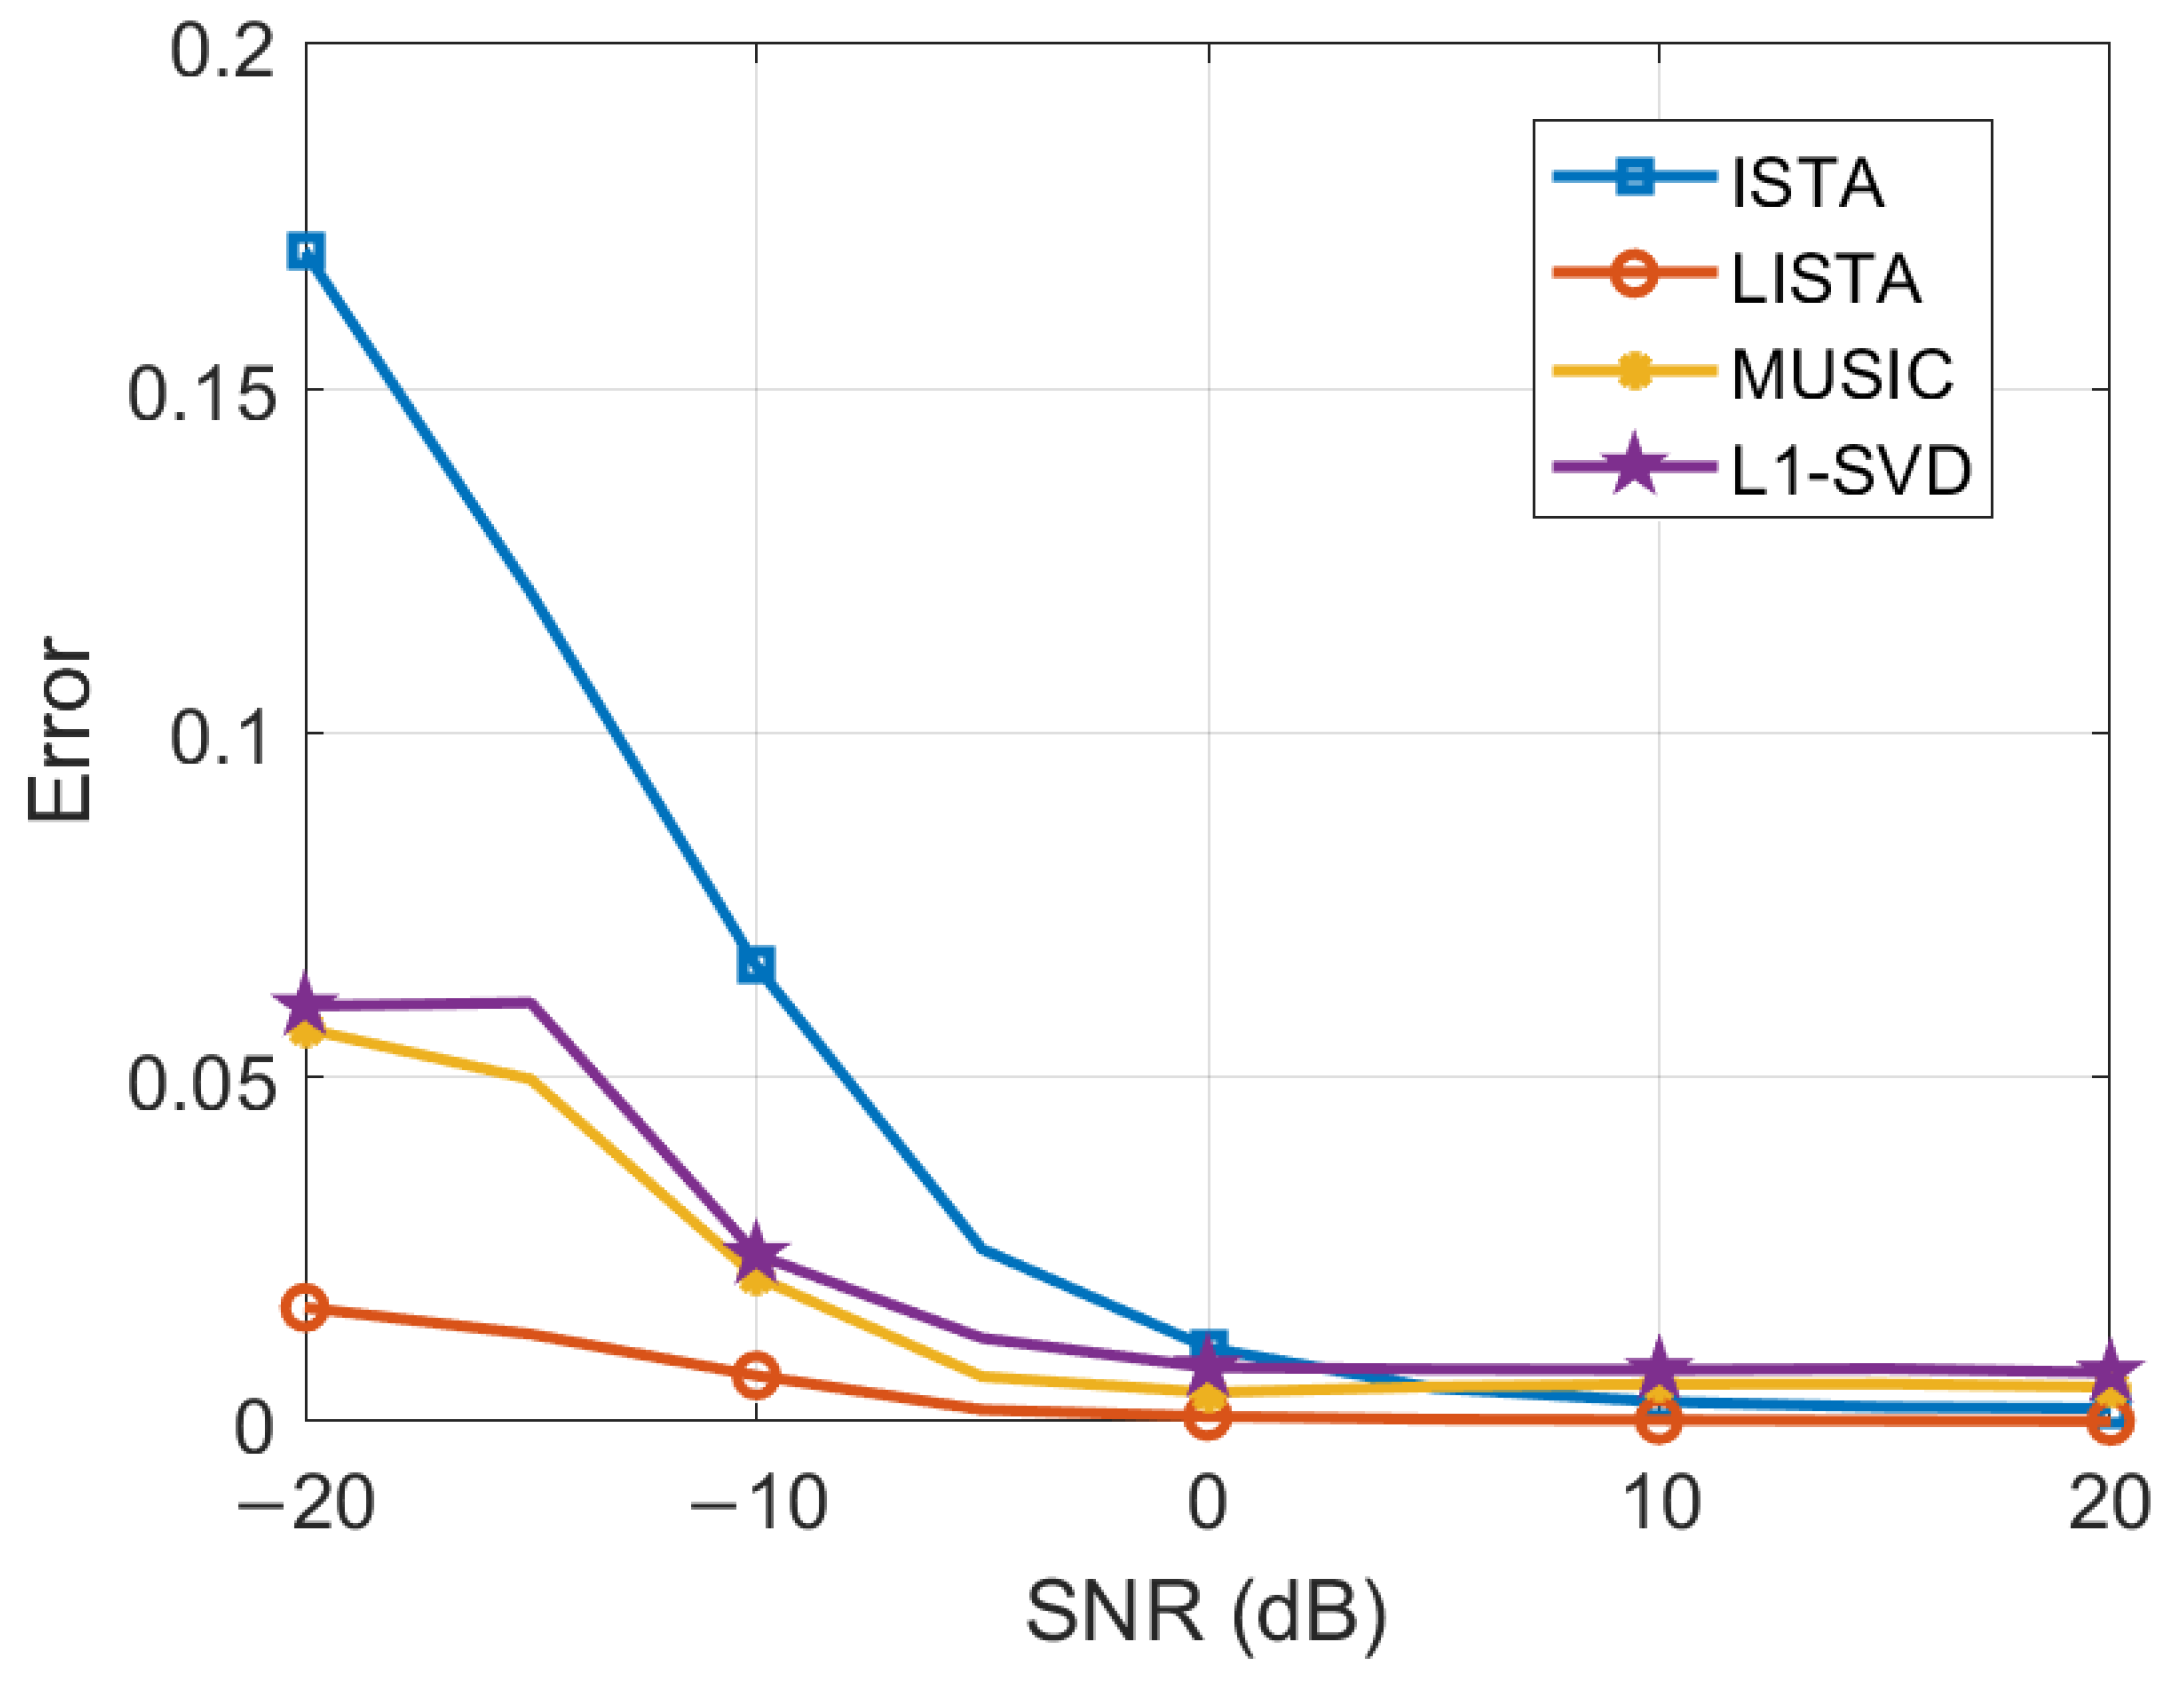
In the experiment, with all other parameters held constant, the SNR conditions are varied from −20 dB to 20 dB in 10 dB increments. As illustrated in Figure 13, the error gradually decreases and eventually stabilizes as the SNR increases, suggesting that a higher SNR significantly enhances the DOA estimation performance.
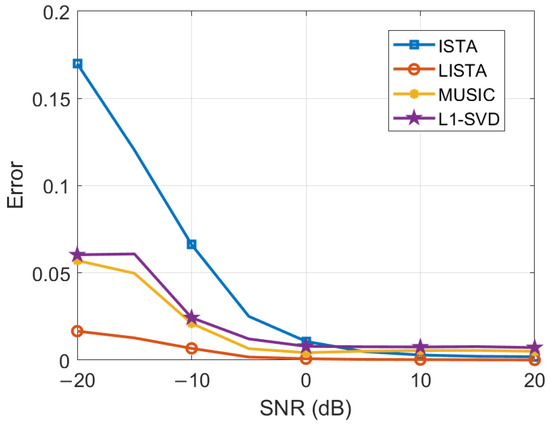
Figure 13.
DOA estimation performance of different SNRs.
As shown in Figure 13, the LISTA algorithm consistently outperforms the other algorithms under the given SNR conditions. In particular, the LISTA algorithm exhibits significantly lower error at lower SNRs compared to the other algorithms, demonstrating its superior reliability in challenging low-SNR environments. This highlights the robustness of the LISTA algorithm, which can maintain high accuracy even when the quality of the signal is degraded by noise.
4.5.2. Performance Analysis Under Different Snapshots
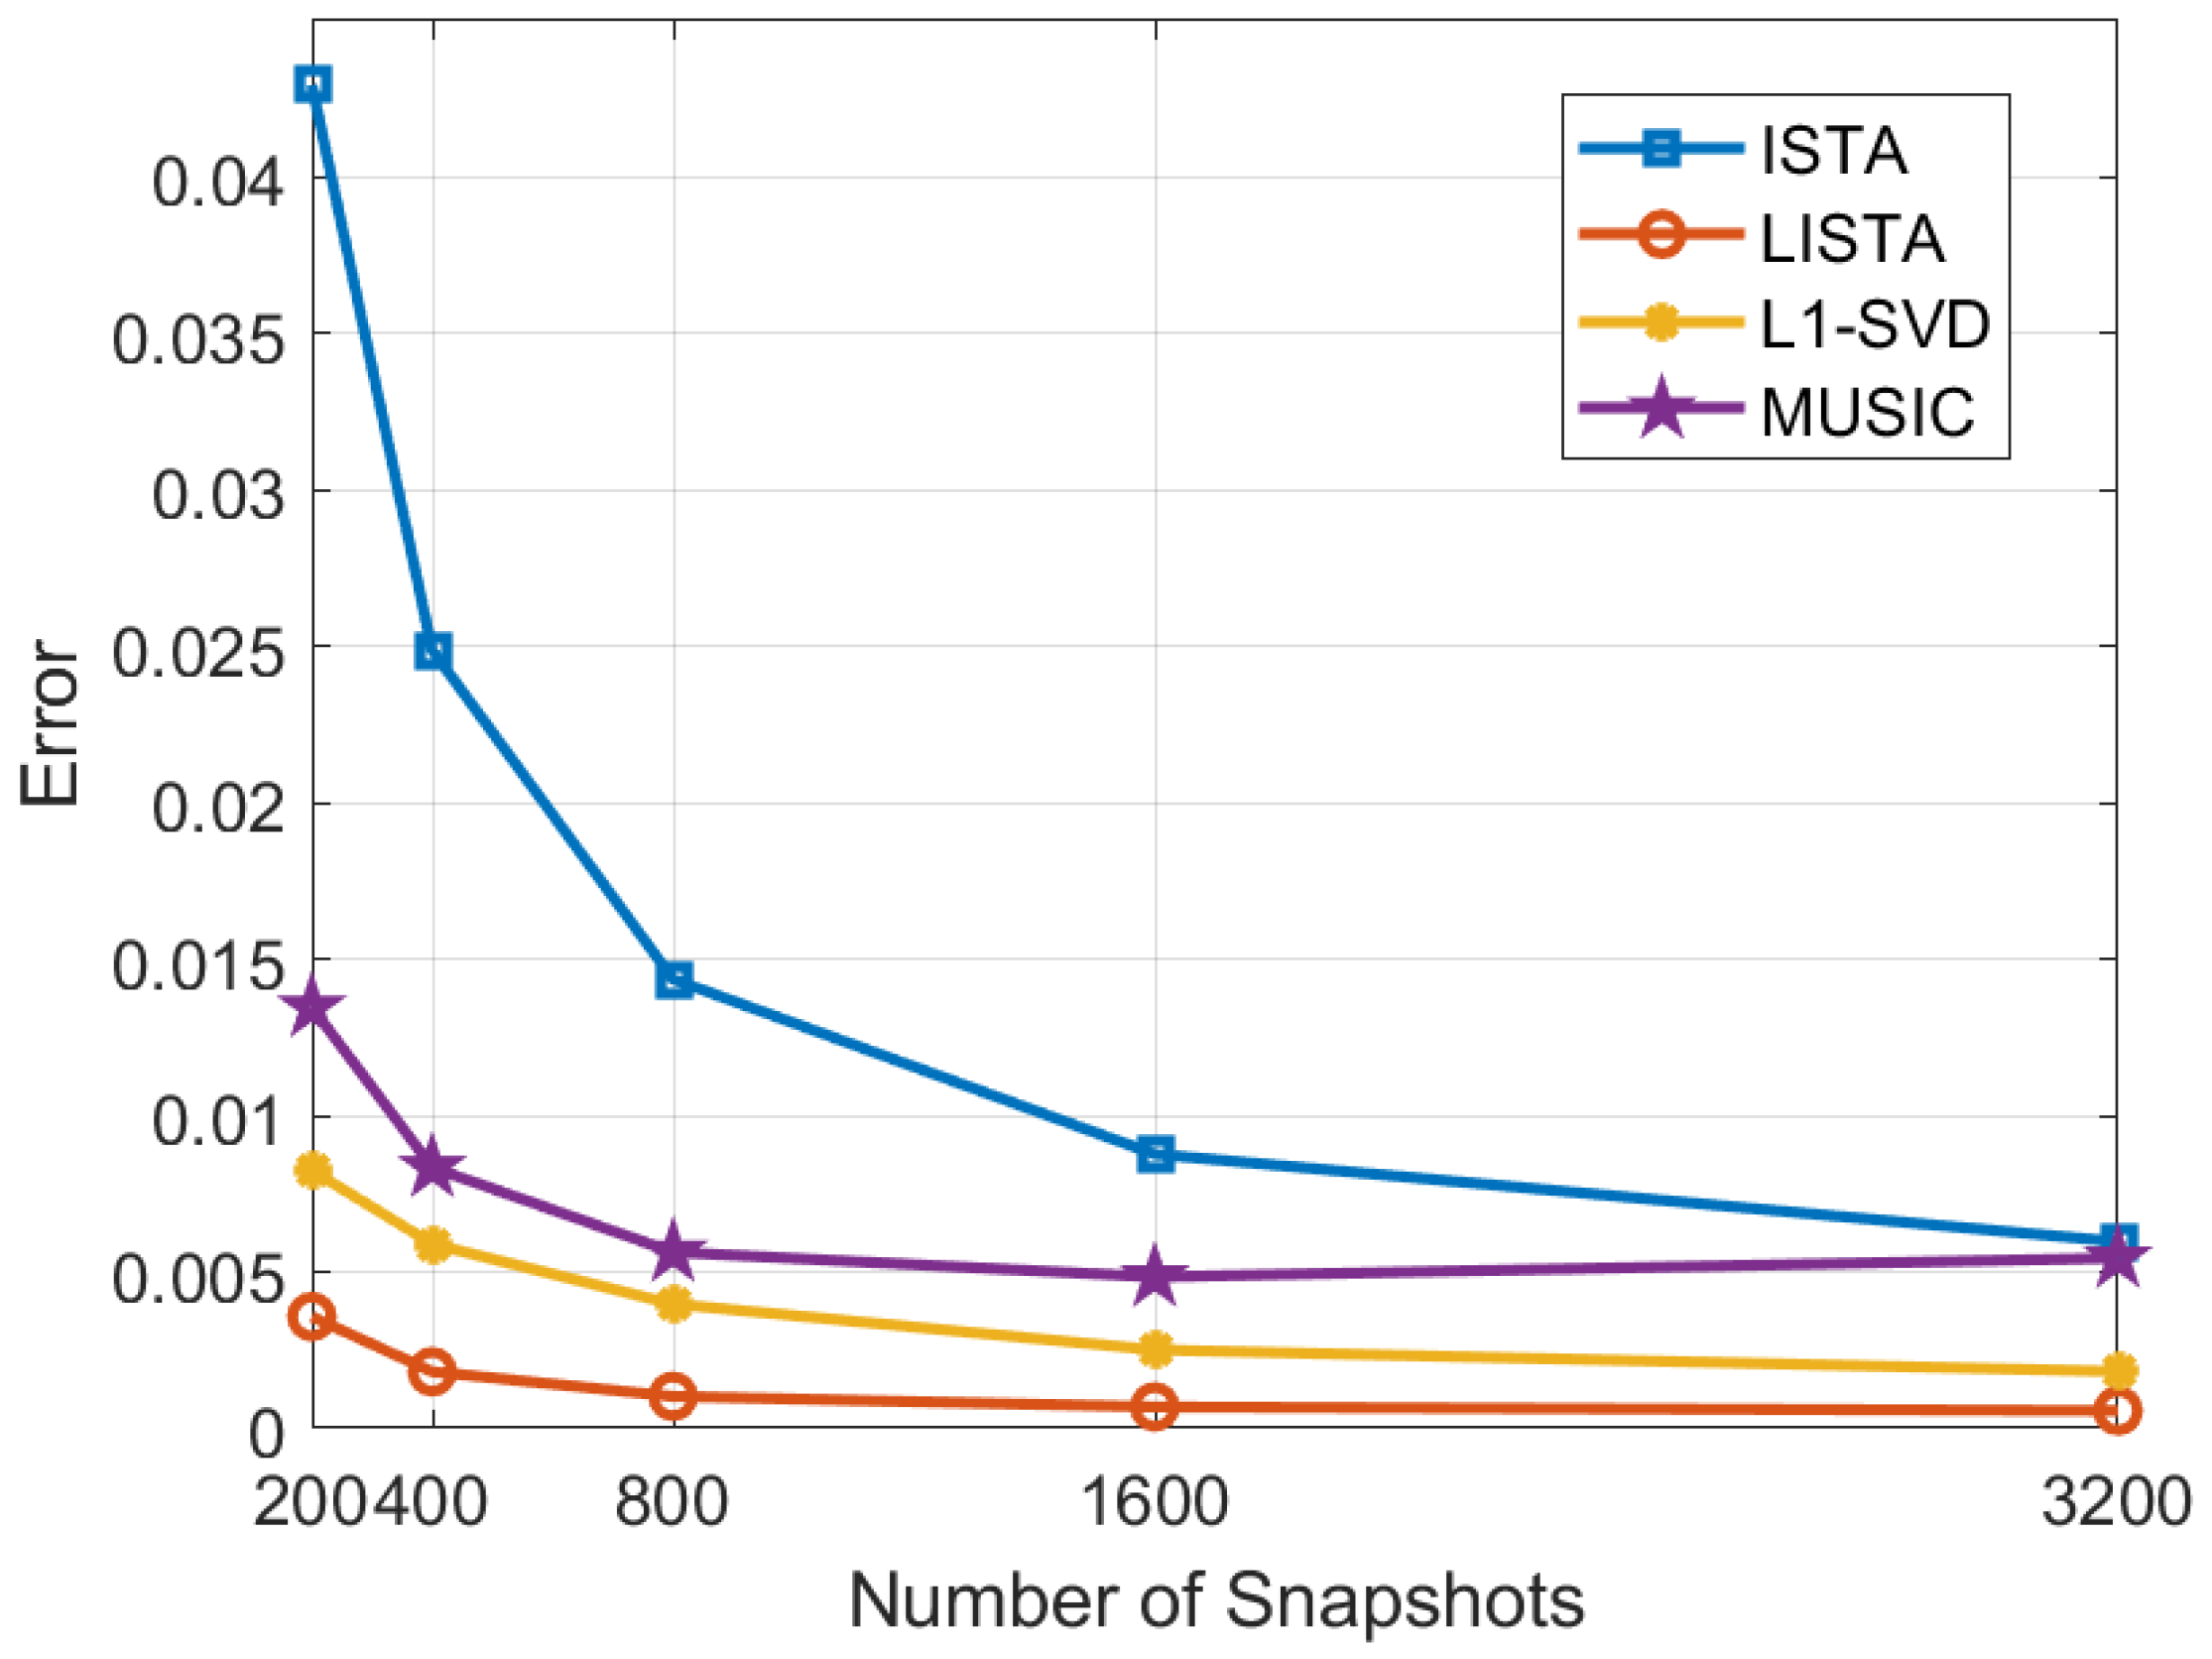
In the experiment, snapshot counts are varied from 200 to 3200, while keeping the other parameters constant. As shown in Figure 14, with snapshots increasing, the error shows a significant decreasing trend. However, the rate of error reduction gradually slows down, suggesting that although increasing snapshot quantities can significantly enhance DOA estimation performance, the extent of improvement decreases as the number of snapshots continues to increase.
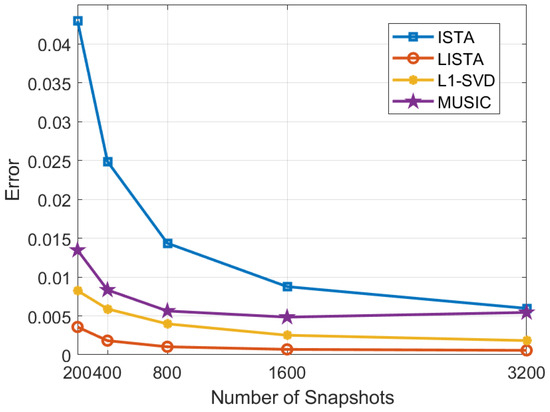
Figure 14.
DOA estimation performance of different snapshots.
Under these conditions, a comprehensive comparison reveals that the error associated with the LISTA algorithm is demonstrably lower than that of other algorithms. In particular, it is noteworthy that the LISTA algorithm is able to maintain a high level of accuracy even under conditions of low snapshots. This feature is of significant practical value for reducing sampling time and directly leads to a decrease in computational cost. As a result, the LISTA algorithm exhibits enhanced efficiency for practical applications, especially in situations where snapshot quantities are poor.
4.6. Computational Cost Analysis
This section compares and analyzes the computational cost of four algorithms: LISTA, ISTA, MUSIC, and L1-SVD. The computational cost can be quantitatively assessed by measuring the average time consumed for a single orientation measurement. Table 1 presents the average time required for one run of each algorithm under the experimental conditions described in Section 4.1.

Table 1.
Averaged process time.
As is shown in the table, the LISTA algorithm exhibits a significantly shorter computation time compared to the other three algorithms, thereby demonstrating a pronounced advantage in computational efficiency. Specifically, the average running time of the LISTA algorithm is approximately three orders of magnitude faster than those of the MUSIC and L1-SVD algorithms, and its smaller computational complexity and lower computational cost further emphasize its advantages in practical applications.
5. Conclusions
This paper addresses the blurring issue in DOA estimation that arises when the element interval exceeds half the wavelength, as well as the challenge of limited error adaptation ability in existing algorithms within complex and dynamic real-world signal environments. To address these challenges, we propose an optimal design of non-uniform metasurface elements and space–time-coding mathematical model. Additionally, we use a novel method for DOA estimation that integrates the strengths of both model-driven and data-driven approaches. Specifically, we leverage the unique characteristics of non-uniform element arrangements and space–time-coding, combined with a deep unfolded LISTA network.
The proposed method enhances error adaptation capability by unfolding the iterative steps of the ISTA algorithm into a deep neural network architecture and optimizing the network parameters via supervised training. This integration of iterative methods with deep learning enables the model to adapt more effectively to varying signal conditions.
The simulation outcomes reveal that non-uniform arrangement reduces the error. Additionally, the proposed method is capable of precisely estimating the azimuth angle of the received signal and exhibits proper generalization capabilities. Compared to the traditional ISTA algorithm, our approach achieves higher accuracy and faster convergence with fewer iterations. Moreover, it is capable of estimating DOA under off-grid conditions and remains applicable to coherent signals. Additionally, through analysis and comparison with traditional algorithms, the proposed method exhibits notable superiority regarding estimation precision and computational cost across various SNR levels and snapshot quantities.
Consequently, the proposed method in this paper exhibits higher practical value and robustness in complex and variable signal environments, thereby offering a reliable and novel approach for high-precision DOA estimation.
Author Contributions
Conceptualization, methodology, software, validation and writing—original draft, X.N.; supervision, X.S. and G.C.; investigation, L.H.; writing—review and editing, X.S. All authors have read and agreed to the published version of the manuscript.
Funding
This work was supported in part by the National Natural Science Foundation of China under Grant 62401585 and in part by the Research Program of National University of Defense Technology under Grant ZK23-18.
Data Availability Statement
The original contributions presented in this study are included in this article. Further inquiries can be directed to the corresponding author.
Acknowledgments
The authors extend their sincere thanks to the editors and reviewers for their careful reading and fruitful suggestions.
Conflicts of Interest
The authors declare no conflicts of interest.
References
- Huan, M.; Liang, J.; Ma, Y.; Liu, W.; Wu, Y.; Zeng, Y. Optimization of High-Resolution and Ambiguity-Free Sparse Planar Array Geometry for Automotive MIMO Radar. IEEE Trans. Signal Process. 2024, 72, 4332–4348. [Google Scholar] [CrossRef]
- Lai, X.; Zhang, X.; Liu, W.; Li, J. Sparse Enhancement of MIMO Radar Exploiting Moving Transmit and Receive Arrays for DOA Estimation: From the Perspective of Synthetic Coarray. IEEE Trans. Signal Process. 2024, 72, 4022–4036. [Google Scholar] [CrossRef]
- Zhu, H.; Feng, W.; Feng, C.; Ma, T.; Zou, B. Deep Unfolded Gridless DOA Estimation Networks Based on Atomic Norm Minimization. Remote Sens. 2022, 15, 13. [Google Scholar] [CrossRef]
- Fang, Z.; Zhou, Q.; Dai, J.Y.; Qi, Z.J.; Zhang, J.; Cheng, Q.; Cui, T.J. DOA Estimation Method Based on Space-Time Coding Antennas with Orthogonal Codes. IEEE Trans. Antennas Propag. 2024, 72, 1173–1181. [Google Scholar] [CrossRef]
- Zhan, Q.; Li, S.; Yan, B.; Cao, A.; Bai, X.; He, C. Spatial Spectrum Direction Finding by Programmable Metasurface with Time Modulation. IEEE Antennas Wirel. Propag. Lett. 2024, 23, 458–462. [Google Scholar] [CrossRef]
- He, C.; Cao, A.; Chen, J.; Liang, X.; Zhu, W.; Geng, J.; Jin, R. Direction Finding by Time-Modulated Linear Array. IEEE Trans. Antennas Propag. 2018, 66, 3642–3652. [Google Scholar] [CrossRef]
- Zhang, L.; Chen, X.Q.; Liu, S.; Zhang, Q.; Zhao, J.; Dai, J.Y.; Bai, G.D.; Wan, X.; Cheng, Q.; Castaldi, G.; et al. Space-Time-Coding Digital Metasurfaces. Nat. Commun. 2018, 9, 4334. [Google Scholar] [CrossRef] [PubMed]
- Li, H.; Li, Y.B.; Hu, W.-S.; Huang, S.-J.; Shen, J.-L.; Wang, S.Y.; Liu, G.-D.; Cui, T.J. Joint Detections of Frequency and Direction of Arrival in Wideband Based on a Programmable Metasurface. IEEE Trans. Antennas Propag. 2023, 71, 8061–8071. [Google Scholar] [CrossRef]
- Zhan, Q.; Yan, B.; Zheng, Y.; Li, S.; He, C. Two-Dimensional Direction Finding by Programmable Metasurface with Time Modulation. In Proceedings of the 2023 IEEE 11th Asia-Pacific Conference on Antennas and Propagation (APCAP), Guangzhou, China, 19–22 November 2023; pp. 1–2. [Google Scholar]
- Fu, H.; Dai, F.; Hong, L. Two-Dimensional off-Grid DOA Estimation with Metasurface Aperture Based on MMV Sparse Bayesian Learning. IEEE Trans. Instrum. Meas. 2023, 72, 1–18. [Google Scholar] [CrossRef]
- Gong, Z.; Su, X.; Hu, P.; Liu, S.; Liu, Z. Deep Unfolding Sparse Bayesian Learning Network for Off-Grid DOA Estimation with Nested Array. Remote Sens. 2023, 15, 5320. [Google Scholar] [CrossRef]
- Zhou, Q.Y.; Dai, J.Y.; Fang, Z.; Wu, L.; Qi, Z.J.; Wang, S.R.; Jiang, R.Z.; Cheng, Q.; Cui, T.J. Generalized High-Precision and Wide-Angle DOA Estimation Method Based on Space-Time-Coding Digital Metasurfaces. IEEE Internet Things J. 2024, 11, 38196–38206. [Google Scholar] [CrossRef]
- Meftah, N.; Ratni, B.; El Korso, M.N.; Burokur, S.N. Direction-of-Arrival Estimation by a Programmable Metasurface. In Proceedings of the 2024 18th European Conference on Antennas and Propagation (EuCAP), Glasgow, UK, 17 March 2024; pp. 1–3. [Google Scholar]
- Xia, D.; Wang, X.; Han, J.; Xue, H.; Liu, G.; Shi, Y.; Li, L.; Cui, T.J. Accurate 2-D DoA Estimation Based on Active Metasurface with Nonuniformly Periodic Time Modulation. IEEE Trans. Microw. Theory Tech. 2023, 71, 3424–3435. [Google Scholar] [CrossRef]
- Chen, G.; Su, X.; He, L.; Guan, D.; Liu, Z. Coherent Signal DOA Estimation Method Based on Space–Time–Coding Metasurface. Remote Sens. 2025, 17, 218. [Google Scholar] [CrossRef]
- Chen, Z.; Tang, J.; Huang, L.; He, Z.-Q.; Wong, K.-K.; Wang, J. Robust Target Positioning for Reconfigurable Intelligent Surface Assisted MIMO Radar Systems. IEEE Trans. Veh. Technol. 2023, 72, 15098–15102. [Google Scholar] [CrossRef]
- Liu, C.-L.; Vaidyanathan, P.P. Super Nested Arrays: Linear Sparse Arrays with Reduced Mutual Coupling—Part II: High-Order Extensions. IEEE Trans. Signal Process. 2016, 64, 4203–4217. [Google Scholar] [CrossRef]
- Liu, C.-L.; Vaidyanathan, P.P. Super Nested Arrays: Sparse Arrays with Less Mutual Coupling than Nested Arrays. In Proceedings of the 2016 IEEE International Conference on Acoustics, Speech and Signal Processing (ICASSP), Shanghai, China, 20–25 March 2016; pp. 2976–2980. [Google Scholar]
- Lin, M.; Xu, M.; Wan, X.; Liu, H.; Wu, Z.; Liu, J.; Deng, B.; Guan, D.; Zha, S. Single Sensor to Estimate DOA with Programmable Metasurface. IEEE Internet Things J. 2021, 8, 10187–10197. [Google Scholar] [CrossRef]
- El-Behery, I.; MacPhie, R. Maximum Likelihood Estimation of the Number, Directions and Strengths of Point Radio Sources from Variable Baseline Interferometer Data. IEEE Trans. Antennas Propag. 1978, 26, 294–301. [Google Scholar] [CrossRef]
- Orlando, D.; Ricci, G. A Comparative Analysis of ML-Based DOA Estimators. In Proceedings of the 2023 IEEE 10th International Workshop on Metrology for AeroSpace (MetroAeroSpace), Milan, Italy, 19 June 2023; pp. 385–388. [Google Scholar]
- Roy, R.; Kailath, T. ESPRIT-Estimation of Signal Parameters via Rotational Invariance Techniques. IEEE Trans. Acoust. Speech Signal Process. 1989, 37, 984–995. [Google Scholar] [CrossRef]
- Veerendra, D.; Balamurugan, K.S.; Villagómez-Galindo, M.; Khandare, A.; Patil, M.; Jaganathan, A. Optimizing Sensor Array DOA Estimation with the Manifold Reconstruction Unitary ESPRIT Algorithm. IEEE Sens. Lett. 2023, 7, 1–4. [Google Scholar] [CrossRef]
- Schmidt, R. Multiple Emitter Location and Signal Parameter Estimation. IEEE Trans. Antennas Propag. 1986, 34, 276–280. [Google Scholar] [CrossRef]
- Merkofer, J.P.; Revach, G.; Shlezinger, N.; Routtenberg, T.; Van Sloun, R.J.G. DA-MUSIC: Data-Driven DoA Estimation via Deep Augmented MUSIC Algorithm. IEEE Trans. Veh. Technol. 2024, 73, 2771–2785. [Google Scholar] [CrossRef]
- Candes, E.J.; Wakin, M.B. An Introduction to Compressive Sampling. IEEE Signal Process. Mag. 2008, 25, 21–30. [Google Scholar] [CrossRef]
- Wagner, M.; Park, Y.; Gerstoft, P. Gridless DOA Estimation and Root-MUSIC for Non-Uniform Linear Arrays. IEEE Trans. Signal Process. 2021, 69, 2144–2157. [Google Scholar] [CrossRef]
- Guo, B.; Zhen, J. Coherent Signal Direction Finding with Sensor Array Based on Back Propagation Neural Network. IEEE Access 2019, 7, 172709–172717. [Google Scholar] [CrossRef]
- Zhao, Z.; Zhao, H.; Zheng, M.; Tang, J. Real-Time Phase-Only Nulling Based on Deep Neural Network with Robustness. IEEE Access 2019, 7, 142287–142294. [Google Scholar] [CrossRef]
- Liu, Z.-M.; Zhang, C.; Yu, P.S. Direction-of-Arrival Estimation Based on Deep Neural Networks with Robustness to Array Imperfections. IEEE Trans. Antennas Propag. 2018, 66, 7315–7327. [Google Scholar] [CrossRef]
- Cong, J.; Wang, X.; Huang, M.; Wan, L. Robust DOA Estimation Method for MIMO Radar via Deep Neural Networks. IEEE Sens. J. 2021, 21, 7498–7507. [Google Scholar] [CrossRef]
- Hu, D.; Zhang, Y.; He, L.; Wu, J. Low-Complexity Deep-Learning-Based DOA Estimation for Hybrid Massive MIMO Systems with Uniform Circular Arrays. IEEE Wirel. Commun. Lett. 2020, 9, 83–86. [Google Scholar] [CrossRef]
- Zhang, Y.; Mu, Y.; Liu, Y.; Zhang, T.; Qian, Y. Deep Learning-Based Beamspace Channel Estimation in mmWave Massive MIMO Systems. IEEE Wirel. Commun. Lett. 2020, 9, 2212–2215. [Google Scholar] [CrossRef]
- Yang, Y.; Sun, J.; Li, H.; Xu, Z. ADMM-CSNet: A Deep Learning Approach for Image Compressive Sensing. IEEE Trans. Pattern Anal. Mach. Intell. 2020, 42, 521–538. [Google Scholar] [CrossRef]
- Li, R.; Zhang, S.; Zhang, C.; Liu, Y.; Li, X. Deep Learning Approach for Sparse Aperture ISAR Imaging and Autofocusing Based on Complex-Valued ADMM-Net. IEEE Sens. J. 2021, 21, 3437–3451. [Google Scholar] [CrossRef]
- Borgerding, M.; Schniter, P.; Rangan, S. AMP-Inspired Deep Networks for Sparse Linear Inverse Problems. IEEE Trans. Signal Process. 2017, 65, 4293–4308. [Google Scholar] [CrossRef]
- Zheng, S.; Jayasumana, S.; Romera-Paredes, B.; Vineet, V.; Su, Z.; Du, D.; Huang, C.; Torr, P.H.S. Conditional Random Fields as Recurrent Neural Networks. In Proceedings of the 2015 IEEE International Conference on Computer Vision (ICCV), Santiago, Chile, 11–18 December 2015; pp. 1529–1537. [Google Scholar]
- Hosseini, S.A.H.; Yaman, B.; Moeller, S.; Hong, M.; Akcakaya, M. Dense Recurrent Neural Networks for Accelerated MRI: History-Cognizant Unrolling of Optimization Algorithms. IEEE J. Sel. Top. Signal Process. 2020, 14, 1280–1291. [Google Scholar] [CrossRef] [PubMed]
- Gregor, K.; LeCun, Y. Learning Fast Approximations of Sparse Coding. In Proceedings of the 27th International Conference on Machine Learning, Haifa, Israel, 21–24 June 2010. [Google Scholar]
- Wu, L.; Liu, Z.; Liao, J. DOA Estimation Using an Unfolded Deep Network in the Presence of Array Imperfections. In Proceedings of the 2022 7th International Conference on Signal and Image Processing (ICSIP), Suzhou, China, 20 July 2022; pp. 182–187. [Google Scholar]
Disclaimer/Publisher’s Note: The statements, opinions and data contained in all publications are solely those of the individual author(s) and contributor(s) and not of MDPI and/or the editor(s). MDPI and/or the editor(s) disclaim responsibility for any injury to people or property resulting from any ideas, methods, instructions or products referred to in the content. |
© 2025 by the authors. Licensee MDPI, Basel, Switzerland. This article is an open access article distributed under the terms and conditions of the Creative Commons Attribution (CC BY) license (https://creativecommons.org/licenses/by/4.0/).

