Article

Extensive Feature-Inferring Deep Network for Hyperspectral and Multispectral Image Fusion

1
School of Computer Science and Engineering, Nanjing University of Science and Technology, Nanjing 210094, China
2
Department of Computer Sciences, College of Computer and Information Sciences, Princess Nourah bint Abdulrahman University, P.O. Box 84428, Riyadh 11671, Saudi Arabia
3
Faculty of Computing and Information Technology, King Abdulaziz University, Jeddah 21589, Saudi Arabia
*
Author to whom correspondence should be addressed.
Remote Sens. 2025, 17(7), 1308; https://doi.org/10.3390/rs17071308
Submission received: 26 January 2025 / Revised: 28 March 2025 / Accepted: 4 April 2025 / Published: 5 April 2025

Abstract

:
Hyperspectral (HS) and multispectral (MS) image fusion is the most favorable way to obtain a hyperspectral image that has high resolution in terms of spatial and spectral information. This fusion problem can be accomplished by formulating a mathematical model and solving it either analytically or iteratively. The mathematical solutions class has serious challenges, e.g., computation cost, manually tuning parameters, and the absence of imaging models that laboriously affect the fusion process. With the revolution of deep learning, the recent HS-MS image fusion techniques gained good outcomes by utilizing the power of the convolutional neural network (CNN) for feature extraction. Moreover, extracting intrinsic information, e.g., non-local spatial and global spectral features, is the most critical issue faced by deep learning methods. Therefore, this paper proposes an Extensive Feature-Inferring Deep Network (EFINet) with extensive-scale feature-interacting and global correlation refinement modules to improve the effectiveness of HS-MS image fusion. The proposed network retains the most vital information through the extensive-scale feature-interacting module in various feature scales. Moreover, the global semantic information is achieved by utilizing the global correlation refinement module. The proposed network is validated through rich experiments conducted on two popular datasets, the Houston and Chikusei datasets, and it attains good performance compared to the state-of-the-art HS-MS image fusion techniques.

1. Introduction

Three-dimensional hyperspectral images (HSIs) are rich information images that can be sensed through hyperspectral sensors to cover a wide range of the electromagnetic spectrum. HSIs naturally possess numerous spectral channels, running from dozens to hundreds, where the captured wide range of the electromagnetic spectrum is split into narrow bands employing a specific interval [1,2]. The wealth of spectral information in HSIs makes them valuable and necessary information sources that can be employed by many applications, such as land-cover classification [3], mapping harmful algae blooms [4], military purposes [5], and monitoring sustainable development [6]. Although they enclose prosperous spectral information, HSIs have low spatial resolution due to the physical restrictions of hyperspectral imaging instruments. This property significantly limits their performance in these applications. Attaining HSIs with high spatial–spectral resolution directly is not practicable because of the cost and the limitations of current imaging devices. Fortunately, the hyperspectral image super-resolution procedure, which recovers high-spatial–spectral-resolution HSIs (HRHSIs) from their low-spatial-resolution counterparts (LRHSIs), has recently become the most favorable and cost-effective solution for acquiring HRHSIs [7]. Hyperspectral image super-resolution strategies can be classified based on different factors, e.g., multi-image to single-image super-resolution [8] and image fusion super-resolution [9], utilizing images for hyper-sharpening (employing panchromatic images (PAN) to super-solve LRHSIs) [10], hyperspectral (HS) and multispectral (MS) image fusion [11]. However, this article focuses on the HS-MS image fusion problem, which we believe is more challenging when both images are high-dimensional data and more advantageous when both fused images can contribute to minimizing spectral distortion.
The HS-MS image fusion process enriches the spatial resolution of LRHSIs by utilizing complementary details for its high-resolution multispectral image (HRMSI) counterparts for the same scene. In this manuscript, we roughly categorized HS-MS image fusion approaches into model-driven [12] and data-driven [13] strategies. Model-driven HS-MS image fusion approaches employ a pre-defined mathematical prototype, established on theoretical knowledge, to solve the fusion issue. For example, based on linear mixture and low-rank models, many HS-MS image fusion methods have been introduced. Yokoya et al. [14] formulated the fusion process as an estimation for dictionary and abundance matrix-form LRHSIs and HRMSIs, respectively, and tackled it by operating a non-negative matrix factorization (NMF) scenario. To enhance the fusion outcomes, various image priors, such as sparse and non-local self-similarity, are utilized in the mathematical solution [15]. On the other hand, based on the tensor factorization scenario that processes the HSIs in their 3D nature, considerable fusion algorithms are offered by incorporating diverse image priors [16,17]. However, despite the satisfactory performance of model-driven algorithms for the HS-MS image fusion problem, there are severe restrictions that restrain the efficiency, e.g., the manual parameters and priors are demanding to adjust and require more calculation time, particularly in real-time applications. Moreover, these strategies depend heavily on the pre-defined point spread function (PSF) and spectral response function (SRF), which are not available in real scenarios [9,18].
On the contrary, the data-driven HS-MS image fusion class relies heavily on learning the affinity between the captured pair and the demanded HRHSI from large amounts of data, utilizing the proficiency of deep learning modules such as the convolutional neural network (CNN). Employing the capability of CNNs for feature extraction, numerous HS-MS image fusion methods have been introduced with superior performance [19,20,21,22]. For example, Xu et al. [23] devised a deep CNN framework that incorporates a convolutional kernel, batch normalization process, residual connection, and the network-in-network, with an adaptation of a high-quality procedure. Moreover, two branches of the deep framework for HS-MS image fusion are offered by Yang et al. in [24]. This deep network possesses a spectral footpath for extracting the spectral features from the up-sampled LRHSI and a spatial footpath for dragging the spatial details from the HRMSI. After that, the acquired features are merged by operating fully connected (FC) neurons where the HRHSI is reconstructed. CNN-based HS-MS image fusion strategies attain satisfactory performance, while the short receptive field of the convolutional kernel hinders their effectiveness in capturing intrinsic features such as spatial–spectral correlation (SSC), global spectral correlation (GSC), and non-local self-similarity (NSS). Encouraged by the attainment of the Transformer scenario for modeling the long-range relationship in language processing [25] and sequential data processing [26], considerable Transformer-based HS-MS image fusion frameworks are offered [27,28,29,30]. Despite the outstanding outcomes of the Transformer-based approaches in HS-MS image fusion, there are still gaps that need to be addressed, e.g., these practices require additional enhancement to capture local characteristics that are neglected by the Transformer modules, and the tremendous computation can be further refined.
Motivated by the aforementioned analysis, this article proposes an Extensive Feature-Inferring Deep Network for Hyperspectral and Multispectral Image Fusion method (dubbed EFINet). The proposed method is an end-to-end network capable of coping with model-driven approaches’ restrictions, where all handcrafted parameters, e.g., image priors, model criteria, PSF, and SRF, are automatically optimized from the training data in an efficient calculation. Moreover, our devised network yields more features by employing convolution filters with various dimensions. Next, we employ our method’s devised extensive-scale feature-interacting (ESFI) module to further enhance the vital characteristics, such as NSS and local features, of the different extensive scales. The ESFI unit possesses five dynamic self-attention (DSA) units corresponding to each scale of the yielded attributes. The dynamic self-attention (DSA) layer is designed to efficiently and effectively obtain local attributes by scheming a network of Transformers. This presented DSA layer is qualified to overcome the limitation of computation time complexity. Moreover, to prevent interference from the straightforward merging of features with significant resolution differences, we fuse multi-scale features gradually, taking into consideration the resolution disparities between characteristics of various layers. During the merging process, the proposed method employs the offered global correlation refinement module (GCR) to model the GSC and further improve NSS. The GCR unit is devised to assemble multi-receptive-field details and maintain the most successful attributes to gradually rebuild the target-fused HRHSI. The suggested GCR module improves the calculation time compared to classic Transformers by concentrating on picking the most helpful similarity weights, where the most consequential global characteristics can be sufficiently employed for high-resolution image recovery. Extensive experiments using popular remote sensing datasets verify the performance of our proposed techniques. In brief, the contributions of this article are outlined as follows:
  • We introduce a novel deep framework architecture called EFINet for HS-MS image fusion that is capable of interactively merging multi-scale characteristics and utilizing global details for reconstructing HRHSIs with minimum spatial detail corruption and spectral distortion;
  • The ESFI unit based on dynamic self-attention (DSA) is proposed. The DSA process is designed to efficiently and effectively model the local information by scheming a network of Transformers in an efficient time. This module overcomes the restriction of the traditional Transformer in recreating the local features;
  • We design a practical correlation refinement network (GCR) to adequately produce lightweight self-attention for global characteristic discovery. The suggested GCR collects multi-receptive-field attributes and reinforces the most prosperous characteristics to reconstruct the desired HRHSIs progressively;
  • Detailed experiments are performed to prove the effectiveness of the devised EFINet techniques by utilizing two well-known remote sensing datasets, the Houston and Chikusei datasets. The performance is compared with state-of-the-art HS-MS image fusion strategies.
The rest of this paper is systematized as follows: Section 2 describes related previous works. The problem formulation and the details of the proposed network are presented in Section 3. We describe the experimental outcomes and discussion in Section 4, while Section 5 briefly concludes the manuscript and provides future perspectives.

2. Related Works

This section briefly studies the earlier works on HS-MS image fusion practices, which we roughly categorized into model-driven and data-driven strategies.

2.1. Model-Driven Strategies

Model-driven approaches are utilized to address the HS-MS image fusion issue by framing the fusion problem as an objective function with suitable data fidelity components and precisely constructing a regularizer to ensure the desired resolution is implemented. For instance, Dong et al. [31] devised a fusion technique established on the linear mixture model (LMM), in which the spectral basis and coefficient matrix are estimated alternatively and iteratively. Here, the spectral basis is retrieved from the LRHSI, and abundance is regained jointly from the HRMSI and LRHSI. The latter optimization function is regularized by incorporating sparse coding and non-local priors. Employing the alternating direction method of multipliers (ADMM) to tackle the fusion problem based on the LMM, a new HS-MS image fusion approach is suggested in [32]. This strategy calculates the sparse codes from the observed pair through a non-negative structured sparse representation procedure where the dictionary is corrected alternatively rather than being kept fixed. Moreover, Zhou et al. [33] offered an HS-MS image fusion strategy that benefits from low ranking to split the LRHSI into clusters and coupled spectral unmixing to rescue the spectral basis and coefficients alternately from the observed pair. Here, the authors utilize the multi-scale practice to improve the fusion results. To solve the fusion problem in 3D, considerable HS-MS image fusion practices are optimized utilizing tensor factorization scenarios [16,34,35,36]. For example, in [17], the fusion problem is tackled by decomposing the observed pair into a core mode and three dictionaries based on the Tucker model, where the HRHSI is reconstructed by combining these three modes. Moreover, in [37], the authors offered HS-MS image fusion by linking a low-tensor multi-rank prior and a subspace representation. Here, singular value decomposition (SVD) is employed to acquire the spectral basis of the observed LRHSI; furthermore, low multi-rank regularization is involved in computing the coefficients. However, the model-driven strategies perform well but require more computation time since the iterative nature of their solutions and the handcrafted parameters are their main obstacles.

2.2. Data-Driven Strategies

Data-driven approaches leverage the capability of CNNs and other deep learning architectures to debrief and mix applicable details from LRHSIs and HRMSIs. HS-MS image fusion techniques operating CNNs usually involve developing an end-to-end network architecture that accepts LRHSIs and HRMSIs as inputs and then delivers a fused outcome [19,38,39,40,41]. Dong et al. [42,43] presented a CNN framework for single-image super-resolution, SRCNN, which gained notable success. Yang et al. [44] designed a deep network architecture that can maintain spectral characteristics by up-sampling the LRHSI and instantly adding the outcome to the network’s result. To enhance the protection of the spatial structure, the offered network is further trained by employing joined attributes of the observed HRMSI and up-sampled LRHSI in high-pass filtering instead of the image domain. A pyramid fully convolutional network was invented in [45] to fuse the observed pair with an encoder sub-network. The encoder sub-network was devised to recast the HSI into a latent image. The HRHSI was revamped by integrating this latent image with the HRMSI pyramid input. Moreover, in [46], the authors regularized the fusion optimization model by deep priors learned from the training data via a plain CNN architecture, and the Sylvester equation was employed to solve the objective function in two steps. The outstanding performance of CNN-based fusion approaches, which overcome the handcrafted parameters and time consumption issues, is hindered by the short receptive field of the convolutional filter. While the convolutional kernel’s short receptive field restrains its ability to exploit NSS, GSC, and SSC, which are crucial in HSI recovery, Transformer scenarios have evolved into a new alternative for capturing long-range features, and many HS-MS image fusions are presented based on this concept [27,47,48,49,50]. For instance, Hu et al. [30] presented the Fusformer approach, which expands the receptive field of convolutional layers by a self-attention (SA) mechanism to enrich extensive global affinities in characteristics. Likewise, two attention mechanisms, global self-attention and cross-attention for HS-MS image fusion, are offered in [51]. Herein, global self-attention is utilized to grasp long-range dependencies between attributes within the identical hierarchy, while cross-attention is employed to obtain dependencies between components at dissimilar hierarchies. Moreover, the PSRT technique, which constitutes a pyramid format with numerous encoder–decoder pieces and a shuffle-and-reshuffle procedure that enriches the attributes’ structure expression and facilitates the fusion of the observed pair to construct the wanted HRHSI, is offered in [52]. Although they have superior outcomes, the original Transformer scenarios are computationally expensive and usually fail to capture the local characteristics, leaving room for improvement.

3. Materials and Methods

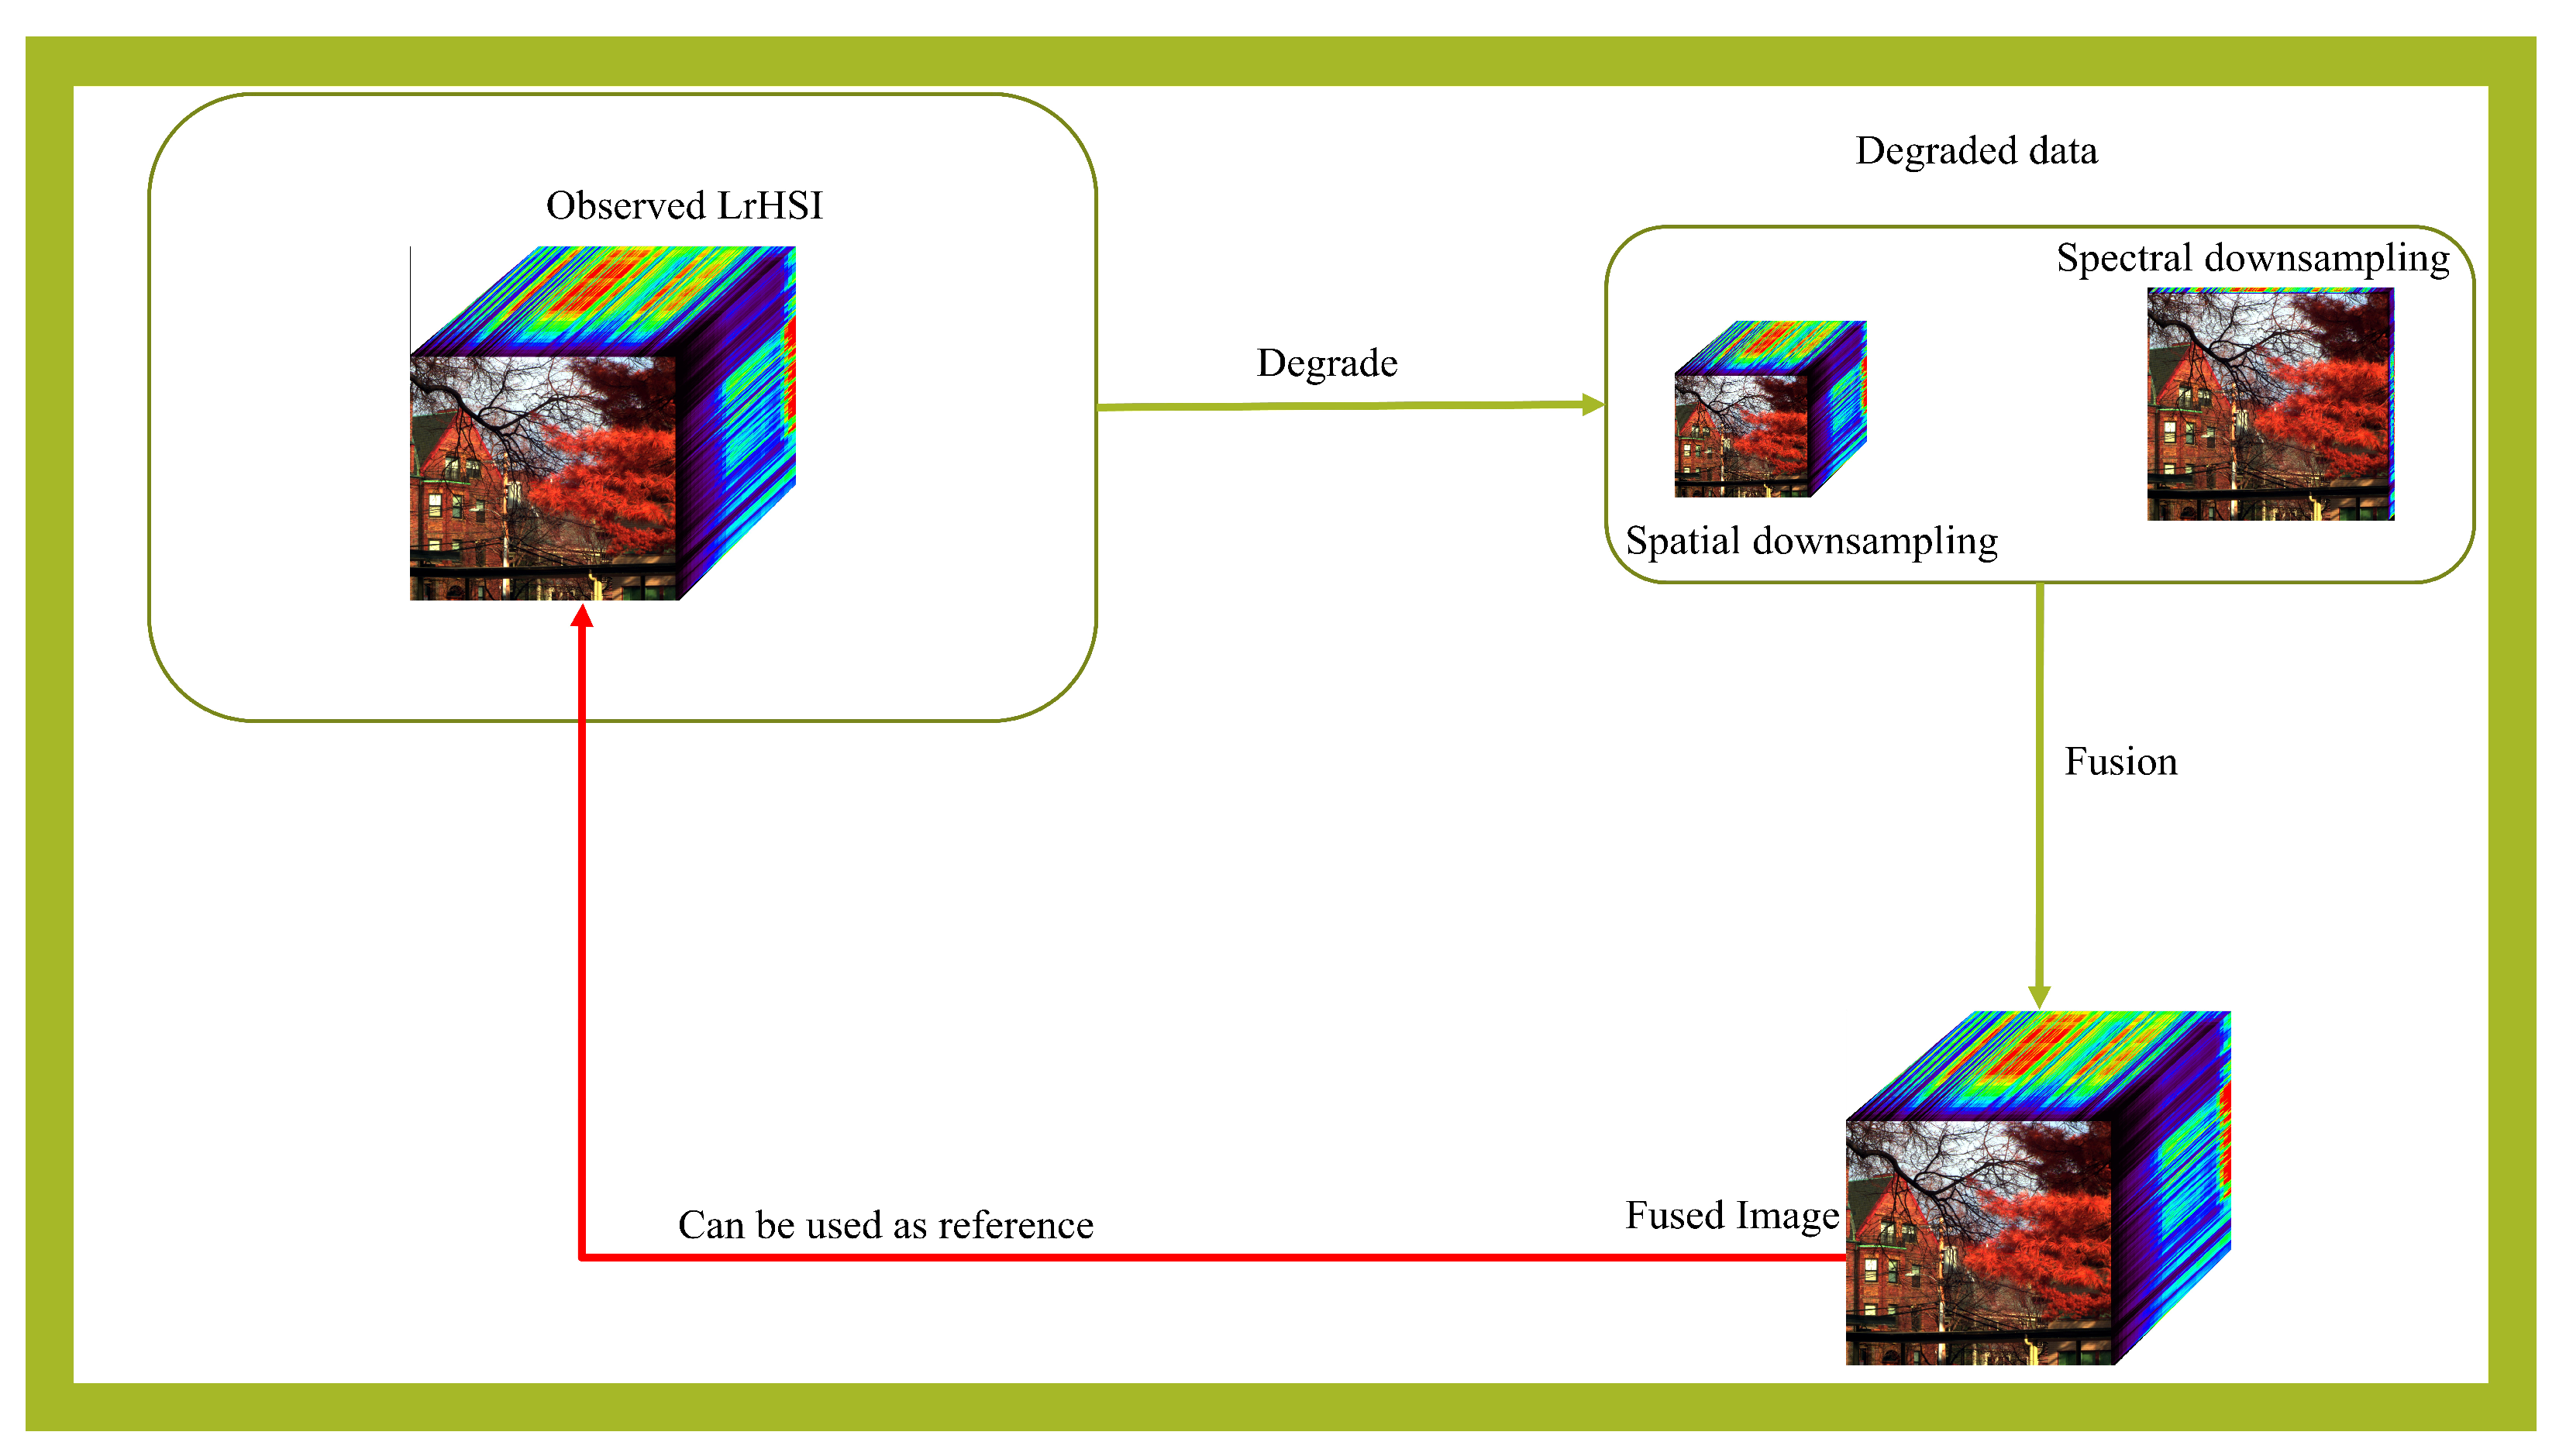
3.1. Problem Formulation

In this paper, X R S × N M denotes high-spatial- and -spectral-resolution hyperspectral images (HRHSIs) where N M is the number of pixels (where N and M represent height and width, respectively) and S is the number of spectral bands. This image is not obtainable in real scenarios due to various constraints. Fortunately, two types of images, named hyperspectral images with low spatial resolution (LRHSIs) and multispectral images with high spatial resolution (HRMSIs), can be captured for the same scene with two different sensors. Therefore, one of the best approaches to obtain an HRHSI is hyperspectral (HS) and multispectral (MS) image fusion, which fuses the complementary information of the observed pair to reconstruct the target image. Herein, the LRHSI ( Y R S × n m , where n m = N M / α and α denotes the decimation factor) can be considered a spatially degraded image of the HRHSI, and it can be achieved as follows:
Y = XBC
where B R N M × N M is the convolution process of the spectral channels of the HRHSI and the point spread function (PSF) of the imaging instrument. C R N M × n m denotes the spatial degradation matrix capturing a subspace from XB s rows. In the same way, the HRMSI with low spectral resolution can be regarded as a spectral down-sampled version of the HRHSI, which can be depicted as follows:
Z = RX
where Z R s × N M represents the HRMSI and s is the number of spectral bands of the HRMSI. R R s × S denotes the MS sensor’s spectral response function (SRF); commonly, the HRHSI is assumed to be a Red–Green–Blue (RGB) image. The main goal of HS-MS image fusion is to acquire HRHSIs with the most satisfactory conservation possible of the complementary features of the observed LRHSI and HRMSI pair. Based on the imaging models in Equations (1) and (2), the solution to the fusion problem is highly ill-posed and has many challenges. For example, the mathematical solution to this problem has various parameters that are hard to tune manually. Furthermore, the lack of PSF and SRF significantly affects the fusion problem and requires more computation time. Therefore, this paper proposes an efficient and effective HS and MS image fusion method with good spatial and spectral information maintenance performance, utilizing the capability of deep learning in terms of powerful feature extraction and time efficiency. Using deep learning technology, the target HRHSI can be obtained by the following equation:
X = f Θ ( Y , Z )
where f Θ is the proposed network, which can be trained in an end-to-end manner, and Θ is the trainable parameters of the proposed network. The details of the proposed technique are given in the following subsection.

3.2. The Proposed Extensive Feature-Inferring Deep Network

In this article, we suggest a novel HS-MS image fusion technique, which is designed to model the vital features that efficiently reconstruct the target HRHSI effectively. The proposed network comprises two modules, so-called extensive-scale feature-interacting (ESFI) and global correlation refinement (GCR) modules, to merge the extracted information in different sizes and fuse the non-local context features to enrich the utilization of features to obtain good fusion results, respectively. A comprehensive presentation of the proposed network is given in the following sections.

3.2.1. Outline of the Proposed Framework Architecture

The proposed network comprises two branches that effectively extract the features from the observed pair, the LRHSI and HRMSI, at different scales. The extracted features have different dimensions at any stage, which ensures the capability of retaining global information across various receptive fields. Afterward, all corresponding information at the same stage obtained from the observed images is concatenated along the channel dimension after upscaling the LRHSI’s features to the same size as the HRMSI. Next, the extracted features are fed to the proposed extensive-scale feature-interacting module, which delivers enriched and refined information at various scales. The proposed extensive-scale feature-interacting module purifies the archived information and makes it interact while constructing richer hierarchies of feature maps. The acquired features are integrated and interact to drive more adequate usage of multi-scale features through the extensive-scale feature-interacting module. Lastly, the five characteristics yielded by the extensive-scale feature-interacting module are bound along the band’s dimension and enhanced by employing the proposed global correlation refinement modules to reconstruct the targeting HRHSI gradually (the steps of the proposed method are summarized in Algorithm 1). A visual outline of the architecture of the proposed network is shown in Figure 1.
Algorithm 1 Extensive Feature-Inferring Deep Network.
Input: Two feature maps of LRHSI and HRMSI, F y and F z .
1:
Multi-scale feature generation, F y i and F z i , i = 1 5 , via Equation (4).
2:
Concatenate the two generated features, F y and F z , at the same level after upscaling F y to the exact spatial size of F z via Equation (5).
3:
The five features obtained in step 2 with various dimensions pass through the ESFI module and generate five refined features.
4:
The features at levels 4 and 5 are concatenated after upscaling level 5 to the exact spatial size of level 4 via Equation (11), and the obtained feature map goes through GCR.
5:
The output of GCR in step 4 is upscaled to the same spatial size as the next upper level (for the output of level 4 and level 5 is level 3) and goes through GCR again.
6:
Steps 4 and 5 are repeated until the original dimension is reached, where the desired feature map is reconstructed gradually.
7:
Reconstruct the final fused image via Equation (16).
Output: Return the fused image in step 7.

3.2.2. Multi-Scale Feature Extraction

As depicted in Figure 1, in the left dashed box, the proposed technique extracts initial characteristics from the observed pair at various scales. Typically, low-level information possesses an abundance of spatial characteristics, whereas high-level information comprises a summary of semantic characteristics without purifying the spatial features. Therefore, we utilize the multi-scale mechanism for feature extraction, which allows the suggested network to extract rich information and retain the long-range dependencies at an early stage. Given the observed pair Y and Z , five features with various hierarchies are obtained by utilizing five convolution layers as follows:
{ F y 1 , F y 2 , F y 3 , F y 4 , F y 5 } = F y 1 = c o n v ( Y ) F y 2 = c o n v ( A v P o o l ( F y 1 ) ) F y 3 = c o n v ( A v P o o l ( F y 2 ) ) F y 4 = c o n v ( A v P o o l ( F y 3 ) ) F y 5 = c o n v ( A v P o o l ( F y 4 ) )
where F y i represents the outcome of the convolutional operation, i = 1 , , 5 . c o n v is a convolutional layer with a kernel of size 3 × 3 , and the number of kernels is S. A v P o o l denotes the average pooling process for downscaling the acquired features. Following the same scenario, except for the number of kernels being set to s, five multi-scale representations, { F Z 1 , F Z 2 , F Z 3 , F Z 4 , F Z 5 } , can be acquired from the HRMSI. However, the exhaustive spatial representations can be additionally improved by merging the information at the same size, whereas using multiple scales can further enhance the expression capability of information with various dimensions. In order to gain better flexible feature usage, the proposed network may assign various weights to characteristics at multiple scales by merging semantic details with meticulous spatial features. Therefore, as shown in Figure 1, we concatenate each feature at the identical stage after up-sampling the features from the LRHSI to the exact same dimensions as the features obtained from the HRMSI; this process can be expressed as follows:
F i = c a t ( u p ( F y i ) , F z i )
where c a t ( · ) and u p ( · ) are the concatenation and upscaling processes, respectively. Subsequently, the acquired features are aggregated by utilizing the interactive learning mechanism through the proposed extensive-scale feature-interacting (ESFI) module, which is detailed in the following subsection.

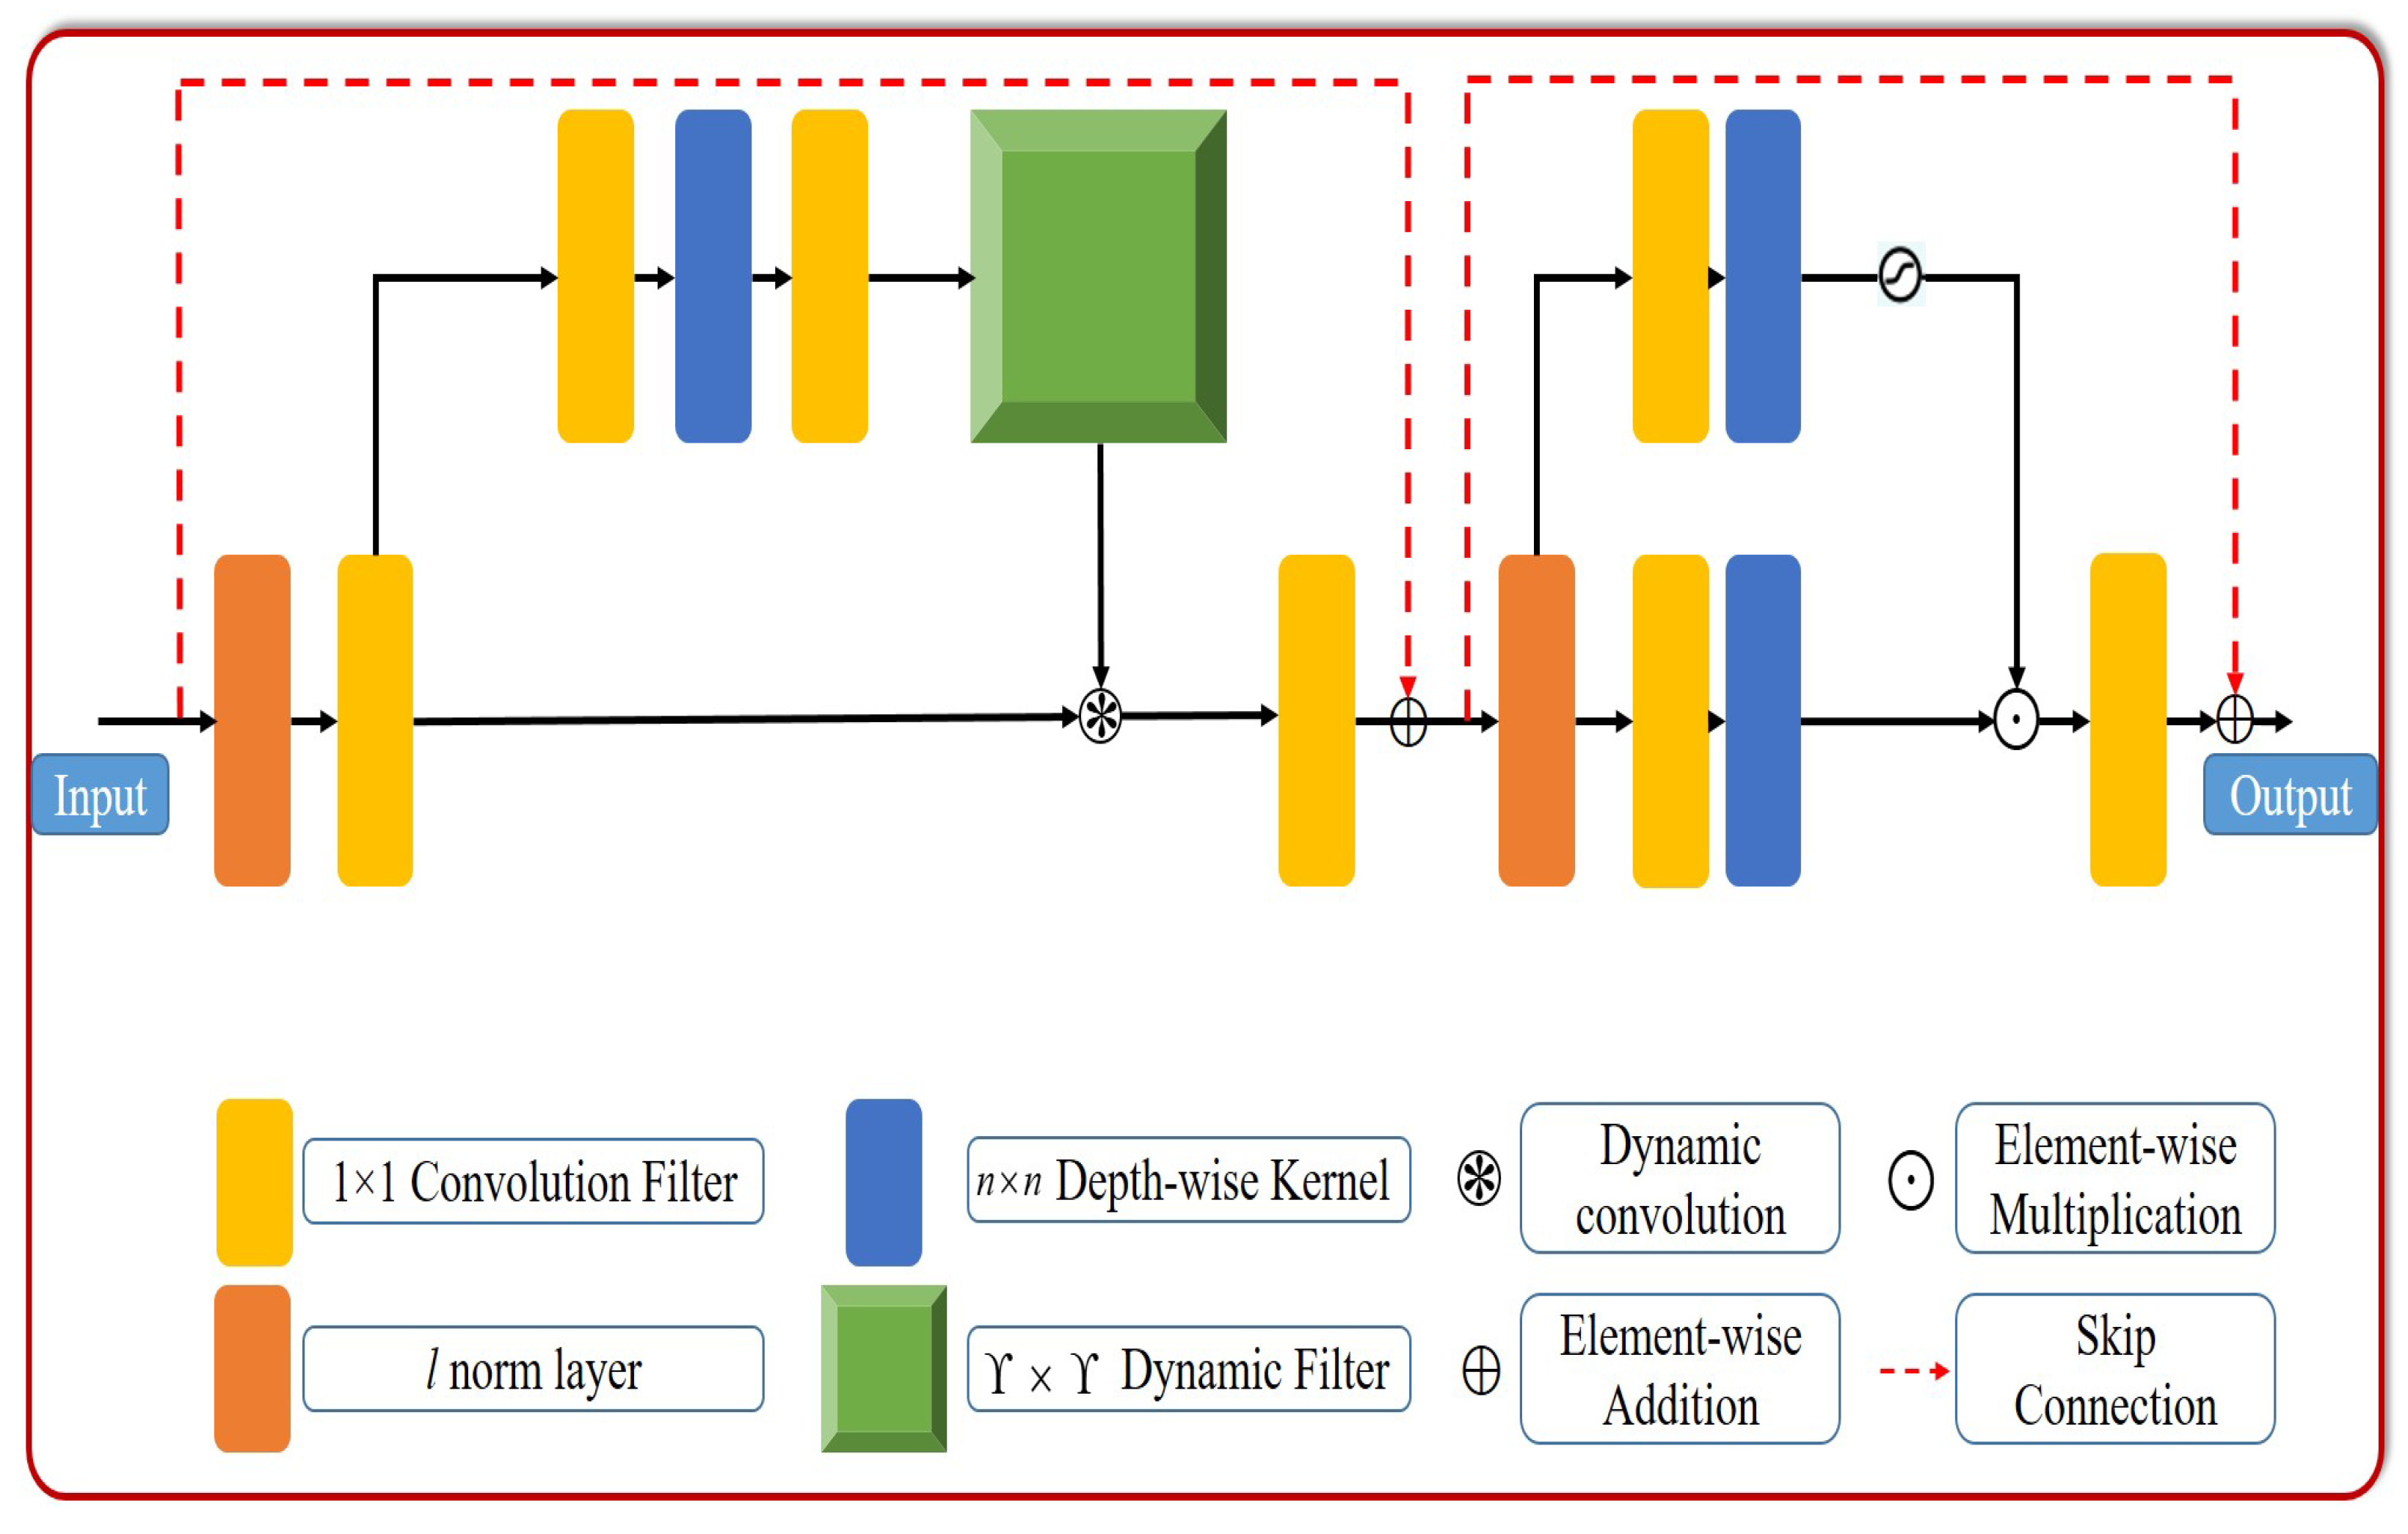
3.2.3. Extensive-Scale Feature-Interacting Module

As shown in Figure 1, the shallow feature extraction network produces five feature maps with different scales. Subsequently, the obtained features are fed to the extensive-scale feature-interacting (ESFI) module, which starts to fuse the information by integrating the detailed spatial characteristic maps and semantic attributes. More adaptable information utilization can be performed by designating different weights to feature maps at various scales. The ESFI module contains five dynamic self-attention (DSA) units corresponding to each level of the produced features by the shallow network; this process can be expressed as follows:
F i = D S A ( F i )
where F i R N 2 i × M 2 i × S + s is the outcome of the DSA unit at level i, i = 0 , , 4 . The DSA unit is employed when local information is extracted in a dynamic manner. As demonstrated in [53,54], window-based self-attention techniques mitigate the high computational expenses of Transformers and attain satisfactory computer vision outcomes. Nevertheless, the divided windows are unable to assemble the data beyond the windows and are incapable of continually adequately capturing characteristics. The shifted windows result in extra processing time expenses even if they can simulate the long-distance relationships between the characteristics across several windows. Therefore, a straightforward but powerful dynamic self-attention (DSA) layer is developed upon designing a network of Transformers to efficiently and effectively capture local characteristics. This offered DSA layer is capable of overcoming the limitation of computation time complexity. The suggested DSA dynamically examines the local attributes through the calculated spatial-variant filters first. In order to improve local information accumulation, the estimated filters are employed in the input information map as dynamic regional attention. Lastly, we operate a gated feed-forward network (FFN) by [55] on the gathered information to enhance the feature representation, as used in the Transformers that engage a feed-forward network to increase feature expression.
As illustrated in Figure 2, the proposed dynamic self-attention (DSA) takes the acquired feature maps via the shallow feature extraction network F i and applies normalization and convolutional layers to them, which is expressed as follows:
F i n i t i = c o n v 1 × 1 ( L N ( F i ) )
where L N and c o n v 1 × 1 represent normalization and convolutional kernels with a size of 1 × 1 layers, respectively. Subsequently, the squeeze-and-excitation network (SENet) [56] is employed to serve as a dynamic weight generation framework, where the non-linear activation function and layer norm are withdrawn. We additionally utilize a depth-wise convolutional process in the SENet in order to guarantee that the created dynamic weight more accurately represents the local information since the depth-wise convolutional function can better express the local attention [57]. The processes of estimating the suggested dynamic weight can be expressed as follows:
G = D W c o n v n × n ( c o n v 1 × 1 ( F i n i t ) ) G = c o n v 1 × 1 ( G ) Ω ( l ) = r e s h a p e ( G )
where G R N × M × λ S represents the output of the depth-wise convolutional layer, and λ is the factor of the squeezing. D W c o n v n × n represents the depth-wise kernels of size n, l is the index of each pixel, and r e s h a p e ( · ) is a reshaping function. Meanwhile, Ω ( l ) R H × Υ × Υ is acquired with a pixel-wise weight, where Υ × Υ is the dimension of the correlated dynamic filter of each pixel through the dynamic convolution layer. Afterward, the accumulated features through the attained pixel-wise weight Ω can be acquired as follows:
F = Ω * F i n i t
herein, we omit the superscription ( i ) for simplicity, and * represents a dynamic convolution process where the weight is shared across each band. To enrich the representation, the band number is split into H heads to impersonate the multi-head scheme, where each dynamic filter is trained individually in a parallel fashion. Subsequently, since Transformers often utilize feed-forward networks to increase their characteristic expression capabilities, we additionally add an enhanced feed-forward network by [55] to the accumulated characteristics. This process can be expressed as
F = F n e t ( F )
where F n e t is the modified feed-forward network. Ultimately, five bunches of rich intrinsic characteristics are attained at diverse dimensions of receptive fields.

3.2.4. Global Correlation Refinement Module

The ESFI module can dynamically model the characteristics of the fusion images locally since the developed dynamic kernels depend on the entirely plain convolutional architecture; consequently, it is less practical for capturing non-local features. Although the Transformer-based techniques have the capability to capture the non-local features and improve the extracted features by the ESFI module, they are highly time-consuming. In order to capture different intrinsic features more precisely, non-local similarity across different regions of the images and different bands is helpful, taking into account the various sizes and forms of distinct details of the fused images. The receptive field will grow in size as the network gets deeper when a convolution filter of the identical dimension is employed. However, feature expression can be significantly improved by merging features with various receptive fields. This allows features to be more representative and possess better contextual details. Therefore, a global correlation refinement (GCR) module is suggested to gather multi-receptive-field information and strengthen the most successful characteristics to reconstruct the target-fused HRHSI gradually.
An effective transposed self-attention mechanism that captures non-local features along band dimensions was developed and is used by current Transformer-based approaches. Despite its good performance, a softmax activation operation still processes the scaled dot-product attention. However, all of the likenesses across the key and query tokens are preserved by the softmax normalization, although not every token from the query is pertinent to the ones in the keys. Therefore, the subsequent feature accumulation can be impacted if self-attention is yielded by utilizing the softmax normalization. As a result, a straightforward but efficient global correlation refinement (GCR) is proposed (see Figure 3), which can overcome the drawbacks of the softmax normalization by utilizing the rectified linear unit (ReLU). The ReLU activation function preserves the most important attention information for feature accumulation by filtering out the negative values and retaining the positive features.
For any level of the ESFI module, the two neighboring feature scales are combined to formulate the input of the corresponding GCR block as shown in Figure 1; for example, taking the features at levels 5 and 4, this process can be expressed as follows:
G = c a t ( u p ( F 5 ) , F 4 )
where G R N × M × 2 S is the outcome of the concatenation process ( c a t ) of upscaling the features at level 5 to the identical scale as level 4 and the features at level 4, which have the same scale as the features at level 4 ( N and M ) , and the number of bands is S ( S = S + s ). G can serve as the input of the GCR block. Afterward, the output of the first GCR module is up-sampled to the exact dimension of the direct upper level of features acquired from ESFI, and it serves as its couple. This process is repeated until the final target scale of the original fused image is achieved. Given the acquired feature G, the query ( Q ) , key ( K ) , and value ( V ) are generated by the following process:
Q , K , V = D W c o n v n × n ( c o n v 1 × 1 ( L N ( G ) ) )
where L N ( · ) , c o n v 1 × 1 ( · ) , and D W c o n v n × n ( · ) denote the normalization layer, convolutional operation with a kernel size of 1, and depth-wise kernels of size n, respectively. Herein, [ Q , K , V ] R N × M × S . Next, the Q , K , and V are reshaped, and the attention map, which we believe saves the most important information for the accumulation process, is calculated as follows:
A = Re L U Q T K η
where [ Q and K ] R N M × S are the reshaped query ( Q ) and key ( K ) matrices, respectively, T denotes the transpose operation, and η is a trainable parameter. Herein, the acquired attention map A has dimensions of S × S rather than the substantial standard attention matrix of dimensions N M × N M . Given the calculated attention matrix, the accumulated features can be acquired as follows:
G = V · A
where V R N M × S represents the reshaped value V and G R N M × S is the accumulated feature map obtained from the attention process. Finally, the GCR module employs the enhanced feed-forward network to improve the estimation of the outcome features as used in the ESFI module. Therefore, the final output of the GCR block is attained as
G = F n e t ( G )
where F n e t is the modified feed-forward network. Lastly, the GCR module constructs the features gradually, starting from the lower scale until the exact dimensions of the target high-resolution HSI are reached. The final acquired reconstructed feature has an identical size to the HRHSI, but the number of bands is S + s . Therefore, it goes through the final fused image reconstruction block, where the residual connection is also used to force the network to focus on learning the missed information and accelerate the learning process. This process can be expressed as follows:
X = c o n v 3 × 3 ( Re L U ( c o n v 3 × 3 ( G ) + u p ( Y ) ) )
where c o n v 3 × 3 is a convolution layer with a kernel size of 3 and the number of kernels is S. Re L U ( · ) and u p ( · ) represent the activation function (rectified linear unit) and the up-sampling operation (bilinear filter), which upscales the dimensions of the LRHSI to the size of the HRMSI (please refer to Figure 1).

3.3. The Loss Function

Given the observed pair Y j and Z j and the ground truth X j of the reconstructed HSI (where j = 1 , , J is the number of training dataset batches), the loss function of the proposed EFINet technique is computed as follows:
L m s e = arg min Θ j = 1 J EFINet ( Y j , Z j ; Θ ) X j 1
where · 1 is l 1 n o r m , which calculates the transparency between the obtained fused image and the ground truth and reduces the error map. Equation (17) helps to reduce the spectral distortion, and therefore, we apply SSIM loss as a part of the introduced loss function where the spatial detail quality can be further improved. The L s s i m function can be calculated as follows:
L s s i m = 1 J j = 1 J SSIM ( EFINet ( Y j , Z j ) ; X j )
Finally, the overall loss function for training the proposed model is achieved as follows:
L f i n a l = L m s e + μ L s s i m
where μ denotes the balancing parameter that controls the contribution of L s s i m to the overall loss function. Herein, we empirically set μ = 0.1 .

4. Experimental Outcomes and Discussion

4.1. Empirical Databases

Two popular remote sensing datasets, Houston [58] and Chikusei [59], are utilized to verify the performance of the proposed network. We describe the experimental datasets in the subsequent section.
(1)
Houston dataset: The Houston 2018 image is a remote sensing hyperspectral image captured over the University of Houston campus in February 2017. It was taken from the 2018 IEEE GRSS Data Fusion Challenge. The Houston hyperspectral image was acquired by utilizing the ITRES CASI-1500 hyperspectral imaging device and the Optech Titam multiwave (MW) (14SEN/CON340) sensor’s LiDAR information as well, with a spatial size of 601 × 2384 pixels. Spanning from the 380 to 1050 nm range, the Houston dataset contains 50 spectral channels, where f o u r spectral bands with low SNR are discarded, and 46 bands remain for our experiment.
(2)
Chikusei dataset: The remote sensing Chikusei hyperspectral dataset was collected over metropolitan and farming regions of Chikusei, Ibaraki, Japan, on 29 July 2014, operating a visible and near-infrared (NIR) hyperspectral imaging instrument. The spectral resolution of the Chikusei dataset is 128 spectral bands covering the spectrum range from 363 to 1018 nm, while the spatial resolution has a size of 2517 × 2335 pixels. For convenience, the central region covering 2048 × 2048 pixels is extracted for the experimentation, where the black boundaries in the geometric resolution are discarded.
The proposed Extensive Feature-Inferring Deep Network (EFINet) method is a supervised network that requires references of the observed pairs, which is not possible in reality. Therefore, we follow Wald’s protocol strategy to prepare the training dataset. Following Wald’s protocol, as depicted in Figure 4, we preserve the original hyperspectral images of the two experimental datasets as the ground truth, where the LRHSI and HRMSI are acquired through the spatial and spectral degradation procedures of the original HSIs, respectively. Specifically, the LRHSIs are simulated from the original hyperspectral datasets employing a 7 × 7 Gaussian filter (with mean 0 and std equal to 2) and downsampling every α × α pixels along the spatial dimension ( α equal to 8 and 16 for the Houston and Chikusei datasets, respectively). Meanwhile, the HRMSIs of the original Houston hyperspectral image are attained through spectral downsampling of the ground truth utilizing the spectral response function of the WorldView satellite. In the same way, IKONOS’s spectral response function is utilized to obtain the HRMSIs of the Chikusei dataset. Through this spectral degradation process, the simulated image that has spectral bands equal to the WorldView satellite spectral channels from the observed Houston HSI (and equal to the IKONOS sensor’s spectral channels from the observed Chikusei HSI) serves as an HRMSI for these experimental datasets [9]. Moreover, we corrupt both simulated images by adding i.i.d Gaussian noise (30 dB and 35 dB for the LRHSI and HRMSI, respectively). We cut non-overlapping 512 × 512 pixels with the training part along the spatial dimension from the two databases for the testing phase.

4.2. The State-of-the-Art HS-MS Image Fusion Techniques for Comparison

Regarding validating the performance of our proposed network, six state-of-the-art HS-MS image fusion methods are compared with the proposed EFINet approach. Among them, three of the comparison techniques are model-based HS-MS image fusion methods, namely, the coupled non-negative matrix factorization (CNMF) approach [14], the non-negative-structured sparse representation (NSSR) approach [31], and the coupled sparse tensor factorization (CSTF) approach [17]. The other three comparison approaches, namely, the deep hyperspectral image-sharpening (DHSIS) approach [46], deep spatiospectral attention CNN (HSRNet) approach [50], and a novel pyramid shuffle-and-reshuffle Transformer (PSRT) approach [52], are learning-based techniques. The source code of all comparison methods is publicly available, where the learning-based techniques are trained with the same training dataset as the proposed network for fair comparison. While the performance results of the competing techniques rely on the simulated data and the other pre-processing operations of the test datasets, all comparison approaches are tested employing the same amount of data and following identical pre-processing operations for fair comparison.

4.3. Quantitative Assessment Indices

Four quantitative measurement metrics are employed to calculate the performance of the comparison techniques, including the suggested EFINet technique. Given the reference image X and estimated fused image X o u t , the details of these four indices are provided below:

4.3.1. Structural Similarity Index (SSIM)

SSIM is a function that calculates the degree of the spatial corruption of the attained fused image compared to its reference; the average of SSIM across all bands is computed as follows:
S S I M ( X , X o u t ) = 1 S i = 1 S S S I M ( X ( i ) , X o u t ( i ) )
The finest value of SSIM is 1, where there is no deterioration.

4.3.2. Peak Signal-to-Noise Ratio (PSNR)

The spectral distortion of the acquired fused image is evaluated through the computation of the PSNR, which is expressed as follows:
P S N R ( X , X o u t ) = 1 S i = 1 S P S N R ( X ( i ) , X o u t ( i ) )
As the value of the PSNR increases, it indicates better performance, and the best value of the PSNR is ∞.

4.3.3. Spectral Angle Mapper (SAM)

Where zero implies the best value of the SAM, the SAM estimates the absolute weight of the spectrum gradients (degrees) between two images as follows:
S A M ( X , X o u t ) = 1 S i = 1 S arcos X ( i ) T X o u t ( i ) X ( i ) 2 X o u t ( i ) 2

4.3.4. Relative Dimension Global Error in Synthesis (ERGAS)

ERGAS assesses the overall falsehoods across all spectral channels of the gained fused image and its corresponding ground truth; this index can be expressed as follows:
E R G A S ( X , X o u t ) = 100 d 1 S i = 1 S M S E ( X ( i ) , X o u t ( i ) ) τ ( X o u t ( i ) ) 2
where M S E is the mean squared error. The best value of ERGAS is Z e r o .

4.4. Implementation Details

The proposed Extensive Feature-Inferring Deep Network (EFINet) strategy is an end-to-end supervised network whose learnable parameters are optimized by operating an ADAM optimizer where the momentum is set to 0.999 , we initialize the learning rate by 1 × 10⁻³, and it decreases by h a l f every twenty_five iterations. All the trainable parameters are initialized by using xavier_normal . The number of total epochs equals 200, as illustrated in Figure 5, and the number of batches is e i g h t . The number of scale levels of the features of the proposed EFINet is set equal to 5; please refer to Figure 6. All experiments are conducted employing the PyTorch 2.4.1 module and NVIDIA GeForce RTX 3090, where the RAM is 32 GB.

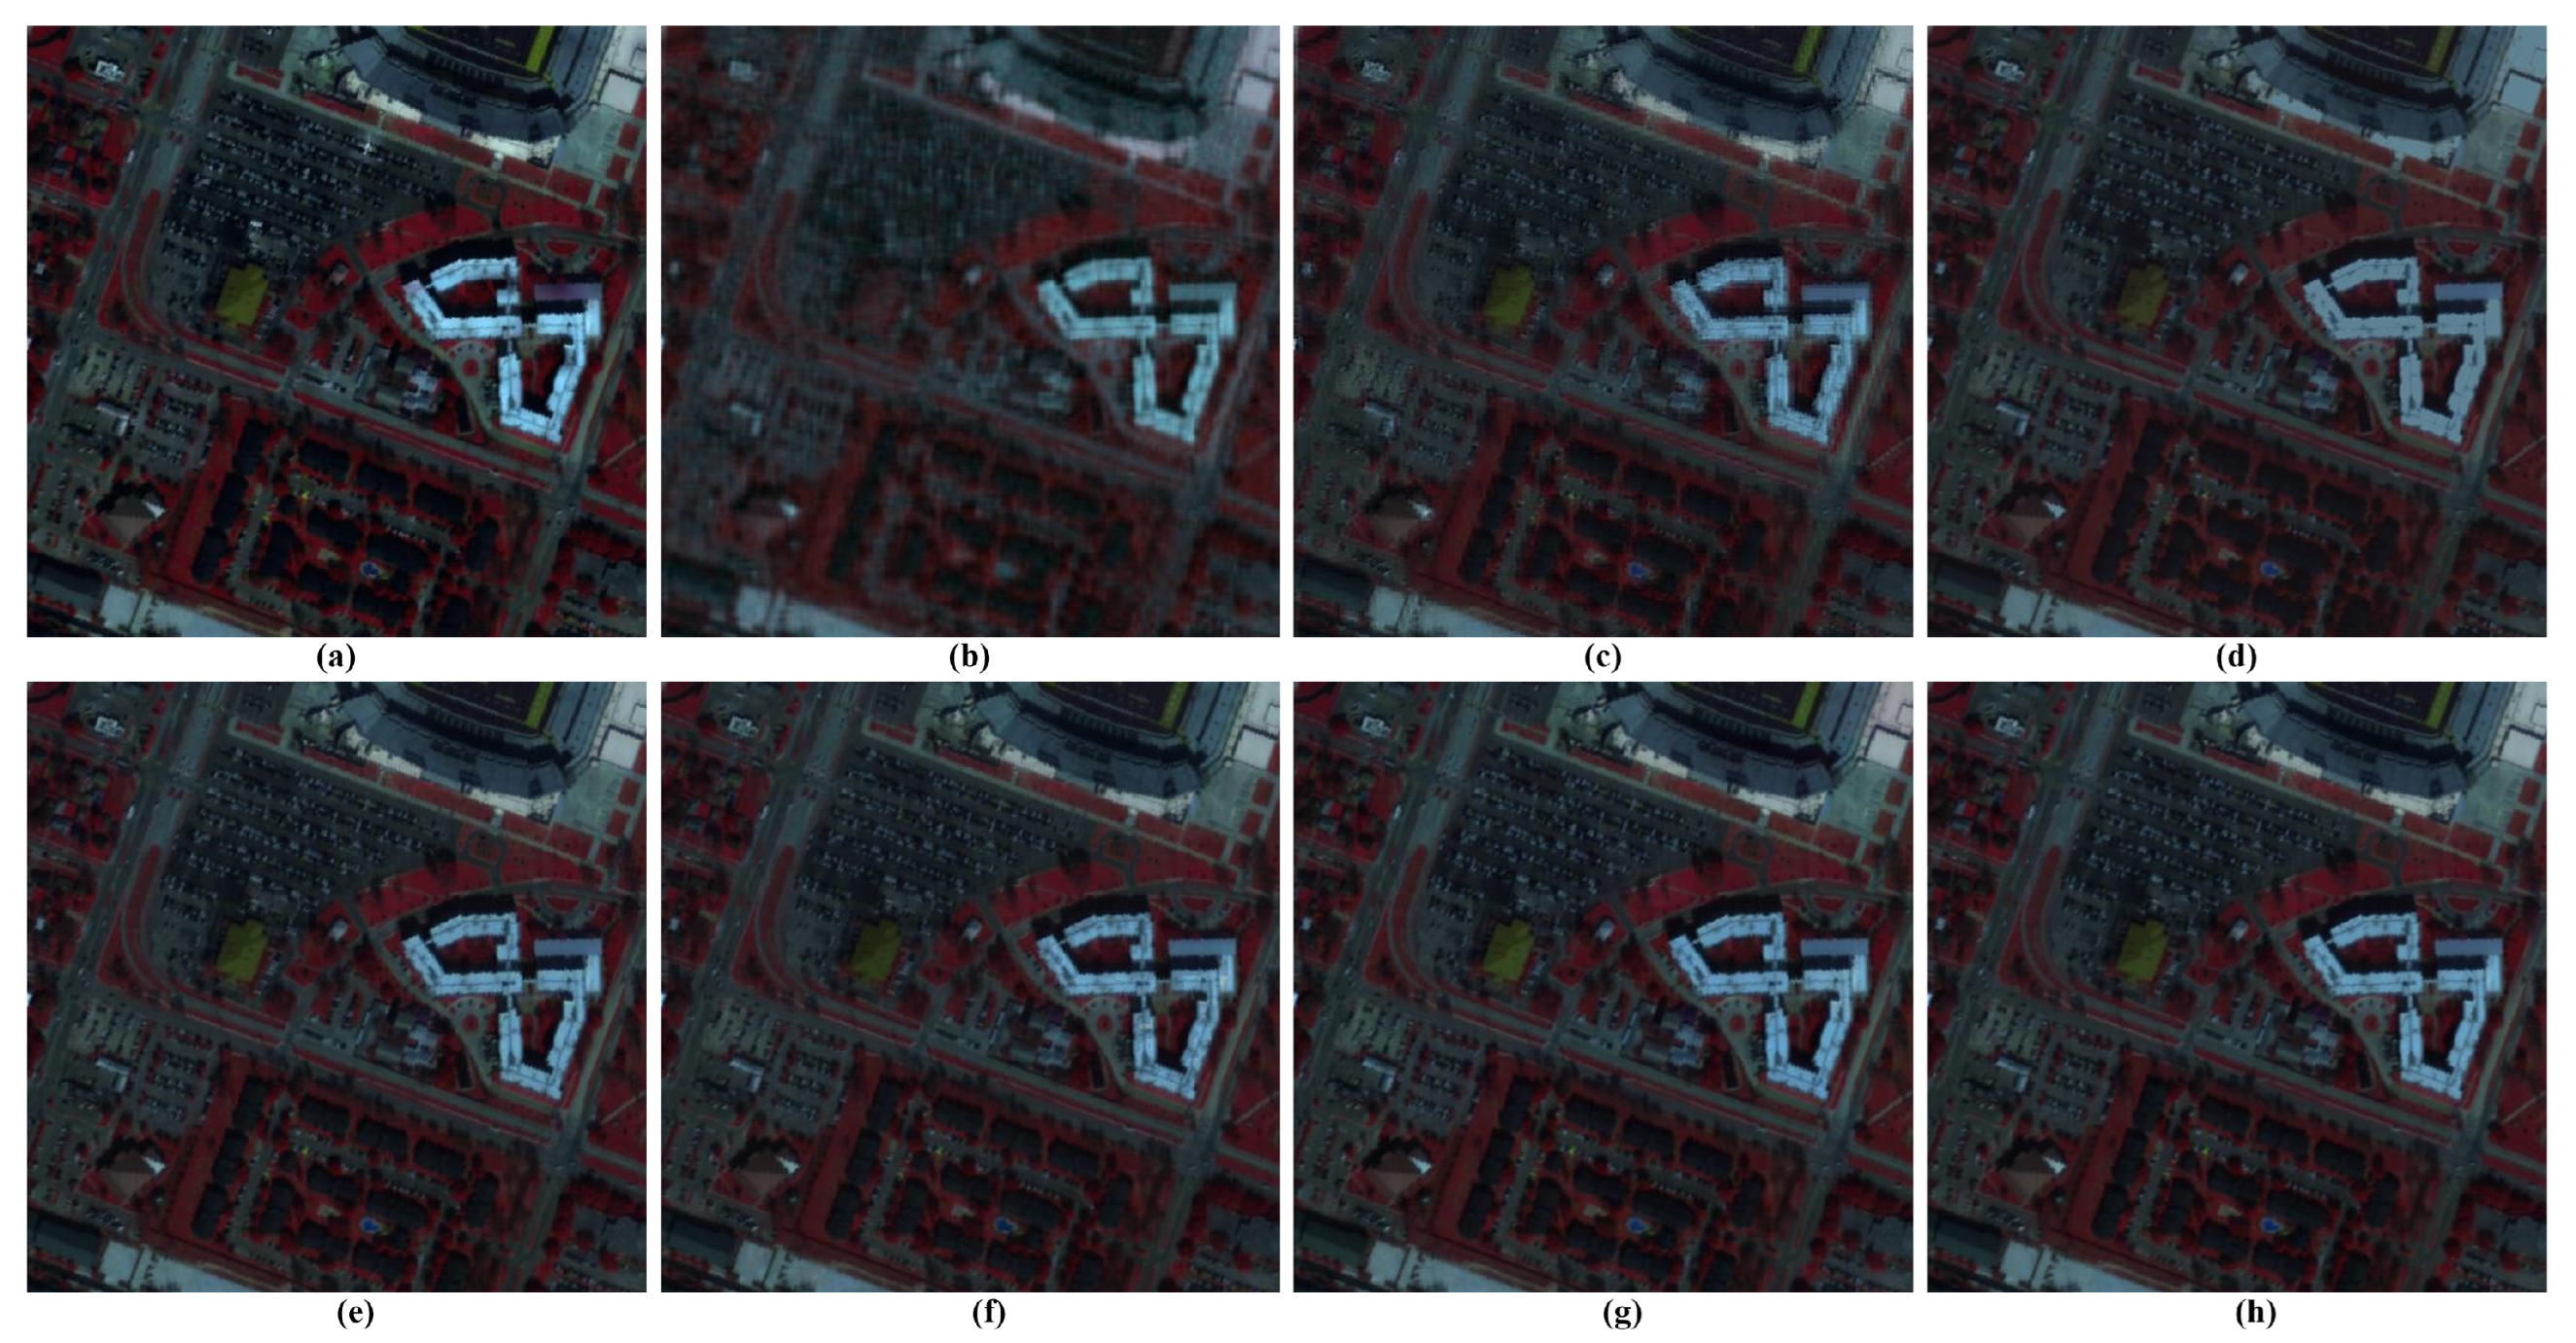
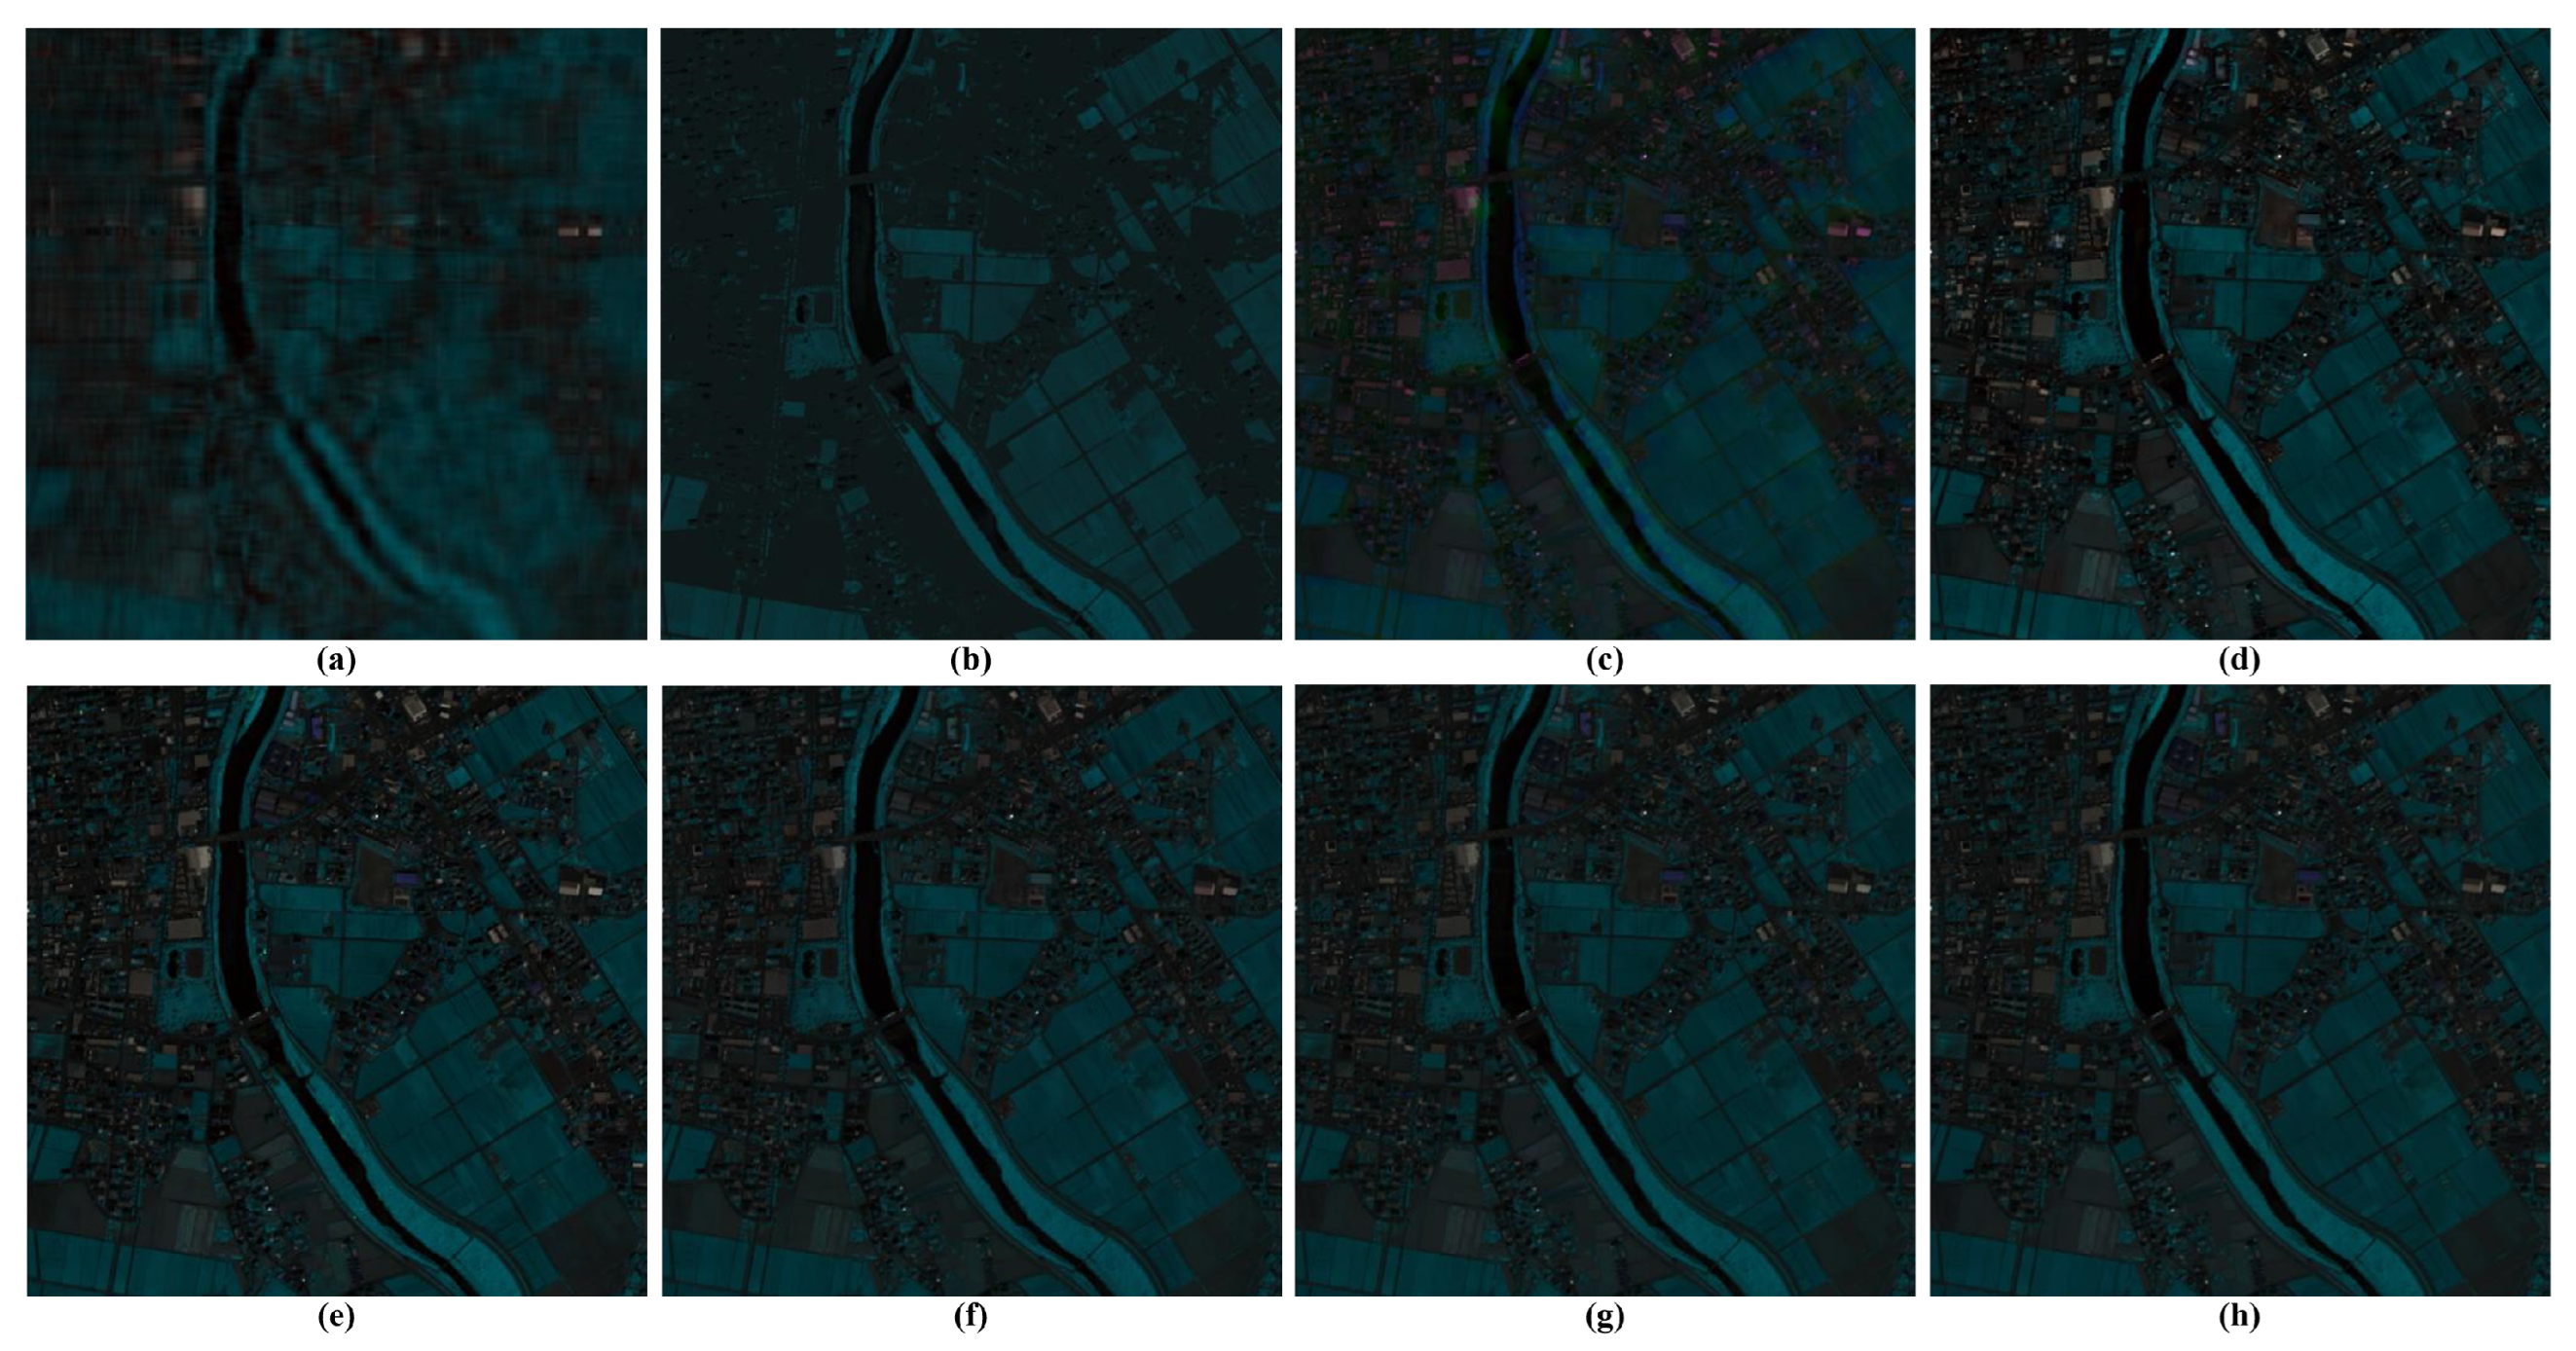
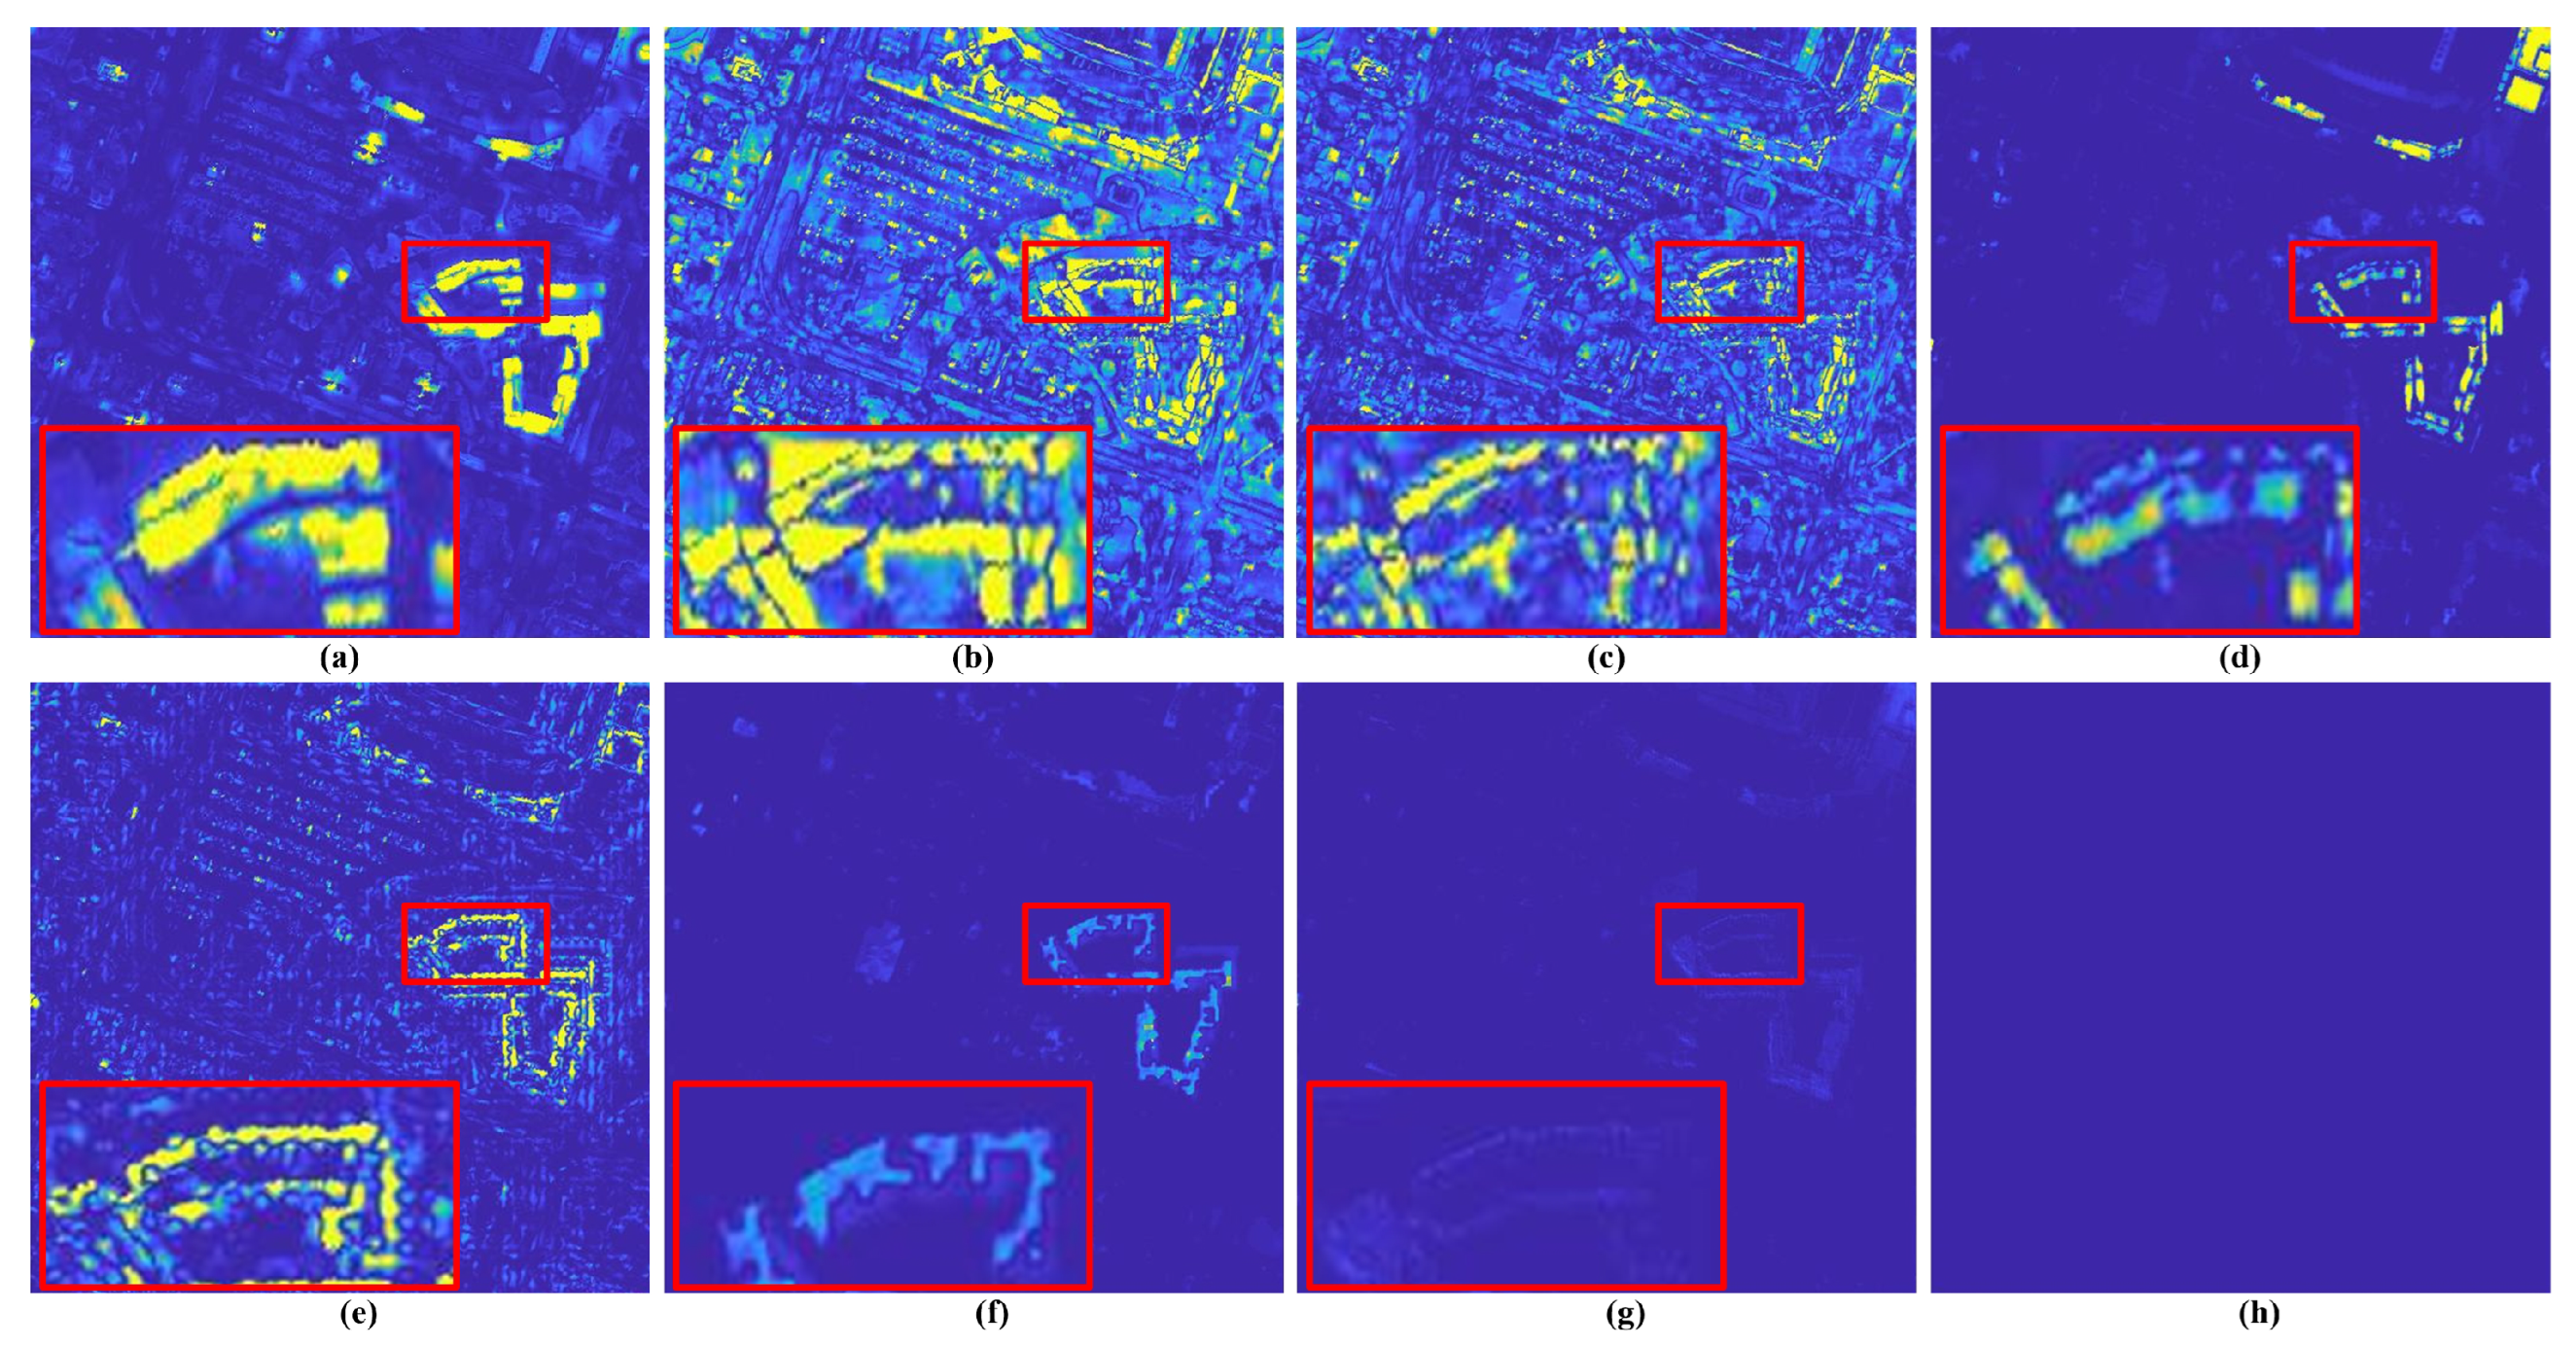
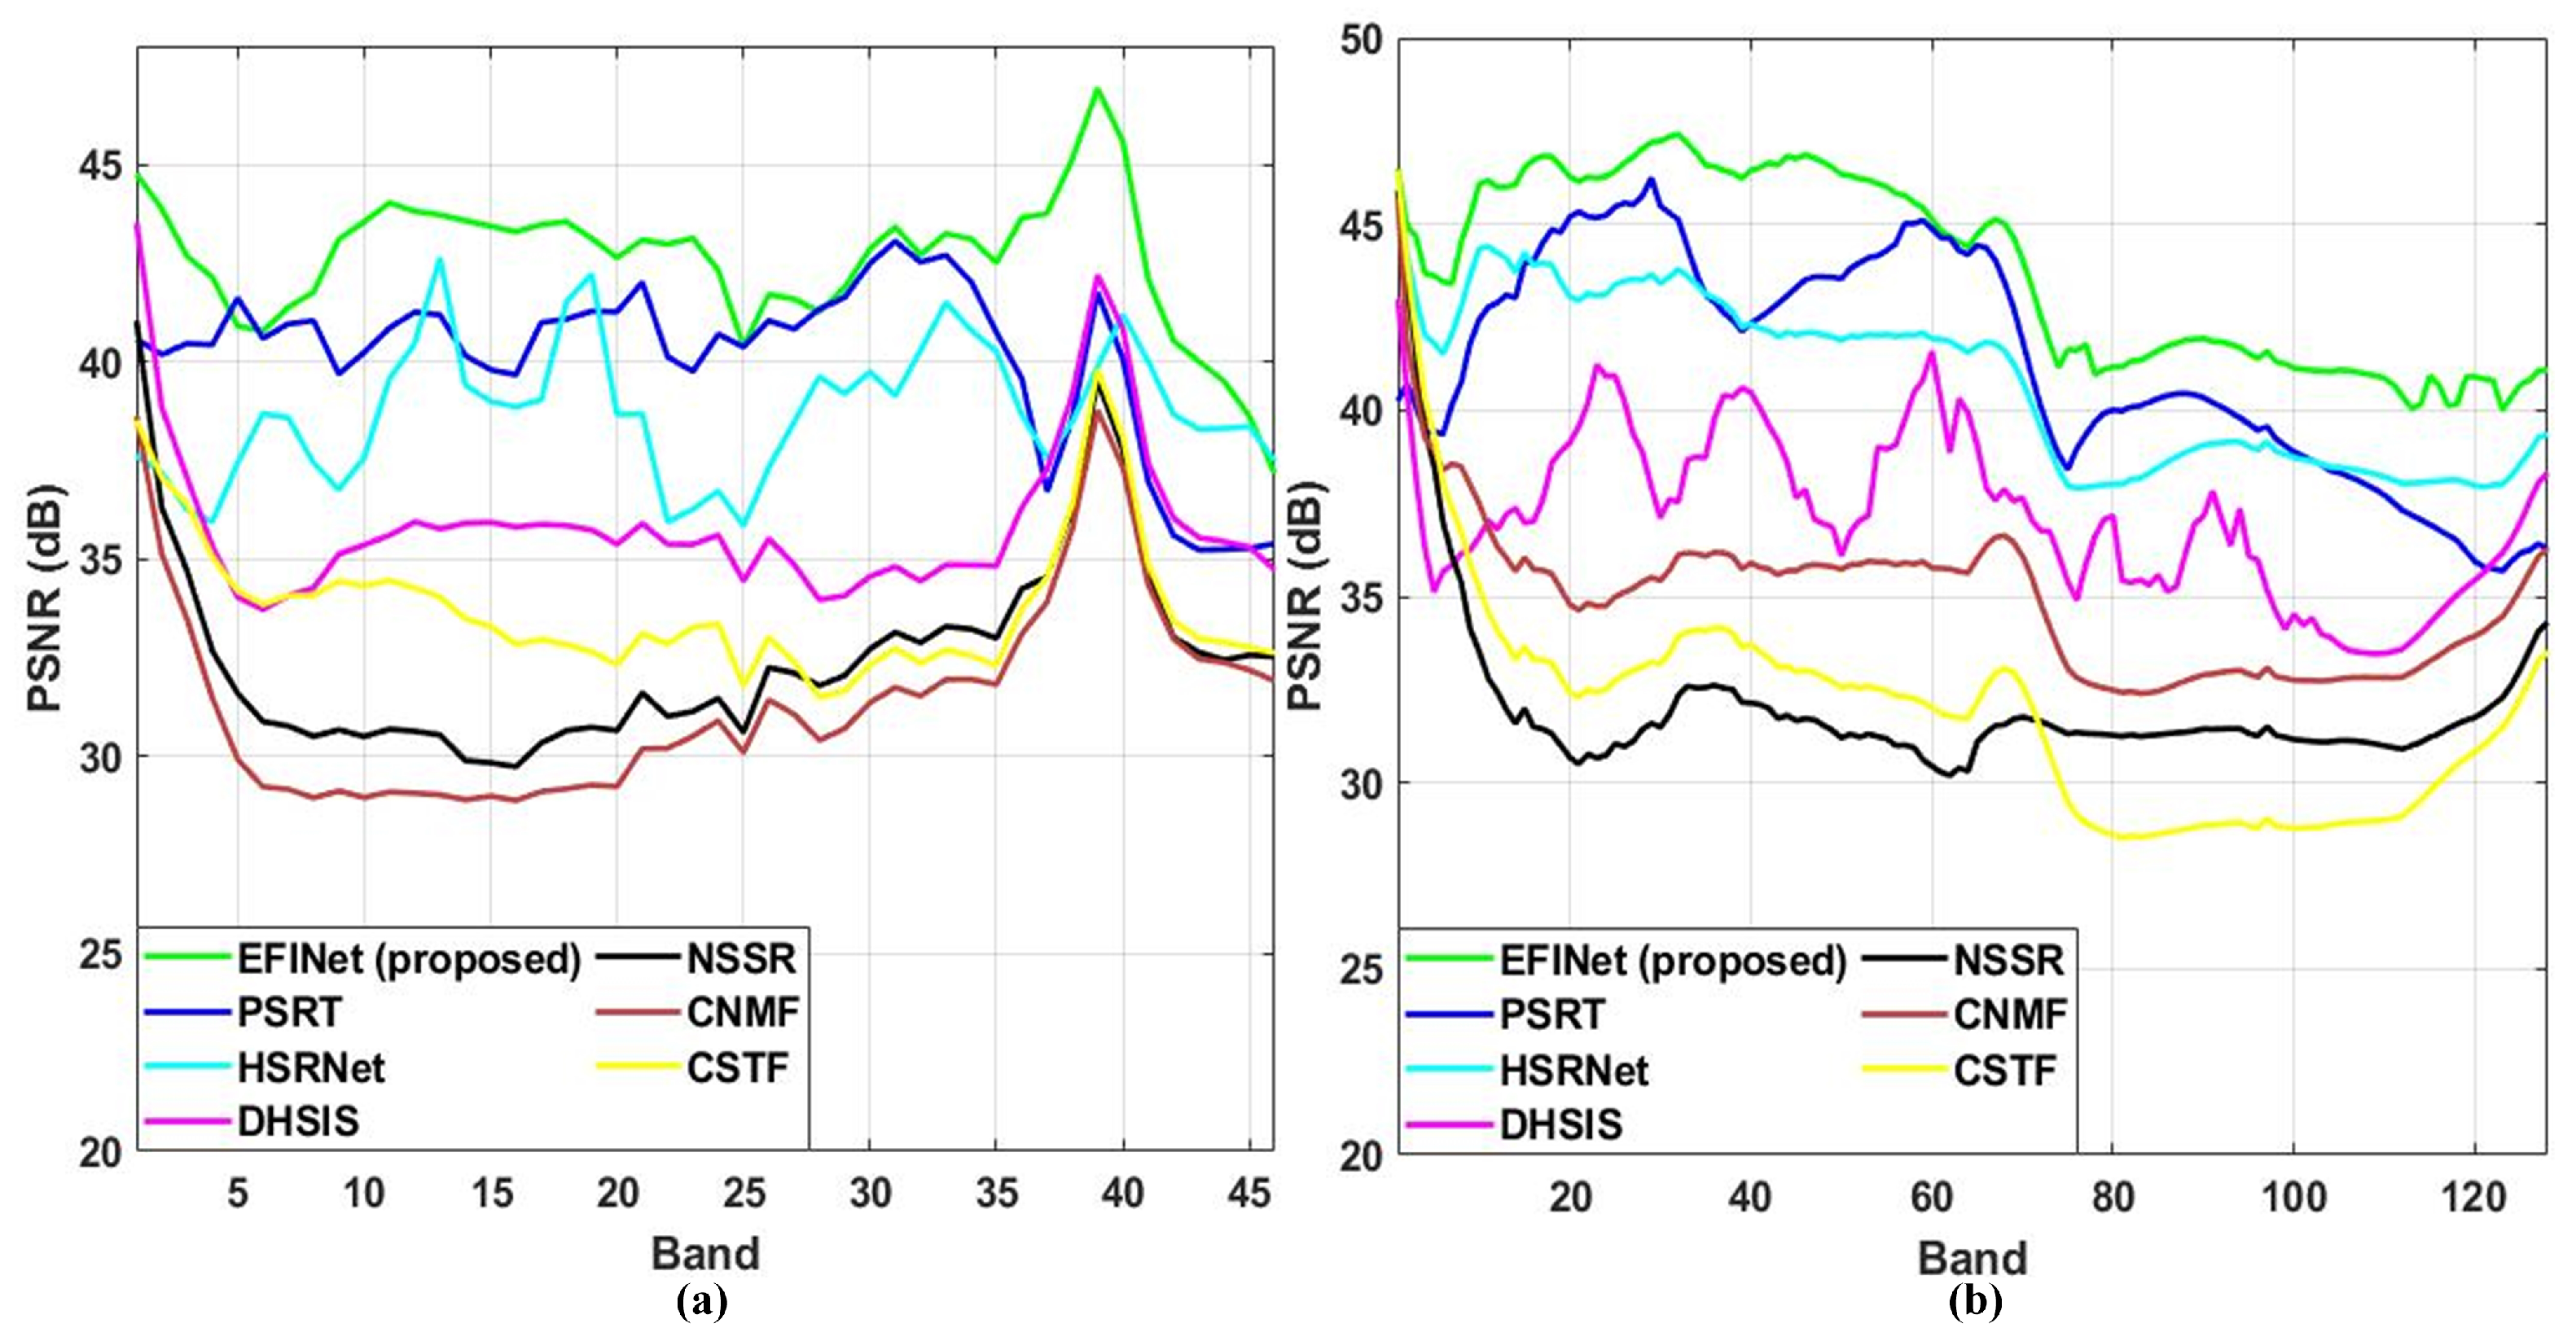
4.5. Experimental Outcomes and Discussion
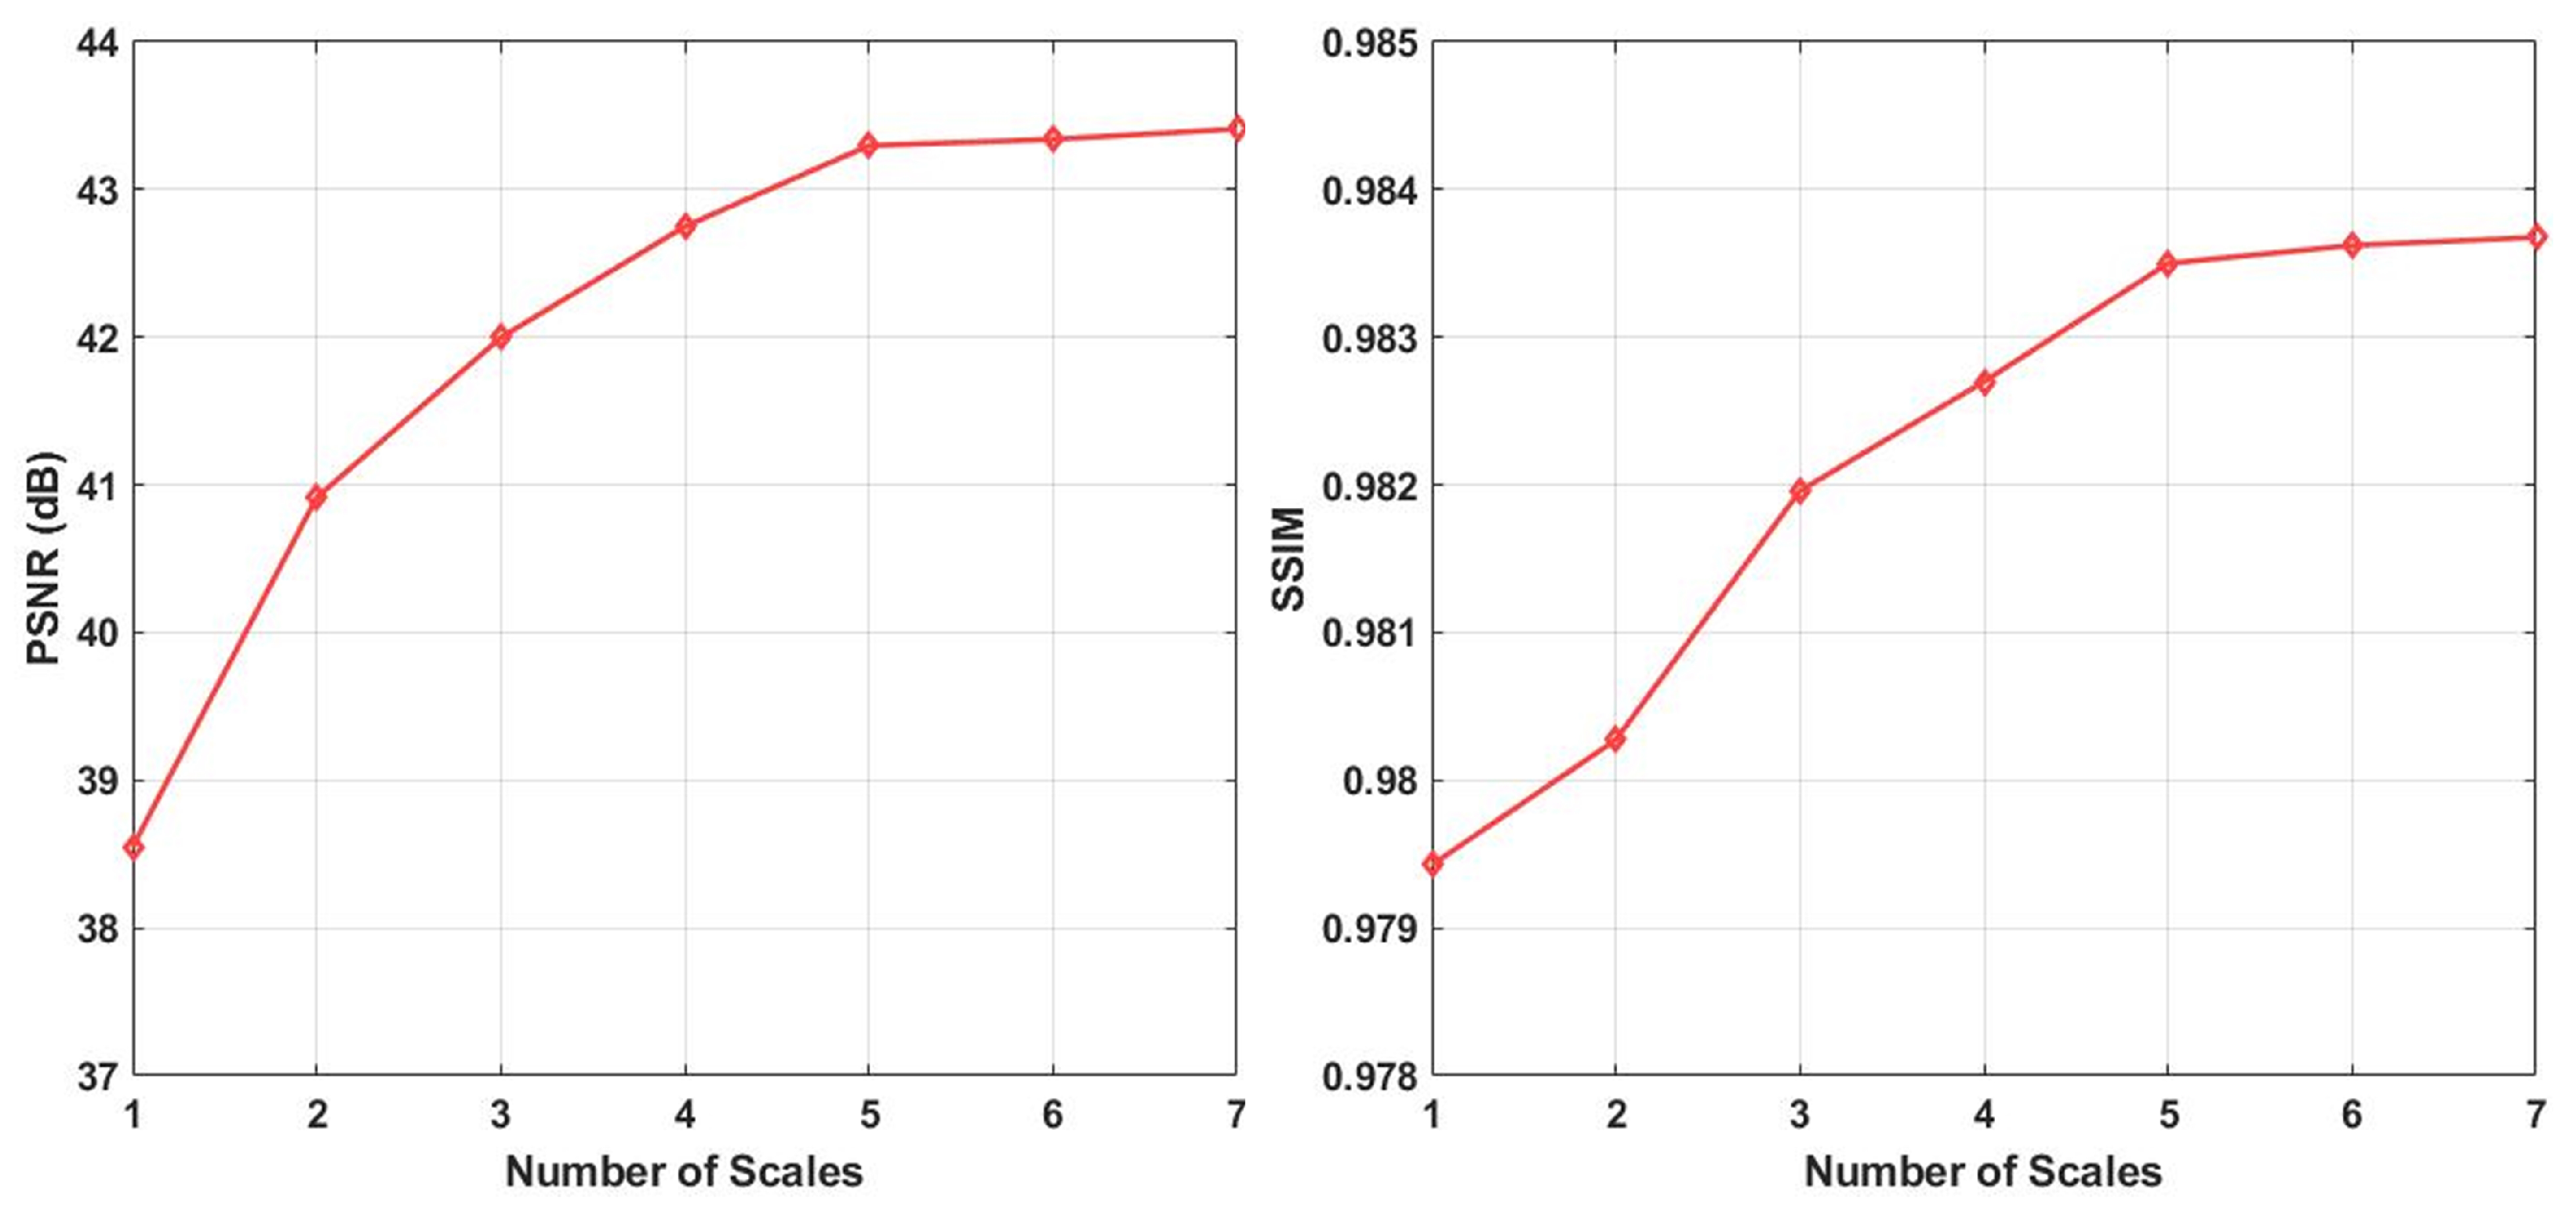
Both qualitative and quantitative aspects of the experiment that validate the performance of the proposed approach are assessed to show how our suggested approach has advanced. In every quantitative metric, the suggested technique demonstrates more notable advantages than alternative comparison techniques for the experimentations conducted on the Houston dataset, as shown in Table 1, where the best achievements are in bold. Specifically, our suggested network outperforms and attains the best outcomes corresponding to the results of other procedures in terms of the numerical measurements of PSNR, SAM, ERGAS, and SSIM while having the lowest computation time. The suggested strategy exhibits outstanding spectrum detail restoration and spatial characteristic abilities according to the PSNR and SSIM values obtained by our offered strategy, respectively. This exhibits the significance of key components of our technique, the extensive-scale feature-interacting and global correlation refinement modules, to enhance the extraction of the non-local spatial similarity and global spectral correlation features, respectively. Further, the suggested approach gained the lowest ERGAS outcome, revealing little change and dynamic shift between the acquired fused image and its reference among the different experimental approaches.
To further display the effectiveness of the suggested technique, we portray the visually obtained fused images of the experimentations of Houston testing data in Figure 7. The introduced false color of the fused images comprises band 30 for red, band 20 for green, and band 10 for blue. CSTF had much brightness among the earned outcomes, while CNMF and NSSR gained blurred fused images. The DL-based approaches achieved better visual outcomes than the model-based methods. Among them, the network proposed in this paper attained a much closer fused image to the corresponding reference compared to all experimental approaches. Moreover, Figure 8 shows the heat maps acquired by computing the mean square error maps between the gained outcomes of the various experimental methods and the corresponding ground truth to better highlight the differences in the obtained results depicted in Figure 7.
To additionally validate the performance of the proposed EFINet technique, we perform more investigations utilizing the remotely sensed Chikusei dataset, widely used in HS-MS image fusion approaches. As portrayed in Table 2, the suggested approach still outperforms other cutting-edge techniques in terms of reconstructed structure, spatial attributes, and spectrum information preservation for the experiments using the Chikusei dataset, with the most effective computation time of all the tested approaches. Herein, the suggested EFINet network achieved the best texture reconstruction and finest spatial detail conservation according to the best acquired SSIM value (all best outcomes are in bold) among the experimentation methods. Our suggested EFINet approach produces the best spectrum allocation of intensities among the various compared testing approaches based on the SAM, as shown in Table 2. Spectral distortion is one of the most problematic factors in the HS-MS image fusion strategy; however, the proposed EFINet approach in this paper maintained the best performance in terms of avoiding spectral distortion, which is exhibited by the finest value of PSNR reached by our method, as displayed in Table 2. Moreover, our proposed technique still achieved the lowest ERGAS outcome, pointing to smaller dynamic shifts and changes between the obtained fused image and its ground truth among the different testing approaches.
To show the quality of the attained fused image, the visual outcomes for the experimentations of the Chikusei testing image are portrayed in Figure 9. The false color of the displayed fused images contains band 60 for red, band 75 for green, and band 90 for blue. As can be seen from Figure 9, the fused image acquired by CSTF is blurry, while the outcome of CMNF has severe artifacts, particularly in the complex-texture regions. NSSR has blurred results and much spectral distortion, and DHSIS gains better visual outcomes in terms of spatial and spectral information conservation compared to the model-based approaches CSTF, CNMF, and NSSR, although the worst attainment compared to its learning-based counterparts. Among all competitors, including the learning-based techniques, our proposed EFINet method still achieves the best visual results for the Chikusei testing image. To assess the graphical quality of the HSI super-solved from the Chikusei dataset more finely, the residual maps between the fused images’ maps acquired by the compared techniques and the ground truth are displayed in Figure 10. As depicted in Figure 10, the suggested technique intuitively surpasses all comparison approaches when viewed through the lens of residual maps, indicating that it is qualified to provide more precise spatial information.
Furthermore, the PSNR (dB) and SSIM values of the attained fused images in each band displayed along spectra corresponding to the above-mentioned experimental datasets (the Houston and Chikusei datasets) are pictured in Figure 11 and Figure 12, respectively. As depicted in Figure 11, our offered technique has higher band-wise PSNR (dB) results for the highest number of spectral channels among the experimental comparison techniques, where the PSNR (dB) values per band for the Houston dataset are portrayed in Figure 11a and those for the Chikusei dataset in Figure 11b. In the same context, the band-wise SSIM values of the testing datasets, where the SSIM results per channel for the Houston dataset are depicted in Figure 12a and those for the Chikusei dataset in Figure 12b, demonstrate that our suggested network still provides the best SSIM values across the most spectral channels for these testing datasets. In a few words, according to Figure 11 and Figure 12, the channel-wise PSNR (dB) and SSIM values reveal that the sequential spectral features and spatial details can be adequately recovered and maintained by the technique suggested in this paper.
Briefly, our proposed technique, EFINet, is an end-to-end deep learning technique that outperformed the competing traditional methods in terms of computation complexity because it does not need an iterative solution in the test stage. Moreover, the proposed network leverages the ability of deep learning operations for feature extraction, which significantly impacts the improvement of its results compared to these classical approaches. On the other hand, the learning-based HS-MS image fusion methods are highly influenced by the ability to extract the intrinsic features (e.g., SSC, GSC, and NSS) of the observed pair. Therefore, the suggested network processes the fusion images in different spatial sizes where rich information can be attained and better NSS properties can be achieved compared to the learning-based competing approaches. Furthermore, the extracted features are enhanced by utilizing the proposed ESFI block. Moreover, the various feature scales are processed to gradually reconstruct the desired fused image, employing the offered GCR module. The GCR module improves the computation efficiency by using the transposed query instead of the classical attention map. Finally, these proposed components of our network emphasize improving the proposed techniques regarding feature extraction capabilities and computational efficiency.

4.6. Ablation Study

In this part, a comprehensive analysis is conducted to validate the proposed module’s functionality further. This part examines the impact and significance of the two main components of the proposed deep network, extensive-scale feature-interacting and global correlation refinement modules, employing the experimental Chikusei dataset with scale = 16. In this manner, our proposed technique is trained using three architecture versions. For the first version (Net1), we removed the global correlation refinement module, and two convolution layers with ReLU in between were used to serve as the refinement module. The second version (Net2) ignores the extensive-scale feature-interacting module and replaces it with a convolutional filter before passing the feature to the global correlation refinement module. Herein, this convolution layer is employed to enrich the extracted features instead of using the extensive-scale feature-interacting module. The third architecture (Net3) is trained using the original architecture of the proposed network, including both main components: extensive-scale feature-interacting and global correlation refinement modules. The quantitative outcomes of these three versions of the proposed network are depicted in Table 3, revealing the functionality of the proposed extensive-scale feature-interacting and global correlation refinement modules.

4.7. Comparative Experiments Under Different Noise Levels

The HS-MS image fusion problem is highly affected by noise levels. Therefore, comparative experiments under two noise levels are conducted to verify the performance of the proposed technique further. Herein, the tested datasets are corrupted by Gaussian noise where the signal-to-noise ratios (SNRs) in the first level are 10 dB and 15 dB for the LRHSI and HRMSI, respectively, and those in the second level are 30 dB and 35 dB for the LRHSI and HRMSI, respectively. The quantitative results of the experiments conducted on the Houston dataset are computed for each noise level. Table 4 displays the obtained quantitative outcomes that emphasize the efficiency of the proposed EFINet technique under different noise levels compared to the competing approaches.

5. Conclusions

HS-MS image fusion is one of the most efficient and strong methodologies for acquiring HRHSIs, and capturing the intrinsic details is vital to attaining adequate fusion outcomes. Therefore, this article presents a fusion approach called Extensive Feature-Inferring Deep Network (EFINet) for HS and MS image fusion that processes the fused image pair at various scales. The suggested network retains two streams that extend the characteristics of the LRHSI and HRMSI at different scales. The extracted attributes have various sizes at any stage, guaranteeing the capacity to maintain global information across various receptive fields. Thereafter, all corresponding information at the same stage acquired from the observed pair is concatenated along the band dimension after upscaling the LRHSI’s features to the same dimensions as the HRMSI. Subsequently, the extended characteristics are fed to the suggested extensive-scale feature-interacting block after up-sampling all features from the LRHSI at all stages to the same size as the features of the HRMSI at corresponding stages using convolutional filters. Lastly, the characteristics yielded by the ESFI module are combined along the band’s dimension and improved by utilizing the offered GCR modules to reconstruct the desired HRHSI gradually. Comprehensive experiments demonstrate the efficiency of our suggested technique. Future work can either improve the network architecture or concentrate on explicitly training the imaging models. For example, the proposed method can leverage the benefits of traditional approaches such as non-negative matrix factorization (NMF) and tensor factorization, where each operation can be interpreted. Moreover, the proposed network learns the image models implicitly, and it can be further enhanced to estimate these models explicitly.

Author Contributions

Conceptualization, A.K. and L.X.; methodology, A.K. and J.Y.; software, A.K. and Z.D.; validation, A.K., J.Y. and S.A.G.; formal analysis, A.A.; investigation, L.X.; resources, J.Y.; data curation, A.K.; writing—original draft preparation, A.K. and S.A.G.; writing—review and editing, A.A. and Z.D.; visualization, A.A. and Z.D.; supervision, L.X.; project administration, L.X.; funding acquisition, A.K., S.A.G. and L.X. All authors have read and agreed to the published version of the manuscript.

Funding

This paper was funded by Princess Nourah bint Abdulrahman University Researchers Supporting Project, under grant No. (PNURSP2025R755), Nourah bint Abdulrahman University, Riyadh, Saudi Arabia. The authors, therefore, gratefully acknowledge and thank Nourah bint Abdulrahman University for its technical and financial support.

Data Availability Statement

The data that support the findings of this study are available from the first author, Dr. Abdolraheem Khader, upon reasonable request.

Conflicts of Interest

The authors declare no conflicts of interest related to the submission of this manuscript, and all authors have granted their approval for its publication. The paper presents original research that has not been previously published and is not currently being considered for publication elsewhere, either wholly or in part. All of the listed authors have reviewed and approved the enclosed manuscript.

References

  1. Landgrebe, D. Hyperspectral image data analysis. IEEE Signal Process. Mag. 2002, 19, 17–28. [Google Scholar]
  2. Lu, B.; Dao, P.D.; Liu, J.; He, Y.; Shang, J. Recent advances of hyperspectral imaging technology and applications in agriculture. Remote Sens. 2020, 12, 2659. [Google Scholar] [CrossRef]
  3. Vali, A.; Comai, S.; Matteucci, M. Deep learning for land use and land cover classification based on hyperspectral and multispectral earth observation data: A review. Remote Sens. 2020, 12, 2495. [Google Scholar] [CrossRef]
  4. Hill, P.R.; Kumar, A.; Temimi, M.; Bull, D.R. HABNet: Machine learning, remote sensing-based detection of harmful algal blooms. IEEE J. Sel. Top. Appl. Earth Obs. Remote Sens. 2020, 13, 3229–3239. [Google Scholar]
  5. Shimoni, M.; Haelterman, R.; Perneel, C. Hypersectral imaging for military and security applications: Combining myriad processing and sensing techniques. IEEE Geosci. Remote Sens. Mag. 2019, 7, 101–117. [Google Scholar] [CrossRef]
  6. Avtar, R.; Komolafe, A.A.; Kouser, A.; Singh, D.; Yunus, A.P.; Dou, J.; Kumar, P.; Gupta, R.D.; Johnson, B.A.; Minh, H.V.T.; et al. Assessing sustainable development prospects through remote sensing: A review. Remote Sens. Appl. Soc. Environ. 2020, 20, 100402. [Google Scholar] [CrossRef] [PubMed]
  7. Wang, X.; Hu, Q.; Cheng, Y.; Ma, J. Hyperspectral image super-resolution meets deep learning: A survey and perspective. IEEE/CAA J. Autom. Sin. 2023, 10, 1668–1691. [Google Scholar]
  8. Li, Y.; Zhang, L.; Dingl, C.; Wei, W.; Zhang, Y. Single hyperspectral image super-resolution with grouped deep recursive residual network. In Proceedings of the 2018 IEEE Fourth International Conference on Multimedia Big Data (BigMM), Xi’an, China, 13–16 September 2018; IEEE: Piscataway, NJ, USA, 2018; pp. 1–4. [Google Scholar]
  9. Dian, R.; Li, S.; Sun, B.; Guo, A. Recent advances and new guidelines on hyperspectral and multispectral image fusion. Inf. Fusion 2021, 69, 40–51. [Google Scholar]
  10. Alparone, L.; Arienzo, A.; Garzelli, A. Spatial Resolution Enhancement of Satellite Hyperspectral Data Via Nested Hyper-Sharpening with Sentinel-2 Multispectral Data. IEEE J. Sel. Top. Appl. Earth Obs. Remote Sens. 2024, 17, 10956–10966. [Google Scholar]
  11. Kang, X.; Li, S.; Benediktsson, J.A. Feature extraction of hyperspectral images with image fusion and recursive filtering. IEEE Trans. Geosci. Remote Sens. 2013, 52, 3742–3752. [Google Scholar]
  12. Palsson, F.; Sveinsson, J.R.; Ulfarsson, M.O.; Benediktsson, J.A. Model-based fusion of multi-and hyperspectral images using PCA and wavelets. IEEE Trans. Geosci. Remote Sens. 2014, 53, 2652–2663. [Google Scholar] [CrossRef]
  13. Liu, Y.; Chen, X.; Wang, Z.; Wang, Z.J.; Ward, R.K.; Wang, X. Deep learning for pixel-level image fusion: Recent advances and future prospects. Inf. Fusion 2018, 42, 158–173. [Google Scholar]
  14. Yokoya, N.; Yairi, T.; Iwasaki, A. Coupled nonnegative matrix factorization unmixing for hyperspectral and multispectral data fusion. IEEE Trans. Geosci. Remote Sens. 2011, 50, 528–537. [Google Scholar] [CrossRef]
  15. Peng, J.; Sun, W.; Li, H.C.; Li, W.; Meng, X.; Ge, C.; Du, Q. Low-rank and sparse representation for hyperspectral image processing: A review. IEEE Geosci. Remote Sens. Mag. 2021, 10, 10–43. [Google Scholar] [CrossRef]
  16. Wang, K.; Wang, Y.; Zhao, X.L.; Chan, J.C.W.; Xu, Z.; Meng, D. Hyperspectral and multispectral image fusion via nonlocal low-rank tensor decomposition and spectral unmixing. IEEE Trans. Geosci. Remote Sens. 2020, 58, 7654–7671. [Google Scholar] [CrossRef]
  17. Li, S.; Dian, R.; Fang, L.; Bioucas-Dias, J.M. Fusing hyperspectral and multispectral images via coupled sparse tensor factorization. IEEE Trans. Image Process. 2018, 27, 4118–4130. [Google Scholar] [CrossRef] [PubMed]
  18. Ciotola, M.; Guarino, G.; Vivone, G.; Poggi, G.; Chanussot, J.; Plaza, A.; Scarpa, G. Hyperspectral Pansharpening: Critical review, tools, and future perspectives. IEEE Geosci. Remote Sens. Mag. 2024, 13, 311–338. [Google Scholar] [CrossRef]
  19. Dong, W.; Zhang, T.; Qu, J.; Li, Y.; Xia, H. A spatial–spectral dual-optimization model-driven deep network for hyperspectral and multispectral image fusion. IEEE Trans. Geosci. Remote Sens. 2022, 60, 1–16. [Google Scholar]
  20. Shen, H.; Jiang, M.; Li, J.; Yuan, Q.; Wei, Y.; Zhang, L. Spatial–spectral fusion by combining deep learning and variational model. IEEE Trans. Geosci. Remote Sens. 2019, 57, 6169–6181. [Google Scholar] [CrossRef]
  21. Vivone, G.; Deng, L.J.; Deng, S.; Hong, D.; Jiang, M.; Li, C.; Li, W.; Shen, H.; Wu, X.; Xiao, J.L.; et al. Deep Learning in Remote Sensing Image Fusion: Methods, protocols, data, and future perspectives. IEEE Geosci. Remote Sens. Mag. 2024, 13, 269–310. [Google Scholar] [CrossRef]
  22. Khader, A.; Xiao, L.; Yang, J. A model-guided deep convolutional sparse coding network for hyperspectral and multispectral image fusion. Int. J. Remote Sens. 2022, 43, 2268–2295. [Google Scholar] [CrossRef]
  23. Xu, S.; Amira, O.; Liu, J.; Zhang, C.X.; Zhang, J.; Li, G. HAM-MFN: Hyperspectral and multispectral image multiscale fusion network with RAP loss. IEEE Trans. Geosci. Remote Sens. 2020, 58, 4618–4628. [Google Scholar] [CrossRef]
  24. Yang, J.; Zhao, Y.Q.; Chan, J.C.W. Hyperspectral and multispectral image fusion via deep two-branches convolutional neural network. Remote Sens. 2018, 10, 800. [Google Scholar] [CrossRef]
  25. Chernyavskiy, A.; Ilvovsky, D.; Nakov, P. Transformers:“The end of history” for natural language processing? In Proceedings of the Machine Learning and Knowledge Discovery in Databases. Research Track: European Conference, ECML PKDD 2021, Bilbao, Spain, 13–17 September 2021; Proceedings, Part III 21. Springer: Berlin/Heidelberg, Germany, 2021; pp. 677–693. [Google Scholar]
  26. Tang, B.; Matteson, D.S. Probabilistic transformer for time series analysis. Adv. Neural Inf. Process. Syst. 2021, 34, 23592–23608. [Google Scholar]
  27. Chen, L.; Vivone, G.; Qin, J.; Chanussot, J.; Yang, X. Spectral–spatial transformer for hyperspectral image sharpening. IEEE Trans. Neural Netw. Learn. Syst. 2023, 35, 16733–16747. [Google Scholar] [CrossRef]
  28. Ma, Q.; Jiang, J.; Liu, X.; Ma, J. Learning a 3D-CNN and transformer prior for hyperspectral image super-resolution. Inf. Fusion 2023, 100, 101907. [Google Scholar] [CrossRef]
  29. Zhuo, Y.W.; Zhang, T.J.; Hu, J.F.; Dou, H.X.; Huang, T.Z.; Deng, L.J. A deep-shallow fusion network with multidetail extractor and spectral attention for hyperspectral pansharpening. IEEE J. Sel. Top. Appl. Earth Obs. Remote Sens. 2022, 15, 7539–7555. [Google Scholar] [CrossRef]
  30. Hu, J.F.; Huang, T.Z.; Deng, L.J.; Dou, H.X.; Hong, D.; Vivone, G. Fusformer: A transformer-based fusion network for hyperspectral image super-resolution. IEEE Geosci. Remote Sens. Lett. 2022, 19, 1–5. [Google Scholar] [CrossRef]
  31. Dong, W.; Fu, F.; Shi, G.; Cao, X.; Wu, J.; Li, G.; Li, X. Hyperspectral image super-resolution via non-negative structured sparse representation. IEEE Trans. Image Process. 2016, 25, 2337–2352. [Google Scholar] [CrossRef]
  32. Li, X.; Zhang, Y.; Ge, Z.; Cao, G.; Shi, H.; Fu, P. Adaptive nonnegative sparse representation for hyperspectral image super-resolution. IEEE J. Sel. Top. Appl. Earth Obs. Remote Sens. 2021, 14, 4267–4283. [Google Scholar] [CrossRef]
  33. Zhou, Y.; Feng, L.; Hou, C.; Kung, S.Y. Hyperspectral and multispectral image fusion based on local low rank and coupled spectral unmixing. IEEE Trans. Geosci. Remote Sens. 2017, 55, 5997–6009. [Google Scholar] [CrossRef]
  34. Peng, Y.; Li, W.; Luo, X.; Du, J.; Gan, Y.; Gao, X. Integrated fusion framework based on semicoupled sparse tensor factorization for spatio-temporal–spectral fusion of remote sensing images. Inf. Fusion 2021, 65, 21–36. [Google Scholar] [CrossRef]
  35. Borsoi, R.A.; Prévost, C.; Usevich, K.; Brie, D.; Bermudez, J.C.; Richard, C. Coupled tensor decomposition for hyperspectral and multispectral image fusion with inter-image variability. IEEE J. Sel. Top. Signal Process. 2021, 15, 702–717. [Google Scholar] [CrossRef]
  36. Liu, N.; Li, W.; Tao, R. Geometric low-rank tensor approximation for remotely sensed hyperspectral and multispectral imagery fusion. In Proceedings of the ICASSP 2022—2022 IEEE International Conference on Acoustics, Speech and Signal Processing (ICASSP), Singapore, 22–27 May 2022; IEEE: Piscataway, NJ, USA, 2022; pp. 2819–2823. [Google Scholar]
  37. Dian, R.; Li, S. Hyperspectral image super-resolution via subspace-based low tensor multi-rank regularization. IEEE Trans. Image Process. 2019, 28, 5135–5146. [Google Scholar] [CrossRef]
  38. Tian, X.; Li, K.; Zhang, W.; Wang, Z.; Ma, J. Interpretable model-driven deep network for hyperspectral, multispectral, and panchromatic image fusion. IEEE Trans. Neural Netw. Learn. Syst. 2023, 35, 14382–14395. [Google Scholar] [CrossRef] [PubMed]
  39. Jin, W.; Wang, M.; Wang, W.; Yang, G. FS-Net: Four-stream Network with Spatial-spectral Representation Learning for Hyperspectral and Multispecral Image Fusion. IEEE J. Sel. Top. Appl. Earth Obs. Remote Sens. 2023, 16, 8845–8857. [Google Scholar] [CrossRef]
  40. Cao, X.; Lian, Y.; Wang, K.; Ma, C.; Xu, X. Unsupervised hybrid network of transformer and CNN for blind hyperspectral and multispectral image fusion. IEEE Trans. Geosci. Remote Sens. 2024, 62, 1–15. [Google Scholar] [CrossRef]
  41. Li, W.; Li, L.; Peng, M.; Tao, R. KANDiff: Kolmogorov–Arnold Network and Diffusion Model-Based Network for Hyperspectral and Multispectral Image Fusion. Remote Sens. 2025, 17, 145. [Google Scholar] [CrossRef]
  42. Dong, C.; Loy, C.C.; He, K.; Tang, X. Learning a deep convolutional network for image super-resolution. In Proceedings of the Computer Vision–ECCV 2014: 13th European Conference, Zurich, Switzerland, 6–12 September 2014; Proceedings, Part IV 13. Springer: Berlin/Heidelberg, Germany, 2014; pp. 184–199. [Google Scholar]
  43. Dong, C.; Loy, C.C.; He, K.; Tang, X. Image super-resolution using deep convolutional networks. IEEE Trans. Pattern Anal. Mach. Intell. 2015, 38, 295–307. [Google Scholar]
  44. Yang, J.; Fu, X.; Hu, Y.; Huang, Y.; Ding, X.; Paisley, J. PanNet: A deep network architecture for pan-sharpening. In Proceedings of the IEEE International Conference on Computer Vision, Venice, Italy, 22–29 October 2017; pp. 5449–5457. [Google Scholar]
  45. Zhou, F.; Hang, R.; Liu, Q.; Yuan, X. Pyramid fully convolutional network for hyperspectral and multispectral image fusion. IEEE J. Sel. Top. Appl. Earth Obs. Remote Sens. 2019, 12, 1549–1558. [Google Scholar] [CrossRef]
  46. Dian, R.; Li, S.; Guo, A.; Fang, L. Deep hyperspectral image sharpening. IEEE Trans. Neural Netw. Learn. Syst. 2018, 29, 5345–5355. [Google Scholar] [PubMed]
  47. Zheng, Y.; Li, J.; Li, Y.; Guo, J.; Wu, X.; Chanussot, J. Hyperspectral pansharpening using deep prior and dual attention residual network. IEEE Trans. Geosci. Remote Sens. 2020, 58, 8059–8076. [Google Scholar]
  48. Wang, K.; Liao, X.; Li, J.; Meng, D.; Wang, Y. Hyperspectral image super-resolution via knowledge-driven deep unrolling and transformer embedded convolutional recurrent neural network. IEEE Trans. Image Process. 2023, 32, 4581–4594. [Google Scholar] [PubMed]
  49. Liu, S.; Liu, S.; Zhang, S.; Li, B.; Hu, W.; Zhang, Y.D. SSAU-Net: A spectral–spatial attention-based U-Net for hyperspectral image fusion. IEEE Trans. Geosci. Remote Sens. 2022, 60, 1–16. [Google Scholar]
  50. Hu, J.F.; Huang, T.Z.; Deng, L.J.; Jiang, T.X.; Vivone, G.; Chanussot, J. Hyperspectral image super-resolution via deep spatiospectral attention convolutional neural networks. IEEE Trans. Neural Netw. Learn. Syst. 2021, 33, 7251–7265. [Google Scholar]
  51. Jha, A.; Bose, S.; Banerjee, B. GAF-Net: Improving the performance of remote sensing image fusion using novel global self and cross attention learning. In Proceedings of the IEEE/CVF Winter Conference on Applications of Computer Vision, Waikoloa, HI, USA, 2–7 January 2023; pp. 6354–6363. [Google Scholar]
  52. Deng, S.Q.; Deng, L.J.; Wu, X.; Ran, R.; Hong, D.; Vivone, G. PSRT: Pyramid shuffle-and-reshuffle transformer for multispectral and hyperspectral image fusion. IEEE Trans. Geosci. Remote Sens. 2023, 61, 1–15. [Google Scholar]
  53. Liang, J.; Cao, J.; Sun, G.; Zhang, K.; Van Gool, L.; Timofte, R. Swinir: Image restoration using swin transformer. In Proceedings of the IEEE/CVF International Conference on Computer Vision, Montreal, QC, Canada, 11–17 October 2021; pp. 1833–1844. [Google Scholar]
  54. Zhang, X.; Zeng, H.; Guo, S.; Zhang, L. Efficient long-range attention network for image super-resolution. In Proceedings of the European Conference on Computer Vision, Tel Aviv, Israel, 23–27 October 2022; Springer: Berlin/Heidelberg, Germany, 2022; pp. 649–667. [Google Scholar]
  55. Zamir, S.W.; Arora, A.; Khan, S.; Hayat, M.; Khan, F.S.; Yang, M.H. Restormer: Efficient transformer for high-resolution image restoration. In Proceedings of the IEEE/CVF Conference on Computer Vision and Pattern Recognition, New Orleans, LA, USA, 18–24 June 2022; pp. 5728–5739. [Google Scholar]
  56. Hu, J.; Shen, L.; Sun, G. Squeeze-and-excitation networks. In Proceedings of the IEEE Conference on Computer Vision and Pattern Recognition, Salt Lake City, UT, USA, 18–22 June 2018; pp. 7132–7141. [Google Scholar]
  57. Liu, Z.; Mao, H.; Wu, C.Y.; Feichtenhofer, C.; Darrell, T.; Xie, S. A convnet for the 2020s. In Proceedings of the IEEE/CVF Conference on Computer Vision and Pattern Recognition, New Orleans, LA, USA, 18–24 June 2022; pp. 11976–11986. [Google Scholar]
  58. Xu, Y.; Du, B.; Zhang, L.; Cerra, D.; Pato, M.; Carmona, E.; Prasad, S.; Yokoya, N.; Hänsch, R.; Le Saux, B. Advanced multi-sensor optical remote sensing for urban land use and land cover classification: Outcome of the 2018 IEEE GRSS data fusion contest. IEEE J. Sel. Top. Appl. Earth Obs. Remote Sens. 2019, 12, 1709–1724. [Google Scholar]
  59. Yokoya, N.; Iwasaki, A. Airborne hyperspectral data over Chikusei. Space Appl. Lab. Univ. Tokyo Tokyo Japan Tech. Rep. SAL-2016-05-27 2016, 5, 5. [Google Scholar]
Figure 1. The overall framework of the proposed Extensive Feature-Inferring Deep Network (EFINet). The EFINet contains two streams to extract the feature map from the observed pair at various scales. The attained feature maps are passed to the ESFI, which generates features of different sizes. The obtained features are concatenated gradually and refined by GCR to reconstruct the desired feature map.
Remotesensing 17 01308 g001
Figure 2. Extensive-scale feature-interacting module. This module takes the input features through norm and convolutional layers for shallow feature extraction. Subsequently, the dynamic weight is generated using a squeeze-and-excitation network containing a depth-wise convolutional. The generated dynamic weight is then applied to the shallow feature extraction, and the result goes through a convolutional filter. The obtained features lastly pass through a feed-forward network to reconstruct the output features of this module.
Remotesensing 17 01308 g002
Figure 3. Global correlation refinement module. Herein, three linear operations are employed to generate the Q, K, and V. Then, the attention map is calculated using transposed Q to reduce its dimensions, followed by reshaping and a convolutional layer. Finally, the achieved maps go through the final fused image reconstruction block, where the residual connection is also used.
Remotesensing 17 01308 g003
Figure 4. Wald’s protocol strategy.
Remotesensing 17 01308 g004
Figure 5. The learning headway during the training process is described by improving the PSNR (left side) and SSIM (right side) using the Houston dataset.
Remotesensing 17 01308 g005
Figure 6. Values of PSNR and SSIM as a function of the number of multi-scale features using the Chikusei dataset [59].
Remotesensing 17 01308 g006
Figure 7. The graphical outcomes of the comparison techniques that demonstrate the false-color RGB (R = 30th band; G = 20th band; B = 10th band) fused images for the Houston testing image: (a) the result of CSTF [17]; (b) the result of CNMF [14]; (c) the result of NSSR [31]; (d) the result of DHSIS [46]; (e) the result of HSRNet [50]; (f) the result of PSRT [52]; (g) the result of EFINet (ours); and (h) the ground truth.
Remotesensing 17 01308 g007
Figure 8. The heat maps depict the difference in the results of various testing approaches, including the proposed approach, compared to the ground truth of the testing HS image from the Houston dataset. (a) The result of CSTF [17]; (b) the result of CNMF [14]; (c) the result of NSSR [31]; (d) the result of DHSIS [46]; (e) the result of HSRNet [50]; (f) the result of PSRT [52]; (g) the result of EFINet (ours); and (h) the ground truth.
Remotesensing 17 01308 g008
Figure 9. The graphical outcomes of the comparison techniques that demonstrate the false-color RGB (R = 60th band; G = 75th band; B = 90th band) fused images for the Chikusei testing image, where (a) the result of CSTF [17]; (b) the result of CNMF [14]; (c) the result of NSSR [31]; (d) the result of DHSIS [46]; (e) the result of HSRNet [50]; (f) the result of PSRT [52]; (g) the result of EFINet (ours); and (h) the ground truth.
Remotesensing 17 01308 g009
Figure 10. The heat maps depict the difference in the results of various testing approaches, including the proposed approach, compared to the ground truth of the testing HS image from the Chikusei dataset. (a) The result of CSTF [17]; (b) the result of CNMF [14]; (c) the result of NSSR [31]; (d) the result of DHSIS [46]; (e) the result of HSRNet [50]; (f) the result of PSRT [52]; (g) the result of EFINet (ours); and (h) the ground truth.
Remotesensing 17 01308 g010
Figure 11. Illustration of the performance curves of various comparison strategies employing the PSNR (dB) index per spectral channel: (a) the curves of the PSNR (dB) index for the Houston dataset, and (b) the curves of the PSNR (dB) index for the Chikusei dataset.
Remotesensing 17 01308 g011
Figure 12. Illustration of the performance curves of various compared strategies employing the SSIM index per spectral channel: (a) the curves of the SSIM index for the Houston dataset, and (b) the curves of the SSIM index for the Chikusei dataset.
Remotesensing 17 01308 g012
Table 1. The representation of the Houston dataset’s experiment quantitative metrics, including PSNR (dB), SAM, ERGAS, SSIM, and computing time (S denotes seconds) that validate the performance of the suggested EFINet technique compared with the state of the art including the CSTF, CNMF, NSSR, DHSIS, HSRNet, and PSRT techniques; the best achievements are in bold.
MethodHouston [58]
PSNR (dB)SAMERGASSSIMTime (S)
Best value0010
CSTF [17]33.814.014.32280.957294.20
CNMF [14]31.434.945.16220.932526.85
NSSR [31]32.524.184.25790.9508117.53
DHSIS [46]35.933.473.17580.97208.34
HSRNet [50]38.733.222.90240.97790.63
PSRT [52]40.112.952.02980.98445.81
EFINet42.582.641.87740.98930.52
Table 2. Representation of the quantitative metrics of the Chikusei dataset experiment, including PSNR (dB), SAM, ERGAS, SSIM, and computing time (S denotes seconds), which validate the performance of the suggested EFINet technique compared with the state of the art including the CSTF, CNMF, NSSR, DHSIS, HSRNet, and PSRT techniques; the best achievements are in bold.
MethodChikusei [59]
PSNR (dB)SAMERGASSSIMTime (S)
Best value0010
CSTF [17]31.976.143.46810.9529116.43
CNMF [14]34.964.582.92720.960131.10
NSSR [31]32.045.833.35900.9558213.25
DHSIS [46]37.154.262.62310.962321.68
HSRNet [50]40.823.692.17350.97841.29
PSRT [52]41.263.021.90380.98019.57
EFINet43.792.431.78610.98380.84
Table 3. Ablation experiments to further validate the proposed modules’ functionality (extensive-scale feature interacting (ESFI) and global correlation refinement (GCR)) and their impact on the proposed network; the best achievements are in bold.
ESFIGCRChikusei [59]
PSNR (dB)SAMERGASSSIM
Best value 001
×41.582.902.36090.9801
×43.062.641.97290.9809
43.792.431.78610.9838
Table 4. The quantitative outcomes of the comparative experiments under two noise levels (by adding i.i.d Gaussian noise of 10/30 dB and 15/35 dB for LRHSI and HRMSI), including PSNR (dB), SAM, ERGAS, SSIM, that validate the performance of the suggested EFINet technique compared with the state of the art including the CSTF, CNMF, NSSR, DHSIS, HSRNet, and PSRT techniques on the Houston dataset; the best achievements are in bold.
MethodHouston [58]
PSNR (dB)SAMERGASSSIM
Best value001
Noise levelSNR = 10/15
CSTF [17]24.6210.237.04540.8692
CNMF [14]23.159.887.78360.8561
NSSR [31]24.3911.626.90130.8759
DHSIS [46]28.608.555.85010.9046
HSRNet [50]33.476.893.52730.9385
PSRT [52]36.015.272.59050.9493
EFINet38.944.591.96810.9624
Noise levelSNR = 30/35
CSTF [17]33.814.014.32280.9572
CNMF [14]31.434.945.16220.9325
NSSR [31]32.524.184.25790.9508
DHSIS [46]35.933.473.17580.9720
HSRNet [50]38.733.222.90240.9779
PSRT [52]40.112.952.02980.9844
EFINet42.582.641.87740.9893
Disclaimer/Publisher’s Note: The statements, opinions and data contained in all publications are solely those of the individual author(s) and contributor(s) and not of MDPI and/or the editor(s). MDPI and/or the editor(s) disclaim responsibility for any injury to people or property resulting from any ideas, methods, instructions or products referred to in the content.

