Abstract
This paper investigates the formation joint resource scheduling problem from the perspective of cooperative jamming against radar systems. First, the formation survivability is redefined based on the task requirements. Then, a hierarchical adaptive scheduling strategy solution framework is constructed for state prediction and detection fusion of the networked radar system. Considering the scene constraints, an Improved Adaptive Parameter Evolution Marine Predators Algorithm is designed as an optimizer and embedded in the proposed framework to jointly optimize the platform beam allocation and jamming mode selection. Based on the original algorithm, real number random coding is used to perform dimensional conversion of decision variables, an adaptive parameter evolution mechanism is designed to reduce the dependence on algorithm parameters, and an adaptive selection mechanism for dominant strategies and a search intensity control strategy are proposed to help decision-makers explore the optimal resource scheduling strategy quickly and accurately. Finally, considering the formation maneuvering behavior and incomplete information, the proposed method is compared with existing base strategies in different typical scenarios. It is proved that the proposed strategy can fully exploit the limited jamming resources and maximize the survivability of the formation in radar system cooperative jamming scenarios, demonstrating superior jamming performance and shorter decision time.
1. Introduction
With the continuous development of data fusion and artificial intelligence (AI) technology, electronic warfare is beginning to take on a new form of system-to-system confrontation, which is prompting both sides in the radar confrontation to find new strategies for competition. Networked radar systems (NRS) [1,2,3,4,5,6,7,8,9] form a three-dimensional, all-round, high-precision space detection network by organically fusing the information from multiple radars distributed over a wide area. This greatly enhances the detection, tracking, and anti-jamming capabilities of the system, significantly accelerating the ‘OODA’ cycle. Traditional ‘one-to-one’ electronic countermeasures (ECM) have proven unable to adapt to the dynamic changes of the modern battlefield. Given the serious challenges posed by NRS to the survivability of air targets, researchers have begun extensive research into formation-cooperative jamming techniques [10,11,12,13] in recent years. The key to formation-cooperative jamming is the active design of jamming resource scheduling strategies.
Studying the problem of jamming resource scheduling is a challenging task that requires the collaborative scheduling of different types of jamming resources in a dynamically uncertain electromagnetic environment, while adhering to certain platform resource constraints, and the online evaluation of jamming effects. Currently, there are three main methods for solving this problem: methods based on game theory, methods based on swarm intelligence optimization, and methods based on self-learning.
Game theory [14,15,16] is widely used in military operations and is also a clever way to solve resource scheduling problems. In [17], the jamming effect was evaluated quantitatively from the four dimensions of time, space, frequency, and energy. Game theory was used to study the equilibrium strategy of the radar active jamming resource allocation model. In [18], a jamming effect evaluation index based on location information was constructed, and the existence and feasibility of Nash equilibrium in the jamming resource allocation game were demonstrated.
The swarm intelligence optimization [19,20,21,22] algorithm is an emerging optimization method that simulates the behavioral characteristics of natural populations and provides a useful tool for solving large-scale jamming resource scheduling problems. Refs. [23,24] proposed an improved particle swarm algorithm to improve the stability and real-time performance of solving jamming target allocation problems. Ref. [25] selected the weighted sum of the track positioning accuracy of the networked radar as the objective function and used a genetic algorithm to solve the jamming resource allocation model. Ref. [26] proposed a genetic ant colony fusion algorithm based on the threat assessment of the target radar for the jamming resource allocation method. Ref. [27] used a two-stage particle swarm optimization method to jointly optimize the jamming beam and power allocation, reducing the fusion detection probability of the networked radar system.
The main difference between self-learning methods and the other two methods is that they improve the machine’s automatic learning ability through data-driven models, the most representative of which is reinforcement learning (RL) [28,29,30], which learns a sequential strategy through successive trial and error with the environment, making it possible to expect the maximum long-term cumulative rewards in interactions, and it currently has achieved many research results in autonomous driving, game AI, resource management, and other decision-making domains. Ref. [31] modeled the jamming resource scheduling problem as a sequential Markov process and used Q-learning to optimize the jamming mode selection strategy of jammers. Ref. [32] used deep Q-neural networks for multifunctional radar jamming resource decision-making combined with a priori knowledge to establish the optimal mapping relationship between radar tasks and jamming modes. Ref. [33] designed a reward function based on the change in radar threat level and jamming effects and adaptively adjusted the jamming type selection and power control. Ref. [34] proposed a two-stage jamming decision framework based on dual Q-learning, which effectively reduced the complexity of joint jamming resource decisions by decomposing the high-dimensional action space into two low-dimensional subspaces containing jamming modes and pulse parameters.
All of the above studies provide valuable potential solutions to the problem of jamming resource scheduling, but the following deficiencies need to be addressed when targeting specific formation-cooperative jamming NRS scenarios. (1) In terms of modeling, current radar models oversimplify environmental dynamics, neglecting the impact of radar state transitions during ‘OODA’ cycles and information fusion countermeasures on jamming efficacy. Additionally, while maximizing jamming effectiveness is prioritized to enhance formation survivability, the self-exposure risks arising from active jamming remain understudied, potentially compromising formation safety. (2) In terms of methodology, firstly, RL-based approaches are largely restricted to single-radar scenarios due to the complexity of modeling NRS environments, and their reliance on black-box neural networks also heightens sensitivity to dynamic electromagnetic conditions. Secondly, game-theoretic methods assume that all participants are rational, which is an impractical premise in real-world non-cooperative settings. Though swarm intelligence algorithms excel in solving large-scale optimization, their high computational complexity conflicts with real-time decision requirements, and their frameworks struggle to handle the hybrid optimization of different types of resources.
Therefore, according to the above discussion, for the joint jamming resource scheduling problem in a complex electromagnetic environment, not only must the requirements of the formation survival task be met, but also a more realistic dynamic system model must be designed to adapt to the response of the NRS. Finally, an improved algorithm based on the model framework is used to enhance the accuracy and real-time performance of the resource scheduling decision. This is also the driving force behind our commitment to research in this area.
This paper studies the joint jamming resources scheduling problem in the cooperative confrontation scenario of NRS, and an efficient hierarchical adaptive scheduling strategy solution framework is proposed. The main contributions are as follows:
- A joint jamming resource scheduling problem for dynamic confrontation scenarios is studied, which breaks through the limitation of traditional resource scheduling focusing only on jamming efficiency. The formation survivability is redefined by fusing the information reception quality of the adversarial NRS and the electromagnetic exposure risk of the formation, and three optimization indexes are comprehensively designed.
- A hierarchical adaptive scheduling framework is designed to deal with the unknown changes in the environment. This framework performs dynamic state estimation of the NRS through a radar state prediction model and drives the adaptive objective function to impose dynamic penalty weights on high-risk scheduling behaviors, forming a closed-loop feedback mechanism. Compared with the static scheduling strategy, this method can perceive the change in the electromagnetic environment in real time and adjust the optimization direction. In the simulation experiment, the electromagnetic exposure time of the formation is significantly reduced, while the formation maintains a high level of survival capability.
- To solve the hybrid optimization problem of two kinds of resources, an Improved Adaptive Parameter Evolutionary Marine Predators Algorithm (IAPEMPA) for task requirements is proposed. Firstly, the dimension mapping of jamming beam allocation and mode selection is implemented by real random coding. Then, an adaptive parameter evolution mechanism is constructed to reduce dependence on the key parameters of the algorithm. Furthermore, the dominant strategy adaptive selection mechanism and the search intensity control strategy are introduced to achieve collaborative optimization of solution precision and speed at the algorithm level.
The rest of this paper is organized as follows. Section 2 describes the system confrontation scenario, Section 3 constructs a signal interaction model for the formation and NRS, Section 4 designs optimization metrics for the formation survivability model based on NRS fusion detection and anti-jamming measures, and Section 5 proposes a hierarchical adaptive scheduling strategy solution framework for joint optimization of jamming beam allocation and jamming mode selection. Section 6 verifies the performance of the proposed strategies in simulations for different scenarios. Finally, Section 7 discusses the conclusions and future improvement directions of this paper.
2. System Confrontation Scenario
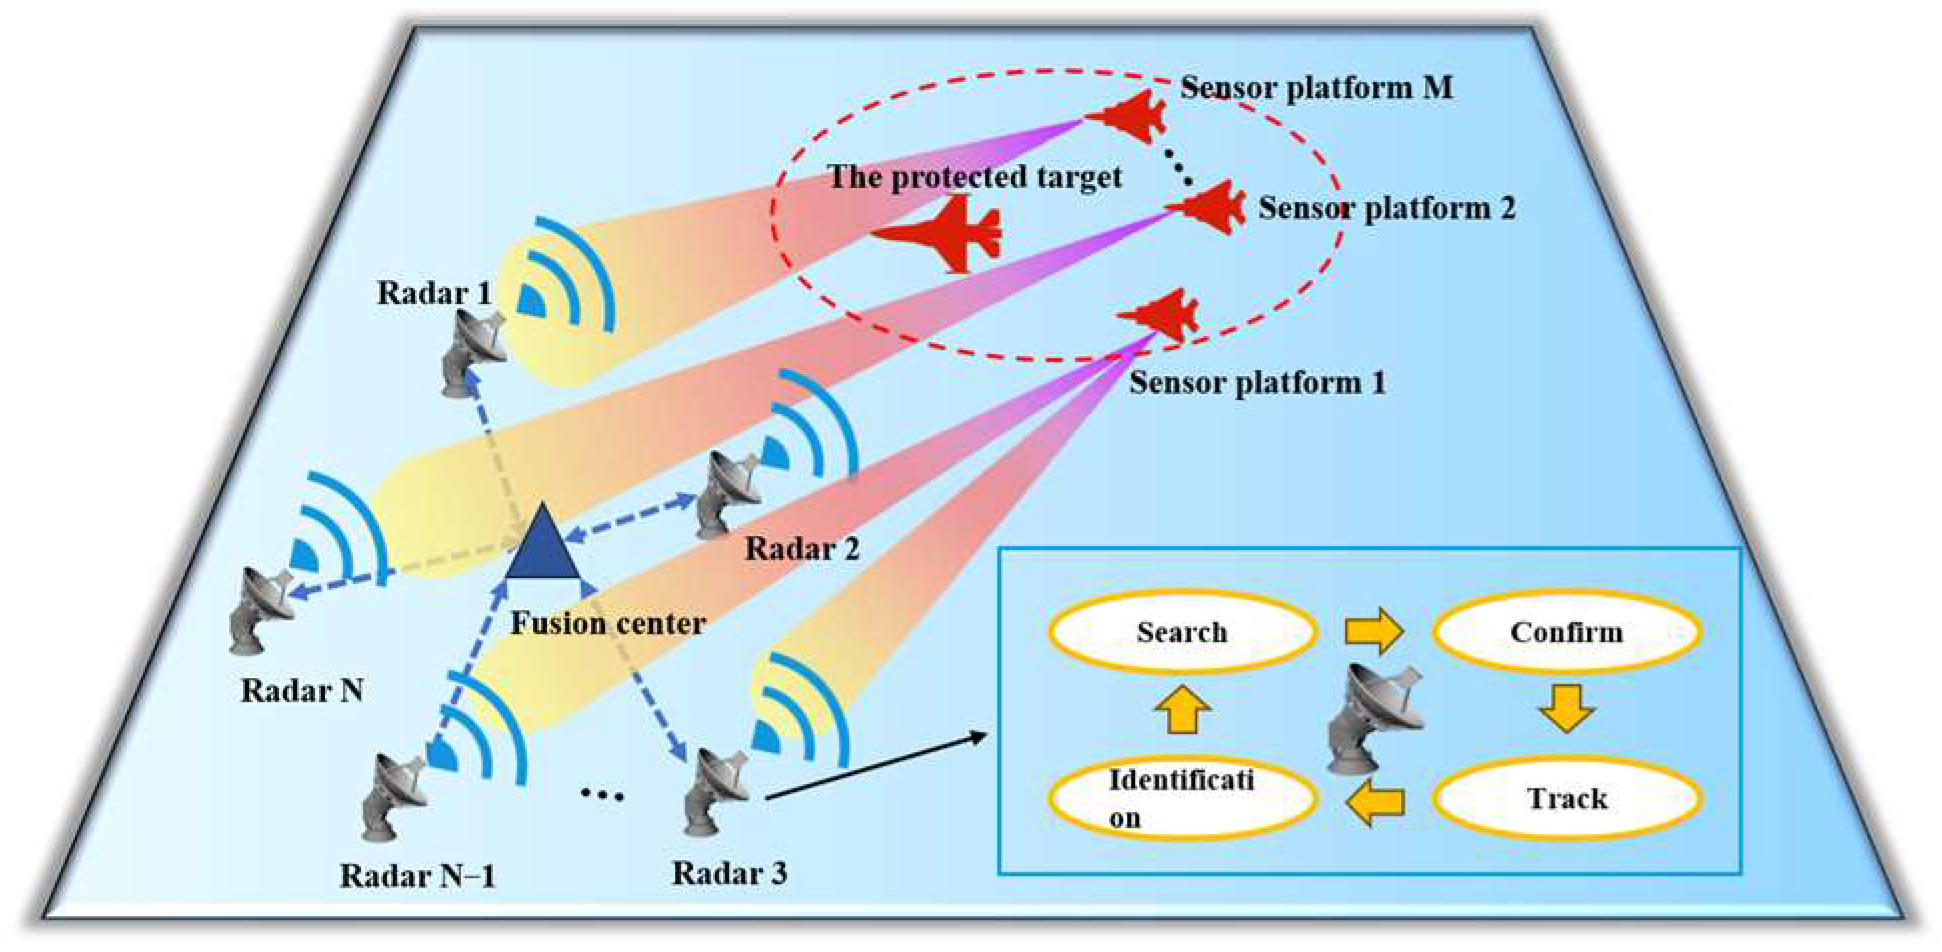
Figure 1 shows a three-dimensional system confrontation scene, where multiple sensor platforms accompany the target to penetrate the NRS. Specifically, the NRS consists of N single-station radars and an information center. The position of the n-th radar node is . Each radar node is independent the others, only receiving and processing its own target echo signals. It follows the ‘OODA’ cycle decision process and can switch between the search, confirmation, tracking and identification states. The information center performs information fusion on the data processed by each radar node to form the final target detection intelligence. A formation consisting of M sensor platforms (each equipped with a jamming device) moves together with the target in the direction of the NRS. The jamming device can switch between multiple jamming modes and emit multiple jamming beams, that is, each platform can jam a finite number of radar nodes simultaneously. The position and velocity of each sensor platform are represented as and , and the position and velocity of the target are represented as and . Under the condition of limited jamming resources, the sensor platform formation jointly schedules the beam and jamming mode resources to implement cooperative jamming on the NRS, ensuring that the target reaches the designated fire strike point successfully and completes the penetration task.
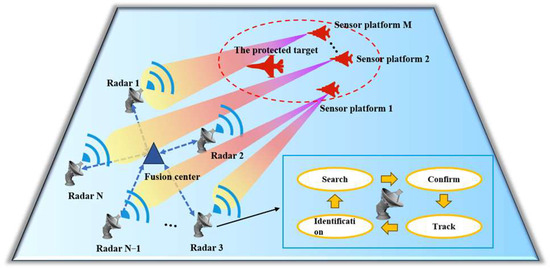
Figure 1.
Diagram of the system confrontation model.
3. Signal Interaction Model
Modern radar confrontation is fundamentally an information dominance competition mediated through electromagnetic wave radiation. The radar system employs pulsed signals to capture target-specific echo characteristics (e.g., spatial coordinates, radial velocity) by alternating different states. Conversely, adversarial platforms actively degrade radar detection and tracking capabilities by transmitting tailored jamming signals to the radar’s receiver. To formalize the optimization of jamming beam allocation and jamming mode selection for a formation of multi-sensor platforms, we define the binary beam allocation matrix and integer jamming mode selection matrix as
where indicates whether sensor platform m assigns a jamming beam to radar n at time k, and represents the jamming mode selected by sensor platform m for radar n, where indicates that the platform does not select jamming modes.
The signal model received by radar n in the NRS is described as follows:
where is the signal received by the radar n receiver at time k, which consists of three parts. The first part on the right side of the equation is the echo signal reflected from the target, represents the target echo power received by the radar receiver, represents the complex envelope of the radar’s pre-designed transmit signal, which exhibits different signal characteristics under different working states, carrying time delay and Doppler frequency information. The second part represents the sensor jamming signal entering the radar receiver, the composition of which is determined by the resource scheduling scheme of the sensor platform formation, represents the jamming power of the sensor platform arriving at the radar receiver, and represents the jamming signal waveform modulated by mode transmitted by platform m. The third part represents the internal noise of the radar receiver, is Gaussian white noise that follows the distribution, and represents the average power of the noise, which can be calculated as
where J/K is the Boltzmann constant; K represents the equivalent noise temperature of the receiver; represents the bandwidth of the radar receiver; and is the noise figure of the receiver.
The signal processing quality of a radar is directly related to the received energy. Analysis of Equation (3) shows that the received signal of radar in the network contains both beneficial energy in the target information (Part 1) and harmful energy that increases the uncertainty of target detection (Part 2 and Part 3). Therefore, the signal-to-jamming ratio (SJR) for evaluating the quality of information acquisition by a single radar is defined as
where and are the transmit powers of the radar and sensor platform jammer, respectively, and represent the path transmission gains of the radar and jamming signals, respectively, is the channel gain introduced by the sensor platform using the jamming mode , and is the state of radar n. Due to the different modulation methods of each jamming mode, the energy filtering effect of various modes of jamming signal varies greatly for radar in different states. Effective jamming modes will further reduce the SJR and affect the quality of radar information acquisition.
The path transmission gains and are calculated as
where and are the antenna gains of the radar and jammer, respectively; is the radar cross section (RCS) of the target; and and are the working wavelengths of the radar and jammer. In order to ensure that the jamming signal enters the radar receiver smoothly, the working frequency of the jammer needs to be aligned with the working frequency of the radar, that is ; LR and LJ represent the radar comprehensive loss (including system loss, other path loss, etc.) and jammer mismatch loss (including polarization mismatch loss, bandwidth mismatch loss, etc.), respectively; and and represent the Euclidean distances between radar n and the target, as well as between radar n and the sensor platform m at time k. The relative positions of the sensor platform, target, and radar are constantly changing. is the antenna gain loss factor of the radar in the direction of the main lobe of the jammer, expressed as
where is a constant, represents the angle between the sensor platform m and the target relative to the radar n at time k, and represents the main lobe width of the radar antenna.
The SJR plays an important role in the design of jamming resource scheduling schemes. In the next section, the SJR is used to calculate the suppression effect of sensor platform formations on the performance of NRS.
4. Optimization Indexes Design
The primary performance of cooperative jamming is to quantitatively characterize formation survivability through robust optimization indexes for resource scheduling. This requirement stems from the adversarial dynamics of NRS operating under the ‘OODA’ cycle. Radars sequentially transition through search–confirmation–tracking–identification states to guide missile interception, necessitating coordinated disruption of the ‘OODA’ cycle to ensure target survivability. Crucially, however, prolonged jamming emissions risk triggering radar passive tracking modes, thereby amplifying the formation exposure risk. To address this dual challenge, our optimization framework prioritizes two coupled objectives as follows: (1) degrading NRS operational coherence by interrupting state transitions in the ‘OODA’ cycle, and (2) minimizing electromagnetic signature accumulation to avoid self-exposure feedback loops. Three quantifiable metrics are proposed to evaluate scheduling efficacy. The subsequent section rigorously derives the mathematical formulation and interdependencies of these indexes.
4.1. Fusion Detection Probability of NRS
The detection probability is an important performance index that reflects the radar’s ability to detect targets in a search state. The radar compares the echo value with the detection threshold to obtain a local decision , where indicates the target exists. At time k, the single radar n’s detection probability function of the target is
where C3, C4, and C6 are Gram–Charlier level coefficients determined by the type of target fluctuation, the specific definition of which is given in [35] and will not be repeated here due to space limitations. and V are defined in Equations (10) and (11).
where np denotes the number of incoherent accumulated pulses, and is a constant.
The target detection result of NRS is jointly determined by the radars in the network, which improves the anti-jamming capability to a certain extent. Assuming that the NRS adopts the rank K decision fusion criterion, it can be described as
Equation (12) indicates that when the number of radars simultaneously detecting a target reaches the threshold K, the NRS determines that the target exists. Therefore, at time k, the fusion detection probability of the NRS for the target is
where represents all the combinations formed by arranging the q radar nodes that detected the target and the N−q radar nodes that did not detect the target. It is worth noting that other information fusion methods can be obtained by modifying the parameter K, reflecting the wide applicability of this model.
4.2. Tracking Mean Square Error of NRS
The radar needs to estimate target parameters in both search and tracking states. Under jamming conditions, the measurement error of parameters worsens, and when the error exceeds a certain threshold, it may disrupt the radar’s stable tracking and put it back into the search state. In this section, we consider the three parameters of distance, azimuth, and pitch. Assuming that the measurements of these three parameters are independent of each other, the measurement accuracy of the parameters is directly related to the SJR. The mean square error of radar n with respect to the above three parameters is
where , , and respectively represent the mean square error of the relative distance, azimuth, and pitch of radar n with respect to the target at time k, c is the speed of light, is the pulse width, and and are the azimuth and pitch main lobe widths of the radar antenna, respectively.
At time k, the measurement error vector of radar n with respect to the target parameter is denoted as , so the radar n’s parameter measurement covariance matrix is
where denotes the mathematical expectation. Assuming that each radar in the network uses Kalman filtering to perform trajectory correlation and tracking, the estimation equation obtained by the NRS after fusing the target filtering information from each radar is
where is the filtered information of radar n at time k, and represents the parameter measurement covariance matrix of the NRS at time k. The tracking mean square error of the NRS is defined as
where denotes the trace of the matrix.
4.3. Platform Interception Coefficient
This section quantitatively addresses the dual-domain interception risk (energy–time coupling) induced by electromagnetic emissions in platform formations. While sustained jamming energy emission is essential for cooperative jamming efficacy, excessive power levels may trigger radar passive tracking modalities, thereby amplifying NRS interception probability. To resolve this energy–stealth tradeoff, we propose a safety power boundary , derived from SJR constraints, that guarantees minimal interception risk when satisfied. The power interception coefficient of platform m at time k is defined as follows
It should be noted that when , , indicating that the platform m is in a safe state at this time, whereas when , increases as the SJR decreases. The platform power interception coefficient is also related to the number of radar nodes that the platform jams simultaneously. The more jamming beams the platform is assigned, the greater the risk of interception.
On the other hand, if the sensor platform is assigned to the same radar for a long time, it is vulnerable to passive tracking or other anti-jamming measures by the radar, leading to mission failure. To avoid this situation, the platform time interception coefficient is designed as
where is the safety time threshold. The electromagnetic management of the sensor platform in both the energy and time domains is equally important, Thus, the interception coefficient of the sensor platform is expressed as .
5. Jamming Resource Scheduling Strategy Optimization
5.1. Joint Jamming Resource Scheduling Model Based on Formation Survivability
Among the three indexes designed above, the first two indexes reflect the target survivability, and the latter index reflects the sensor platform survivability. The jamming resource scheduling strategy addressed in this paper aims to find a balance between the two subtasks of target survivability and sensor platform survivability and maximize the overall survival ability of the formation. Thus, the objective function is designed as follows
where Se represents the formation survivability, and wm is the importance coefficient of platform m. k2, k3, and k4 are adjustment coefficients that are used to map the corresponding indexes to the interval [0, 1]. c1 and c2 denote the task weight coefficients. When the formation prioritizes improving the safety of the target, c1 can be increased accordingly, and vice versa. By changing the weight coefficients, the formation can adapt to different task requirements, which in turn affects the focus of jamming strategy adjustment.
In order to simulate a realistic radar countermeasure scenario, as well as the limitations of jamming resources and jammer capabilities, this model also considers the following constraints.
- The jammer’s beam capability limitations. Constrained by the power of each platform’s jammer, the jammer can only jam P radar nodes simultaneously at the current time, that is
- 2.
- The jammer’s jamming mode selection limitations. To reduce the computational complexity of the platform control system, each platform can only select one jamming mode at the current time, that is
- 3.
- Jamming resource utilization limitations. In practice, the number of ground radars often exceeds the number of jammers. Concentrating multiple beams on one radar not only wastes jamming resources but also reduces the jamming effect on NRS, so the upper limit of the jammer number allocated to each radar node is set to Q, that is
In this task, it is specified that a radar node can only be jammed by a maximum of one jammer at the current time, i.e., Q = 1.
- 4.
- Two jamming resource relationship limitations. The jammer can only select the jamming mode after it has assigned a jamming beam to the radar. There is a sequential relationship between the two resources, that is
The joint jamming resource scheduling can be modeled as the following mathematical optimization model.
5.2. Joint Jamming Resource Scheduling Strategy Solution
The difficulty in solving the above model lies in the fact that the types of two resource variables are different, and they exhibit nonlinear coupling in both the objective function and constraints, resulting in a high-dimensional mixed-integer nonlinear programming (MINLP) problem. To efficiently solve the optimal scheduling strategy, combining the advantages of swarm intelligence methods, an adaptive hierarchical strategy solution framework based on the Improved Adaptive Parameter Evolution Marine Predators Algorithm (IAPEMPA) is proposed. The algorithm improvement method and solution framework details are given below.
5.2.1. Improved Adaptive Parameter Evolution Marine Predators Algorithm
The MPA [36,37,38,39,40] is a novel nature-inspired optimization method proposed by Faramarzi et al. in 2020 that solves the optimal solution by simulating predators pursuing prey populations in marine ecosystems. In the MPA algorithm, there are two important matrices, one is the prey matrix Prey composed of prey populations, and the initialization equation for the element in the matrix is
where xU and xL are the upper and lower bounds of the search space, and rand is a uniform random number in the range [0, 1]. The prey matrix can be represented as
where Np is the population size and d is the individual dimensions in the population.
Calculate the fitness of each row vector in matrix (29), and duplicate Np copies of the individual with the best fitness to form another elite matrix Elite.
The key to the MPA algorithm is three-stage optimization and the FADs effect. Specifically, the algorithm divides the iterative process into three stages, with each stage adjusting the position update equation based on the speed ratio of predator and prey. The FADs effect is an effective method specially designed to avoid local optima. The specific population position update method is shown in Equation (31).
where t is the current iteration, Max_T is the maximum number of iterations, RB is a Brownian motion random vector based on a normal distribution, RL is a random vector based on the Lévy distribution, R is a uniform random vector in the range of [0, 1], CF is an adaptive parameter that controls the predator’s movement step size, U is a binary random vector, and r is a random number in [0, 1], P = 0.5, FADs = 0.2.
The canonical MPA algorithm exhibits competence in continuous optimization, but it has the disadvantages of slow convergence speed and strong parameter dependence, which cannot be directly applied to this task. To overcome this gap, multiple strategies are adopted for this algorithm, so as to further improve its accuracy and real-time performance while adapting to resource scheduling strategies solutions.
- Population encoding and decoding.
The specific design for encoding and decoding is as follows:
(1) Encoding and decoding of jamming beam allocation variables.
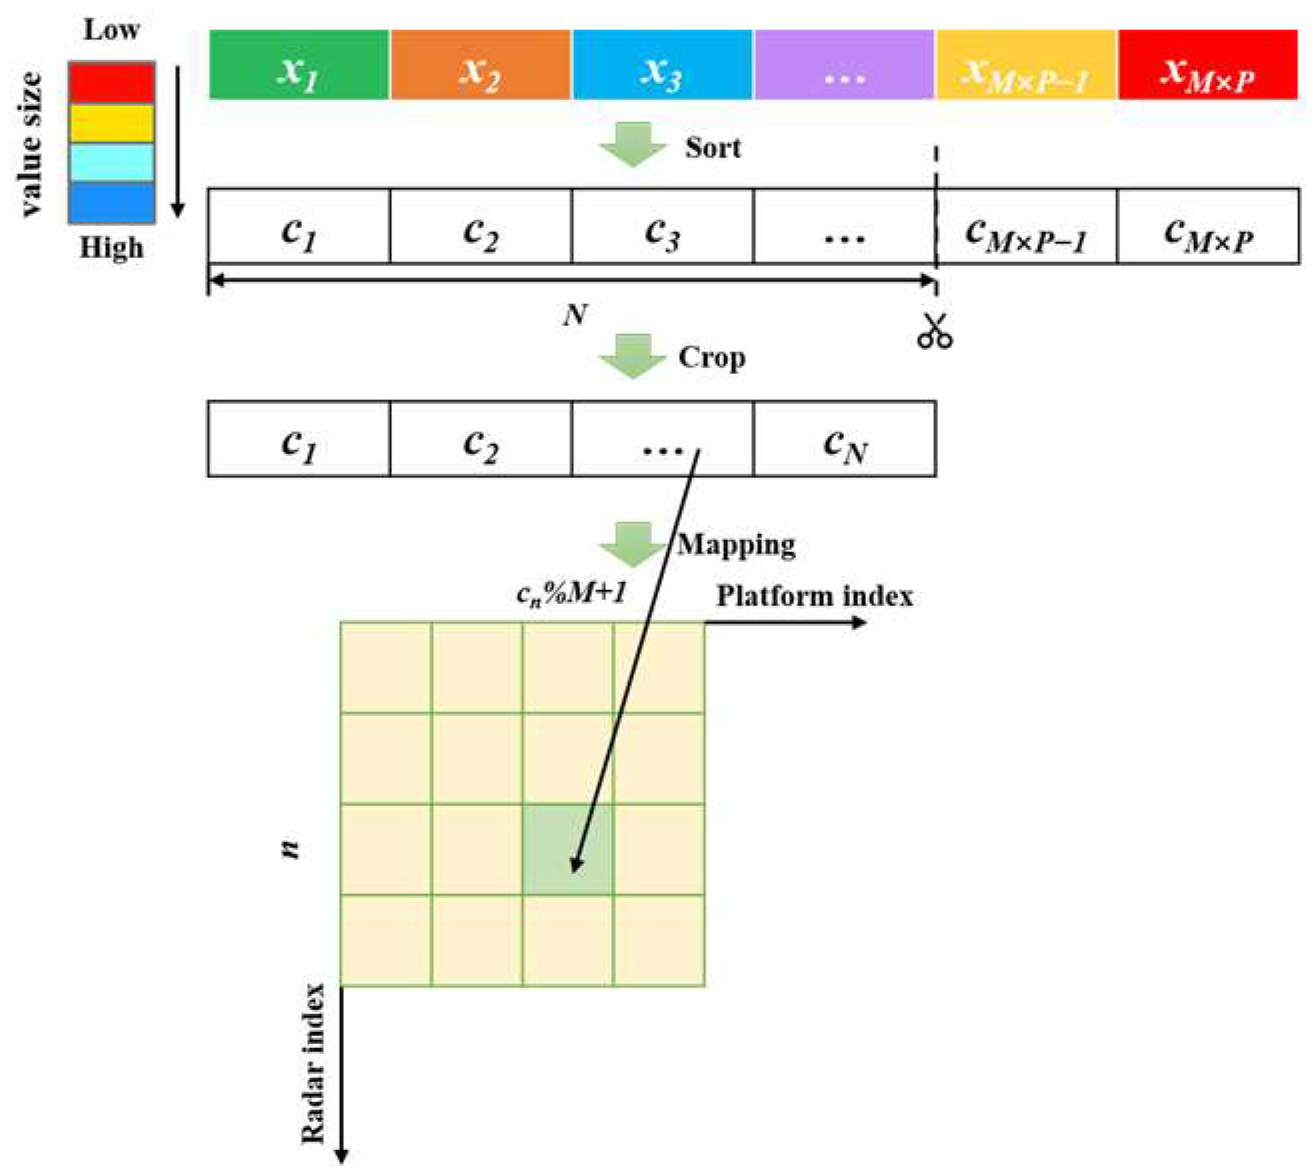
As shown in Figure 2, the beam allocation variable is represented by a real vector with dimension M × P, where the upper and lower bounds of each element are 1 and −1. Let the encoded position vector of the prey be , with the decoded method as follows: sort the elements in the position vector in ascending order to obtain an index vector , take the first N elements to form a new vector , and the number of platforms that jam the radar n is , where % is the remainder sign.
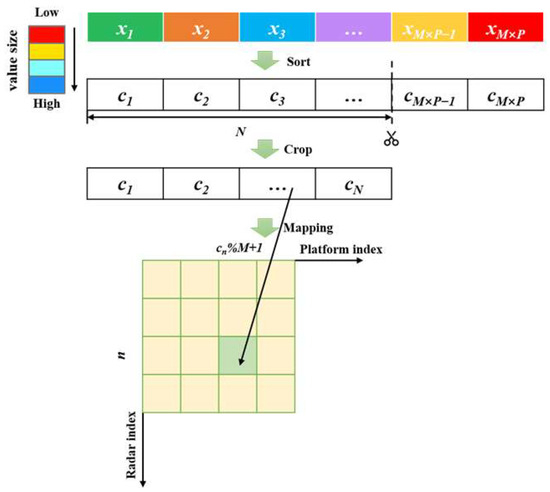
Figure 2.
Jamming beam allocation variables encoding–decoding method.
(2) Encoding and decoding of jamming mode selection variables.
To be consistent with the strategy design of the algorithm, real number encoding is also chosen for the jamming mode selection variable, which is represented by a vector with dimension M, where the upper and lower bounds of each element are I and 0. Let the encoded position vector of the prey be , with the decoded method as follows: perform an up-rounding operation on the elements in the vector, then obtain the jamming mode number selected by each platform, as shown in Figure 3.

Figure 3.
Jamming mode selection variables encoding–decoding method.
- 2.
- Dominant strategy adaptive selection mechanism (DSASM).
The canonical MPA partitions the population into static subgroups for Lévy flight exploitation (first 50%) and Brownian motion exploration (remaining 50%) during mid-iteration phases. However, this rigid strategy allocation neglects individual evolutionary states, often trapping high-fitness particles in local optima while underutilizing promising search regions. Hence, a dominant strategy adaptive selection mechanism is proposed based on the evolutionary information of the population. Specifically, the individual in the population selects the more favorable strategy according to its own fitness and the historical efficiency of the two strategies. The selection probability of the two strategies is calculated as
where and denote the probability that individual i selects either the Lévy flight strategy or the Brownian motion strategy in generation t, is the fitness of individual i, is the average fitness of the population, and denote the historical efficiency of adopting Lévy flight and Brownian motion, respectively, where NumL denotes the number of individuals that generate a new prey position superior to the original one after adopting Lévy flight, popL is the total number of individuals that adopt this strategy, and NumB and popB are numbers of the same meaning after adopting Brownian motion. The initial values of and are set to 0.5.
The process of the DSASM is shown in Algorithm 1.
| Algorithm 1: Dominant Strategy Adaptive Selection Mechanism | |
| 1: | for each individual i do |
| 2: | Calculate the fitness value of individual i; |
| 3: | Calculate the selection probabilities and of two strategies based on Equations (32)–(34); |
| 4: | Generate a random number ; |
| 5: | if then |
| 6: | The individual i executes the Levy flight strategy; |
| 7: | else |
| 8: | The individual i executes the Brownian motion strategy; |
| 9: | End if |
| 10: | end for |
- 3.
- Adaptive Parameter evolution mechanism.
The parameter choice plays an important role in the convergence speed and evolution direction of the algorithm. To overcome the dependence of the step size control parameter CF and the Fish Aggregating Devices effects parameter FADs in the MPA algorithm, an adaptive parameter evolution mechanism based on parameter storage is proposed.
Parameter storage means that when the population completes a position update, the parameters that find a better position (i.e., ) are stored in the corresponding sample library, denoted as beneficial parameter sample libraries PCF and PFADs. The weighted Lehmer mean of these samples is calculated as the sampling benchmark for the parameter update before the next iteration begins. The sampling benchmark is updated as follows
where represents CF or FADs. represents the kth parameter in the sample library.
Considering the differences in the function and range constraints of the two parameters, CF and FADs choose two distribution sampling generation strategies in the potential solution space respectively. CF selects Cauchy distribution and exponential distribution sampling, while FADs selects normal distribution and quadratic polynomial distribution sampling. The sampling criterion is designed as follows:
where randn(0,0.1) denotes a random number based on normal distribution with mean 0 and variance 0.1, randc(0,0.1) denotes a random number based on a Cauchy distribution with mean 0 and variance 0.1, r1 and r2 are uniform random numbers in [0, 1], and a0 = 0.3 and a1 = 0.15 are constants. The sampling criterion adaptively adjusts the sampling range of the parameters in the next stage based on the historical sampling experience and improves the sampling probability of beneficial parameters by alternately using parameter sampling strategies with different distributions.
- 4.
- Search intensity control strategy.
The main idea of search intensity control is to control the population size and FADs effect frequency to reduce unnecessary computational costs and help find potential optimal solutions faster. The specific method is as follows:
(1) Population size control. During the evolution process, the population will gradually gather around the potential optimal solution, exhibiting a similarity trend, and the definition of population similarity is as follows:
where dist() calculates the Euclidean distance between two vectors, and and represent the optimal individual of generation t-th and the t+1-th generation, respectively. Then the population size is updated as follows:
where and represent the upper and lower bounds of population size.
(2) FADs effect frequency control. The MPA algorithm uses the FADs effect to jump out of the local optimal solution, but using this mechanism for some potentially bad individuals will increase additional computational cost. Thus, an activation operator is designed to activate this mechanism when a certain number of iterations and stagnation occur. The expression of the activation operator is as follows:
When the iteration growth rate is greater than the current optimal solution’s fitness growth rate, it is considered that the risk of the population falling into local optima increases, and increases accordingly, making it easier to activate the FADS effect mechanism. Conversely, as decreases, the activation probability of the mechanism adaptively decreases.
Algorithm 2 provides the pseudocode for IAPEMPA.
| Algorithm 2: The procedure of IAPEMPA | |
| Input: Fitness function , dimension d, upper and lower bounds of variables , upper and lower bounds of population size , maximum number of iterations Max_T | |
| Output: Optimal solution and its fitness values: and | |
| 1: | Initialize the population Prey (i = 1,…, Np), calculate the fitness, and construct the Elite matrix Elite, t = 1 |
| 2: | while t < Max_T do |
| 3: | if t Max_T/3 then |
| 4: | Update prey population based on Equation (31) |
| 5: | Else if Max_T/3 < t 2 × Max_T/3 then |
| 6: | Execute Algorithm 1 to determine the search strategy for each individual |
| 7: | Update prey population based on Equation (31) |
| 8: | Else if t > 2 × Max_T/3 then |
| 9: | Update prey population based on Equation (31) |
| 10: | End if |
| 11: | Calculate population fitness, achieve memory saving and update the Elite matrix Elite |
| 12: | Update parameters CF and FADs using Equations (35)–(39) |
| 13: | Calculate the parameter using Equation (42) |
| 14: | Generate a random number r |
| 15: | if r < then |
| 16: | Apply FADs effect based on Equation (31) |
| 17: | End if |
| 18: | Update population size Np based on Equations (40) and (41) |
| 19: | Set t = t + 1 |
| 20: | end while |
5.2.2. Adaptive Scheduling Strategy Solution Framework Embedded with IAPEMPA
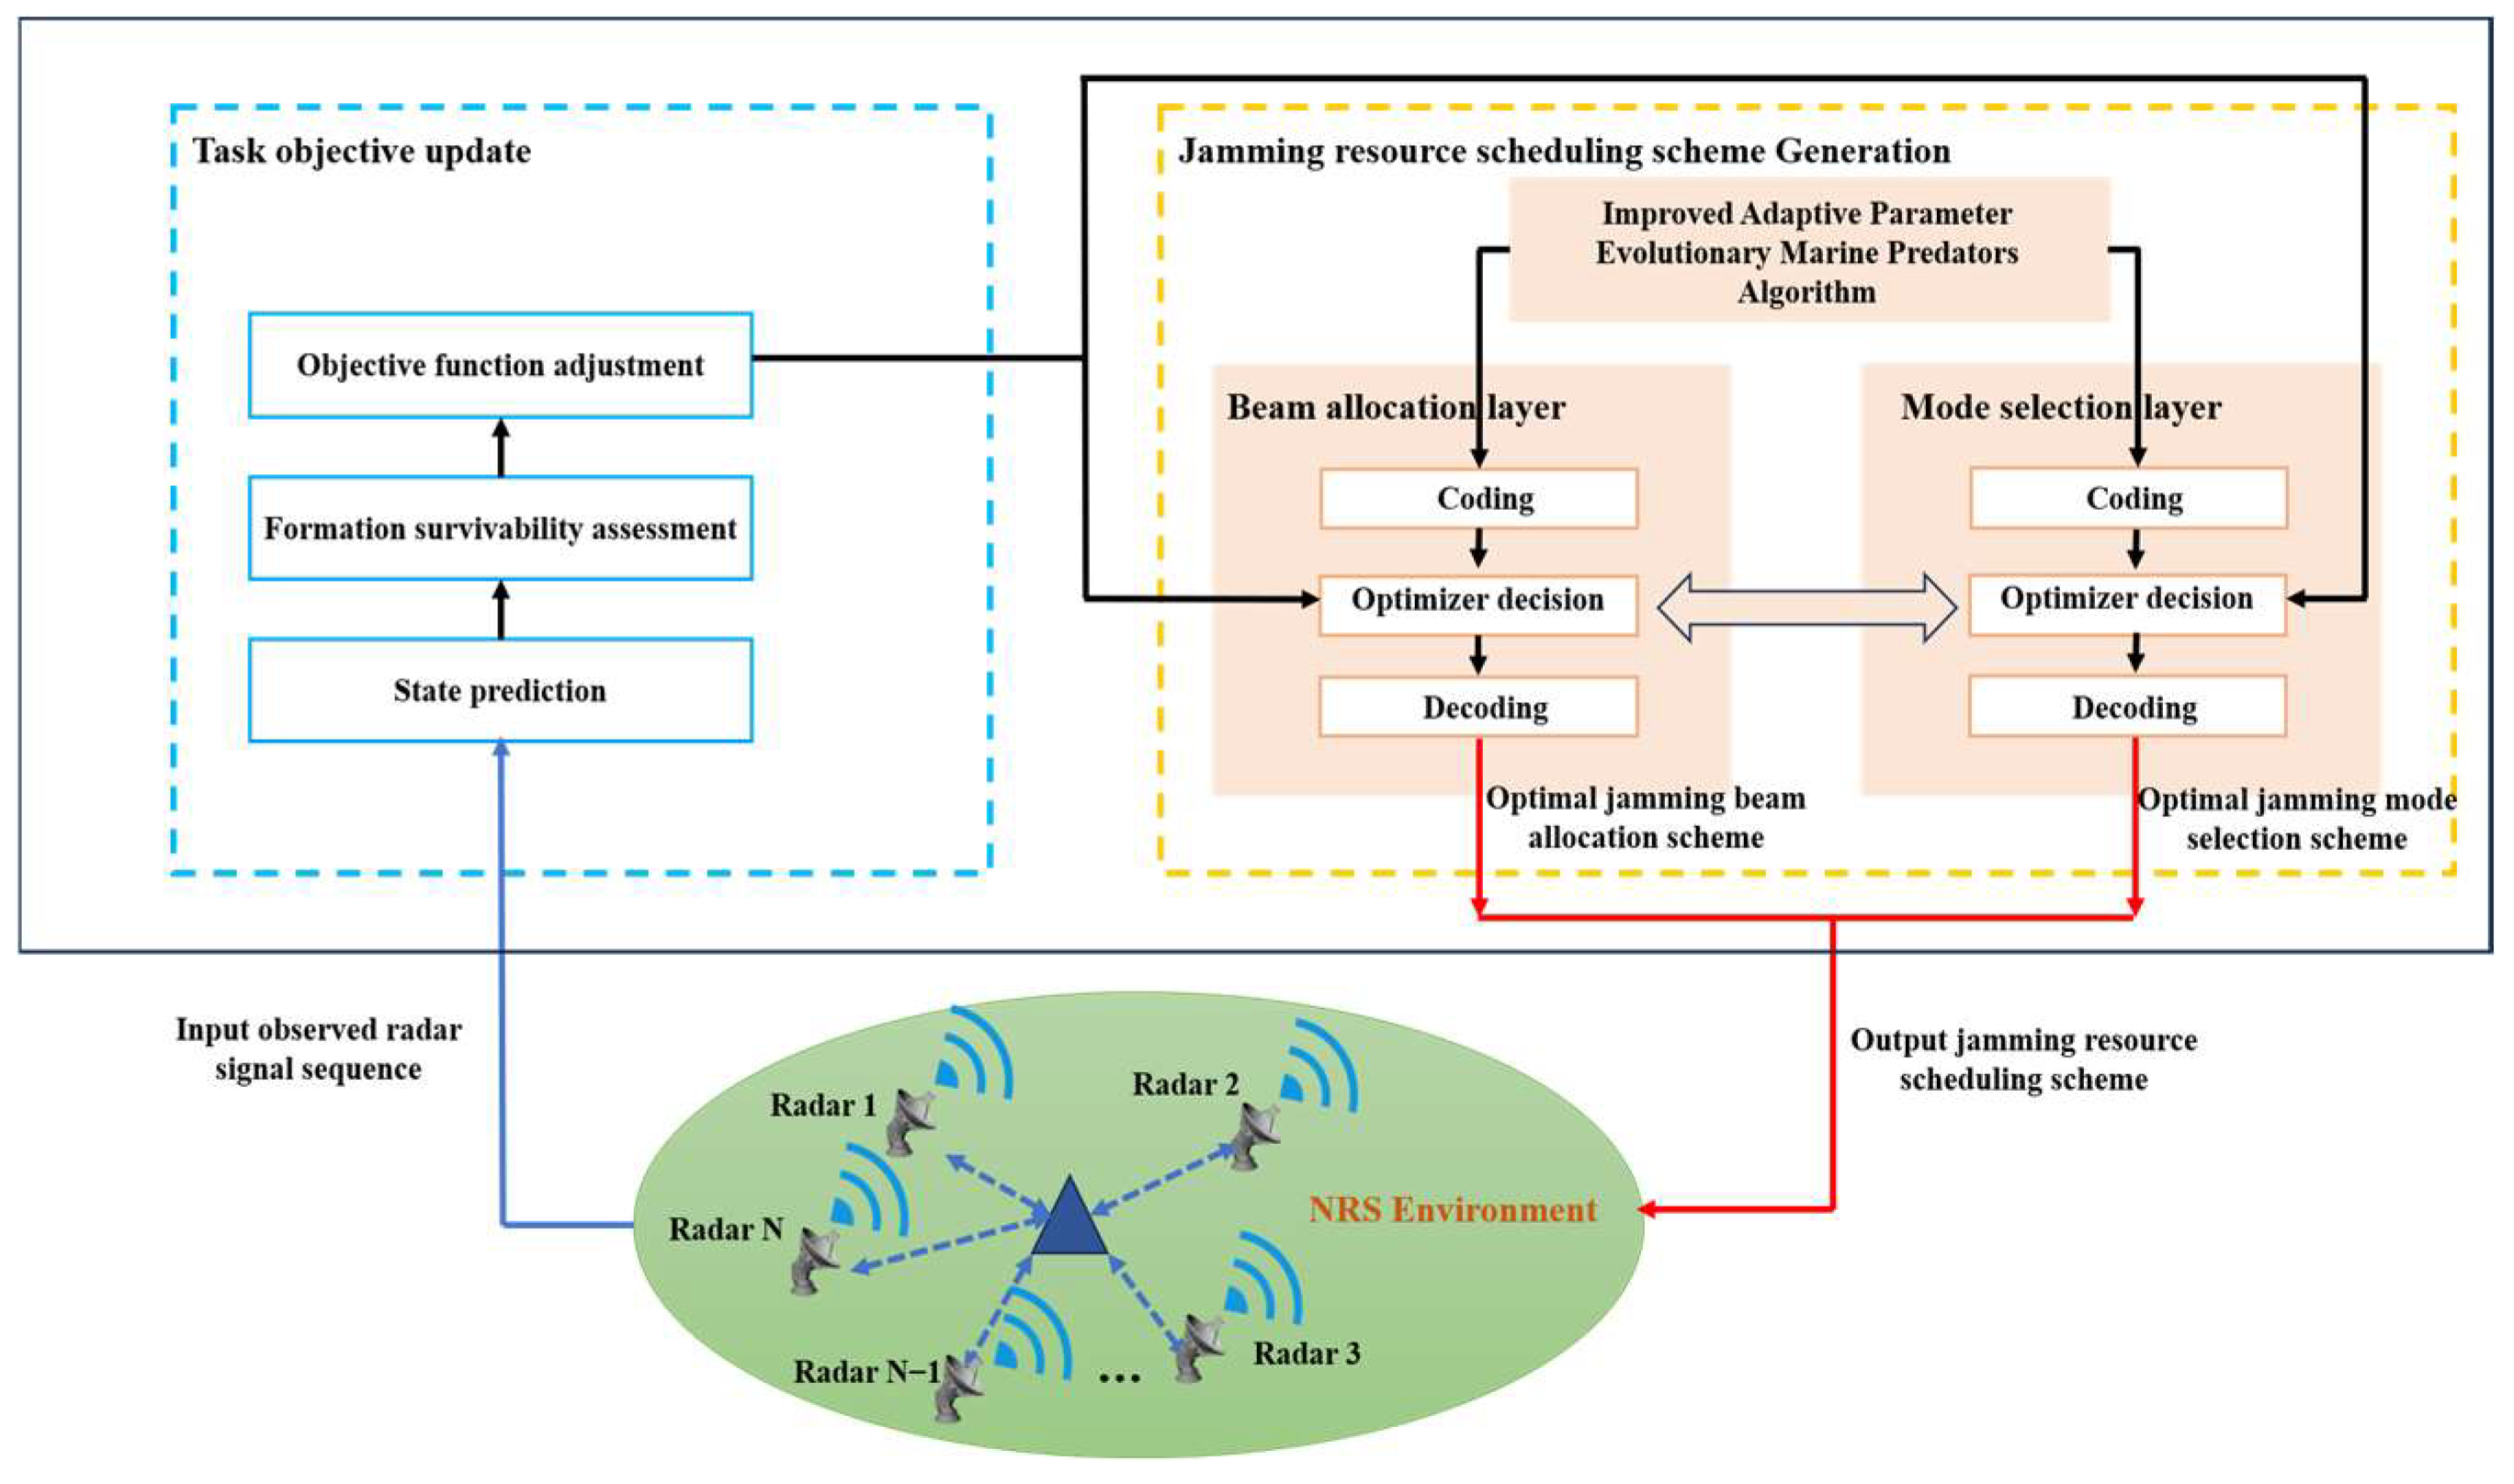
In this section, an adaptive hierarchical jamming resource scheduling solution framework suitable for embedding swarm intelligence methods is proposed, including two main phases: dynamic adjustment of the objective function and optimizer solution. The design framework is shown in Figure 4. Below is a detailed explanation of the two phases.
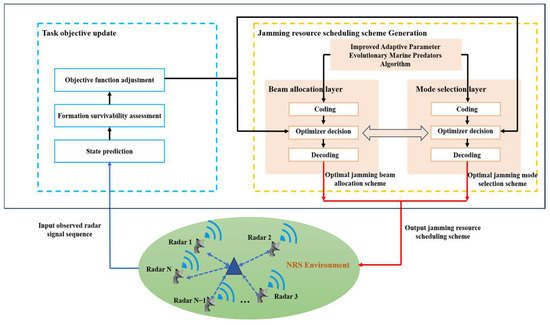
Figure 4.
IAPEMPA-based adaptive hierarchical strategy solution framework.
- Dynamic adjustment of the objective function.
The non-cooperative game of radar confrontation requires automatic adjustment of the resource scheduling task model objective to adapt to the state change of each radar in the network. In a specific air defense mission, the radar adopts several specific signal patterns in each state and performs Markov state transitions based on the quality of the target information obtained. Table 1 shows the correspondence between the radar state and the radar signal observation values through extensive reconnaissance statistics in the early stage of this task, including five states labeled as and eight observation values labeled as . Considering that the radar state is not directly observable, the HMM model is constructed based on the observation of the radar’s signal pattern sequence . Firstly, the EM method [41] is used to obtain the radar state transition probability and signal observation probability, which provide prior decision information for resource scheduling tasks. Then the Bayes rule is used to update the radar state belief probability based on observations as follows:
where b′ is the updated belief probability, represents the current belief probability when the radar is in state , represents the transition probability from state to state , and represents the probability of observing when the state is . The estimated state of the radar is the state with the highest belief probability.

Table 1.
Radar states and corresponding observation values.
After completing each radar’s state estimation in the network, penalty control weights are set considering the jamming interception risk. If the interception coefficient of sensor platform m reaches the upper limit 1 at time k, the corresponding weight is updated as follows:
where is a large positive real number. Then, Equation (26) can be redescribed as
- 2.
- Optimizer solution.
To meet the real-time requirements of online resource scheduling and be applicable to embedded management of other swarm intelligence algorithms, a hierarchical strategy optimizer is designed to decouple the beam allocation variables and jamming mode selection variables in the beam allocation layer (upper layer) and mode selection layer (lower layer), respectively. Specifically, in the beam allocation layer, the model (26) fixes and transforms into a subproblem (46) with respect to . Then, the output of the beam allocation layer is used as the input of the style selection layer, and the model (26) fixes and transforms into a subproblem (47) with respect to . By iteratively optimizing between the upper and lower layers until the termination condition is reached and the optimization stops, the optimal solution that satisfies the constraints is obtained. The specific steps of the IAPEMPA-based optimizer solution strategy are as follows:
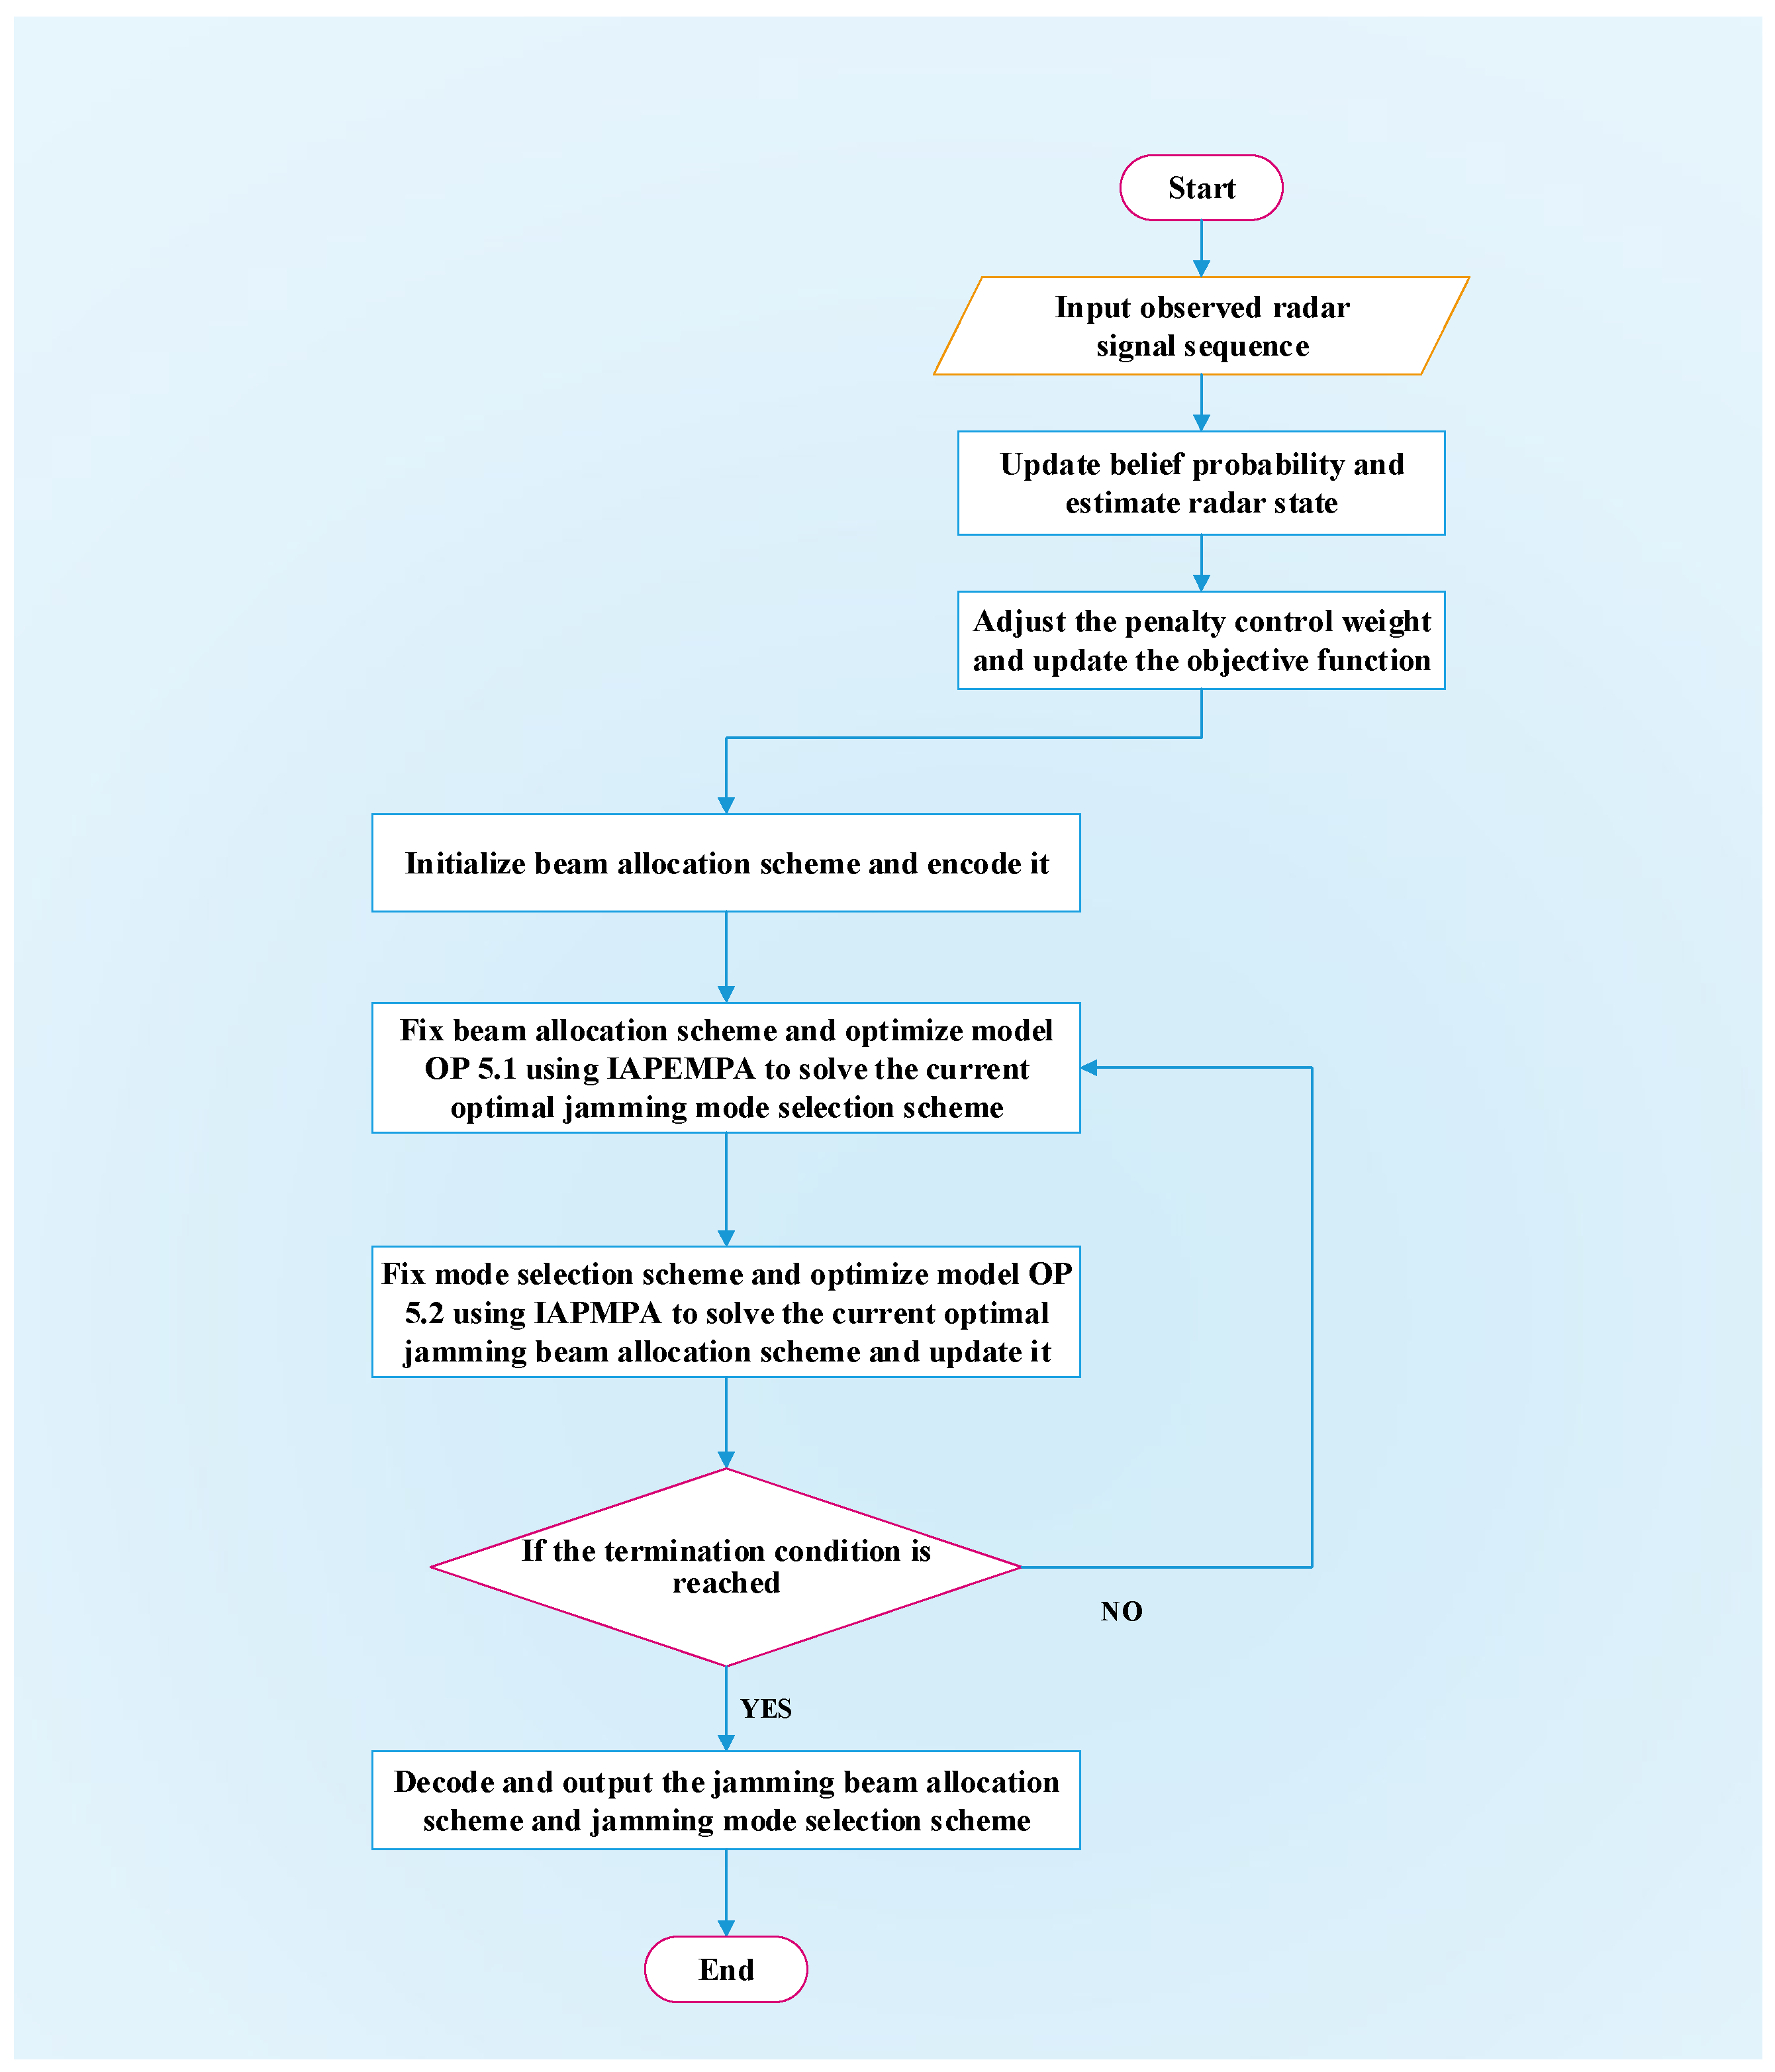
(1) Initialize a beam allocation scheme using a beam allocation encoding strategy and substitute it into Equation (26) to transform it into a decision problem OP 5.1 only with respect to .
Obviously, Equation (46) is a univariate optimization problem, which can be solved using IAPEMPA to obtain the potential optimal jamming mode selection scheme .
(2) Next, fix the jamming mode selection scheme , and then re-optimize the beam allocation scheme. The decision problem is transformed into
Similarly, use the IAPEMPA to solve OP 5.2 and update the beam allocation scheme.
(3) Solve the subproblem OP 5.1 and OP 5.2 iteratively and update the beam allocation scheme and jamming mode selection scheme; when the maximum number of iterations is reached or the change of the objective function value is less than a given value, the loop stops. Finally obtain the optimal beam allocation scheme and jamming mode selection scheme at time k.
The specific process of the joint jamming resource scheduling scheme generation is shown in Figure 5.
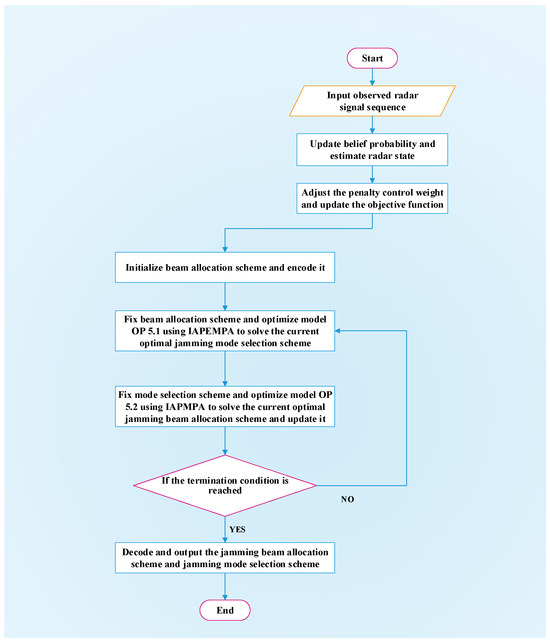
Figure 5.
Joint jamming resource scheduling scheme generation flowchart.
6. Simulation Results and Discussion
In this section, to demonstrate the performance advantages of the proposed adaptive jamming resource scheduling strategy based on the IAPEMPA in the scenario of formation cooperation against NRS, relevant simulation experiments and result analyses are conducted. In particular, the jamming effectiveness and jamming success rate of the proposed strategy and other strategies in different scenarios are studied. The following provides a detailed introduction to the scenario description, parameter settings, strategy comparison, and algorithm performance analysis in turn.
6.1. Scenario Description
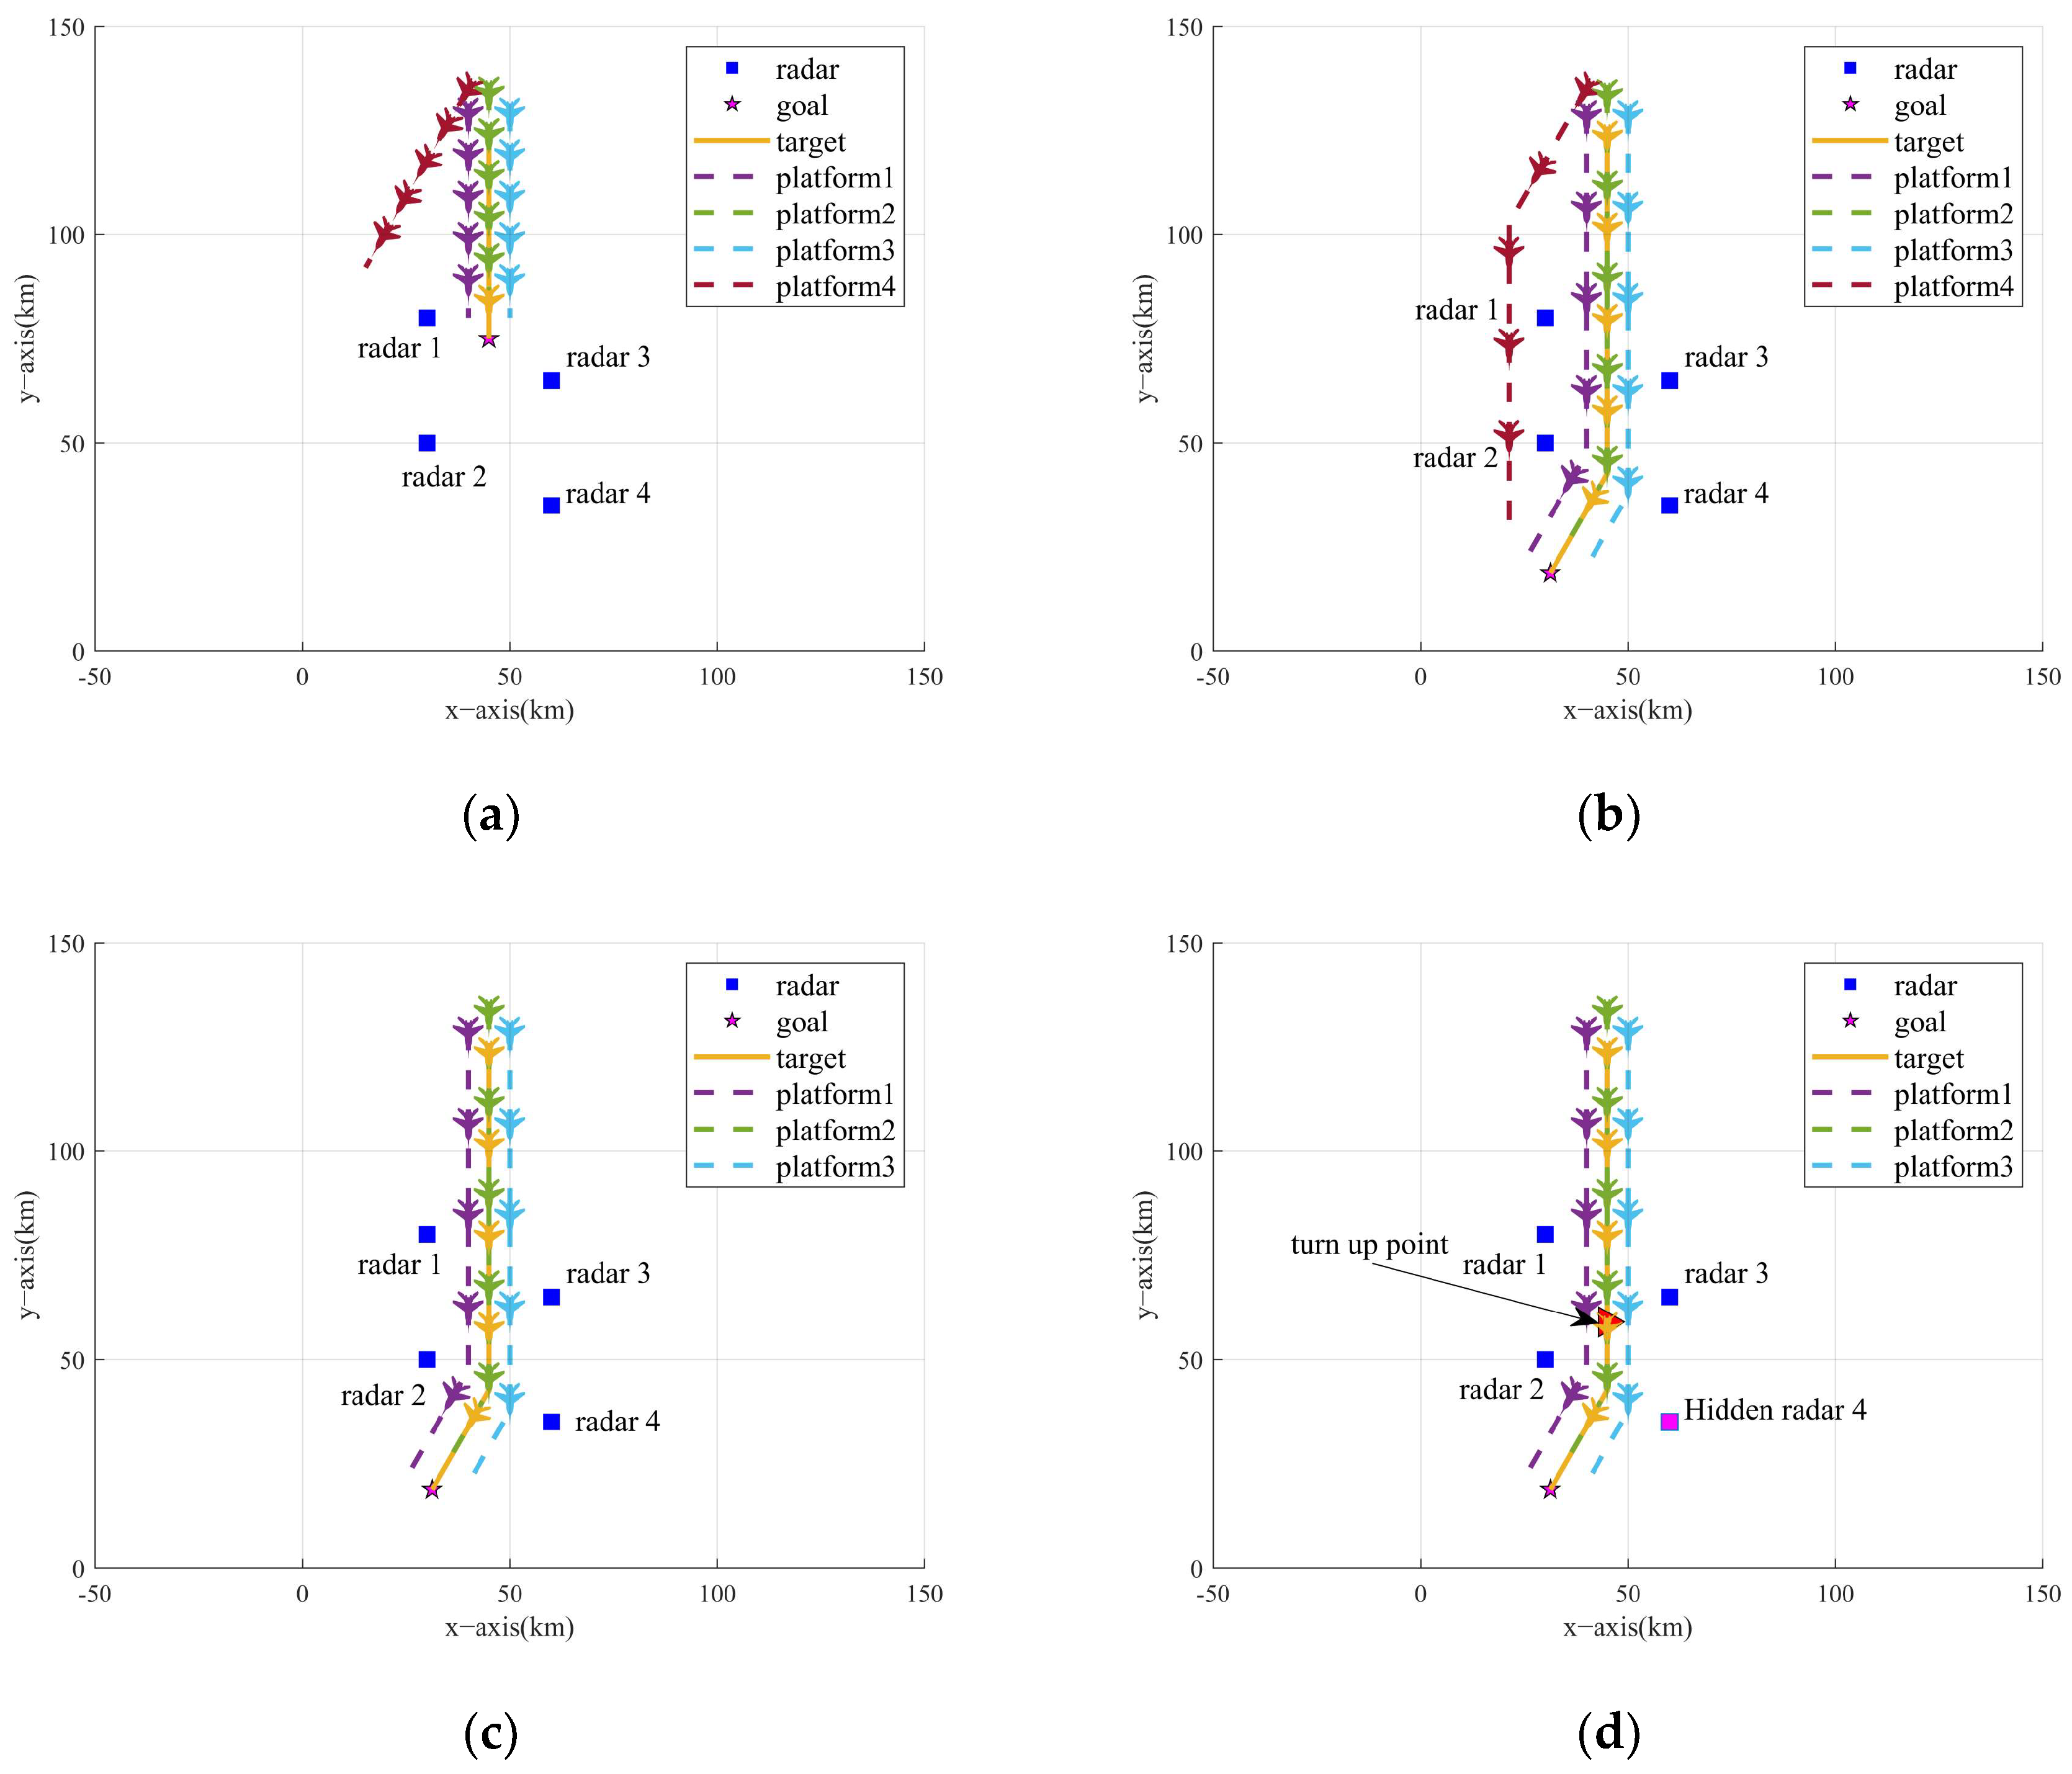
The simulation environment is carried out in a 100 km × 100 km × 10 km 3D space. The blue team (NRS) consists of N = 4 uniformly spaced radars, with each radar node’s initial state set to Search. The red team (sensor platform formation) follows CV linear motion dynamics to perform penetration tasks and obtains the radar signal observations through the radar warning receiver (RWR) at each time step. Four progressively challenging engagement scenarios are modeled to systematically evaluate the jamming strategy’s electromagnetic countermeasure (ECM) capabilities. The 2D vertical view of the formation trajectory is shown in Figure 6.
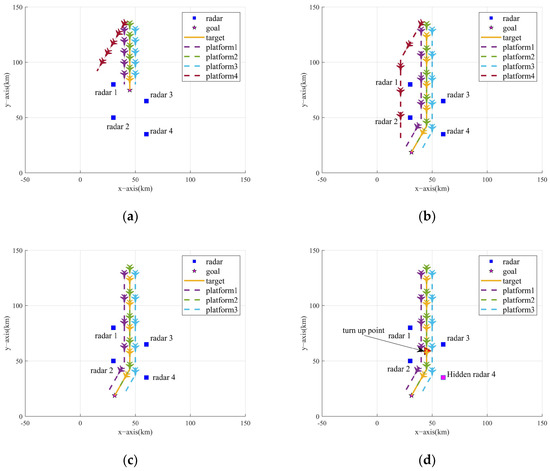
Figure 6.
Two-dimensional vertical view of formation trajectory and NRS deployment. (a) Scenario one. (b) Scenario two. (c) Scenario three. (d) Scenario four.
- Scenario one:
The situation that the number of available sensor platforms is equal to the number of radar nodes (i.e., sufficient jamming resources) is considered. The formation approaches from the north direction of the task area, and the target’s destination is close to the NRS. To attract the attention of the NRS, one of the sensor platforms performs lateral maneuvering jamming.
- 2.
- Scenario two:
In this scenario, the number of sensor platforms is still four, but the formation is required to traverse the NRS to reach the target destination, which is used to study the effect of changing the formation path planning on the performance of the jamming strategy.
- 3.
- Scenario three:
This scenario replicates Scenario two’s trajectory, but the number of available sensor platforms is less than the number of radar nodes (i.e., insufficient jamming resources). The deployment of the NRS remains unchanged, with three sensor platforms accompanying the target to perform tasks.
- 4.
- Scenario four:
A formation consisting of three sensor platforms and a target is intended to penetrate an NRS consisting of three radar nodes initially, with a sudden fourth radar (the pink square in Figure 6d) activation to perform detection tasks, which is used to test the adaptability of the jamming strategy in the case of incorrect/insufficient prior information.
6.2. Parameter Settings
The simulation adopts a Cartesian coordinate system to characterize the current environment, and the NRS adopts the rank K = 3 information fusion criterion. Assuming that the working bandwidth of the jammer can cover the radar carrier frequency, the basic parameter information of both teams is shown in Table 2 and Table 3.

Table 2.
Radar performance parameters.

Table 3.
Formation performance parameters.
In four scenarios, the trajectory of the formation is given by running the CV model for 100 time steps. The safe power boundary is −30 dB, the safe time threshold is 3, and the importance coefficient of the sensor platform is set to [0.2, 0.4, 0.2, 0.2]. The jamming mode of each sensor platform is selected from the set [1, 2, 3], representing noise jamming, range gate pull-off (RGPO) jamming, and smart noise jamming in sequence. The initial belief probability of each radar state is b0 = [0.2, 0.2, 0.2, 0.2, 0.2]. The experimental environment is Windows 10, and the CPU is Intel (R) Core (TM) i7-6500U CPU @ 2.50 GHz, 256 G memory. Table 4 shows the initial parameters of the IAPEMPA algorithm.

Table 4.
IAPEMPA Initial Parameters.
6.3. Strategy Comparison and Evaluation Metrics
Compare the proposed strategy with two other typical cooperative jamming strategies and provide evaluation metrics applicable to this task. The definitions of the other two strategies are as follows:
(1) Intended strategy. The beam allocation scheme and jamming mode selection scheme are planned in advance for each sensor platform before the task begins and remain unchanged throughout the entire process.
(2) Greedy strategy. Each sensor platform prioritizes the allocation of jamming beams to radars closer to itself and updates the historical average reward of each jamming mode at each time step, then randomly selects jamming modes based on the ε-greedy method, theoretically increasing the possibility of exploring the optimal jamming strategy.
Conduct 100 Monte Carlo experiments and evaluate the jamming effectiveness performance of each strategy by using the average detection probability (ADP), the average tracking mean square error (ATE), and the average electromagnetic exposure coefficient (AEEC) during the task time. On this basis, to directly quantify the jamming success rate, the statistics of the radar state recognition rate (SRR) and the average occupancy rate of identification (AOI) are added. The definition of the SRR is the ratio of the times that the platform correctly recognizes the radar state during the task period to the total task time, and the definition of the AOI is the ratio of the duration that the radar is in identification state to the total task time. The mathematical expressions of the five metrics are as follows:
where K is the total task time, TMC is the number of Monte Carlo experiments, denotes the true state of the radar at time k, is the estimated state of the radar, and is the indicator function, expressed as
It is worth mentioning that the proposed strategy updates the belief probability of the radar state rather than directly using observations to schedule jamming resources, and correct recognition of the radar state is an important prerequisite for completing the task.
6.3.1. Scenario One
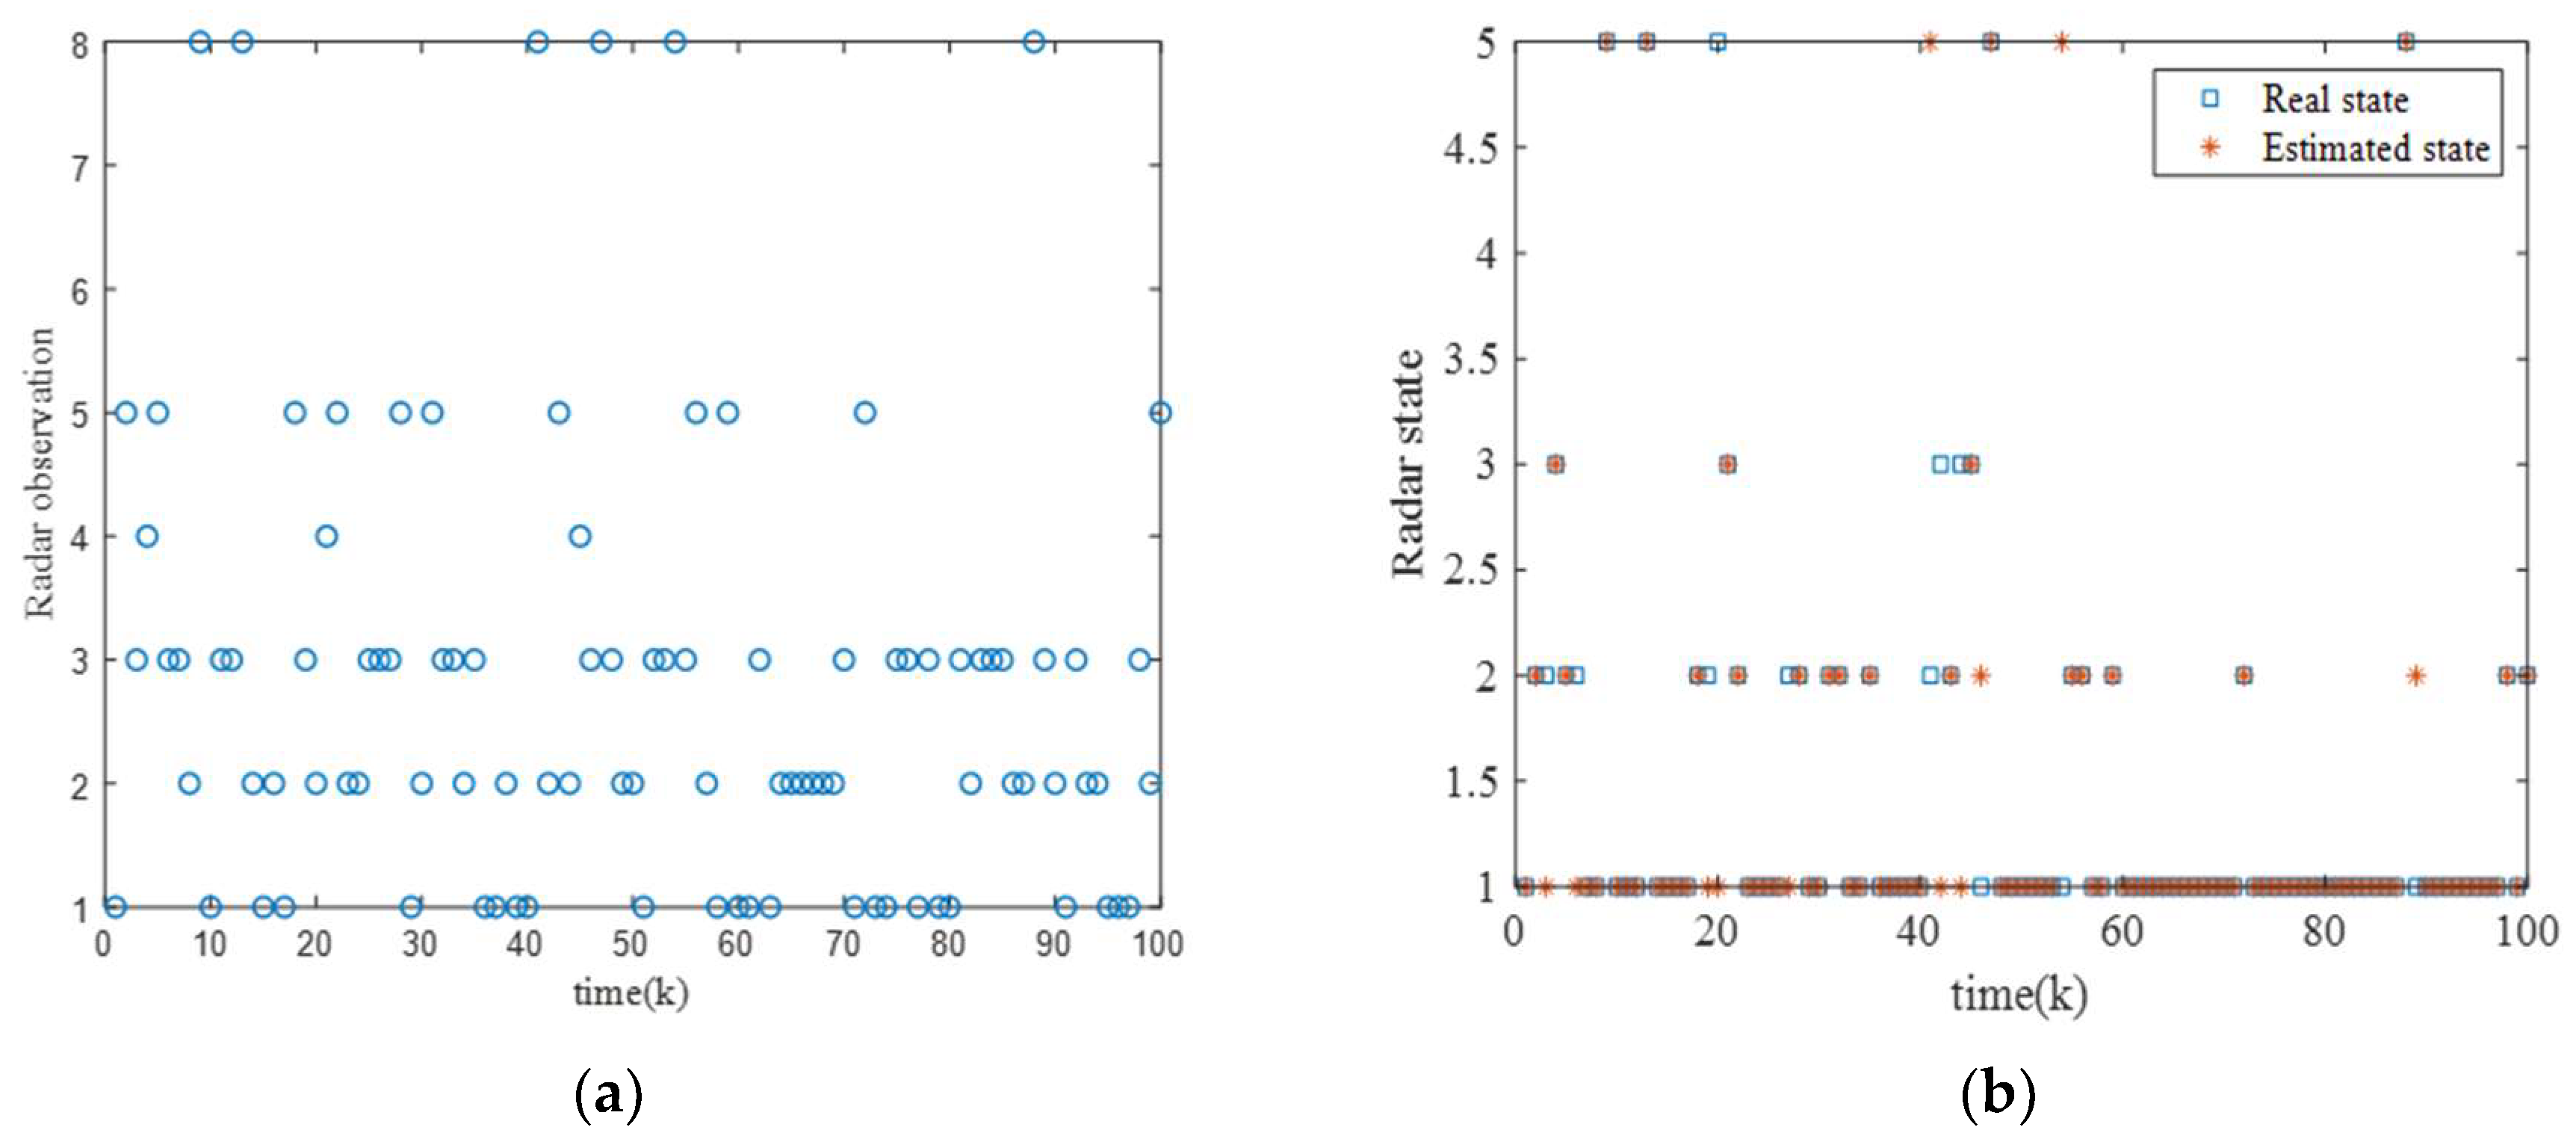
For this scenario, Figure 7 shows the observations, true states, and estimated states of the radar at each time step in a single experiment. It can be clearly observed that there is not a one-to-one correspondence between the states and the observations, and radar can emit signals with different characteristics in certain states. Additionally, during most of the task time, the estimated state of the radar aligns well with the true state, indicating that the belief probability is capable of tracking the radar’s state effectively.
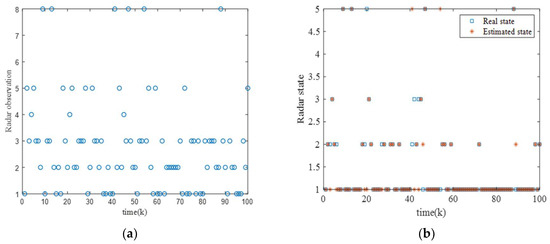
Figure 7.
Radar state observation results. (a) Observations of radar at each time step. (b) True and estimated states of the radar at each time step.
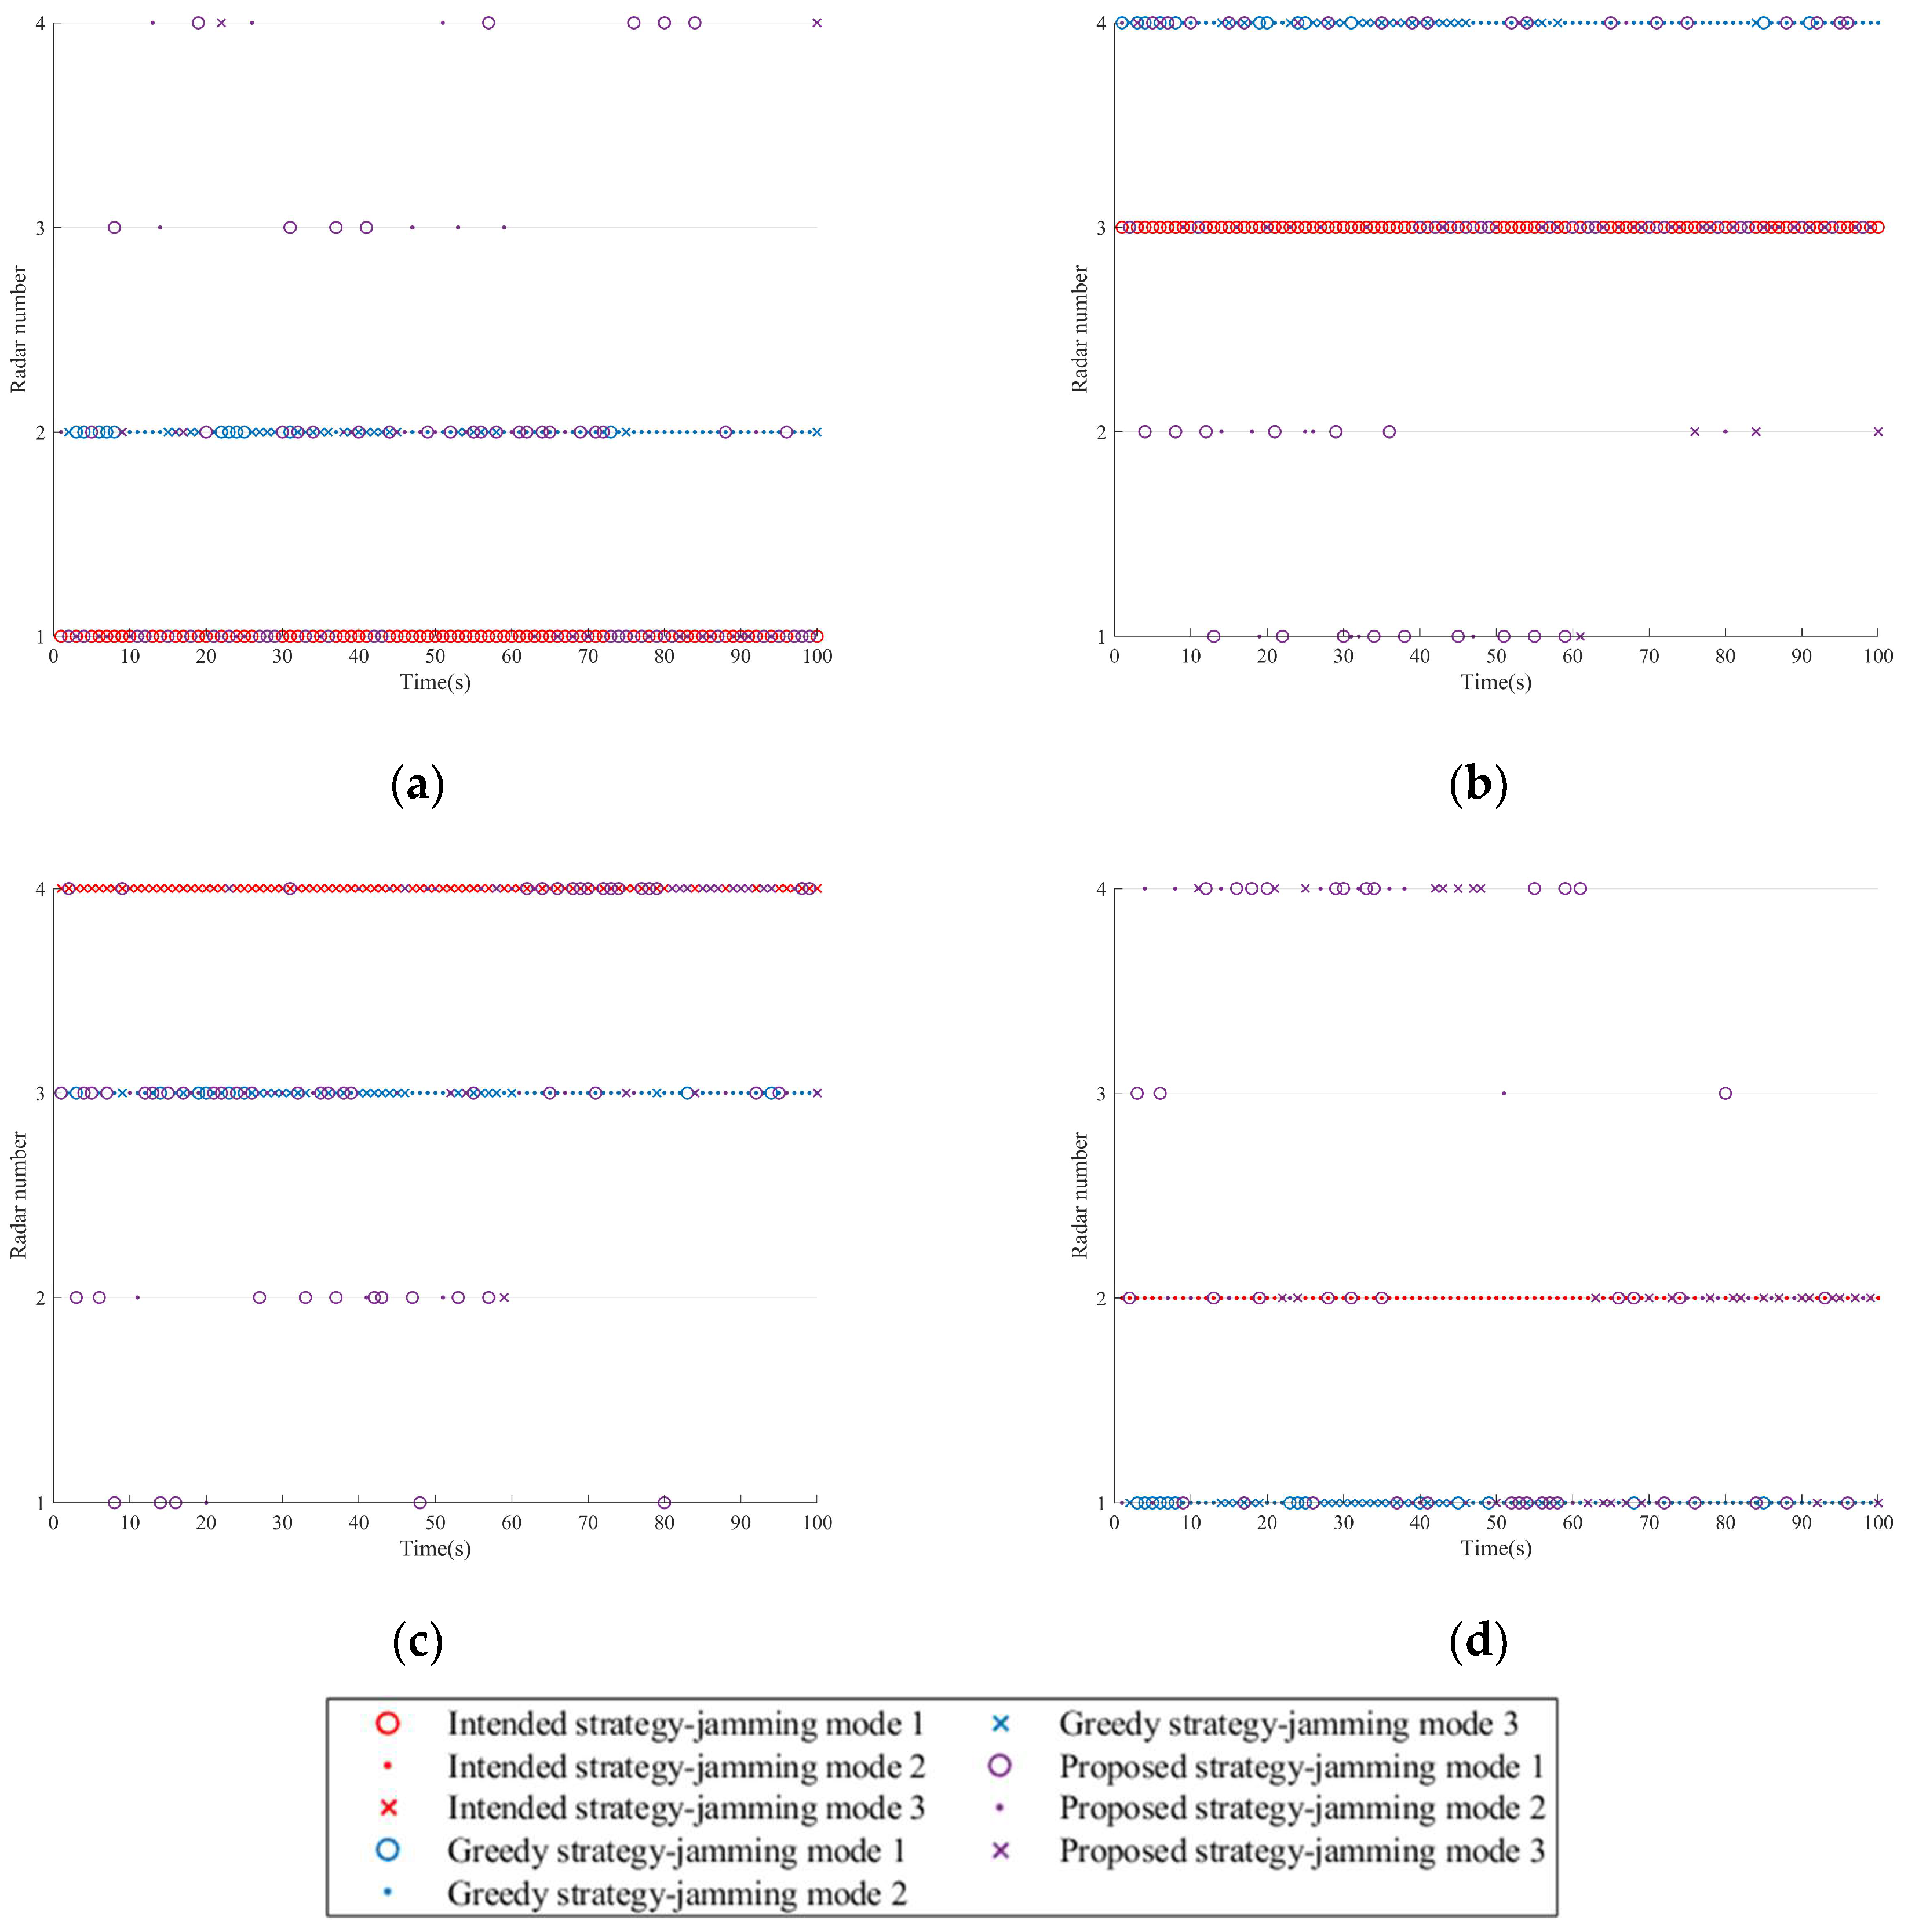
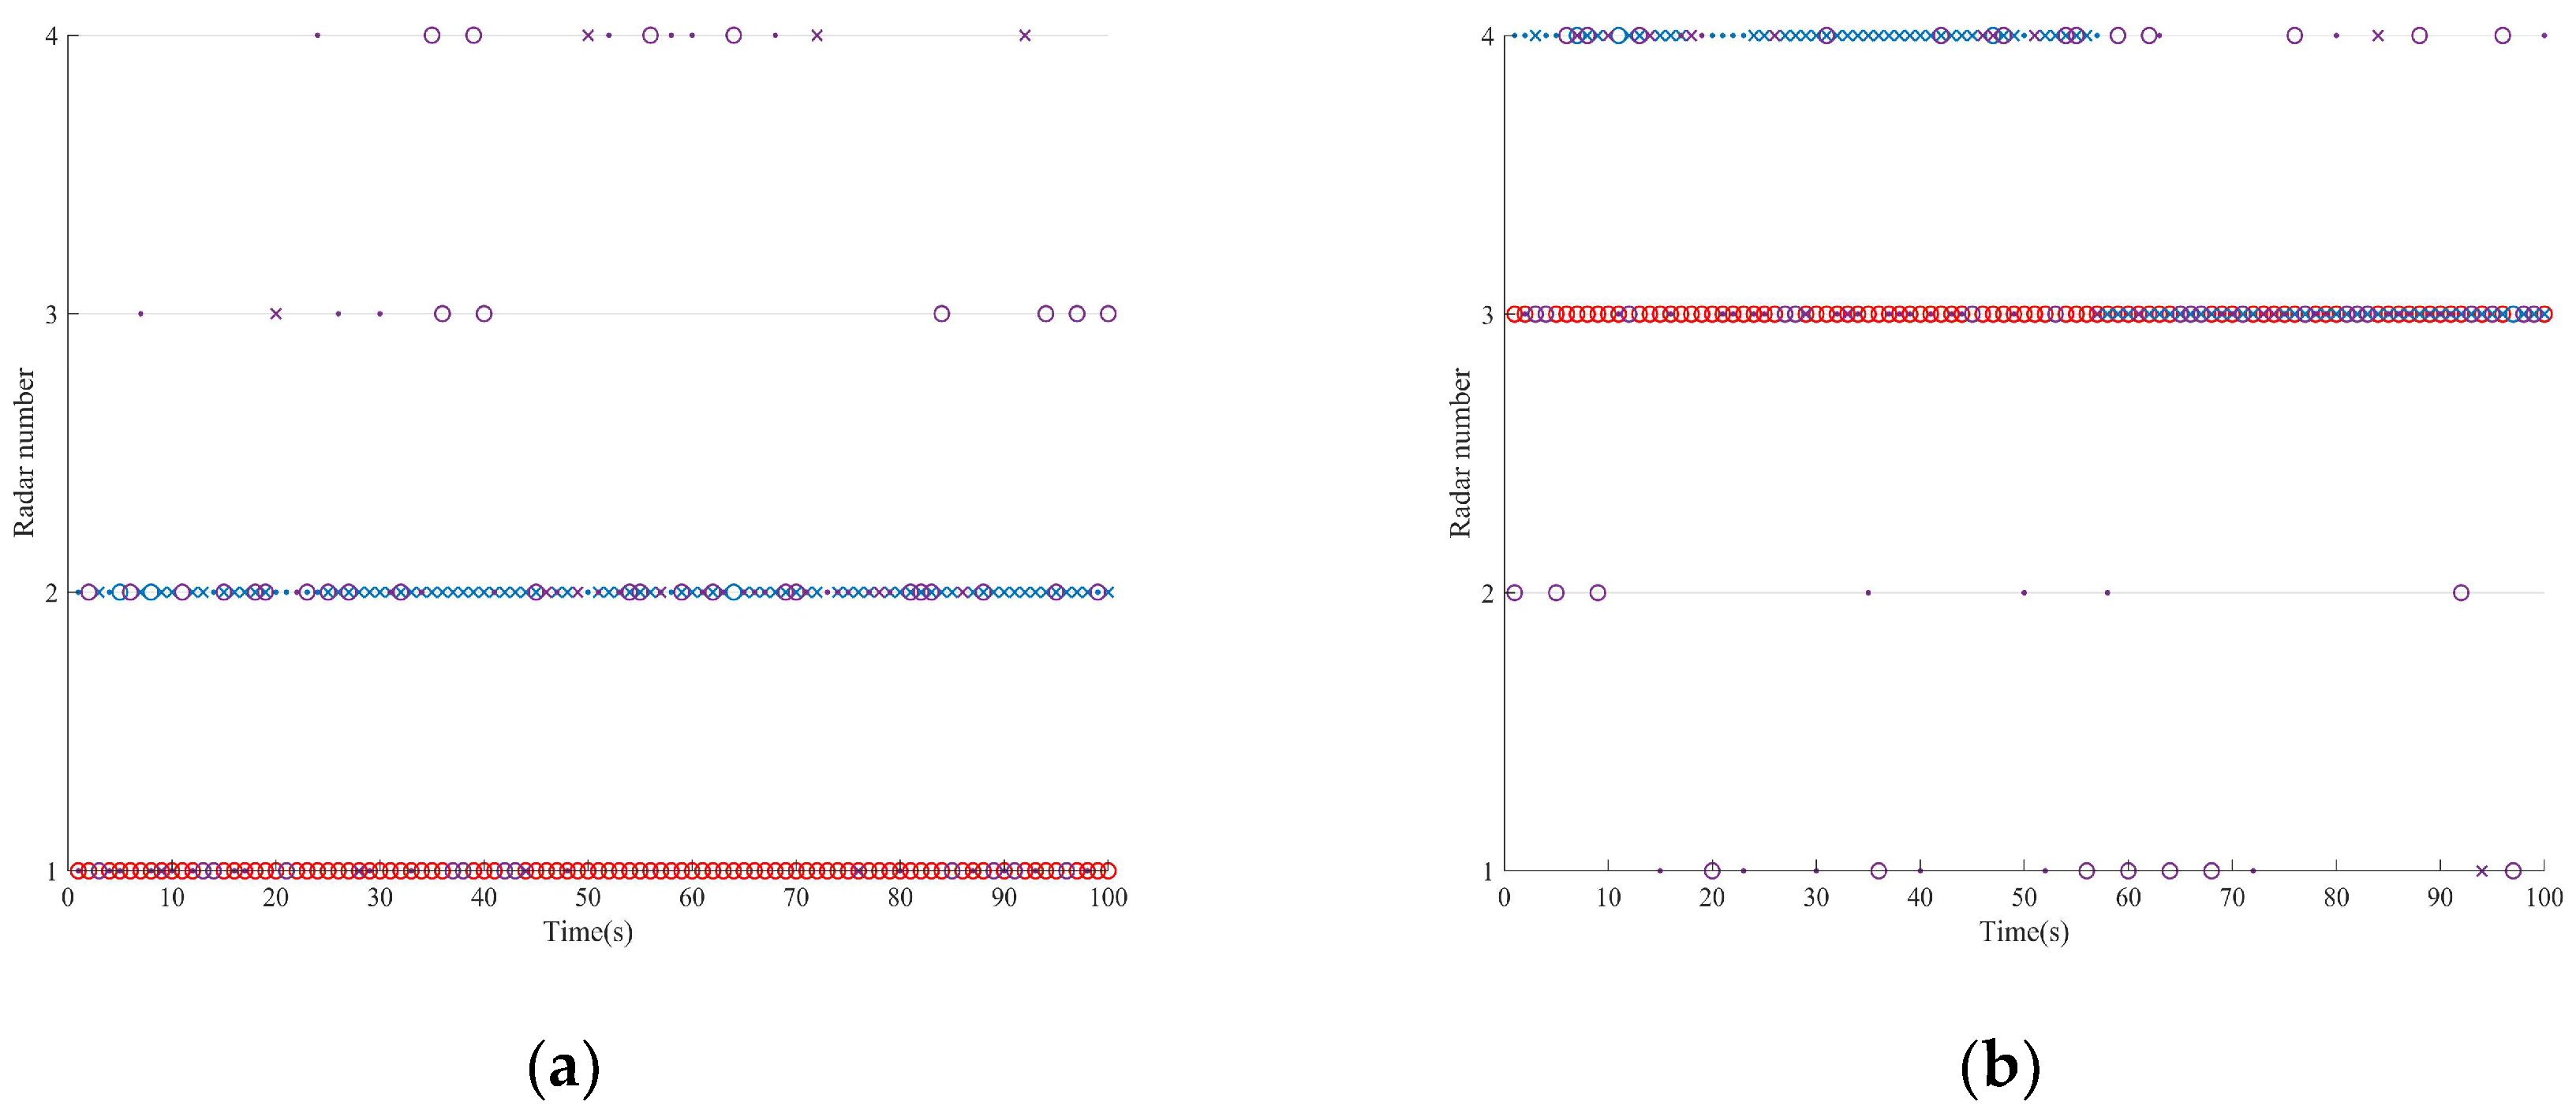
The sequence diagram of the single resource scheduling schemes for the three strategies is shown in Figure 8. In the case of sufficient jamming resources, each platform is required to allocate one radar node. In comparison, the intended strategy is the simplest. When the formation employs the greedy strategy, each platform prioritizes jamming the radar closer to itself (with a higher threat degree) and tends to use the latter two jamming modes. In contrast, when using the proposed strategy, to achieve a balance between the target survival task and the platform’s stealth, the platform implements intermittent jamming for the radar closest to itself.
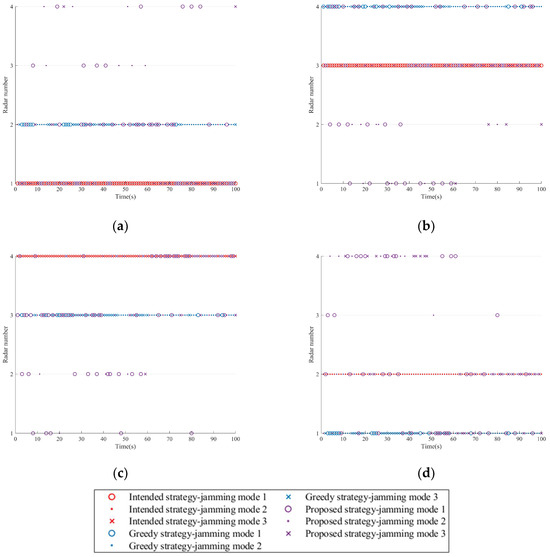
Figure 8.
Jamming resource scheduling schemes in Scenario one. (a) Platform 1. (b) Platform 2. (c) Platform 3. (d) Platform 4.
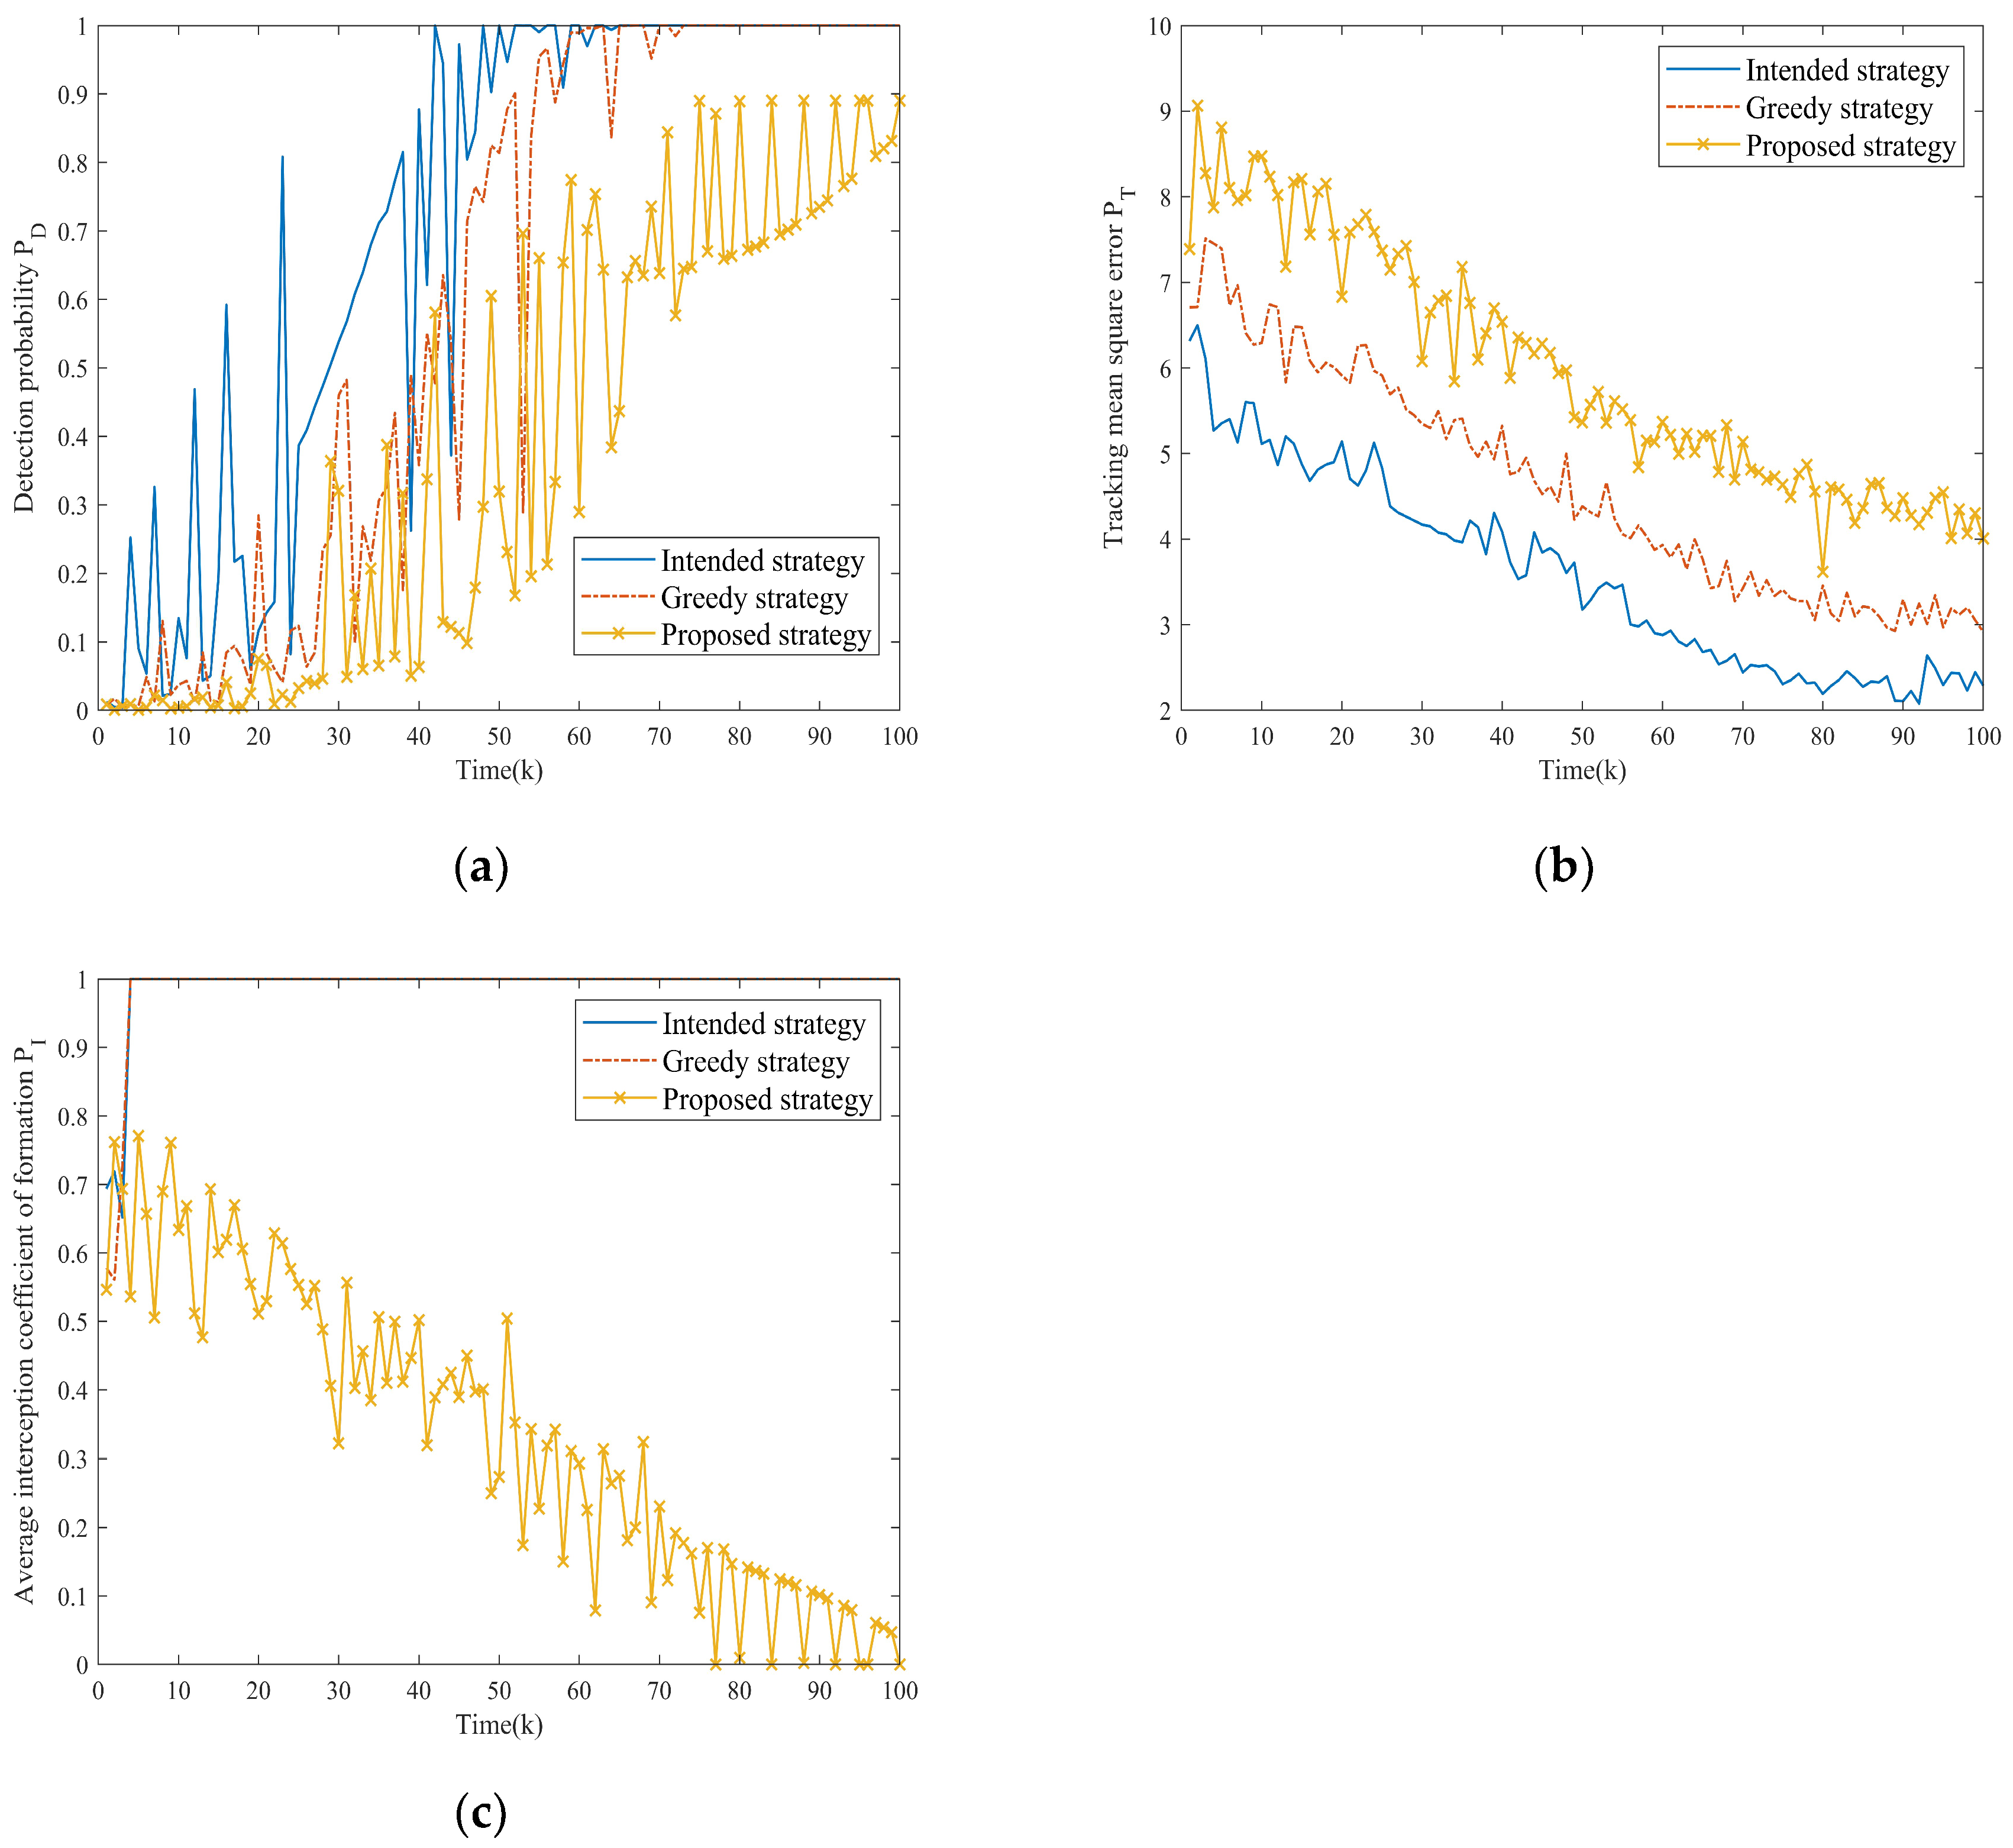
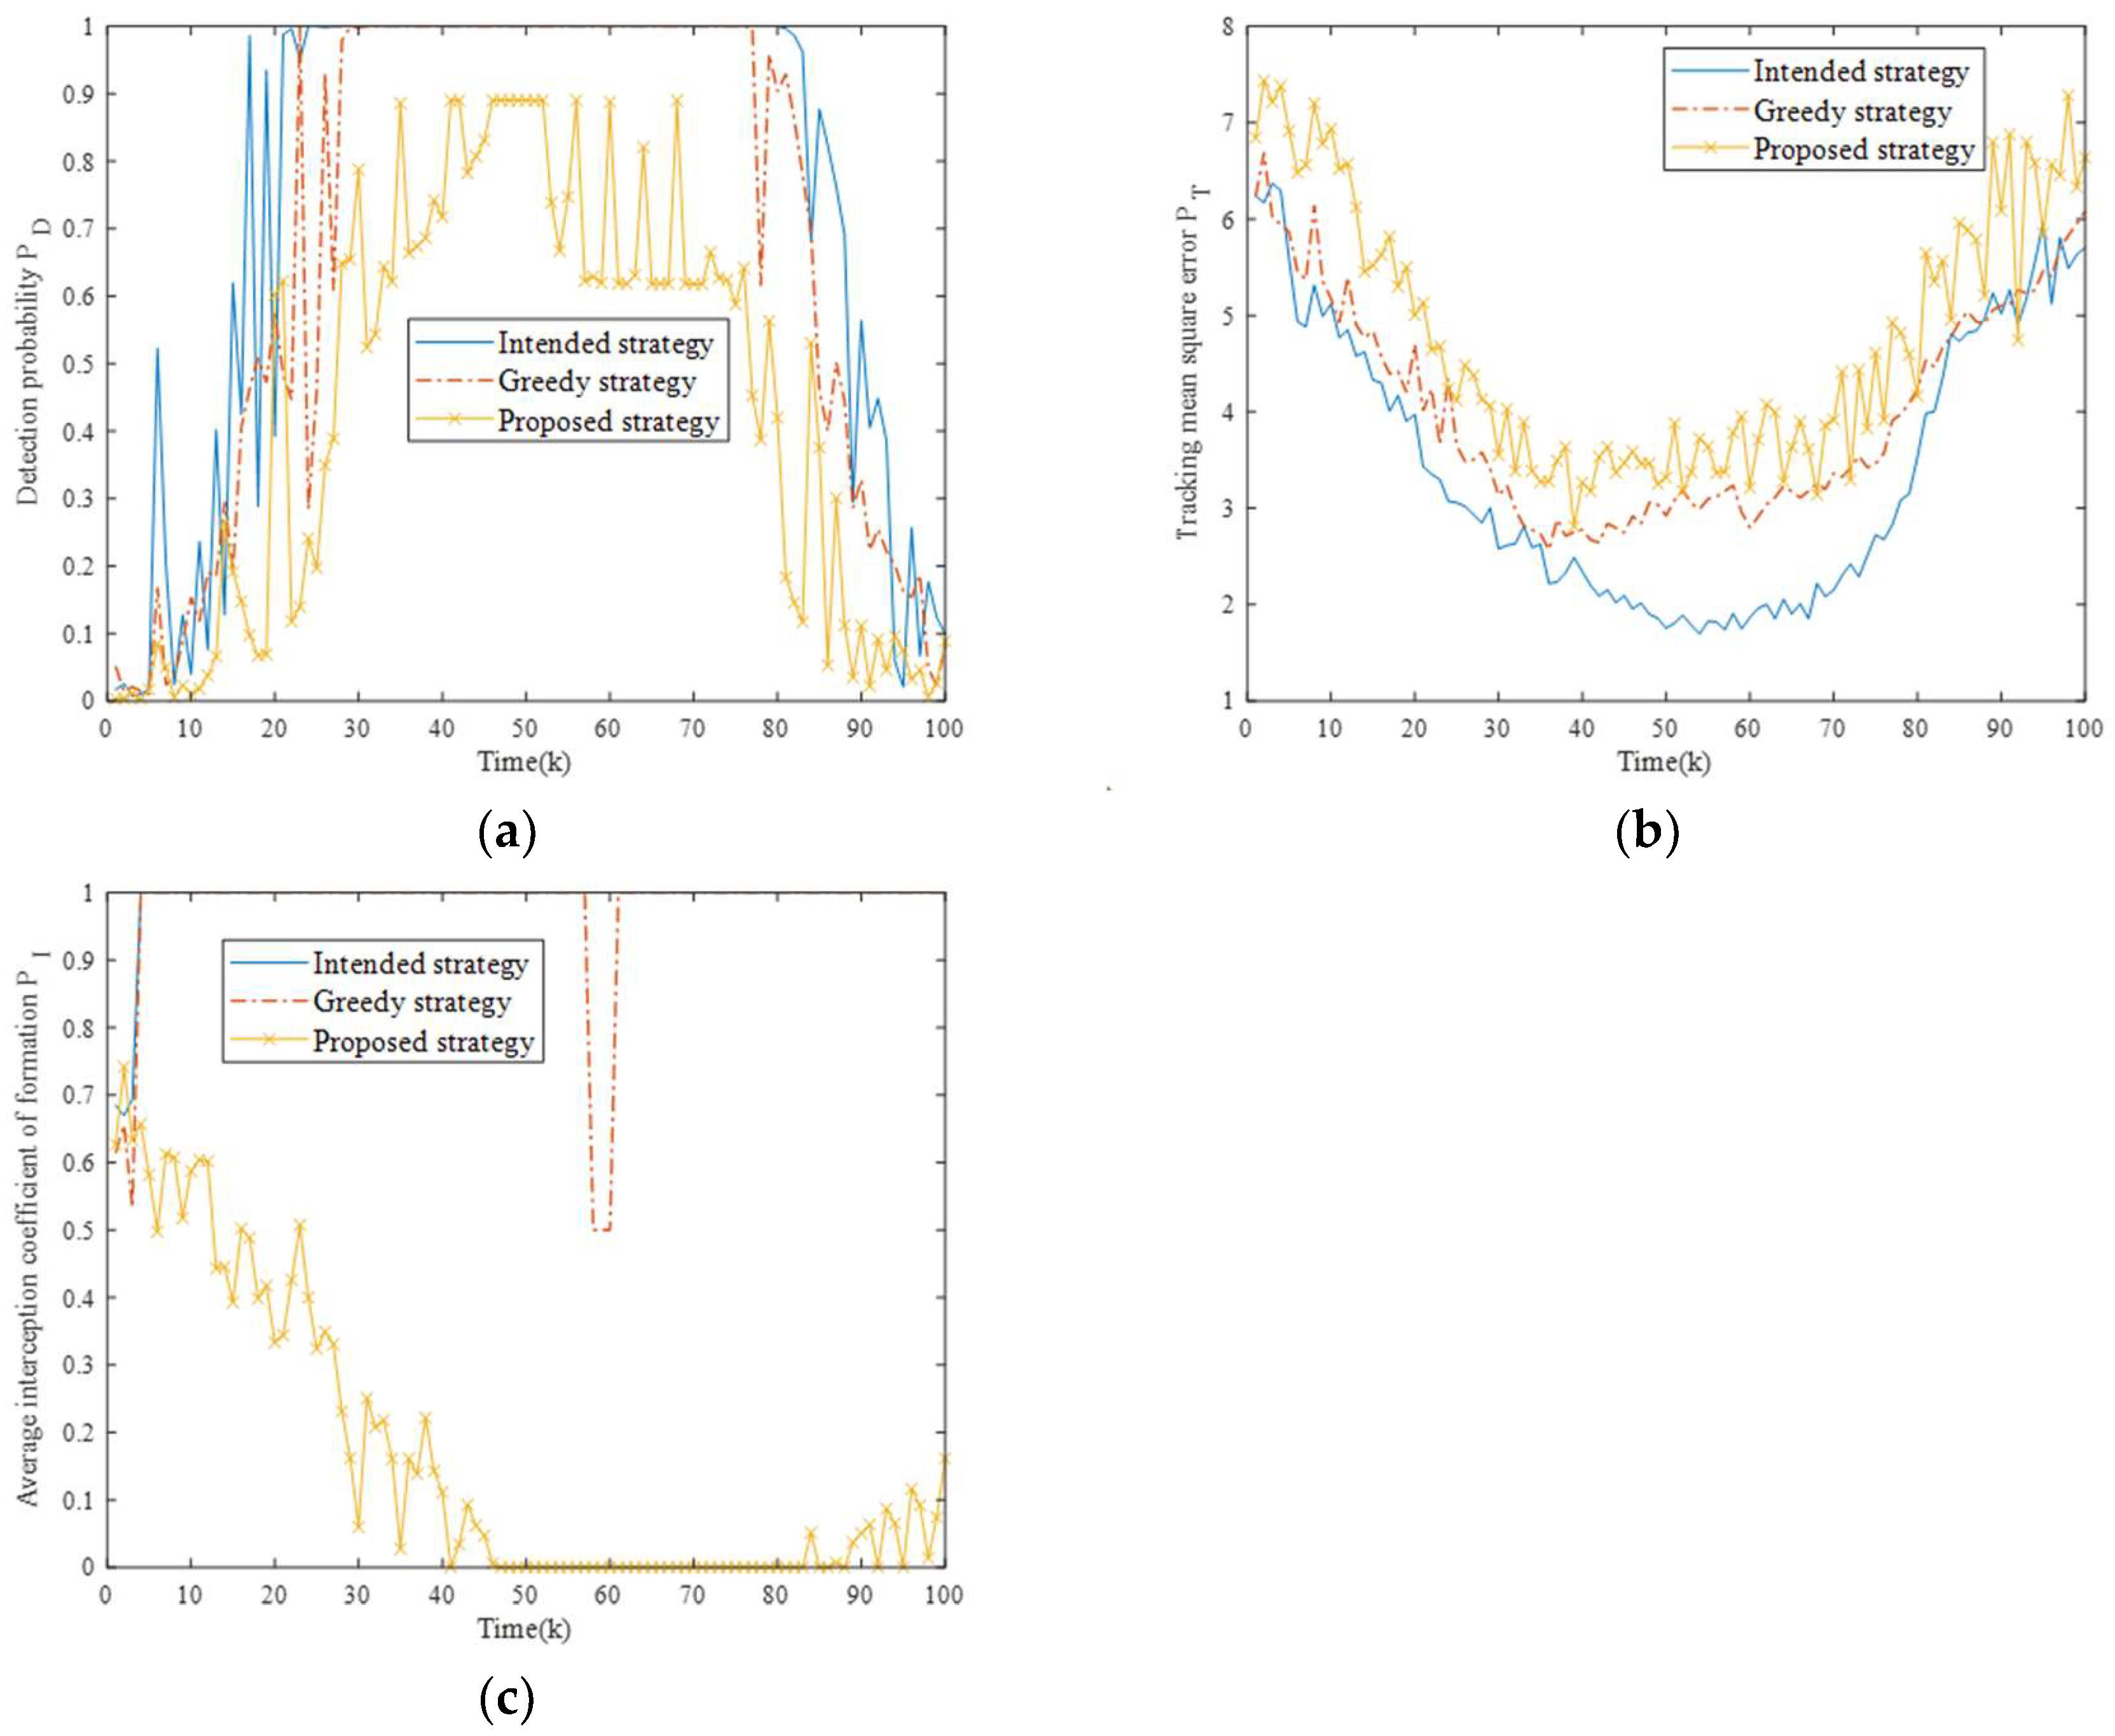
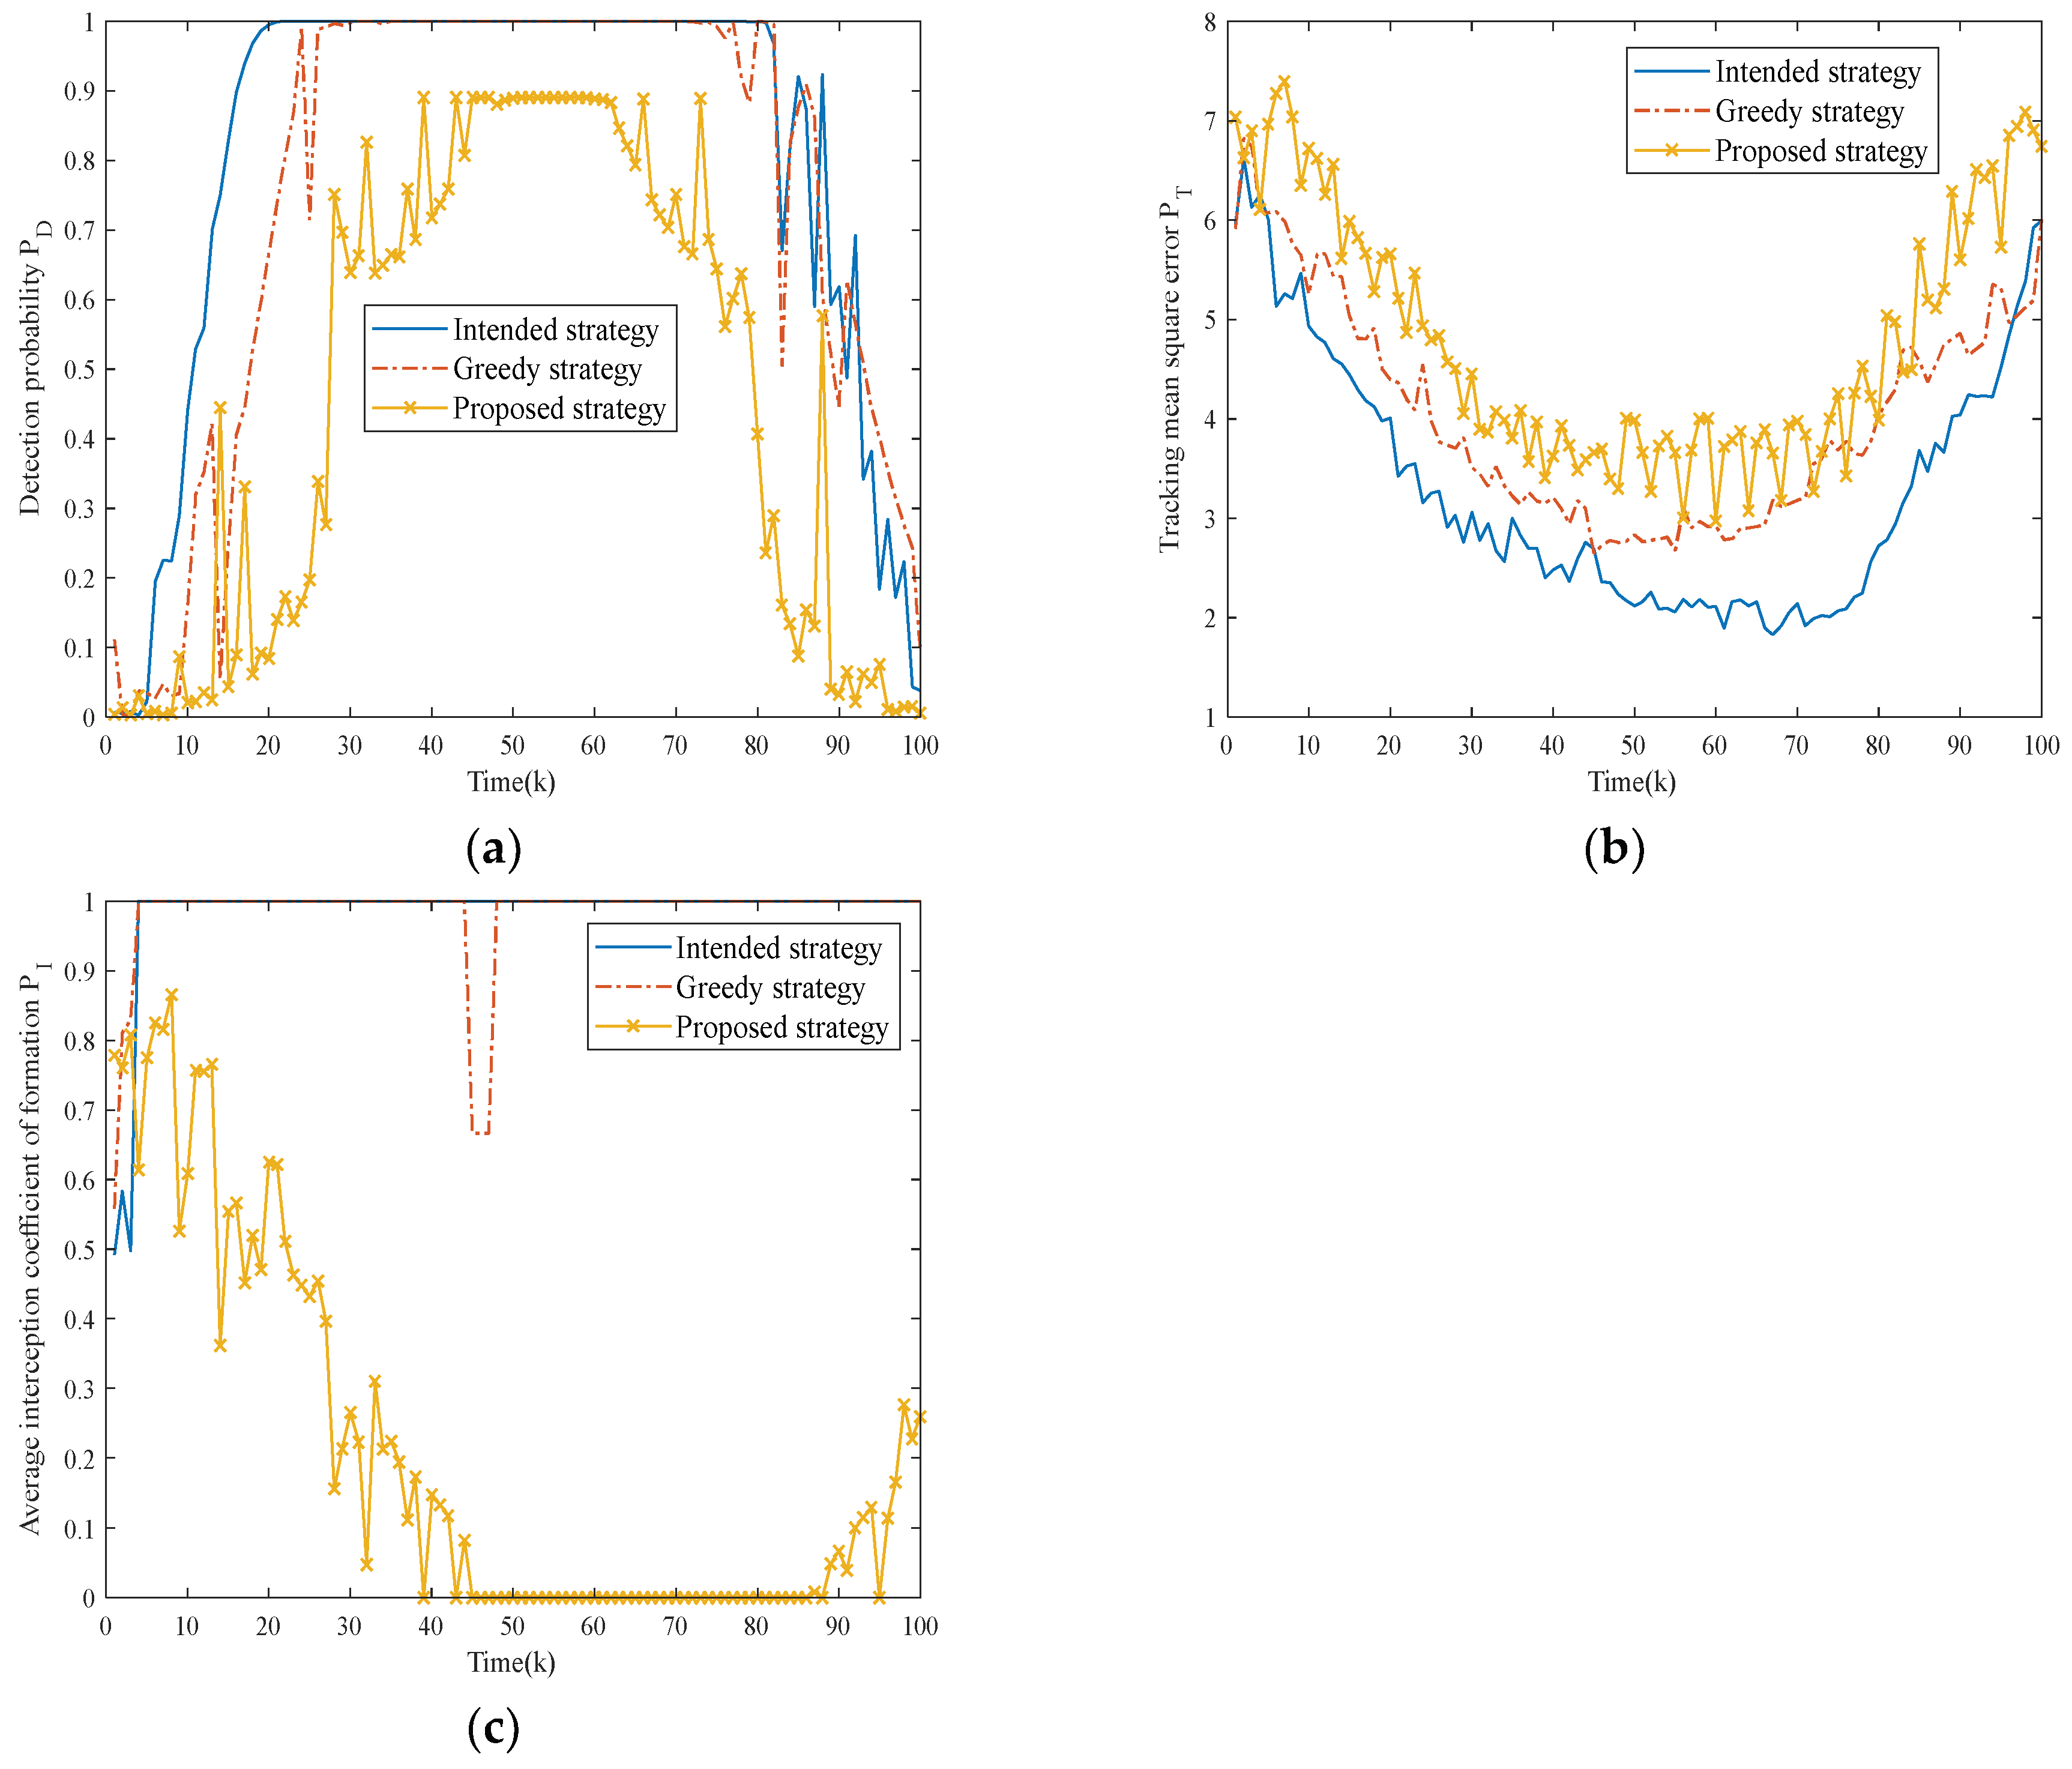
To compare the effectiveness of the three strategies more intuitively, firstly, Figure 9a,b shows the target fusion detection probability and tracking mean square error of the NRS under different strategies, and Figure 9c shows the average platform interception coefficients over time.
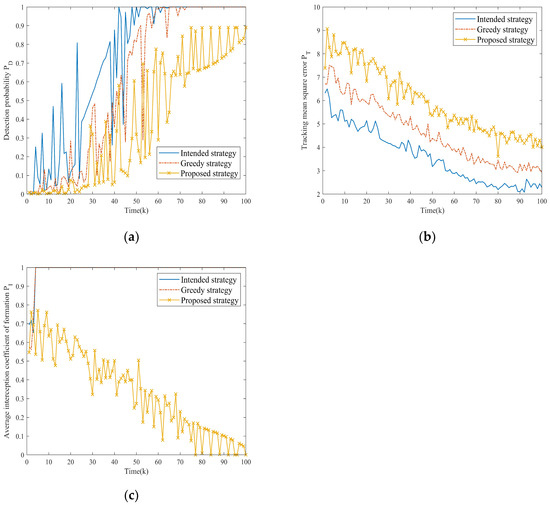
Figure 9.
Comparison of optimization indexes for different strategies in Scenario one. (a) Comparison of fusion detection probability for three strategies. (b) Comparison of tracking mean square error for three strategies. (c) Comparison of average platform interception coefficients for three strategies.
From Figure 9a,b, it is clear that as the formation gradually approaches the NRS, the fusion detection probability of the target shows an increasing trend, and the tracking mean square error gradually decreases. This is a reasonable phenomenon caused by the increasing SJR required for radar detection. The intended strategy demonstrates the poorest jamming performance, being incapable of adapting to dynamic electromagnetic conditions. While the greedy strategy marginally improves the jamming performance, the proposed strategy achieves superior jamming efficacy through two synergistic effects: maintaining lower fusion detection probability (delaying the NRS’s first target detection) while simultaneously generating a higher tracking mean square error (reducing stable tracking duration), thereby creating compounded operational advantages.
Figure 9c quantifies electromagnetic radiation exposure risks across three strategies. Obviously, the first two strategies exhibit higher average platform interception coefficients, which greatly increases the risk of task failure. In contrast, the proposed strategy achieves effective control of electromagnetic energy and radiation duration by dynamically adjusting the objective function throughout the entire task period, thereby preventing radar lock-on through flexible jamming resource scheduling.
Secondly, four evaluation metrics for three strategies were calculated in the Monte Carlo experiment, as shown in Table 5.

Table 5.
Statistical results of evaluation metrics in Scenario one.
It can be seen that the proposed strategy demonstrates comprehensive metric dominance. Specifically, compared with the other two strategies, the ADP decreased by 0.3876 and 0.2152, the ATE increased by 1.3087 and 0.9432, the AEEC decreased by 0.6510 and 0.6484, and the AOI decreased by 26% and 13.5%, respectively. It should be noted that the AOI is an important metric that directly measures the jamming success rate of the formation. The proposed strategy can effectively reduce the high-threat state duration of the NRS, thereby fundamentally ensuring target survivability through operational tempo disruption.
6.3.2. Scenario Two
Due to space limitations, the observations and true states of the radar at each time step are not displayed in subsequent scenarios (which are verified through SRR metrics).
Figure 10 shows the resource scheduling scheme for three strategies in a single run. Under complex spatial situations, the proposed strategy exhibits enhanced dynamic adaptation. Similarly, the system maintains its survivability guarantee by implementing coordinated alternating jamming on high-value radar nodes.
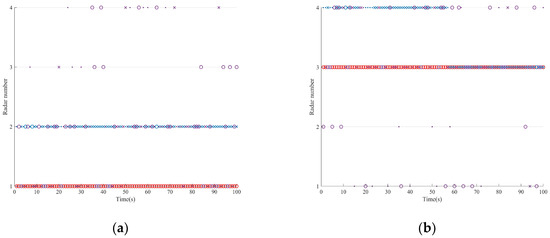
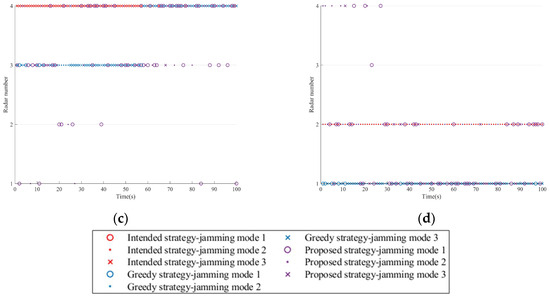
Figure 10.
Jamming resource scheduling schemes in Scenario two. (a) Platform 1. (b) Platform 2. (c) Platform 3. (d) Platform 4.
Figure 11 reveals temporal evolution results for each optimization index. In this scenario, the fusion detection probability of the NRS shows a clear trend of first increasing and then decreasing, while the tracking mean square error shows a reverse trend, which can be explained by the changes in the SJR (see Section 3 for details). It can be also observed that the proposed strategy deliberately accepts temporary NRS suppression trade-offs at some moments, narrowing the gap in jamming performance with the greedy strategy; this is to prevent electromagnetic radiation exposure risk accumulation.
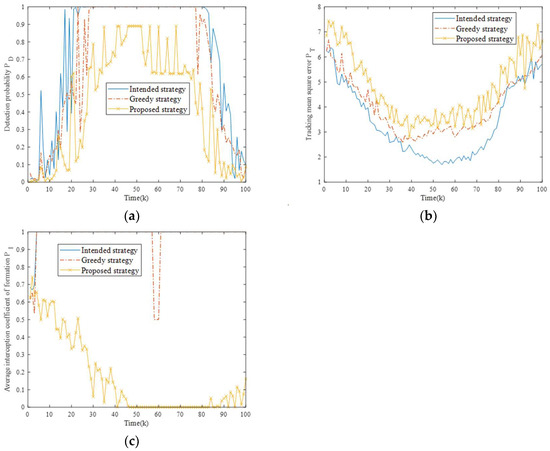
Figure 11.
Comparison of optimization indexes for different strategies in Scenario two. (a) Comparison of fusion detection probability for three strategies. (b) Comparison of tracking mean square error for three strategies. (c) Comparison of average platform interception coefficients for three strategies.
Five evaluation metrics are counted again, as shown in Table 6. In this scenario, compared to the other two strategies, the ADP of the proposed strategy decreased by 0.315 and 0.243, the ATE improved by 1.344 and 0.7428, the AEEC decreased by 0.8253 and 0.7721, and the AOI decreased by 20% and 4.25%, respectively, showing better jamming performance in all metrics.

Table 6.
Statistical results of evaluation metrics in Scenario two.
6.3.3. Scenario Three
In actual task deployment, the number of available sensor platforms is likely to be less than the number of radar nodes, which brings additional complexity to the resource scheduling problem. This scenario is to verify the jamming performance of different resource scheduling strategies under this condition.
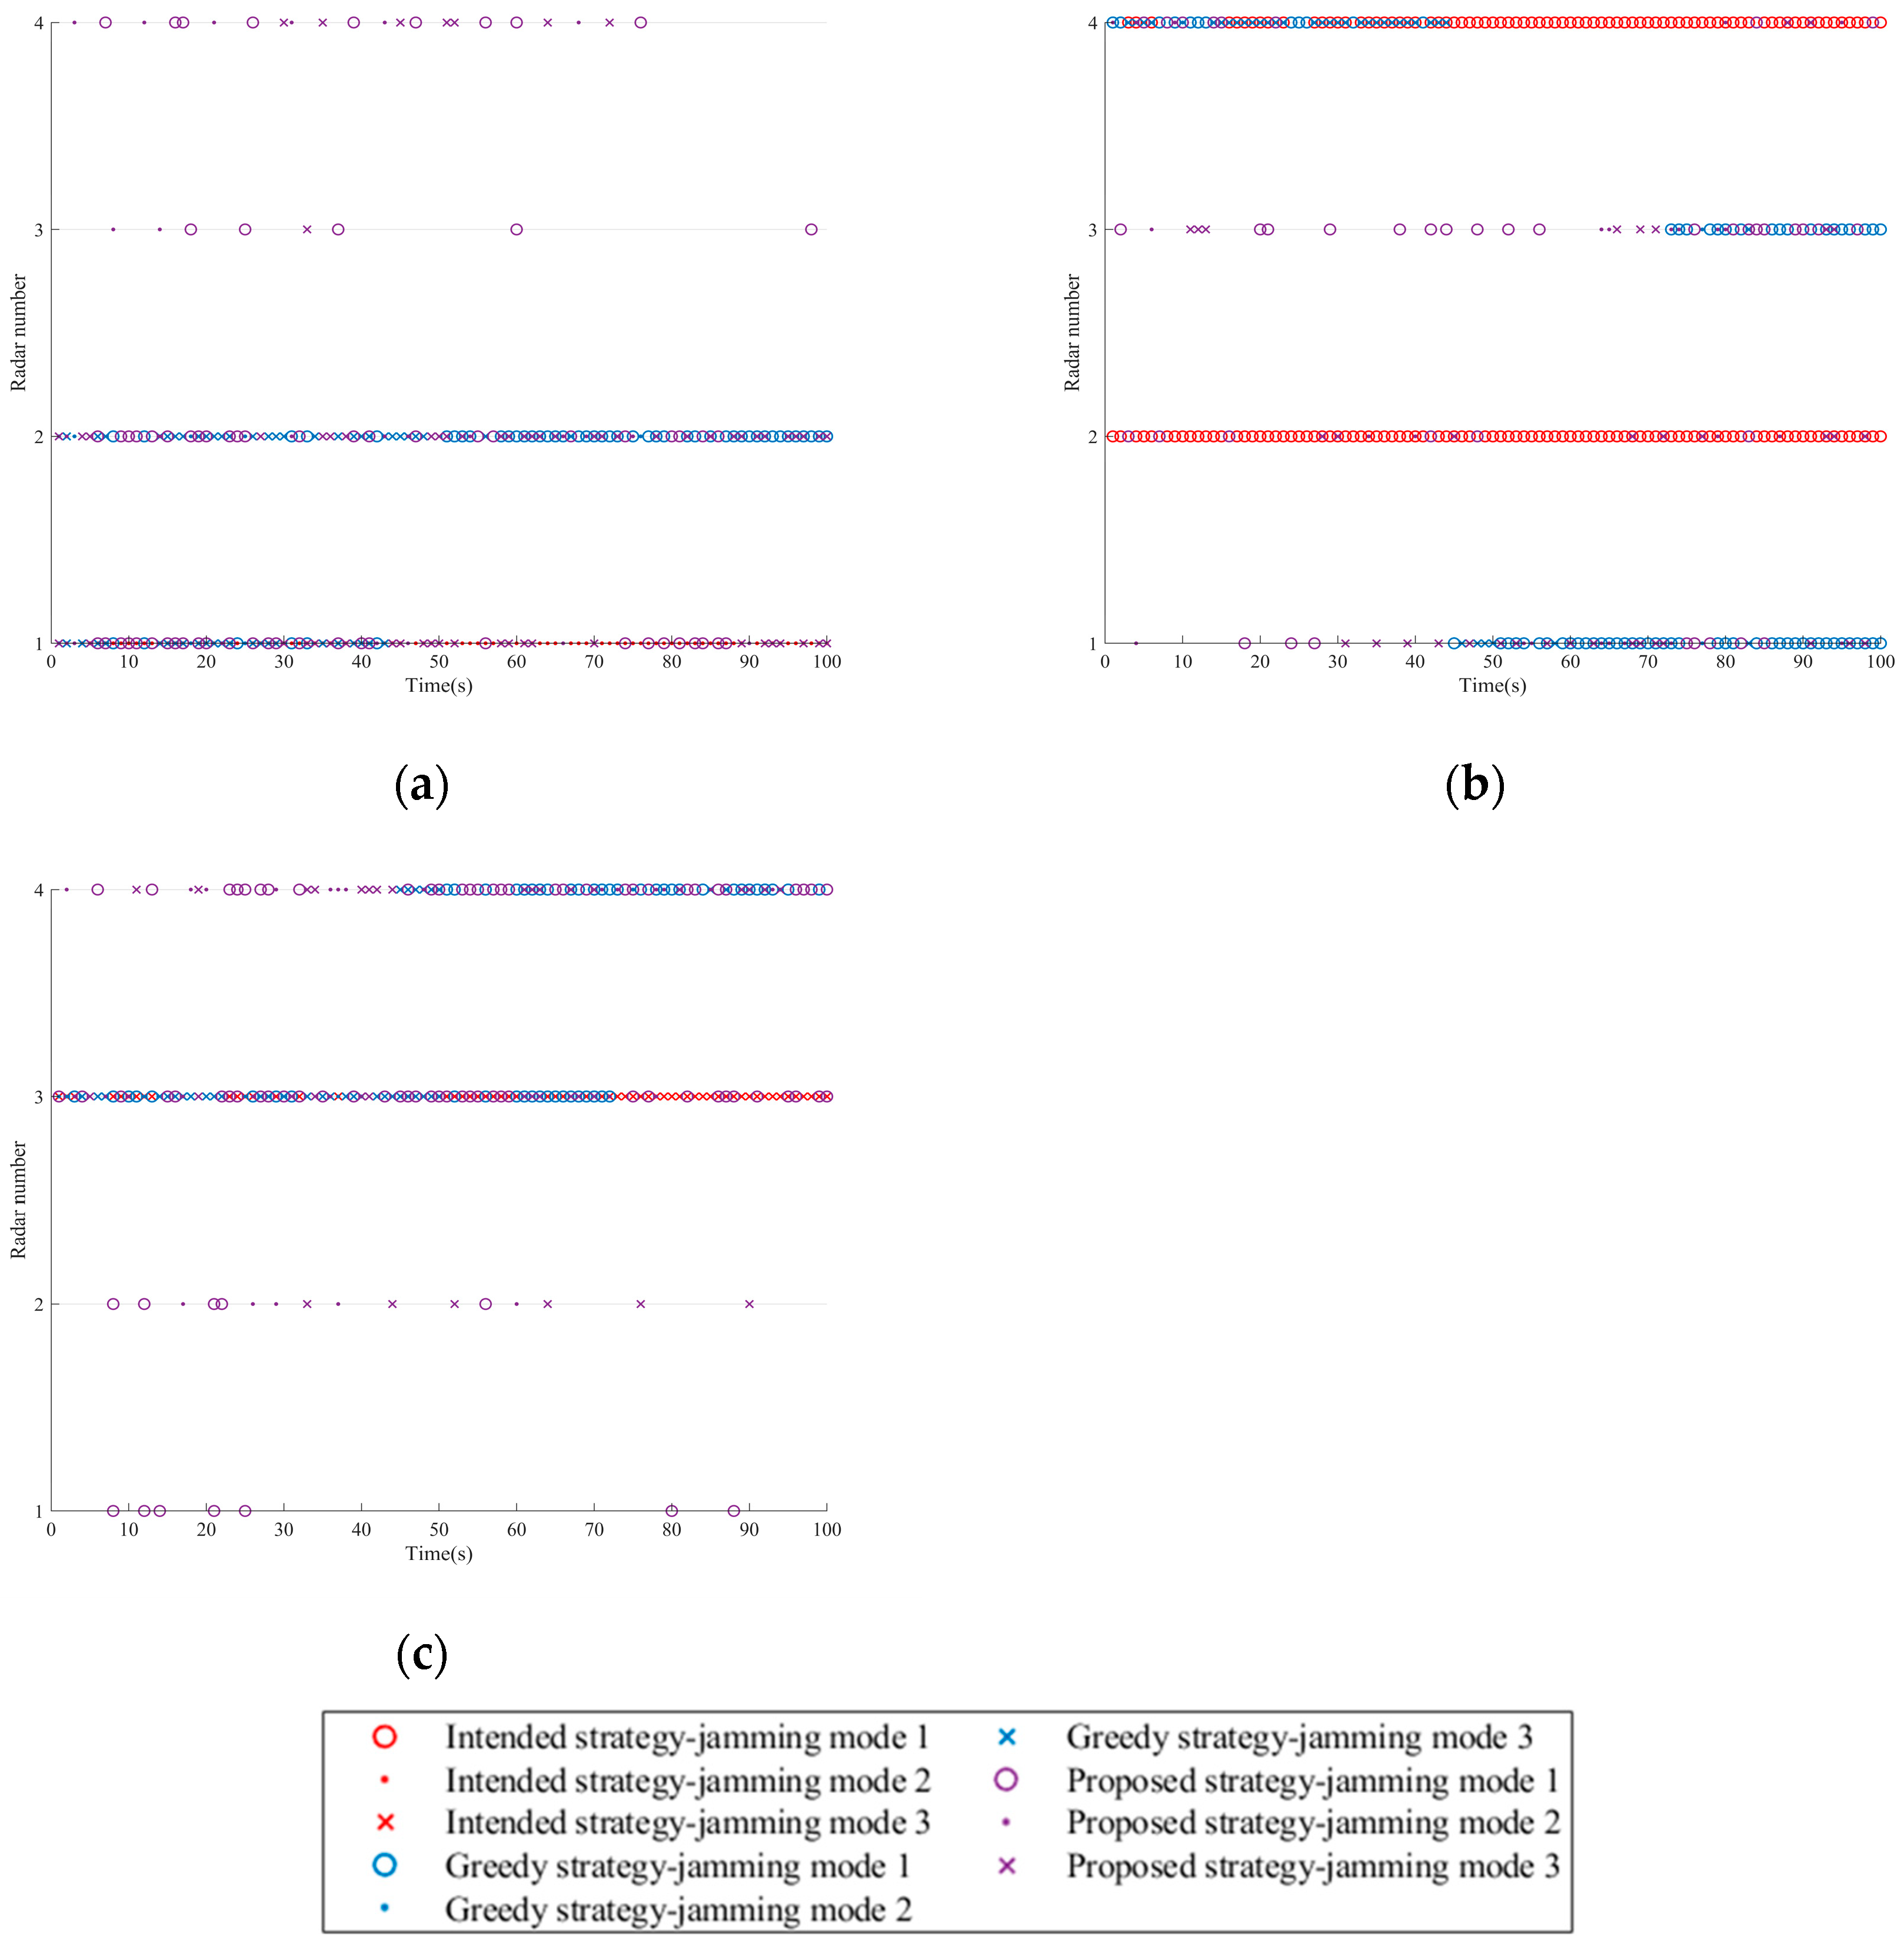
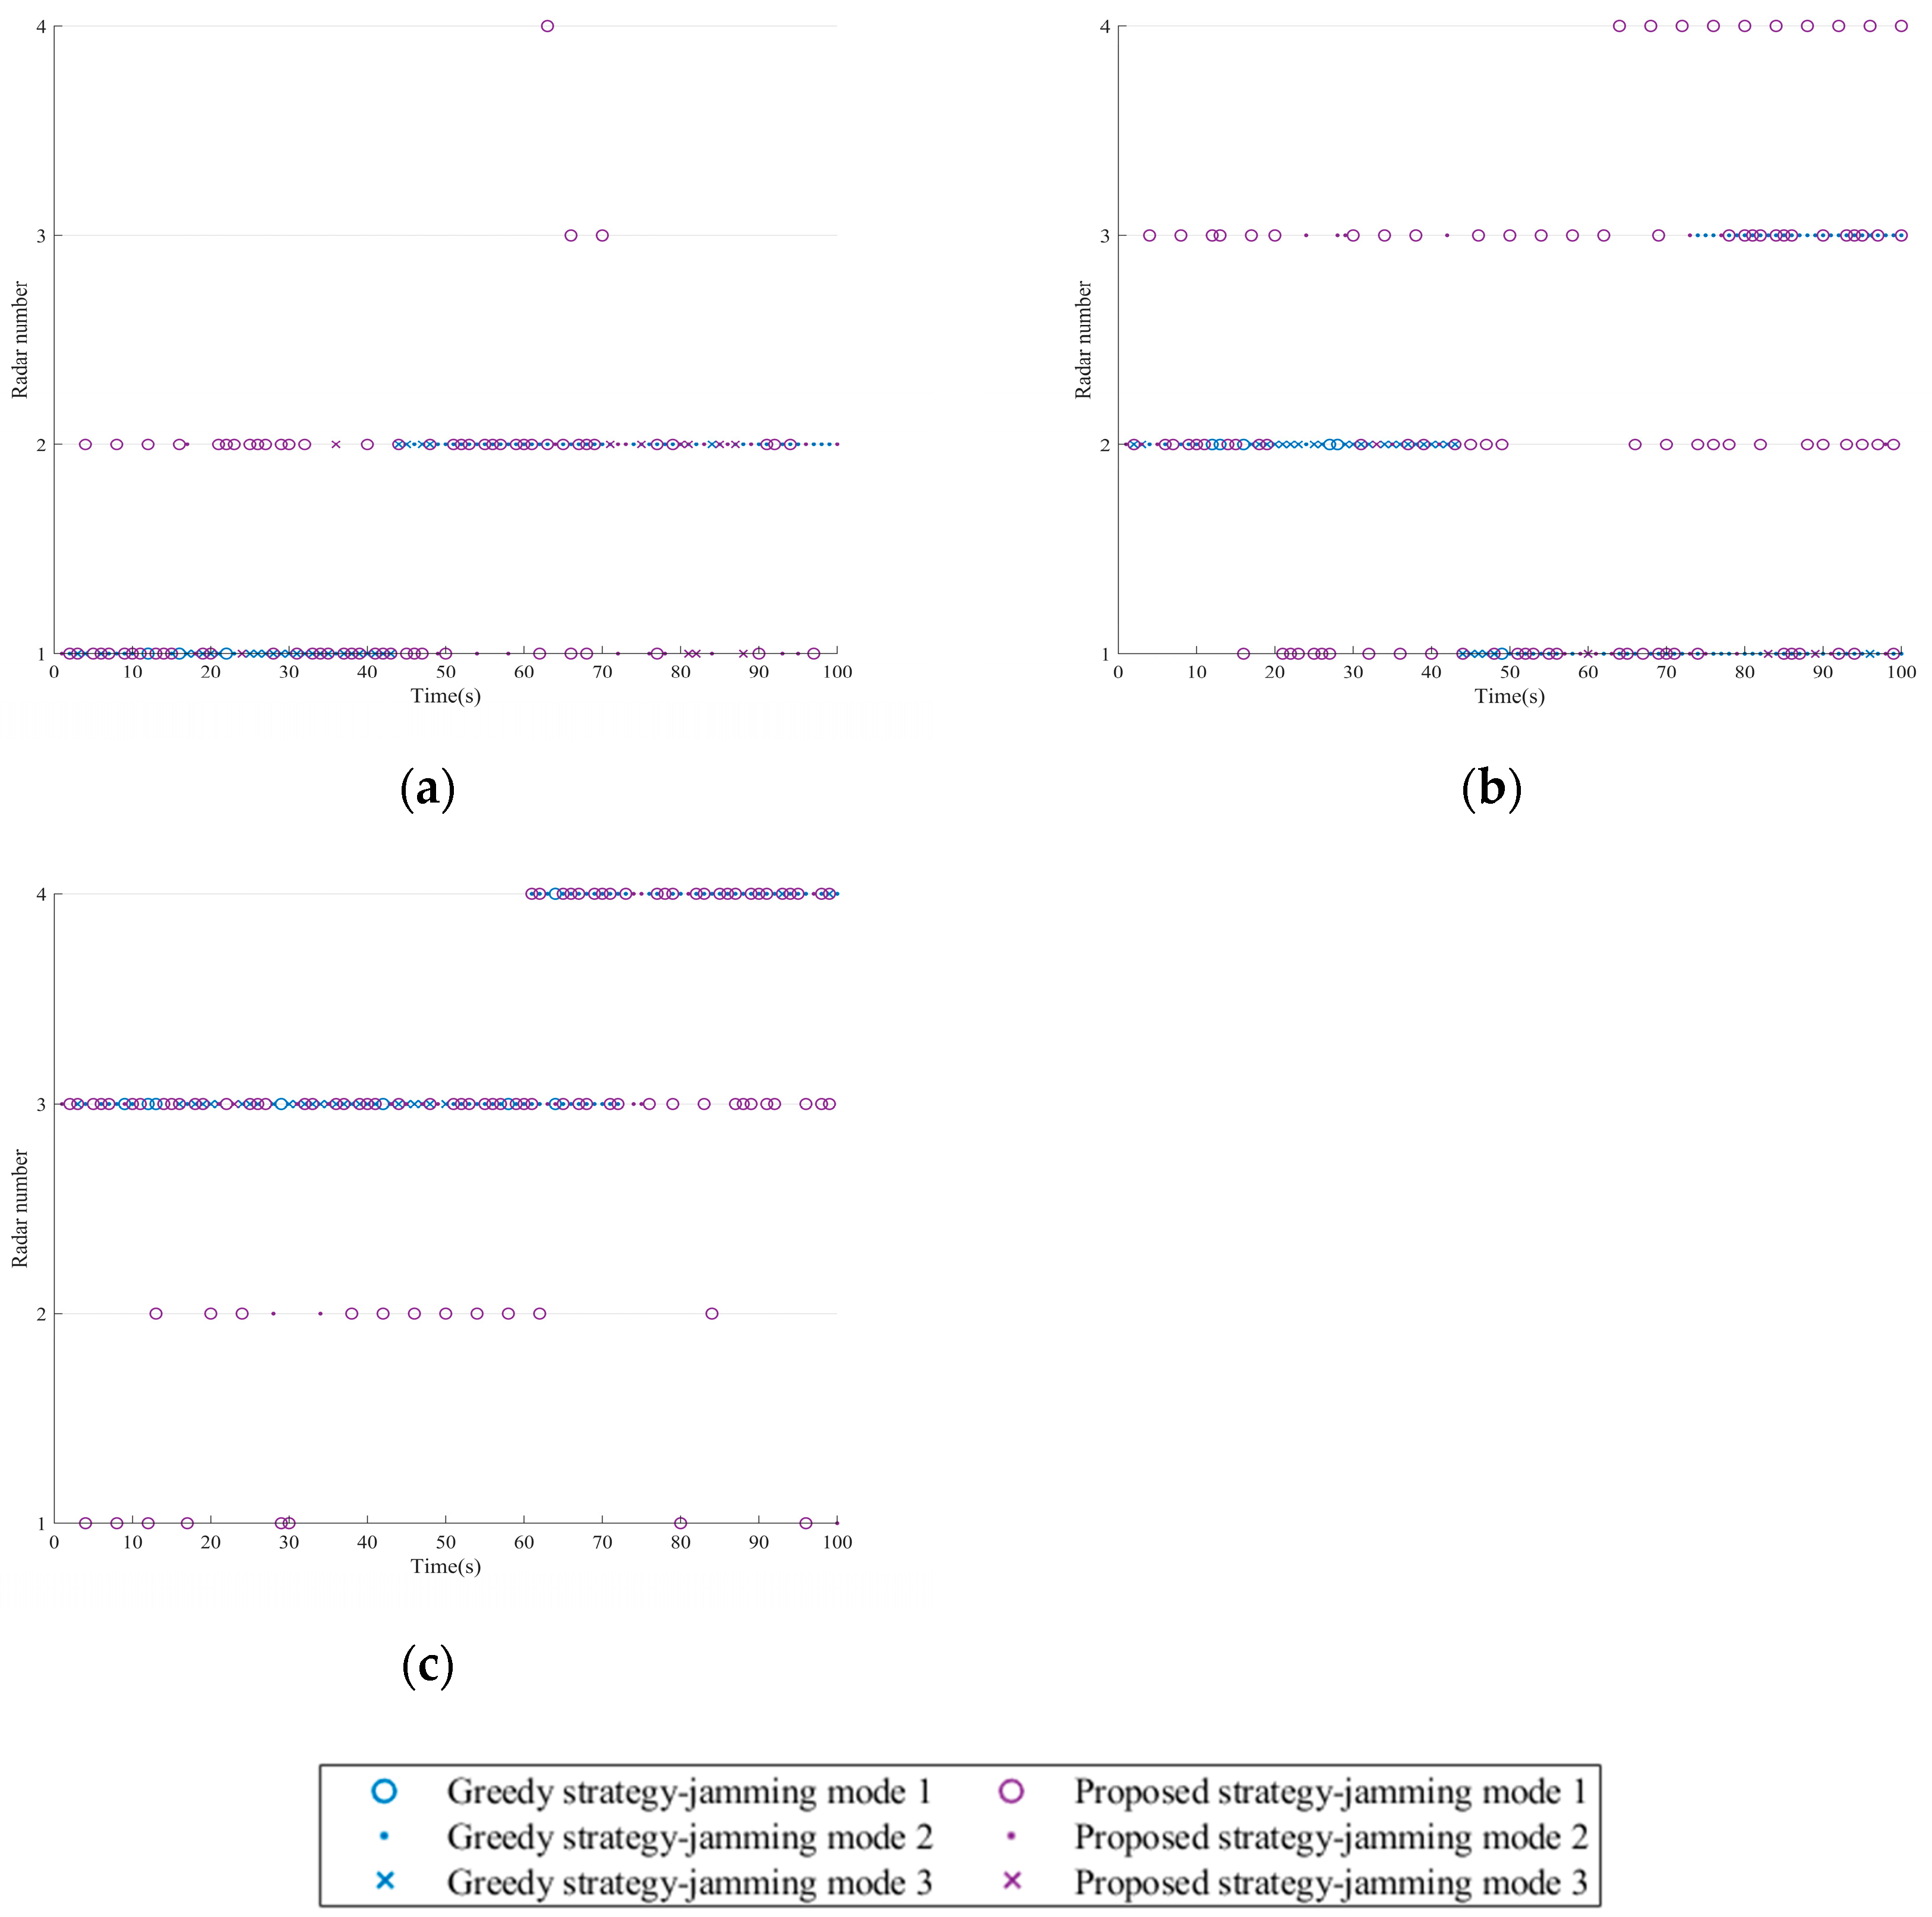
The single resource scheduling schemes for three strategies are presented in Figure 12. It can be observed that to achieve the expected jamming effect on the NRS, the three strategies require at least one platform to simultaneously jam multiple radar nodes at any time and satisfy the maximum jamming beam constraint of the platform.
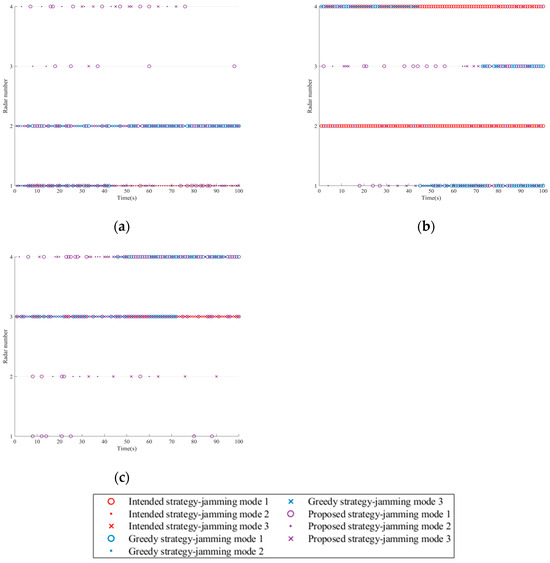
Figure 12.
Jamming resource scheduling schemes in Scenario three. (a) Platform 1. (b) Platform 2. (c) Platform 3.
Figure 13 shows the changes in the optimization indexes for three strategies in this scenario. It can be seen that all strategies experience performance degradation compared to Scenario 2, but the proposed strategy can still sustain the superior jamming performance on the NRS within electromagnetic exposure constraints.
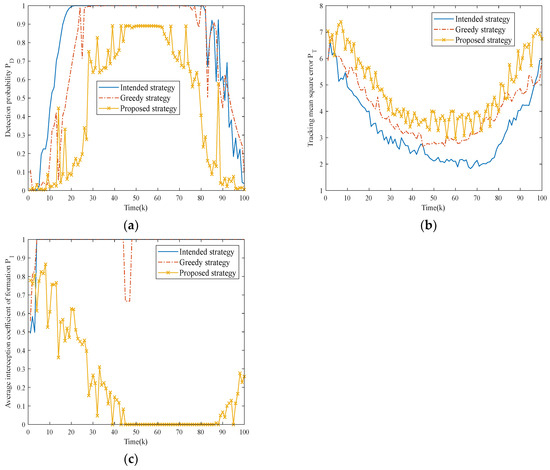
Figure 13.
Comparison of optimization indexes for different strategies in Scenario three. (a) Comparison of fusion detection probability for three strategies.; (b) Comparison of tracking mean square error for three strategies. (c) Comparison of average platform interception coefficients for three strategies.
Table 7 presents the evaluation metrics for three strategies in this scenario. Obviously, with the increasing complexity of the scenario, the metrics of the other two strategies gradually deteriorate over time due to insufficient acquisition of radar state information, while the proposed strategy is always able to dynamically respond to the states of the NRS and adjust the jamming resource scheduling scheme in time. The performances of all metrics are better than the other two strategies.

Table 7.
Statistical results of evaluation metrics in Scenario three.
It is worth mentioning that when observing the radar state transition diagrams of the three strategies, due to insufficient understanding of electromagnetic radiation risks, the other two strategies frequently trigger passive tracking states that grant the NRS sufficient target position information and quickly complete the ‘OODA’ cycle. Conversely, the proposed strategy implements effective alternating cooperative jamming and low interception jamming (i.e., allowing platforms with lower electromagnetic exposure risks to jam more radars) under resource scarcity, ensuring the safety of the formation. This is also the reason why the AOI performs better.
6.3.4. Scenario Four
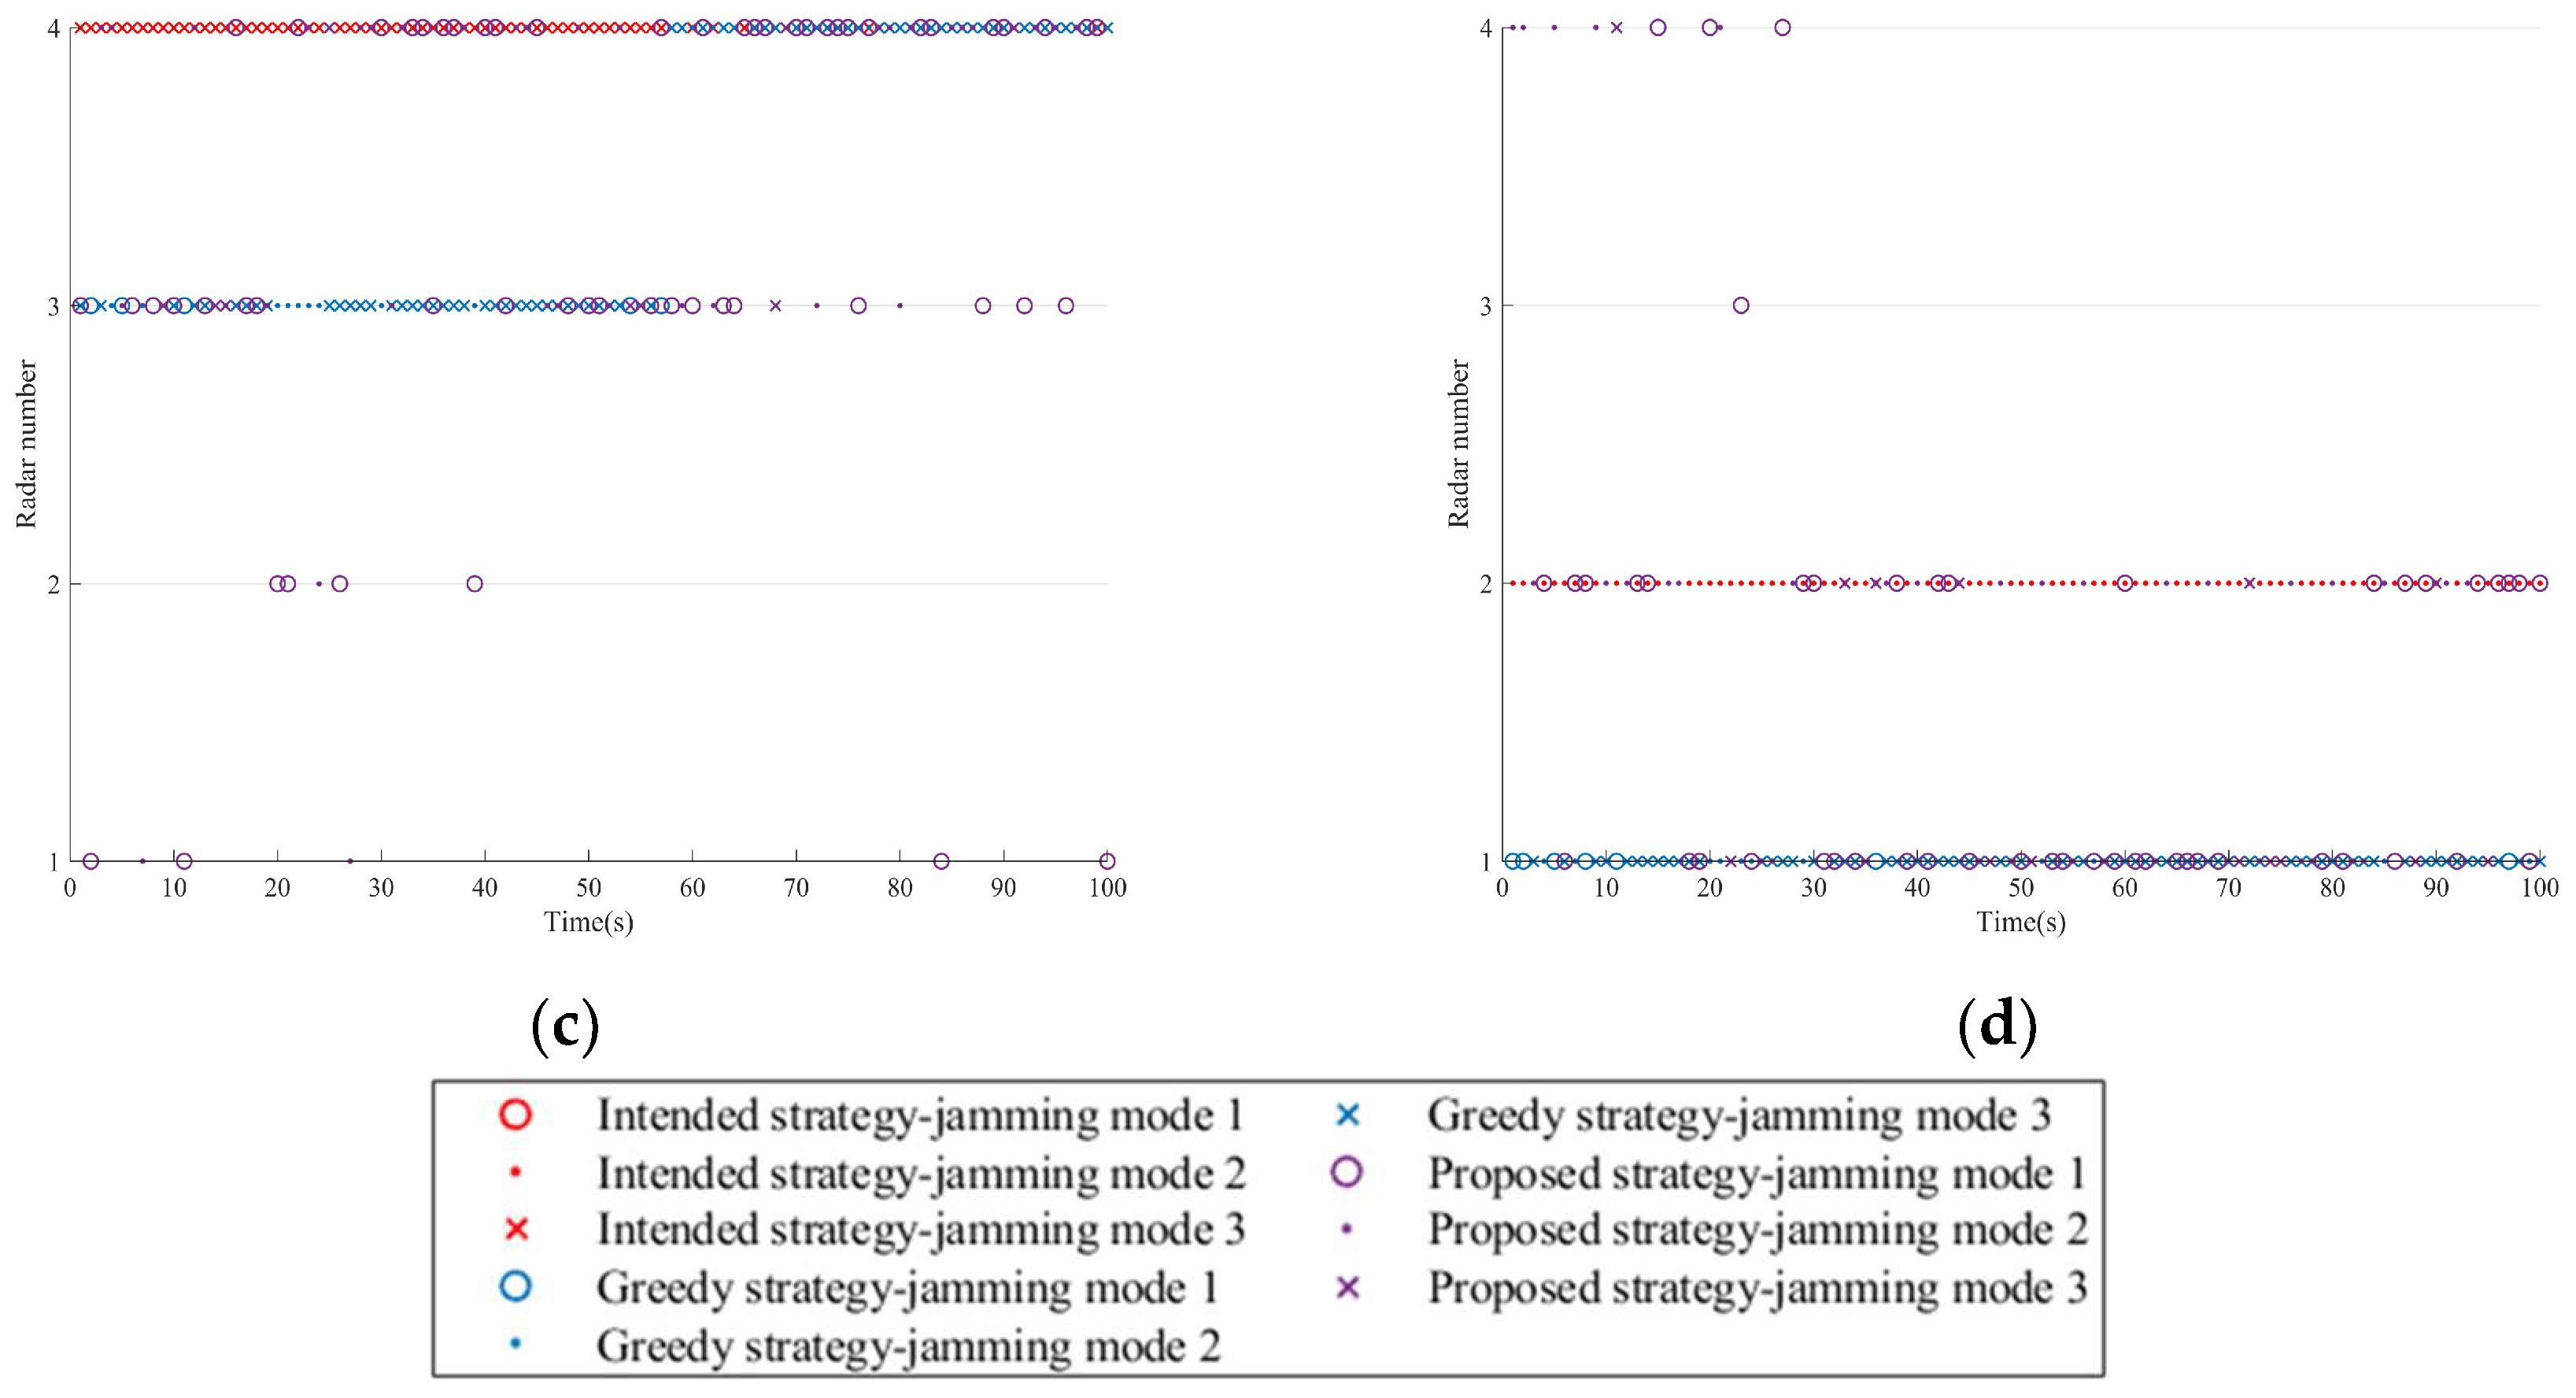
In this scenario, the proposed strategy is compared with the greedy strategy, and Figure 14 shows the resource scheduling schemes of the two strategies in a single run.
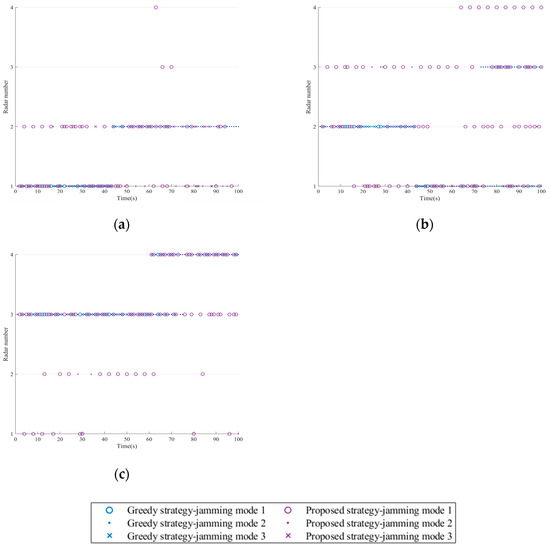
Figure 14.
Jamming resource scheduling schemes for two strategies. (a) Platform 1. (b) Platform 2. (c) Platform 3.
As can be seen from Figure 14, when the fourth radar is turned on, both strategies prioritize allocating the nearest sensor platform for jamming. The difference is that the greedy strategy relies on previous historical experience to select the jamming mode with the greatest current benefits for jamming, while the proposed strategy dynamically selects the jamming mode based on real-time observation of radar signals.
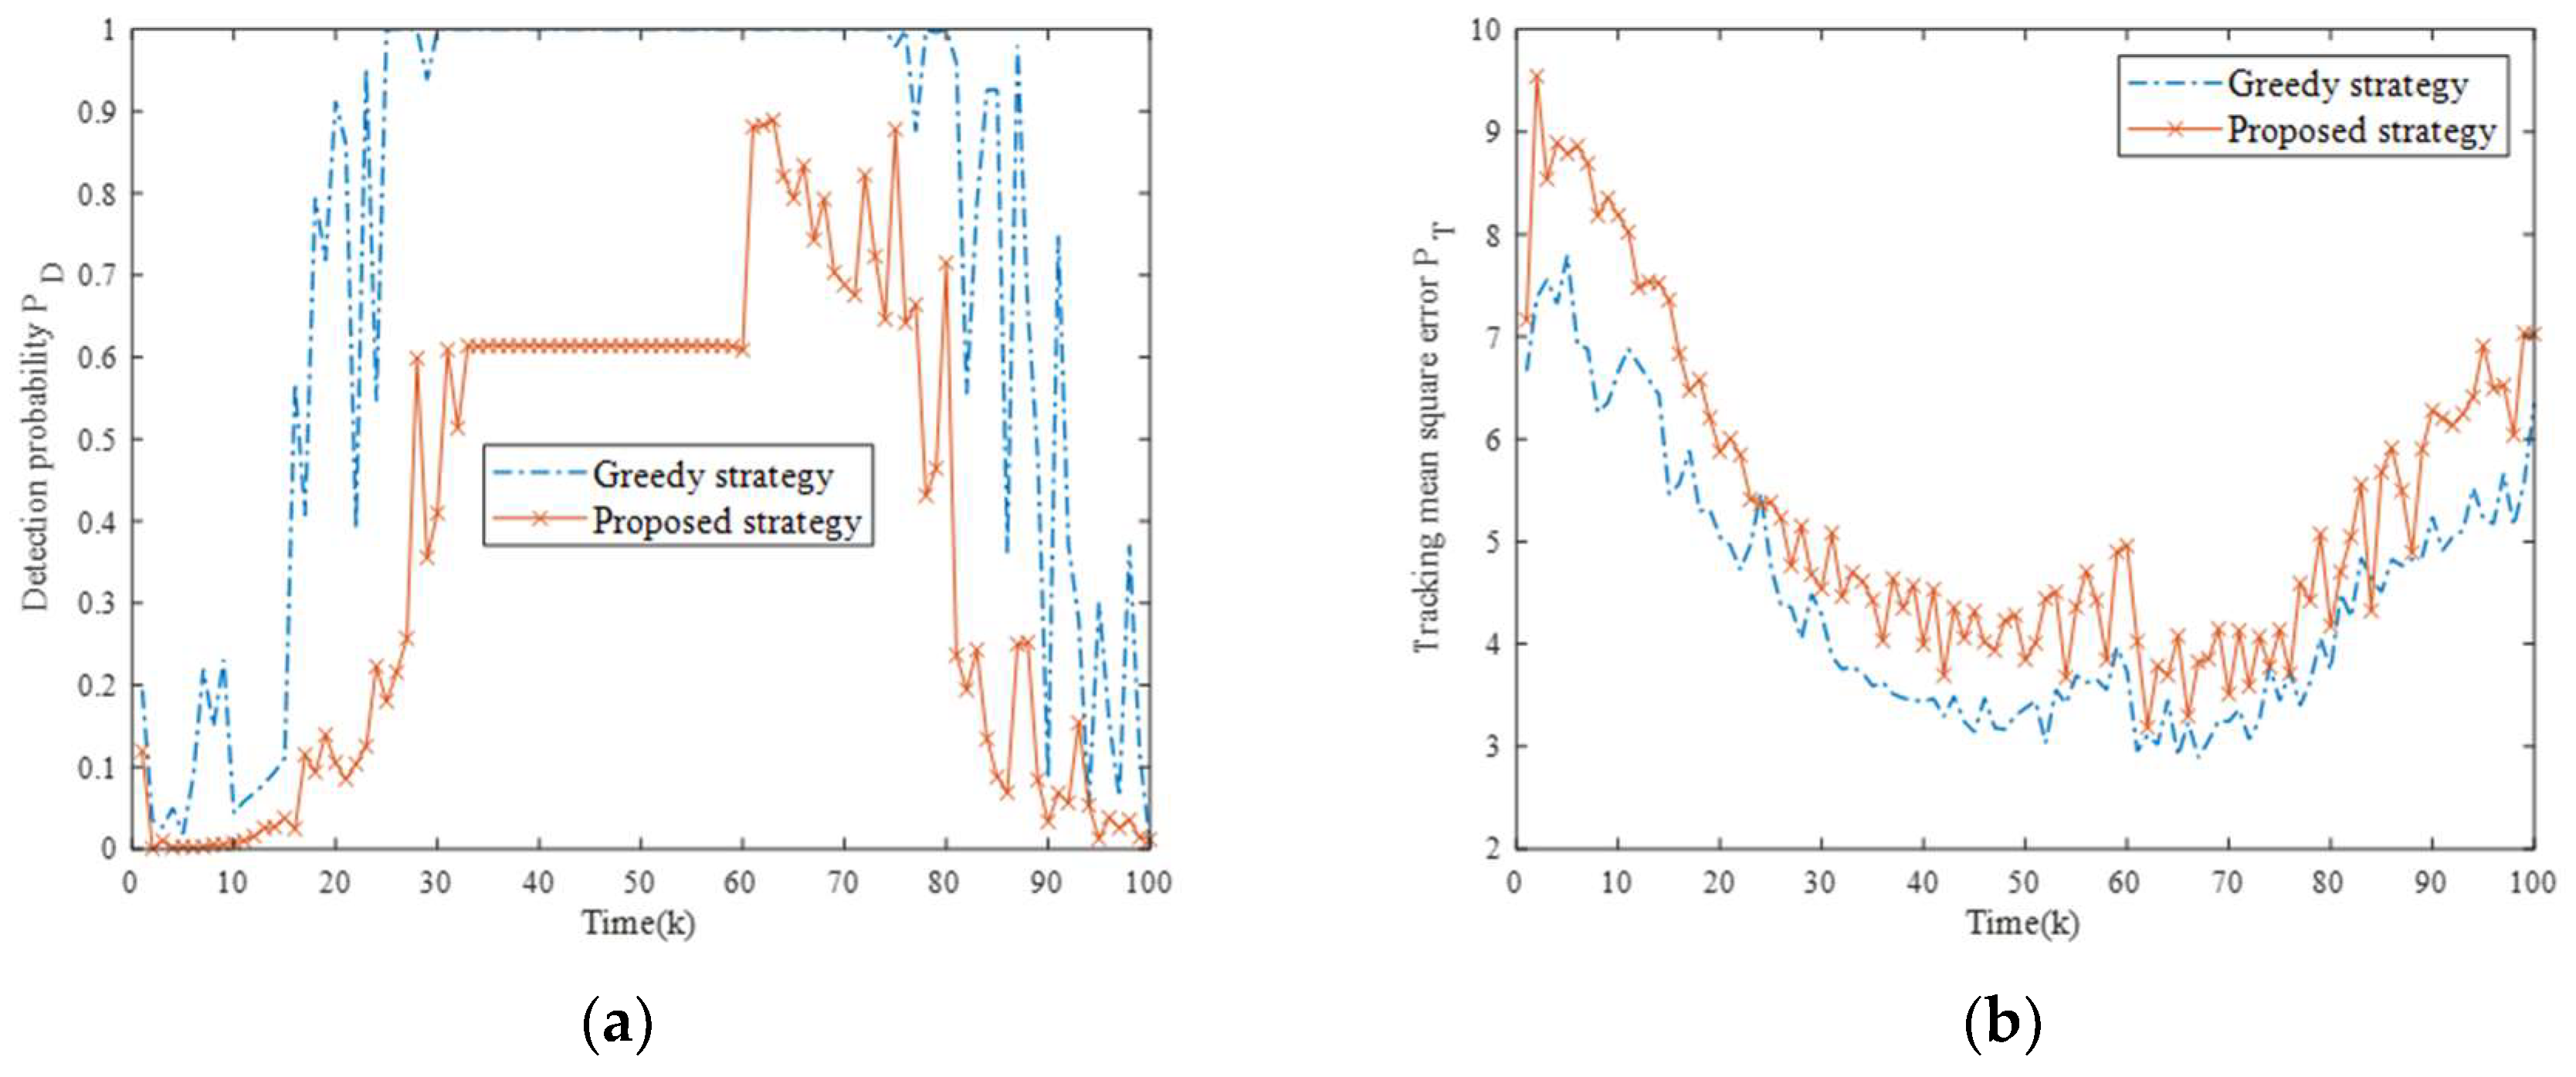
In the following, the two strategies are independently run for 10 Monte Carlo experiments. Figure 15 shows the changes in fusion detection probability and tracking mean square error of the NRS. It can be seen that both strategies exhibit comparable NRS suppression capabilities during initial phases (pre-radar four activation) with adequate jamming resources. However, after radar four turns on (time 60), the optimization indexes for the two strategies both show a free-fall deterioration, and the proposed strategy gradually widens the jamming performance gap from the greedy strategy by promptly adjusting the jamming resource scheduling scheme. The reason for the analysis is that the greedy strategy learns the historical reward experience obtained from previous decisions, which is highly correlated over time. This limitation leads to a narrowed jamming mode exploration space. Hence, it is not enough for the greedy strategy to achieve the optimal scheduling under incomplete prior knowledge.
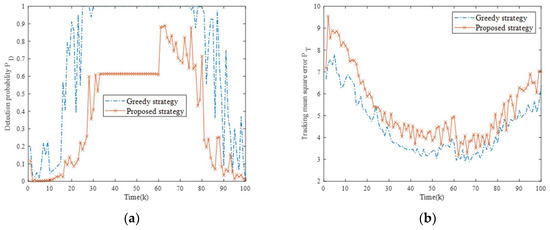
Figure 15.
Comparison of optimization indexes for two strategies in Scenario four. (a) Comparison of fusion detection probability for two strategies; (b) Comparison of tracking mean square error for two strategies.
Four evaluation metrics of the Monte Carlo experiment were statistically analyzed, as shown in Table 8. In the proposed strategy, the ADP decreased by 0.3423, the ATE increased by 0.8733, the AEEC decreased by 0.8421, and the AOI decreased by 16.25%, demonstrating the unique ability of the proposed strategy in the case of insufficient information.

Table 8.
Statistical results of evaluation metrics under two strategies.
6.4. Algorithm Performance Analysis
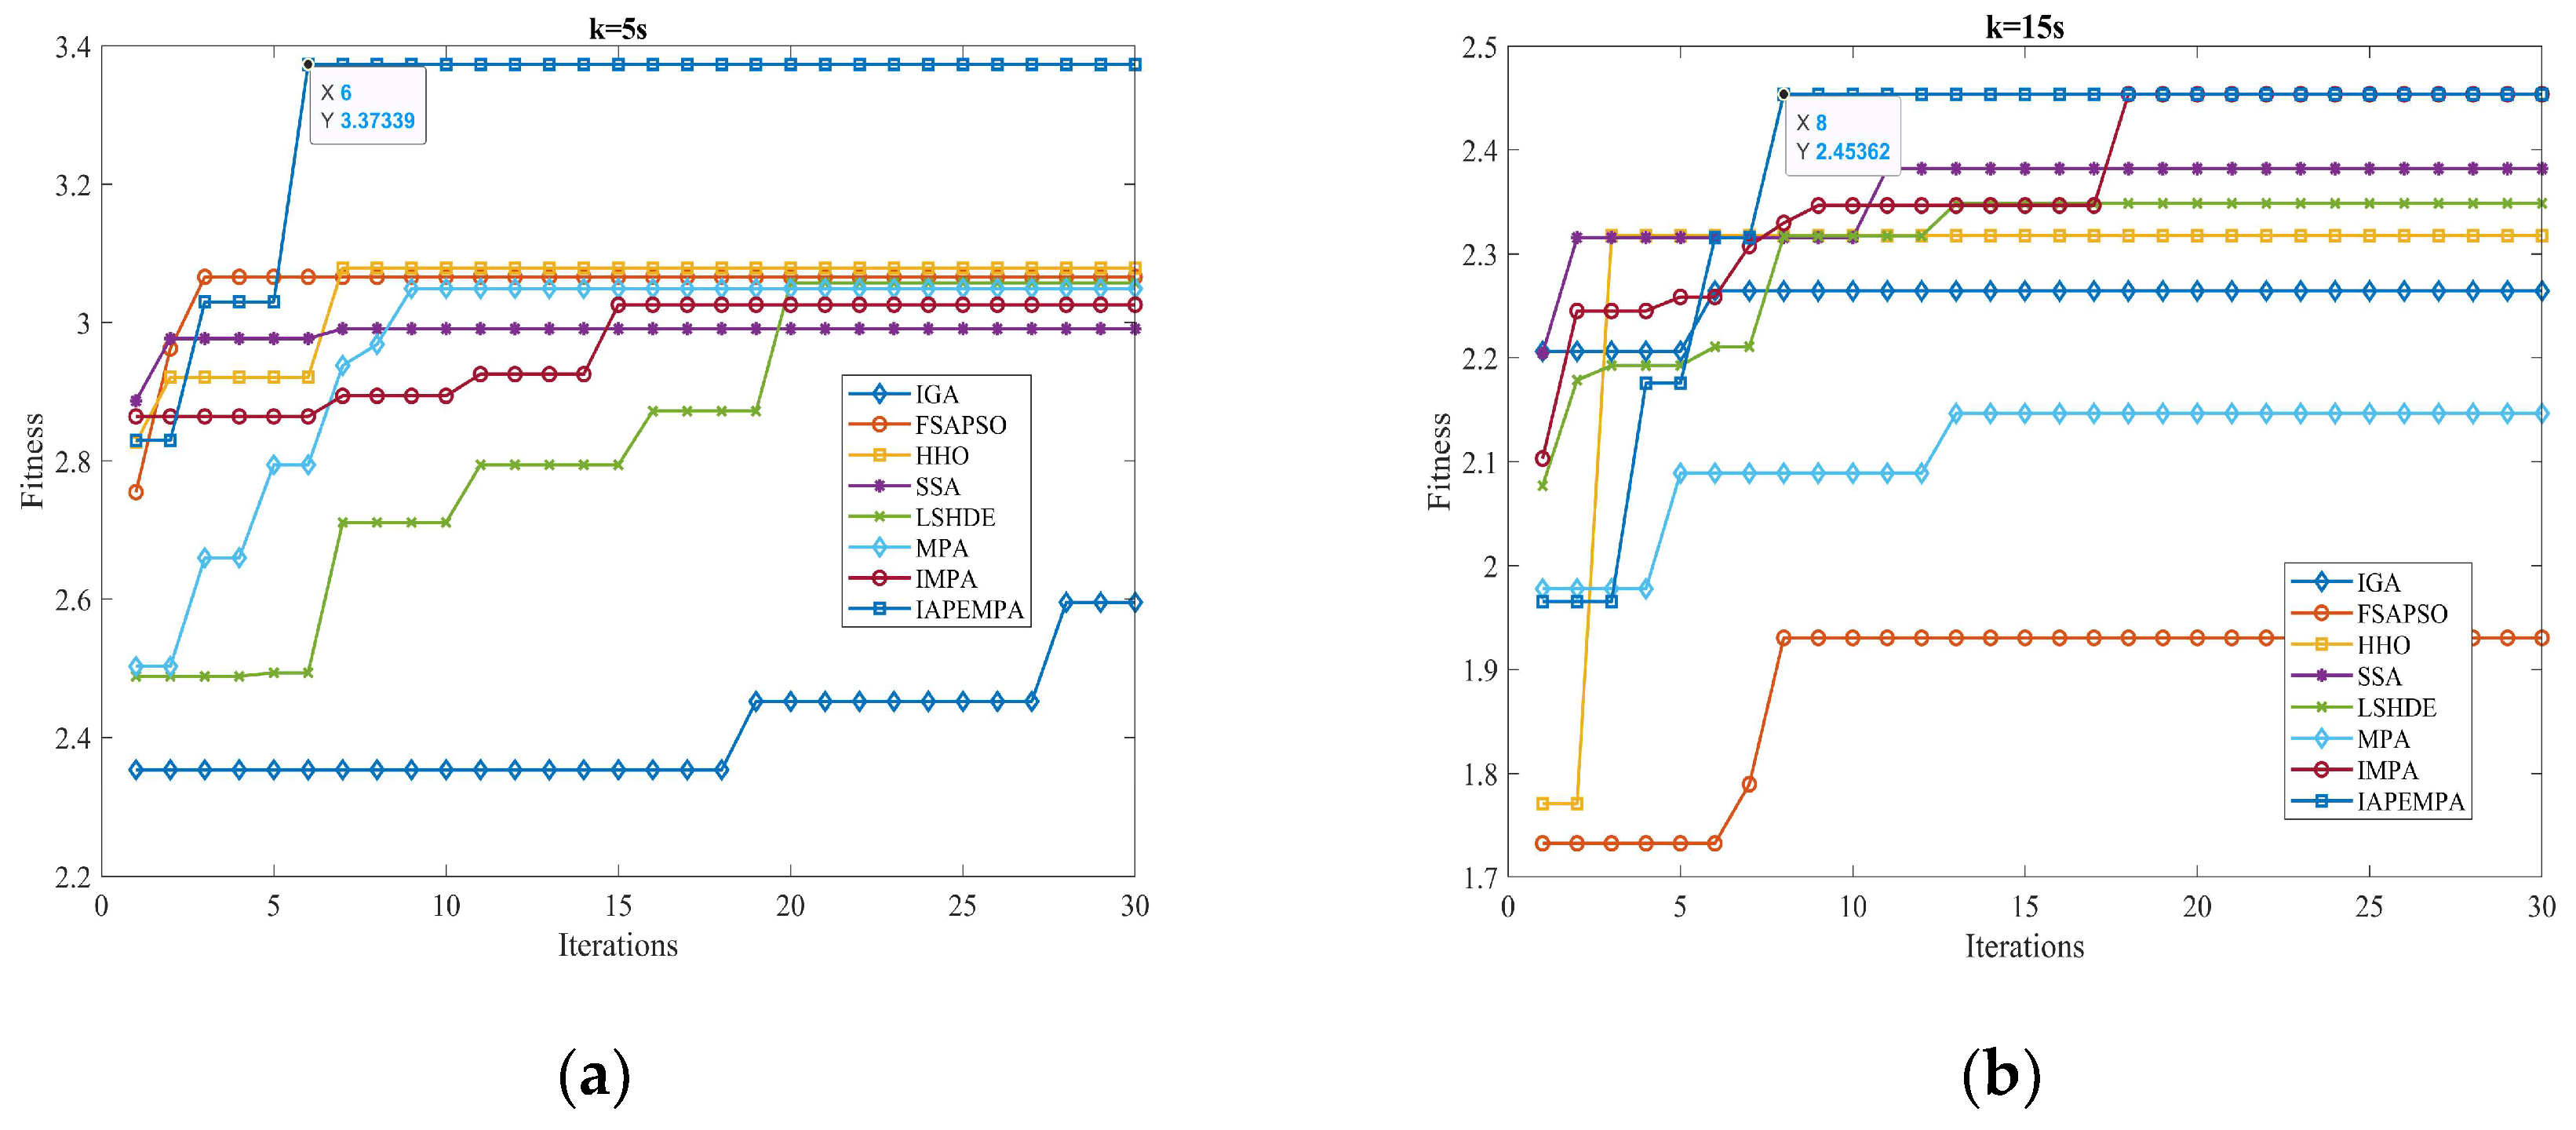
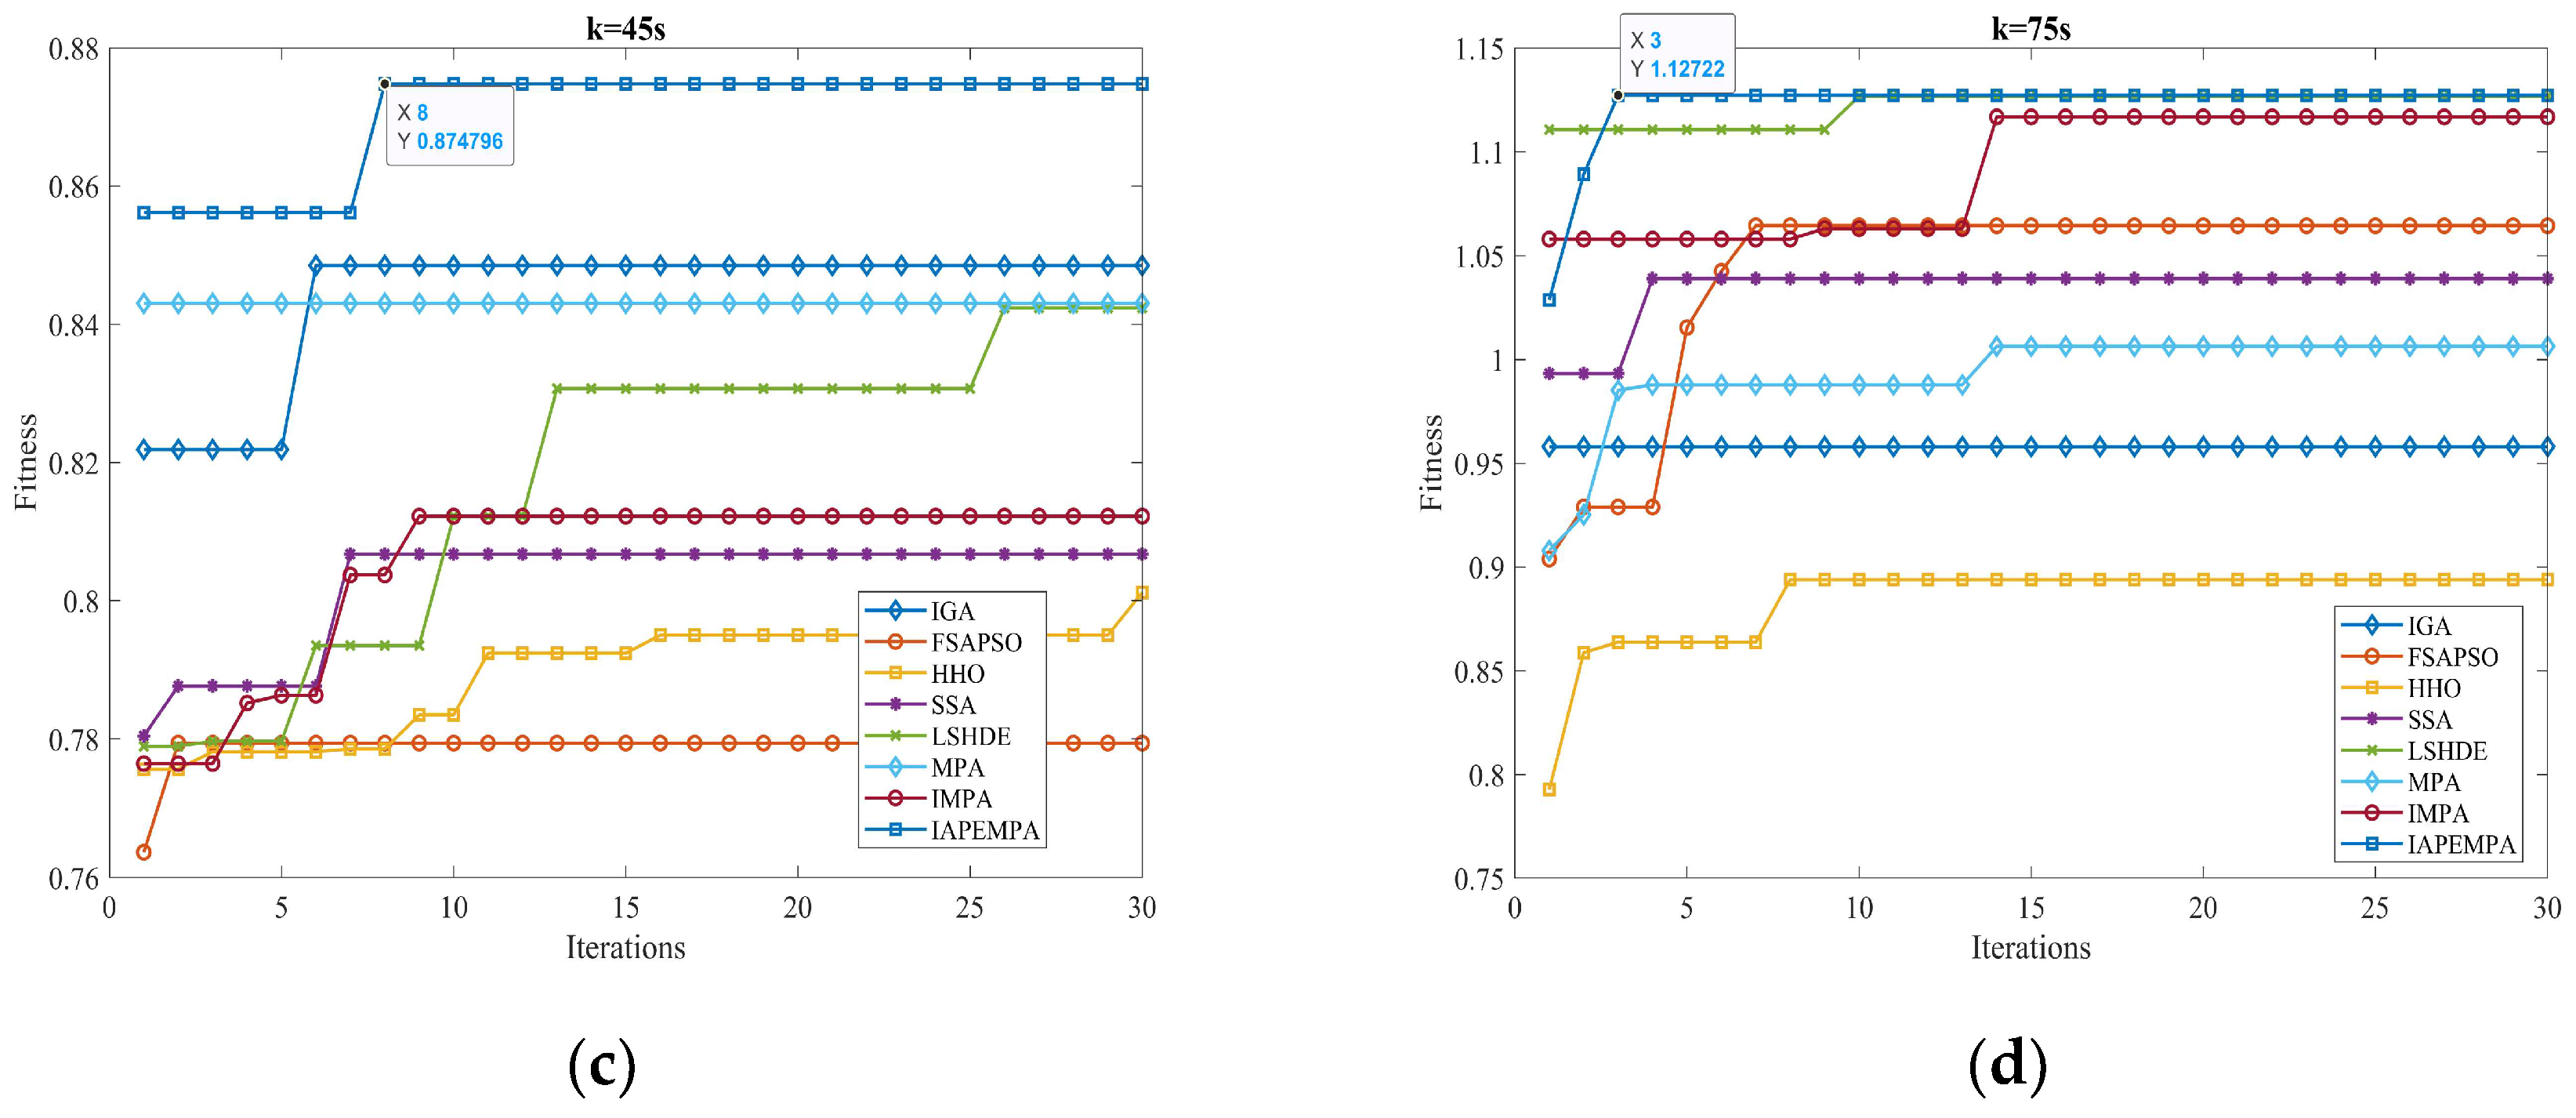
In the previous section, the effectiveness of the proposed strategy is validated by comparing it with different strategies in four scenarios. Next, the current mainstream swarm intelligence optimization algorithms are embedded into the designed resource scheduling framework to verify the accuracy and real-time performance of the proposed IAPEMPA. Specifically, the comparison algorithms considered include IGA, FSAPSO, HHO, SSA, MPA, IMPA, and LSHDE. Compared to other scenarios, Scenario 3 models a more realistic and complex environment. Hence, we focus on Scenario 3 for detailed algorithmic analysis, and other parameters are set in accordance with the previous experiments. To fairly evaluate the performance of each algorithm, Monte Carlo experiments are independently run 50 times in this scenario, and each algorithm samples the convergence curve graphs at four time points of k = 5, k = 15, k = 45, and k = 75, as shown in Figure 16.
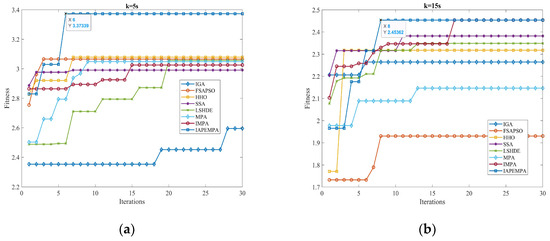
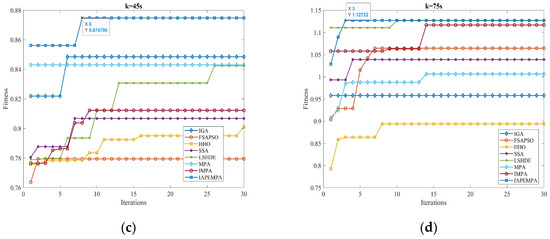
Figure 16.
Convergence curves at different times. (a) k = 5. (b) k = 15. (c) k = 45. (d) k = 75.
As can be seen from Figure 16, the proposed algorithm shows good performance in the convergence speed at all four time points and can converge after reaching eight iterations. The performance of finding the optimal solution is also significantly better than other algorithms.
The goal of pursuing algorithm accuracy is to better complete the task. To verify the difference between the proposed algorithm and other algorithms in the accuracy of task decision, Table 9 provides the statistical results of the AOIs of eight algorithms in the Monte Carlo experiment. The AOI of the proposed algorithm is the lowest at 3.22%, and the second is LSHDE at 4.70%, an increase of 1.48% compared with the proposed strategy. It is worth noting that the main reason for this difference is that the low accuracy of a single-step solution may not have an obvious impact on radar state transition, but with the gradual accumulation of solution errors, the radar will complete the ‘OODA’ cycle after several steps, resulting in task failure.

Table 9.
AOI comparison of eight algorithms.
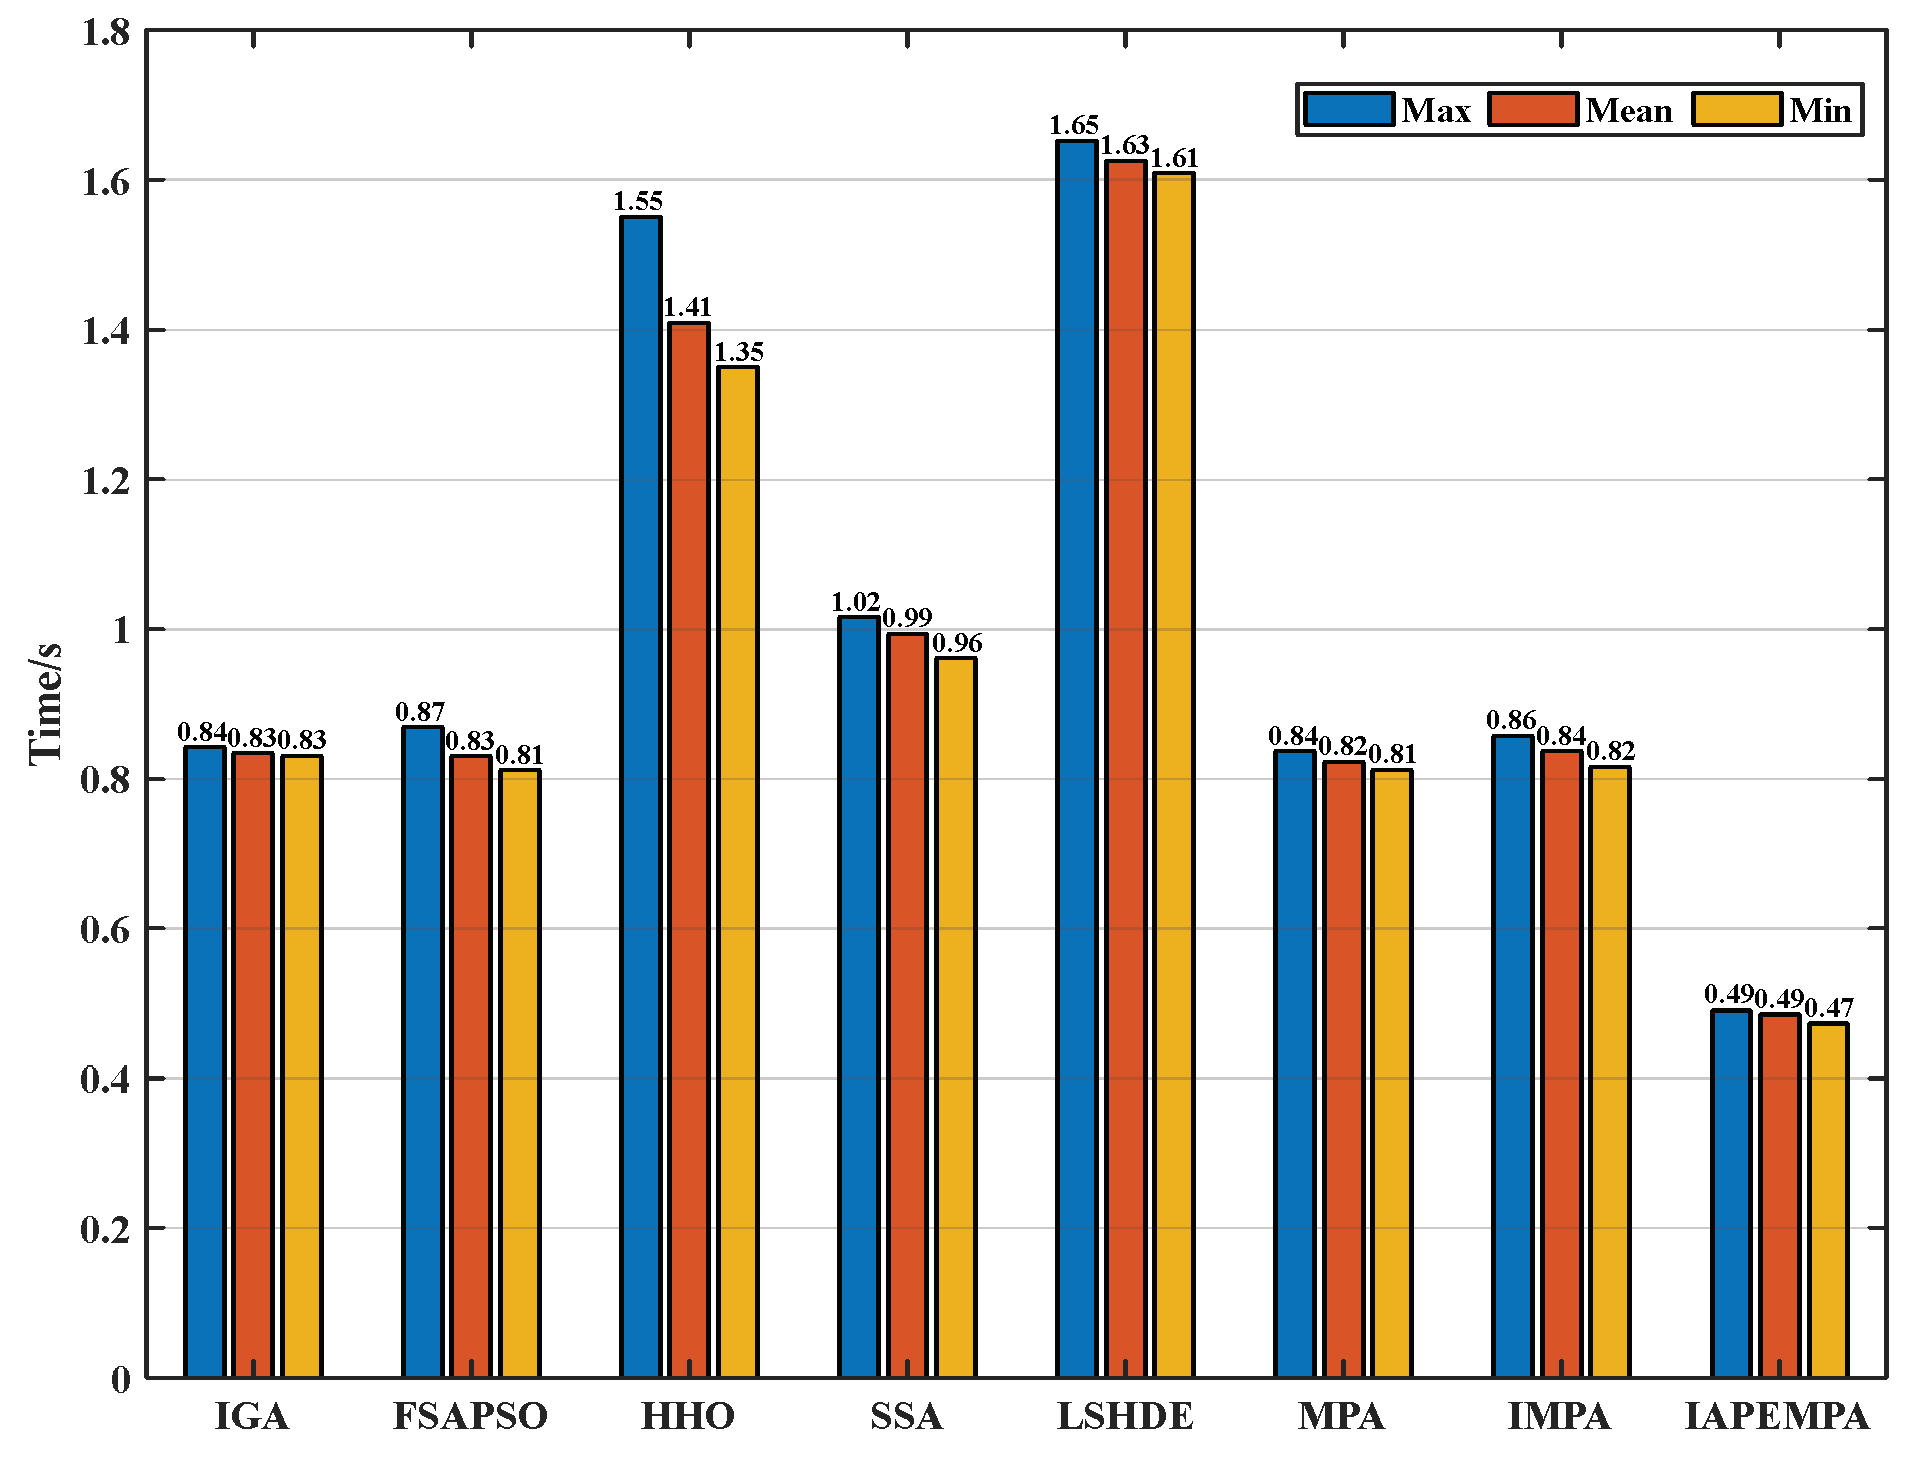
Then, the real-time performance is verified by the simulation time consumption of different algorithms. The average decision time (ADT) of jamming resource scheduling in the Monte Carlo experiment is used as an evaluation metric, defined as
where Ti is the execution time of a single task. The specific decision time is shown in Figure 17. It can be seen that the average decision time of the IAPEMPA is the shortest, taking 0.485s, while the average decision time of LSHDE is the longest, taking 1.626 s. The single-step decision time of the proposed algorithm is controlled within 0.5 s, which can meet the real-time requirements of jamming resource scheduling in highly dynamic game scenarios.
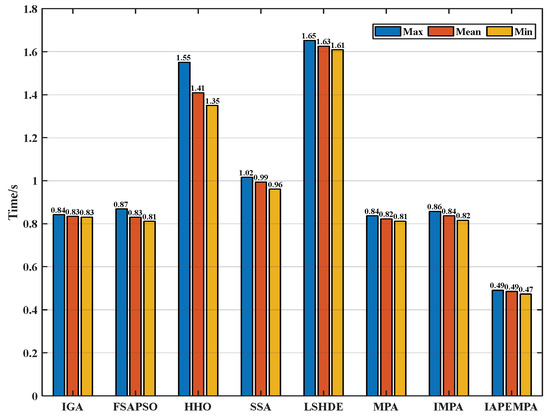
Figure 17.
Single-step decision time comparison.
7. Conclusions
This paper investigates the joint jamming resource scheduling problem in the task of formation cooperation against the NRS. The formation survivability is quantified by fusing the information reception quality of the adversarial NRS and the electromagnetic exposure risk of the formation, and an adaptive scheduling strategy solution framework is designed to deal with the NRS state prediction and dynamic adjustment of the objective function. Then, several improvement methods are designed for the MPA algorithm to better embed it into the solution framework, which helps obtain the optimal resource scheduling strategy. Finally, simulation results demonstrate that the proposed strategy has wider applicability and robustness, it exhibits satisfactory performance in different scenarios, and the electromagnetic exposure time of the formation is significantly reduced, while the formation maintains a high level of survival capability.
Future work will further investigate the joint multi-jamming resource scheduling problem in the case of insufficient prior information and endow the sensor platform with self-learning intelligence to adapt to the dynamic system countermeasure scenario.
Author Contributions
Conceptualization, S.C.; methodology, D.L.; software, D.L.; validation, D.L. and Y.C.; formal analysis, X.Z.; investigation, X.Z. and D.L.; resources, H.L.; data curation, T.Y.; writing—original draft preparation, D.L.; writing—review and editing, S.C.; visualization, D.L.; supervision, S.C. All authors have read and agreed to the published version of the manuscript.
Funding
This research received no external funding.
Data Availability Statement
The data can be obtained by contacting the corresponding author.
Acknowledgments
The authors would like to thank all the reviewers and editors for their comments on this paper.
Conflicts of Interest
The authors declare no conflicts of interest.
References
- Zhang, H.; Liu, W.; Shi, J.; Fei, T.; Zong, B. Joint detection threshold optimization and illumination time allocation strategy for cognitive tracking in a networked radar system. IEEE Trans. Signal Process. 2022, 70, 5833–5847. [Google Scholar]
- Yang, C.; Feng, L.; Zhang, H.; He, S.; Shi, Z. A novel data fusion algorithm to combat false data injection attacks in networked radar systems. IEEE Trans. Signal Inf. Process. Over Netw. 2018, 4, 125–136. [Google Scholar] [CrossRef]
- Yan, J.; Jiao, H.; Pu, W.; Shi, C.; Dai, J.; Liu, H. Radar sensor network resource allocation for fused target tracking: A brief review. Inf. Fusion 2022, 86, 104–115. [Google Scholar] [CrossRef]
- Shi, C.; Ding, L.; Wang, F.; Salous, S.; Zhou, J. Joint target assignment and resource optimization framework for multitarget tracking in phased array radar network. IEEE Syst. J. 2020, 15, 4379–4390. [Google Scholar]
- Shi, C.; Wang, Y.; Salous, S.; Zhou, J.; Yan, J. Joint transmit resource management and waveform selection strategy for target tracking in distributed phased array radar network. IEEE Trans. Aerosp. Electron. Syst. 2021, 58, 2762–2778. [Google Scholar] [CrossRef]
- Zhang, H.; Liu, W.; Zhang, Q.; Zhang, L.; Liu, B.; Xu, H.-X. Joint Power, Bandwidth, and Subchannel Allocation in a UAV-Assisted DFRC Network. IEEE Internet Things J. 2025. [Google Scholar] [CrossRef]
- Yi, W.; Yuan, Y.; Hoseinnezhad, R.; Kong, L. Resource scheduling for distributed multi-target tracking in netted colocated MIMO radar systems. IEEE Trans. Signal Process. 2020, 68, 1602–1617. [Google Scholar]
- Zhang, H.; Liu, W.; Zhang, Q.; Liu, B. Joint customer assignment, power allocation, and subchannel allocation in a UAV-based joint radar and communication network. IEEE Internet Things J. 2024, 11, 29643–29660. [Google Scholar] [CrossRef]
- Ding, L.; Shi, C.; Qiu, W.; Zhou, J. Joint dwell time and bandwidth optimization for multi-target tracking in radar network based on low probability of intercept. Sensors 2020, 20, 1269. [Google Scholar] [CrossRef]
- Xin, Q.; Xin, Z.; Chen, T. Cooperative jamming resource allocation with joint multi-domain information using evolutionary reinforcement learning. Remote Sens. 2024, 16, 1955. [Google Scholar] [CrossRef]
- Wang, X.; Fei, Z.; Huang, J.; Zhang, J.A.; Yuan, J. Joint resource allocation and power control for radar interference mitigation in multi-UAV networks. Sci. China Inf. Sci. 2021, 64, 182307. [Google Scholar] [CrossRef]
- Xing, H.; Wu, H.; Chen, Y.; Wang, K. A cooperative interference resource allocation method based on improved firefly algorithm. Def. Technol. 2021, 17, 1352–1360. [Google Scholar] [CrossRef]
- Zhang, W.; Zhao, T.; Zhao, Z.; Ma, D.; Liu, F. Performance analysis of deep reinforcement learning-based intelligent cooperative jamming method confronting multi-functional networked radar. Signal Process. 2023, 207, 108965. [Google Scholar] [CrossRef]
- Geng, J.; Jiu, B.; Li, K.; Zhao, Y.; Liu, H.; Li, H. Radar and jammer intelligent game under jamming power dynamic allocation. Remote Sens. 2023, 15, 581. [Google Scholar] [CrossRef]
- Owen, G. Game Theory; Emerald Group Publishing: Bingley, UK, 2013. [Google Scholar]
- Li, K.; Jiu, B.; Liu, H. Game theoretic strategies design for monostatic radar and jammer based on mutual information. IEEE Access 2019, 7, 72257–72266. [Google Scholar] [CrossRef]
- Han, P.; Zhang, L. Game model and algorithm of radar jamming resources optimization allocation. Mod. Radar 2019, 41, 78–83+90. [Google Scholar]
- Han, P.; Lu, J.; Wang, X. Radar Active Jamming Resource Assignment Algorithm Based on Game Theory. Mod. Def. Technol. 2018, 46, 53–59. [Google Scholar] [CrossRef]
- Xing, H.; Xing, Q.; Wang, K. A Joint Allocation Method of Multi-Jammer Cooperative Jamming Resources Based on Suppression Effectiveness. Mathematics 2023, 11, 826. [Google Scholar] [CrossRef]
- He, F.; Qi, S.; Xie, G.; Wu, T. Improved ant colony algorithm to solve multi-objective optimization of radar interference resource distribution. Fire Control. Command. Control 2014, 39, 111–114. [Google Scholar]
- Liu, X.; Li, D.; Hu, R. Application of improved genetic algorithm in cooperative jamming resource assignment. J. Detect. Control 2018, 40, 69–75. [Google Scholar]
- Ji, H.; Pan, M.; Zhang, Y.; Yu, Q. Method of jamming resource distribution based on genetic-ant colony fusion algorithm. Syst. Eng. Electron. 2023, 45, 2098–2107. [Google Scholar]
- Wu, H.; Shi, Z.; Shen, W.; Chen, Y.; Cheng, S. Distribution method of jamming resource based on IFS and IPSO algorithm. J. Beijing Univ. Aeronaut. Astronaut. 2017, 43, 2370–2376. [Google Scholar]
- Dai, S.; Yang, G.; Li, M.; Kang, C.; Zhong, Z. Cooperative jamming resources allocation of networked radar based on improved particle swarm optimization algorithm. Aerosp. Electron. Warf. 2020, 36, 29–34. [Google Scholar]
- Zhang, Y.; Li, Y.; Gao, M. Optimal assignment model and solution of cooperative jamming resources. Syst. Eng. Electron. 2014, 36, 1744–1749. [Google Scholar]
- Yao, Z.; Wang, C.; Shi, Q.; Zhang, S.; Yuan, N. Cooperative jamming resource allocation model for radar network based on simulated annealing genetic algorithm. Syst. Eng. Electron. 2024, 46, 824–830. [Google Scholar]
- Zhang, D.; Yi, W.; Kong, L. Optimal joint allocation of multijammer resources for jamming netted radar system. J. Radars 2021, 10, 595–606. [Google Scholar]
- Wu, J.; Huang, Z.; Hu, Z.; Lv, C. Toward human-in-the-loop AI: Enhancing deep reinforcement learning via real-time human guidance for autonomous driving. Engineering 2023, 21, 75–91. [Google Scholar]
- Feng, S.; Sun, H.; Yan, X.; Zhu, H.; Zou, Z.; Shen, S.; Liu, H.X. Dense reinforcement learning for safety validation of autonomous vehicles. Nature 2023, 615, 620–627. [Google Scholar]
- Yin, K.; Shi, J.; Duan, G.; Li, L.; Si, J. Greedy-PPO intelligent spectrum sharing decision for complex electromagnetic interference environments. Acta Aeronaut. Astronaut. Sin. 2024, 45, 330195. [Google Scholar]
- Xing, Q.; Zhu, W.; Jia, X. Intelligent radar countermeasure based on Q-learning. Syst. Eng. Electron. 2018, 40, 1031–1035. [Google Scholar]
- Zhang, B.; Zhu, W. DQN based decision-making method of cognitive jamming against multifunctional radar. Syst. Eng. Electron. 2020, 42, 819–825. [Google Scholar]
- Pan, Z.; Li, Y.; Wang, S.; Li, Y. Joint Optimization of Jamming Type Selection and Power Control for Countering Multifunction Radar Based on Deep Reinforcement Learning. IEEE Trans. Aerosp. Electron. Syst. 2023, 59, 4651–4665. [Google Scholar] [CrossRef]
- Liu, H.; Zhang, H.; He, Y.; Sun, Y. Jamming strategy optimization through dual Q-learning model against adaptive radar. Sensors 2021, 22, 145. [Google Scholar] [CrossRef]
- Mahafza, B.R.; Elsherbeni, A. MATLAB Simulations for Radar Systems Design; Chapman and Hall/CRC: Boca Raton, FL, USA, 2003. [Google Scholar]
- Faramarzi, A.; Heidarinejad, M.; Mirjalili, S.; Gandomi, A.H. Marine Predators Algorithm: A nature-inspired metaheuristic. Expert Syst. Appl. 2020, 152, 113377. [Google Scholar]
- Zhao, S.R.; Wu, Y.L.; Tan, S.; Wu, J.R.; Cui, Z.S.; Wang, Y.G. QQLMPA: A quasi-opposition learning and Q-learning based marine predators algorithm. Expert Syst. Appl. 2023, 213, 119246. [Google Scholar]
- Aydemir, S.B. Enhanced marine predator algorithm for global optimization and engineering design problems. Adv. Eng. Softw. 2023, 184, 103517. [Google Scholar]
- Zhong, K.Y.; Zhou, G.; Deng, W.; Zhou, Y.Q.; Luo, Q.F. MOMPA: Multi-objective marine predator algorithm. Comput. Methods Appl. Mech. Eng. 2021, 385, 114029. [Google Scholar]
- Ramezani, M.; Bahmanyar, D.; Razmjooy, N. A new improved model of marine predator algorithm for optimization problems. Arab. J. Sci. Eng. 2021, 46, 8803–8826. [Google Scholar]
- Latombe, G.; Granger, E.; Dilkes, F.A. Graphical EM for on-line learning of grammatical probabilities in radar Electronic Support. Appl. Soft Comput. 2012, 12, 2362–2378. [Google Scholar]
Disclaimer/Publisher’s Note: The statements, opinions and data contained in all publications are solely those of the individual author(s) and contributor(s) and not of MDPI and/or the editor(s). MDPI and/or the editor(s) disclaim responsibility for any injury to people or property resulting from any ideas, methods, instructions or products referred to in the content. |
© 2025 by the authors. Licensee MDPI, Basel, Switzerland. This article is an open access article distributed under the terms and conditions of the Creative Commons Attribution (CC BY) license (https://creativecommons.org/licenses/by/4.0/).

