Article

Validation of Inland Water Surface Elevation from SWOT Satellite Products: A Case Study in the Middle and Lower Reaches of the Yangtze River

1
State Key Laboratory of Simulation and Regulation of Water Cycle in River Basin, China Institute of Water Resources and Hydropower Research, Beijing 100038, China
2
Remote Sensing Technology Application Center, Ministry of Water Resources, Beijing 100038, China
3
Engineering Technology Research Center for Flood Control and Drought Relief, Ministry of Water Resources, Beijing 100038, China
4
School of Ecology, Environment and Resources, Guangdong University of Technology, Guangzhou 510006, China
*
Author to whom correspondence should be addressed.
Remote Sens. 2025, 17(8), 1330; https://doi.org/10.3390/rs17081330
Submission received: 29 January 2025 / Revised: 31 March 2025 / Accepted: 3 April 2025 / Published: 8 April 2025

Abstract

:
The Surface Water and Ocean Topography (SWOT) satellite mission, jointly developed by NASA and several international collaboration agencies, aims to achieve high-resolution two-dimensional observations of global surface water. Equipped with the advanced Ka-band radar interferometer (KaRIn), it significantly enhances the ability to monitor surface water and provides a new data source for obtaining large-scale water surface elevation (WSE) data at high temporal and spatial resolution. However, the accuracy and applicability of its scientific data products for inland water bodies still require validation. This study obtained three scientific data products from the SWOT satellite between August 2023 and December 2024: the Level 2 KaRIn high-rate river single-pass vector product (L2_HR_RiverSP), the Level 2 KaRIn high-rate lake single-pass vector product (L2_HR_LakeSP), and the Level 2 KaRIn high-rate water mask pixel cloud product (L2_HR_PIXC). These were compared with in situ water level data to validate their accuracy in retrieving inland water levels across eight different regions in the middle and lower reaches of the Yangtze River (MLRYR) and to evaluate the applicability of each product. The experimental results show the following: (1) The inversion accuracy of L2_HR_RiverSP and L2_HR_LakeSP varies significantly across different regions. In some areas, the extracted WSE aligns closely with the in situ water level trend, with a coefficient of determination ( R 2 ) exceeding 0.9, while in other areas, the R 2 is lower (less than 0.8), and the error compared to in situ water levels is larger (with Root Mean Square Error (RMSE) greater than 1.0 m). (2) This study proposes a combined denoising method based on the Interquartile Range (IQR) and Adaptive Statistical Outlier Removal (ASOR). Compared to the L2_HR_RiverSP and L2_HR_LakeSP products, the L2_HR_PIXC product, after denoising, shows significant improvements in all accuracy metrics for water level inversion, with R 2 greater than 0.85, Mean Absolute Error (MAE) less than 0.4 m, and RMSE less than 0.5 m. Overall, the SWOT satellite demonstrates the capability to monitor inland water bodies with high precision, especially through the L2_HR_PIXC product, which shows broader application potential and will play an important role in global water dynamics monitoring and refined water resource management research.

1. Introduction

Water Surface Elevation (WSE) is a key indicator for studying the dynamic changes in surface water. Enhancing the capacity for WSE monitoring and accurately and comprehensively tracking river and lake water level changes is of great significance for flood control and disaster reduction, water resource management and allocation, and the protection of river and lake ecosystems [1]. Traditional water level monitoring data is primarily obtained through continuous observations at fixed hydrological stations [2], a method that requires substantial human resources, material support, and financial investment. Additionally, due to the insufficient number of hydrological stations in some river basins and the limited spatial coverage, particularly in remote and sparsely populated upstream areas, conventional hydrological observation methods alone are unable to provide effective and continuous water level measurements [3].
Satellite altimetry technology enables large-scale, high-precision, and periodic surface observations, offering unmatched advantages over other observation techniques. It can overcome the limitations of traditional water level monitoring, providing broader spatial coverage and filling the gap in water level monitoring for data-scarce areas. It has become an important tool for monitoring global ocean and inland water body elevations [4]. Satellite altimetry was first introduced by W.M. Kaula in 1969 and was initially applied to global sea level height measurements. With the development of information and space technologies, the capabilities of satellite altimetry have significantly improved, and its range of application has expanded from oceanic [5] observations to glaciers [6,7] and inland water bodies [8,9], including reservoirs [10], lakes [11], large rivers [12,13], wetlands [14], and floodplains [15,16]. As a key component of satellite altimetry, radar-altimeter-equipped satellites, with their ability to operate in all weather conditions, are especially suitable for monitoring large-scale oceans and inland water bodies. However, due to their relatively large footprint (low spatial resolution), they are limited in monitoring medium and small inland water bodies and struggle to capture spatial variations in water bodies’ details [17]. In contrast to radar altimetry, the ICESat and ICESat-2 satellites, equipped with laser altimeters, significantly improve spatial resolution and data acquisition accuracy through high-precision laser ranging. However, due to their relatively long revisit cycle, their practicality is reduced [18]. Additionally, the laser signals from a laser altimeter can be affected by atmospheric scattering and cloud cover when passing through the atmosphere, which weakens or blocks the signals and impacts the quality and continuity of the observation data [19]. Currently, existing satellite altimetry technologies only provide one-dimensional strip or point measurements along the satellite’s orbit and cannot cover large areas. This limitation makes it difficult to fully capture the overall water level changes in rivers or lakes within a region.
The Surface Water and Ocean Topography (SWOT) satellite, launched in December 2022, carries the Ka-band radar interferometer (KaRIn), which utilizes dual-antenna interferometric radar technology to measure WSE across a 120 km wide swath, covering over 90% of the Earth’s surface. This capability addresses the limitations of existing radar altimetry and laser altimetry techniques, which have narrow coverage swaths, and enables the first continuous two-dimensional observation of global surface water [20]. The SWOT satellite orbits at an altitude of 891 km above Earth and completes global surface water monitoring every 21 days, with at least two observations of the same location within each cycle [21], offering the advantage of a short revisit period. It is also the first satellite to conduct high-resolution monitoring and high-vertical-accuracy measurements of global surface water using wide-swath radar interferometric altimetry, providing centimeter-level measurement accuracy. The spatial resolution for inland water bodies is 50 m, with a measurement precision of 10 cm [22]. Additionally, the SWOT satellite is capable of monitoring small water bodies, including rivers with a width greater than 100 m and inland water bodies with an area of 0.06 km² or larger. Numerous researchers worldwide have conducted extensive studies on inland water bodies using synthetic SWOT data generated by the CNES SWOT large-scale hydrology simulator (SWOT simulator). Xiong et al. [23] used the SWOT simulator to generate synthetic SWOT data, accurately capturing the seasonal and annual variations in the water level of Qinghai Lake, with a correlation coefficient exceeding 0.9 and a root mean square error less than 0.19 m. Grippa et al. [24] demonstrated the potential of the SWOT satellite for monitoring seasonal water level changes in small water bodies in the Sahel region, achieving better than 0.04 m accuracy in some small lakes. Nair et al. [25] used the SWOT simulator in the Mahanadi River Basin in India, effectively monitoring river water level fluctuations and capturing seasonal water level changes in the basin. Compared to traditional HEC-RAS hydrodynamic models and measured data, the error was less than 0.2 m. Elmer et al. [26] used the SWOT simulator along with the WRF-Hydro model to generate proxy WSE data for the Tanana and Susitna river basins. The average WSE error for the river reaches in the Tanana River Basin was 0.15 m, with a standard deviation of 0.64 m, while in the Susitna River Basin, the average WSE error was 0.04 m, with a standard deviation of 0.58 m.
An analysis of the aforementioned research findings reveals that the majority of studies are based on synthetic SWOT data generated by the SWOT simulator, rather than analyzing and validating actual data from the SWOT satellite. In March 2024, the Version C KaRIn scientific data from the SWOT satellite were officially released, providing crucial new data support for global surface water monitoring. However, the overall accuracy and effectiveness of these scientific data products remain unknown. In light of this, the present study aims to conduct a preliminary investigation of the scientific data released by the SWOT satellite. It analyzes the accuracy and overall precision of three Level 2 KaRIn high-rate products—namely, the high-rate water mask pixel cloud product [27] (L2_HR_PIXC Version 2.0), the high-rate river single-pass vector product [28] (L2_HR_RiverSP Version 2.0), and the high-rate lake single-pass vector product [29] (L2_HR_LakeSP Version 2.0)—in measuring water levels in inland water bodies, and it evaluates their applicability. Additionally, this study innovatively develops a combined denoising method based on the Interquartile Range (IQR) and Adaptive Statistical Outlier Removal (ASOR) to address the spatial noise generated during the interferometric process of the SWOT satellite. This method significantly improves the overall accuracy and temporal resolution of water level inversion, providing an effective technical approach for further dynamic monitoring of inland water bodies and the extraction of water body characteristics based on SWOT satellite data.

2. Study Area and Data
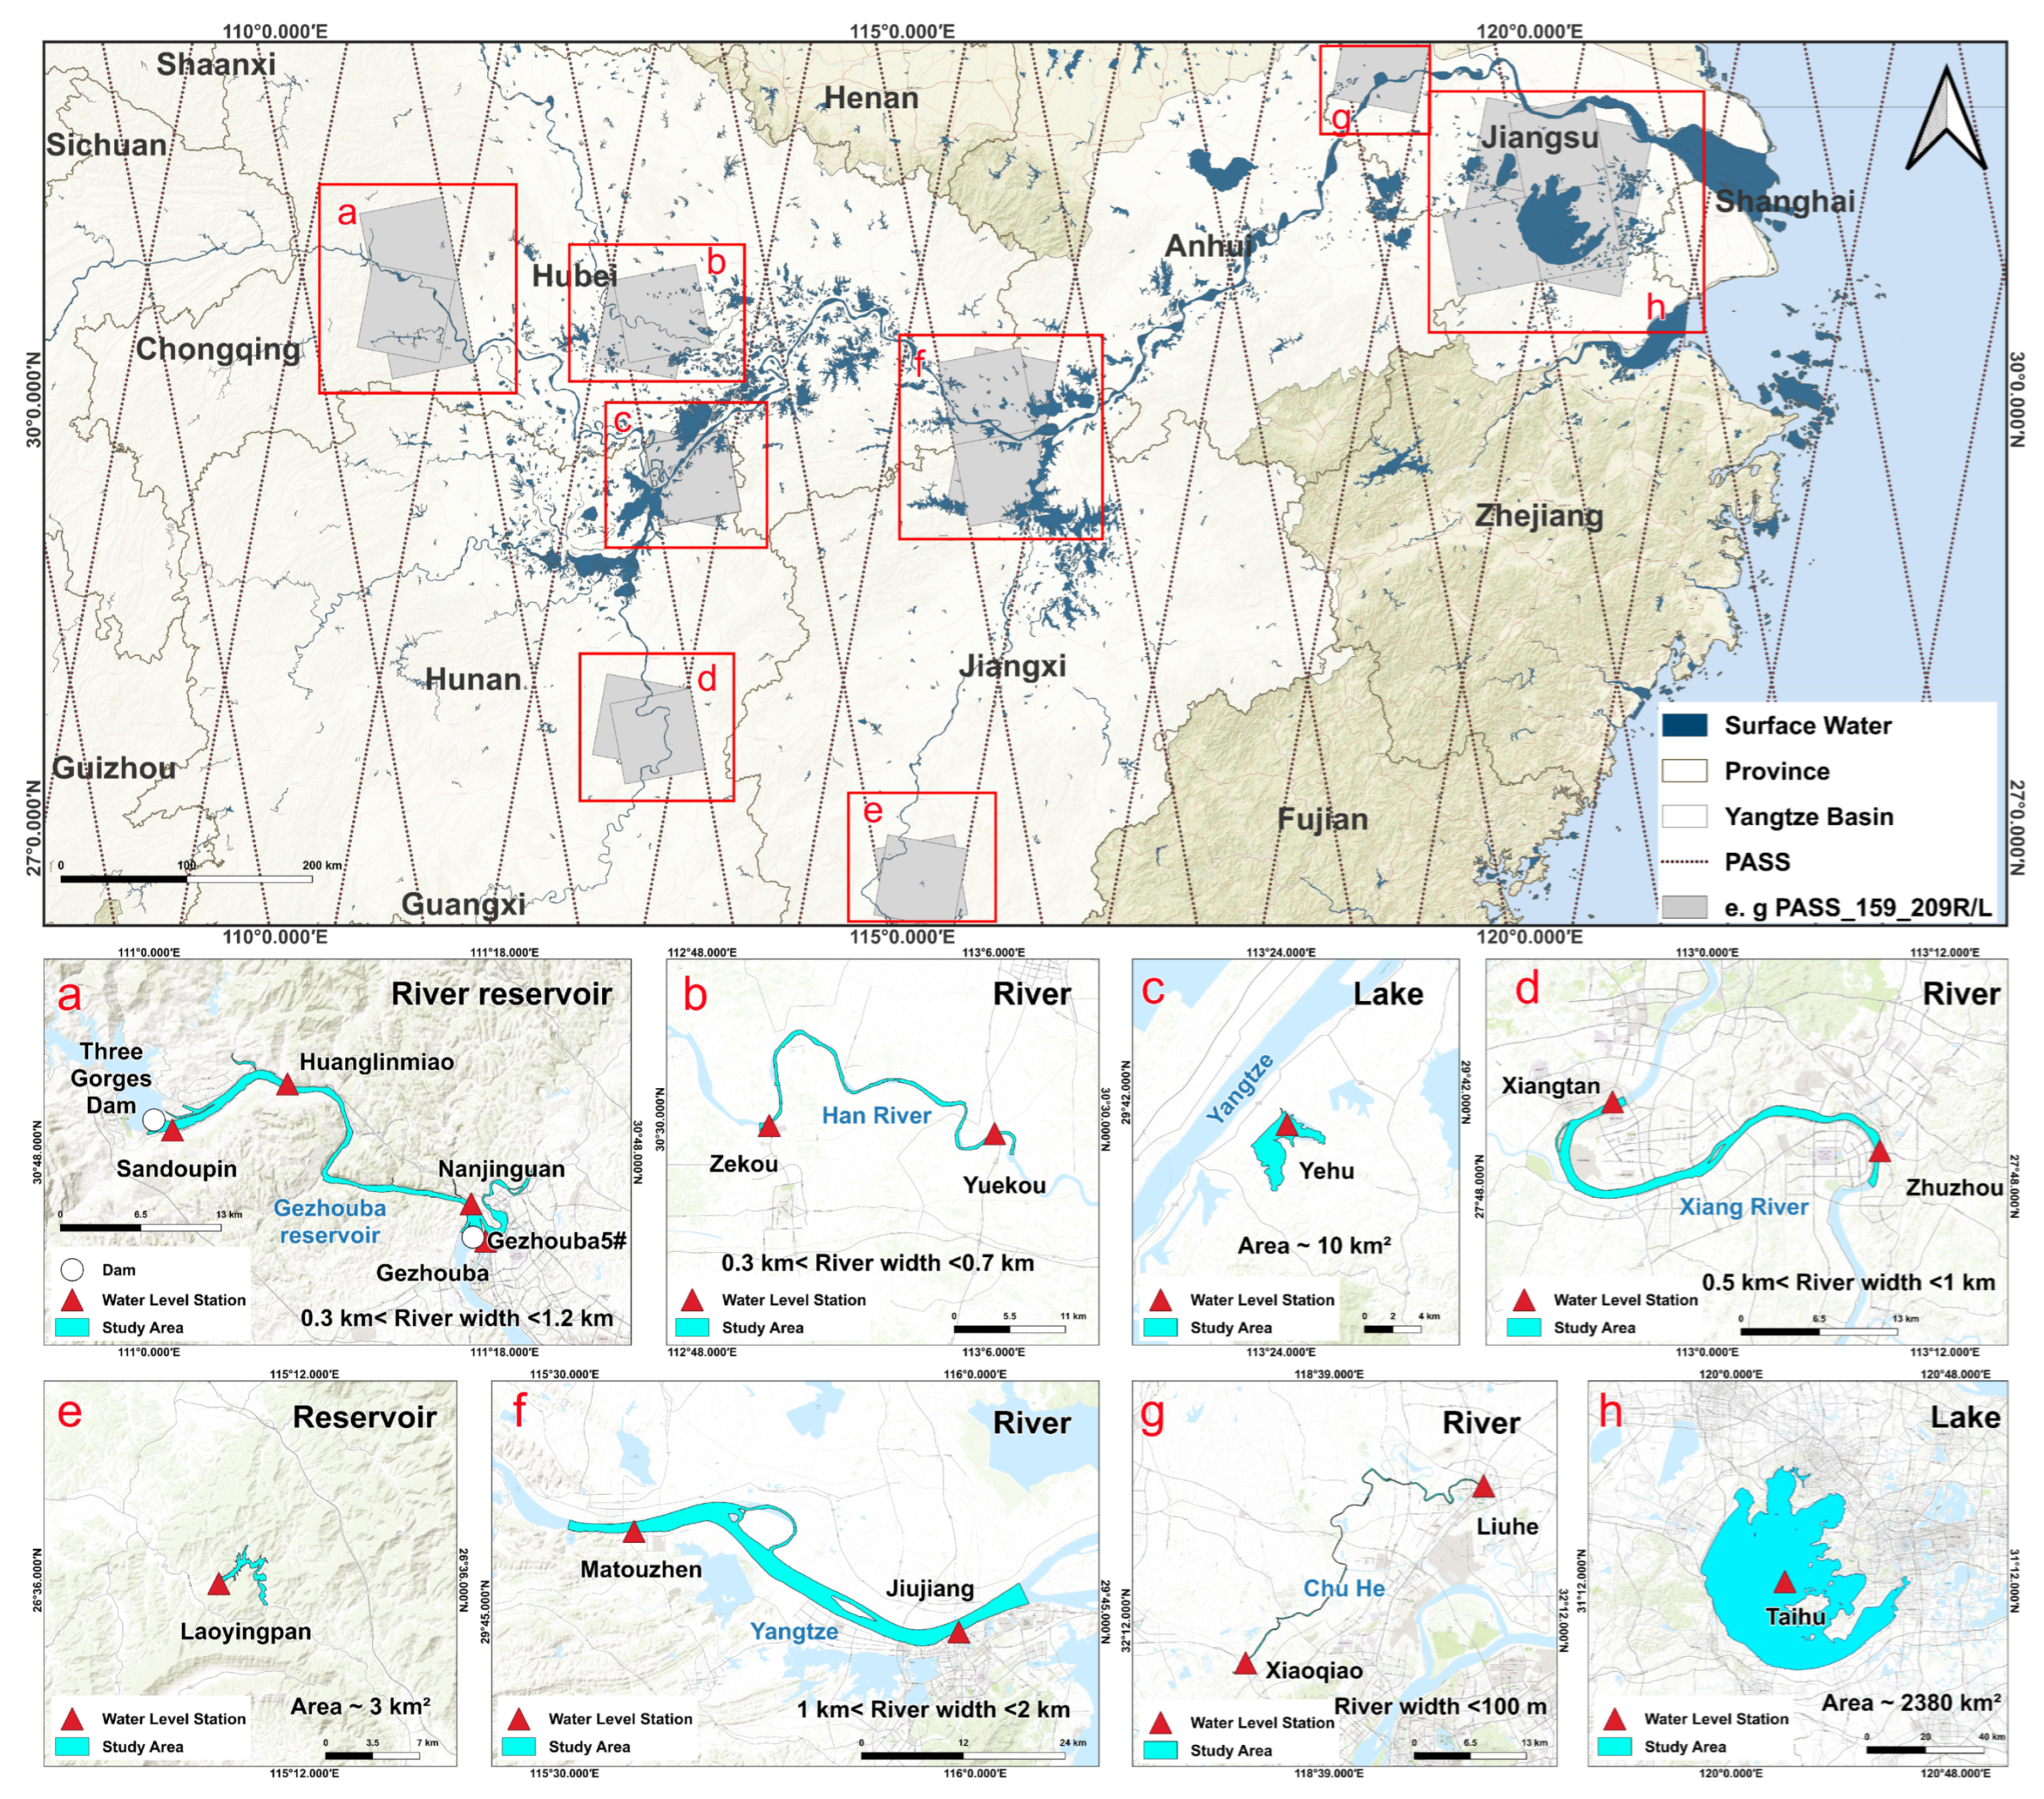
2.1. Study Area

The middle and lower reaches of the Yangtze River (MLRYR) are primarily characterized by a plain topography, with an average elevation generally below 50 m. Only the upstream river sections are characterized by mountainous and hilly terrain. The total area of the MLRYR is approximately 780,000 square kilometers [30]. The region’s water system is intricate, with lakes and reservoirs widely distributed, making it the most concentrated area in terms of water resources, water network density, and lake distribution in China; indeed, it accounts for 36.5% of the nation’s water resources. This region falls within the subtropical monsoon climate zone, with precipitation exhibiting significant seasonal variation, and is frequently affected by droughts and floods [31,32,33]. To effectively assess and validate the accuracy of the SWOT satellite in monitoring inland water elevations under different environmental conditions, this study selected eight different research areas within the MLRYR (Figure 1). These areas encompass the main stream of the Yangtze River and its major tributaries; large, medium, and small lakes; and reservoirs, representing a variety of terrain conditions and water body characteristics.

2.2. SWOT Satellite Data

The SWOT KaRIn scientific data are divided into Level 1B and Level 2 categories, consisting of two types of Global Low Rate oceanography science data products and nine types of Global High Rate hydrology science data products, each covering different levels and types. For this study, we selected three products from the Level 2 Global High Rate hydrology science data products: L2_HR_PIXC, L2_HR_RiverSP, and L2_HR_LakeSP. Among these, L2_HR_RiverSP and L2_HR_LakeSP are high-resolution products that are further processed from L2_HR_PIXC data to generate river- and lake-specific physical parameters [34]. The L2_HR_RiverSP product primarily includes two sub-products, namely, river nodes (Node) and river reaches (Reach), while the L2_HR_LakeSP product includes three sub-products, namely, lakes based on observations (Obs), lakes based on prior databases (Prior), and lakes with unassigned features (Unassigned) (Table 1). Each sub-product is distributed in Esri Geographic Information System (GIS) Shapefile format.
This study will focus on analyzing key parameters, such as WSE, provided by the L2_HR_PIXC, L2_HR_RiverSP (Node), and L2_HR_LakeSP (Obs) products. The L2_HR_PIXC product includes attributes such as geolocation height information, surface classification, backscatter, geophysical field information, and related quality flags. The L2_HR_RiverSP (Node) product extracts key river parameters from the pixel cloud data of the L2_HR_PIXC product, including WSE, surface slope, river width, and discharge (dschg_c), through pixel assignment and node aggregation processing [37]. The L2_HR_LakeSP (Obs) product extracts lake features from the pixel cloud data of the L2_HR_PIXC product using processes such as water body pixel selection, water body region segmentation, height-constrained geolocation, and attribute calculation. It generates vector surface data containing lake attributes, such as WSE and water surface area.
The SWOT satellite orbit paths and interferometric coverage for the study area can be obtained from the 21-day scientific orbit KMZ file published by NASA’s Physical Oceanography Distributed Active Archive Center (PO.DACC) (https://podaac.github.io/tutorials/quarto_text/SWOT.html, accessed on 1 January 2025). The L2_HR_PIXC, L2_HR_RiverSP, and L2_HR_LakeSP scientific data for the period from August 2023 to December 2024 can be downloaded from NASA Earthdata’s website (https://search.earthdata.nasa.gov/search?q=SWOT_*_2.0, accessed on 1 January 2025).

2.3. Optical and SAR Satellite Data

To obtain high-temporal-resolution surface water extent (SWE), we utilized SAR and optical remote sensing data from the Sentinel-1/2 satellites provided by the Google Earth Engine (GEE) cloud platform [38]. The Sentinel-2 satellite consists of two satellites, 2A and 2B, from which Level 2A surface reflectance data products with a 10 m resolution, preprocessed by radiometric calibration, geometric correction, and atmospheric correction, can be accessed through the GEE cloud platform [39]. To compensate for image gaps caused by cloud cover in Sentinel-2 data, the Sentinel-1A satellite was selected as a supplementary data source. The preprocessed (orbital correction, thermal noise removal, radiometric calibration, and terrain correction) Ground Range Detected (GRD) data product in the Interferometric Wide Swath (IW) mode, with a 10 m resolution at Level 1, is available on the GEE cloud platform.

2.4. Other Data

The GDW consensus global database (V1) [40], developed by the Global Dam Watch (GDW) consortium, integrates data from The Global Geo-referenced Database of Dams (GOODD), The Global Reservoir and Dam Database (GRanD), and Future Hydropower Reservoirs and Dams (FHReD). It provides a high-quality consensus product for river barriers and reservoirs globally and is often used to delineate reservoir boundaries [41,42]. The river boundaries were delineated based on visual inspection of remote sensing imagery. To validate the accuracy of the SWOT product water level data for the target area, we obtained daily in situ water level data at 8:00 a.m. from 15 in situ stations for the period from August 2023 to December 2024 from the Ministry of Water Resources Information Center. The data used in this study are summarized in Table 2.

3. Methods

3.1. Overall Framework

This study evaluates the accuracy of water level measurements for rivers, lakes, and reservoirs in MLRYR from August 2023 to December 2024, using WSE derived from three SWOT satellite scientific data products (Figure 2). First, SWE for the study area was extracted using the water index algorithm applied to Sentinel-1/2 satellite imagery. Next, WSE with higher reliability from the L2_HR_RiverSP (Node) and L2_HR_LakeSP (Obs) products were selected. Third, the L2_HR_PIXC data were clipped using the high-temporal-resolution SWE, and the clipped pixel cloud underwent denoising to obtain the WSE data for the pixel cloud. Finally, the accuracy of the extracted WSE was comprehensively evaluated based on the 15 in situ water level observations.

3.2. Extracting SWE

The water index method is widely used for remote-sensing-based water body extraction. In the process of extracting SWE using Sentinel-1/2 satellite data, a 100 m buffer zone is first constructed based on the boundary vector data of rivers and lakes. For Sentinel-1A data, preprocessing is required, where the VV and VH polarizations in IW mode are selected from the GEE cloud platform. The Refined Lee filter [43] is then applied to remove speckle noise and grainy noise from the radar imagery. The Sentinel-1 Dual-Polarized Water Index [44] (SDWI) (Equation (1)) is then calculated within the buffer zone. For Sentinel-2 data, to ensure the imagery is not affected by cloud cover, images with less than 20% cloud cover are selected, followed by cloud removal. The Automatic Water Extraction Index [45] (AWEIsh) (Equation (2)) is then calculated within the buffer zone. Finally, the Otsu [46] method is used to automatically select the optimal threshold to extract the water bodies. The generated water mask data are then used to filter the pixel cloud data, retaining only the pixels located within the identified water body boundaries.
S D W I = ln ( 10 × V V × V H )
A W E I s h = B l u e + 2.5 × G r e e n 1.5 × ( N I R + S W I R 1 ) 0.25 × S W I R 2
where VV and VH denote two distinct polarization channels, Blue represents the blue spectral band, Green corresponds to the green spectral band, NIR indicates the near-infrared band, and SWIR1 and SWIR2 refer to shortwave infrared bands 1 and 2,

3.3. Calculation of WSE

The WSE from the SWOT satellite refers to the elevation of the inland water surface relative to the geoid after removing tidal effects [47]. The L2_HR_RiverSP (Node) and L2_HR_LakeSP (Obs) products directly include the WSE field, whereas the L2_HR_PIXC product does not directly provide the WSE field. Therefore, before data processing, the WSE must be calculated using the height field, geoid field, and several tidal fields from the L2_HR_PIXC product. The height values in the L2_HR_PIXC product are measurements that have undergone multiple calibrations, including instrument calibration, signal propagation delay corrections (ionospheric, dry tropospheric, and wet tropospheric corrections), and cross-calibration. However, corrections based on geophysical models have not been applied. To calculate the WSE for the L2_HR_PIXC product, this study applies geophysical corrections using Equation (3).
W S E = h e i g h t g e o i d s o l i d _ e a r t h _ t i d e l o a d _ t i d e p o l e _ t i d e
where WSE denotes the water surface elevation relative to the geoid, height represents the water surface height relative to the reference ellipsoid, geoid corresponds to the geoid ellipsoid separation, solid_earth_tide indicates solid Earth tidal height, load_tide refers to load tidal height, and pole_tide specifies pole tidal height.

3.4. Data Preprocessing for L2_HR_RiverSP and L2_HR_LakeSP

The Summary Quality Indicator for the node measurement (node_q) in the L2_HR_RiverSP (Node) product and the Summary Quality Flag for the lake measurement (quality_f) in the L2_HR_LakeSP (Obs) product are used to assess the overall data quality. A summary quality indicator value of zero indicates high data quality, while higher values correspond to lower data quality. This study uses the summary quality indicators to filter the WSE data, ensuring its reliability. Specifically, for the L2_HR_RiverSP (Node) product, the WSE values from the three nodes (node) closest to the in situ measurement station are selected. WSE values with lower quality (node_q > 1) are excluded, and the final WSE value is obtained by averaging the remaining node WSE values. For the L2_HR_LakeSP (Obs) product, only high-quality WSE measurements with a quality_f of 0 are retained. The filtered WSE values are then compared with the trends of the 15 in situ measurement results (Figure 3).

3.5. Noise Removal from L2_HR_PIXC

The L2_HR_PIXC product, obtained from the SWOT satellites’ KaRIn instrument through interferometric radar measurements, provides spatial distribution, elevation, and dynamic change information about the pixel cloud. During radar interferometric measurements, the SWOT satellites is subject to the radar’s static effects, environmental interference, and scattering anomalies, resulting in significant spatial noise in the pixel cloud, distributed discretely on both sides (Figure 4a). These outliers can significantly affect the accuracy of WSE inversion.
It is worth noting that the geolocation quality flag attribute (geolocation_qual) in the L2_HR_PIXC product is used to assess the quality of the pixel cloud’s geolocation data (including elevation, longitude, and latitude). A value of zero indicates reliable data quality, while higher values indicate lower reliability. However, extensive experiments have shown that some pixel cloud WSE values with larger quality flags are similar to those with quality flags equal to zero. Selecting only data with a quality flag of zero may result in the exclusion of a large quantity of available pixel cloud data in the study area. To avoid data loss due to filtering, this study did not perform quality filtering on the pixel cloud.
Therefore, this study repeatedly employed the IQR and ASOR denoising algorithms to identify and remove spatially uneven or anomalously dispersed points, reducing noise in the data and enhancing the reliability and accuracy of WSE inversion from the L2_HR_PIXC product. Specifically, outliers with a large deviation in the pixel cloud were removed using the IQR method (Equations (4) and (5)). WSE values below the first quartile minus 1.5 times the IQR or above the third quartile plus 1.5 times the IQR were considered outliers and were excluded.
I Q R = Q 3 Q 1
W S E outier < Q 1 1.5 × I Q R & W S E outlier > Q 3 + 1.5 × I Q R
where the variable IQR quantifies the dispersion of the central 50% of the data points; Q1 represents the first quartile (25th percentile), and Q3 corresponds to the third quartile (75th percentile).
The pixel cloud is composed of a collection of spatially discrete pixels, with significant variation in spatial density and uneven distribution. To address this characteristic, this study employs the ASOR method (Equation (6)), which analyzes the local spatial statistical properties of the pixel cloud and adaptively adjusts the neighborhood scale to effectively identify and remove outliers. This process significantly improves the precision and reliability of the filtering. After removing the noise values, a 600 m wide range was selected for the pixel cloud, and the WSE value for each pixel cloud was obtained by averaging within this range.
For each p i PointCloud : d i = j = 1 N I p i p j r K i = K ( d i ) μ i , σ i = ComputeStats ( p i , K i ) Filter ( p i ) = Remove , p i μ i > μ i + n · σ i Keep , otherwise
where the variable p i denotes the ith point in the point cloud; r indicates the neighborhood radius; d i is the number of points within radius r of p i ; K maps d i to K i (i.e., K i is obtained by applying the function K to d i , thereby adaptively determining the neighborhood size parameter based on the local density d i ); μ i and σ i represent the local mean and standard deviation, respectively; and n is the factor controlling the outlier threshold.

3.6. Removal of Systematic Errors

The WSE obtained directly or through calculation is converted from WGS84 ellipsoidal height to orthometric height using the EGM2008 geoid model, while the in situ measurement reference for China is based on the Huanghai Sea level datum. Due to differences in the definition of reference surfaces between global geoid models and regional elevation benchmarks, the elevation anomalies from the two can lead to systematic biases. In this study, the in situ measured water levels are selected as the reference time series. Systematic errors between the SWOT satellite-inverted water levels and the in situ measured water level time series are corrected using Equations (7) and (8).
h = 1 n i = 1 n X i W S E i
Y I = W S E i ± h
where: h denotes the systematic error; X i corresponds to the measured water level; W S E i represents the water surface elevation relative to the geoid; Y i refers to the systematic error-corrected water level; and n signifies the sample size.

3.7. Accuracy Assessment

This study quantitatively evaluates the accuracy of the water levels inverted by the three SWOT satellite products using four evaluation metrics [48]: Root Mean Square Error (RMSE), Coefficient of Determination ( R 2 ), Mean Absolute Error (MAE), and Mean Absolute Percentage Error (MAPE). The calculation formulas for the evaluation metrics are as follows:
R 2 = 1 i = 1 n X i Y i 2 i = 1 n X i X ¯ 2
R M S E = 1 n i = 1 n X i Y i 2
M A E = 1 n i = 1 n X i Y i
M A P E = 1 n i = 1 n X i Y i X i
where the variables X i and Y i represent the measured and observed values, respectively; X ¯ denote the means of the measured values, respectively; and n represents the sample size.

4. Results

4.1. Accuracy Assessment and Applicability Analysis of SWOT L2_HR_RiverSP and LakeSP Products

We compared the WSE values of the L2_HR_RiverSP (Node) and L2_HR_LakeSP (Obs) products after quality screening with the results of the 15 in situ measurements. The results show that there are significant differences in the characteristics of water level changes at different sites. Among them, the WSE of Laoyingpan and Zekou, not only can reflect the seasonal trend of the in situ observed water level more accurately (Figure 3), but also shows a very high correlation ( R 2 > 0.99) with it (Figure 5). For most stations, such as Sandouping, Xiangtan, Zhuzhou, and Taihu, the WSE fluctuates greatly during certain periods of time, and these anomalies are incorrectly classified as a “better quality” of WSE, resulting in a low correlation with in situ data ( R 2 < 0.8). Therefore, it is not possible to fully identify or exclude all anomalies by quality screening alone.
It is worth noting that only 13 stations actually obtained data using this method (Figure 3 and Figure 5), and two in situ stations, Xiaoqiao and Liuhe, located in the Chu River reach, failed to obtain valid water level data. The Prior River Database (PRD) used by the SWOT mission provides high-precision river centerline and node location information for rivers worldwide. The pixel cloud data used to support SWOT satellite observations are spatially matched to river nodes. However, the SWORD_V16 database has not yet achieved complete coverage of all rivers in the world, especially for small rivers less than or equal to 100 m in width. Therefore, even if the PIXC data from SWOT satellites can observe these small rivers that are not included in the database, the lack of the corresponding centerline and node position reference information makes it impossible to carry out effective node mapping and pixel aggregation processing, which restricts the effective data generation of the L2_HR_RiverSP product on these river segments.
In general, L2_HR_RiverSP and L2_HR_LakeSP can be used to quickly obtain hydraulic parameters of inland water bodies, and the WSE extracted in some areas has a relatively impressive performance. At the same time, in some areas, there are some limitations in terms of quality control and applicability.

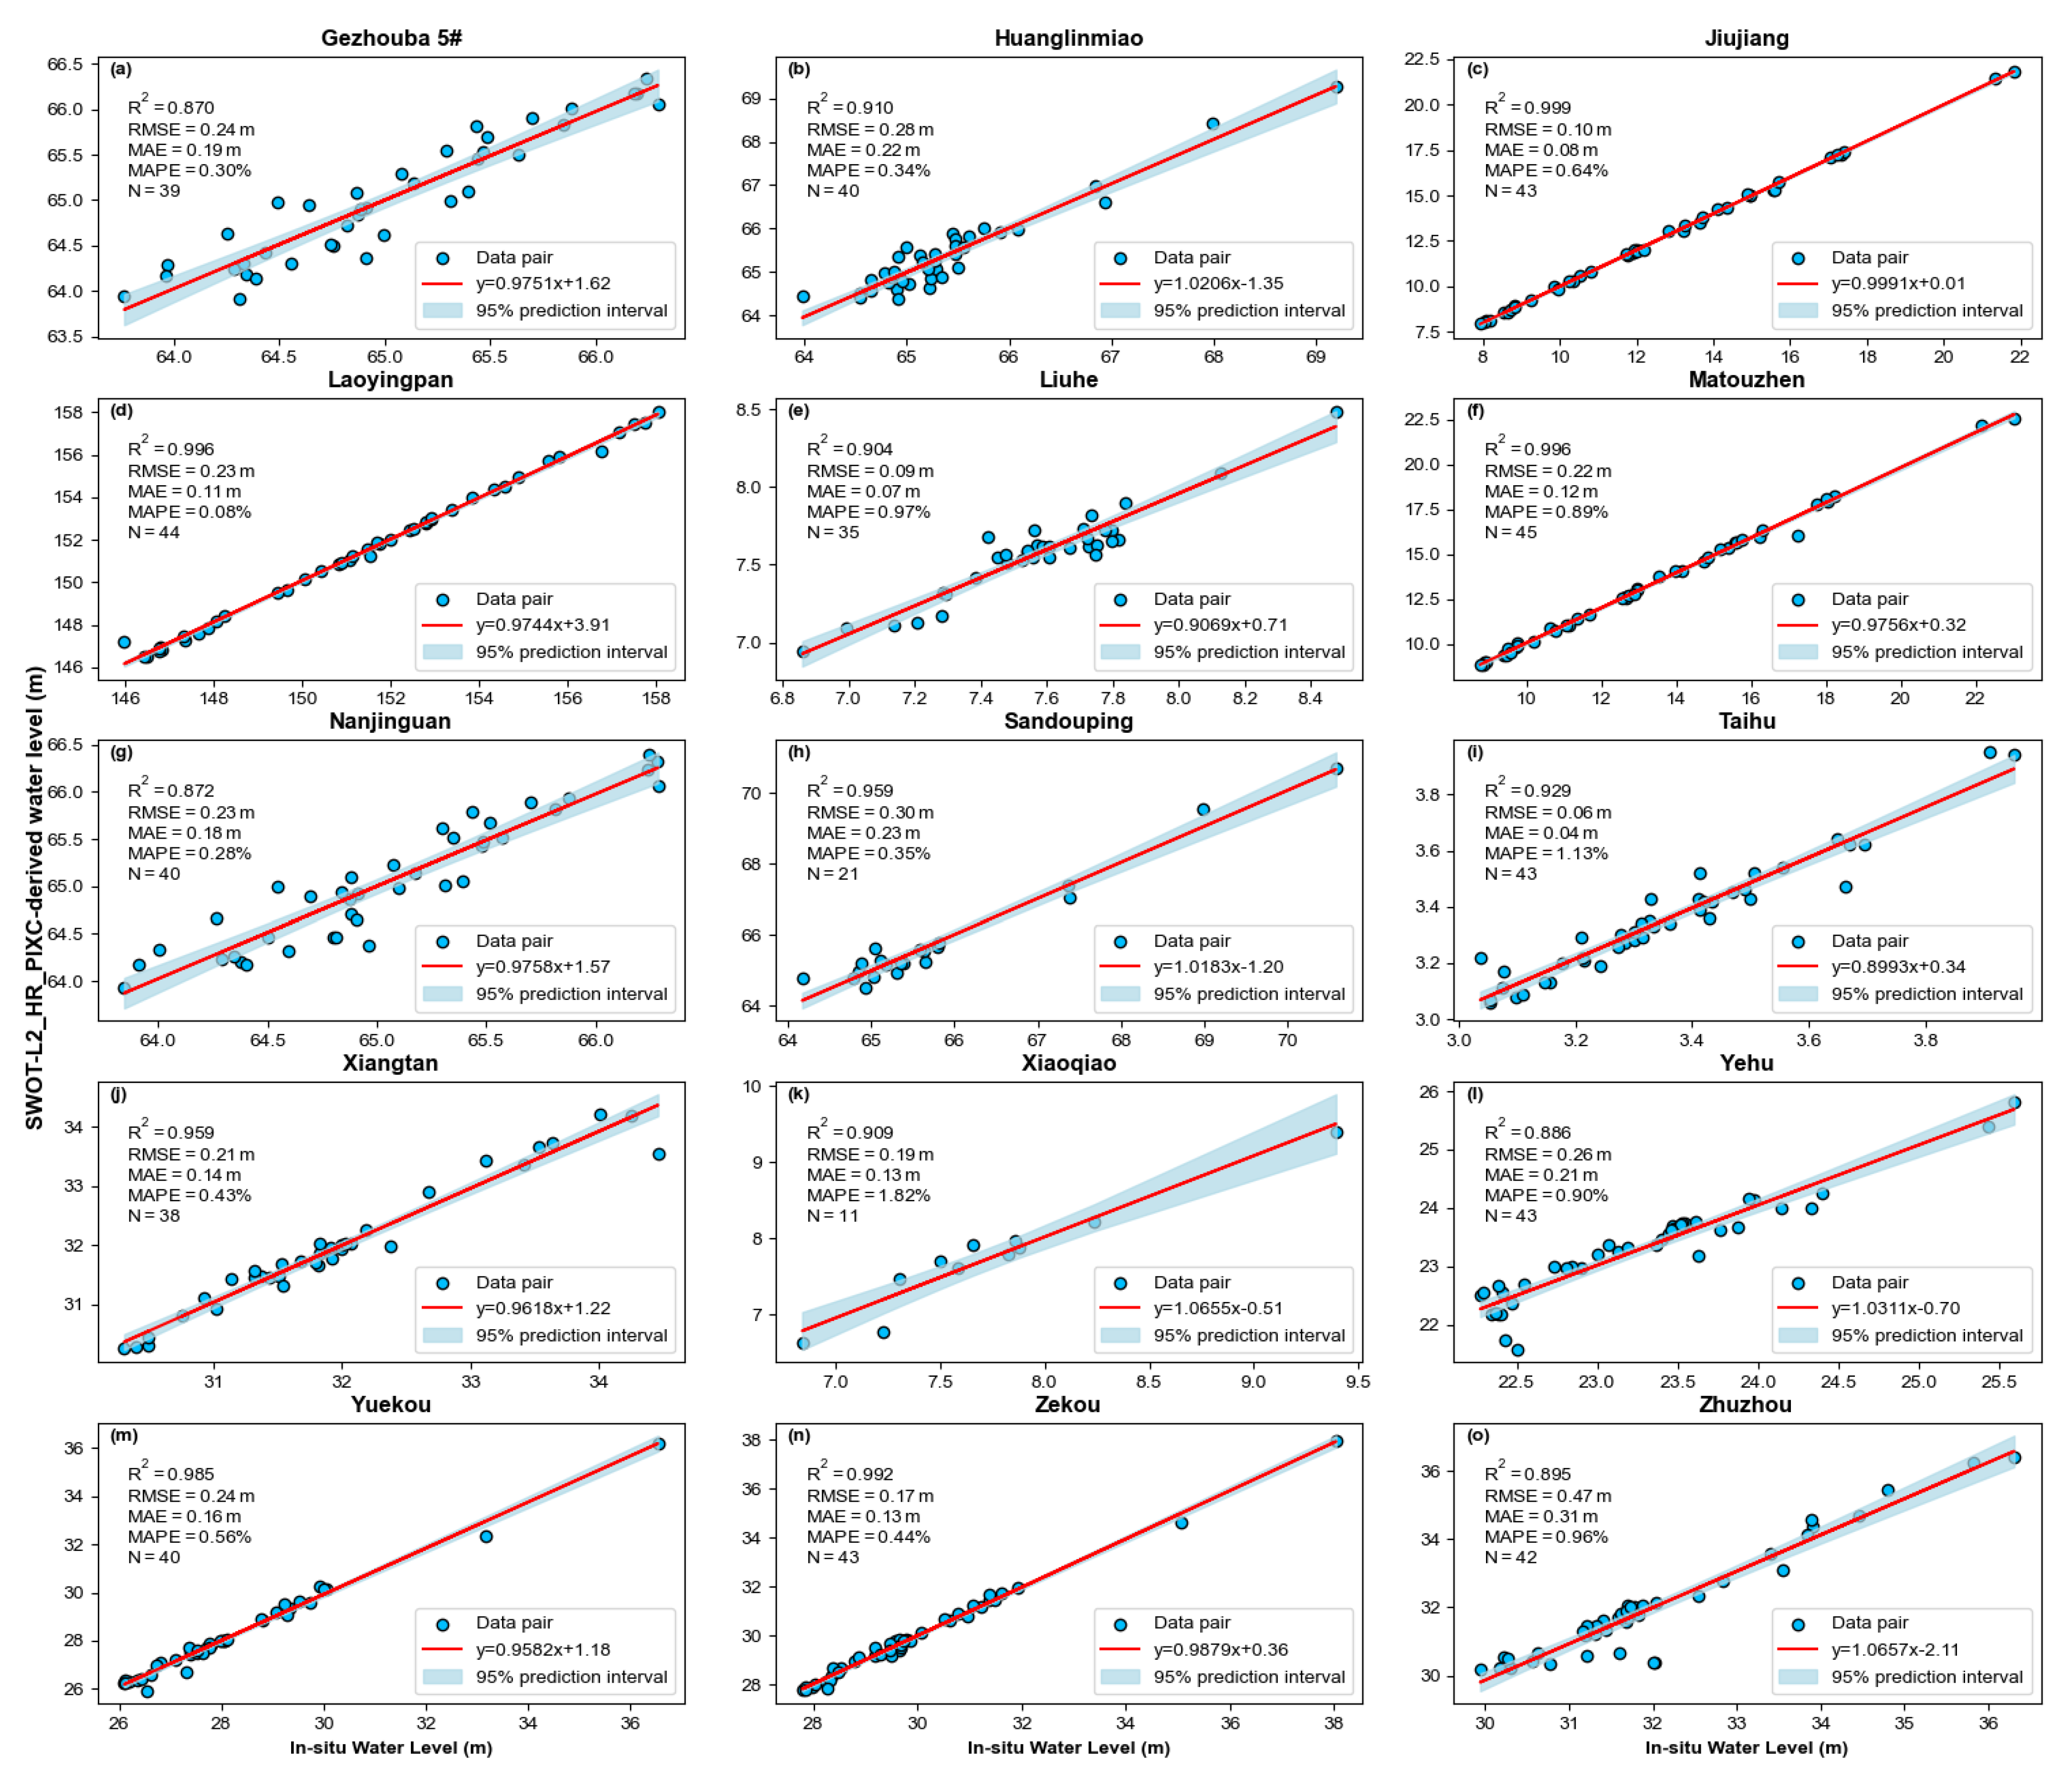
4.2. Accuracy Assessment and Applicability Analysis of SWOT L2_HR_PIXC

As L2_HR_PIXC is the base product consisting of SWOT satellite high-resolution water surface elevation data, its data quality largely determines the accuracy and reliability of the subsequent products such as L2_HR_RiverSP and L2_HR_LakeSP. Based on this, L2_HR_PIXC is denoised in this paper. The results show that the scattered anomalies of the original distribution are effectively removed, which can better reflect the changes of water surface height with the relief of the terrain (Figure 4b), and the distribution of the pixel cloud elevation in each region is stable and more concentrated, which effectively improves the data quality (Figure 4c). Meanwhile, all the accuracy indexes are significantly improved compared with L2_HR_RiverSP and L2_HR_LakeSP in each study area, which is manifested by the further improvement of the correlation and the significant reduction of the error and bias (Figure 6 and Table 3). In addition, more valid WSE observations can be obtained in a year, and the temporal resolution is significantly improved, which can capture the seasonal changes of water level more effectively.
It is worth noting that the observation frequency of L2_HR_PIXC at the Sandouping and Xiaoqiao in situ stations is relatively low compared with other stations, which have high temporal resolution. The Sandouping in situ station is located only 1.5 km downstream from the Three Gorges Dam, and the radar signals are easily interfered with by the stopover effect, which leads to a large number of unrealistic spatial points in the data, significantly increasing the probability of abnormal spatial distribution of the point cloud, and thus decreasing the effective observation frequency. At the same time, the KaRIn on board the SWOT satellite adopts the dual-antenna cross-track interferometry mode, and due to the geometric constraints of the interferometric baseline configuration, an observation blind zone of about 20 km is formed in the vicinity of the satellite Nadir, and the Xiaoqiao in situ station is located in the observation blind zone, which greatly reduces the frequency of acquiring effective observation data.
In summary, by effectively denoising L2_HR_PIXC, the accuracy of the water level inversion is significantly improved compared with the WSE obtained by directly utilizing L2_HR_RiverSP (Node) and L2_HR_LakeSP (Obs), and it has a higher temporal resolution, which demonstrates great potential in the observation of the dynamics of inland water bodies.

5. Discussion

5.1. Analysis of Accuracy Differences in Inland Water Level Retrieval Using the SWOT Satellites

The accuracy of the SWOT satellites’ L2_HR_PIXC product in inversion of WSE is significantly affected by the terrain conditions and the magnitude of the water level change. Gezhouba Reservoir is located between canyons with steep slopes, with large terrain undulation. At the same time, it is affected by the upstream Three Gorges Dam scheduling, with an unstable water surface morphology, and the radar signal is more susceptible to echo interference, resulting in a lower correlation with the measured water level, while the Laoyingpan Reservoir, located in the same area, is able to more accurately reflect the changes in the actual water level due to its smaller water level variation. In contrast, the plain area is less disturbed by topography, and the RMSE and MAE of some rivers and lakes can be below 0.1 m, which makes the overall accuracy higher and the stability greater.

5.2. L2_HR_PIXC Demonstrates Greater Application Potential

Compared with the L2_HR_RiverSP and L2_HR_LakeSP, L2_HR_PIXC not only accurately inverts the WSE of inland water bodies but also reveals their spatial distribution and heterogeneity, especially in identifying small water bodies and improving temporal resolution. With the high spatial and temporal resolution of its pixel cloud data, L2_HR_PIXC shows greater potential for applications in areas such as water resources management [49,50] and hydrological modeling [51,52]. Specifically, in refined water resource management, the spatial interpolation of L2_HR_PIXC data combined with multi-source remote sensing to construct a continuous water surface elevation raster surface and the digital elevation model (DEM) can quantify the spatial and temporal variations of lake and reservoir water storage more accurately [53]. In the hydrological model calibration, by comparing the spatial distribution of water level output from the model with the WSE of L2_HR_PIXC inversion, the data assimilation technique is used to effectively reduce the model bias and optimize the model parameters, which can significantly improve the applicability of the model in different scenarios.

6. Conclusions

This study analyzes and evaluates the accuracy as well as applicability of three scientific data products, L2_HR_PIXC, L2_HR_RiverSP, and L2_HR_LakeSP, based on the comparison of the water levels of the river, lake, and reservoir inversions on the MLRYR with the measured water levels provided by SWOT satellites during the period from August 2023 to December 2024, and the results show the following:
(1)
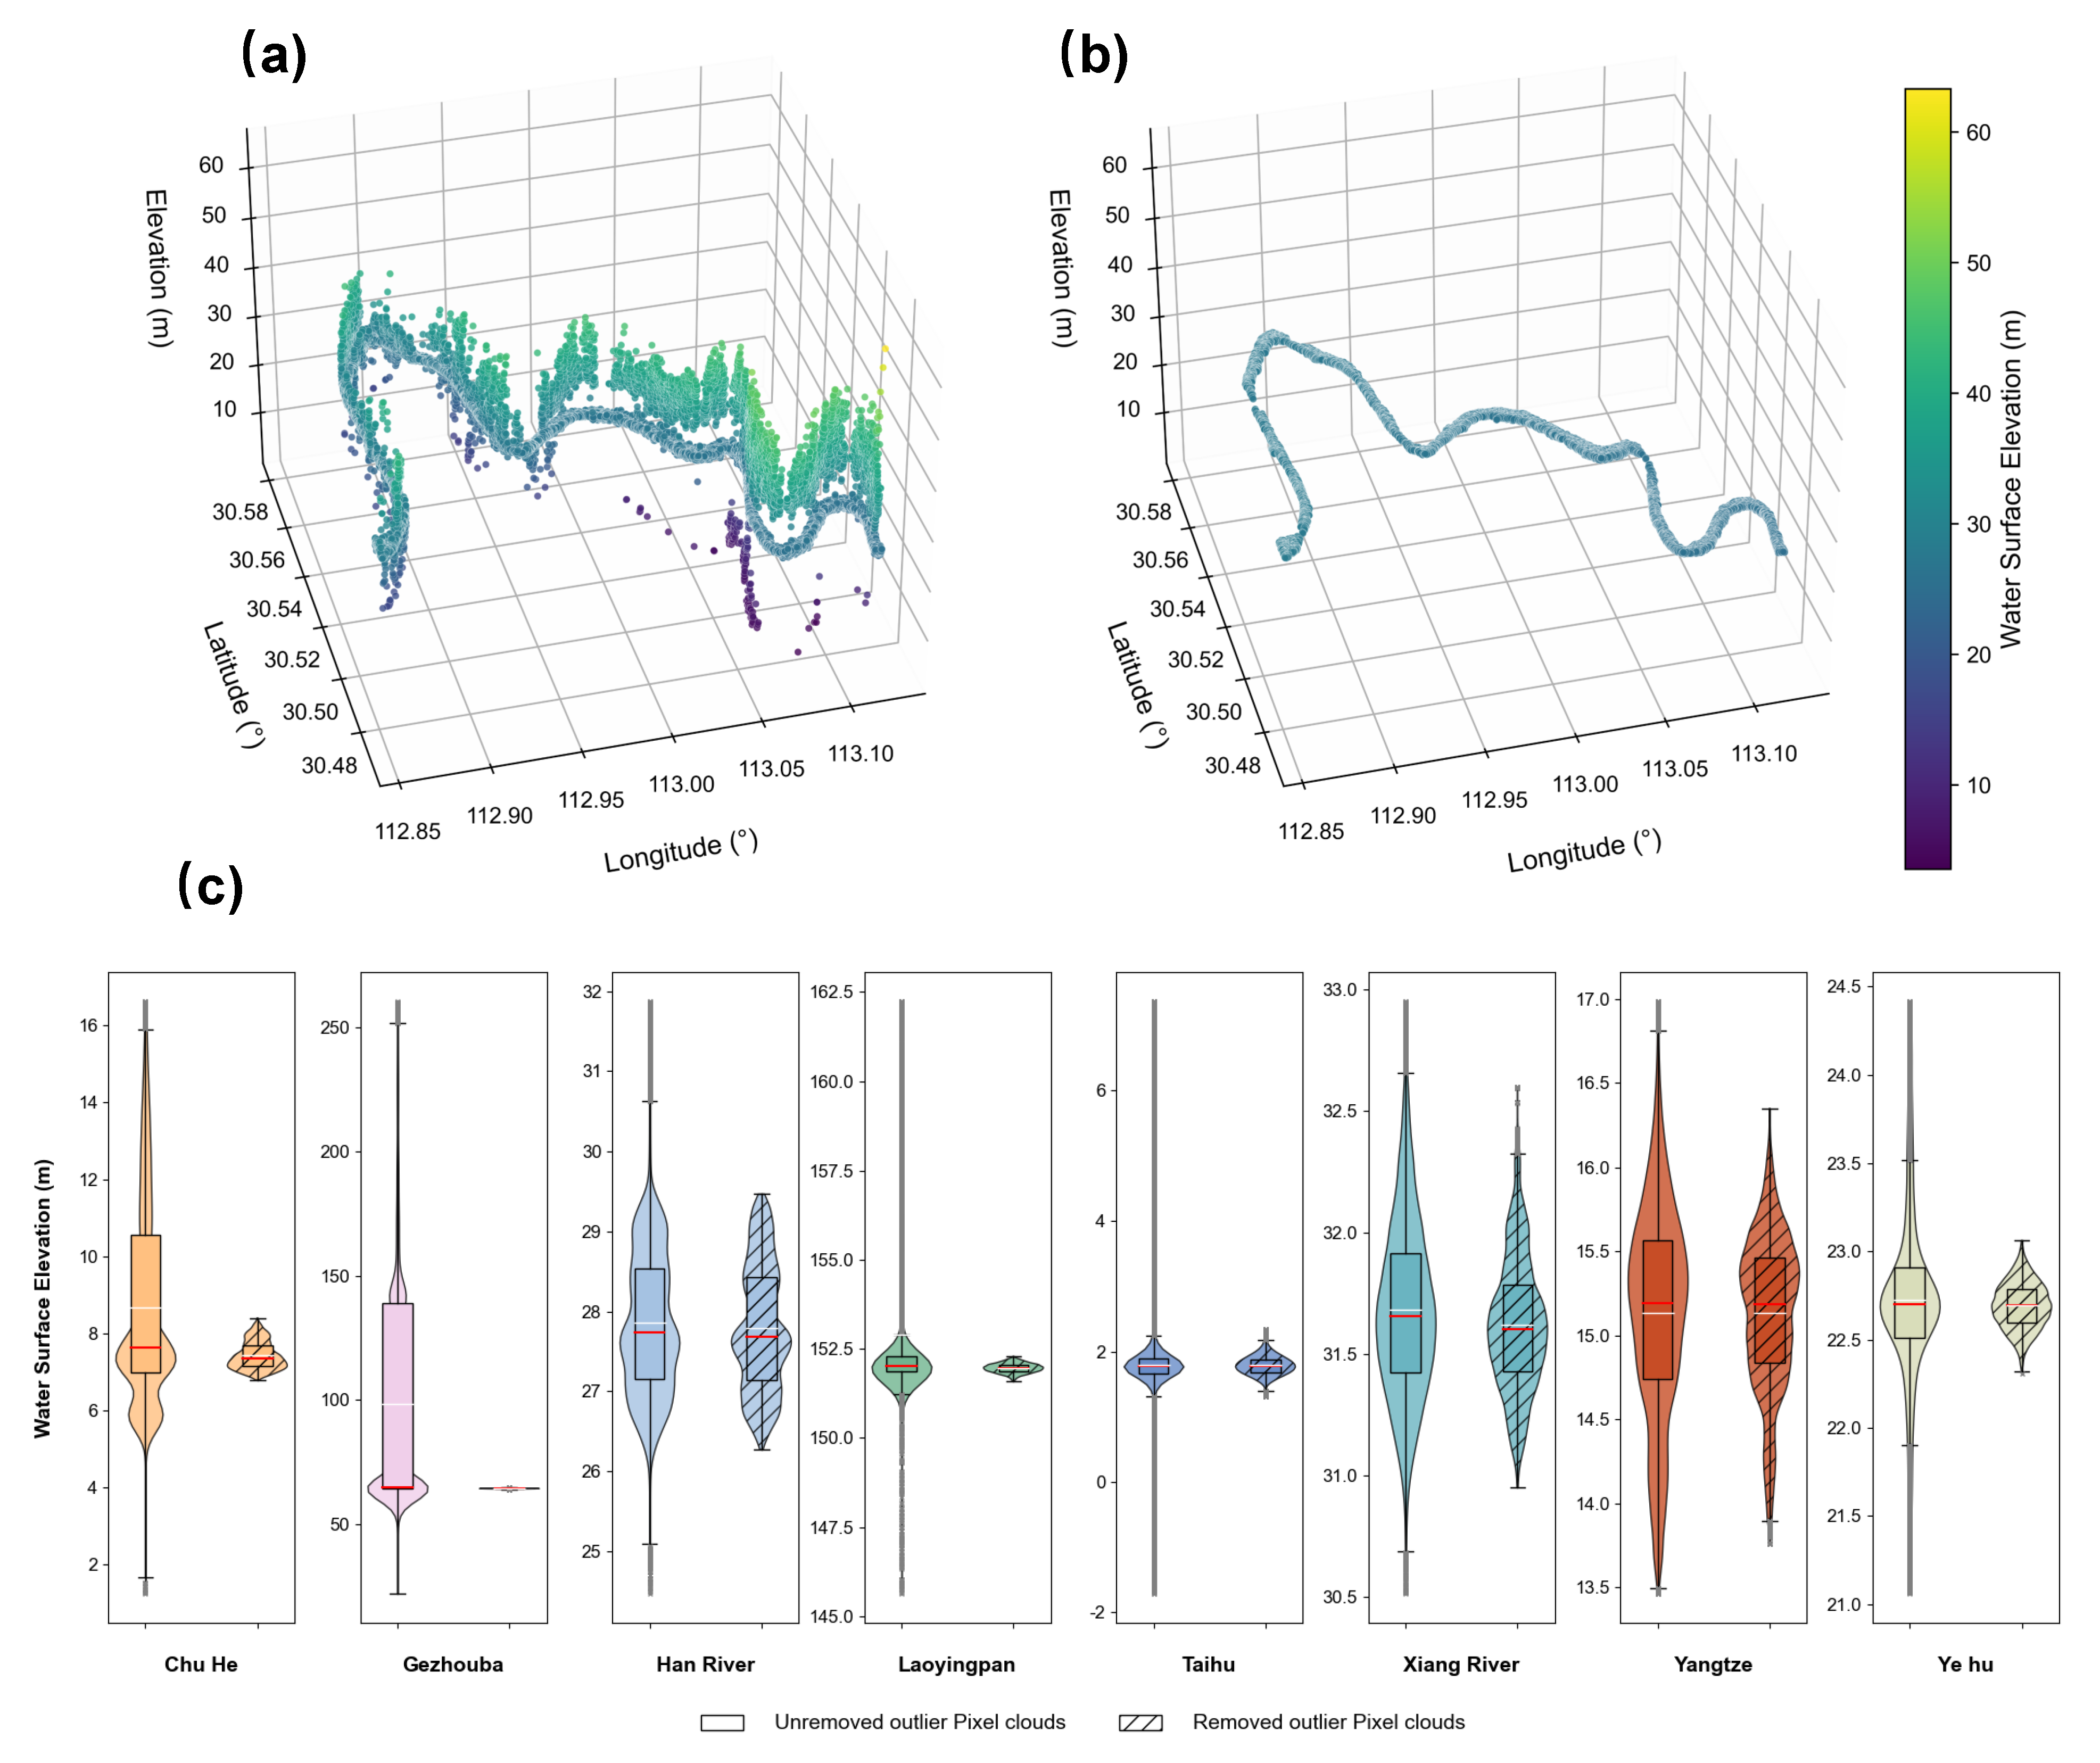
In response to spatial noise generated during the interferometric processing of the SWOT satellite, this study proposes an innovative denoising method based on the L2_HR_PIXC product, which combines multiple iterations of the IQR with the ASOR technique. Experiments in eight different regions in the middle and lower reaches of the Yangtze River show that the method can effectively remove points with uneven spatial distribution and abnormal discrete points from the pixel cloud, so that the distribution of pixel cloud elevation in each region is stable and more centralized, which significantly improves the quality of pixel cloud data.
(2)
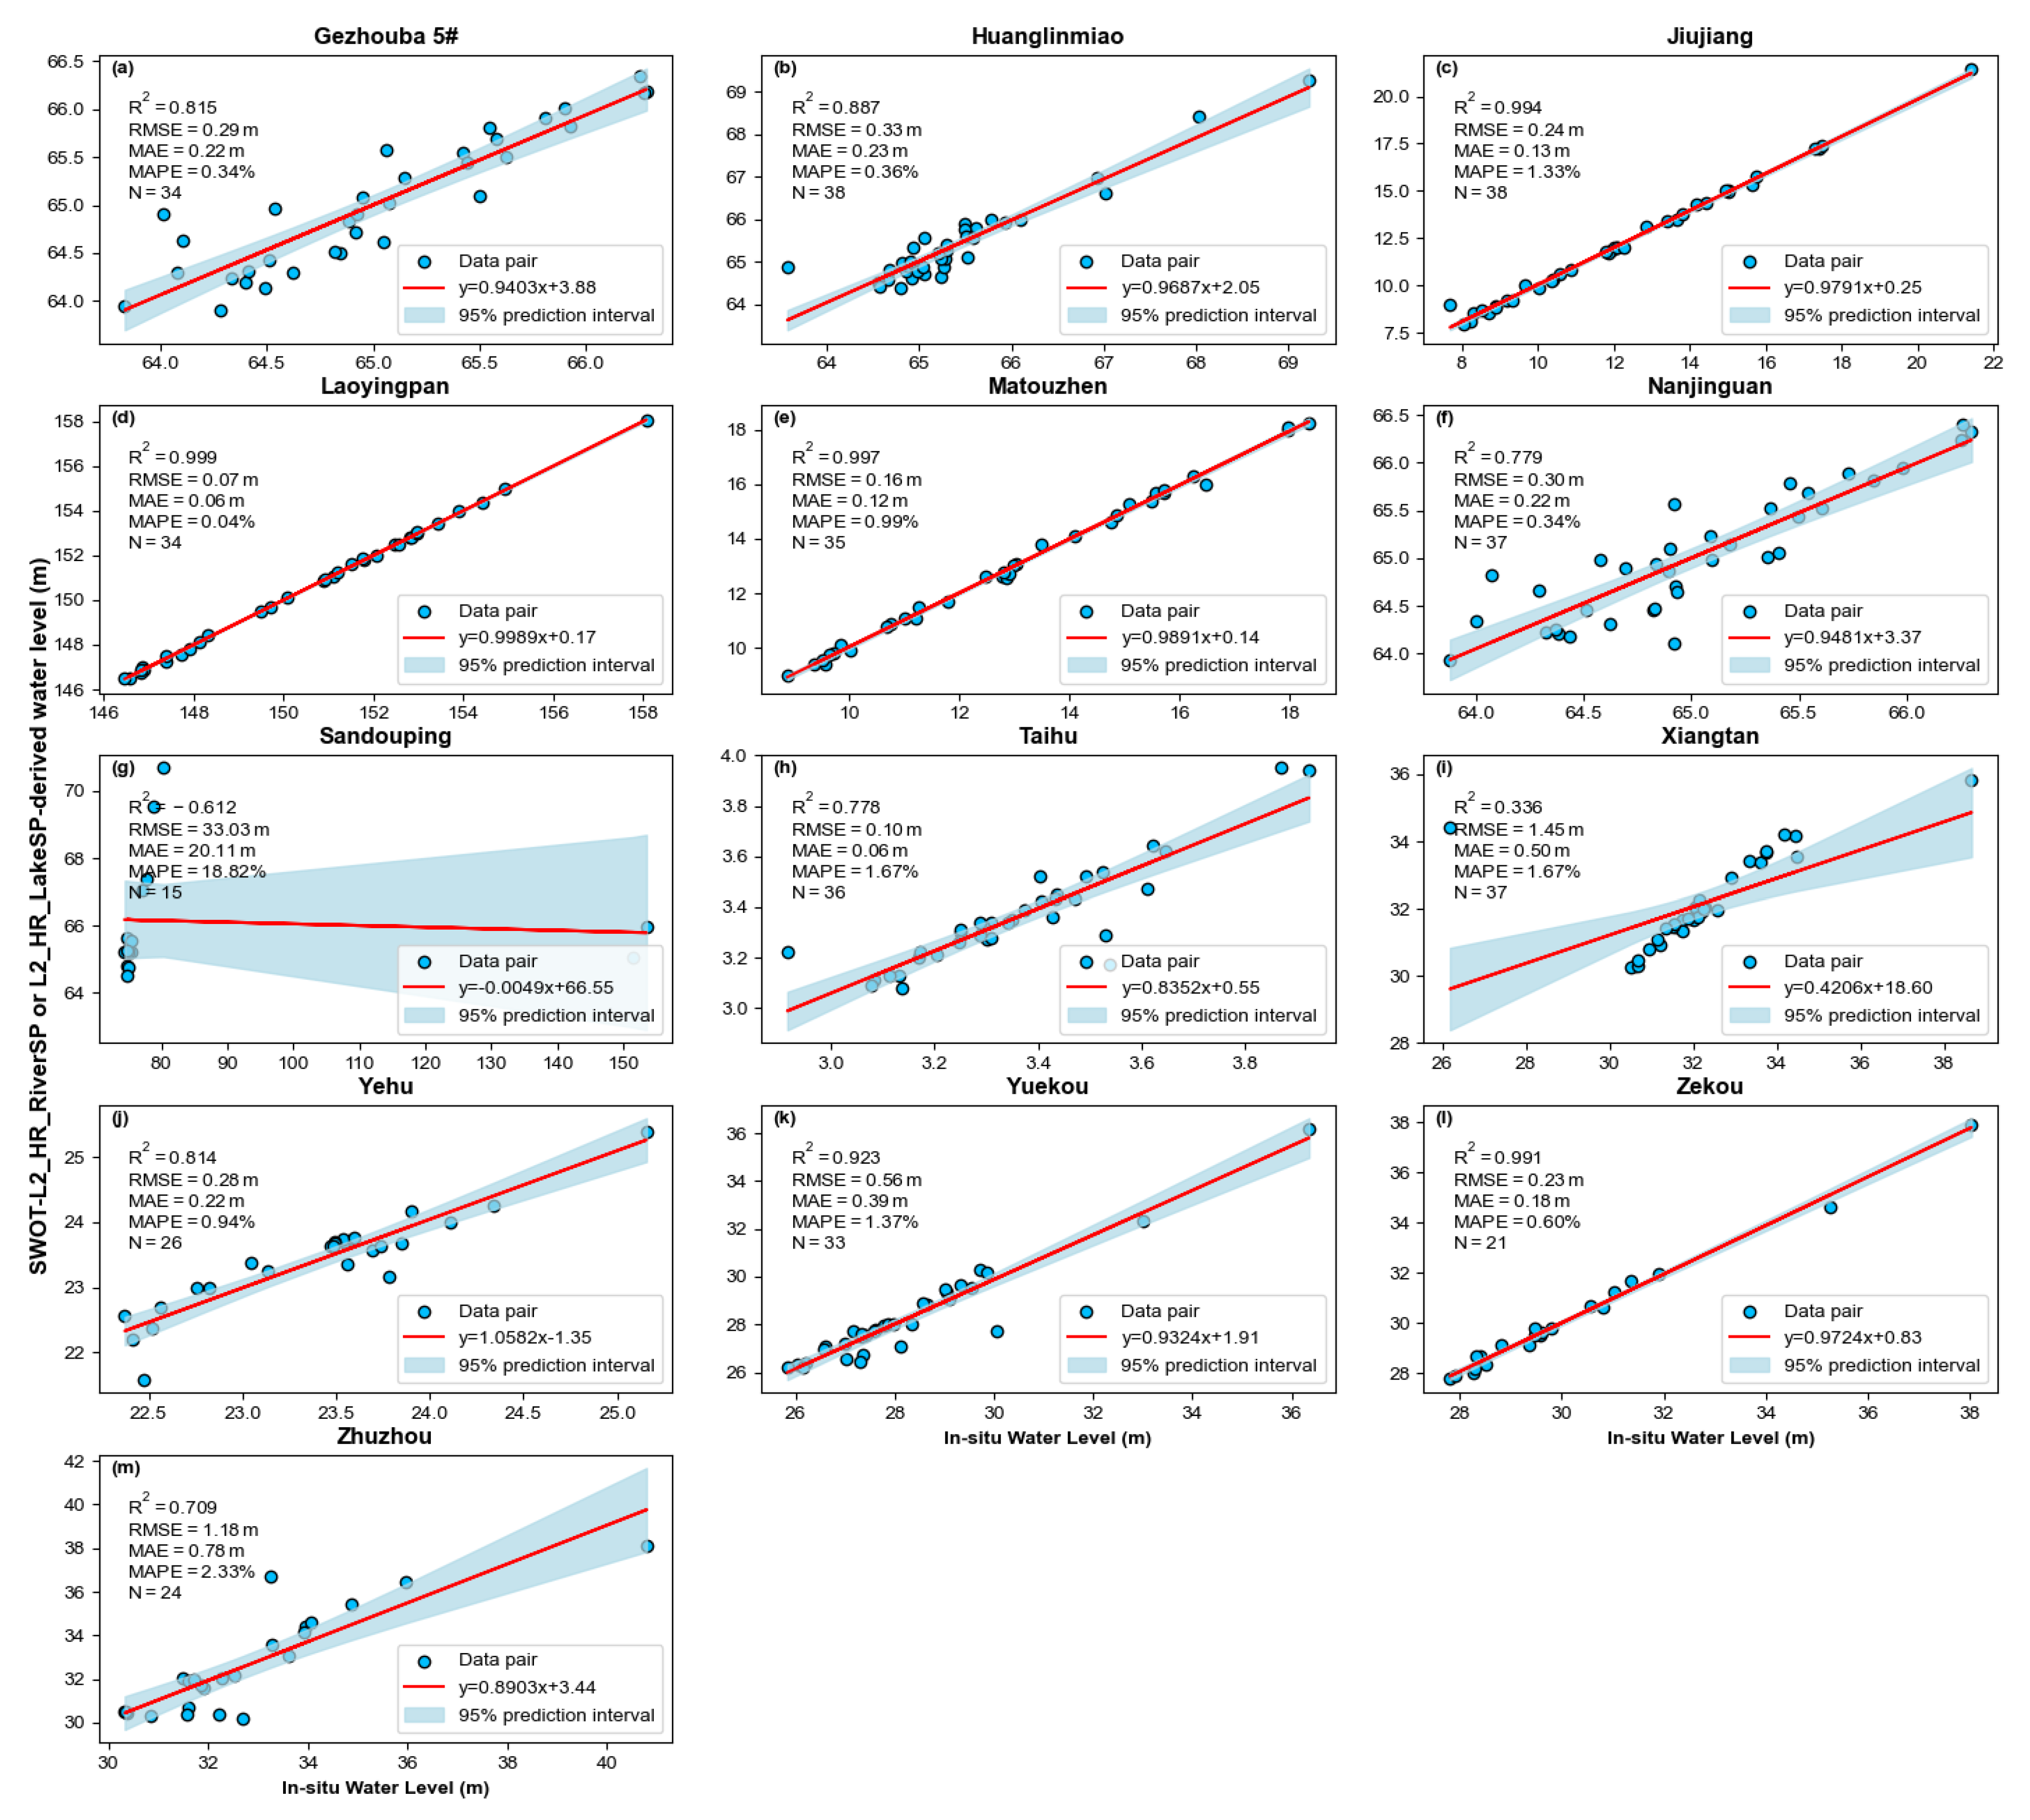
Through the comprehensive analysis of the three SWOT satellite products, it is found that, compared with the two standardized derivatives, L2_HR_RiverSP and L2_HR_LakeSP, the noise-processed L2_HR_PIXC product shows higher accuracy, higher correlation coefficients, and lower errors in inland water body water level inversion. In addition, the L2_HR_PIXC data improve the temporal resolution of water level inversion to a certain extent, which makes this product more applicable in recognizing small water bodies.
(3)
L2_HR_RiverSP and L2_HR_LakeSP can quickly obtain hydraulic parameters of inland water bodies, which can efficiently support the analysis of water level trends in inland water bodies in a given region, basin or global scale; meanwhile, L2_HR_PIXC, with the high spatial and temporal resolution of its pixel cloud data, can completely present the two-dimensional spatial distribution characteristics of inland water bodies and effectively capture details of local spatial heterogeneity such as water level gradients, which makes it more suitable for the scientific research requiring refined data and gives it greater application potential.
However, this experiment is limited by the scope of data collected and analyzed; although the three SWOT satellite products were verified to be capable of monitoring water levels in rivers and lakes in the middle and lower reaches of the Yangtze River, their applicability to high-altitude regions (e.g., glacial lakes and glaciers on the Qinghai–Tibetan Plateau) and wetlands remains to be explored.
With their high-precision two-dimensional water level monitoring and wide swath coverage capability, the SWOT satellites have shown significant advantages in the field of inland water monitoring, greatly enhancing inland water dynamic monitoring capabilities. This resource shows great research and application potential in the precise calculation of surface water storage, coupling of 2D hydrodynamic models, improvement of flood simulation accuracy, optimization of river flow inversion, etc.,which provides important data support for the promotion of global water cycle research, water disaster prevention and control, and sustainable development of water resources.

Author Contributions

Y.Z.: writing—original draft, software, methodology, investigation, formal analysis, data curation, conceptualization; J.F.: writing—review and editing, supervision, methodology, investigation, funding acquisition, formal analysis, conceptualization; Z.P.: writing—review and editing, supervision, methodology, investigation, funding acquisition, formal analysis, conceptualization; W.J.: writing—review and editing, supervision, investigation, conceptualization; P.Z.: writing—review and editing, supervision, investigation, conceptualization; Z.Q.: writing—review and editing, supervision, investigation, conceptualization. All authors have read and agreed to the published version of the manuscript.

Funding

This research was funded by the Beijing Natural Science Foundation–Fengtai Innovation Joint Fund Project under No. L241046 and by the National Natural Science Foundation of China (42301450).

Data Availability Statement

Data will be made available on request.

Acknowledgments

The authors thank the data providers for making the following data available: SWOT, Sentinel-1/2, GDW, and in situ water levels. Sentinel-1/2 data were accessed on the GEE platform (https://earthengine.google.com/). SWOT data were downloaded from the NASA Earthdata Search (https://search.earthdata.nasa.gov/). GDW data were downloaded from the Global Dam Watch (https://www.globaldamwatch.org/). In situ water level data were from the Information Center of the Ministry of Water Resources (http://xxzx.mwr.gov.cn/).

Conflicts of Interest

The authors declare that they have no known competing financial interests or personal relationships that could have appeared to influence the work reported in this paper.

References

  1. Alsdorf, D.E.; Rodríguez, E.; Lettenmaier, D.P. Measuring surface water from space. Rev. Geophys. 2007, 45, 1–24. [Google Scholar] [CrossRef]
  2. Sauer, V.B.; Turnipseed, D.P. Stage Measurement at Gaging Stations; Technical Report; US Geological Survey: Reston, VA, USA, 2010. [Google Scholar]
  3. Calmant, S.; Seyler, F. Continental surface waters from satellite altimetry. Comptes Rendus. Geosci. 2006, 338, 1113–1122. [Google Scholar] [CrossRef]
  4. Abdalla, S.; Kolahchi, A.A.; Ablain, M.; Adusumilli, S.; Bhowmick, S.A.; Alou-Font, E.; Amarouche, L.; Andersen, O.B.; Antich, H.; Aouf, L.; et al. Altimetry for the future: Building on 25 years of progress. Adv. Space Res. 2021, 68, 319–363. [Google Scholar] [CrossRef]
  5. Donlon, C.J.; Cullen, R.; Giulicchi, L.; Vuilleumier, P.; Francis, C.R.; Kuschnerus, M.; Simpson, W.; Bouridah, A.; Caleno, M.; Bertoni, R.; et al. The Copernicus Sentinel-6 mission: Enhanced continuity of satellite sea level measurements from space. Remote Sens. Environ. 2021, 258, 112395. [Google Scholar] [CrossRef]
  6. Kouraev, A.V.; Semovski, S.V.; Shimaraev, M.N.; Mognard, N.M.; Légresy, B.; Remy, F. Observations of Lake Baikal ice from satellite altimetry and radiometry. Remote Sens. Environ. 2007, 108, 240–253. [Google Scholar] [CrossRef]
  7. Guerreiro, K.; Fleury, S.; Zakharova, E.; Rémy, F.; Kouraev, A. Potential for estimation of snow depth on Arctic sea ice from CryoSat-2 and SARAL/AltiKa missions. Remote Sens. Environ. 2016, 186, 339–349. [Google Scholar] [CrossRef]
  8. Calmant, S.; Seyler, F.; Cretaux, J.F. Monitoring continental surface waters by satellite altimetry. Surv. Geophys. 2008, 29, 247–269. [Google Scholar] [CrossRef]
  9. Le Gac, S.; Boy, F.; Blumstein, D.; Lasson, L.; Picot, N. Benefits of the Open-Loop Tracking Command (OLTC): Extending conventional nadir altimetry to inland waters monitoring. Adv. Space Res. 2021, 68, 843–852. [Google Scholar] [CrossRef]
  10. Ryan, J.C.; Smith, L.C.; Cooley, S.W.; Pitcher, L.H.; Pavelsky, T.M. Global characterization of inland water reservoirs using ICESat-2 altimetry and climate reanalysis. Geophys. Res. Lett. 2020, 47, e2020GL088543. [Google Scholar] [CrossRef]
  11. Crétaux, J.F.; Birkett, C. Lake studies from satellite radar altimetry. Comptes Rendus Geosci. 2006, 338, 1098–1112. [Google Scholar] [CrossRef]
  12. Biancamaria, S.; Schaedele, T.; Blumstein, D.; Frappart, F.; Boy, F.; Desjonquères, J.D.; Pottier, C.; Blarel, F.; Niño, F. Validation of Jason-3 tracking modes over French rivers. Remote Sens. Environ. 2018, 209, 77–89. [Google Scholar] [CrossRef]
  13. Biancamaria, S.; Frappart, F.; Leleu, A.S.; Marieu, V.; Blumstein, D.; Desjonquères, J.D.; Boy, F.; Sottolichio, A.; Valle-Levinson, A. Satellite radar altimetry water elevations performance over a 200 m wide river: Evaluation over the Garonne River. Adv. Space Res. 2017, 59, 128–146. [Google Scholar] [CrossRef]
  14. Birkett, C.M. Contribution of the TOPEX NASA radar altimeter to the global monitoring of large rivers and wetlands. Water Resour. Res. 1998, 34, 1223–1239. [Google Scholar] [CrossRef]
  15. Frappart, F.; Seyler, F.; Martinez, J.M.; León, J.G.; Cazenave, A. Floodplain water storage in the Negro River basin estimated from microwave remote sensing of inundation area and water levels. Remote Sens. Environ. 2005, 99, 387–399. [Google Scholar] [CrossRef]
  16. Da Silva, J.S.; Calmant, S.; Seyler, F.; Rotunno Filho, O.C.; Cochonneau, G.; Mansur, W.J. Water levels in the Amazon basin derived from the ERS 2 and ENVISAT radar altimetry missions. Remote Sens. Environ. 2010, 114, 2160–2181. [Google Scholar] [CrossRef]
  17. Calmant, S.; Crétaux, J.F.; Rémy, F. Principles of radar satellite altimetry for application on inland waters. In Microwave Remote Sensing of Land Surface; Elsevier: Amsterdam, The Netherlands, 2016; pp. 175–218. [Google Scholar]
  18. Cooley, S.W.; Ryan, J.C.; Smith, L.C. Human alteration of global surface water storage variability. Nature 2021, 591, 78–81. [Google Scholar] [CrossRef]
  19. Brenner, A.C.; DiMarzio, J.P.; Zwally, H.J. Precision and accuracy of satellite radar and laser altimeter data over the continental ice sheets. IEEE Trans. Geosci. Remote Sens. 2007, 45, 321–331. [Google Scholar] [CrossRef]
  20. Fu, L.L.; Pavelsky, T.; Cretaux, J.F.; Morrow, R.; Farrar, J.T.; Vaze, P.; Sengenes, P.; Vinogradova-Shiffer, N.; Sylvestre-Baron, A.; Picot, N.; et al. The surface water and ocean topography mission: A breakthrough in radar remote sensing of the ocean and land surface water. Geophys. Res. Lett. 2024, 51, e2023GL107652. [Google Scholar] [CrossRef]
  21. Durand, M.; Fu, L.L.; Lettenmaier, D.P.; Alsdorf, D.E.; Rodriguez, E.; Esteban-Fernandez, D. The surface water and ocean topography mission: Observing terrestrial surface water and oceanic submesoscale eddies. Proc. IEEE 2010, 98, 766–779. [Google Scholar] [CrossRef]
  22. Frasson, R.P.d.M.; Schumann, G.J.P.; Kettner, A.J.; Brakenridge, G.R.; Krajewski, W.F. Will the surface water and ocean topography (SWOT) satellite mission observe floods? Geophys. Res. Lett. 2019, 46, 10435–10445. [Google Scholar] [CrossRef]
  23. Jinghua, X.; Shenglian, G.; Liguang, J.; Jiabo, Y.; Jun, W. Exploring the potential of SWOT for water level monitoring in the Qinghai Lake. Natl. Remote Sens. Bull. 2023, 27, 1888–1898. [Google Scholar]
  24. Grippa, M.; Rouzies, C.; Biancamaria, S.; Blumstein, D.; Cretaux, J.F.; Gal, L.; Robert, E.; Gosset, M.; Kergoat, L. Potential of SWOT for monitoring water volumes in Sahelian ponds and lakes. IEEE J. Sel. Top. Appl. Earth Obs. Remote Sens. 2019, 12, 2541–2549. [Google Scholar]
  25. Nair, A.S.; Soman, M.K.; Girish, P.; Karmakar, S.; Indu, J. Evaluating SWOT water level information using a large scale hydrology simulator: A case study over India. Adv. Space Res. 2022, 70, 1362–1374. [Google Scholar] [CrossRef]
  26. Elmer, N.J.; Hain, C.; Hossain, F.; Desroches, D.; Pottier, C. Generating proxy SWOT water surface elevations using WRF-Hydro and the CNES SWOT Hydrology Simulator. Water Resour. Res. 2020, 56, e2020WR027464. [Google Scholar]
  27. Jet Propulsion Laboratory. SWOT Product Description Document: Level 2 KaRIn High Rate Water Mask Pixel Cloud (L2_HR_PIXC) Data Product; Internal Document JPL D-56411, Revision B; Jet Propulsion Laboratory: Pasadena, CA, USA, 2023. [Google Scholar]
  28. Jet Propulsion Laboratory. SWOT Product Description Document: Level 2 KaRIn High Rate River Single Pass Vector (L2_HR_RiverSP) Data Product; Internal Document JPL D-56413, Revision B; Jet Propulsion Laboratory: Pasadena, CA, USA, 2023. [Google Scholar]
  29. Centre National d’Études Spatiales. SWOT Product Description Document: Level 2 KaRIn High Rate Lake Single Pass Vector Product (L2_HR_LakeSP); Internal Document SWOT-TN-CDM-0673-CNES, Revision C (Draft); Centre National d’Études Spatiales: Paris, France, 2024. [Google Scholar]
  30. Xu, Y.; Liu, W.; Song, J.; Yao, L.; Gu, S. Dynamic monitoring of the lake area in the middle and lower reaches of the Yangtze River using MODIS images between 2000 and 2016. IEEE J. Sel. Top. Appl. Earth Obs. Remote Sens. 2018, 11, 4690–4700. [Google Scholar] [CrossRef]
  31. Qi, Z.; Ye, Y.; Sun, L.; Yuan, C.; Cai, Y.; Xie, Y.; Cheng, G.; Zhang, P. Development of an indicator system for solar-induced chlorophyll fluorescence monitoring to enhance early warning of flash drought. Agric. Water Manag. 2025, 312, 109397. [Google Scholar]
  32. Qi, Z.; Ye, Y.; Cai, Y.; Yuan, C.; Xie, Y.; Cheng, G.; Zhang, P.; Sun, L.; Wan, H. Investigating the characteristics and drivers of slow droughts and flash droughts: A multi-temporal scale drought identification framework. Water Resour. Res. 2025, 61, e2024WR037181. [Google Scholar]
  33. Qi, Z.; Ye, Y.; Cai, Y.; Yuan, C.; Xie, Y.; Cheng, G.; Zhang, P.; Sun, L. Incorporation crisis lifecycle theory into full-stage flash drought spatio-temporal pattern identification and risk analysis. J. Hydrol. 2024, 642, 131828. [Google Scholar]
  34. Jet Propulsion Laboratory. SWOT Algorithm Theoretical Basis Document: Level 2 KaRIn High Rate Pixel Cloud (L2_HR_PIXC) Science Algorithm Software; Internal Document JPL D-105504; Jet Propulsion Laboratory: Pasadena, CA, USA, 2023. [Google Scholar]
  35. Altenau, E.H.; Pavelsky, T.M.; Durand, M.T.; Yang, X.; Frasson, R.P.d.M.; Bendezu, L. The Surface Water and Ocean Topography (SWOT) Mission River Database (SWORD): A global river network for satellite data products. Water Resour. Res. 2021, 57, e2021WR030054. [Google Scholar]
  36. Wang, J.; Pottier, C.; Cazals, C.; Battude, M.; Sheng, Y.; Song, C.; Sikder, M.S.; Yang, X.; Ke, L.; Gosset, M.; et al. The Surface Water and Ocean Topography Mission (SWOT) Prior Lake Database (PLD): Lake mask and operational auxiliaries. Authorea 2023, 279, 778–780. [Google Scholar]
  37. Jet Propulsion Laboratory. SWOT Algorithm Theoretical Basis Document: Level 2 KaRIn High Rate River Single Pass (L2_HR_RiverSP) Science Algorithm Software; Internal Document JPL D-105505; Jet Propulsion Laboratory: Pasadena, CA, USA, 2023. [Google Scholar]
  38. Gorelick, N.; Hancher, M.; Dixon, M.; Ilyushchenko, S.; Thau, D.; Moore, R. Google Earth Engine: Planetary-scale geospatial analysis for everyone. Remote Sens. Environ. 2017, 202, 18–27. [Google Scholar] [CrossRef]
  39. Jiang, W.; Kong, F.; Ding, X.; Luo, G.; Pang, Z. Water Quality Monitoring of Inland Waters Using Remote Sensing Based on GEE and Sentinel-2 Imagery. In Proceedings of the 15th International Conference on Hydroinformatics, Beijing, China, 27–31 May 2024; p. 52. [Google Scholar]
  40. Lehner, B.; Beames, P.; Mulligan, M.; Zarfl, C.; De Felice, L.; van Soesbergen, A.; Thieme, M.; Garcia de Leaniz, C.; Anand, M.; Belletti, B.; et al. The Global Dam Watch database of river barrier and reservoir information for large-scale applications. Sci. Data 2024, 11, 1069. [Google Scholar] [CrossRef] [PubMed]
  41. Wang, Y.; Long, D.; Li, X. High-temporal-resolution monitoring of reservoir water storage of the Lancang-Mekong River. Remote Sens. Environ. 2023, 292, 113575. [Google Scholar] [CrossRef]
  42. Pekel, J.F.; Cottam, A.; Gorelick, N.; Belward, A.S. High-resolution mapping of global surface water and its long-term changes. Nature 2016, 540, 418–422. [Google Scholar] [CrossRef]
  43. Yommy, A.S.; Liu, R.; Wu, S. SAR image despeckling using refined Lee filter. In Proceedings of the 2015 7th International Conference on Intelligent Human-Machine Systems and Cybernetics, Hangzhou, China, 26–27 August 2015; IEEE: Piscataway, NJ, USA, 2015; Volume 2, pp. 260–265. [Google Scholar]
  44. Jia, S.; Xue, D.; Li, C.; Zheng, J.; Li, W. Study on new method for water area information extraction based on Sentinel-1 data. Yangtze River 2019, 50, 213–217. [Google Scholar]
  45. Feyisa, G.L.; Meilby, H.; Fensholt, R.; Proud, S.R. Automated Water Extraction Index: A new technique for surface water mapping using Landsat imagery. Remote Sens. Environ. 2014, 140, 23–35. [Google Scholar] [CrossRef]
  46. Otsu, N. A threshold selection method from gray-level histograms. Automatica 1975, 11, 23–27. [Google Scholar] [CrossRef]
  47. Jet Propulsion Laboratory. SWOT Science Data Products User Handbook; Internal Document JPL D-109532; Jet Propulsion Laboratory: Pasadena, CA, USA, 2024. [Google Scholar]
  48. Yu, L.; Zhang, H.; Gong, W.; Ma, X. Validation of Mainland Water Level Elevation Products From SWOT Satellite. IEEE J. Sel. Top. Appl. Earth Obs. Remote Sens. 2024, 17, 13494–13505. [Google Scholar] [CrossRef]
  49. Vinogradova, N.T.; Pavelsky, T.M.; Farrar, J.T.; Hossain, F.; Fu, L.L. A new look at Earth’s water and energy with SWOT. Nat. Water 2025, 3, 27–37. [Google Scholar] [CrossRef]
  50. Getirana, A.; Kumar, S.; Bates, P.; Boone, A.; Lettenmaier, D.; Munier, S. The SWOT mission will reshape our understanding of the global terrestrial water cycle. Nat. Water 2024, 2, 1139–1142. [Google Scholar] [CrossRef]
  51. Yao, J.; Xu, N.; Wang, M.; Gong, P.; Lu, H.; Cao, Y.; Tang, X.; Mo, F. Promoting global surface water monitoring research with the SWOT satellite. Innov. Geosci. 2024, 2, 100099. [Google Scholar] [CrossRef]
  52. Patidar, G.; Paris, A.; Indu, J.; Karmakar, S. How can SWOT derived water surface elevations help calibrating a distributed hydrological model? J. Hydrol. 2025, 56, 132968. [Google Scholar] [CrossRef]
  53. Yoon, Y.; Durand, M.; Merry, C.J.; Rodriguez, E. Improving temporal coverage of the SWOT mission using spatiotemporal kriging. IEEE J. Sel. Top. Appl. Earth Obs. Remote Sens. 2013, 6, 1719–1729. [Google Scholar] [CrossRef]
Figure 1. The spatial distribution of study areas and related characteristics in the middle and lower reaches of the Yangtze River. The gray shaded regions indicate the coverage areas of SWOT satellite passes over the study region, and the red rectangles delineate the locations of the selected study areas. (ah) encompass different water body types, including the main stream and major tributaries of the Yangtze River, reservoirs, and lakes. Red triangles represent in situ observation stations, and blue water bodies denote the extents of the study areas.
Remotesensing 17 01330 g001
Figure 2. Flowchart of the methodology developed in this study. Red, yellow, green, and blue squares represent input data, key algorithms, important variables, and results of the data flow, respectively.
Remotesensing 17 01330 g002
Figure 3. (am) Comparison of water level trends between quality-screened WSE derived from L2_HR_RiverSP (Node) or L2_HR_LakeSP (Obs) and in situ measured water levels. Orange curves represent in situ measurements, and blue curves indicate quality-screened satellite-derived WSE values.
Remotesensing 17 01330 g003
Figure 4. Comparison of spatial pixel cloud distributions before and after outlier filtering, and statistical analysis of elevation characteristics. (a) Pixel cloud spatial distribution in the Han River before outlier removal. (b) Pixel cloud spatial distribution in the Han River after outlier removal. (c) Data distribution range of pixel clouds with and without outlier removed. Violin and box plots represent the elevation distribution ranges, where different colors indicate individual study areas. the red and white centerline shows the median and mean values, the whiskers denote the full range (min and max), and box limits indicate the 25th and 75th percentiles.
Remotesensing 17 01330 g004
Figure 5. (am) Correlation analysis between quality-screened water levels derived from L2_HR_RiverSP or L2_HR_LakeSP products and in situ measured water levels.
Remotesensing 17 01330 g005
Figure 6. (ao) Correlation analysis between water levels derived from the L2_HR_PIXC product and in situ measured water levels.
Remotesensing 17 01330 g006
Table 1. Descriptions of SWOT satellite products.
LevelProductSub-ProductFormatDescription
L2L2_HR_PIXC——NetCDFWater mask pixel cloud dataset containing geolocated heights, classification parameters, backscatter coefficients, geophysical fields, and quality flags
L2_HR_RiverSPNodeShapefileNodes spaced approximately 200 m apart, extracted from the SWOT River Database (SWORD_V16)
ReachShapefileRiver reaches (∼10 km segments) derived from the SWORD_V16 database; [35]
ObsShapefileLakes that are both included in the Prior Lake Database (PLD) [36] and observed by the SWOT satellite
L2_HR_LakeSPPriorShapefileComposite lakes inventory encompassing PLD-archived and SWOT-observed waterbodies, with null values assigned to PLD lakes lacking SWOT observations
UnassignedShapefileSWOT-observed lakes unrecorded in the PLD database
Table 2. List of remote sensing and other data sources used in the study.
DatasetVariableSpatial
Resolution
Temporal
Resolution
Time SpanPurposeData Source
SWOTL2_HR_PIXC50 m21 days2023.08-2024.12WSE retrievalNASA
SWOTL2_HR_RiverSP21 days2023.08-2024.12WSE retrievalNASA
SWOTL2_HR_LakeSP21 days2023.08-2024.12WSE retrievalNASA
Sentinel-1AVV/VH10 m12 days2023.08-2024.12SWE retrievalGEE
Sentinel-2TOA reflectance10 m5 days2023.08-2024.12SWE retrievalGEE
GDW-V1Vector boundaries2024SWE retrievalGDW
In situ water levelWater level1 day2023.08–2024.12Water level validationIn situ stations
Table 3. Comparison of SWOT L2_HR_RiverSP/L2_HR_LakeSP and L2_HR_PIXC products.
Study AreaIn Situ StationL2_HR_RiverSP/L2_HR_LakeSPL2_HR_PIXC
R 2 RMSEMAEMAPENumber R 2 RMSEMAEMAPENumber
GezhoubaGezhouba 5#0.8150.290.220.34340.8700.240.190.3039
Huanglinmiao0.8870.330.230.36380.9100.280.220.3440
Nanjinguan0.7790.300.220.34370.8720.230.180.2840
Sandoupoing−0.61233.0320.1118.82150.9590.300.230.3521
YangtzeMatouzhen0.9970.160.120.99350.9960.220.120.8945
Jiujiang0.9940.240.131.33380.9990.100.080.6443
Xiang RiverXiangtan0.3361.450.501.67370.9590.210.140.4338
Zhuzhou0.7091.180.782.33240.8950.470.310.9642
ChuheXiaoqiao0.9090.190.131.8211
Liuhe0.9040.090.070.9735
Han RiverYuekou0.9230.560.391.37330.9850.240.160.5640
Zekou0.9910.230.180.60210.9920.170.130.4443
YehuYehu0.8140.280.220.94260.8860.260.210.943
LaoyingpanLaoyingpan0.9990.070.060.04340.9960.230.110.0844
TaihuTaihu0.7780.100.061.67360.9290.060.041.1343
The bold numbers in the table represent the superior accuracy indicators.
Disclaimer/Publisher’s Note: The statements, opinions and data contained in all publications are solely those of the individual author(s) and contributor(s) and not of MDPI and/or the editor(s). MDPI and/or the editor(s) disclaim responsibility for any injury to people or property resulting from any ideas, methods, instructions or products referred to in the content.

