Article

Spatio-Temporal Patterns and Drivers of the Urban Heat Island Effect in Arid and Semi-Arid Regions of Northern China

1
College of Earth and Environmental Sciences, Lanzhou University, Lanzhou 730000, China
2
Center for Remote Sensing of Ecological Environments in Cold and Arid Regions, Lanzhou University, Lanzhou 730000, China
3
School of Civil Engineering, Lanzhou University of Technology, Lanzhou 730050, China
*
Author to whom correspondence should be addressed.
Remote Sens. 2025, 17(8), 1339; https://doi.org/10.3390/rs17081339
Submission received: 21 February 2025 / Revised: 30 March 2025 / Accepted: 7 April 2025 / Published: 9 April 2025

Abstract

:
Investigating the urban heat island (UHI) effect and its driving factors is crucial for supporting future climate mitigation actions and human adaptation strategies. Due to the unique climatic characteristics and vulnerable ecological environment of arid and semi-arid regions, it is valuable to detect the UHI effect in cities in these regions, which have not been fully explored yet. Utilizing moderate-resolution imaging spectroradiometer (MODIS) land surface temperature (LST) data from 2010 to 2020, this study quantified the summer, winter, and annual diurnal mean surface urban heat island intensity (SUHII) of 30 cities in the arid and semi-arid regions of northern China and comprehensively investigated the spatio-temporal patterns and drivers of UHI. The results showed that the annual mean daytime SUHII had a significant decreasing trend, and the nighttime SUHII had an increasing trend for these cities between 2010 and 2020. The nighttime SUHII was stronger than the daytime SUHII, and some cities exhibited surface urban cool island (SUCI) phenomena during daytime, especially in winter. It was also found that cities at higher latitudes experienced higher daytime SUHII throughout the year, and that it was more pronounced in winter. The driving factor analysis revealed that daytime SUHII was primarily influenced by the urban area size (UAS), total precipitation (TP), and the differences in white sky albedo (ΔWSA), enhanced vegetation index (ΔEVI), and normalized difference moisture index (ΔNDMI) between urban and suburban areas. Nighttime SUHII was mainly correlated with ΔWSA, ΔEVI, ΔNDMI, and the differences in elevation (ΔDEM) between urban and suburban areas. This indicated that the background climate was a potential driver for the spatial pattern of UHI in this region. As for the nightlight difference between urban and sub-urban areas (ΔNTL), no correlation was observed with neither daytime SUHII nor nighttime SUHII. These findings are promising in providing theoretical support and scientific guidance for formulating sustainable development strategies and mitigating the UHI effects of cities in the arid and semi-arid regions.

Graphical Abstract

1. Introduction

Over past decades, urbanization has rapidly advanced in many developing countries, accompanied by widespread land use and land cover changes [1]. This process contributes to the rise in urban temperature and intensifies urban heat island (UHI) effect by altering urban surface properties, increasing anthropogenic heat sources, aggravating air pollution, and reducing vegetation and green spaces [2,3]. The UHI effect refers to the phenomenon that the atmospheric or land surface temperature (LST) in urban areas is higher than that of the surrounding environment [4]. It not only deteriorates air quality and the ecological environment [5,6] but also increases the risk of disasters, such as extreme heat and heat waves, heavy rainfall, flooding, and landslides [7], and has significant adverse impacts on human health and well-being [6,8]. Therefore, a comprehensive investigation of the UHI effect and its underlying driving mechanisms is crucial for ensuring future well-being and promoting the sustainable and high-quality development of human society [9].
The indicators of the UHI effect are differentiated into atmospheric or air UHI and surface UHI (SUHI) [10]. Atmospheric UHI is defined as the air temperature difference between urban and non-urban areas [11], whereas SUHI represents the radiative temperature difference between urban and non-urban surfaces [12]. Atmospheric UHI encompasses canopy layer heat island (CLHI) and boundary layer heat island (BLHI). The CLHI is primarily measured by instruments in fixed meteorological stations or in situ sensors mounted on vehicles [13]. BLHI is usually acquired by observations from more specialized equipment, such as towers, radiosondes, and aircraft [14]. Due to the limited distribution of meteorological stations, time-consuming and expensive development and deployment of related specialized equipment [15], the measurements of atmospheric UHI often fail to provide sufficient spatial details for urban land use planning and climate change research [16]. In comparison, SUHI intensity (SUHII) involves calculating the LST difference between urban areas and suburban or rural areas by utilizing LST data obtained from satellite observations [4,17,18]. Given the availability of remote sensing products and their extensive spatial coverage, SUHII is used as the fundamental means for UHI studies [16]. LSTs derived from Landsat TM/ETM+/TIRS and Terra/Aqua Moderate Resolution Imaging Spectroradiometer (MODIS) play primary roles in SUHI studies [12]. Although Landsat images facilitate fine-scale studies [19,20], the 16-day over-pass period and lack of nighttime observations impose limitations on temporal SUHI research. In comparison, MODIS data are utilized for regional and global UHI studies due to their extensive spatial coverage, four daily observations, and availability of day and night LST products [21,22].
The UHI effect, as a widespread phenomenon, is significantly influenced by geographic features, climatic conditions, and seasonal variations, which results in pronounced spatio-temporal heterogeneity [2]. Numerous studies have investigated the spatio-temporal variability of SUHII and its driving mechanisms at regional and global scales. For example, Peng et al. (2012) analyzed diurnal and seasonal variations in SUHII for 419 major cities worldwide using MODIS data [18]. Their findings indicate that the daytime SUHII is significantly higher than nighttime SUHII. Furthermore, nighttime SUHII is positively correlated with differences in albedo and nocturnal lighting between urban and suburban areas, whereas daytime SUHII is negatively correlated with differences in vegetation cover. Dewan et al. (2021) examined five major cities in Bangladesh and found that larger cities (such as Dhaka and Chittagong) exhibited higher annual SUHII compared to smaller cities, with four cities showing an increasing trend in SUHII during daytime and one city displaying a decreasing trend in SUHII at night [17]. Additionally, Yao et al. (2017) conducted a systematic analysis of interannual variations in SUHII for 31 cities in China during the period from 2001 to 2015 [23]. The results reveal that in most cities the daytime SUHII in both summer and winter is negatively correlated with the mean air temperature, while albedo plays a role in modulating winter daytime SUHII. Although these studies provide valuable insights into the spatio-temporal variations in SUHII, most have primarily focused on large cities or economically developed regions. Few regional studies have addressed SUHII in arid and semi-arid regions, and only a limited number of investigations concentrated on specific area or cities, revealing that these regions exhibited unique spatio-temporal features of SUHI [24,25]. For cities in arid and semi-arid regions, particularly those nestled in oases, SUHI presents distinctive features compared to those of cities located in humid areas [4,26]. Some cities show relatively small SUHII and even the occurrence of surface urban cool island (SUCI) phenomena during daytime [24,25,27], which means that urban areas are cooler than their surrounding non-urban areas. For example, Chen et al. (2023) found that the urban agglomerations in Inner Mongolia of China exhibited the SUCI effect during daytime and the SUHI effect at night [24]. However, this study only discussed the response of LST to land use changes without exploring the underlying driving factors. Rasul et al. (2016) identified the SUCI phenomenon in city of Erbil and highlighted that spring vegetation growth had the most significant impact on LST [25]. Any strategy aiming at mitigating or adapting to the UHI effect should fully consider the specific conditions within these regions. In addition to previous studies focusing on individual cities or specific regions, studies of SUHI (SUCI) effects in arid and semi-arid regions from a macroscopic and comprehensive perspective are necessary [25,28,29], including the identification and clarification of UHI patterns across these regions. Additionally, discussions on the spatio-temporal variations and potential driving mechanisms of SUHI in these regions are insufficient [28,30], which is a non-negligible gap in the comprehensive understanding of UHI. Consequently, it is vital to investigate the spatio-temporal characteristics and driving factors of SUHI in arid and semi-arid regions from a regional perspective.
Since the 1980s, China has experienced a rapid urbanization, in which the UHI effect caused severe temperature disturbances [31,32,33]. As a result, it serves as an ideal case study of the UHI effect. Previous studies primarily focus on the UHI effect in the cities of eastern China, such as Shanghai [34], Hangzhou [35] or provincial capitals [4], as well as urban agglomerations in the economically developed areas like the Yangtze River Delta [36,37], Beijing–Tianjin–Hebei [38,39], and the Greater Bay Area [40]. In contrast, studies on cities in the arid and semi-arid regions of northern China remain scarce. Compared with the developed eastern regions, cities in northern China are generally smaller in size and exhibit lower level of economic development, with most being built in oases surrounded by deserts or barren lands. Moreover, from the perspective of climate, most areas in northern China belong to arid and semi-arid regions, facing severe environmental challenges such as water scarcity and land desertification due to the presence of several deserts and their distance from the ocean. These unique natural conditions not only increase the vulnerability of their ecological environments, but they may also lead to more severe negative impacts caused by their distinctive UHI characteristics associated with the urbanization process in this region. Therefore, an in-depth study on the spatio-temporal patterns of SUHI and the driving factors in these cities is crucial for promoting their ecological environment and ensuring sustainable development.
Zhou et al. (2014) provided a comprehensive discussion on the driving mechanisms of SUHI in 32 major cities across China, in which capital cities of four provinces in the northern China (i.e., Urumqi, Lanzhou, Yinchuan, and Hohhot) were included [4]. Though there were a number of possible driving forces of SUHII spatial variability, it mainly focused on eight biophysical and anthropogenic factors in analyzing the driving mechanisms. However, it has been shown that urban morphology and soil moisture factors impose influence on SUHI [41,42]. For smaller cities in arid and semi-arid regions, water scarcity and urban morphology may also play a significant role in variations in UHI intensity. Therefore, based on the eight indicators which are discussed in previous studies, our research further considered urban morphology and soil moisture indicators in exploring the driving forces of SUHI in cities in the arid and semi-arid regions of northern China.
By selecting 30 cities with high urbanization rates in the arid and semi-arid regions of northern China, this study investigated the spatial and temporal characteristics of SUHI in these cities as well as the driving mechanisms from 2010 to 2020. Using MODIS LST data, the study calculated the average daytime and nighttime SUHIIs for summer, winter, and annual scale, based on which the diurnal SUHII amplitude (DSA) and seasonal SUHII amplitude (SSA) were also calculated. By using the Mann–Kendall trend test, Theil–Sen slope estimation method, and Pearson correlation analysis, the spatial and temporal patterns of SUHII were analyzed. The relationships between ten possible driving factors and SUHII were revealed by using Pearson correlation analysis and multiple stepwise linear regression methods, and the explanatory power of each factor on SUHII variations was also quantified.

2. Materials and Methods
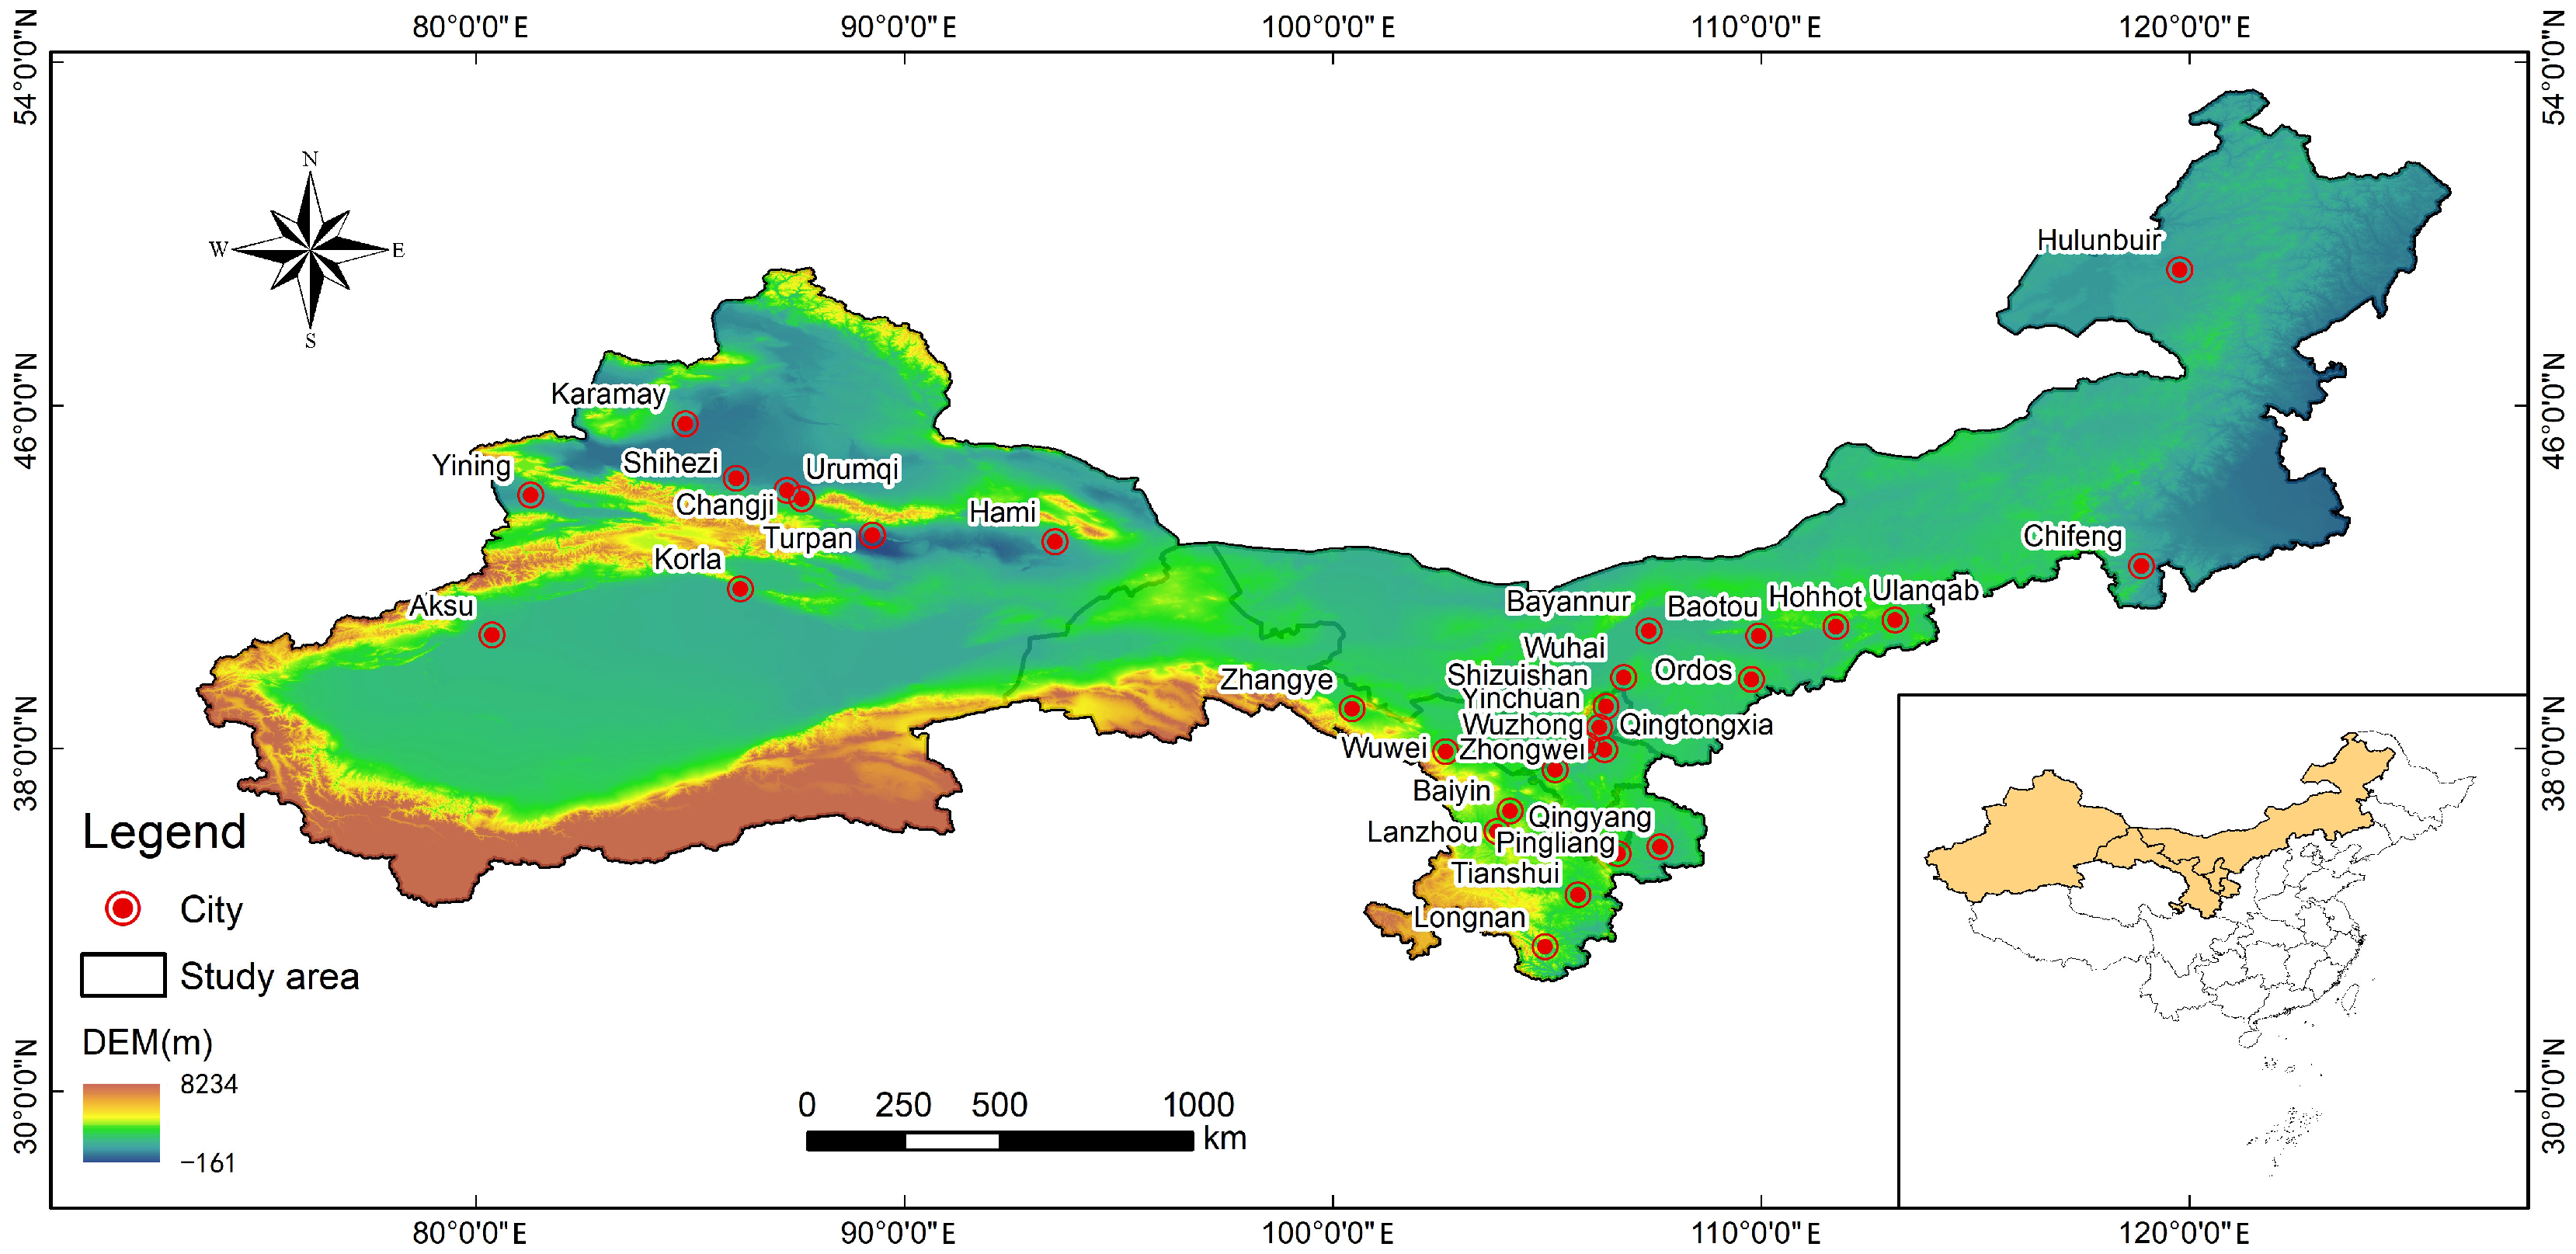
2.1. Study Area

The arid and semi-arid regions of northern China are one of nine major agricultural divisions in China, including the Inner Mongolia Autonomous Region, Gansu Province, Ningxia Hui Autonomous Region, and Xinjiang Uyghur Autonomous Region. This study selects a total of 30 cities across the four regions (Figure 1): eight cities in the Inner Mongolia Autonomous Region, including Hohhot, Baotou, Ordos, Bayannur, Chifeng, Hulunbuir, Wuhai, and Ulanqab; eight cities in the Gansu Province, including Lanzhou, Baiyin, Longnan, Pingliang, Qingyang, Tianshui, Wuwei, and Zhangye; five cities in the Ningxia Hui Autonomous Region, including Qingtongxia, Shizuishan, Wuzhong, Yinchuan, and Zhongwei; nine cities in the Xinjiang Uyghur Autonomous Region, including Aksu, Changji, Hami, Karamay, Korla, Shihezi, Turpan, Urumqi, and Yining.

2.2. Materials

In this study, SUHII is derived from MODIS 8-day composite LST product MYD11A2 (version 6.1) with a spatial resolution of 1 km. For this product, LSTs are retrieved from Aqua MODIS observations acquired at local times of 13:30 and 1:30, using the generalized split-window algorithm [43]. Considering Aqua MODIS data are closer to approximate daily maximum and minimum LST values than Terra data [44], daytime and nighttime SUHII would be better estimated by Aqua data. This product has been widely used in studies of SUHI at different scales [4,18,45]. In the pixel selection process, we utilized the product’s 8-bit binary Quality Control (QC) data. The procedure consists of two main steps: first, converting the QC values from binary to decimal and excluding pixels with QC values of 2 and 3, which indicate areas affected by cloud cover or other retrieval issues; second, applying a QC threshold of 127 (pixels with LST error ≤ 2 K are preserved) to eliminate low-quality pixels. Then, the LSTs at both daytime and nighttime with high-quality from 2010 to 2020 were used to quantify the average LST differences between urban and suburban areas, thereby determining SUHII.
The China land cover dataset (CLCD) is used in this study. It has a spatial resolution of 30 m and covers the period from 1985 to 2022 [46]. The third-party evaluation on 5131 testing samples showed that the overall accuracy of the CLCD outperformed the accuracy of other products, including MCD12Q1, ESACCI_LC, FROM_GLC, and GlobeLand30.
To investigate the drivers of the UHI effect, we carefully selected ten indicators referred to in previous studies that may have significant impacts on SUHI in arid and semi-arid regions [4,18,24]. They are enhanced vegetation index (EVI), digital elevation model (DEM), white sky albedo (WSA), normalized difference moisture index (NDMI), nighttime light (NTL), build-up intensity (BI), urban area size (UAS), fractal dimension (FD), mean air temperature (MT), and total precipitation (TP), as listed in Table 1. EVI derived from the MYD13A2 product (Version 6.1) is used to indicate vegetation activity, since it is more sensitive to dense vegetation than the normalized difference vegetation index (NDVI) and is prone to responding to slight variations in vegetation [47]. Here, ΔEVI is the difference in EVI between urban and suburban areas. As the indicator of terrain, DEM provided by the Shuttle Radar Topography Mission (SRTM) products from the National Aeronautics and Space Administration (NASA) is used, which is accessible via (http://earthexplorer.usgs.gov/). Compared to the Global Multi-resolution Terrain Elevation Data 2010 (GMTED2010) and the Advanced Spaceborne Thermal Emission and Reflection Radiometer (ASTER) elevation data, SRTM DEM exhibits superior vertical accuracy, with the absolute vertical precision of 9 m (at 90% confidence level) or better [48]. ΔDEM represents the difference in DEM between urban and suburban areas. Surface albedo is acquired from the MCD43A3 product (version 6.1), which provides data including black sky albedo (BSA) and WSA. It has been reported that BSA and WSA are linearly correlated, and their impacts on SUHI are similar; therefore, only WSA is used in the study [18]. Here, ΔWSA denotes the difference in WSA between urban and suburban areas. NTL data originates from the annual DMSP-OLS-like dataset for China, released by Wu et al. (2021) [49]. It is an improved and long-term sequential dataset, obtained by combining DMSP-OLS data from 1992 to 2013 with SNPP-VIIRS data between 2012 and 2023. We used NTL to represent the anthropogenic heat release, and ΔNTL indicates the difference in NTL between urban and suburban areas. The BI data are derived from land cover data by utilizing the 1 km × 1 km moving window approach to calculate the percentage of area of built-up land to the total area. ΔBI represents the difference in BI between urban and suburban areas. UAS is derived from an urban area of each city extracted from land cover data. MT and TP are the mean values of the air temperature and total precipitation, respectively, originating from the observations of meteorological stations provided by the National Meteorological Science Data Center (http://data.cma.cn). FD is used as an indicator to characterize urban morphology. Based on the urban boundaries of the cites extracted from the CLCD land cover data, we applied the box-counting method to capture the spatial division of urban areas, in which a square grid with side length r was used to cover the target region, and the number of grids N(r) covering the urban area was counted. Based on the relationship N(r)~r−FD, FD, representing the fractal dimension, was calculated. To improve computational accuracy, this study adopts a dense sampling strategy in the selection of grid sizes. With increase in r, it should be ensured that sufficient samples are available at each scale and eliminate instances of duplicate counting, thereby minimizing the bias introduced by discretization. Subsequently, linear regression between ln N(r) and ln r is performed, and the absolute value of the slope represents the FD value [42]. NDMI is always used to represent soil moisture and is employed to describe the moisture content in the upper soil layer (up to a few inches) of the Earth’s surface [41]. It is calculated using the reflectance values of the Near-Infrared (NIR) and Short-Wave Infrared (SWIR) bands from the MOD09A1 (version 6.1) product (Equation (1)). The formula is shown as follows:
NDMI = NIR SWIR NIR + SWIR
where NIR denotes the reflectance of the near-infrared band, and SWIR represents the reflectance of the short-wave infrared band. ΔNDMI refers to the difference in NDMI between urban and suburban areas.

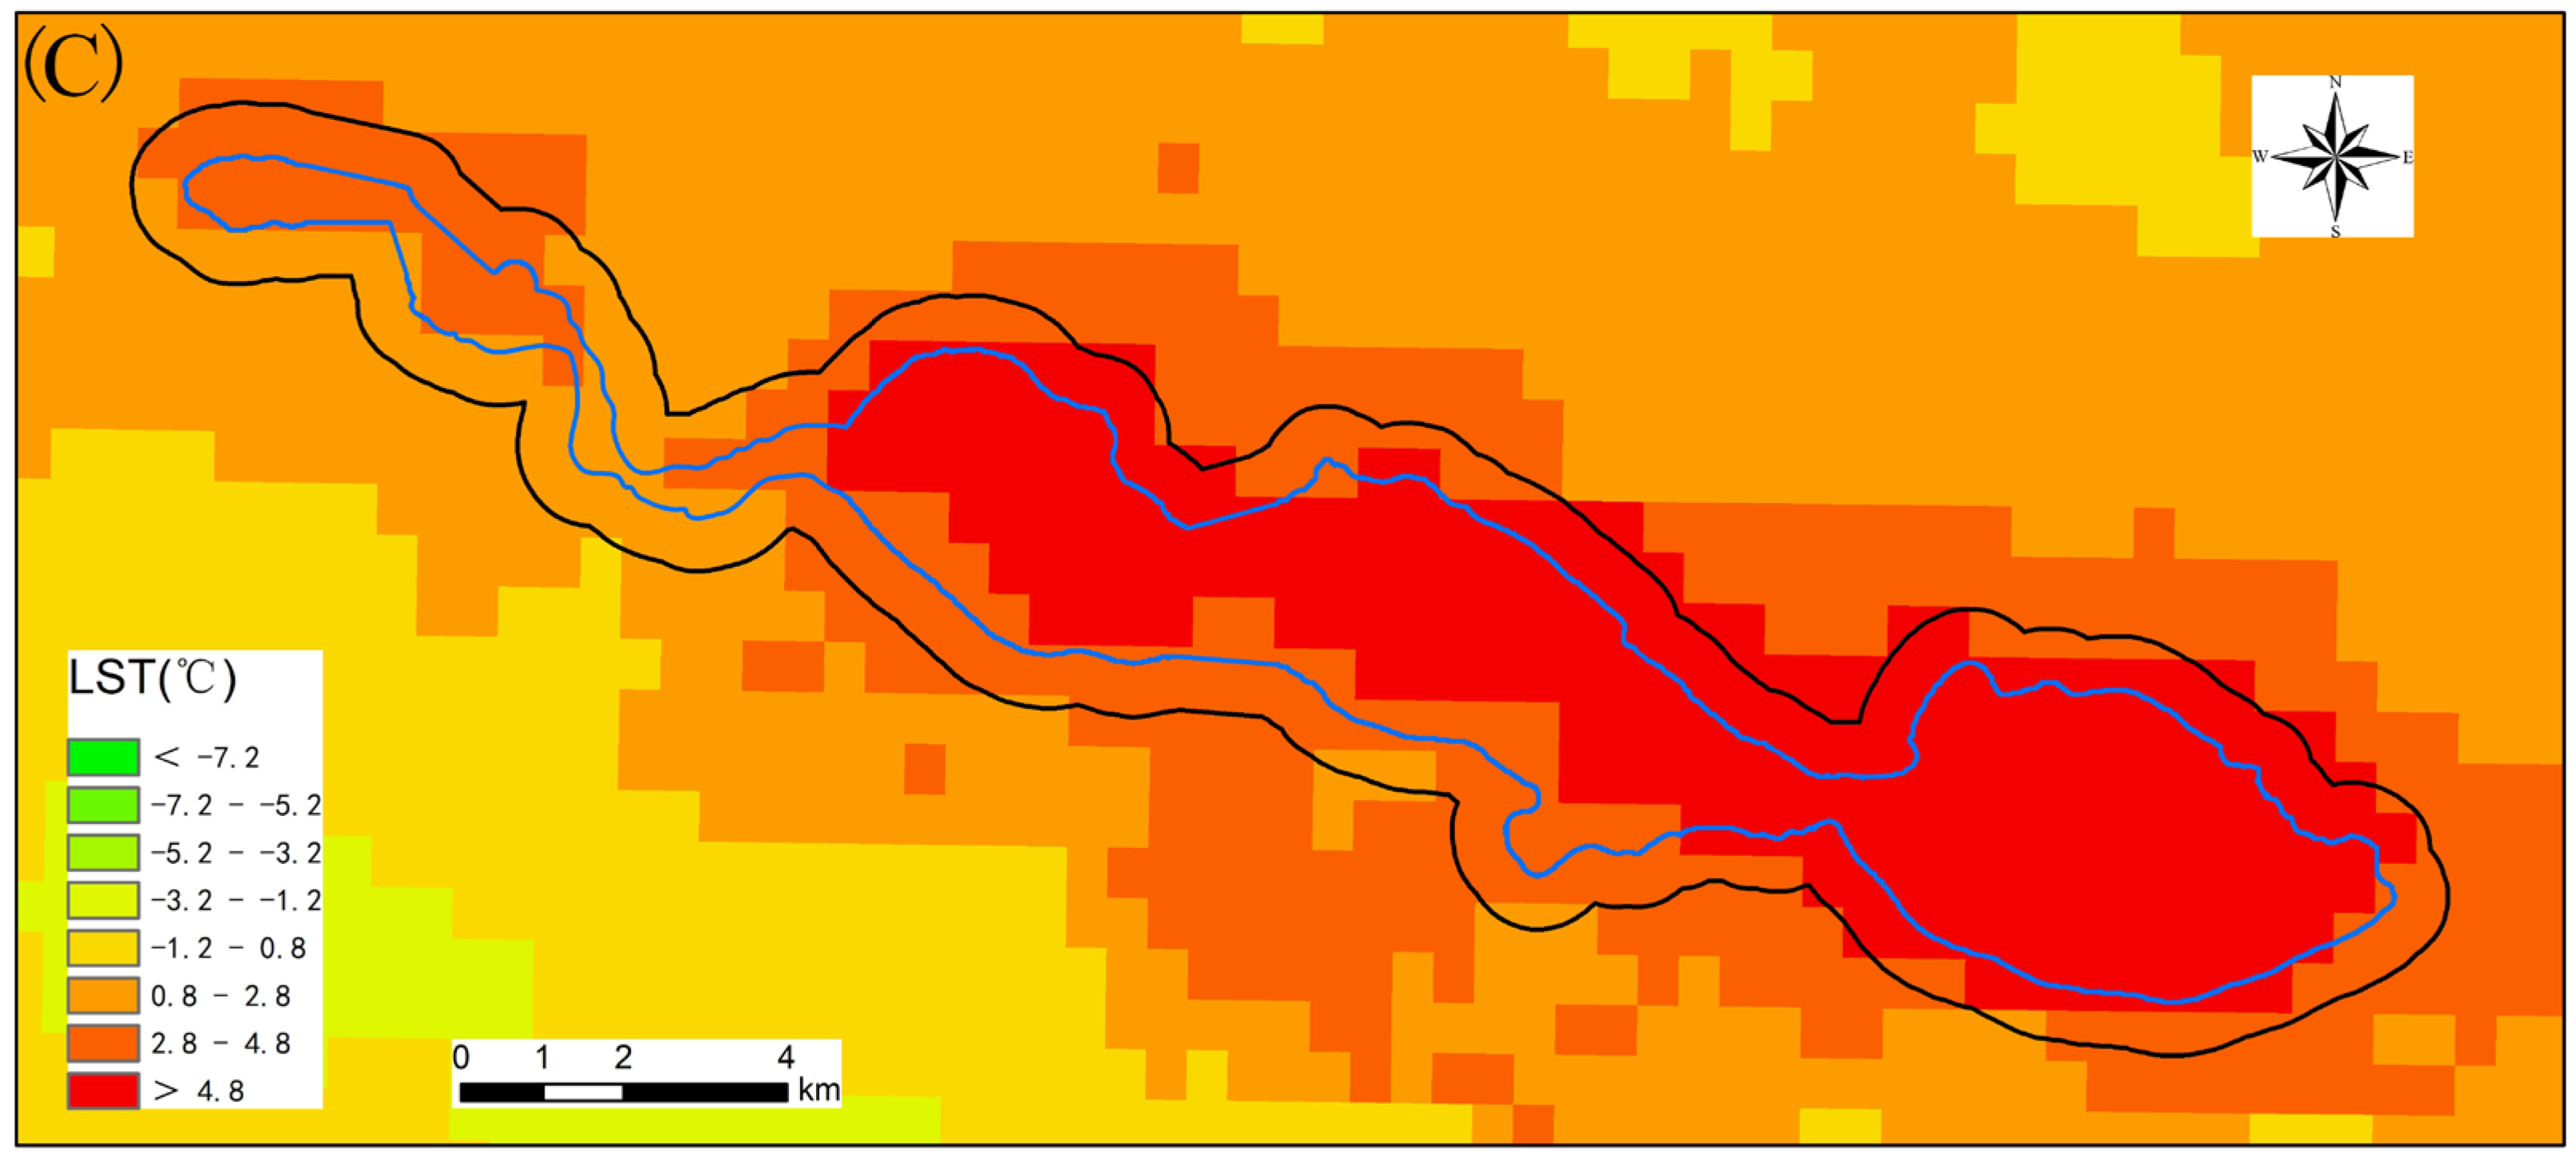
2.3. Quantification of SUHII

Given the small size of urban areas in the study regions, this study defines SUHII as the averaged LST difference between urban areas and their adjacent suburban areas [9,18]. Instead of using rural zones, selecting suburban areas as reference zones is more effective in mitigating the impacts caused by variations in urban underlying surfaces, atmospheric humidity, water bodies, and terrain [4].
To determine the boundaries of urban and suburban areas, we employed the city clustering algorithm to identify urban areas [18]. Based on the CLCD data from 2010 to 2020, the proportion of built-up land within a 1 km × 1 km window was calculated using the moving window method to produce a BI map. Using this BI map, pixels were classified into high-intensity and low-intensity built-up lands based on a 50% threshold [50]. Patches of high-intensity built-up land within a distance of less than or equal to 2 km were aggregated to form spatially continuous urban areas, and the boundary of urban area was then extracted. Here, pixels corresponding to water bodies within urban areas were excluded. Using the boundary of urban area as a reference, a buffer zone of the same area as the urban region was established, which was considered as the suburban area (Figure 2).

2.4. Methods to Analyze Trends of SUHII and Driving Mechanisms

In this study, we employed the Mann–Kendall trend test and Theil–Sen slope estimator to conduct a detailed analysis on the temporal trends of SUHII across 30 cities from 2010 to 2020. The Mann–Kendall trend test was used to determine the statistical significance of SUHII trends, while the Theil–Sen slope estimator provided a robust calculation of the rate of change in SUHII over time. Specifically, we first analyzed the variation trends and their statistical significance for annual, summer, and winter daytime and nighttime SUHII in each city. Summer includes the months from June to August, and winter spans December to February of the next year. We then calculated the annual average daytime and nighttime SUHII and analyzed the trends from a holistic perspective. Additionally, we conducted Pearson correlation analysis to explore the relationships between SUHII during different periods. In terms of spatial characteristics, we utilized Pearson correlation analysis to reveal the relationships between the cities’ geographical locations and their SUHIIs.
For ΔEVI, ΔWSA, ΔNDMI, TP, and MT, the annual and seasonal (summer and winter) mean values were calculated for every city during the study period. Since the variables of NTL, BI, FD, and UAS would not present significant variation at intra-annual scale, they were assumed to be constant across seasons within a year, and only annual mean values were calculated. Using IBM SPSS Statistics 26, Pearson correlation coefficients between SUHII and each explanatory variable were calculated, and multiple stepwise linear regression models were established to determine the explanatory power of each driving factor on the spatial variability of SUHII and the comprehensive explanatory capability of all driving factors (indicated by R2).

3. Results

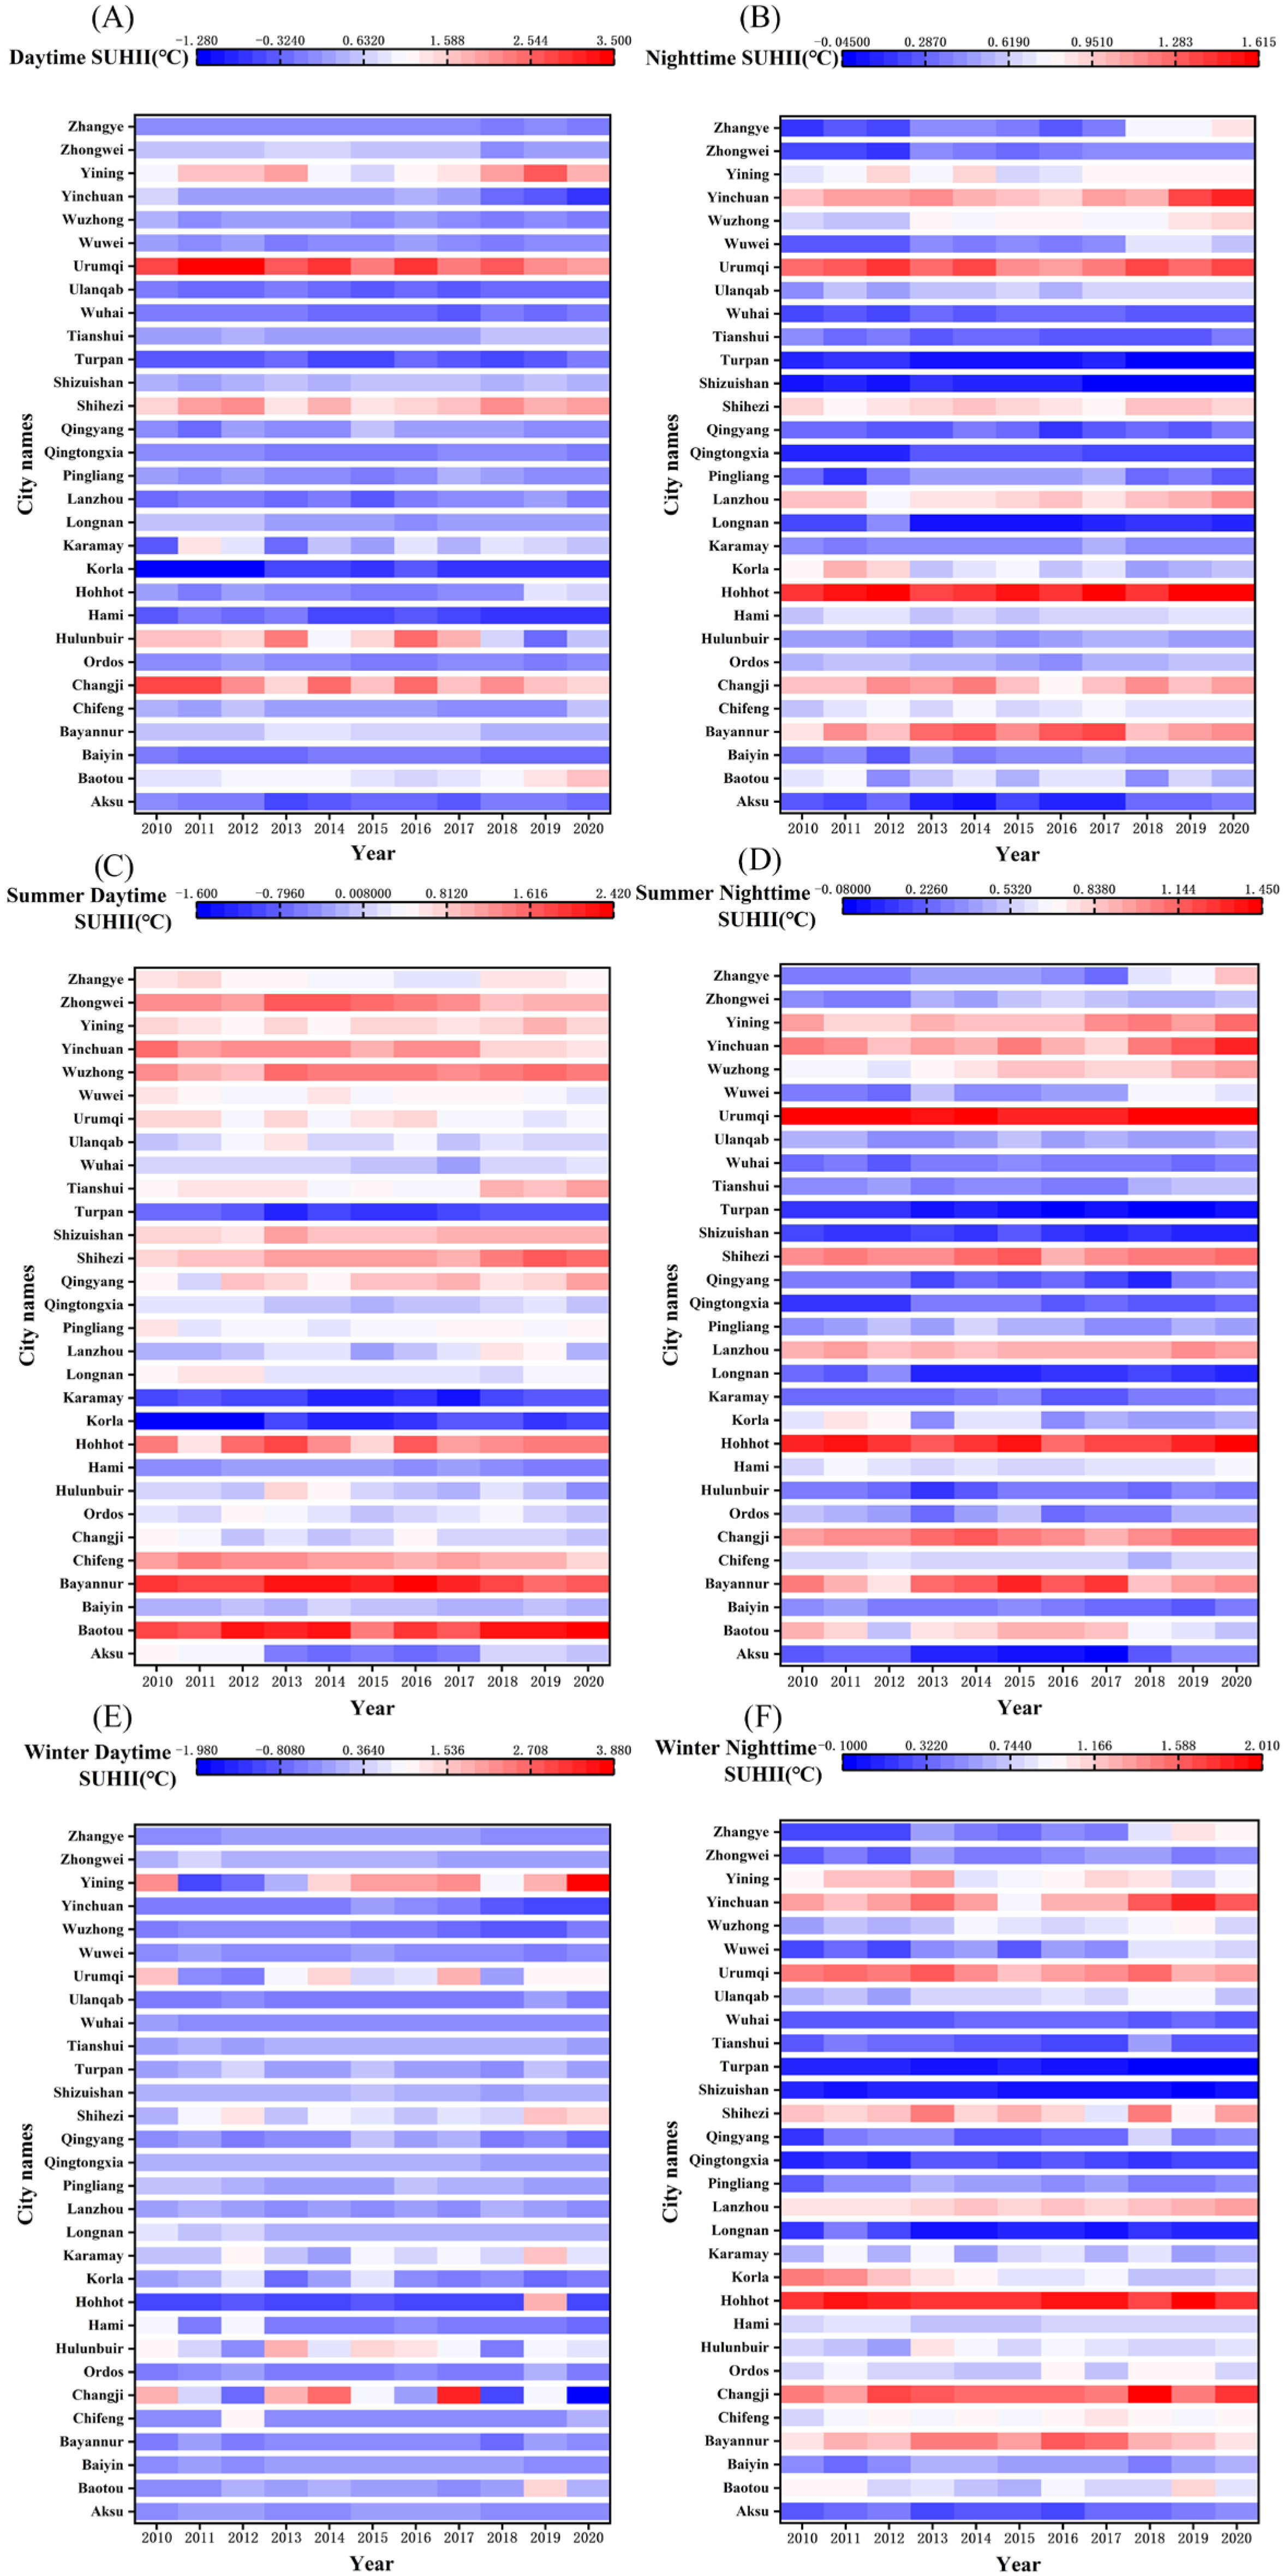
3.1. Temporal Trends of SUHII

Figure 3 summarizes trends of daytime and nighttime SUHII of 30 cities at annual and seasonal scales, respectively, during the study period. Overall, the annual mean daytime SUHII in 2010 (0.397 ± 0.844 °C) is higher than that in 2020 (0.306 ± 0.760 °C) across these cities, while the annual mean nighttime SUHII is lower in 2010 (0.535 ± 0.352 °C) than that in 2020 (0.646 ± 0.415 °C). The Mann–Kendall trend test revealed that the annual mean daytime SUHII presented a significant decreasing trend from 2010 to 2020 (trend slope = −0.011, p < 0.01), whereas the nighttime SUHII exhibited a significant increase (trend slope = 0.007, p < 0.05) (Table 2 and Table 3). In addition, Baotou City did not show a significant trend, although it had the highest rise in SUHII at daytime, with an increase of 0.928 °C. Zhangye City had the greatest increase in nighttime SUHII with a value of 0.726 °C (trend slope = 0.065, p < 0.01), and was the city with the fastest increase in nighttime SUHII throughout the years (Table 3).
For annual SUHII, more cities showed rising trends at nighttime, specifically for Hohhot, Lanzhou, Ulanqab, Wuwei, Wuzhong, and Zhangye, whereas only Tianshui exhibited a significant rising trend during the daytime. Similarly, in summer and winter, more cities experienced rising trends in SUHII at night than during the day. Furthermore, it seems that the variation in SUHII of a city presents difference at different times. Taking Wuzhong City as an example, there was a notable declining trend for daytime SUHII throughout the year (trend slope = −0.039, p < 0.05), while an opposite situation occurred for nighttime SUHII (trend slope = 0.026, p < 0.01). On the other hand, the same variation trend may also occur among different cities for the same period. For instance, both Hohhot and Ulanqab exhibited a rising slope of 0.011 in SUHII during night over the years. Additionally, there were also some cities keeping a stable pattern without obvious fluctuations during the study period, including Baotou, Baiyin, Bayannur, Changji, Ordos, Karamay, Pingliang, Qingtongxia, and Wuhai.
Figure 4 displays the correlations between daytime and nighttime SUHII in summer, winter, and across the entire year. In summer, there is a strong positive correlation between daytime and nighttime SUHII (r = 0.49, p < 0.01) (Figure 4A), indicating that an increase in daytime SUHII is typically accompanied by a corresponding rise in nighttime SUHII in summer, and a similar pattern is observed for the entire year (r = 0.42, p < 0.05) (Figure 4C). However, there is no correlation between daytime (−0.010 ± 0.478 °C) and nighttime SUHII (0.757 ± 0.469 °C) in winter (p < 0.001) (Figure 4B). Additionally, the correlations of daytime SUHII and nighttime SUHII between summer and winter are also displayed in Figure 4. It illustrates that there is no significant correlation for daytime SUHII in summer and winter (r = −0.12, p = 0.54) (Figure 4D), while nighttime SUHII exhibits a positive correlation between these two seasons (r = 0.92, p < 0.01) (Figure 4E). These findings are consistent with the results reported by Zhou et al. (2014) [4] in their study on SUHI across 32 major Chinese cities.

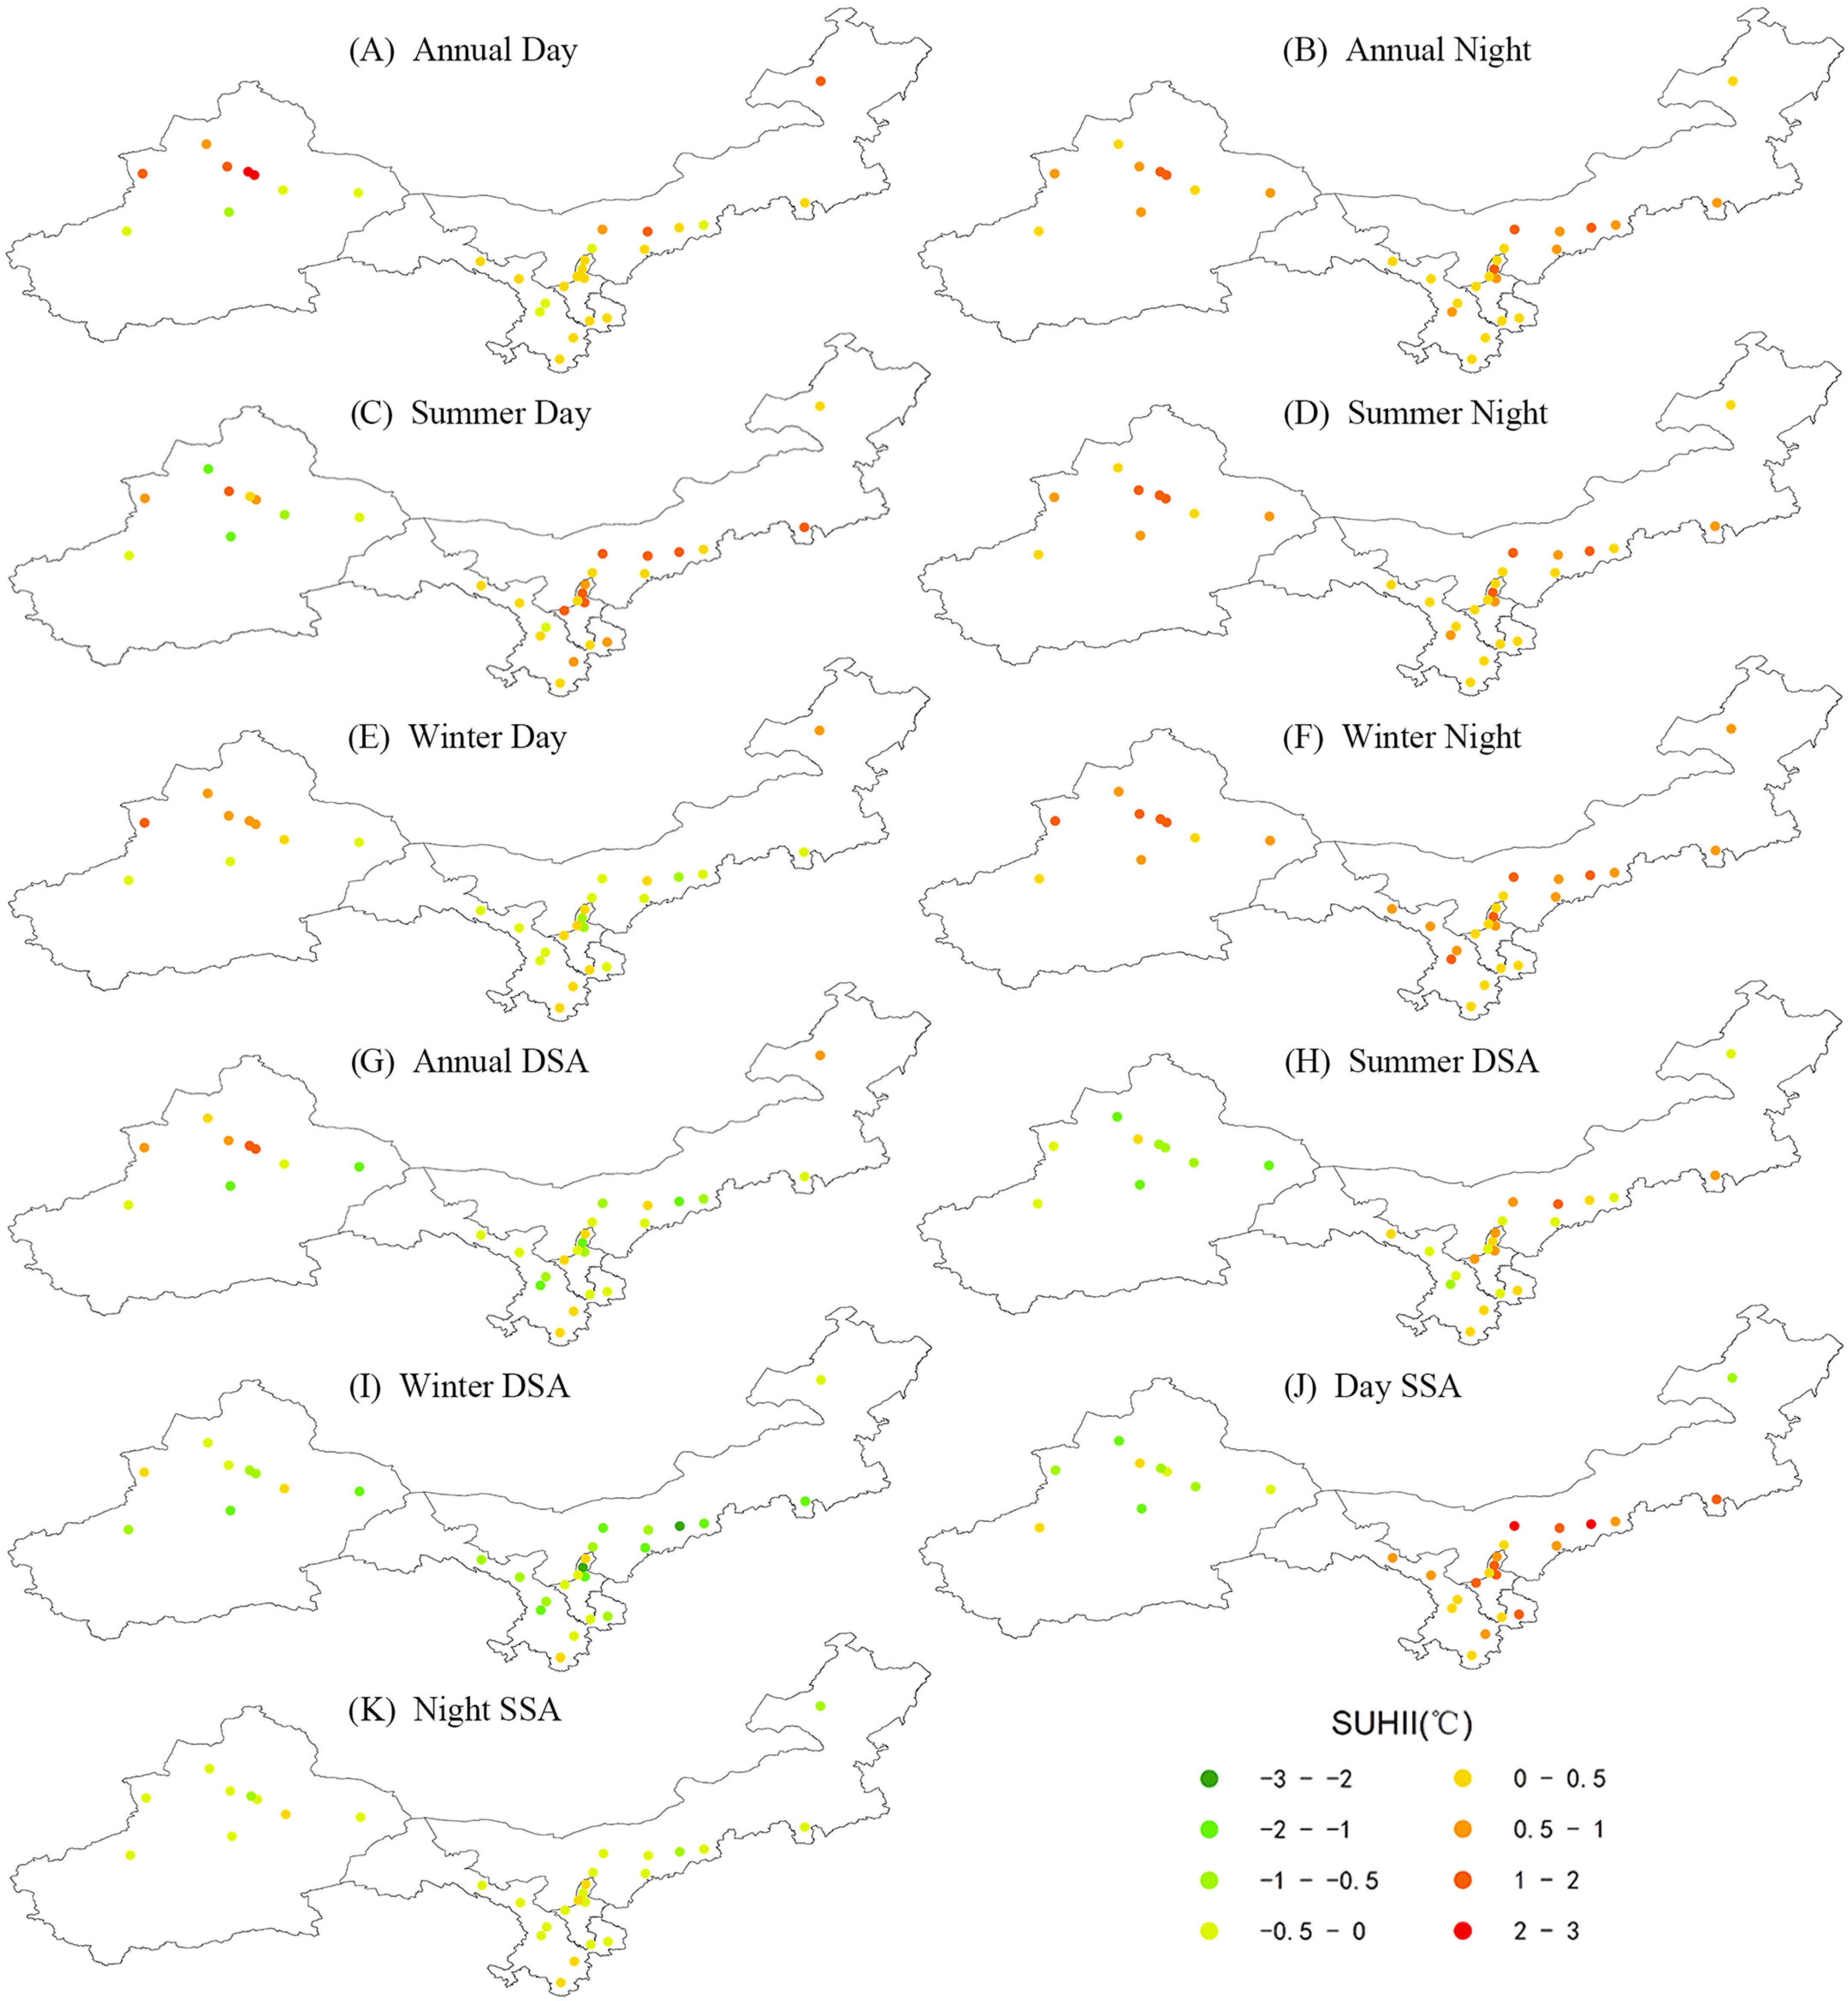
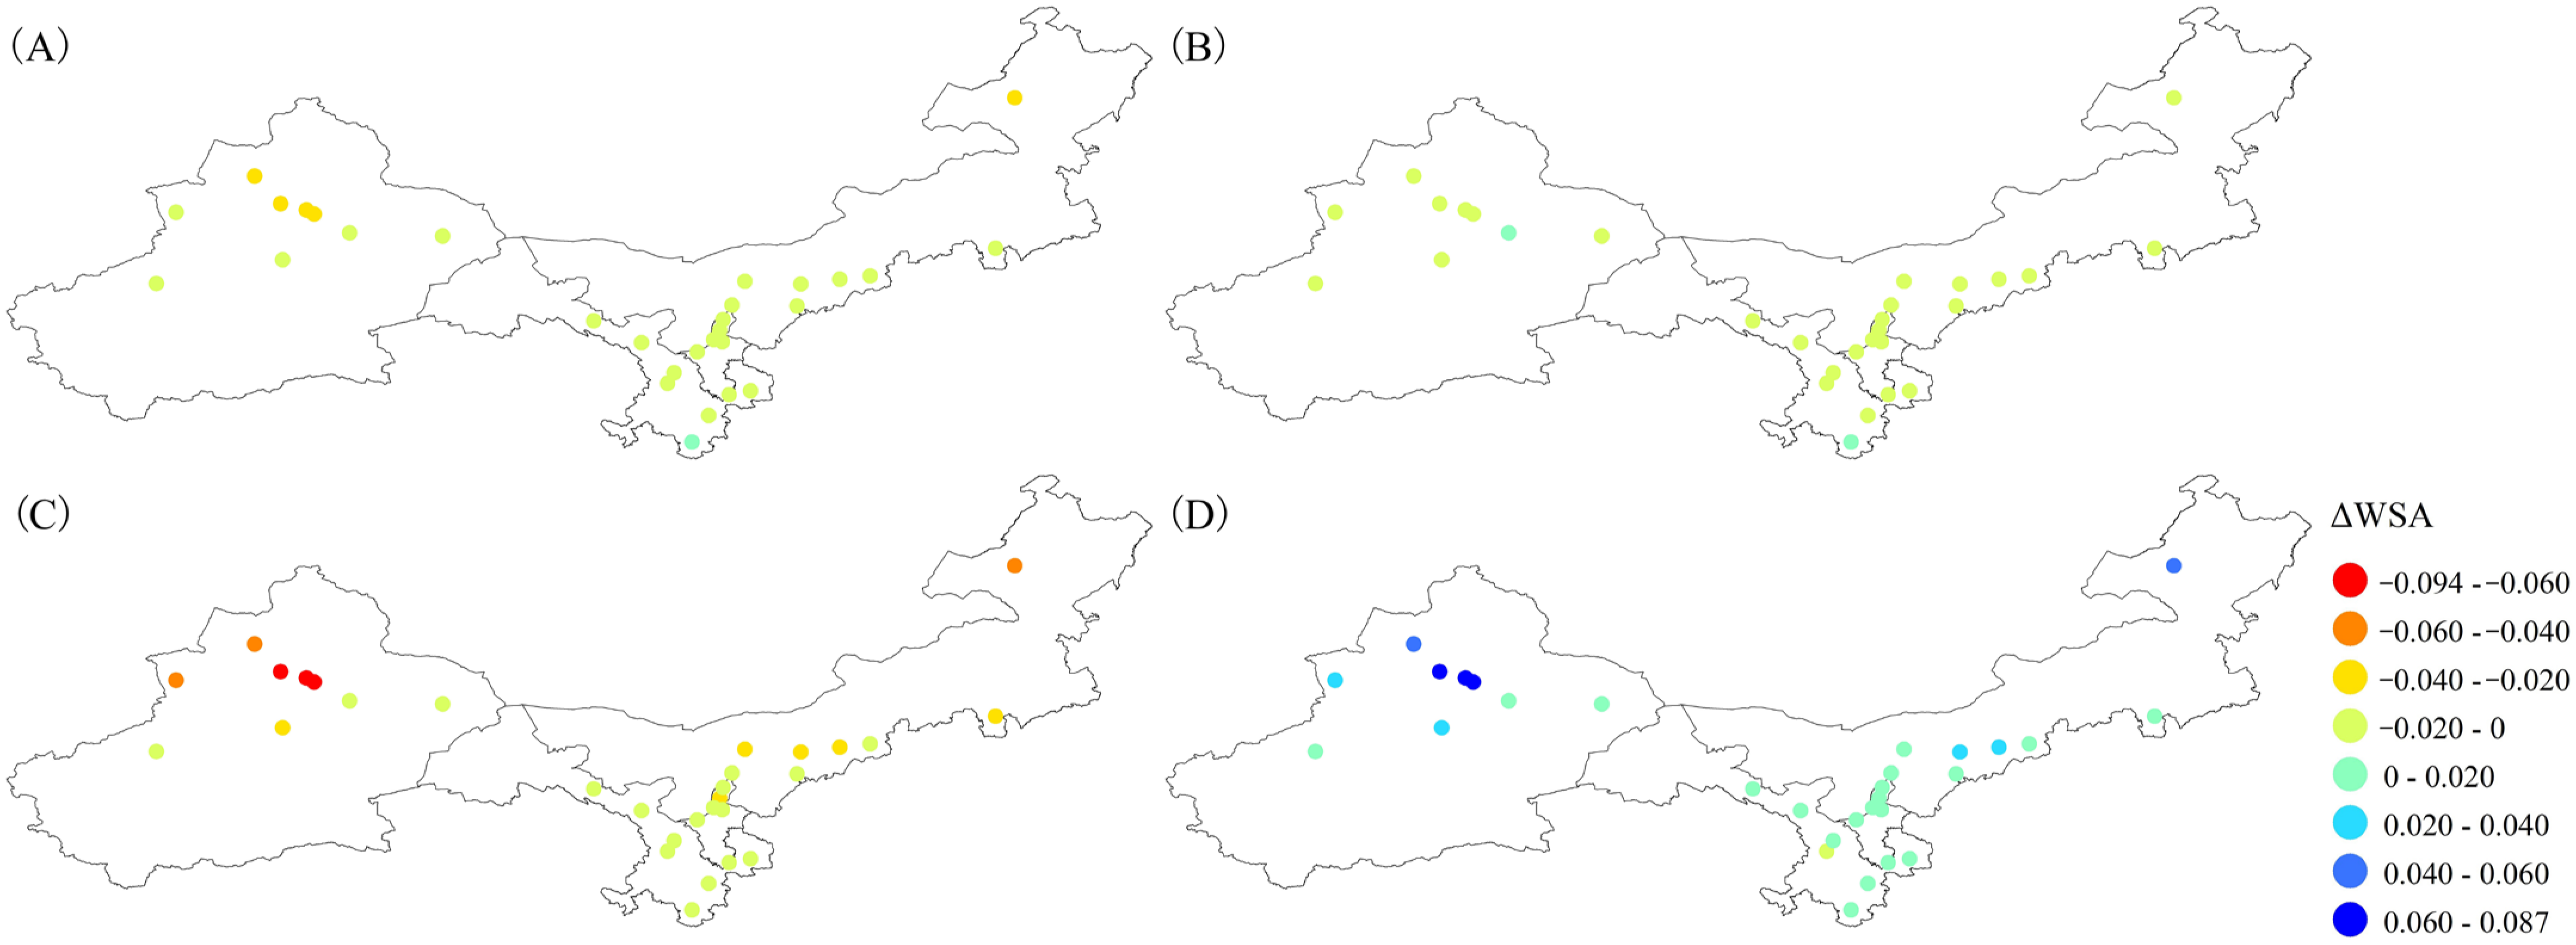
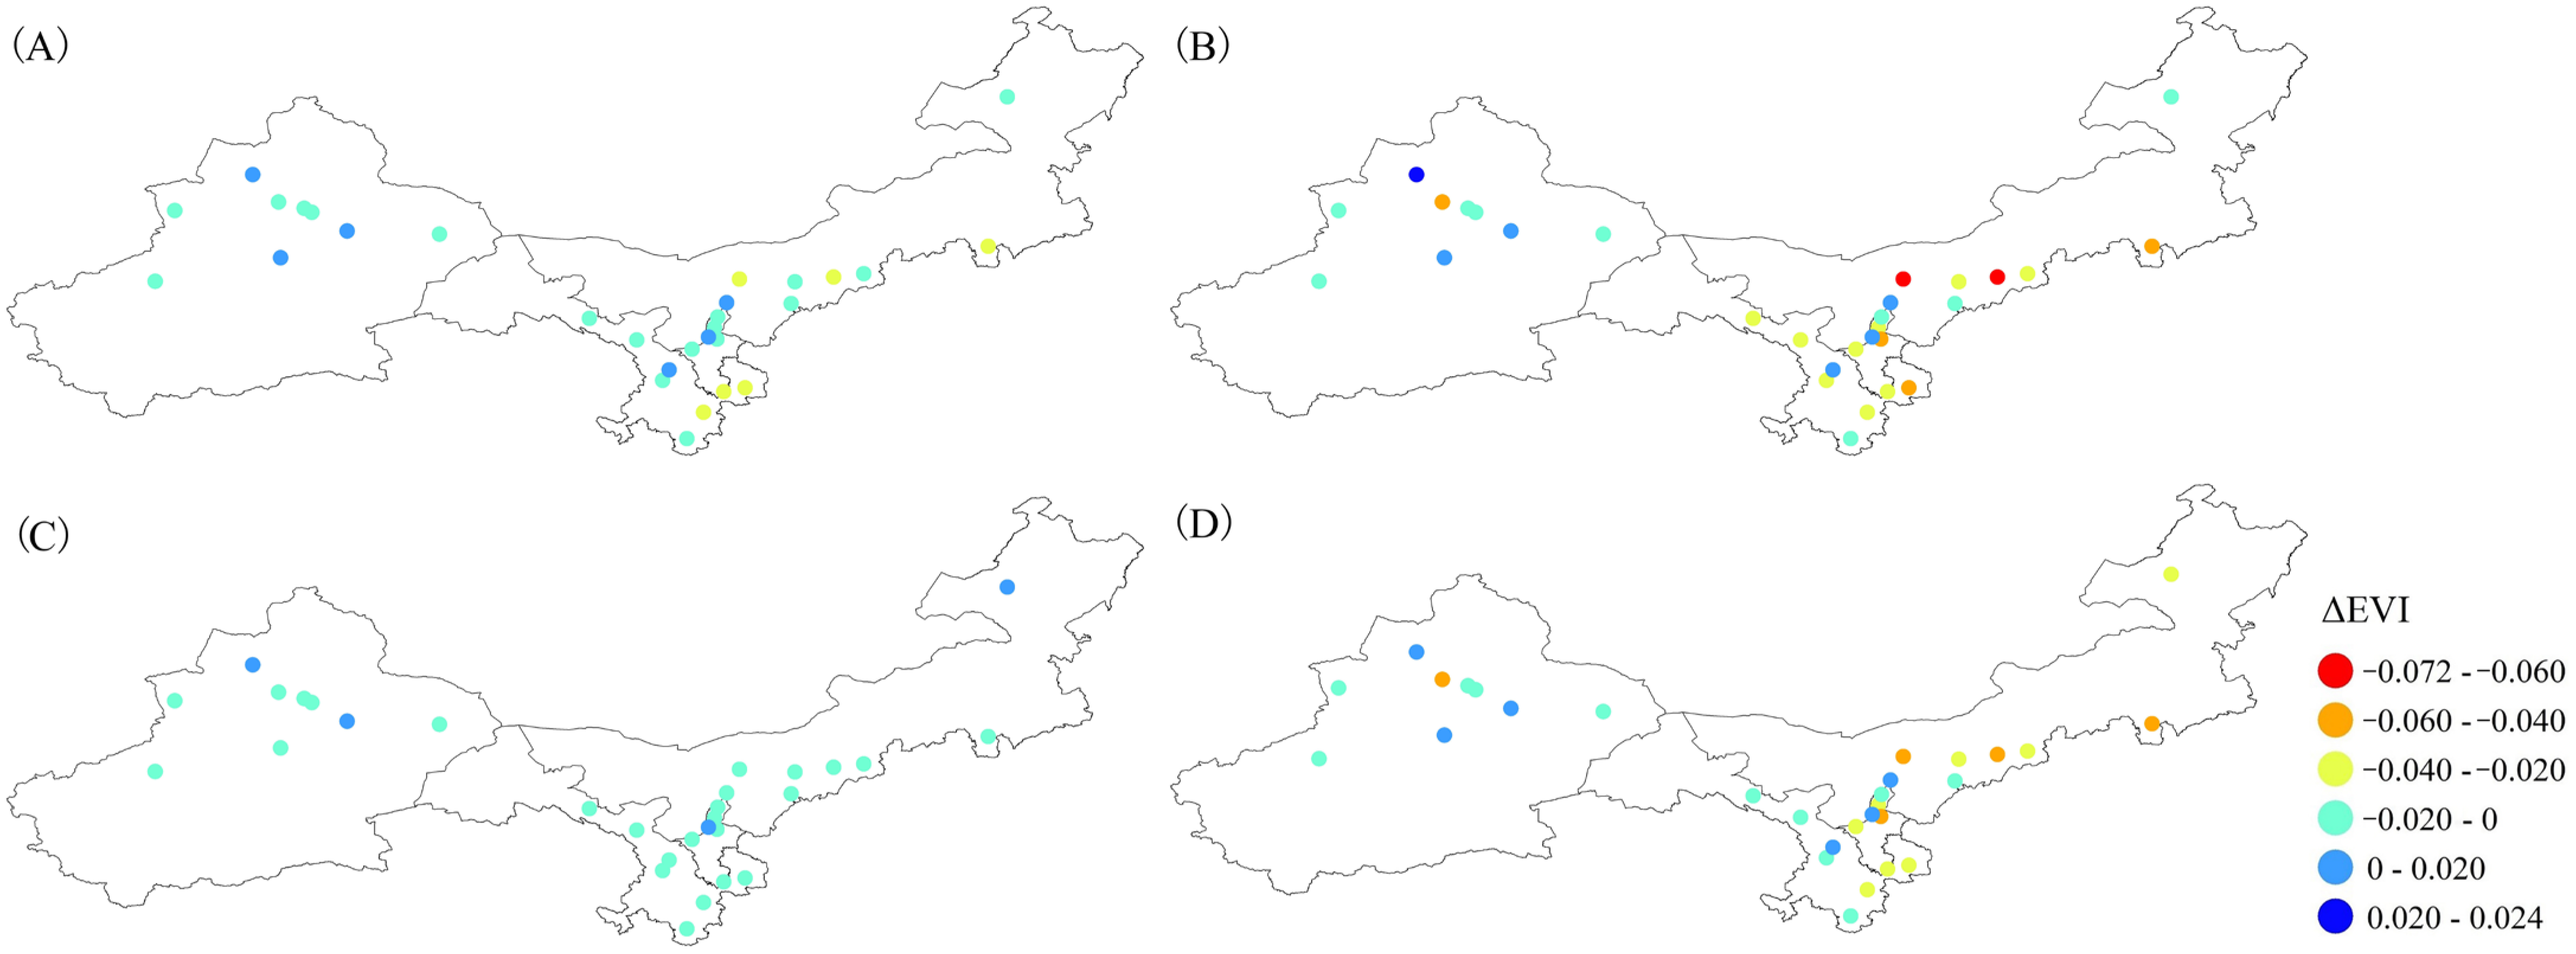
3.2. Spatial Patterns of SUHII

Figure 5 shows the spatial distribution of SUHII averaged over the period 2010–2020 for 30 cities. During the daytime, cities in the northern part of the study area generally exhibited higher SUHII throughout the year. Urumqi (2.665 ± 0.471 °C) and Changji (2.095 ± 0.465 °C) in Xinjiang Province, located in the northwest of China, recorded significantly higher SUHII compared to other cities (Figure 5A). Notably, the SUCI phenomenon was observed in eight cities, ranging from −0.806 ± 0.263 °C in Korla to −0.172 ± 0.046 °C in Baiyin (Figure 5A). In summer, cities in Inner Mongolia like Baotou (1.990 ± 0.285 °C) and Bayannur (1.961 ± 0.256 °C) had higher SUHII than other cities (Figure 5C). Six cities exhibited the SUCI phenomenon, predominantly located in the western part of the study area, ranging from −1.214 ± 0.234 °C in Korla to −0.150 ± 0.073 °C in Baiyin (Figure 5C). In winter, SUHII was generally lower across all 30 cities, ranging from −0.802 ± 0.836 °C in Hohhot to 1.335 ± 1.368 °C in Yining, of which 14 cities showed positive values. SUHIIs of cities in the north and west parts of the study area were higher than those of cities in the south and east parts (Figure 5E). During nighttime, the spatial distribution of SUHIIs of these cities was consistent throughout the year, summer, and winter, with higher values concentrated around the four provincial capitals and their neighboring cities. All 30 cities recorded positive nighttime SUHII, ranging from 0.050 ± 0.044 °C in Shizuishan to 1.502 ± 0.087 °C in Hohhot annually (Figure 5B), from 0.098 ± 0.045 °C in Shizuishan to 1.395 ± 0.049 °C in Urumqi during summer (Figure 5D), and from 0.008 ± 0.055 °C in Turpan to 1.830 ± 0.093 °C in Hohhot during winter (Figure 5F). Furthermore, the annual average DSA of all cities was −0.200 ± 0.704 °C, with a range from −1.515 °C in Korla to 1.386 °C in Urumqi. Among these cities, 19 exhibited negative DSA values (Figure 5G). In summer, DSA values ranged from −1.736 °C in Korla to 1.243 °C in Baotou, with 17 cities showing negative values. For the cities of Korla, Karamay, Hami, Turpan, Changji, and Urumqi, which are located in the arid zone, daytime SUHII was significantly lower than nighttime SUHII in summer. In contrast, cities located in the temperate continental climate zone, such as Chifeng, Shizuishan, Zhongwei, Bayannur, and Baotou, experienced a higher daytime SUHII than nighttime SUHII in summer (Figure 5H). During winter, the DSA values ranged from −2.632 °C in Hohhot to 0.299 °C in Yining, with 26 cities presenting negative values (Figure 5I). During the daytime, 22 cities recorded higher SUHII in summer than in winter, with positive SSA values ranging from 0.008 °C in Qingtongxia to 2.309 °C in Bayannur. Cities with negative SSA values were mainly distributed in the western part of the study area, ranging from −1.626 °C in Karamay to −0.149 °C in Hami (Figure 5C,E,J). At night, 25 cities showed lower SUHII in summer than in winter, with SSA values ranging from −0.550 °C in Hohhot to −0.013 °C in Wuzhong. Cities with positive SSA values were mainly concentrated in the central part of the study area, and the SSA values ranged from 0.003 °C in Turpan to 0.067 °C in Shizuishan (Figure 5D,F,K). The differences between daytime SSA (0.446 ± 0.957 °C) and nighttime SSA (−0.197 ± 0.194 °C) across the 30 cities were statistically significant (p < 0.01).
Correlation analysis on SUHII and geographical coordinates was performed, and the results are shown in Table 4. Annual daytime SUHII, as well as both winter daytime and nighttime SUHIIs, presented significantly positive correlation with latitude. For summer daytime, SUHII showed a positive correlation with longitude (r = 0.451, p < 0.05), while winter daytime SUHII presented a significant negative correlation with longitude (r = −0.503, p < 0.01).

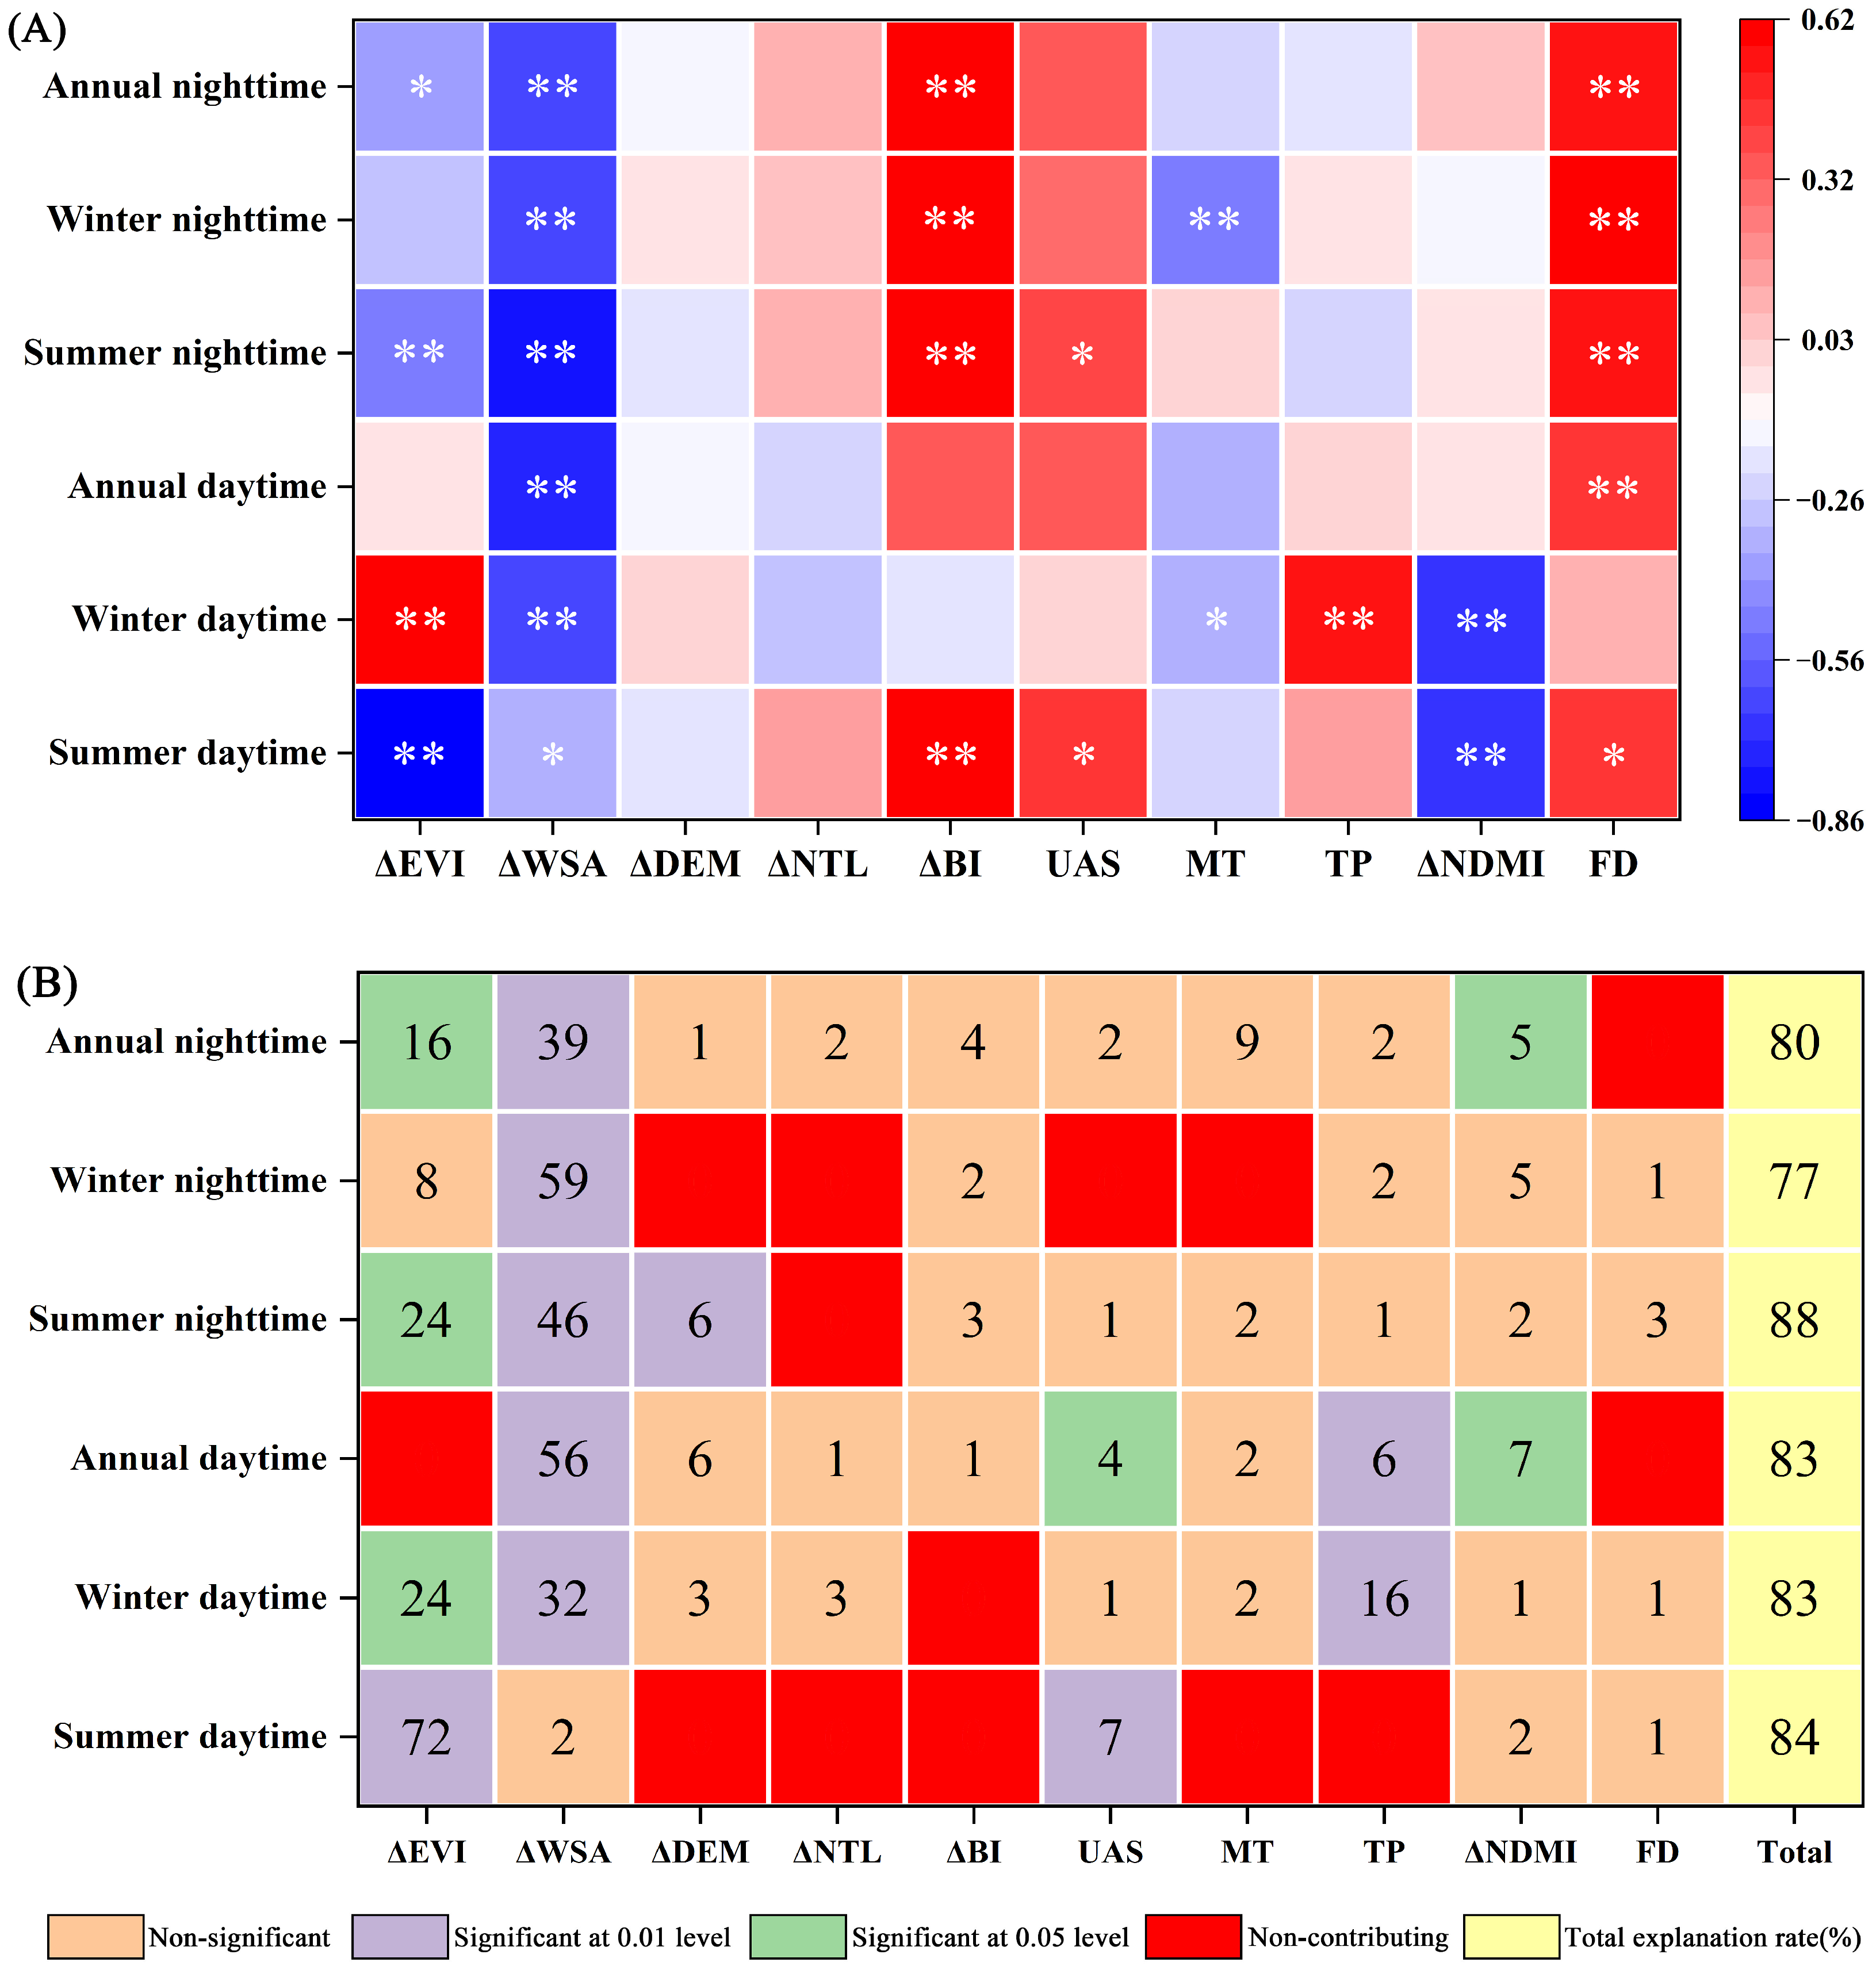
3.3. Analysis of Potential Driving Factors

To ensure the reliability of multiple stepwise linear regression analysis, we calculated the variance inflation factor for each explanatory variable to quantify the degree of multicollinearity, as shown in Table 5. The values of the variance inflation factor are less than 5, indicating that the regression analysis of the impact of explanatory variables on SUHII is robust and reliable. Figure 6A displays the Pearson correlation coefficients between SUHII and the 10 driving variables, indicating that SUHII is negatively correlated with ΔWSA across almost all time scales. In addition to ΔWSA, during the summer daytime, SUHII is negatively correlated with ΔEVI and ΔNDMI, and positively correlated with ΔBI, UAS, and FD. In winter, it is positively correlated with ΔEVI and TP, and negatively correlated with MT and ΔNDMI. At night, winter SUHII presents significantly negative correlation with MT and positive correlation with ΔBI and FD. In summer, nighttime SUHII is positively correlated with ΔBI, UAS, and FD, and negatively correlated with ΔEVI.
Meanwhile, Figure 6B illustrates the proportion of variability in SUHII explained by the driving factors and the total R2 explanatory rate (%) based on the stepwise linear regression analysis model. It shows that the variation in daytime SUHII in summer is primarily explained by ΔEVI (72%), while in winter, it is mainly explained by ΔWSA (32%), ΔEVI (24%), and TP (16%). For nighttime SUHII, ΔWSA accounts for most of the variation (46% in summer and 59% in winter), and ΔEVI and ΔNDMI together explain 21% of the variation. In summer, these driving factors show strong explanatory power for both daytime and nighttime SUHII (with total explanatory rates of 84% and 88%, respectively). In winter, the explanation of daytime SUHII is more comprehensive than that of nighttime SUHII (with total explanatory rates of 83% for daytime SUHII and 77% for nighttime SUHII). These factors explain the total variability of annual daytime and nighttime SUHII, with explanatory rates of 83% and 80%, respectively.

4. Discussion

4.1. UHI Effects in Arid and Semi-Arid Regions

Previous studies have reported that a majority of cities in China presented significant UHI effect, and the intensity of UHI kept increasing in the past decades [23,51,52], in which the SUCI phenomenon was seldom observed for large cities in moist regions [4]. However, in some studies focusing on an individual semi-arid city, the SUCI was identified during the day, and it was reported to be correlated with NDVI, BI, and LST [25,30,53]. By performing a systematic study on 30 cities in the arid and semi-arid regions of northern China, we confirmed the occurrence of the SUCI during the daytime and the more pronounced SUHI effect at night. During the daytime in summer, cities such as Korla, Karamay, Turpan, Hami, Aksu, and Baiyin experienced a cool island effect. This is partly due to the proximity of nearby deserts or barren areas, which, characterized by sparse vegetation and low soil moisture, absorb solar energy more rapidly, leading to higher LST compared to urban areas [54]. Additionally, in urban areas, green space can effectively cool the surface through plant transpiration and evaporation of soil moisture, whereas the sparse vegetated non-urban areas lack such cooling effects [55]. Taking the city of Korla in Xinjiang Province as an example, the central and southern parts of the city are primarily irrigated by the Peacock River, and it possesses a canal system, forming a vast fan-shaped oasis. The irrigated area not only supports rich agricultural production but also reduces LST. In contrast, the surrounding Taklamakan Desert exhibits stronger heat absorption during the day and causes higher LST. In winter, cities such as Hohhot, Yinchuan, Wuzhong, Ulanqab, Ordos, Bayannur, Wuwei, Wuhai, Qingyang, Hami, Zhangye, Chifeng, Aksu, Baiyin, Korla, and Lanzhou also exhibited the SUCI phenomenon during the daytime. This phenomenon may be closely associated with winter air pollution and diminished vegetation activity [4]. Since it is very cold in northern China in winter, the extensive consumption of coal for heating leads to air pollution [56], which significantly reduces the solar radiation received in urban centers compared to suburban areas, where less coal is consumed due to smaller populations [57]. This reduction in incoming radiation subsequently results in lower urban LSTs. Meanwhile, due to reduced vegetation activity in suburban areas during winter, the surface cooling effect is minimal, and these regions typically possess more available energy than urban centers [58], resulting in higher LSTs in the suburbs. Moreover, previous studies have reported that suburban areas in arid regions have extensive bare land, which primarily absorbs rather than reflects solar radiation, further contributing to elevated suburban LSTs [59,60,61].
On the other hand, we also found the positive values of nighttime SUHII in all cities, which was more pronounced in winter. This is partly attributed to the higher thermal inertia of urban built-up areas that retain heat longer compared to deserts or barren lands and release heat slowly at night [54]. In winter, additionally, the higher population density and colder temperatures, which cause more consumption of fuel in urban areas, contribute to an increase in SUHII. For all cities, annual mean daytime SUHII (0.390 ± 0.787 °C) was lower than nighttime SUHII (0.590 ± 0.370 °C), with a significant increasing trend in nighttime SUHII (trend slope = 0.007, p < 0.05). Additionally, 19 cities exhibited negative values of DSA (Figure 5G). These cities, such as Korla, Hohhot, Hami, Lanzhou, Yinchuan, Ulanqab, and Wuzhong, are either situated in arid regions, surrounded by deserts and the Gobi, or are provincial capitals with dense populations. These findings indicated that the UHI effect was more severe at night compared to daytime. This further complemented and supported the results in Zhou et al. (2014) [4], which reported a negative DSA of the four provincial capitals in the northwest China. In contrast, the other 11 cities, such as Urumqi, Shihezi, Hulunbuir, Changji, and Yining, showed positive values of DSA, varying between 0.015 °C and 1.386 °C.
Previous studies have reported that, in China, both SUHII and CLUHII increased significantly during the past decades [51]. Even in a study on 272 cities in the mainland of China, it was reported that few cities were found with trends of significant decrease in CLUHII and SUHII between 2001 and 2018 [52]. However, for 30 cities in northern China, we found that between 2010 and 2020, annual mean daytime SUHII presented a significant decreasing trend (trend slope = −0.011, p < 0.01), and nighttime SUHII exhibited a significant increase (trend slope = 0.007, p < 0.05). Along with the urbanization, the increase in impervious surfaces (e.g., roads and buildings) leads to the gradual release of the heat absorbed during the day at nighttime [62], which explains the observed increase in nighttime SUHII. Moreover, Figure 6B demonstrates that at daytime ΔEVI has a strong explanatory power for the variations in SUHII. Analysis of ΔEVI from 2010 to 2020 indicates that most cities (18 out of 30) exhibited an overall increasing trend, reflecting an expansion in the disparity of green vegetation between urban and suburban areas, which contributed to the decline in daytime SUHII. Furthermore, we speculate that although arid and semi-arid regions are inherently characterized by water scarcity, recent improvements in water resource management through scientific urban planning, such as enhanced artificial irrigation and the construction of urban water bodies, have allowed water bodies and irrigated vegetation to dissipate part of heat at daytime through evaporation and transpiration, thereby contributing to a reduction in urban LST. The differences in these findings across various studies can be attributed not only to the varying buffer of rural areas used in the SUHII calculation but also to the fact that most of the cities referenced in those studies are located in central and eastern parts of China, with only a few cities from the northern regions being included. Additionally, we found that, in the arid and semi-arid regions of northern China, cities in the north areas were likely to possess higher SUHII than cities in the south, referring to annual daytime SUHII and daytime and nighttime SUHIIs in winter (Figure 5A,E,F). Figure 6B shows that the primary driving factor for daytime SUHII is ΔWSA, while Figure 7 reveals that the ΔWSA gradually decreases with increase in latitude. Moreover, Figure 6A demonstrates a significant negative correlation between ΔWSA and daytime SUHII. Consequently, as latitude increases, daytime SUHII tends to be more pronounced. Furthermore, winter daytime SUHII decreased from west to east, while summer daytime SUHII exhibited a trend of increase from west to east (Figure 5C,E). It indicates that the background climate is a potential driver for spatial pattern of UHI in this region.

4.2. Drivers and Underlying Mechanisms of SUHII

Previous studies have analyzed correlations between SUHII and associated driving forces in different cities, and they have demonstrated that albedo contributes greatly to nighttime SUHII [4,18,63], vegetation is helpful for mitigating SUHII [18,64], and anthropogenic heat release can exacerbate SUHII [18]. In Zhou et al. (2014) [4], driving mechanisms of the major biophysical and anthropogenic factors on SUHI effects were discussed for 32 major cities in China, in which more comprehensive driving factors were included. Zhou et al. (2017) analyzed the influence of urban morphology (FD) on SUHI [42], and Shahfahad et al. (2023) examined the responses of LST and SUHI seasonal variations in SUHI to soil moisture and vegetation conditions in subtropical semi-arid cities [41]. Accordingly, these factors were selected in this study, and the results showed that they explained a significantly larger fraction of SUHII variations in cities of northern China (over 77%) than those for the 32 cities in Zhou et al. (2014) [4], especially for daytime SUHII in summer (84% vs. 57%) and winter (83% vs. 61%) and nighttime SUHII in summer (88% vs. 72%).
From the perspective of surface energy balance, the net all-wave radiation (Rn) plus anthropogenic heat release (F) is equal to the sum of latent heat flux (LE), sensible heat flux (H), and ground heat flux (ΔS) in urban areas. Since the surface temperature used to calculate SUHII is controlled by surface radiative and thermodynamic properties, the spatial-temporal patterns of SUHII could reflect the variability of different heat fluxes in the surface energy balance [4]. In the urbanization process, the conversion of natural vegetation to man-made structures not only causes the reduction in evapotranspiration but also leads to greater absorption of solar radiation due to lower albedo of artificial structures [65]. It has been reported that surface albedo is a critical factor influencing SUHI, especially during nighttime [4,63,66]. This study demonstrated, among the ten driving factors, ΔWSA was the predominant factor and presented significantly negative correlation with SUHII, except for the daytime SUHII in summer when vegetation activity was the major driver. Figure 7 illustrates that there are 29 cities presenting negative values for annual ΔWSA, in which 28 cities show negative ΔWSA in summer, and all 30 exhibit negative values in winter (Figure 7A–C). This is in line with the fact that urban areas, characterized by a higher concentration of buildings and paved surfaces, typically have lower albedo compared to suburban areas with natural vegetation, leading to more absorption of solar radiation contributing to an increase in net radiation in the surface energy balance, thus exacerbating the SUHI effect [67]. Additionally, we observed that the impact was more pronounced in winter (32% for daytime and 59% for nighttime, respectively) compared to summer (2% for daytime and 46% for nighttime, respectively). Taking the city of Urumqi as an example, the annual ΔWSA was −0.021, and ΔWSA in summer was −0.008 versus −0.074 in winter. In the arid and semi-arid regions of northern China, low temperatures in winter lead to an increased accumulation of ice and snow in suburban areas. Due to the high albedo of ice and snow, a greater proportion of solar radiation is reflected back into the atmosphere, further reduces suburban LST [68]. In contrast, ice and snow on urban roads and buildings are frequently removed by intensive human activities, which consequently diminishes ΔWSA [4].
Since large amounts of natural surfaces are replaced by impervious surfaces in urbanization process, the space for vegetation growth is limited within urban areas. It is commonly believed that the cooling effects produced by vegetation through transpiration and shading are the primary causes of the SUHI phenomenon, especially during the daytime in summer [18,64,69]. This study confirmed a negative correlation between summer daytime SUHII and ΔEVI, with ΔEVI accounting for the vast majority (72%) of the variation in daytime SUHII in summer. This suggests that increasing urban vegetation cover can significantly reduce SUHII during this period [66]. Figure 8 shows that values of annual and summer ΔEVI are negative in 24 cities, and 26 cities present negative ΔEVI in winter (Figure 8A–C). It is worth noting that Hohhot and Bayannur had lower annual ΔEVI values of −0.035 and −0.028, values of −0.072 and −0.068 in summer, and −0.017 and −0.010 in winter, respectively. This suggests that neighboring areas such as the Daqing Mountains in Hohhot, the Yinshan Mountains in Bayannur, and the Hetao Plain still maintain more natural vegetation than urban areas. Despite the dry climate of these regions, they are able to sustain healthy agriculture and natural vegetation due to centralized irrigation resources. Conversely, cities of Wuhai, Qingtongxia, Baiyin, Korla, Turpan, and Karamay had positive ΔEVI values throughout the year and in summer, consequently presenting the SUCI effect. For example, Turpan and Karamay, located in the arid environments of the Turpan and Junggar Basins, recorded higher values of 0.010 and 0.012 for annual ΔEVI, and values of 0.018 and 0.023 in summer, respectively. In the areas surrounding these cities, the natural vegetation consists of desert plants adapted to extreme arid conditions, with a low level of biomass and greening. In contrast, urban areas have achieved higher levels of vegetation growth through artificial irrigation and other management practices. Notably, we found a significant positive correlation between SUHII and ΔEVI during daytime in winter. However, in northern China, both urban and suburban areas have little green vegetation during winter, with EVI values close to 0. As a result, the uncertainty of the product causes slight variations in EVI. This phenomenon was also found in previous studies, and it was attributed to the spurious EVI values or winter snow [4,23]. Additionally, the seasonal variation in ΔEVI is the best predictor of daytime SSA (r = −0.816, p < 0.01) (Figure 8D).
Soil moisture is highly correlated with vegetation and its canopy water content [70], and changes in soil moisture can affect SUHI [71]. This study confirms a significant negative correlation between daytime SUHII and ΔNDMI in both summer and winter, with ΔNDMI explaining 7% of the variation in daytime SUHII. This can be easily explained that, with the increase in soil moisture, latent heat flux significantly increases in suburban areas due to the evaporation of soil moisture and enhanced transpiration of vegetation. Consequently, in suburban regions, sensible heat flux and LST decrease lead to an increase in SUHII [72,73]. A weak positive correlation is observed throughout the year at night, with ΔNDMI explaining 5% of nighttime SUHII. Since intensive evapotranspiration during the day causes a loss of soil moisture, which lowers the thermal capacity of soil. This leads to rapid nocturnal cooling in suburban areas, resulting in an increase in nighttime SUHII [74].
It has been reported that the relationship between SUHII and air temperature differed greatly in different areas. Studies by Du et al. (2016) [75] and Zhou et al. (2014) [4] showed a positive relationship between daytime SUHII and air temperature. However, in Yao et al. (2021) [52], it was demonstrated that the meteorological factors were significantly correlated with both CLUHII and SUHII in few cities. The differences were attributed to different time scales for UHI referred to among these studies, and effect of meteorological factors being masked by urbanization factors during the study period when the region was undergoing rapid urbanization [52]. In this study, a significantly negative correlation was revealed between mean air temperature and nighttime SUHII in winter. In northern China, it is always cold in winter, and the heating demand leads to more anthropogenic heat release, especially at nighttime, which further exacerbates SUHII [2]. This study found that precipitation was correlated positively with daytime SUHII, offering part explanation for daytime SUHII variations, particularly in winter (23%) (Figure 6). In this region, the growth of natural vegetation in a suburban area is dependent on precipitation and is sensitive to the variation in precipitation amount [76]. Figure 9A shows significantly negative correlation between annual TP and ΔEVI. An increase in precipitation facilitates the growth of vegetation and increase in soil moisture in suburban areas, thus creates substantial differences in soil and vegetation water content between urban and suburban areas, enhancing the daytime evaporative cooling effect in suburban region and exacerbating SUHII [4]. Figure 9B shows a positive correlation between annual MT and ΔWSA. It indicates that warm climate conditions may promote growth of natural vegetation in suburban area and decrease the albedo compared to the original bare soil. Winter MT presents a significant positive correlation with ΔWSA (Figure 9C), since an increase in winter temperatures leads to ice and snow melt, reducing the coverage of these surfaces, thereby lowering surface albedo [77]. TP in summer is positively correlated with ΔWSA (Figure 9D), because increasing precipitation can enhance soil moisture and impel growth of natural vegetation in suburban areas, which usually has a lower albedo [78]. Figure 9E shows a significant positive correlation between winter MT and ΔNDMI, possibly because higher winter temperatures accelerate the melting of ice and snow. In urban areas, the UHI effect causes faster snowmelt, allowing soils to gain more moisture, while in suburban areas, slower melting limits the increase in moisture. Therefore, we draw the conclusion that climate indirectly affects SUHII by influencing vegetation activity [69], surface albedo [79], and soil moisture in arid and semi-arid regions in northern China.
BI and NTL have been demonstrated to impose influence on SUHII in previous studies and are classified into socio-economic factors. Generally, the larger the BI, the higher the LST [80,81]. NTL is usually used to represent anthropogenic heat release in urban areas, and higher NTL is able to cause higher LST [82]. The present study revealed a significant positive correlation between ΔBI and SUHII, especially for nighttime when ΔBI accounted for 4% of SUHII variations (Figure 6). Urbanization leads to higher BI in urban areas compared to suburban areas, thus a greater ΔBI indicates a stronger SUHII, especially after the release of stored heat at night [83]. For instance, in the provincial capitals of Urumqi, Lanzhou, and Hohhot, the values of ΔBI were greater than those in other cities (53.125, 53.422, and 56.872, respectively), corresponding to relatively higher nighttime SUHII (1.279 °C, 0.942 °C, and 1.502 °C, respectively). This is primarily attributed to the heat trapping effect of street canyons, the high heat absorption and storage capacity of building materials, and the reduction in vertical fluxes [84,85]. Conversely, the cities of Aksu, Turpan, and Qingtongxia exhibited lower ΔBI than the other cities (21.293, 21.967, and 26.253, respectively) and presented lower nighttime SUHII (0.209 °C, 0.046 °C, and 0.197 °C, respectively). NTL is commonly regarded as an effective proxy for human activities and is capable of revealing population density, socio-economic development levels, and degrees of urbanization [86]. Previous studies on large cities have identified a positive correlation between ΔNTL and SUHII [4,23]. However, our research demonstrated that, in the arid and semi-arid regions of northern China, ΔNTL did not exhibit significant correlation with SUHII nor did it provide substantial explanatory power for SUHII variations (Figure 6). It may be attributed to the small size and low population density of most cities within the regions, where the intensity of night light is significantly reduced compared to large cities and the variations in ΔNTL are weaker, resulting in a less pronounced influence on the UHI effect.
Consistent with numerous studies [9,18], we found that SUHII increased with the rise in UAS (Figure 6). An increase in UAS indicates a rise in impervious surfaces and a reduction in green space coverage, thereby leading to an increase in SUHII [87]. Temporally, from 2010 to 2020, the total growth rate of the UAS in 30 cities ranged from 9.40% (Lanzhou) to 235.13% (Aksu). Spatially, the average UAS across these cities varied from 6.972 km2 (Zhangye) to 445.433 km2 (Baotou). For example, cities like Urumqi and Baotou, which had a large UAS (309.195 km2 and 445.433 km2, respectively), also exhibited higher SUHII (daytime SUHII of 2.665 °C and 1.031 °C, respectively, and nighttime SUHII of 1.279 °C and 0.612 °C, respectively). Conversely, cities such as Qingyang, Longnan, and Baiyin, which had small UAS (9.024 km2, 11.419 km2, and 11.709 km2, respectively), possessed correspondingly lower SUHII (daytime SUHII of 0.129 °C, 0.262 °C, and −0.172 °C, respectively, and nighttime SUHII of 0.285 °C, 0.141 °C, and 0.405 °C, respectively). Therefore, it is recommended to mitigate the UHI effect by making regulations and policies that restrict unplanned urban expansion on the urban fringe.
FD has been reported to impose influence on SUHI in previous studies [88,89,90]. Generally, higher FD values indicate a more complex spatial organization of the urban area [89]. In the present study, no significant contribution was found in explaining the variations in daytime and nighttime SUHIIs. However, a significant positive correlation was observed between FD and SUHII during both day and night. The larger the FD, the higher the SUHII. These results suggest that cities with more complex spatial structures tend to exhibit stronger SUHI effects, which is consistent with the conclusions of previous studies [42,88,90].
In Chakraborty et al. (2020) [26], it was reported that higher mean altitudes were associated with lower temperatures. For the 30 cities in this study, the range of ΔDEM extended from −57.063 m (Lanzhou) to 56.743 m (Karamay). The results presented a slight negative correlation between ΔDEM and summer nighttime SUHII; however, it explained 6% of SUHII variations (Figure 6). At night, areas with high altitudes experienced faster surface cooling [91]. For instance, cities like Lanzhou and Urumqi, which exhibited lower ΔDEM (−57.063 m and −30.511 m, respectively), also had relatively higher summer nighttime SUHII (0.923 °C and 1.395 °C, respectively). In contrast, cities such as Aksu and Karamay, with notably high ΔDEM (19.267 m and 56.743 m, respectively), displayed lower summer nighttime SUHII in summer (0.147 °C and 0.275 °C, respectively). This is primarily due to enhanced air circulation in urban areas with a high altitude, which facilitates heat dissipation, thereby mitigating the UHI effect. Therefore, if the altitude of urban areas is higher than the surrounding suburban areas, this rapid cooling effect can help reduce the temperature difference between urban and suburban areas.

4.3. Implications and Limitations

In the arid and semi-arid regions of northern China, the rapid urbanization is significantly altering the urban environment. Our findings reveal important impacts of surface albedo, vegetation activity, soil moisture, climate, built-up intensity, urban size, urban morphology and topography on the spatio-temporal variations in SUHII in this region. Since large-scale adjustment of background climate and topography appears impractical and unfeasible, efforts should be more focused on managing albedo, soil moisture, vegetation, and controlling built-up intensity as well as urban size to alleviate SUHII. The stepwise multiple linear regression analysis provides quantitative results on the independent and combined effects of each potential driving factor on SUHII, enabling decision makers to make effective urban planning and management strategies to mitigate SUHII. For instance, albedo management is considered as a practical measure for mitigating UHI effect [92]. ΔWSA, as the most significant driving factor for SUHII of cities in the arid and semi-arid regions of northern China, shows a significant negative correlation with SUHII, indicating that increasing albedo in urban area could reduce the absorption and storage of solar radiation during the day. Hence, reflective strategies such as using reflective roofs and materials are encouraged, which might be more effective in mitigating UHI than vegetative approaches [93]. Similarly to cities in other places mentioned in previous studies [4,94], this study also demonstrates that increasing vegetation is the most effective way to alleviate the daytime SUHI in summer in cities located in the arid and semi-arid region of China.
It has been pointed out that, in large-scale SUHI studies, rapid changes in land cover could not be ignored, and the concurrent regional or global land cover data at an annual or timely manner should be used [12]. However, most previous studies used outdated urban area maps [9,18] or a limited number of urban maps [4,64] to obtain SUHII over a long time period. Zhao et al. (2016) reported that an underestimation of 50% in SUHII might be produced by using outdated urban-extent maps in China, especially during the daytime [95]. In this study, the land cover dataset in China (CLCD) was used, ensuring to update the urban boundary timely every year, since this dataset provided annual land cover maps with good accuracy. Thus, the accuracy of derived SUHII is enhanced, and the confidence of the results and conclusions in UHI study is improved.
On the other hand, this study encountered several limitations. First, the impact of anthropogenic heat release on SUHI was not found to be significant, differing from the conclusions of some studies [4,18]. The reason for this discrepancy remains unclear. One possible reason is that the night light data used for characterizing anthropogenic heat release is suitable for large cities. In small and medium-sized cities, the night light intensity is lower, and its variation is subtle, thus it is difficult to establish a clear association with SUHII. In future research, alternative data sources are expected to be employed to more accurately represent anthropogenic heat release in the arid and semi-arid regions of northern China, such as traffic flow data and energy consumption data. Traffic flow data can reflect the heat and emissions produced by vehicle operations, which are significant contributors to the UHI effect. Energy consumption data can indirectly indicate the heat released into the atmosphere, particularly during the cold winter when heating demand in northern regions significantly increases energy consumption, thus exacerbating anthropogenic heat release. Second, the relationship between impact factors and LST often varies with spatial resolution [96]. Further studies should investigate scale effects to more accurately explore the relationships between driving factors and SUHII. Third, to gain a more comprehensive understanding of SUHII variations in arid and semi-arid regions, future research should consider other potential driving factors not covered in this study, such as landscape configuration [83], wind speed and direction [1], and land cover types around urban areas. Fourth, this study employed multiple linear regression to account for the contributions of individual variables. However, potential interactive effects among these factors were not considered. Future research should adopt multi-factor analytical models to elucidate the complex interdependencies among the driving forces and more comprehensively clarify their combined impacts on SUHII.

5. Conclusions

This study focuses on the SUHI spatio-temporal characteristics and potential drivers of cities in the arid and semi-arid regions of northern China. Temporally, annual mean daytime SUHII showed a significant decreasing trend from 2010 to 2020, whereas nighttime SUHII exhibited a significant increase. Some cities experienced the SUCI phenomenon during the day, especially in winter. Most cities (22 out of 30) had higher daytime SUHII in summer than in winter, while the opposite case appeared at night. There was a positive correlation between annual daytime SUHII and annual nighttime SUHII, and a significant positive correlation was observed between summer nighttime SUHII and winter nighttime SUHII. Spatially, the higher the latitude, the greater the daytime SUHII throughout the year. For these variations in SUHII, ΔWSA, and ΔEVI were the main driving factors, and the background climate also contributed to UHI by imposing direct influence on natural vegetation in suburban areas. In addition, daytime SUHII was also affected by ΔNDMI, UAS, and TP, while nighttime SUHII variations were also driven by ΔNDMI and ΔDEM changes. In most cases, the UHI effect can be effectively mitigated by increasing urban greenery and using building and road materials with high reflectance. These findings not only provide theoretical and scientific guidance for formulating sustainable development strategies and mitigating the UHI effect in the study regions but also help deepen our understanding of the SUHI effect in arid and semi-arid regions globally.

Author Contributions

Conceptualization, L.L.; methodology, J.W., L.L. and X.Z.; software, J.W. and Z.C.; validation, J.W., X.Z. and L.L.; formal analysis, J.W. and L.L.; writing—original draft preparation, J.W. and L.L.; writing—review and editing, L.L., X.Z. and G.H.; visualization, J.W.; funding acquisition, X.Z., G.H. and L.L. All authors have read and agreed to the published version of the manuscript.

Funding

This research was funded by the National Natural Science Foundation of China (grant numbers 42061056, 42171322, and 42371365), the Gansu Provincial Science and Technology Program (grant number 23JRRA1059), and the Fundamental Research Funds for the Central Universities (grant number lzujbky-2023-35).

Data Availability Statement

The LST data are available at https://earthdata.nasa.gov/ (accessed on 1 October 2023). The CLCD data are available at https://zenodo.org/records/12779975 (accessed on 1 October 2023). The EVI data are available at https://earthdata.nasa.gov/ (accessed on 1 October 2023). The DEM data are available at http://earthexplorer.usgs.gov/ (accessed on 1 October 2023). The WSA data are available at https://earthdata.nasa.gov/ (accessed on 1 October 2023). The NDMI data are available at https://earthdata.nasa.gov/ (accessed on 18 March 2025). The NTL data are available at https://dataverse.harvard.edu/dataset.xhtml?persistentId=doi:10.7910/DVN/GIYGJU (accessed on 1 October 2023). The temperature and precipitation data are available at http://data.cma.cn (accessed on 1 October 2023).

Acknowledgments

First: I would like to express my sincere gratitude to Xuanlong Ma for his invaluable guidance and suggestions throughout this study. Second, I am deeply thankful to the anonymous reviewers for their constructive comments, which have significantly improved this manuscript. Finally, I extend my appreciation to all individuals and institutions that supported and contributed to this research.

Conflicts of Interest

The manuscript is an original work, and we confirm that neither the manuscript nor any parts of its content are currently under consideration for publication with or published in another journal. All authors have approved the manuscript and agree with its submission to Remote Sensing. The authors do not have any possible conflicts of interest.

References

  1. Wu, Y.; Zhang, X.; Shen, L. The impact of urbanization policy on land use change: A scenario analysis. Cities 2011, 28, 147–159. [Google Scholar] [CrossRef]
  2. Mohajerani, A.; Bakaric, J.; Jeffrey-Bailey, T. The urban heat island effect, its causes, and mitigation, with reference to the thermal properties of asphalt concrete. J. Environ. Manag. 2017, 197, 522–538. [Google Scholar] [CrossRef]
  3. Rossi, F.; Pisello, A.L.; Nicolini, A.; Filipponi, M.; Palombo, M. Analysis of retro-reflective surfaces for urban heat island mitigation: A new analytical model. Appl. Energy 2014, 114, 621–631. [Google Scholar] [CrossRef]
  4. Zhou, D.; Zhao, S.; Liu, S.; Zhang, L.; Zhu, C. Surface urban heat island in China’s 32 major cities: Spatial patterns and drivers. Remote Sens. Environ. 2014, 152, 51–61. [Google Scholar] [CrossRef]
  5. Susca, T.; Pomponi, F. Heat island effects in urban life cycle assessment: Novel insights to include the effects of the urban heat island and UHI-mitigation measures in LCA for effective policy making. J. Ind. Ecol. 2020, 24, 410–423. [Google Scholar] [CrossRef]
  6. Singh, N.; Singh, S.; Mall, R.K. Urban ecology and human health: Implications of urban heat island, air pollution and climate change nexus. In Urban Ecology; Elsevier: Amsterdam, The Netherlands, 2020; pp. 317–334. [Google Scholar] [CrossRef]
  7. Vargas, N.; Magaña, V. Climatic risk in the Mexico city metropolitan area due to urbanization. Urban Clim. 2020, 33, 100644. [Google Scholar] [CrossRef]
  8. Huang, H.; Deng, X.; Yang, H.; Zhou, X.; Jia, Q. Spatio-Temporal Mechanism Underlying the Effect of Urban Heat Island on Cardiovascular Diseases. Iran. J. Public Health 2020, 49, 1455. [Google Scholar] [CrossRef]
  9. Imhoff, M.L.; Zhang, P.; Wolfe, R.E.; Bounoua, L. Remote sensing of the urban heat island effect across biomes in the continental USA. Remote Sens. Environ. 2010, 114, 504–513. [Google Scholar] [CrossRef]
  10. Oke, T.R. The energetic basis of the urban heat island. Q. J. R. Meteorol. Soc. 1982, 108, 1–24. [Google Scholar] [CrossRef]
  11. Hu, L.; Brunsell, N.A. A new perspective to assess the urban heat island through remotely sensed atmospheric profiles. Remote Sens. Environ. 2015, 158, 393–406. [Google Scholar] [CrossRef]
  12. Zhou, D.; Xiao, J.; Bonafoni, S.; Berger, C.; Deilami, K.; Zhou, Y.; Frolking, S.; Yao, R.; Qiao, Z.; Sobrino, J. Satellite Remote Sensing of Surface Urban Heat Islands: Progress, Challenges, and Perspectives. Remote Sens. 2018, 11, 48. [Google Scholar] [CrossRef]
  13. Clay, R.; Guan, H.; Wild, N.; Bennett, J.; Vinodkumar; Ewenz, C. Urban Heat Island traverses in the City of Adelaide, South Australia. Urban Clim. 2016, 17, 89–101. [Google Scholar] [CrossRef]
  14. Chen, L.; Wang, X.; Cai, X.; Yang, C.; Lu, X. Seasonal Variations of Daytime Land Surface Temperature and Their Underlying Drivers over Wuhan, China. Remote Sens. 2021, 13, 323. [Google Scholar] [CrossRef]
  15. Mirzaei, P.A.; Haghighat, F. Approaches to study Urban Heat Island—Abilities and limitations. Build. Environ. 2010, 45, 2192–2201. [Google Scholar] [CrossRef]
  16. Wang, K.; Jiang, S.; Wang, J.; Zhou, C.; Wang, X.; Lee, X. Comparing the diurnal and seasonal variabilities of atmospheric and surface urban heat islands based on the Beijing urban meteorological network. J. Geophys. Res. Atmos. 2017, 122, 2131–2154. [Google Scholar] [CrossRef]
  17. Dewan, A.; Kiselev, G.; Botje, D.; Mahmud, G.I.; Bhuian, M.H.; Hassan, Q.K. Surface urban heat island intensity in five major cities of Bangladesh: Patterns, drivers and trends. Sustain. Cities Soc. 2021, 71, 102926. [Google Scholar] [CrossRef]
  18. Peng, S.; Piao, S.; Ciais, P.; Friedlingstein, P.; Ottle, C.; Bréon, F.-M.; Nan, H.; Zhou, L.; Myneni, R.B. Surface Urban Heat Island Across 419 Global Big Cities. Environ. Sci. Technol. 2012, 46, 696–703. [Google Scholar] [CrossRef]
  19. Gohain, K.J.; Mohammad, P.; Goswami, A. Assessing the impact of land use land cover changes on land surface temperature over Pune city, India. Quat. Int. 2021, 575, 259–269. [Google Scholar] [CrossRef]
  20. Rizvi, S.H.; Fatima, H.; Iqbal, M.J.; Alam, K. The effect of urbanization on the intensification of SUHIs: Analysis by LULC on Karachi. J. Atmos. Sol.-Terr. Phys. 2020, 207, 105374. [Google Scholar] [CrossRef]
  21. Shao, L.; Liao, W.; Li, P.; Luo, M.; Xiong, X.; Liu, X. Drivers of global surface urban heat islands: Surface property, climate background, and 2D/3D urban morphologies. Build. Environ. 2023, 242, 110581. [Google Scholar] [CrossRef]
  22. Yang, Q.; Xu, Y.; Tong, X.; Hu, T.; Liu, Y.; Chakraborty, T.C.; Yao, R.; Xiao, C.; Chen, S.; Ma, Z. Influence of urban extent discrepancy on the estimation of surface urban heat island intensity: A global-scale assessment in 892 cities. J. Clean. Prod. 2023, 426, 139032. [Google Scholar] [CrossRef]
  23. Yao, R.; Wang, L.; Huang, X.; Niu, Z.; Liu, F.; Wang, Q. Temporal trends of surface urban heat islands and associated determinants in major Chinese cities. Sci. Total Environ. 2017, 609, 742–754. [Google Scholar] [CrossRef] [PubMed]
  24. Chen, Y.; Xie, M.; Chen, B.; Wang, H.; Teng, Y. Surface Regional Heat (Cool) Island Effect and Its Diurnal Differences in Arid and Semiarid Resource-based Urban Agglomerations. Chin. Geogr. Sci. 2023, 33, 131–143. [Google Scholar] [CrossRef]
  25. Rasul, A.; Balzter, H.; Smith, C. Diurnal and Seasonal Variation of Surface Urban Cool and Heat Islands in the Semi-Arid City of Erbil, Iraq. Climate 2016, 4, 42. [Google Scholar] [CrossRef]
  26. Chakraborty, T.; Hsu, A.; Manya, D.; Sheriff, G. A spatially explicit surface urban heat island database for the United States: Characterization, uncertainties, and possible applications. ISPRS J. Photogramm. Remote Sens. 2020, 168, 74–88. [Google Scholar] [CrossRef]
  27. Bhanage, V.; Kulkarni, S.; Sharma, R.; Lee, H.; Gedam, S. Enumerating and Modelling the Seasonal alterations of Surface Urban Heat and Cool Island: A Case Study over Indian Cities. Urban Sci. 2023, 7, 38. [Google Scholar] [CrossRef]
  28. Haashemi, S.; Weng, Q.; Darvishi, A.; Alavipanah, S. Seasonal Variations of the Surface Urban Heat Island in a Semi-Arid City. Remote Sens. 2016, 8, 352. [Google Scholar] [CrossRef]
  29. Masoodian, S.A.; Montazeri, M. Quantifying of surface urban cool island in arid environments case study: Isfahan metropolis. Landsc. Ecol. Eng. 2021, 17, 147–156. [Google Scholar] [CrossRef]
  30. Gherraz, H.; Guechi, I.; Alkama, D. Quantifying the effects of spatial patterns of green spaces on urban climate and urban heat island in a semi-arid climate. Bull. Société R. Sci. Liège 2020, 89, 164–185. [Google Scholar] [CrossRef]
  31. Gong, P.; Li, X.; Zhang, W. 40-Year (1978–2017) human settlement changes in China reflected by impervious surfaces from satellite remote sensing. Sci. Bull. 2019, 64, 756–763. [Google Scholar] [CrossRef]
  32. Miao, S.; Jiang, W.; Liang, P.; Liu, H.; Wang, X.; Tan, J.; Zhang, N.; Li, J.; Du, W.; Pei, L. Advances in Urban Meteorological Research in China. J. Meteorol. Res. 2020, 34, 218–242. [Google Scholar] [CrossRef]
  33. Zhou, D.; Sun, S.; Li, Y.; Zhang, L.; Huang, L. A multi-perspective study of atmospheric urban heat island effect in China based on national meteorological observations: Facts and uncertainties. Sci. Total Environ. 2023, 854, 158638. [Google Scholar] [CrossRef] [PubMed]
  34. Yang, Y.; Guangrong, S.; Chen, Z.; Hao, S.; Zhouyiling, Z.; Shan, Y. Quantitative analysis and prediction of urban heat island intensity on urban-rural gradient: A case study of Shanghai. Sci. Total Environ. 2022, 829, 154264. [Google Scholar] [CrossRef] [PubMed]
  35. Sun, D.; Hu, C.; Wang, Y.; Wang, Z.; Zhang, J. Examining Spatio-Temporal Characteristics of Urban Heat Islands and Factors Driving Them in Hangzhou, China. IEEE J. Sel. Top. Appl. Earth Obs. Remote Sens. 2021, 14, 8316–8325. [Google Scholar] [CrossRef]
  36. Sun, Y.; Gao, C.; Li, J.; Wang, R.; Liu, J. Evaluating urban heat island intensity and its associated determinants of towns and cities continuum in the Yangtze River Delta Urban Agglomerations. Sustain. Cities Soc. 2019, 50, 101659. [Google Scholar] [CrossRef]
  37. Wang, Z.; Meng, Q.; Allam, M.; Hu, D.; Zhang, L.; Menenti, M. Environmental and anthropogenic drivers of surface urban heat island intensity: A case-study in the Yangtze River Delta, China. Ecol. Indic. 2021, 128, 107845. [Google Scholar] [CrossRef]
  38. Fu, X.; Yao, L.; Xu, W.; Wang, Y.; Sun, S. Exploring the multitemporal surface urban heat island effect and its driving relation in the Beijing-Tianjin-Hebei urban agglomeration. Appl. Geogr. 2022, 144, 102714. [Google Scholar] [CrossRef]
  39. Hou, L.; Yue, W.; Liu, X. Spatiotemporal patterns and drivers of summer heat island in Beijing-Tianjin-Hebei Urban Agglomeration, China. IEEE J. Sel. Top. Appl. Earth Obs. Remote Sens. 2021, 14, 7516–7527. [Google Scholar] [CrossRef]
  40. Geng, S.; Yang, L.; Sun, Z.; Wang, Z.; Qian, J.; Jiang, C.; Wen, M. Spatiotemporal patterns and driving forces of remotely sensed urban agglomeration heat islands in South China. Sci. Total Environ. 2021, 800, 149499. [Google Scholar] [CrossRef]
  41. Shahfahad, A.A.; Bindajam, A.A.; Naikoo, M.W.; Horo, J.P.; Mallick, J.; Rihan, M.; Malcoti, M.D.; Talukdar, S.; Rahman, R.; Rahman, A. Response of soil moisture and vegetation conditions in seasonal variation of land surface temperature and surface urban heat island intensity in sub-tropical semi-arid cities. Theor. Appl. Clim. 2023, 153, 367–395. [Google Scholar] [CrossRef]
  42. Zhou, B.; Rybski, D.; Kropp, J.P. The role of city size and urban form in the surface urban heat island. Sci. Rep. 2017, 7, 4791. [Google Scholar] [CrossRef] [PubMed]
  43. Wan, Z.; Dozier, J. A generalized split-window algorithm for retrieving land-surface temperature from space. IEEE Trans. Geosci. Remote Sens. 1996, 34, 892–905. [Google Scholar] [CrossRef]
  44. Crosson, W.L.; Al-Hamdan, M.Z.; Hemmings, S.N.; Wade, G.M. A daily merged MODIS Aqua–Terra land surface temperature data set for the conterminous United States. Remote Sens. Environ. 2012, 119, 315–324. [Google Scholar] [CrossRef]
  45. Zhou, D.; Bonafoni, S.; Zhang, L.; Wang, R. Remote sensing of the urban heat island effect in a highly populated urban agglomeration area in East China. Sci. Total Environ. 2018, 628–629, 415–429. [Google Scholar] [CrossRef]
  46. Yang, J.; Huang, X. The 30 m annual land cover datasets and its dynamics in China from 1985 to 2022. Earth Syst. Sci. Data 2023, 13, 3907–3925. [Google Scholar] [CrossRef]
  47. Huete, A.; Didan, K.; Miura, T.; Rodriguez, E.P.; Gao, X.; Ferreira, L.G. Overview of the radiometric and biophysical performance of the MODIS vegetation indices. Remote Sens. Environ. 2002, 83, 195–213. [Google Scholar] [CrossRef]
  48. Rodriguez, E.; Morris, C.S.; Belz, J.E.; Chapin, E.C.; Martin, J.M.; Daffer, W.; Hensley, S. An Assessment of the SRTM Topographic Products; Technical Report JPL D-31639; Jet Propulsion Laboratory: Pasadena, CA, USA, 2005; p. 143. [Google Scholar]
  49. Wu, Y.; Shi, K.; Chen, Z.; Liu, S.; Chang, Z. Developing Improved Time-Series DMSP-OLS-Like Data (1992–2019) in China by Integrating DMSP-OLS and SNPP-VIIRS. IEEE Trans. Geosci. Remote Sens. 2021, 60, 4407714. [Google Scholar] [CrossRef]
  50. Lu, D.; Weng, Q. Use of impervious surface in urban land-use classification. Remote Sens. Environ. 2006, 102, 146–160. [Google Scholar] [CrossRef]
  51. Peng, S.; Feng, Z.; Liao, H.; Huang, B.; Peng, S.; Zhou, T. Spatial-temporal pattern of, and driving forces for, urban heat island in China. Ecol. Indic. 2019, 96, 127–132. [Google Scholar] [CrossRef]
  52. Yao, R.; Wang, L.; Huang, X.; Liu, Y.; Niu, Z.; Wang, S.; Wang, L. Long-term trends of surface and canopy layer urban heat island intensity in 272 cities in the mainland of China. Sci. Total Environ. 2021, 772, 145607. [Google Scholar] [CrossRef]
  53. Reisi, M.; Ahmadi Nadoushan, M.; Aye, L. Remote sensing for urban heat and cool islands evaluation in semi-arid areas. Glob. J. Environ. Sci. Manag. 2019, 5, 319–330. [Google Scholar] [CrossRef]
  54. Karimi, A.; Mohammad, P.; Gachkar, S.; Gachkar, D.; García-Martínez, A.; Moreno-Rangel, D.; Brown, R.D. Surface Urban Heat Island Assessment of a Cold Desert City: A Case Study over the Isfahan Metropolitan Area of Iran. Atmosphere 2021, 12, 1368. [Google Scholar] [CrossRef]
  55. Fryd, O.; Pauleit, S.; Bühler, O. The role of urban green space and trees in relation to climate change. CABI Rev. 2012, 6, 1–18. [Google Scholar] [CrossRef]
  56. He, K.; Huo, H.; Zhang, Q. Urban air pollution in China: Current status, characteristics, and progress. Annu. Rev. Energy Environ. 2002, 27, 397–431. [Google Scholar] [CrossRef]
  57. Sang, J.; Liu, H.; Liu, H.; Zhang, Z. Observational and numerical studies of wintertime urban boundary layer. J. Wind Eng. Ind. Aerodyn. 2000, 87, 243–258. [Google Scholar] [CrossRef]
  58. Li, D.; Bou-Zeid, E. Synergistic interactions between urban heat islands and heat waves: The impact in cities is larger than the sum of its parts. J. Appl. Meteorol. Climatol. 2013, 52, 2051–2064. [Google Scholar] [CrossRef]
  59. Montazeri, M.; Masoodian, S.A. Tempo-spatial behavior of surface urban heat island of Isfahan metropolitan area. J. Indian Soc. Remote Sens. 2020, 48, 263–270. [Google Scholar] [CrossRef]
  60. Lazzarini, M.; Marpu, P.R.; Ghedira, H. Temperature-land cover interactions: The inversion of urban heat island phenomenon in desert city areas. Remote Sens. Environ. 2013, 130, 136–152. [Google Scholar] [CrossRef]
  61. Georgescu, M.; Moustaoui, M.; Mahalov, A.; Dudhia, J. An alternative explanation of the semiarid urban area “oasis effect”. J. Geophys. Res. Atmos. 2011, 116, D24113. [Google Scholar] [CrossRef]
  62. Wang, Y.; Berardi, U.; Akbari, H. Comparing the effects of urban heat island mitigation strategies for Toronto, Canada. Energy Build. 2016, 114, 2–19. [Google Scholar] [CrossRef]
  63. Dutta, K.; Basu, D.; Agrawal, S. Evaluation of seasonal variability in magnitude of urban heat islands using local climate zone classification and surface albedo. Int. J. Environ. Sci. Technol. 2022, 19, 8677–8698. [Google Scholar] [CrossRef]
  64. Zhou, D.; Zhang, L.; Li, D.; Huang, D.; Zhu, C. Climate–vegetation control on the diurnal and seasonal variations of surface urban heat islands in China. Environ. Res. Lett. 2016, 11, 074009. [Google Scholar] [CrossRef]
  65. Lin, P.; Gou, Z.; Lau, S.; Qin, H. The Impact of Urban Design Descriptors on Outdoor Thermal Environment: A Literature Review. Energies 2017, 10, 2151. [Google Scholar] [CrossRef]
  66. Wang, J.; Huang, B.; Fu, D.; Atkinson, P. Spatiotemporal Variation in Surface Urban Heat Island Intensity and Associated Determinants across Major Chinese Cities. Remote Sens. 2015, 7, 3670–3689. [Google Scholar] [CrossRef]
  67. Vujovic, S.; Haddad, B.; Karaky, H.; Sebaibi, N.; Boutouil, M. Urban Heat Island: Causes, Consequences, and Mitigation Measures with Emphasis on Reflective and Permeable Pavements. CivilEng 2021, 2, 459–484. [Google Scholar] [CrossRef]
  68. Lian, X.; Zeng, Z.; Yao, Y.; Peng, S.; Wang, K.; Piao, S. Spatiotemporal variations in the difference between satellite-observed daily maximum land surface temperature and station-based daily maximum near-surface air temperature. J. Geophys. Res. Atmos. 2017, 122, 2254–2268. [Google Scholar] [CrossRef]
  69. Deng, X.; Yu, W.; Shi, J.; Huang, Y.; Li, D.; He, X.; Xie, Z. Characteristics of surface urban heat islands in global cities of different scales: Trends and drivers. Sustain. Cities Soc. 2024, 107, 105483. [Google Scholar] [CrossRef]
  70. Jin, S.; Sader, S.A. Comparison of time series tasseled cap wetness and the normalized difference moisture index in detecting forest disturbances. Remote Sens. Environ. 2005, 94, 364–372. [Google Scholar] [CrossRef]
  71. Schatz, J.; Kucharik, C.J. Seasonality of the urban heat island effect in Madison, Wisconsin. J. Appl. Meteorol. Climatol. 2014, 53, 2371–2386. [Google Scholar] [CrossRef]
  72. Tabassum, A.; Hong, S.-H.; Park, K.; Baik, J.-J. Impacts of Changes in Soil Moisture on Urban Heat Islands and Urban Breeze Circulations: Idealized Ensemble Simulations. Asia-Pac. J. Atmos. Sci. 2024, 60, 541–553. [Google Scholar] [CrossRef]
  73. Husain, S.Z.; Bélair, S.; Leroyer, S. Influence of soil moisture on urban microclimate and surface-layer meteorology in Oklahoma City. J. Appl. Meteorol. Climatol. 2014, 53, 83–98. [Google Scholar] [CrossRef]
  74. Martilli, A. Numerical study of urban impact on boundary layer structure: Sensitivity to wind speed, urban morphology, and rural soil moisture. J. Appl. Meteorol. 2002, 41, 1247–1266. [Google Scholar] [CrossRef]
  75. Du, H.; Wang, D.; Wang, Y.; Zhao, X.; Qin, F.; Jiang, H.; Cai, Y. Influences of land cover types, meteorological conditions, anthropogenic heat and urban area on surface urban heat island in the Yangtze River Delta Urban Agglomeration. Sci. Total Environ. 2016, 571, 461–470. [Google Scholar] [CrossRef]
  76. Lambers, H.; Oliveira, R.S. Plant water relations. In Plant Physiological Ecology; Springer International Publishing: Cham, Switzerland, 2019; pp. 187–263. [Google Scholar] [CrossRef]
  77. Wang, S.; Davidson, A. Impact of climate variations on surface albedo of a temperate grassland. Agric. For. Meteorol. 2007, 142, 133–142. [Google Scholar] [CrossRef]
  78. Sugathan, N.; Biju, V.; Renuka, G. Influence of soil moisture content on surface albedo and soil thermal parameters at a tropical station. J. Earth Syst. Sci. 2014, 123, 1115–1128. [Google Scholar] [CrossRef]
  79. Hall, A. The Role of Surface Albedo Feedback in Climate. J. Clim. 2004, 17, 1550–1568. [Google Scholar] [CrossRef]
  80. Morabito, M.; Crisci, A.; Messeri, A.; Orlandini, S.; Raschi, A.; Maracchi, G.; Munafò, M. The impact of built-up surfaces on land surface temperatures in Italian urban areas. Sci. Total Environ. 2016, 551–552, 317–326. [Google Scholar] [CrossRef]
  81. Fu, S.; Wang, L.; Khalil, U.; Cheema, A.H.; Ullah, I.; Aslam, B.; Alarifi, S.S. Prediction of surface urban heat island based on predicted consequences of urban sprawl using deep learning: A way forward for a sustainable environment. Phys. Chem. Earth Parts A/B/C 2024, 135, 103682. [Google Scholar] [CrossRef]
  82. Feng, J.-M.; Wang, Y.-L.; Ma, Z.-G.; Liu, Y.-H. Simulating the Regional Impacts of Urbanization and Anthropogenic Heat Release on Climate across China. J. Clim. 2012, 25, 7187–7203. [Google Scholar] [CrossRef]
  83. Li, J.; Song, C.; Cao, L.; Zhu, F.; Meng, X.; Wu, J. Impacts of landscape structure on surface urban heat islands: A case study of Shanghai, China. Remote Sens. Environ. 2011, 115, 3249–3263. [Google Scholar] [CrossRef]
  84. Karimimoshaver, M.; Khalvandi, R.; Khalvandi, M. The effect of urban morphology on heat accumulation in urban street canyons and mitigation approach. Sustain. Cities Soc. 2021, 73, 103127. [Google Scholar] [CrossRef]
  85. Mughal, M.O.; Li, X.X.; Norford, L.K. Urban heat island mitigation in Singapore: Evaluation using WRF/multilayer urban canopy model and local climate zones. Urban Clim. 2020, 34, 100714. [Google Scholar] [CrossRef]
  86. Levin, N.; Kyba, C.C.M.; Zhang, Q.; Sánchez De Miguel, A.; Román, M.O.; Li, X.; Portnov, B.A.; Molthan, A.L.; Jechow, A.; Miller, S.D.; et al. Remote sensing of night lights: A review and an outlook for the future. Remote Sens. Environ. 2020, 237, 111443. [Google Scholar] [CrossRef]
  87. Saha, M.; Kafy, A.A.; Bakshi, A.; Faisal, A.A.; Almulhim, A.I.; Rahaman, Z.A.; Al Rakib, A.; Fattah, M.A.; Akter, K.S.; Rahman, M.T.; et al. Modelling microscale impacts assessment of urban expansion on seasonal surface urban heat island intensity using neural network algorithms. Energy Build. 2022, 275, 112452. [Google Scholar] [CrossRef]
  88. Li, Y.; Schubert, S.; Kropp, J.P.; Rybski, D. On the influence of density and morphology on the Urban Heat Island intensity. Nat. Commun. 2020, 11, 2647. [Google Scholar] [CrossRef]
  89. Tu, L.; Qin, Z.; Li, W.; Geng, J.; Yang, L.; Zhao, S.; Wang, F. Surface urban heat island effect and its relationship with urban expansion in Nanjing, China. J. Appl. Remote Sens. 2016, 10, 026037. [Google Scholar] [CrossRef]
  90. Kang, S.; Lee, D.; Park, J.; Jung, J. Exploring Urban Forms Vulnerable to Urban Heat Islands: A Multiscale Analysis. Sustainability 2022, 14, 3603. [Google Scholar] [CrossRef]
  91. Wang, G.; Zhao, M.; Kang, M.; Xing, K.; Wang, Y.; Xue, F.; Chen, C. Diurnal and seasonal variation of the elevation gradient of air temperature in the northern flank of the western Qinling Mountain range, China. J. Mt. Sci. 2017, 14, 94–105. [Google Scholar] [CrossRef]
  92. Zhao, L.; Lee, X.; Smith, R.B.; Oleson, K. Strong contributions of local background climate to urban heat islands. Nature 2014, 511, 216–219. [Google Scholar] [CrossRef]
  93. Mackey, C.W.; Lee, X.; Smith, R.B. Remotely sensing the cooling effects of city scale efforts to reduce urban heat island. Build. Environ. 2012, 49, 348–358. [Google Scholar] [CrossRef]
  94. Morabito, M.; Crisci, A.; Guerri, G.; Messeri, A.; Congedo, L.; Munafò, M. Surface urban heat islands in Italian metropolitan cities: Tree cover and impervious surface influences. Sci. Total Environ. 2021, 751, 142334. [Google Scholar] [CrossRef] [PubMed]
  95. Zhao, S.; Zhou, D.; Liu, S. Data concurrency is required for estimating urban heat island intensity. Environ. Pollut. 2016, 208, 118–124. [Google Scholar] [CrossRef] [PubMed]
  96. Estoque, R.C.; Murayama, Y.; Myint, S.W. Effects of landscape composition and pattern on land surface temperature: An urban heat island study in the megacities of Southeast Asia. Sci. Total Environ. 2017, 577, 349–359. [Google Scholar] [CrossRef] [PubMed]
Figure 1. Locations of 30 cities in the arid and semi-arid regions of northern China. Background map indicates elevation.
Remotesensing 17 01339 g001
Figure 2. Boundaries of the urban and suburban areas for Lanzhou City in 2020, overlapped on: (A) the land cover map with a spatial resolution of 30 m, (B) the annual average daytime LST map, and (C) the annual average nighttime LST map with a spatial resolution of 1 km. The blue line represents the boundary of the urban area, and the area inside the black line and outside the blue line represents the suburban area.
Remotesensing 17 01339 g002aRemotesensing 17 01339 g002b
Figure 3. Variations in daytime and nighttime SUHII of 30 cities during 2010–2020 for the whole year (A,B), summer (C,D), and winter (E,F).
Remotesensing 17 01339 g003
Figure 4. Correlations between daytime and nighttime SUHII (°C) in summer (A), winter (B), and year-round (C), and correlations between summer and winter SUHII (°C) in daytime (D) and nighttime (E) for 30 cities in arid and semi-arid regions of northern China from 2010 to 2020. The solid purple line represents the fitted line from the linear regression model. AKS: Aksu; BT: Baotou; BY: Baiyin; BYNE: Bayannur; CF: Chifeng; CJ: Changji; EEDS: Ordos; HLBE: Hulunbeier; HM: Hami; HHHT: Hohhot; KEL: Korla; KLMY: Karamay; LN: Longnan; LZ; Lanzhou; PL: Pingliang; QTX: Qingtongxia; QY: Qingyang; SHZ: Shihezi; SZS: Shizuishan; TLF: Turpan; TS: Tianshui; WH: Wuhai; WLCB: Ulanqab; WLMQ: Urumqi; WW: Wuwei; WZ: Wuzhong; YC: Yinchuan; YN: Yining; ZW: Zhongwei; ZY: Zhangye.
Remotesensing 17 01339 g004
Figure 5. Spatial distribution of SUHII of 30 cities in arid and semi-arid northern China, averaged over the period 2010–2020, including the annual mean daytime and nighttime SUHII (A,B), mean daytime and nighttime SUHII during summer (C,D), mean daytime and nighttime SUHII during winter (E,F), yearly diurnal SUHII amplitude (DSA) (G), DSA in summer and winter (H,I), and seasonal SUHII amplitude (SSA) during day and night (J,K). DSA and SSA are defined as differences in SUHII between day and night, and between summer and winter, respectively.
Remotesensing 17 01339 g005
Figure 6. Relationships between SUHII and 10 driving variables for 30 cities. (A) illustrates the Pearson correlation coefficients (r) between 10 driving variables and SUHII (** indicates significance at the 0.01 level; * indicates significance at the 0.05 level); (B) shows the proportion of SUHII variability explained by driving factors and the total R2 explanatory rate (%) of the model based on stepwise linear regression analysis (red grids indicate no independent contribution to SUHII variability).
Remotesensing 17 01339 g006
Figure 7. Spatial distributions of the annual (A), summer (B), winter (C), and seasonal changes (summer–winter) (D) of ΔWSA across 30 cities in the arid and semi-arid regions of northern China, averaged over the period from 2010 to 2020.
Remotesensing 17 01339 g007
Figure 8. Spatial distributions of the annual (A), summer (B), winter (C), and seasonal changes (Summer–Winter) (D) of ΔEVI across 30 cities in the arid and semi-arid regions of northern China, averaged over the period from 2010 to 2020.
Remotesensing 17 01339 g008
Figure 9. Correlations between climate elements and ΔEVI, ΔWSA, ΔNDMI for 30 cities in arid and semi-arid regions of the north from 2010 to 2020.
Remotesensing 17 01339 g009
Table 1. Driving factors of SUHI in the study.
CategoryVariableAbbreviationUnitSpatial ResolutionTime ScaleData Source
VegetationEnhanced vegetation indexEVI-1 km2010–2020MYD13A2 product
Soil moistureNormalized difference moisture indexNDMI-500 m2010–2020MOD09A1 product
City size, urban morphology, terrain, and albedoFractal dimensionFD--2010–2020Urban boundary extracted from CLCD land cover data
Urban area sizeUASkm2-2010–2020Derived from CLCD land cover data
Digital elevation model DEMm30 m2015SRTM product
White sky albedo WSA-500 m2010–2020MCD43A3 product
Socio-economyNighttime light NTL-1 km2010–2020Combination of DMSP-OLS data and SNPP-VIIRS data released by Wu et al. (2021) [49]
Built-up intensity BI-30 m2010–2020Derived from CLCD land cover data
ClimateMean temperatureMT°C-2010–2020Derived from the air temperature provided by the National Meteorological Science Data Center
Total precipitationTPmm-2010–2020Derived from the precipitation provided by the National Meteorological Science Data Center
Table 2. Trends of daytime SUHII at annual and seasonal scales indicated by the Mann–Kendall and Theil–Sen estimators.
City NameTrend Slope (°C/year)Lower Bound at 95% CI of SlopeUpper Bound at 95% CI of Slope
Annual daytimeTianshui0.027 *−0.0250.029
Hami−0.052 **−0.038 0.040
Urumqi−0.096 *−0.091 0.088
Wuzhong−0.039 *−0.027 0.025
Yinchuan−0.089 *−0.056 0.055
Zhongwei−0.048 *−0.035 0.034
Summer daytimeKorla0.062 *−0.0410.042
Qingyang0.056 *−0.0540.047
Shihezi0.080 **−0.0550.058
Shizuishan0.036 *−0.0280.028
Chifeng−0.043 **−0.0290.028
Hami−0.021 *−0.0220.021
Yinchuan−0.084 *−0.0580.049
Winter daytimeYining0.349 *−0.2490.262
Hami−0.038 *−0.0460.044
Longnan−0.025 *−0.0170.032
Wuzhong−0.048 *−0.0400.040
Zhongwei−0.028 **−0.0270.026
* Significance at the 0.05 level; ** significance at the 0.01 level. The “Trend slope” column indicates the slope of the trend; “Lower bound at 95% CI of slope” and “Upper bound at 95% CI of slope” represent the lower and upper 95% confidence intervals, respectively. SUHII trends for cities not listed in the table are not statistically significant.
Table 3. Trends of nighttime SUHII at annual and seasonal scales indicated by the Mann–Kendall and Theil–Sen estimators.
City NameTrend Slope (°C/year)Lower Bound at 95% CI of SlopeUpper Bound at 95% CI of Slope
Annual nighttimeHohhot0.011 *−0.016 0.015
Lanzhou0.024 *−0.021 0.018
Ulanqab0.011 **−0.010 0.011
Wuwei0.040 **−0.030 0.031
Wuzhong0.026 **−0.022 0.020
Zhangye0.065 **−0.041 0.035
Korla−0.036 **−0.031 0.032
Turpan−0.018 *−0.012 0.013
Summer nighttimeHulunbuir0.004 *−0.008 0.008
Wuwei0.030 **−0.028 0.026
Wuzhong0.032 **−0.022 0.023
Yining0.018 *−0.018 0.019
Zhongwei0.019 *−0.018 0.015
Zhangye0.042 *−0.028 0.032
Turpan−0.014 **−0.009 0.010
Winter nighttimeAksu0.020 *−0.016 0.016
Lanzhou0.023 **−0.016 0.016
Ulanqab0.021 *−0.018 0.019
Wuwei0.064 **−0.041 0.042
Wuzhong0.036 *−0.026 0.023
Zhongwei0.020 *−0.018 0.018
Zhangye0.077 **−0.051 0.054
Korla−0.070 **−0.045 0.043
Shizuishan−0.011 *−0.009 0.009
Turpan−0.017 **−0.011 0.010
* Significance at the 0.05 level; ** significance at the 0.01 level. The “Trend slope” column indicates the slope of the trend; “Lower bound at 95% CI of slope” and “Upper bound at 95% CI of slope” represent the lower and upper 95% confidence intervals, respectively. SUHII trends for cities not listed in the table are not statistically significant.
Table 4. Correlations between SUHII and geographical locations of cities during different periods.
VariableLongitudeLatitude
Annual daytime SUHII−0.2300.457 *
Summer daytime SUHII0.451 *−0.185
Winter daytime SUHII−0.503 **0.500 **
Winter nighttime SUHII−0.0760.398 *
* Significance at the 0.05 level; ** significance at the 0.01 level.
Table 5. Variance inflation factor for explanatory variables.
VariableVariance Inflation Factor
Annual Daytime SUHIIAnnual Nighttime SUHIISummer Daytime SUHIISummer Nighttime SUHIIWinter Daytime SUHIIWinter Nighttime SUHII
ΔEVI4.0234.0234.2874.2874.7664.766
ΔWSA2.3502.3502.7632.7634.1714.171
ΔDEM1.5751.5751.7081.7081.9841.984
ΔNTL1.7451.7451.9111.9111.9601.960
ΔBI4.7334.7334.4584.4583.1823.182
UAS3.0633.0633.5033.5033.9213.921
MT2.2192.2193.4803.4802.7752.775
TP1.8441.8443.2933.2931.5731.573
ΔNDMI2.0952.0954.1844.1843.3913.391
FD4.4664.4664.4874.4873.5853.585
Disclaimer/Publisher’s Note: The statements, opinions and data contained in all publications are solely those of the individual author(s) and contributor(s) and not of MDPI and/or the editor(s). MDPI and/or the editor(s) disclaim responsibility for any injury to people or property resulting from any ideas, methods, instructions or products referred to in the content.

