Abstract
The Directional Polarimetric Camera (DPC) aboard the Chinese GaoFen-5 02 satellite is designed to monitor aerosols and particulate matter (PM). In this study, we retrieved the aerosol optical depth (AOD) over the Jing–Jin–Ji (JJJ) region using multi-angle data from the DPC, employing a combination of dark dense vegetation (DDV) and multi-angle retrieval methods. The added value of our method included novel hybrid methodology and good practical performance. The retrieval process involves three main steps: (1) deriving AOD from DPC data collected at the nadir angle using linear parameters of land surface reflectance between the blue and red bands from the MOD09 surface product; (2) after performing atmospheric correction with the retrieved AOD, calculating the variance of the normalized reflectance at all observation angles; and (3) leveraging the calculated variance to obtain the final AOD values. AOD images over the JJJ region were successfully retrieved from DPC data collected between January and June 2022. To validate the retrieval method, we compared our results with aerosol products from the AErosol RObotic NETwork (AERONET) Beijing-RADI site, as well as aerosol data from MODerate-resolution Imaging Spectroradiometer (MODIS) and the generalized retrieval of atmosphere and surface properties (GRASP)/models over the same site. In terms of validation metrics, the correlation coefficient (R2) and root mean square error (RMSE) indicated that our method achieved high accuracy, with an R2 value greater than 0.9 and an RMSE below 0.1, closely aligning with the performance of GRASP.
1. Introduction
Since its launch in 2021, the Chinese Gaofen-5 02 (GF-5 02) satellite has been providing valuable data for atmospheric monitoring for more than three years. One of its key instruments, the Directional Polarimetric Camera (DPC), is specifically designed to monitor aerosols and particulate matter (PM). Similarly to the POLarization and Directionality of the Earth’s Reflectances (POLDER) instrument, the DPC captures both polarized and intensity data in the visible and near-infrared bands across multiple angles. Although the spatial resolution of the DPC is relatively fine (approximately 3.3 km), it lacks the 1020 nm band. Notably, the GF-5 02 DPC offers up to 17 view angles, surpassing the capabilities of its predecessor, Gaofen-5.
A significant challenge in retrieving aerosol information over land surfaces from satellite data lies in the removal of surface contributions. Typically, surface contributions are mitigated through assumptions about land surface reflectance. Methods such as dark dense vegetation (DDV) or dark target (DT) assume that the reflectance of dense vegetation in the red and blue bands is low and that the relationship between these bands is linear [1,2,3,4,5,6,7,8,9,10,11]. The deep blue (DB) method posits that the reflectance in the blue band over land is low and stable [12,13,14,15,16]. The multi-angle method assumes that the ratio of surface reflectance across multiple observation angles remains consistent with wavelength [17,18,19,20]. The multi-angle polarization method assumes that surface polarization is minimal and stable [21,22,23,24,25,26,27,28]. The generalized retrieval of atmosphere and surface properties (GRASP) method utilizes a bidirectional reflectance distribution function (BRDF) to model multi-angle reflection from the land surface [25,28]. Recently, machine learning methods have been employed to retrieve aerosol without the need for radiance transfer calculations, often achieving higher accuracy and faster processing speeds compared to traditional methods [29,30,31,32].
Several studies have utilized DPC data to retrieve aerosol optical depth (AOD) and other aerosol properties. Li et al. [33] developed an inversion algorithm for the simultaneous retrieval of aerosol and surface parameters from DPC radiometric and polarimetric measurements. Huang et al. [34] retrieved the AOD over eastern China using multi-spectral, multi-angle, and polarimetric data from the DPC. Ge et al. [35] proposed a visible surface reflectance relationship (VISRR) algorithm for DPC, while Fang et al. [36] applied the Space Research Organisation Netherlands (SRON) Remote sensing of Trace gas and Aerosol Products (RemoTAP) full retrieval algorithm for aerosol property retrieval from GF-5 DPC data. Jin et al. [37] evaluated the AOD retrieved from DPC data using the GRASP algorithm, and Li et al. [38] monitored a heavily haze-polluted case using DPC data. Zhang et al. [39] retrieved the AOD over North China using the DDV method applied to GF-5 02 DPC data.
For DPC data, while the DDV and DB methods demonstrate rapid inversion rates, they fail to exploit multi-angle observations to extract comprehensive aerosol information. Although multi-angle polarization and multi-angle methods exhibit enhanced capability in retrieving aerosol models, their implementation is constrained by prohibitive computational demands. Therefore, this study develops a synergistic framework integrating DDV with multi-angle methods. The proposed hybrid method aims to achieve rapid aerosol retrieval after choosing aerosol models.
The Jing–Jin–Ji (JJJ) region, one of China’s largest urban agglomerations, encompasses the cities of Beijing and Tianjin, as well as Hebei province. Covering approximately 220,000 km2, the region’s GDP exceeded USD 1.4 trillion in 2022. Despite its economic success, aerosol pollution remains a significant concern due to the presence of numerous heavy-polluting factories and over 30 million vehicles.
In this study, we improved upon the DDV and multi-angle methods to retrieve terrestrial aerosol properties from DPC data over the JJJ region. After analyzing aerosol models and land surface reflectance characteristics in the region, our method was applied to DPC data from January to June 2022. The retrieval results were then compared with AErosol RObotic NETwork (AERONET) data, MODerate-resolution Imaging Spectroradiometer (MODIS) products, and GRASP results to assess the accuracy of our approach.
2. Method
For non-polarized signals, the apparent reflectance , which is observed by satellites, can be expressed as follows [40]:
where , T, and S are three atmospheric parameters, and represents the surface reflectance. denotes the relative azimuth angle, denotes the sun zenith angle, and denotes the viewing zenith angle. Aerosol information can be extracted from atmospheric parameters (, T, and S).
Equation (1) can be mathematically formulated as follows:
If the atmospheric parameters are known, the surface reflectance, , can be received by Equation (2), and usually this process is called atmospheric correction (AC).
For land surface, several methods are available to retrieve aerosol, such as DDV, DB, and multi-angle. The DDV method assumes a linear relationship between the reflectance in the red band and that in the blue band, which was expressed as follows [1,2]:
where a and b are empirical parameters, which are generally received from ground-based spectrum measurements. Some studies showed that the DDV method was not only applied to vegetation but also other land types [8,41].
The multiple-angle method assumes that the surface reflectance ratio in multiple observation directions does not change with wavelength; Diner et al. [17] proposed that the surface reflectance, , at a given viewing angle can be expressed as the product of a wavelength-dependent coefficient, a, and a geometry-dependent function f:
Then, for each of the viewing bands, the reflectance, , can be averaged over all viewing angles. The average values, , are used for normalization, which yields normalized surface reflectance, :
Therefore, theoretically normalized surface reflectance of all bands is equal, but measurement errors can lead to differences between different bands. The variance was used to measure the difference in in different bands [17]:
For a given aerosol model and AOD , the variance, , can be calculated as follows:
In the study, we utilized four bands (490 nm, 550 nm, 670 nm, and 865 nm) and all 17 viewing angles of the DPC to retrieve aerosol properties.
Based on the DDV and multi-angle methods, we developed a new method with which to retrieve aerosols from DPC multi-angle signals. The data-flow chart was shown in Figure 1 and the steps of the method were as follows:
- (1)
- The AOD of the default aerosol model (seen in the next chapter) from DPC data was retrieved at the nadir angle, which aimed to maintain consistency with the viewing geometry of the 8-Day MOD09 product, and a and b were received for every pixel in Chapter IV;
- (2)
- Using Equation (2), the reflectances at other angles after AC were received;
- (3)
- Using Equation (6), the reflectances were normalized, and, using Equation (7), the variance, , was calculated;
- (4)
- If was less than 2, the result was output for default aerosol model. If not, was calculated for other aerosol models, and the minimum of was output.
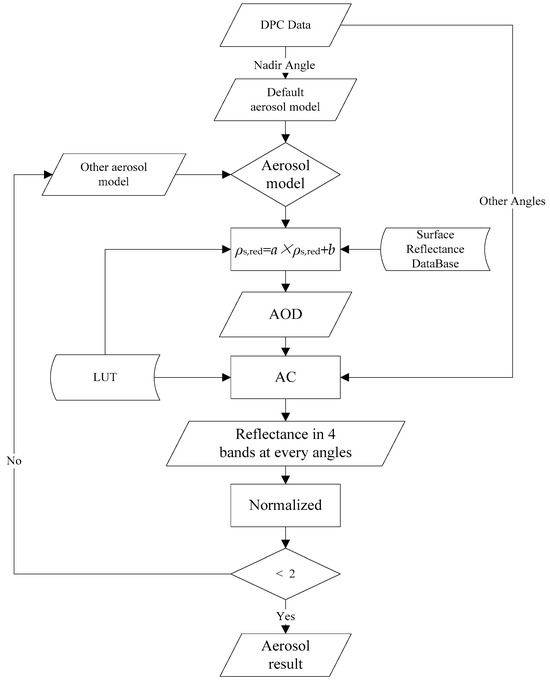
Figure 1.
The data flow of our aerosol retrieval method from DPC data. The parallelogram represents data, the rectangle represents the processing module, the diamond represents the decision process, and the rounded rectangle represents the database.
Figure 1.
The data flow of our aerosol retrieval method from DPC data. The parallelogram represents data, the rectangle represents the processing module, the diamond represents the decision process, and the rounded rectangle represents the database.
Atmospheric parameters were pre-calculated with 6SV 1.0 [42] and stored in the lookup table (LUT).
3. Aerosol Model
The JJJ region is home to thousands of factories and motor vehicles, which emit particulate matter (PM10, PM2.5) and pollutant gasses (e.g., NO2, SO2) that contribute to the formation of water-soluble particles. In the spring, dust from Mongolia and Northwestern China can be transported into the region, further exacerbating air quality issues. During the heating and harvest seasons, large amounts of coal burning and straw burning also contribute to aerosol pollution. In this study, we assume that the aerosol composition over the JJJ region consists of three primary components: water-soluble aerosols (WASO), black carbon (BC), and dust. By combining these components in different proportions, we generate 16 aerosol models to represent the region’s aerosol characteristics.
The aerosol models were derived from AERONET products by fitting parameters such as the AOD and single scattering albedo (SSA) [43]. The results indicated that WASO dominated (16–99%), followed by dust (1–84%), while BC contributed the least (0–11%) [41]. Based on AERONET analysis results and considering the strong absorption and scattering of BC in visible bands, along with comparable scattering effects between WASO and dust, this study establishes the following aerosol models:
- BC’s proportion (BC%) varies from 0% to 15% in 5% increments (0%, 5%, 10%, 15%);
- WASO’s proportion (WASO%) ranges from 10% to 100% in 30% increments (10%, 40%, 70%, 100%), as well as 100% in adjustment to 1-BC% when BC > 0%;
- Dust proportion is defined as 1-BC%-WASO%.
This configuration generates 4 × 4 = 16 aerosol models in total, which is shown in Table 1. From AERONET data from the Beijing site, Model 7 shows the closest alignment with the findings of Wei et al. [43] and Zhang et al. [41]. Given the similarity of climatic conditions and emission patterns, we adopt Model 7 as the representative aerosol model for the entire JJJ region. In the future, we plan to collect additional ground-based measurements to develop more detailed aerosol model characterizations specific to this regional context. So, the default aerosol model was set as Model 7.

Table 1.
The proportional composition of WASO, BC, and dust for 16 aerosol models.
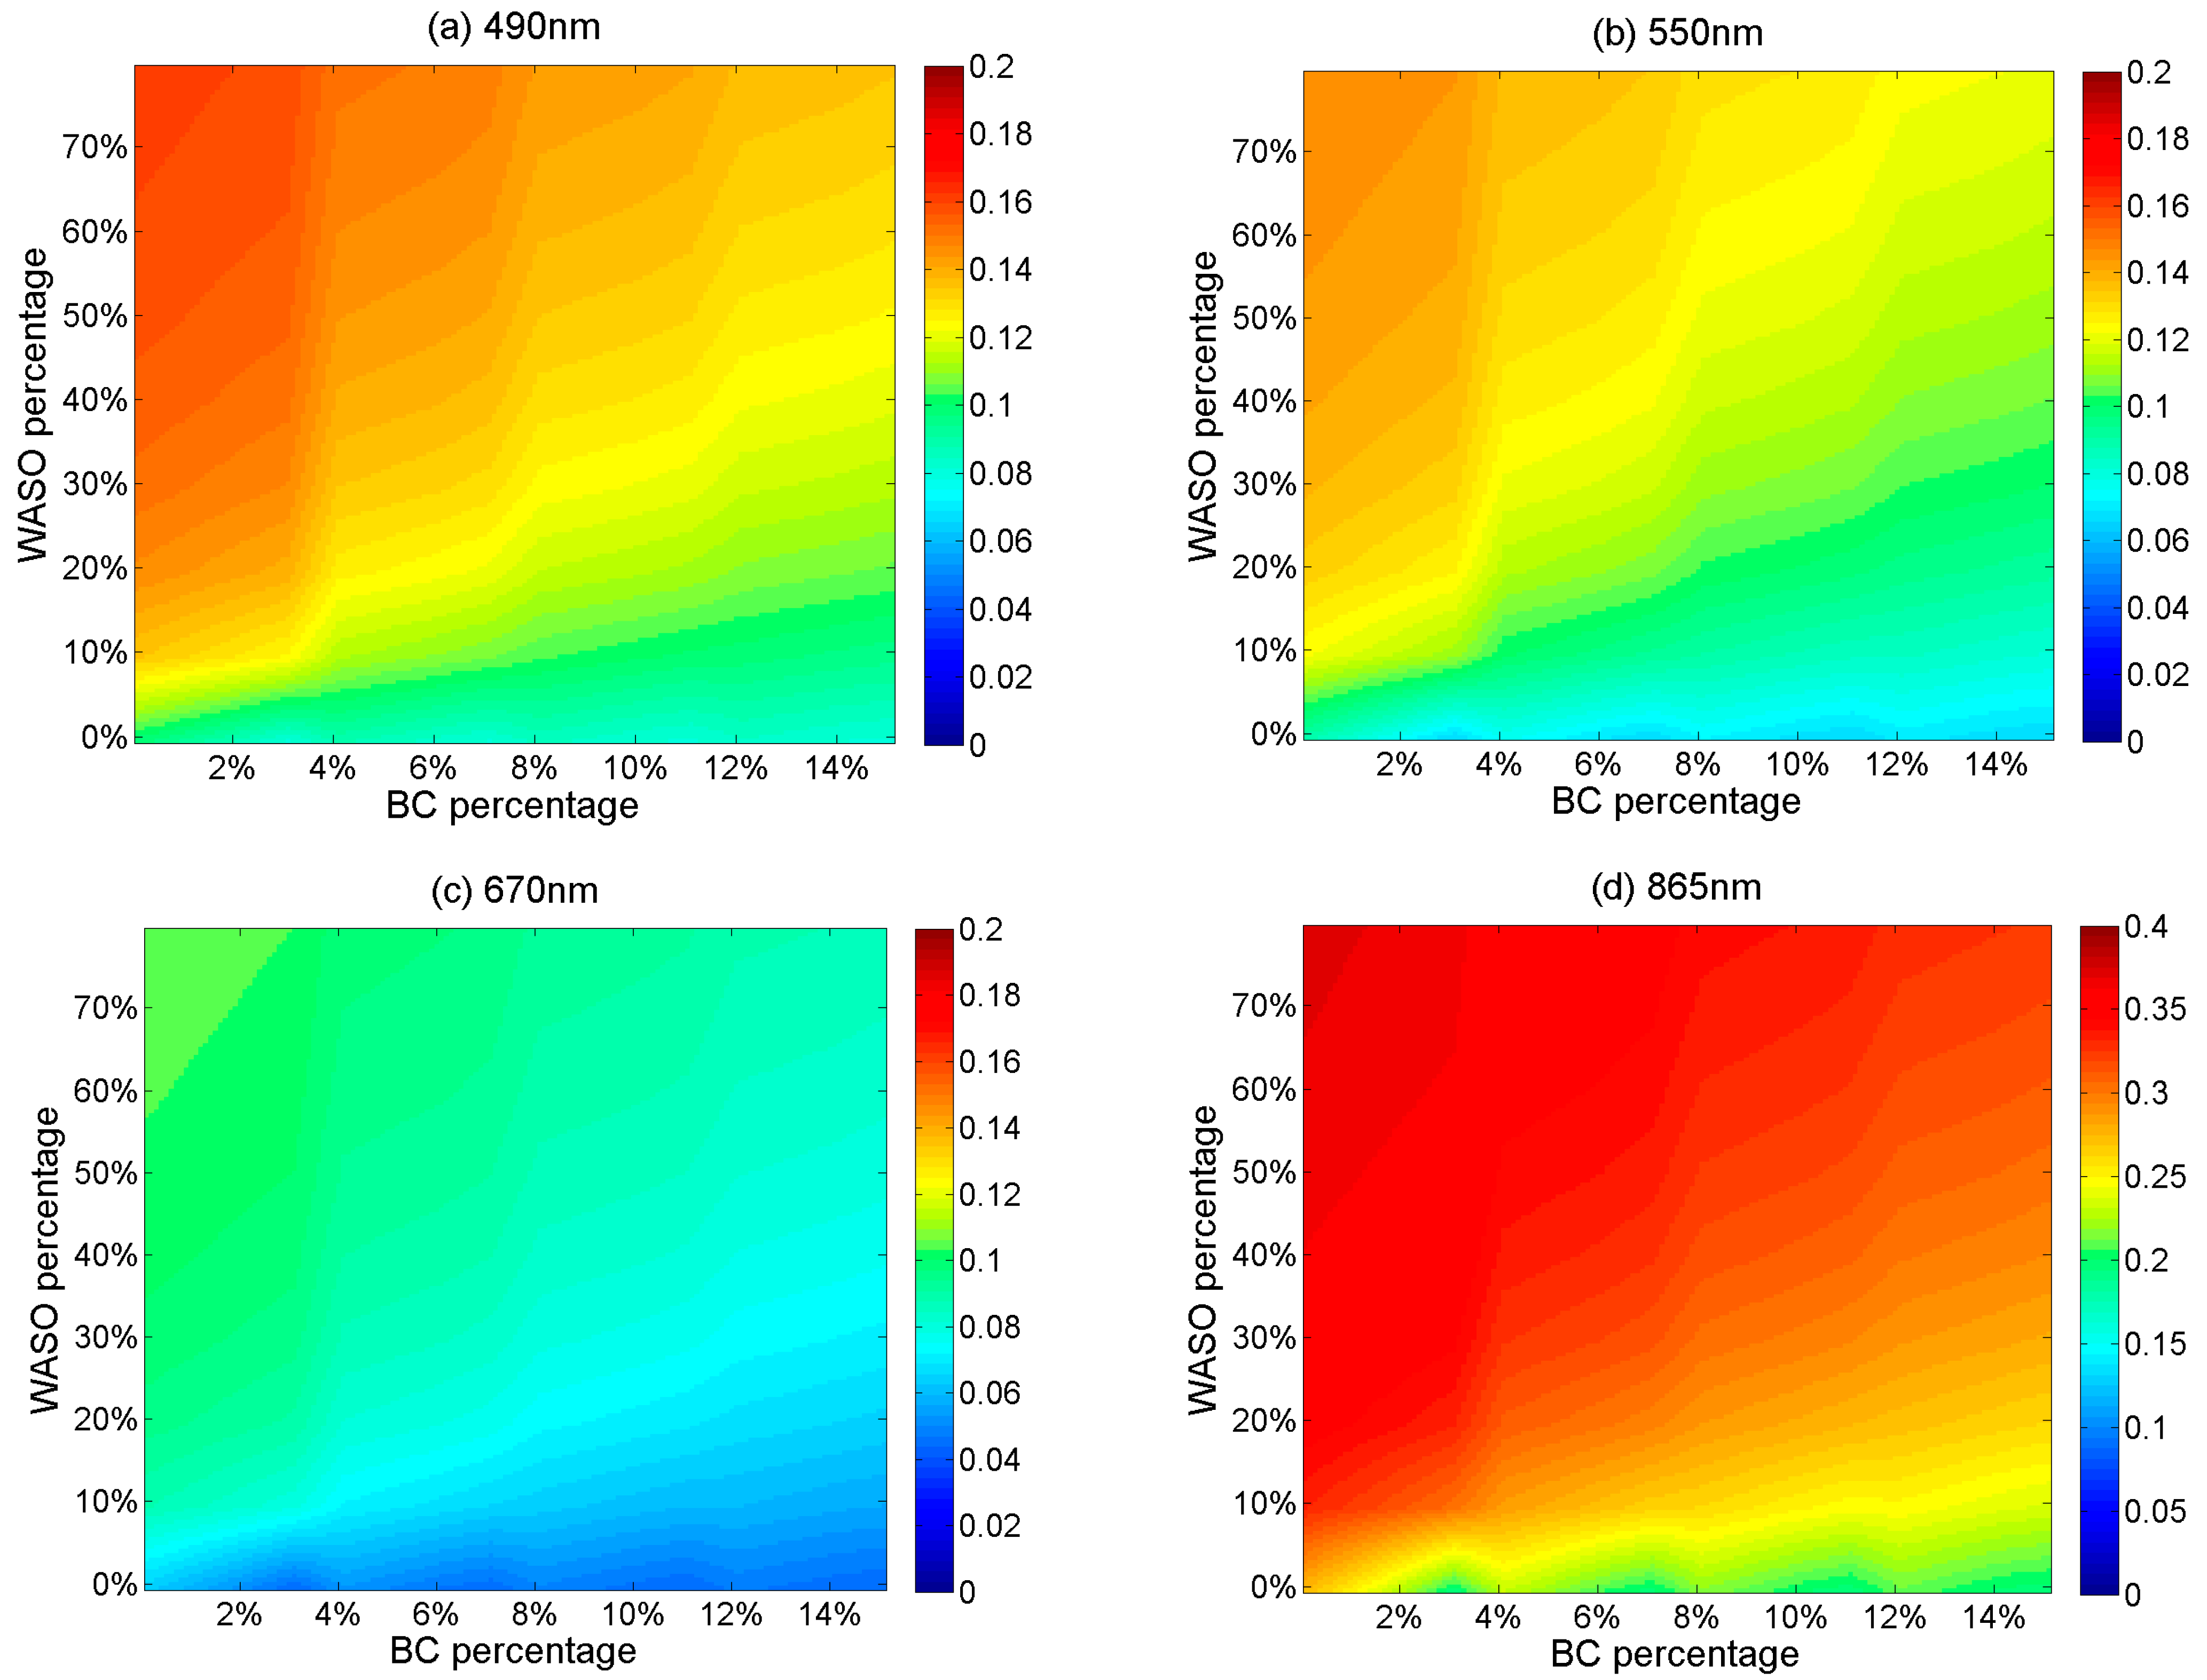
We then simulated the apparent reflectance for each aerosol model, with the AOD of 0.5, the nadir view angle, and the vegetation surface type. As shown in Figure 2, the apparent reflectance varied with different aerosol models. As the proportion of WASO increased, the apparent reflectance also increased, whereas an increase in BC resulted in a decrease in apparent reflectance. The apparent reflectance was the largest at 865 nm, likely due to higher reflectance at this wavelength, while the apparent reflectance was smallest at 670 nm, owing to lower surface reflectance and path radiance.

Figure 2.
The apparent reflectance of different aerosol models ((a) 490 nm, (b) 550 nm, (c) 660 nm, and (d) 865 nm).
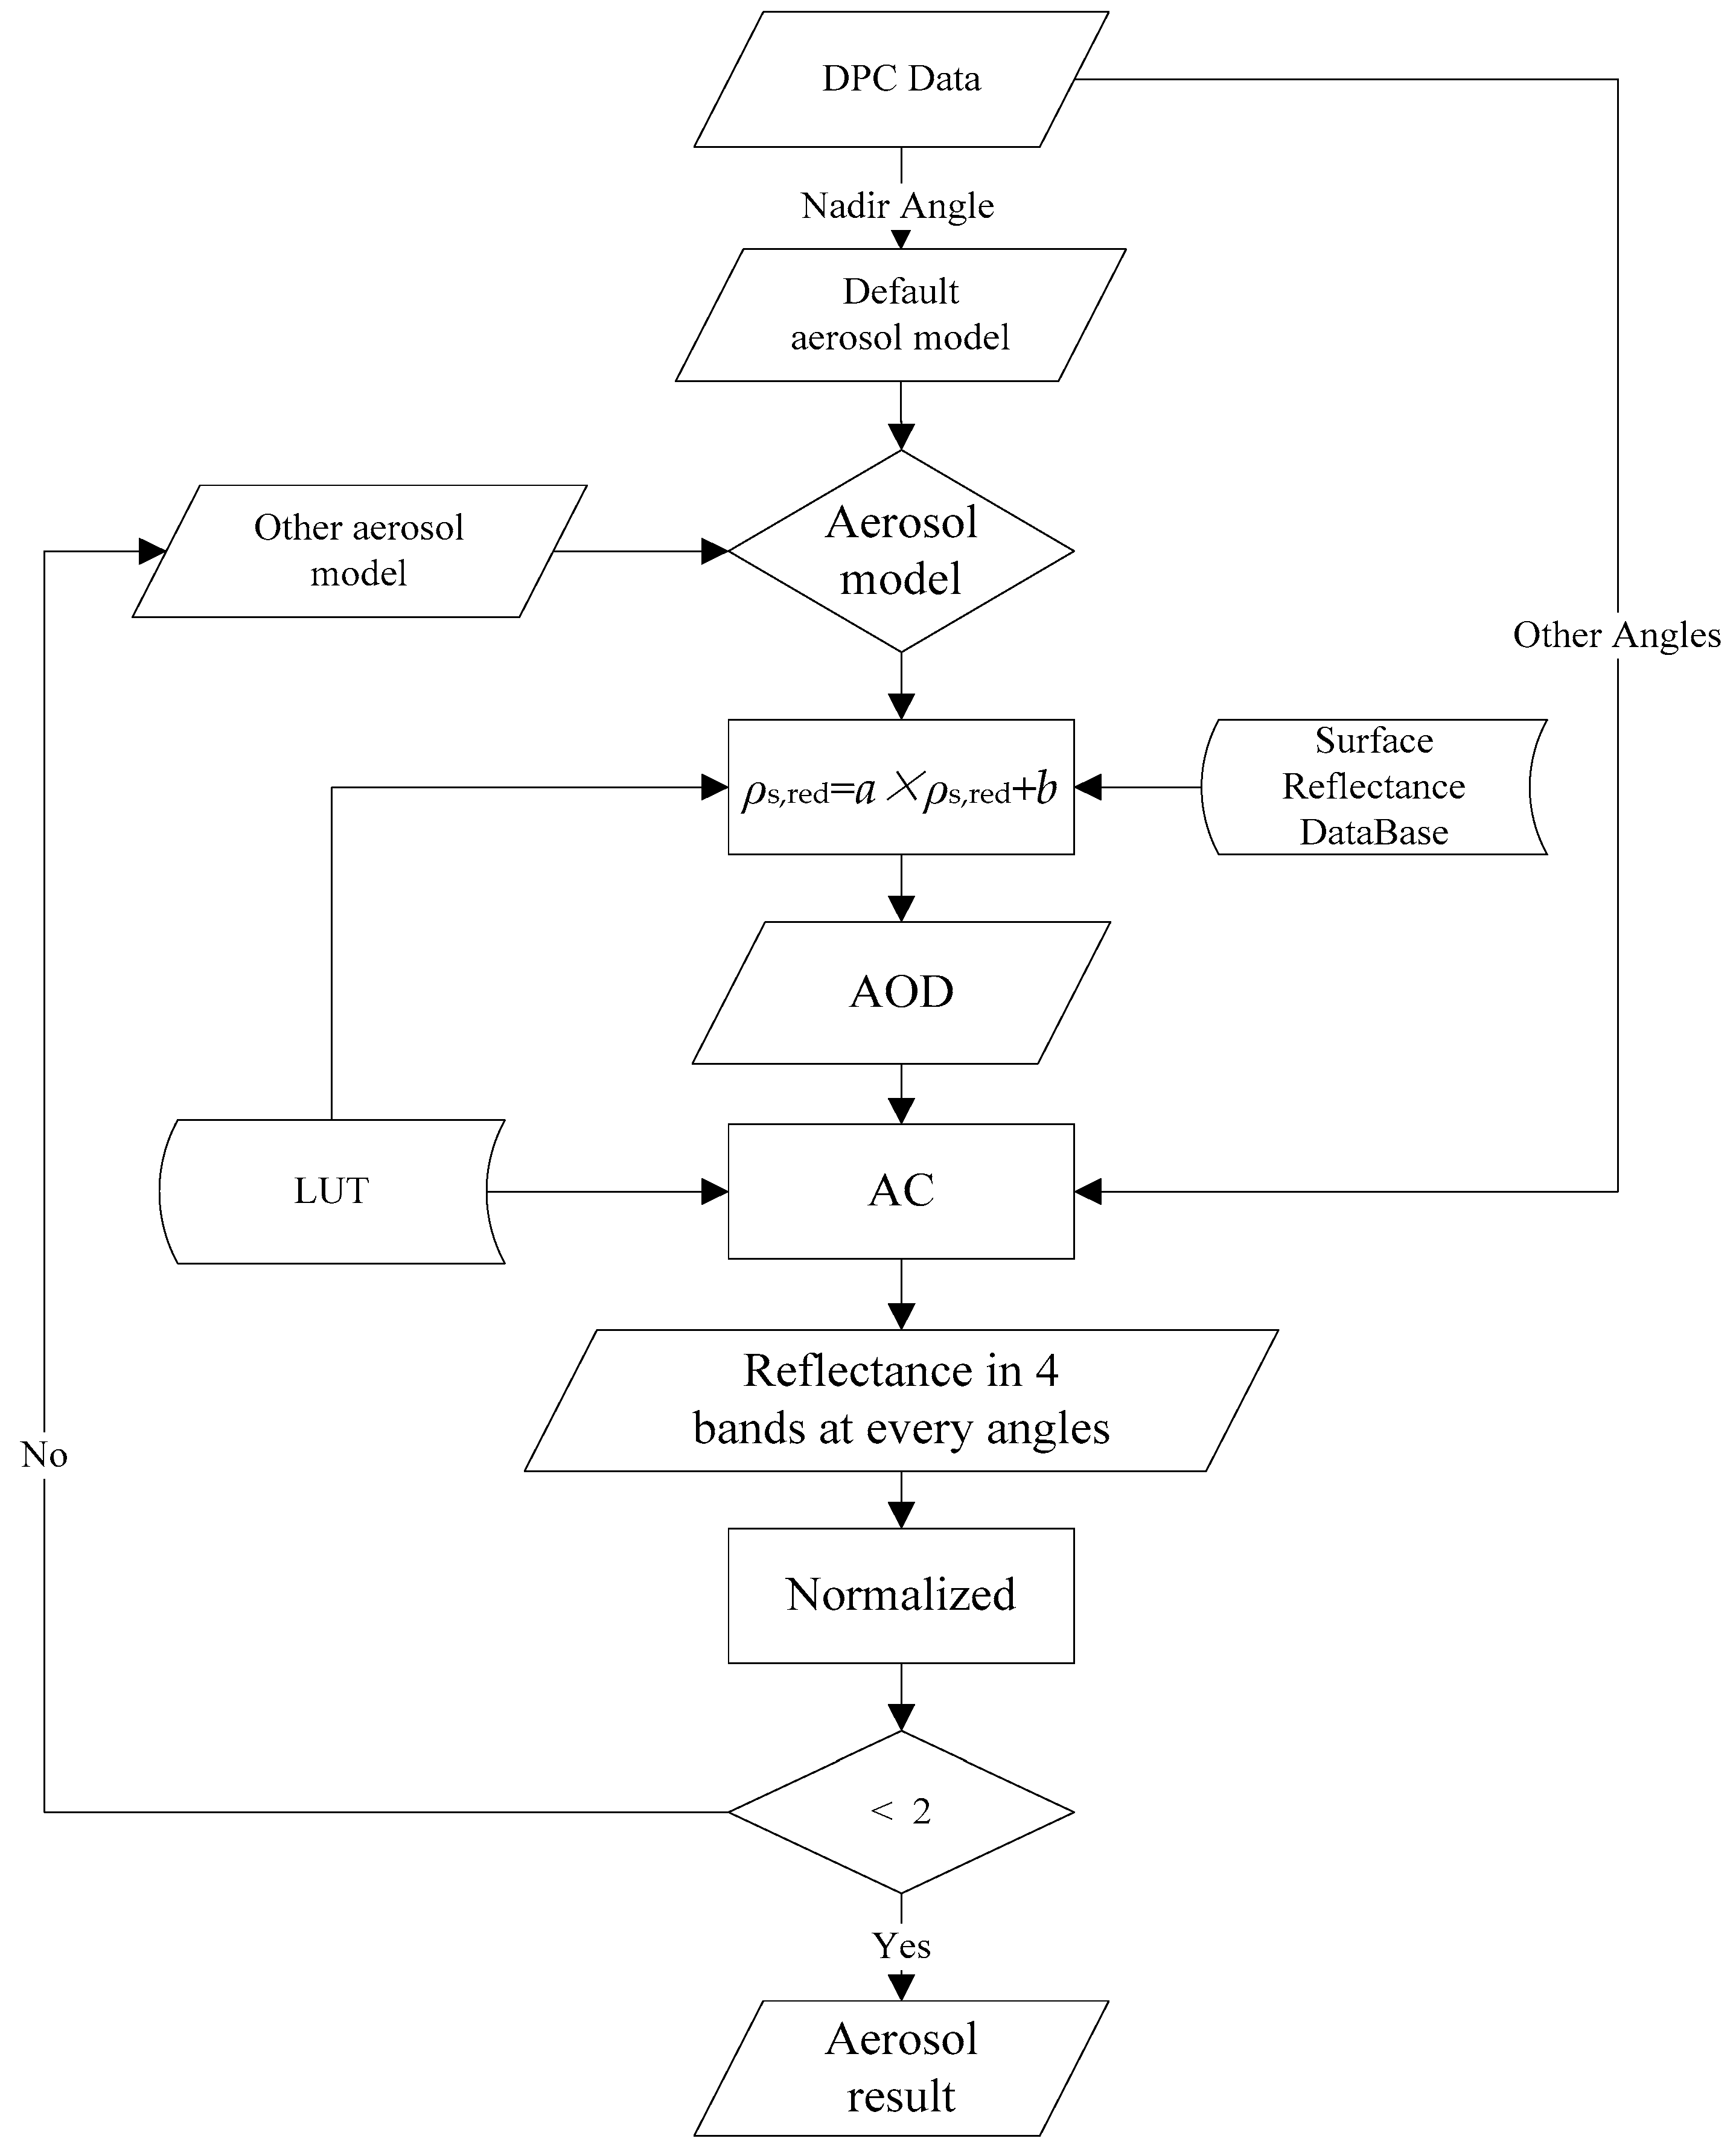
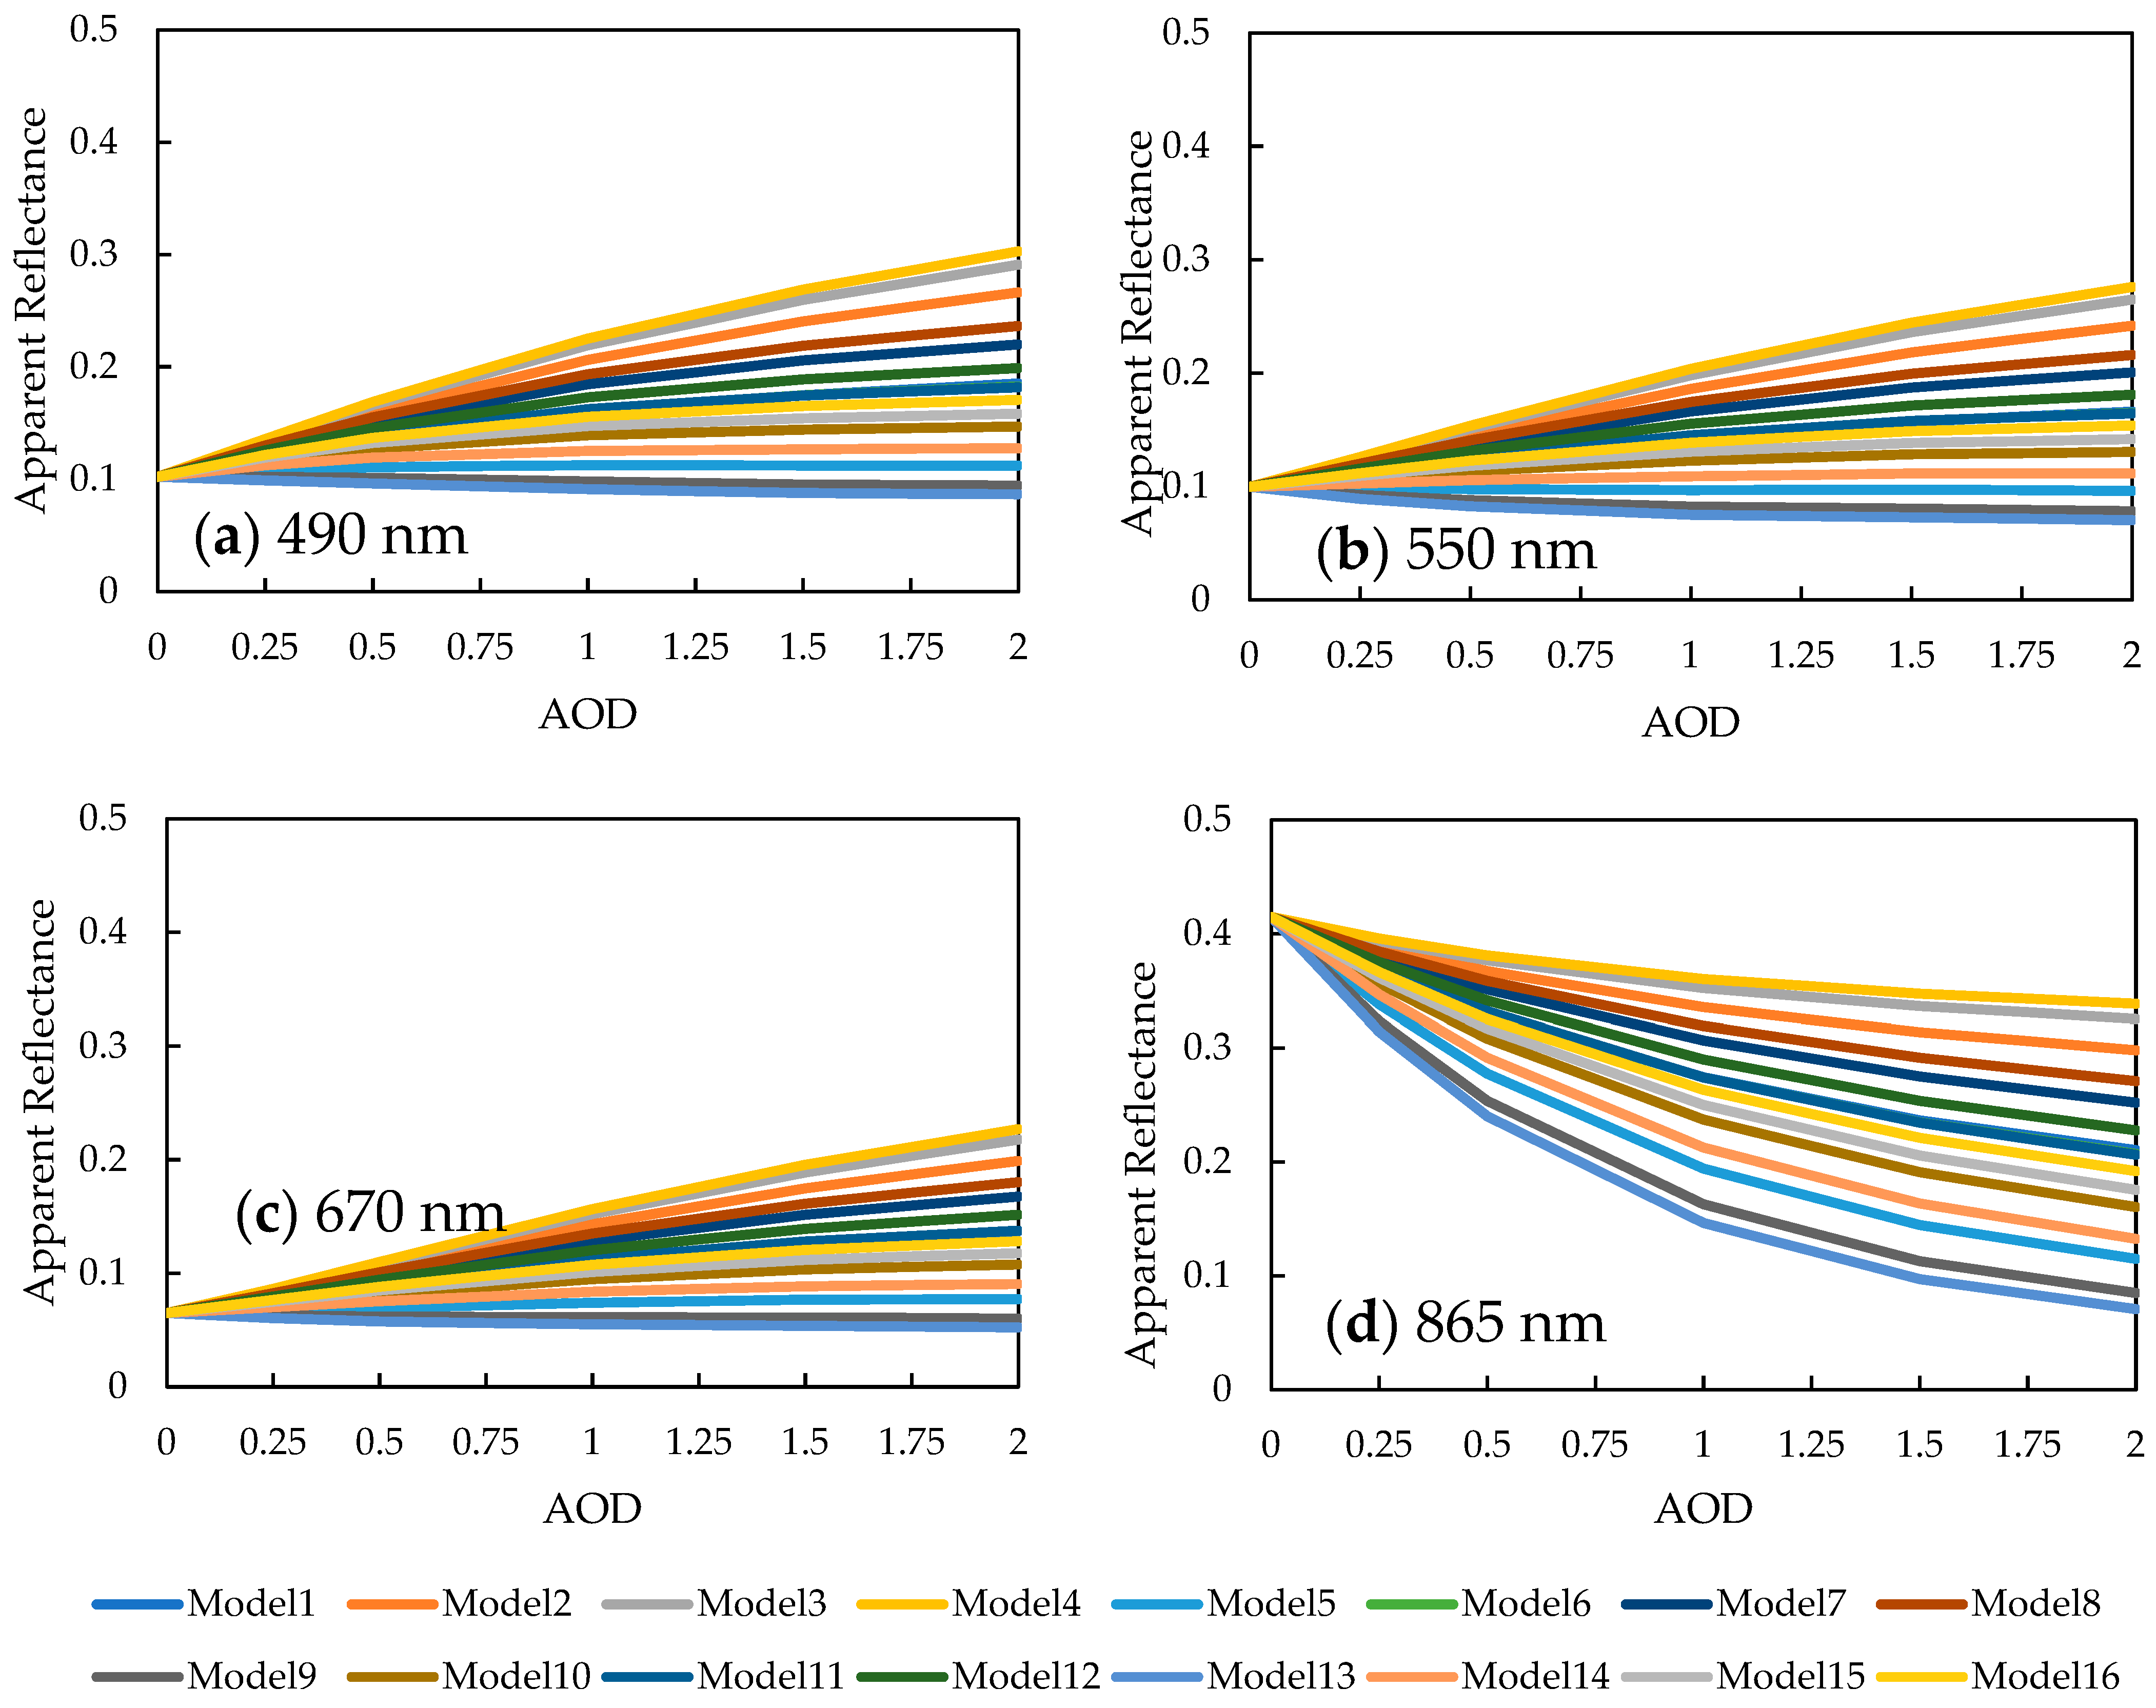
We simulated the apparent reflectance for 16 aerosol models at the nadir angle, with the AOD increasing from 0 to 2. As shown in Figure 3, the apparent reflectance varied across the 16 aerosol models. At 865 nm, the apparent reflectance decreased as the AOD increased, because atmosphere (aerosol and molecule) scattering is predominant when the surface reflectance exceeds 0.2. In contrast, in other bands, the apparent reflectance generally increased, except for Model 9 and Model 13, where dust was the dominant aerosol component. The largest increase in apparent reflectance was observed at 490 nm, while the smallest increase occurred at 550 nm.
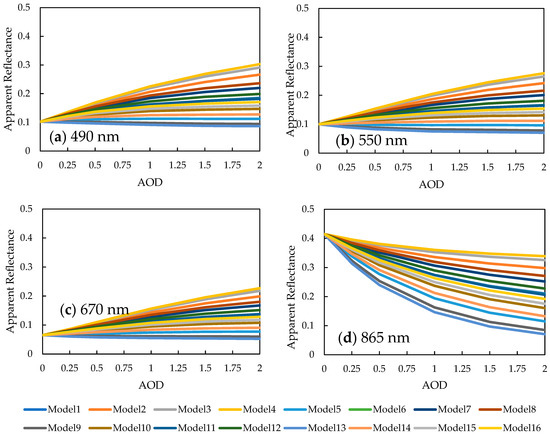
Figure 3.
Simulated apparent reflectance at the nadir ((a) 490 nm, (b) 550 nm, (c) 660 nm, and (d) 865 nm).
We also simulated the apparent reflectance of the GF-5 02 DPC at 17 viewing angles, with the AOD set to 0.5. The solar zenith angle was 63°, and the viewing zenith angles ranged from −52° to 52°. As shown in Figure 4, at the nadir angle (Angle 9), the apparent reflectance was the smallest, and the differences between aerosol models were minimal due to the shortest sunlight path. As the viewing zenith angles increased, the apparent reflectance also increased. At 865 nm, the increase was the smallest, while at 490 nm, it was the largest. The increase at 550 nm was similar to that at 490 nm.
Figure 4.
Simulated apparent reflectance for 16 aerosol models at 17 different viewing angles in four bands ((a) 490 nm, (b) 550 nm, (c) 660 nm, and (d) 865 nm).
In summary, the apparent reflectance varied across different aerosol models. At the nadir angle, it was the smallest, and it increased with the viewing zenith angle.
4. Surface Reflectance Analysis
Due to the lack of a surface reflectance product for the DPC, this study used the surface spectral reflectance of the MODIS surface reflectance product (MOD09) to analyze the relationship of surface reflectance [8,41]. For the GF-5 02 satellite’s overpass local time, the surface reflectance product from the Terra satellite (MOD09) was obtained from the Level-1 and Atmosphere Archive & Distribution System Distributed Active Archive Center (LAADS DAAC). For the consistency of surface reflectance at 490 nm and 670 nm and temporal–spatial completeness across the JJJ region, the 8-Day L3 Global 500 m MOD09 product was selected. Surface reflectance values were extracted from the MOD09 product for the blue (470 nm), green (550 nm), red (660 nm), and near-infrared (865 nm) bands.
Similarly to the MOD09 products, DPC data are provided in a sinusoidal equal-area projection; however, each DPC pixel corresponds to an area of approximately 3.3 × 3.3 km, while each MOD09 pixel covers about 0.463 × 0.463 km. Therefore, one DPC pixel contains roughly 7.1 × 7.1 MOD09 pixels. Using Equation (8), the coordinates (line number, column number) in the DPC reference grid were calculated based on the latitude and longitude of each MOD09 pixel. The surface reflectance for each DPC pixel was then derived by averaging the MOD09 reflectance values within the corresponding DPC grid:
where NINT() is the function that obtains the nearest integer; lin is line number; col is column number in the DPC reference grid; and is the number of pixels from 0°E to 180°E when the latitude is equal to lat.
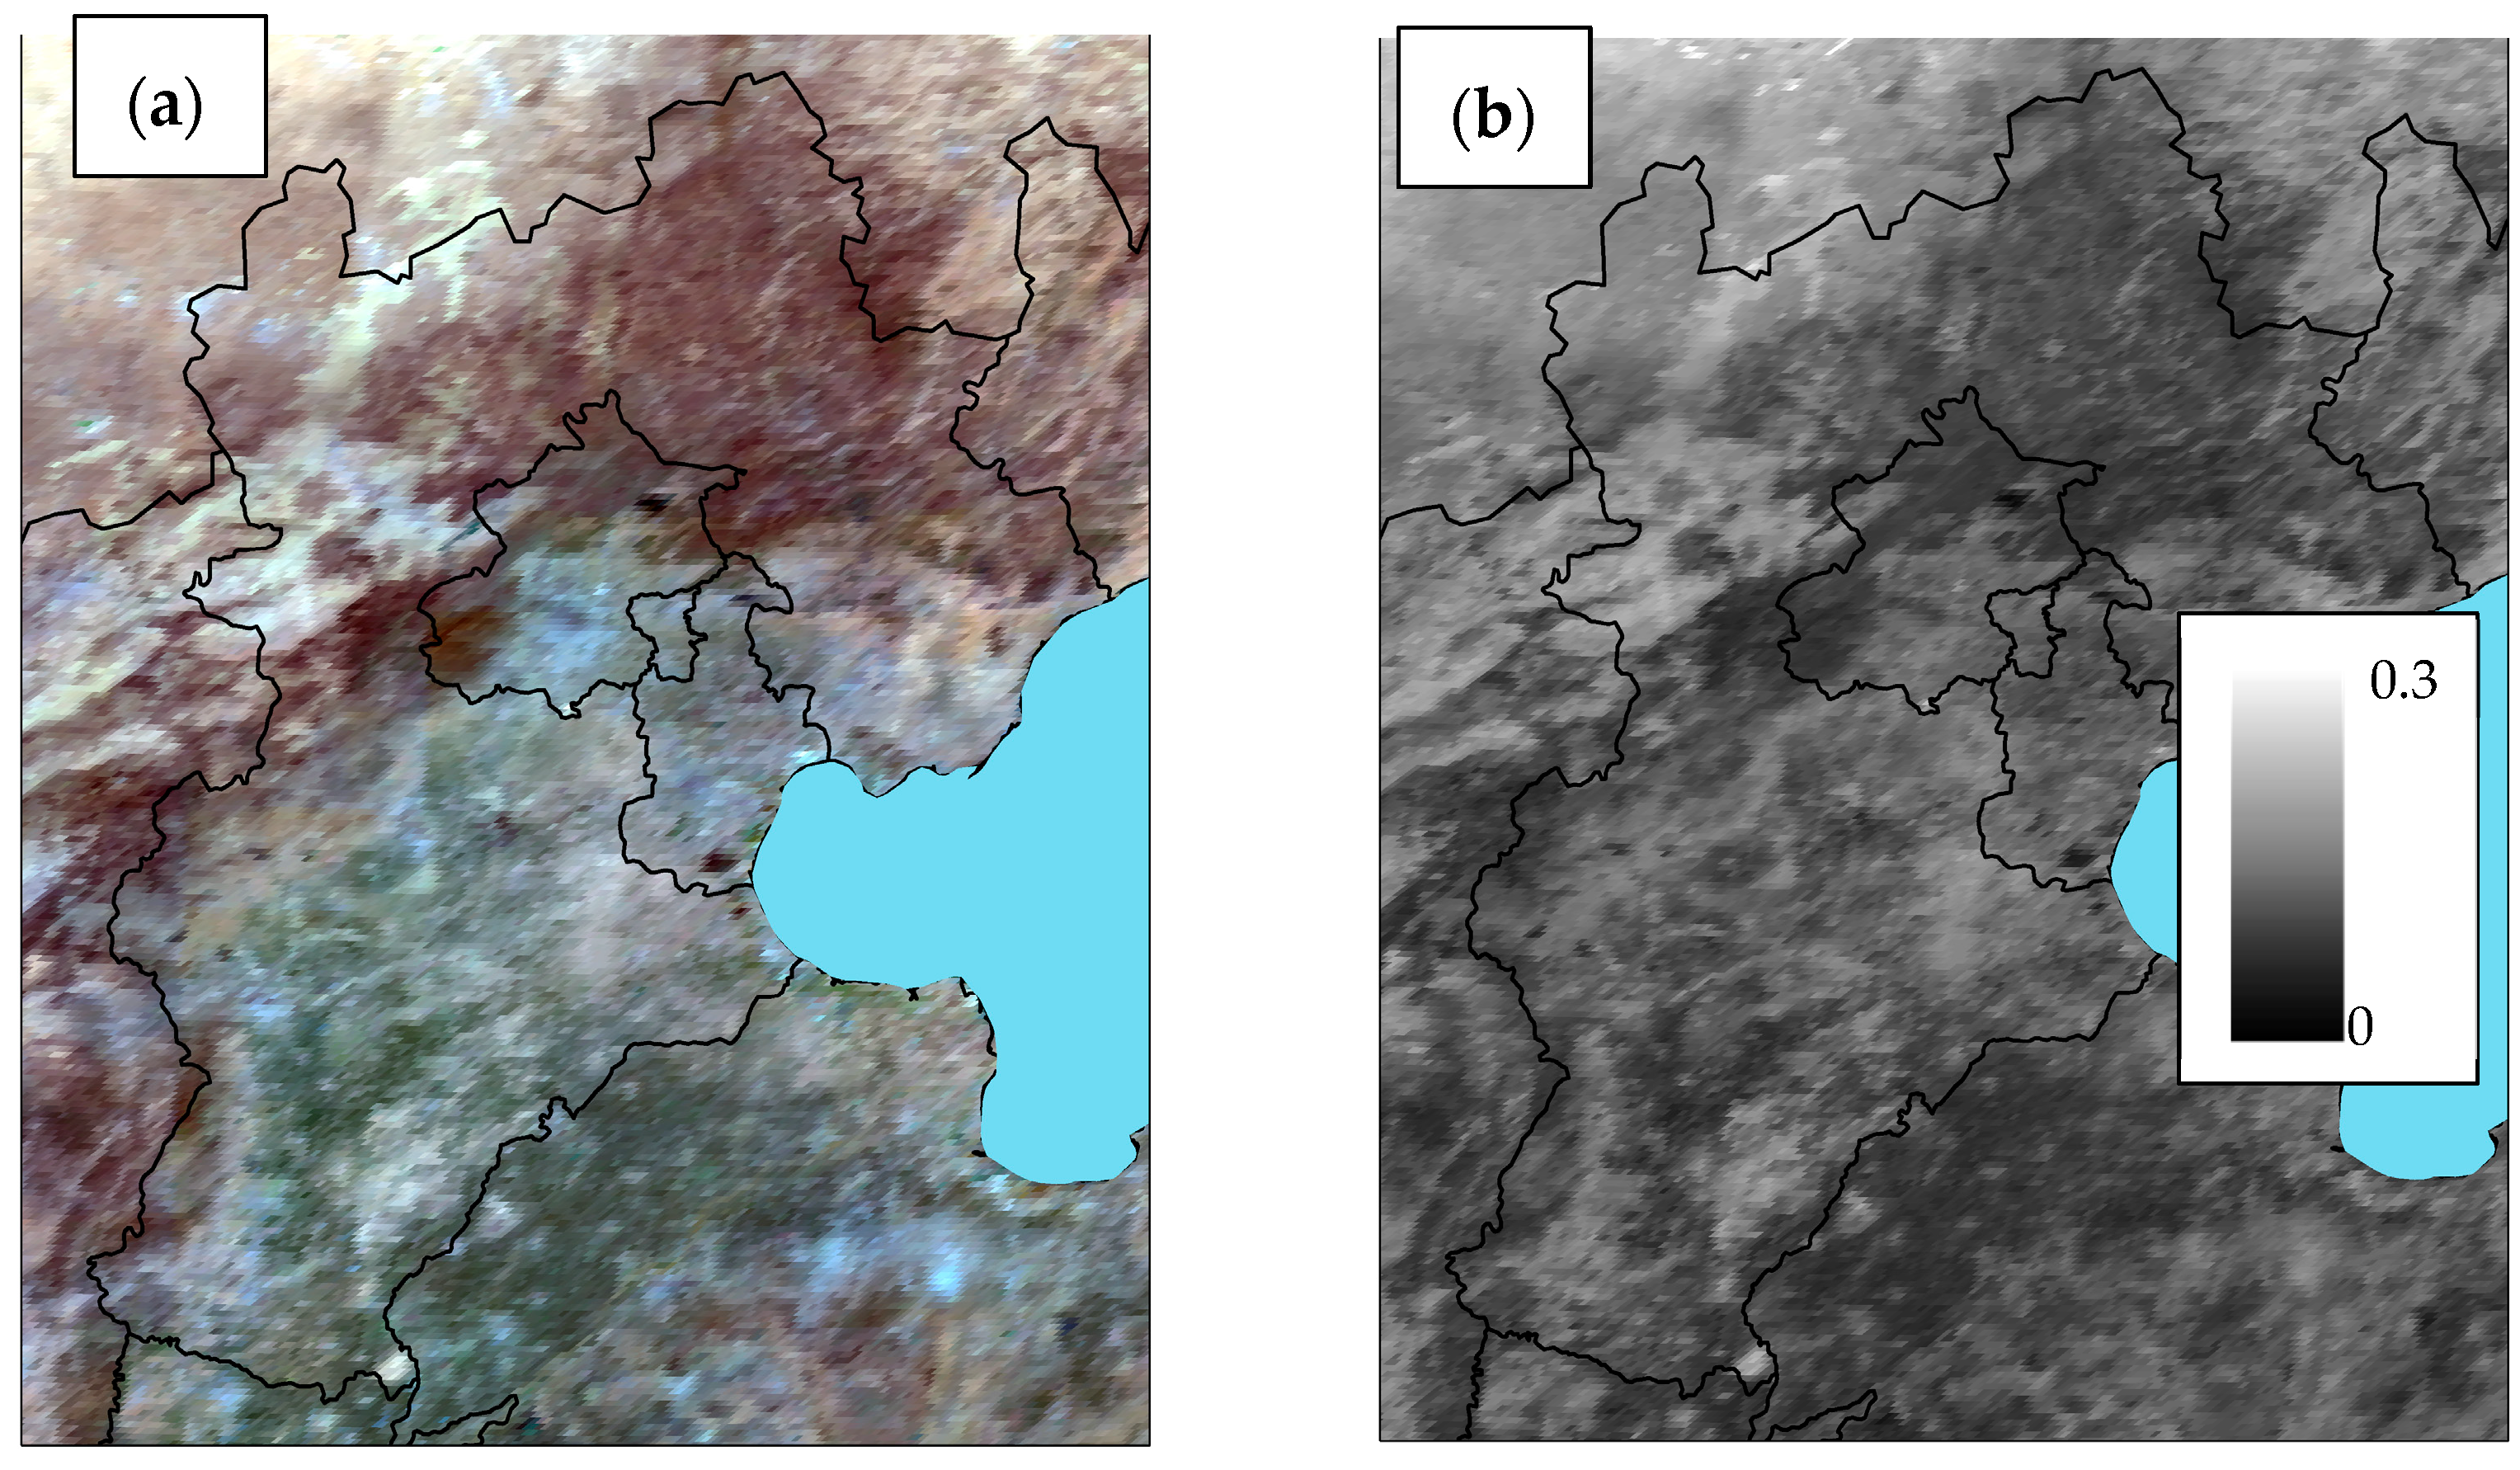
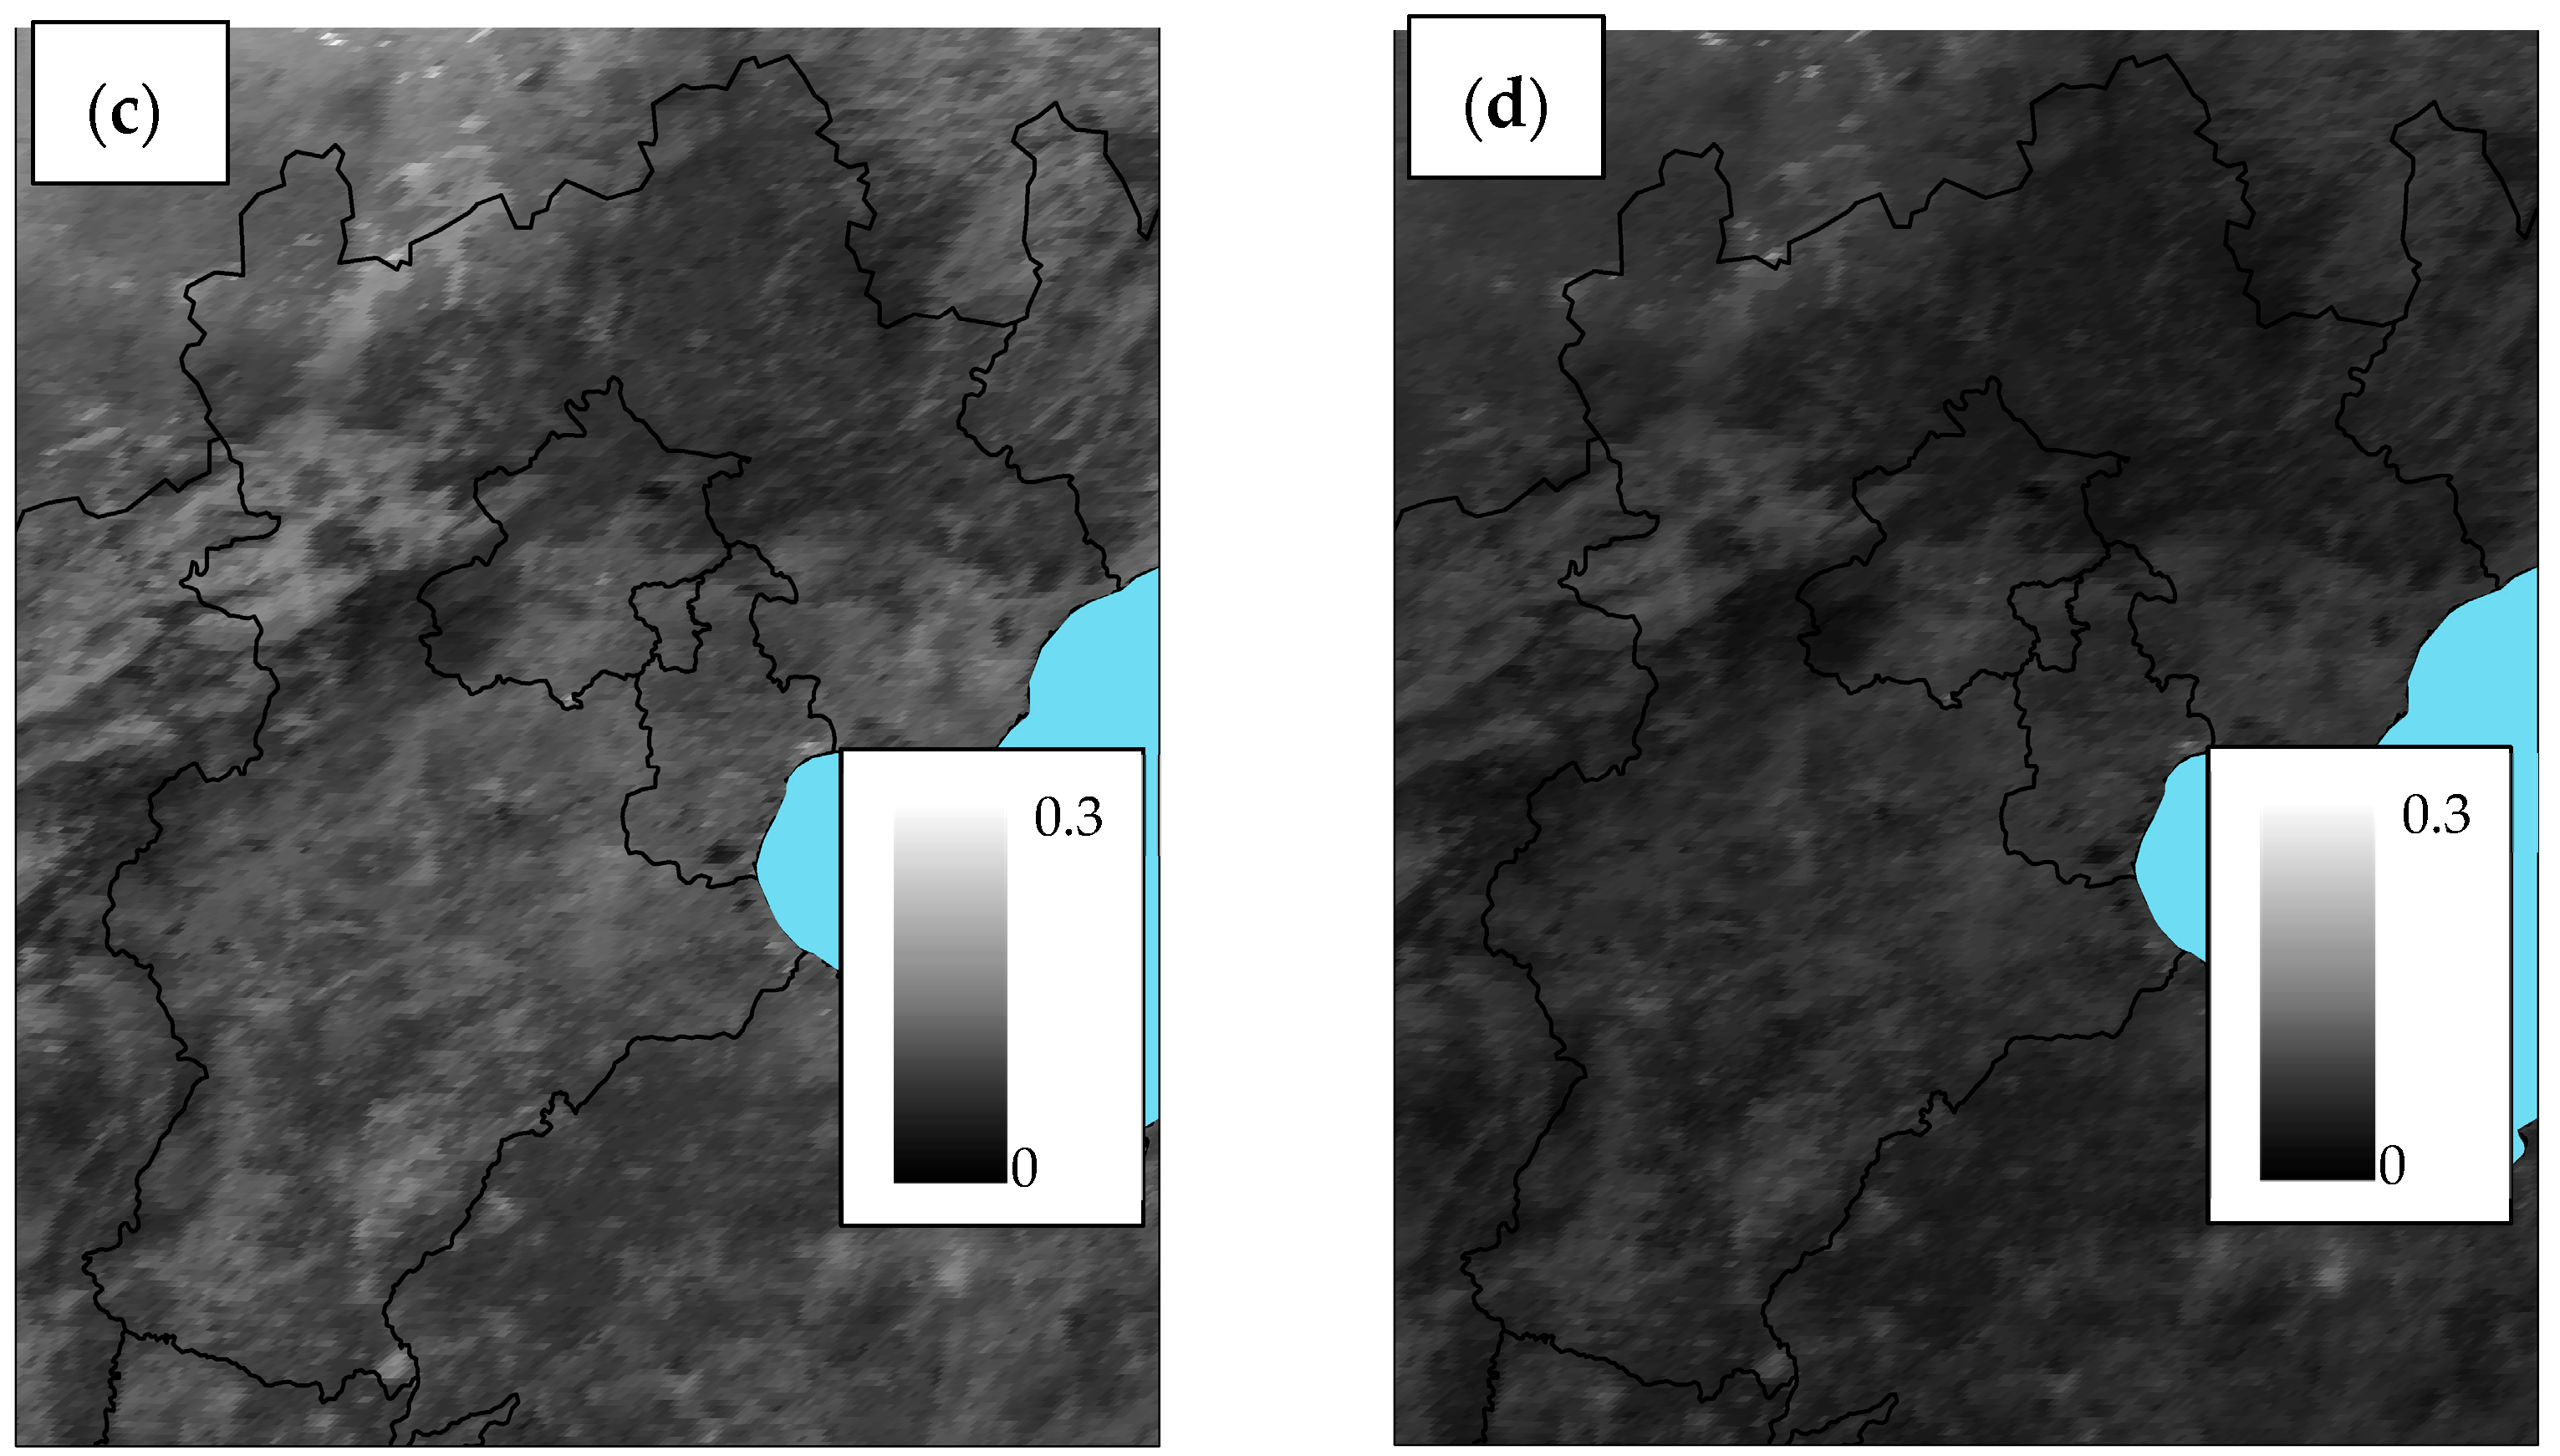
The yearly average reflectance over the JJJ region in 2021 is shown in Figure 5. The northwest part of the region consists of mountainous terrain, while the rest of the area is predominantly flat, including farmland, cities, lakes, and other features.
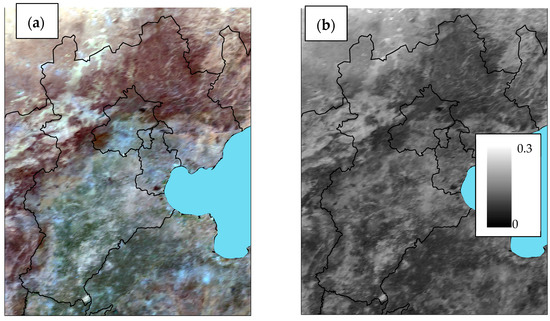

Figure 5.
True-color image (a) composed of MODIS surface reflectance averaged over the entire dataset of year 2021 over the JJJ region. The red is 660 nm (b), the green is 550 nm (c), and the blue is 470 nm (d).
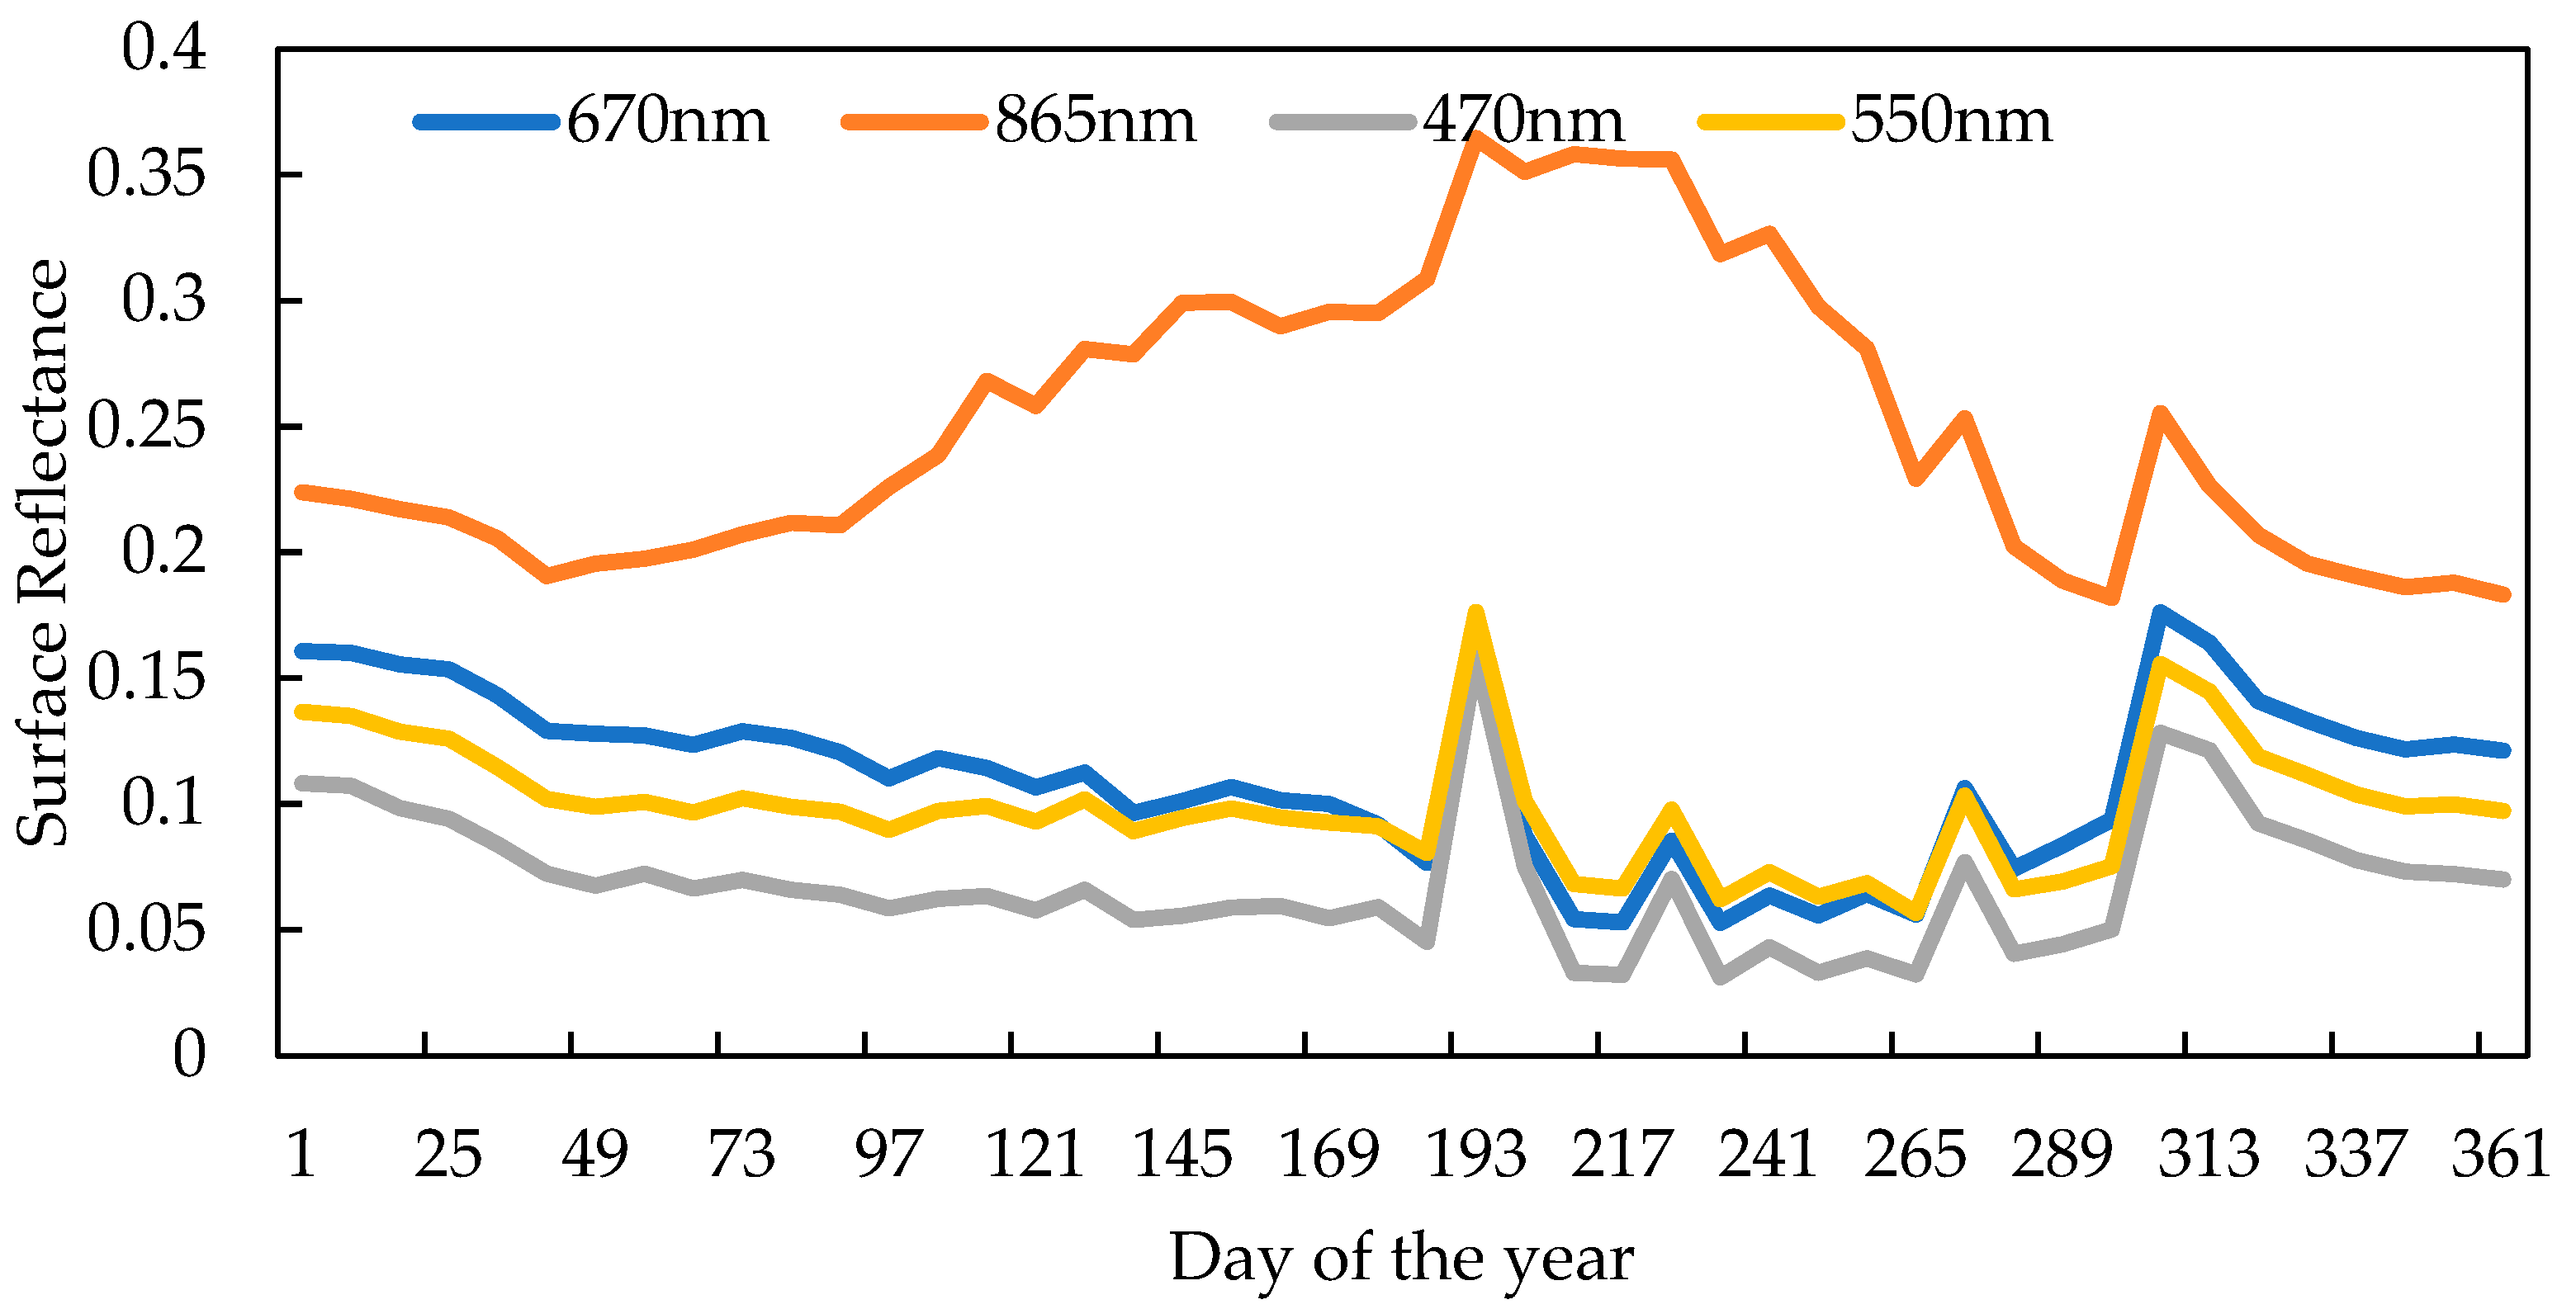
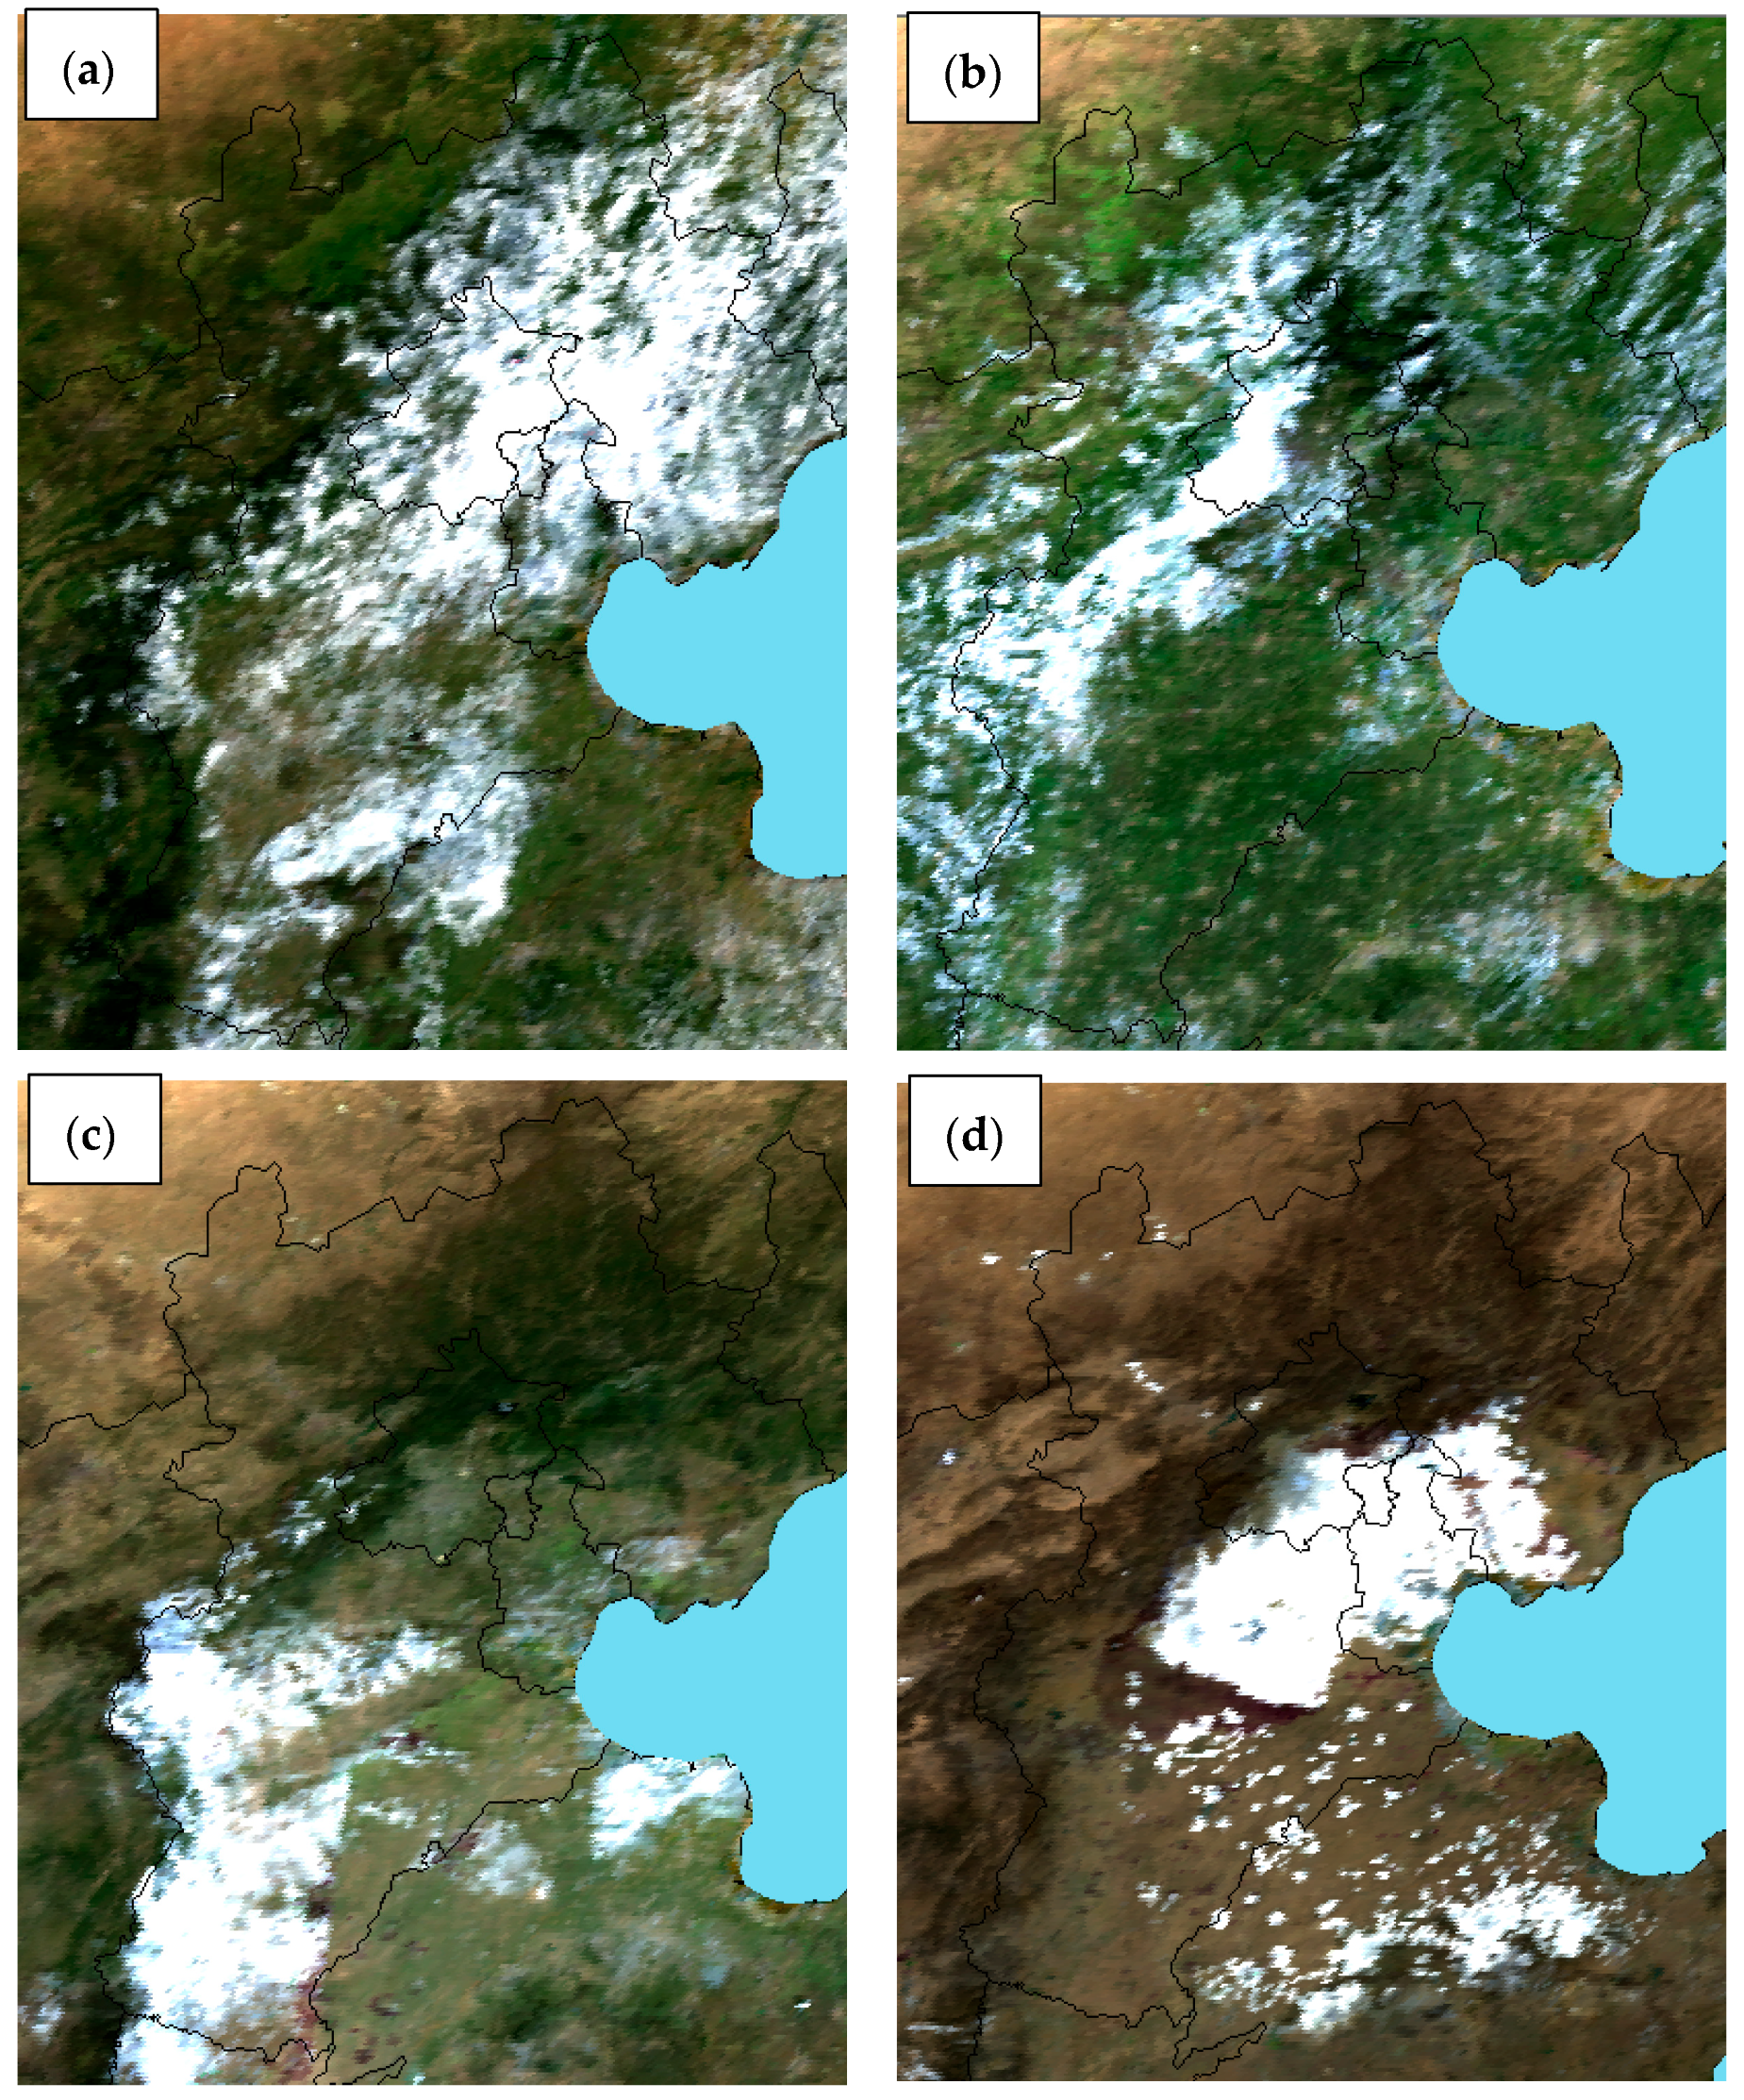
As shown in Figure 6, the average reflectance over the JJJ region was calculated across four bands. The surface reflectance at 865 nm was the highest, while that at 470 nm was the lowest. Surface reflectance varied with changes in vegetation. During the first half of the year, as vegetation grew, the reflectance in the 470 nm, 550 nm, and 675 nm bands gradually decreased, while the reflectance at 865 nm increased. Between days 209 and 297, the reflectance remained relatively stable. Afterward, the reflectance increased significantly, likely due to the harvesting of crops. In Figure 7, the reflectance values for days 193, 225, 273, and 305 were particularly high, primarily due to the presence of extensive cloud cover.
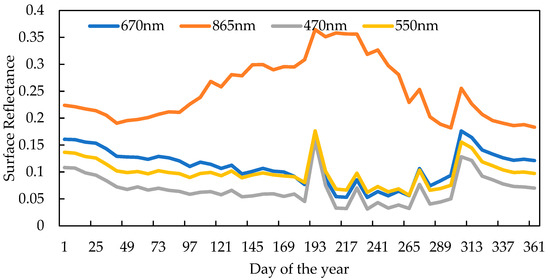
Figure 6.
Region-averaged surface reflectance in the four bands.
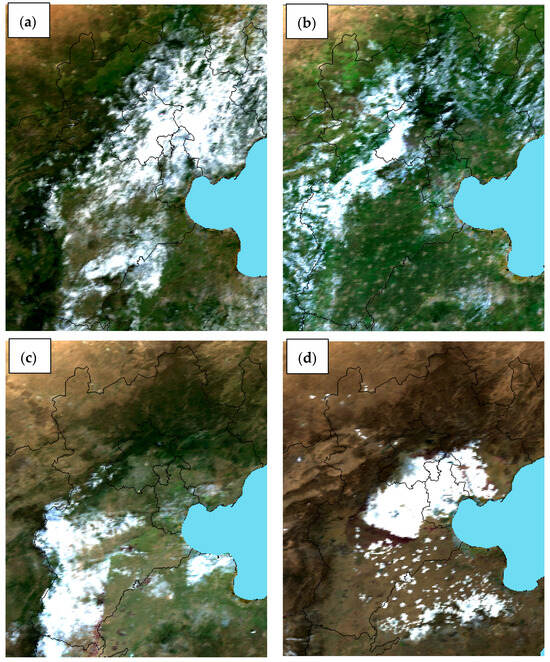
Figure 7.
MODIS RGB images for days 193 (a), 225 (b), 273 (c), and 305 (d) in 2021 over JJJ region show the presence of clouds.
To remove outliers, such as clouds in Figure 7, the point was removed when the surface reflectance in the blue band was greater than 0.2 or the distance, as calculated in , was more than twice the average value.
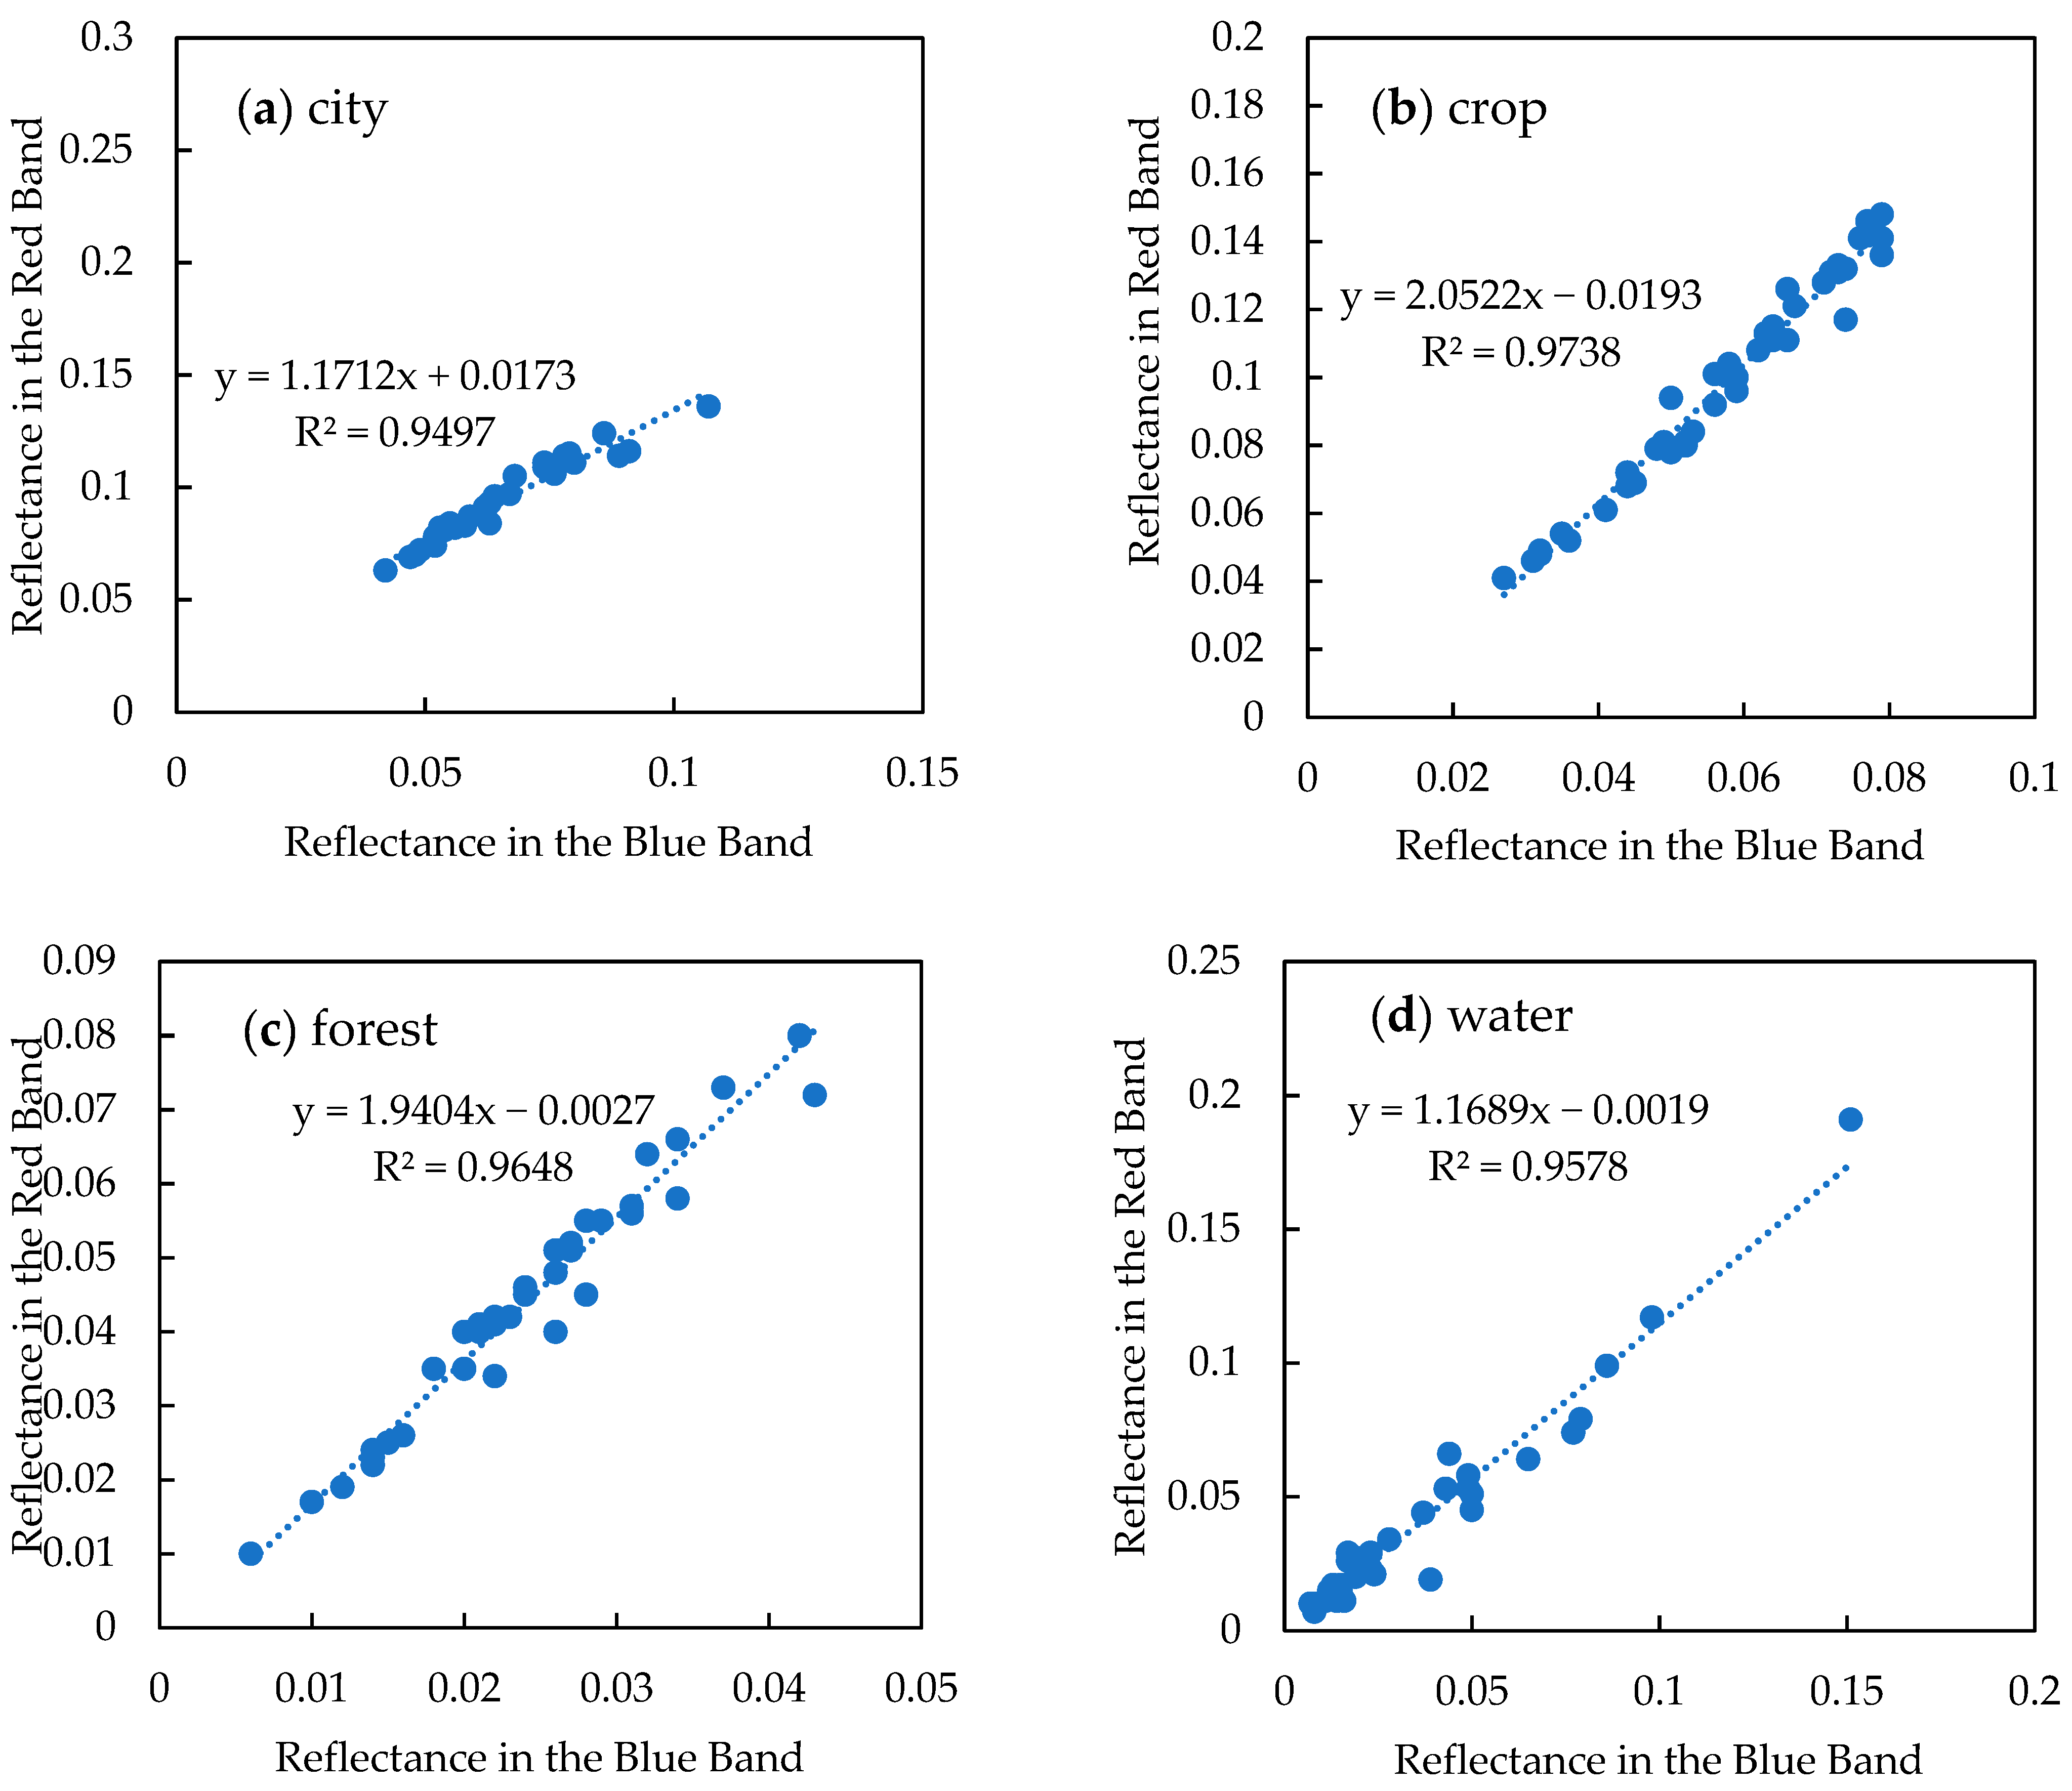
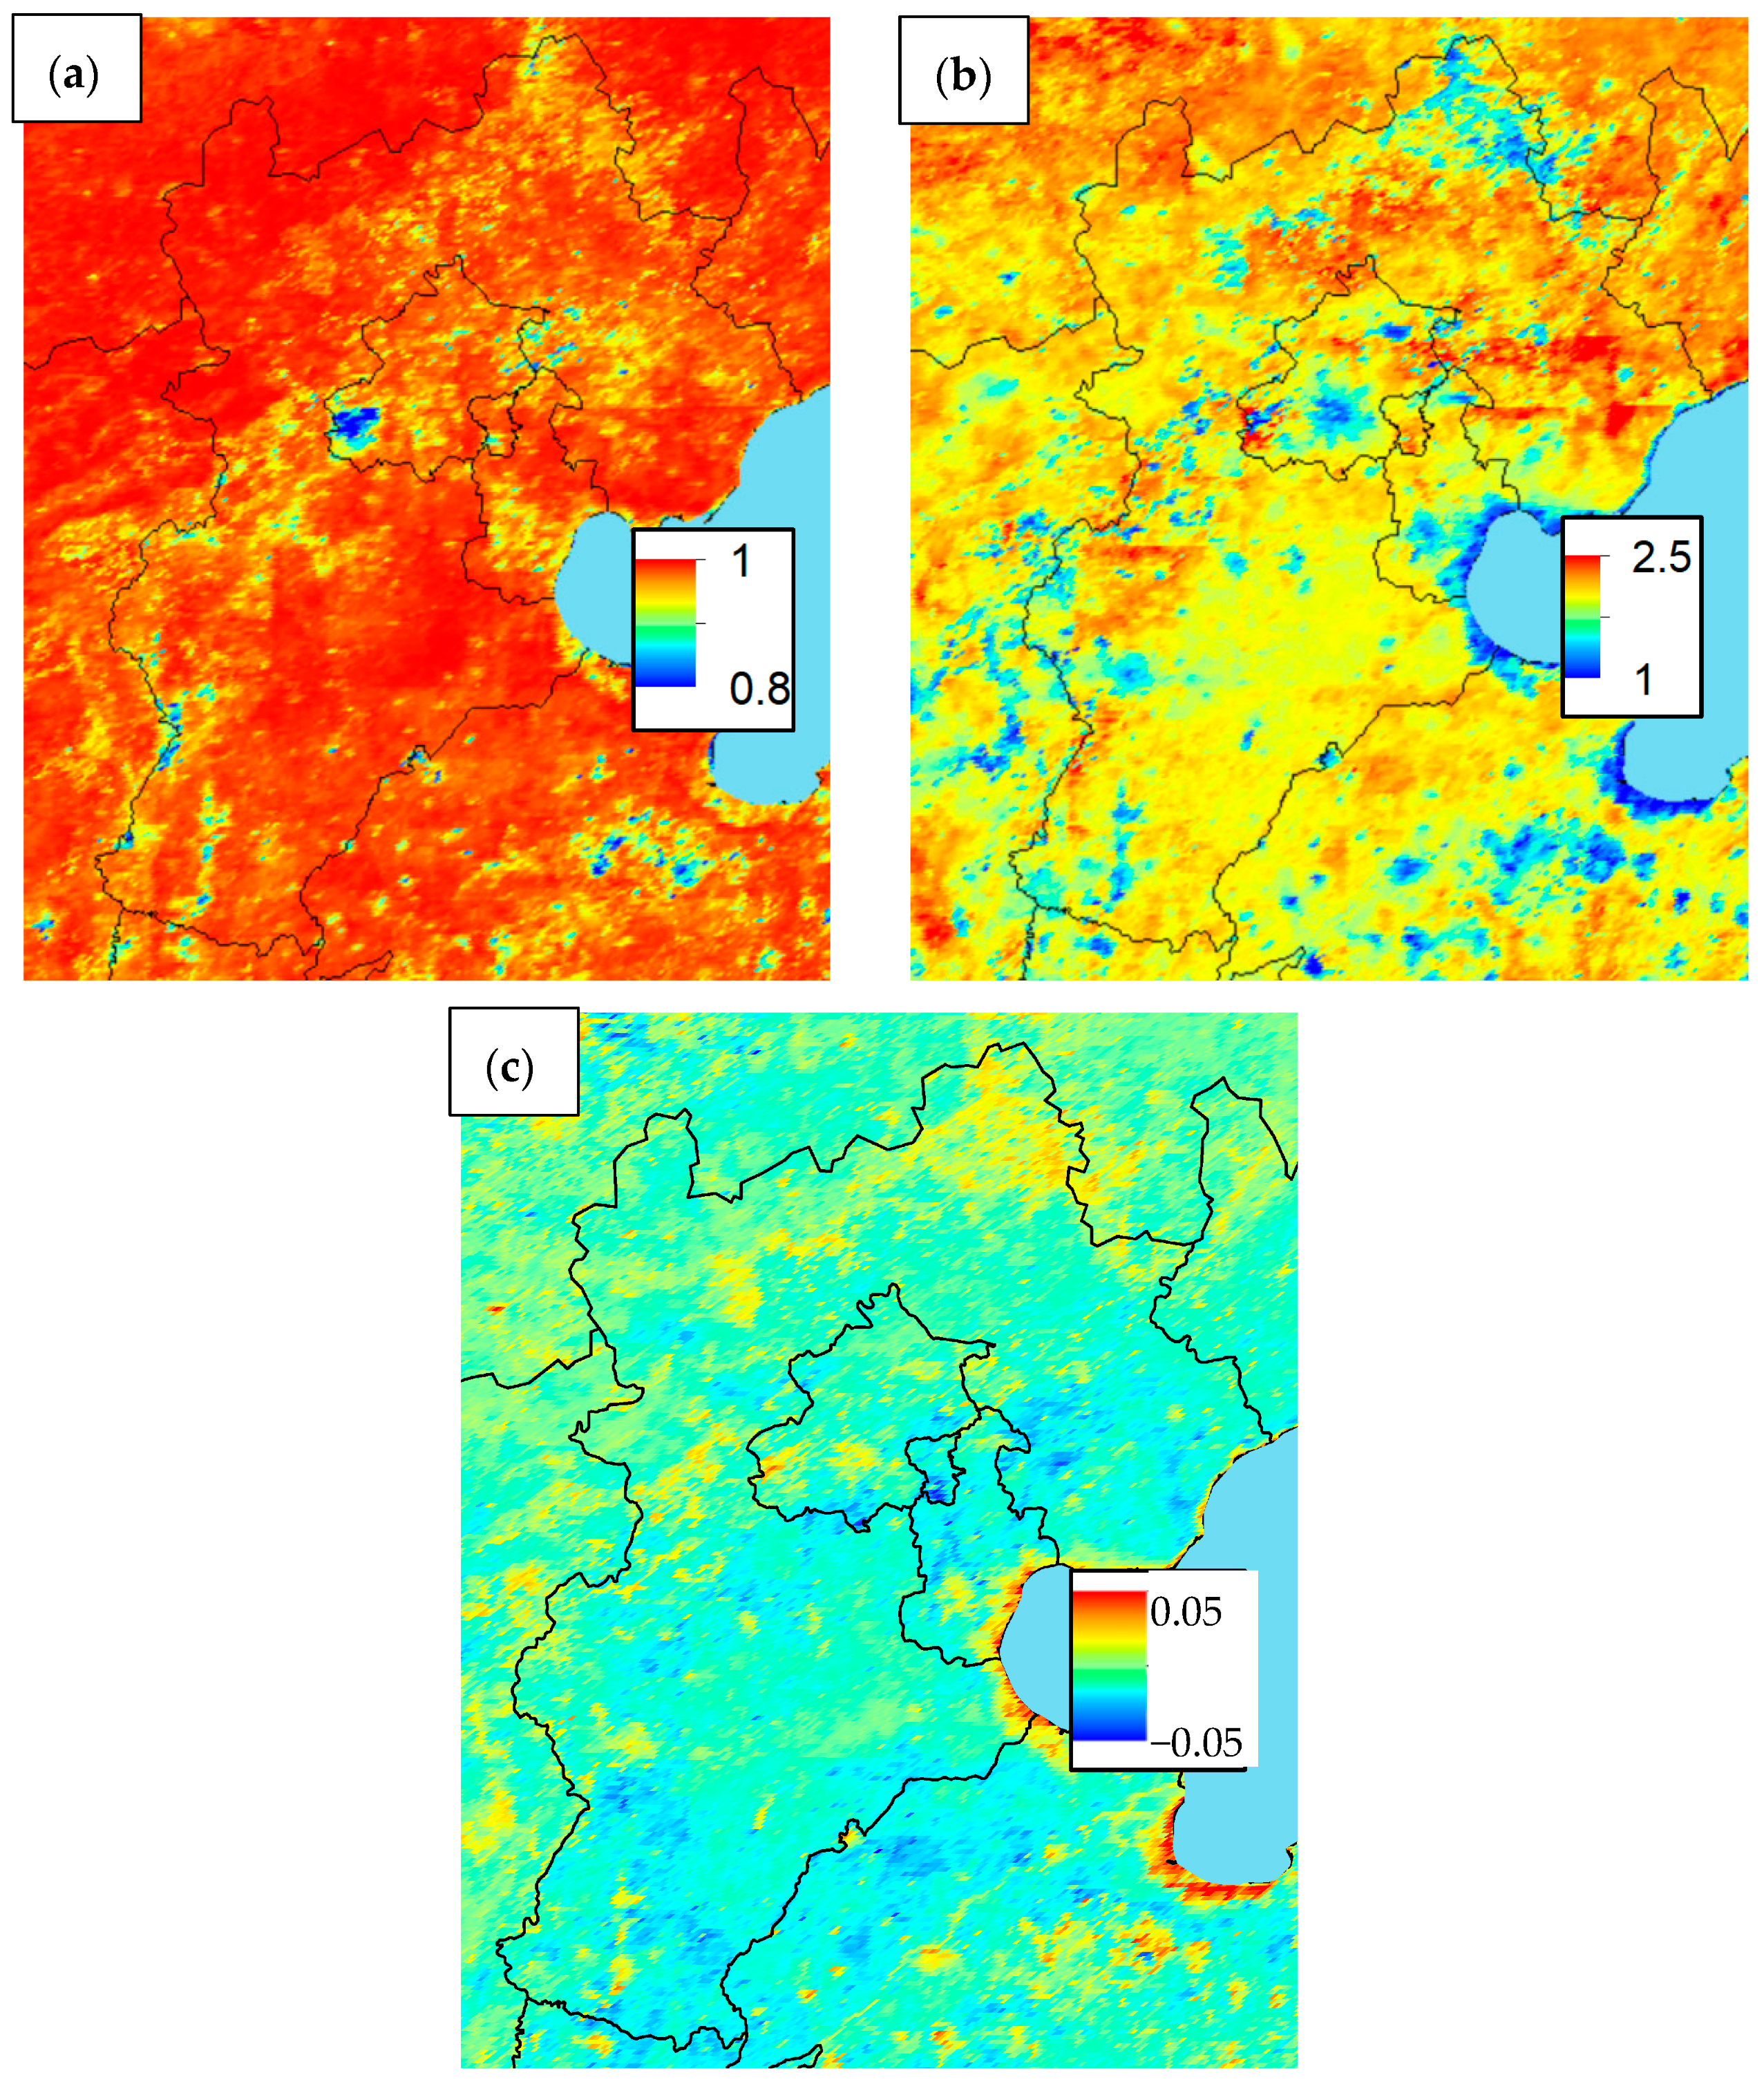
We selected forest, crop, urban, and lake pixels to analyze the reflectance in four bands. As shown in Table 2 and Figure 8, the correlation coefficients for red vs. blue, red vs. green, and blue vs. green were higher than those for red vs. near-infrared (NIR), NIR vs. blue, and NIR vs. green. This is because, with the growth of vegetation, the reflectance in the NIR band increases. In the DDV method, the reflectance in the red and blue bands is used to remove surface contributions and retrieve aerosol properties. The reflectance in the red and blue bands was analyzed for each pixel over the JJJ region, and by linear fitting the correlation between the data points in the two bands, the correlation coefficient (R), as well as the parameters a (slope) and b (offset) of the fit, were obtained. As shown in Figure 9, the R was greater than 0.9 in most areas. In urban areas, such as Beijing and Tianjin, R was around 0.9, while it exceeded 0.95 in farmland areas; however, in the southwest of Beijing, R was approximately 0.8. The parameter a ranged from 1 to 2, typically measuring around 1 in urban areas and reaching approximately 2 in farmland and forest areas. The parameter b maintained a consistent range between −0.05 and 0.05 across all study areas.
Table 2.
Correlation coefficients between reflectances at different wavelengths for typical surfaces from MOD09.
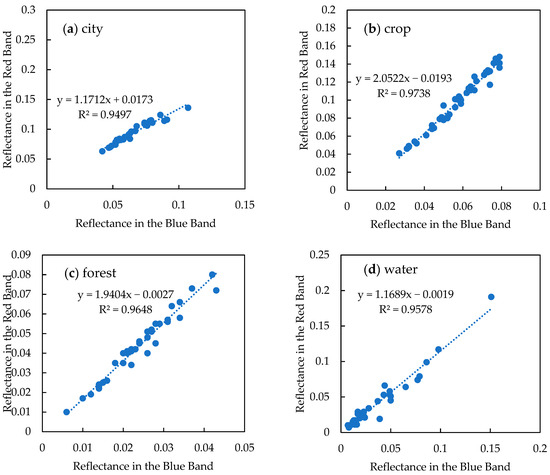
Figure 8.
Correlation between reflectance measurements in the blue and red bands for different terrain types ((a) city, (b) crop, (c) forest, and (d) water). The blue dots are the reflectance in the blue and red bands, and the blue lines are the regressions.
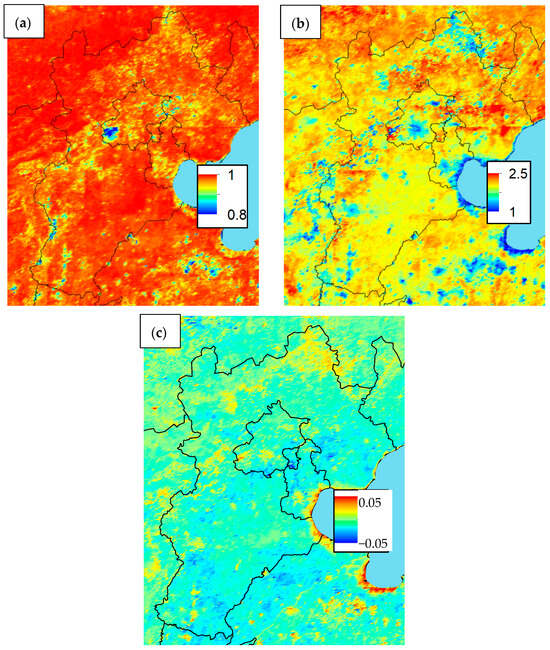
Figure 9.
Images of R (a), a (b), and b (c) between MODIS blue and red bands in 2021 over the JJJ region.
5. Retrieval Experiments and Validation
Using the method described above, we retrieved AOD images over the JJJ region from GF-5 02 DPC data collected between 1 January and 30 June 2022. A total of 132 images of the JJJ region were obtained from the GF-5 02 DPC during this period. DPC retrieval showed that the GRASP/MODEL requires 0.3 s per pixel for retrieving, while our method achieves a reduced computation time of 0.21 s per pixel, demonstrating a computational efficiency improvement of approximately 30%. The better performance of our method may be due to the utilization of MOD09 data, while GRASP/MODEL’s performance can be attributed to its absence of prior constraints and implementation of real-time radiative transfer computations.
To demonstrate the retrieval process, we selected data from three specific days. The Red Green Blue (RGB) and AOD images for these days are shown in Figure 10. On 10 February, the AOD gradually increased from northwest to southeast. Due to the cloud cover and low AOD in the northwest, some areas were rendered white, indicating missing data. On 2 May, the JJJ region was clear, with AOD values generally below 0.5. On 20 June, aerosol pollution was more pronounced in the central part of the region, with AOD values exceeding 1, and on the right side of the AOD image, there are no data in the blank area due to the swath limitations of the DPC. Figure 10g shows the averaged AOD between 1 January and 30 June, and it is oblivious that AOD is low in the northwest while AOD is high in the southeast. There is a high AOD region in the northern part of Hebei province, which may be an overestimation caused by snow cover in winter.
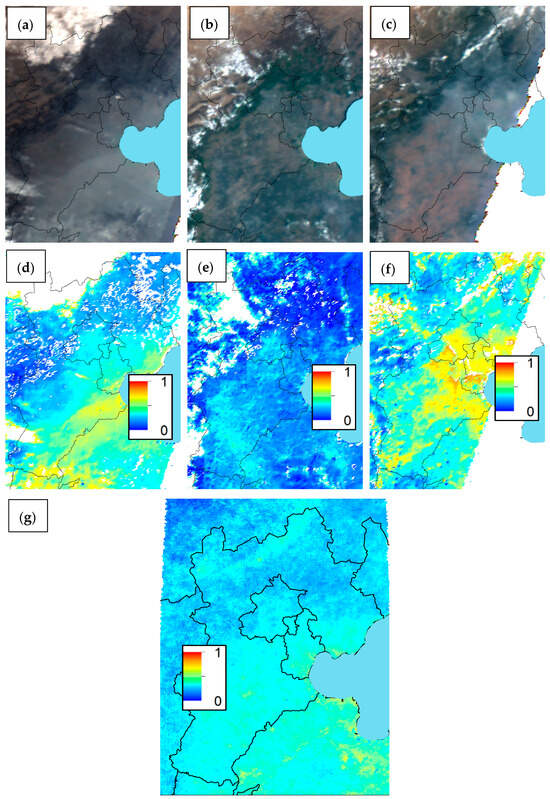
Figure 10.
RGB and AOD images from the DPC on 10 February ((a) RGB, (d) AOD), 2 May ((b) RGB, (e) AOD), 20 June ((c) RGB, (f) AOD), and averaged AOD (g) during the testing retrieval period.
Next, to validate our method, we compared the retrieved AOD with aerosol products from the AERONET Beijing-RADI site, as well as MODIS and GRASP data. To match the overpass local time of the GF-5 02 satellite, we used MODIS aerosol products from the Terra satellite, specifically from the 6.1 collection of MOD04 L2, which includes AOD data at a 10 km resolution obtained using the DDV and DB methods [44,45,46,47]. GRASP is an open-source software package designed for retrieving various optical and microphysical properties of aerosols and the surface from different remote sensing instruments, such as satellites, lidar, radiometers, and radiosondes [48]. In this study, we used the GRASP/Model v1.0 [35] to retrieve the AOD from DPC intensity data in the 490 nm, 550 nm, 670 nm, and 865 nm bands, which are consistent with our method.
To compare AOD data from the DPC and MODIS with AERONET, we converted AERONET AOD products at 440 nm and 675 nm into the AOD at 550 nm by using the Angström formula [49]. Given the small spatial and temporal variability in aerosol distribution, we averaged the AOD data from our method over a 10 × 10 km area (about 3 × 3 pixels) centered around the Beijing-RADI site. AERONET AOD data within one hour were also averaged. To ensure cloud-free AERONET products, we removed data where the standard deviation of the AOD exceeded 50% of the average AOD within one hour, and more than 70% of AERONET product remained.
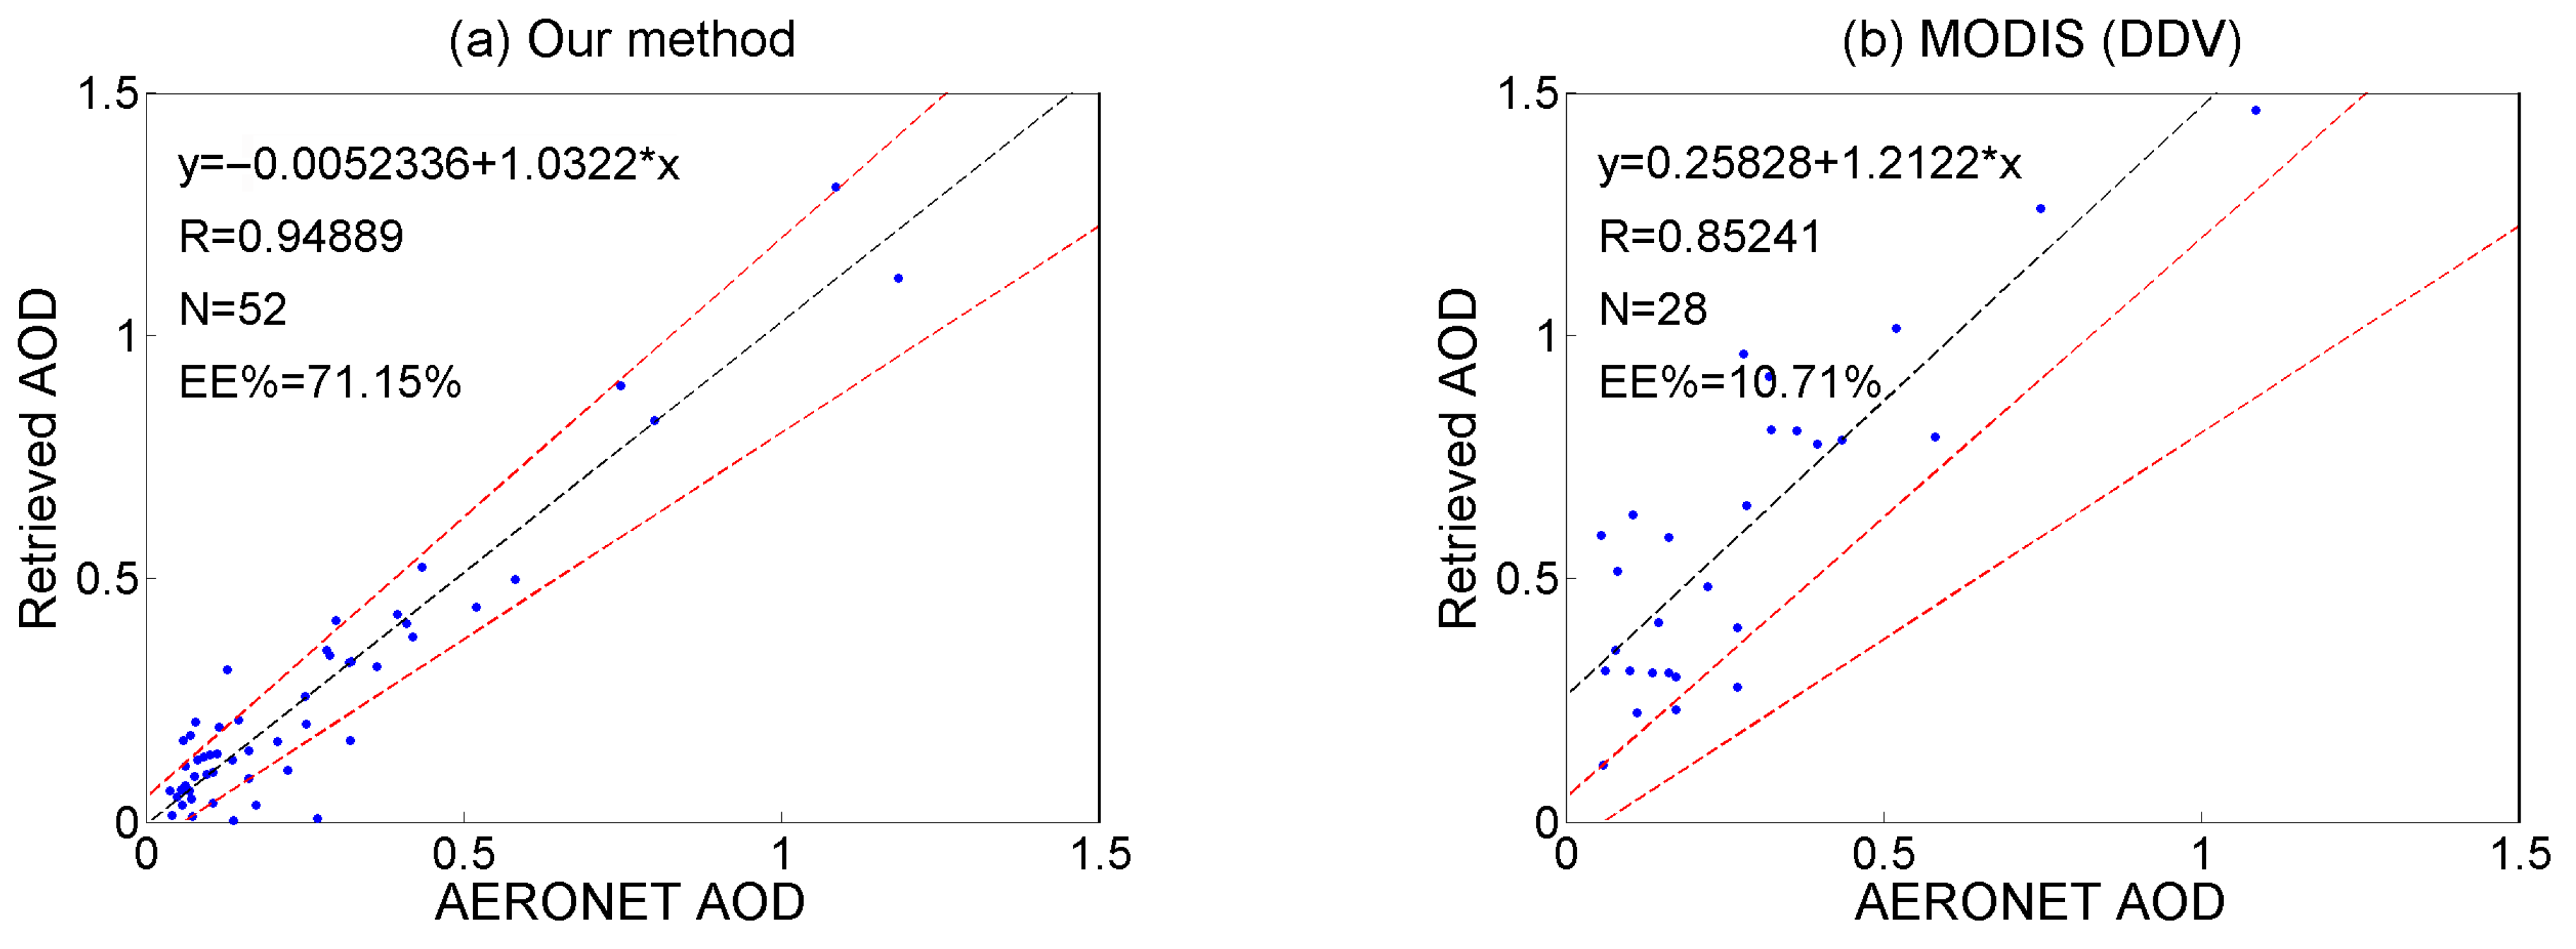
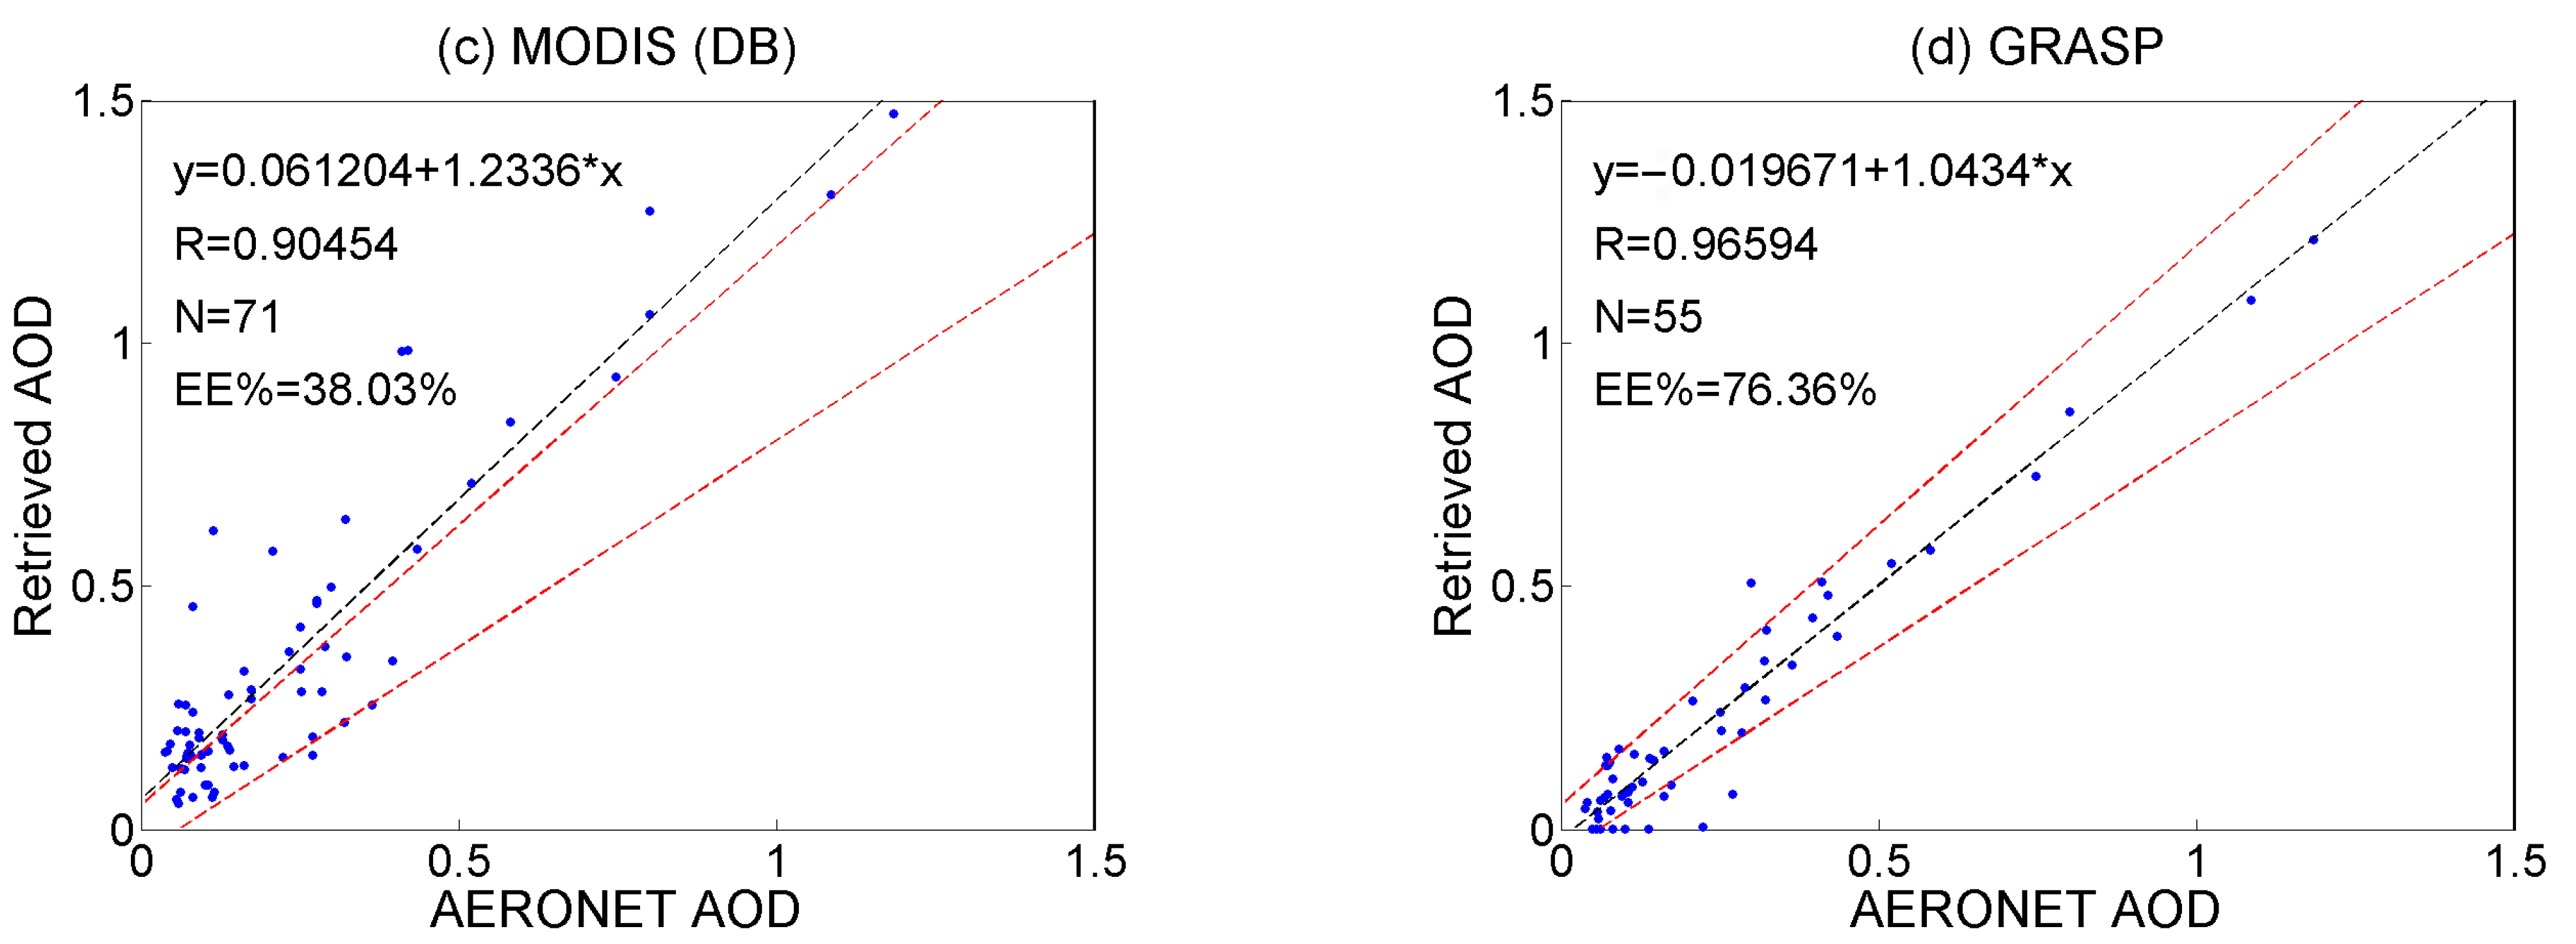
As shown in Figure 11, the validation of our method was similar to that of GRASP, while the results from the MODIS DDV and DB methods were less accurate than those from GRASP. Among the four methods, GRASP achieved the best performance, with the highest R, the lowest root mean square error (RMSE), and the most within expected error (EE). The R for our method was greater than 0.9, and the RMSE was below 0.1. The MODIS results were consistently higher than the AERONET data, with AOD values greater than 1.2 times those from AERONET. The MODIS (DDV) method had the fewest data points (28) due to sparse vegetation in the fall and winter, while the MODIS (DB) method had the most data points (71), as MODIS had a larger swath than the DPC and the DB method was suitable for sparse vegetation. At low AOD, our methods exhibit suboptimal performance, potentially due to the uncertainties of surface reflectance from MODIS. The paper focused on JJJ region, the 52 data points have provided preliminary evidence of the method’s operational performance under JJJ atmospheric conditions. In the future, our method would be validated over a longer time span and in more regions.
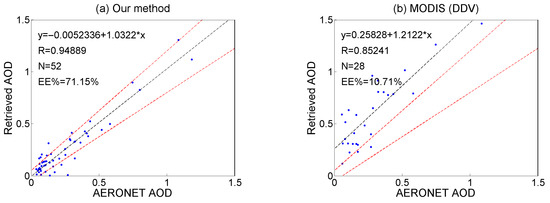
Figure 11.
Correlation of the results obtained with our method with AERONET (a), MODIS aerosol product—DDV (b), MODIS aerosol product—DB (c), and GRASP (d). The blue dots are the data points, the black dashed lines are the regressions, and the red dashed lines are the expected errors (EE).
6. Discussion
6.1. Calibration
Generally, radiance calibration uncertainties are below 5% [34,36]; however, based on Rayleigh scattering over the ocean, radiance calibration uncertainties of DPC were found to be larger [50], ranging from 1% to 7%, depending on the band and view zenith angle. Additionally, data comparisons between the DPC and particulate observing scanning polarimeter (POSP) showed that there was a temporal drift in the DPC’s relative radiation response [51].
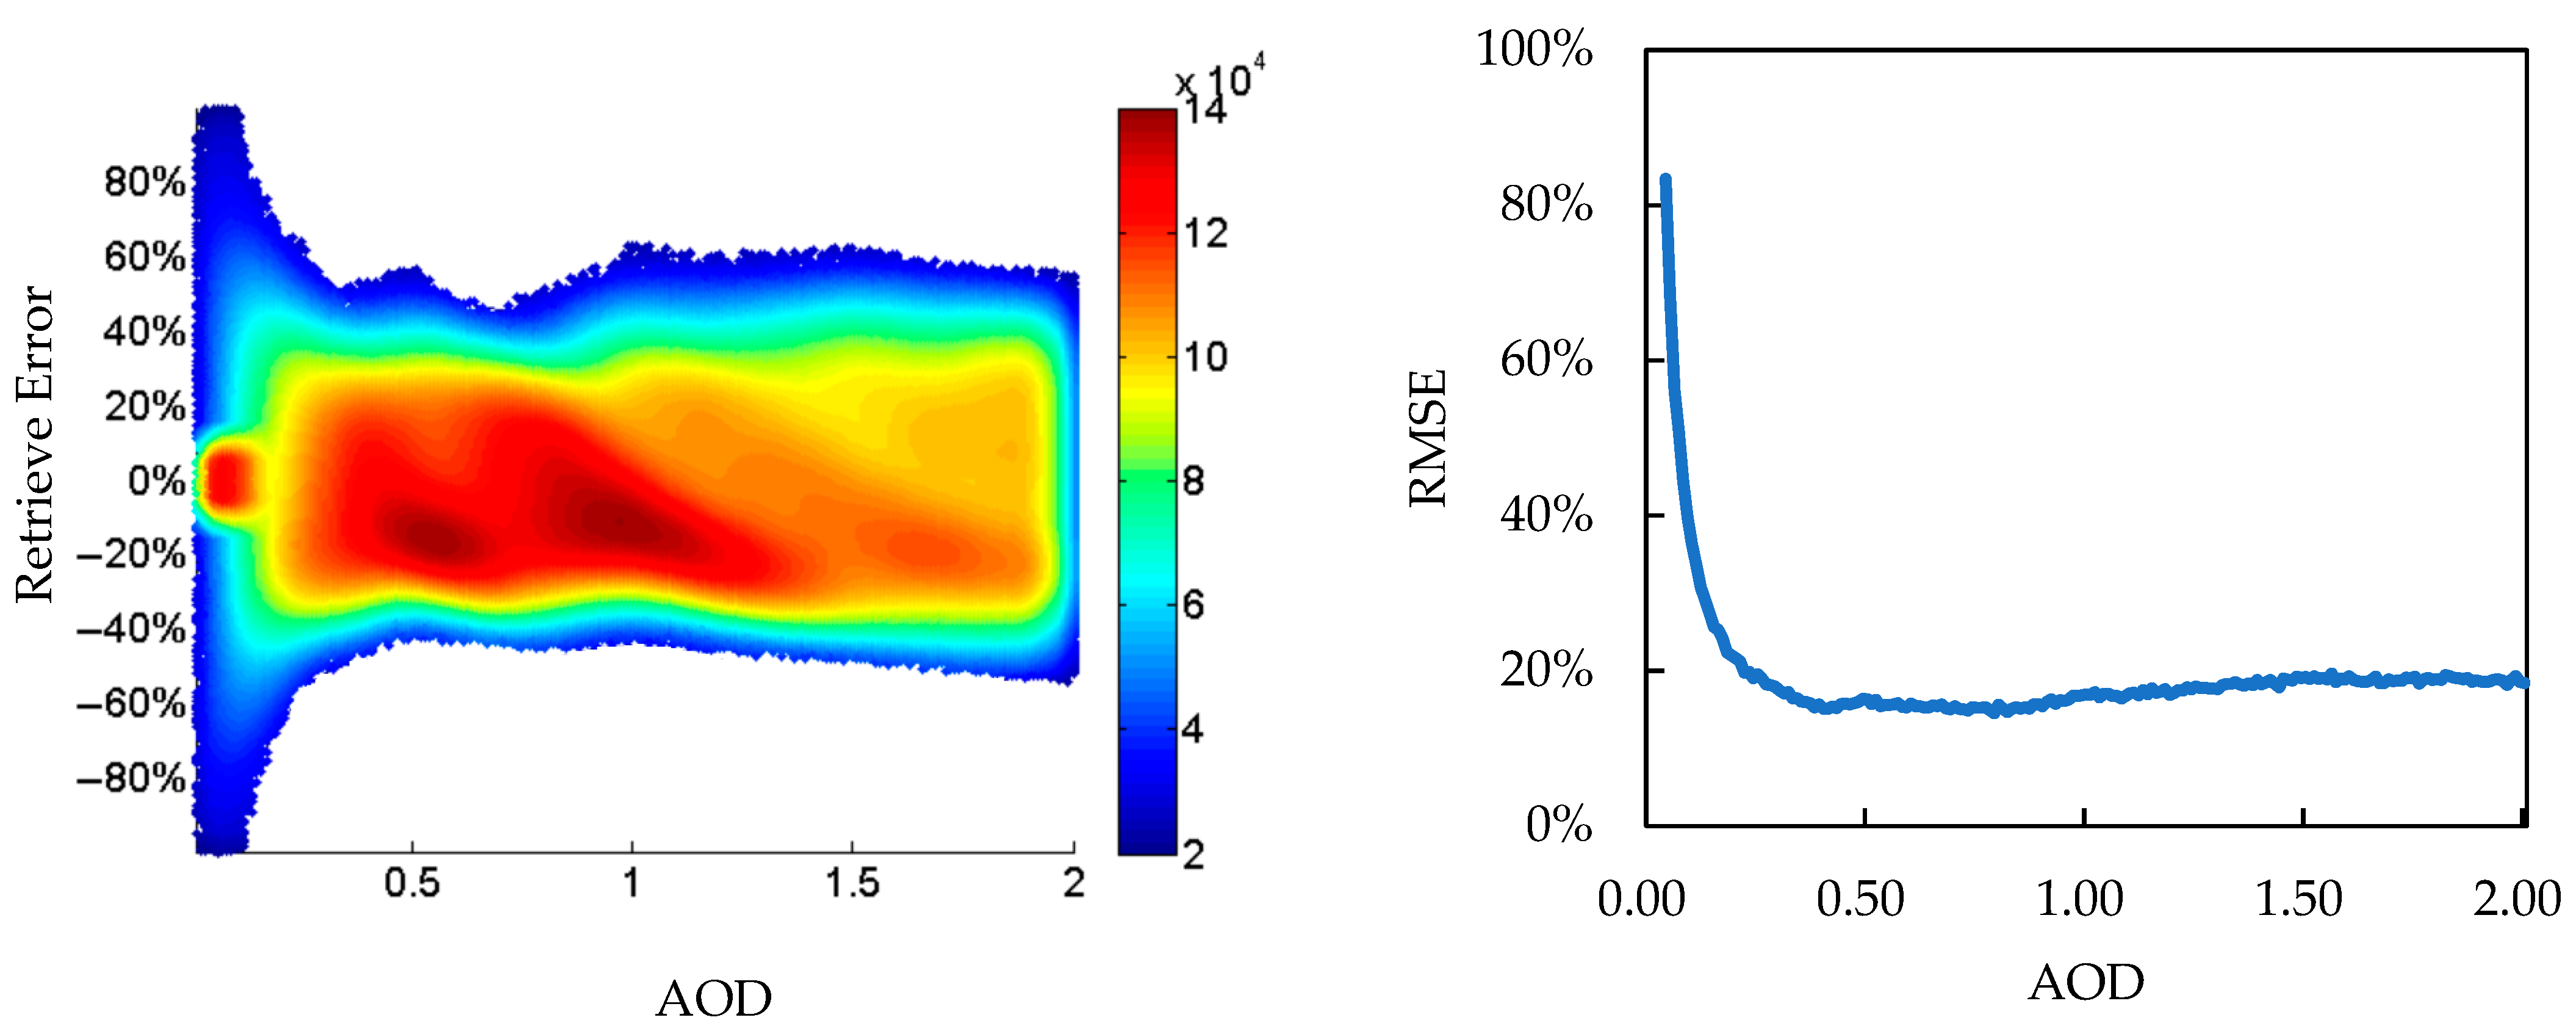
To evaluate the impact of calibration errors, we simulated the apparent reflectance with AOD values ranging from 0 to 2 and introduced random errors of −5% to +5% as calibration uncertainties, while other uncertainties were not included. Figure 12 shows the relative error of the retrieved AOD and the RMSE of the relative error. As the AOD increased, the relative error decreased to within ±40%, then increased again to within ±50%. For the RMSE, it decreased rapidly with an increasing AOD and stabilized at around 20%. Therefore, to improve retrieval accuracy, it is crucial to minimize calibration uncertainties.

Figure 12.
Retrieval error (left) and root mean square error (RMSE) (right) obtained from calibration error from vibration during launch, the aging of DPC, and so on.
6.2. Spectral Response Function (SRF)
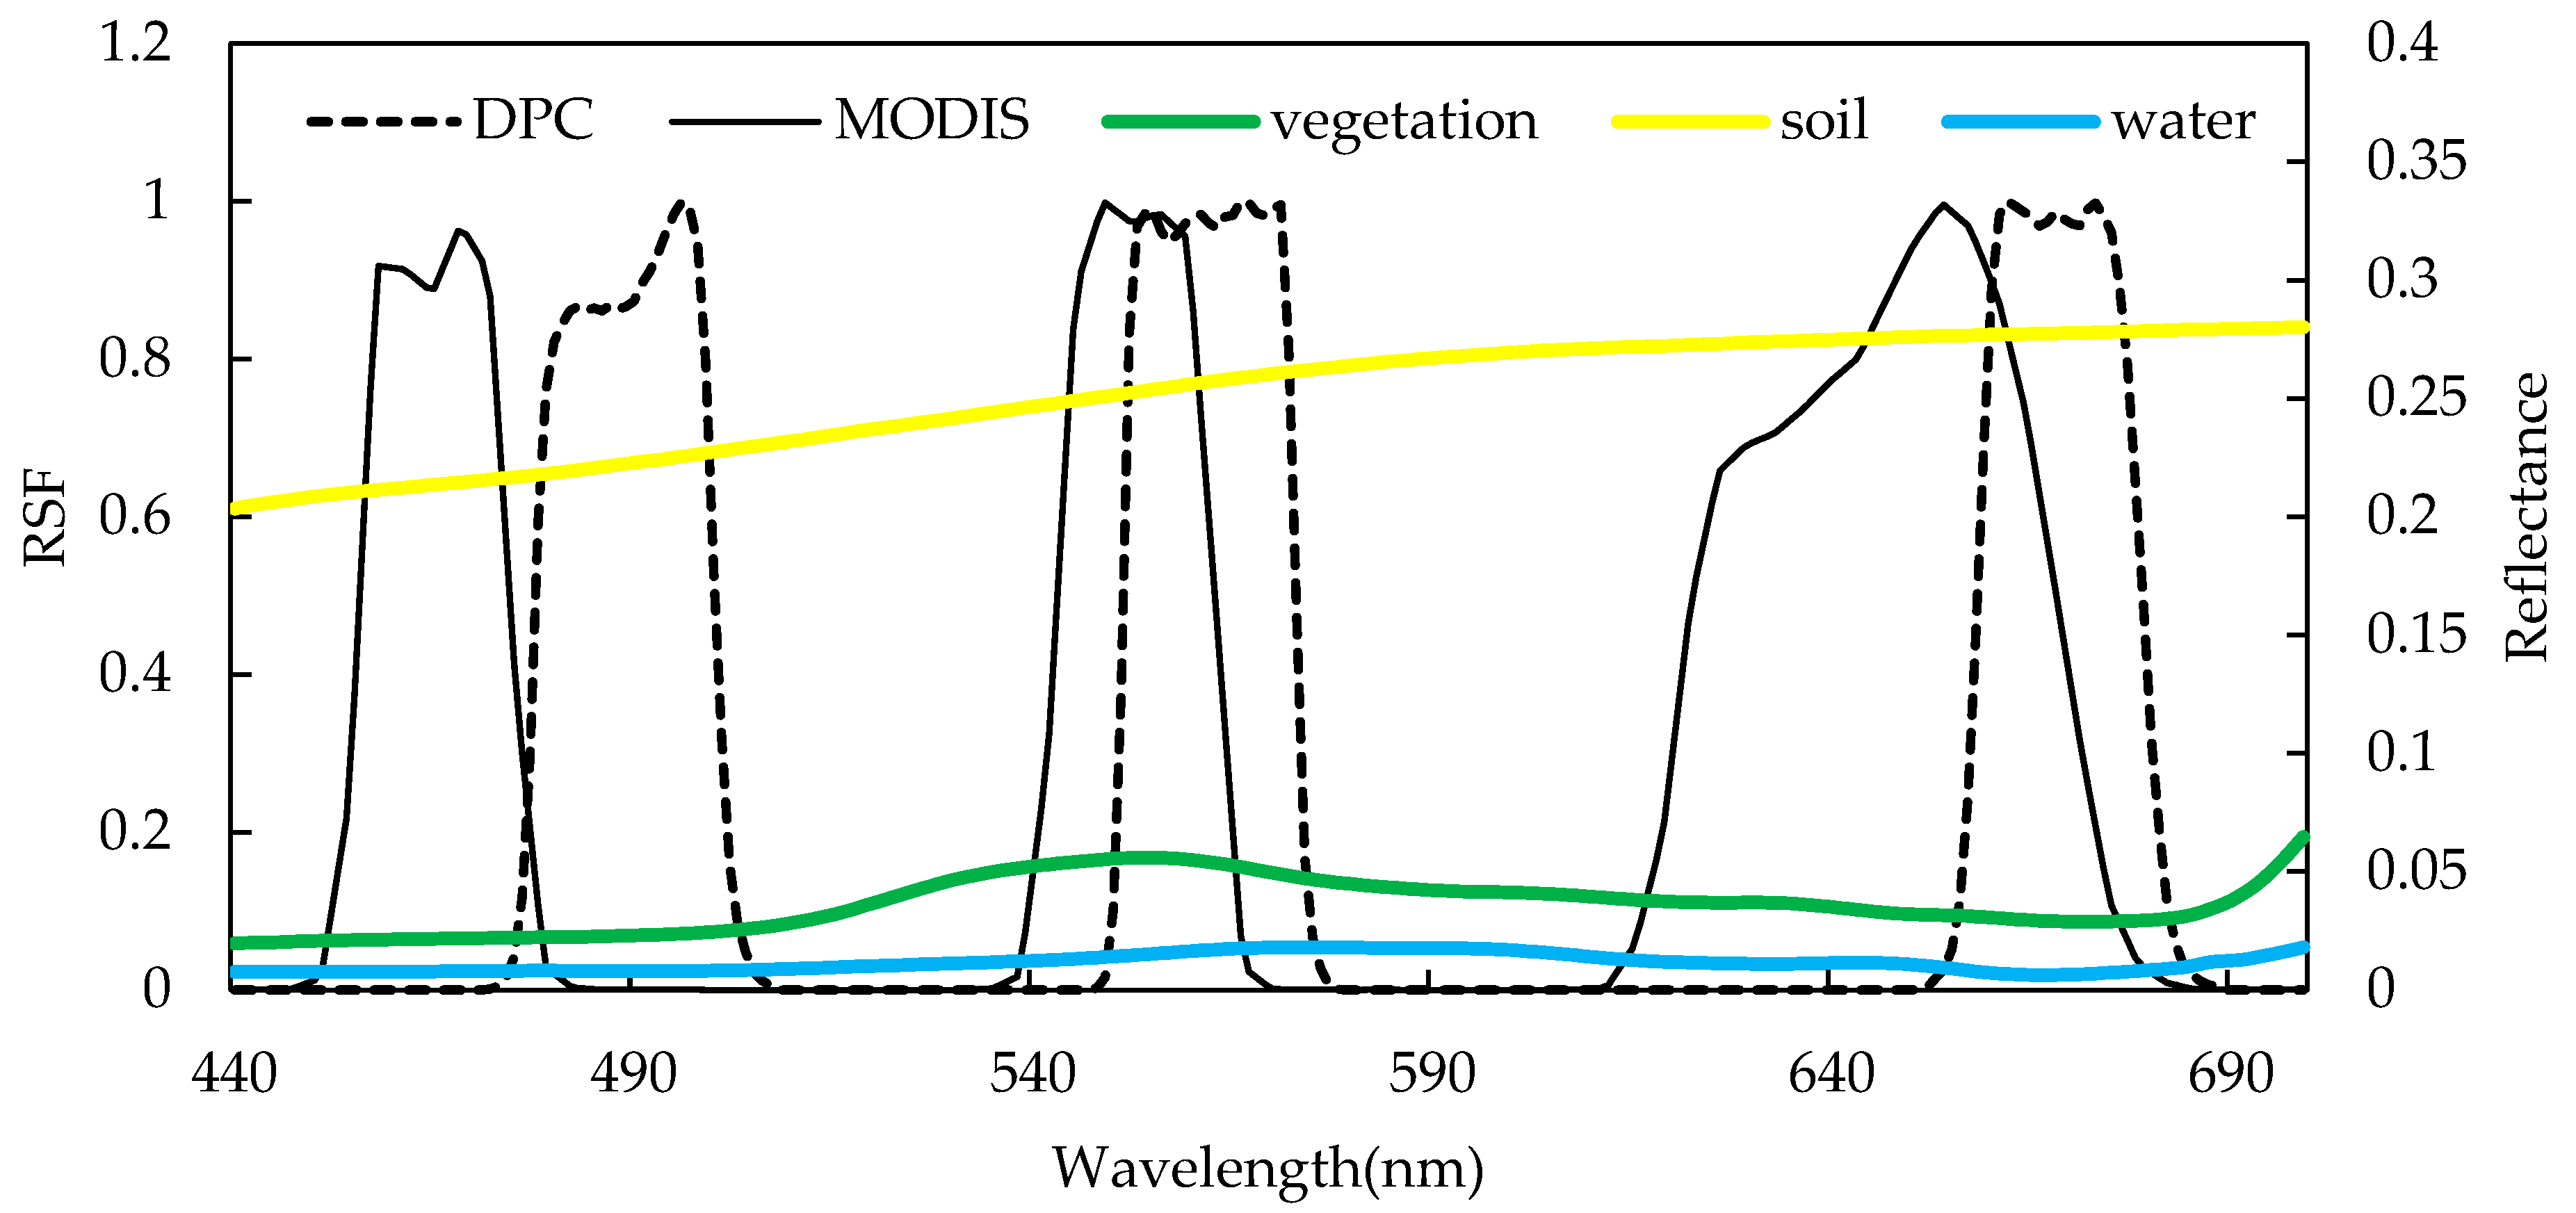
In this paper, we received parameters a and b of Equation (3) from the MOD09 product of 470 nm and 660 nm. As shown in Figure 13, the SRF of the DPC was different from MODIS. The central wavelength of the DPC was larger than MODIS, and in the red band, the width of MODIS was wider than the DPC. The land surface spectra from ground measurement were used to discuss the error from different SRFs. The typical spectra of soil, vegetation, and water were received by analytical spectral devices (ASDs) over Beijing. Compared to the SRF, spectral reflectance changed gradually. Using the SRF of the DPC and MODIS, band reflectance was computed according to the following:
where is the SRF, and is the surface reflectance at the wavelength .
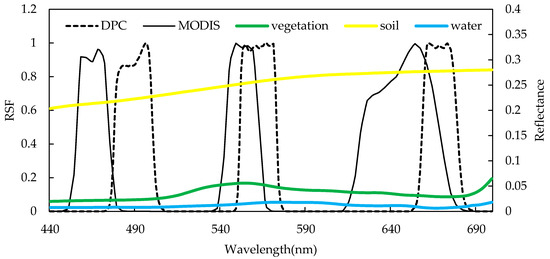
Figure 13.
SRF and surface reflectance from 440 nm to 690 nm. Solid line is MODIS SRF, dotted line is DPC SRF, green line is vegetation spectra, yellow line is soil spectra, and blue line is water spectra.
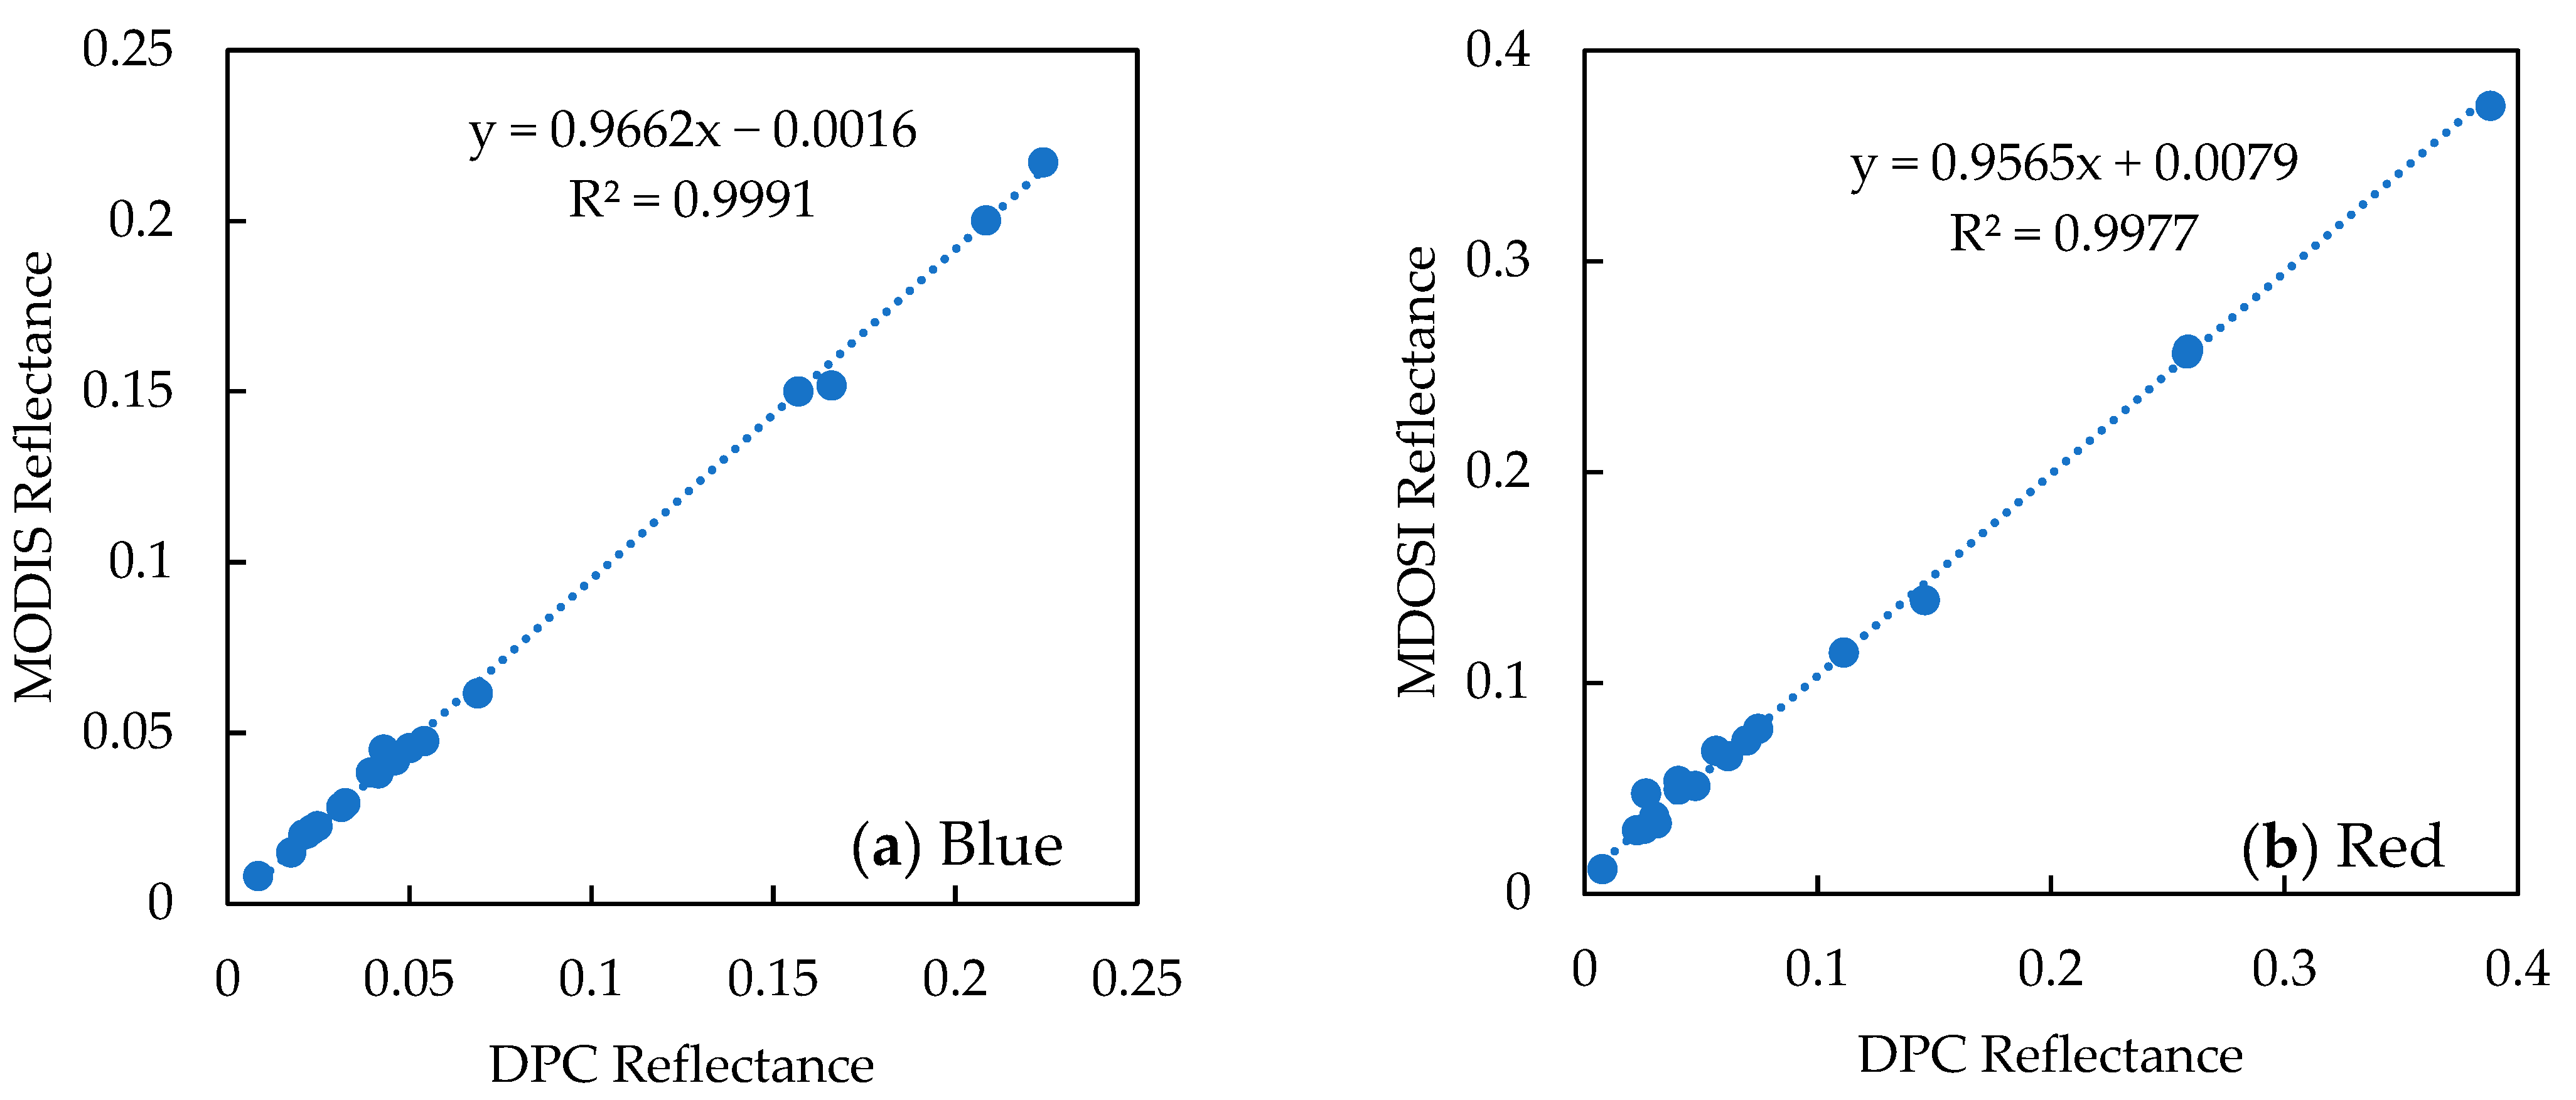
As shown in Figure 14, the reflectance from the DPC closely matched that of MODIS, as the reflectance varied gradually with wavelength. In the red band, the DPC reflectance was 0.005 lower than that of MODIS, while in the blue band, the DPC reflectance was 0.004 higher than that of MODIS.
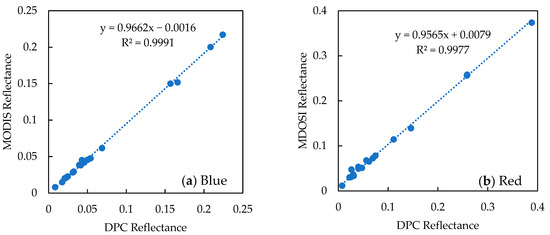
Figure 14.
Reflectance comparison between the DPC and MODIS. The left (a) is blue band, and the right (b) is red band. The blue dots are the reflectance from MODIS and DPC SRF, and the blue dashed lines are the regressions.
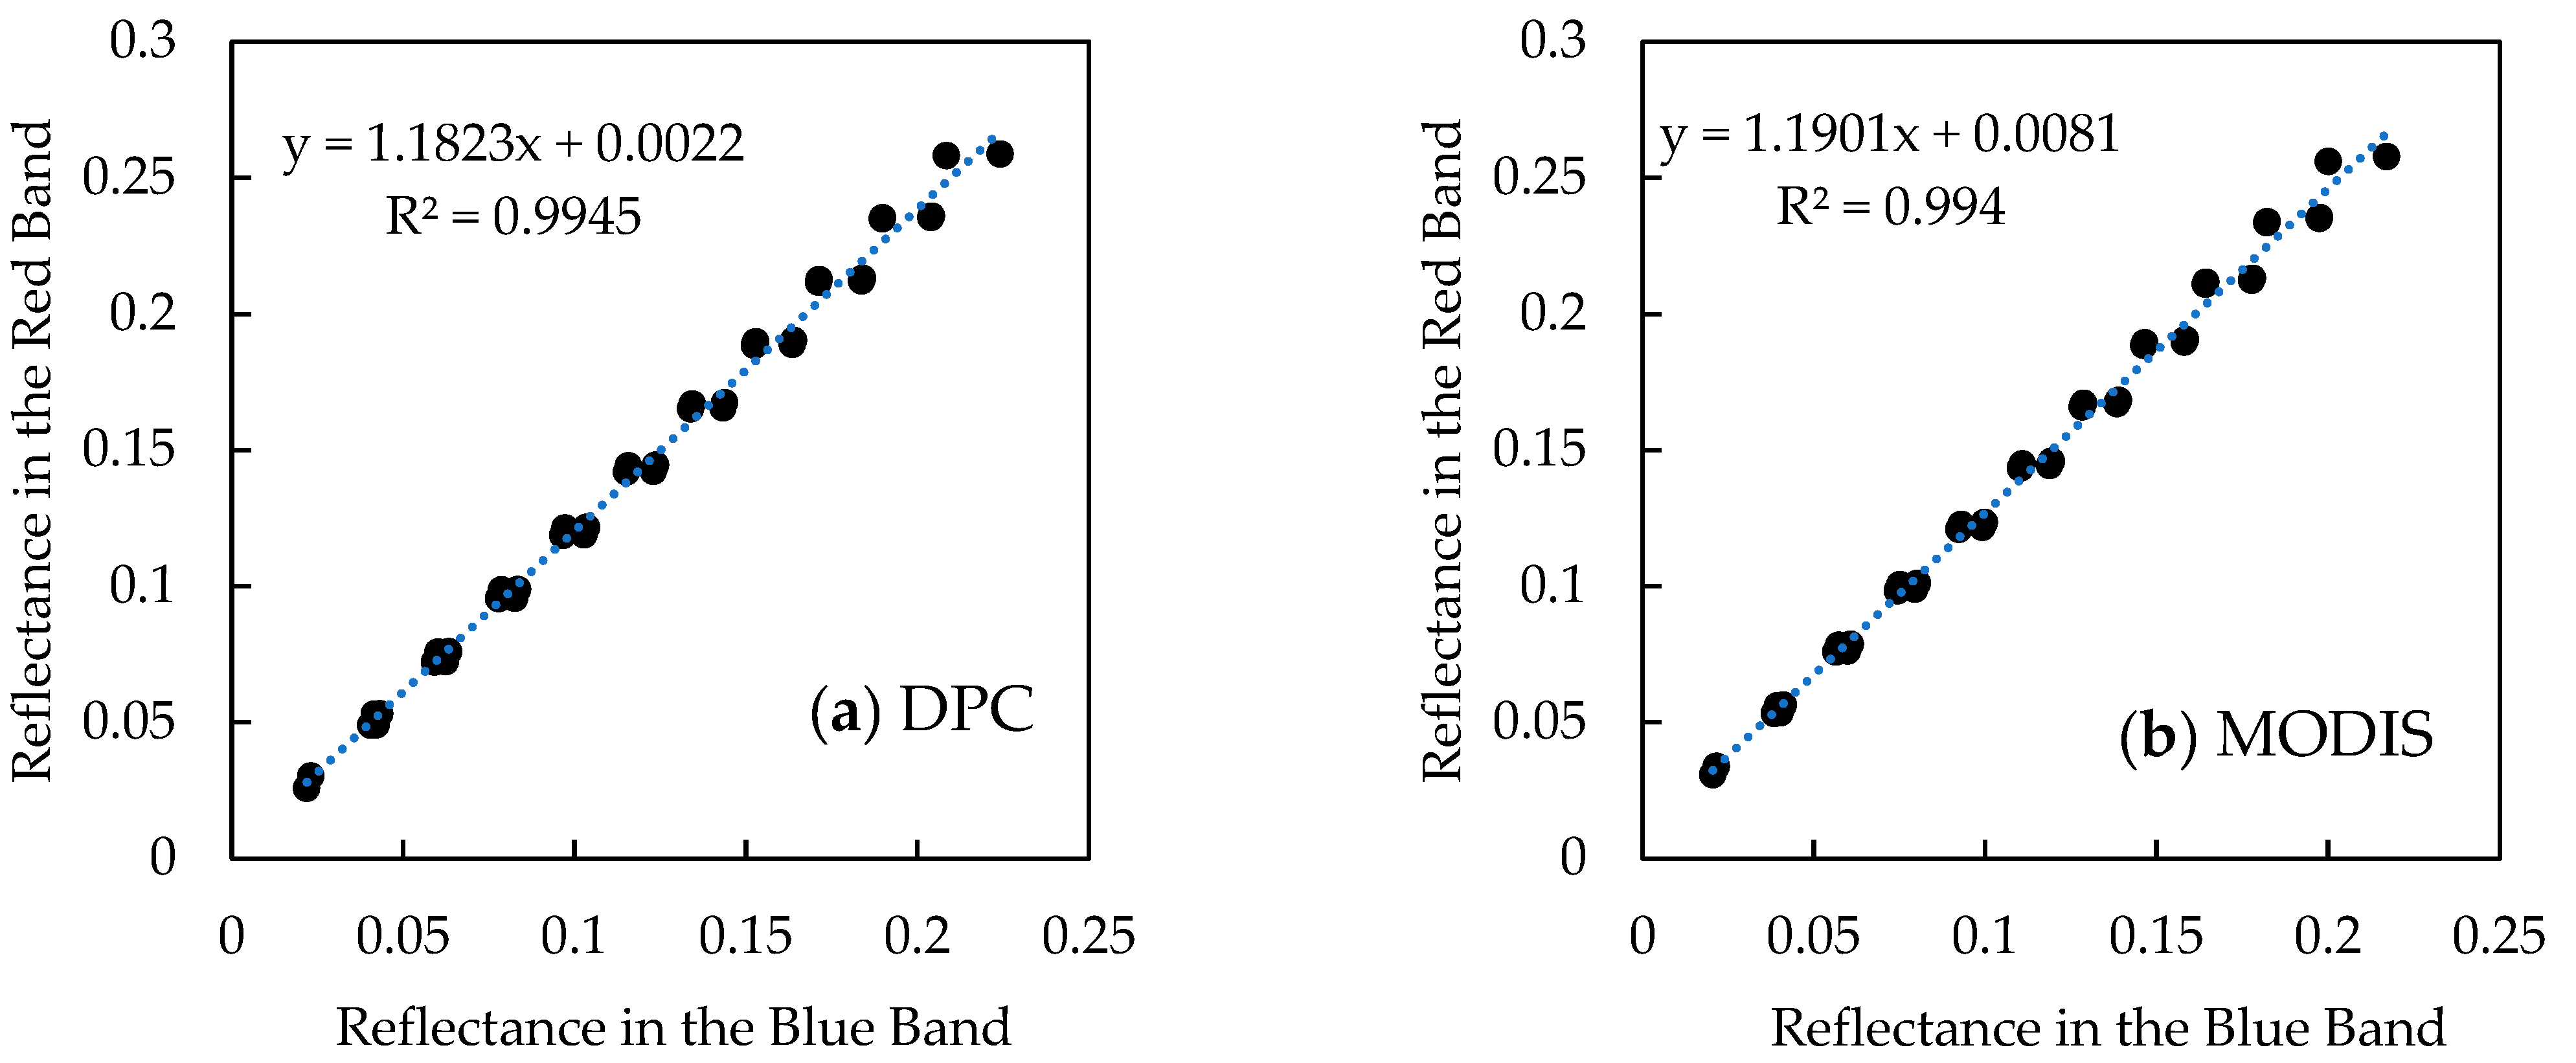
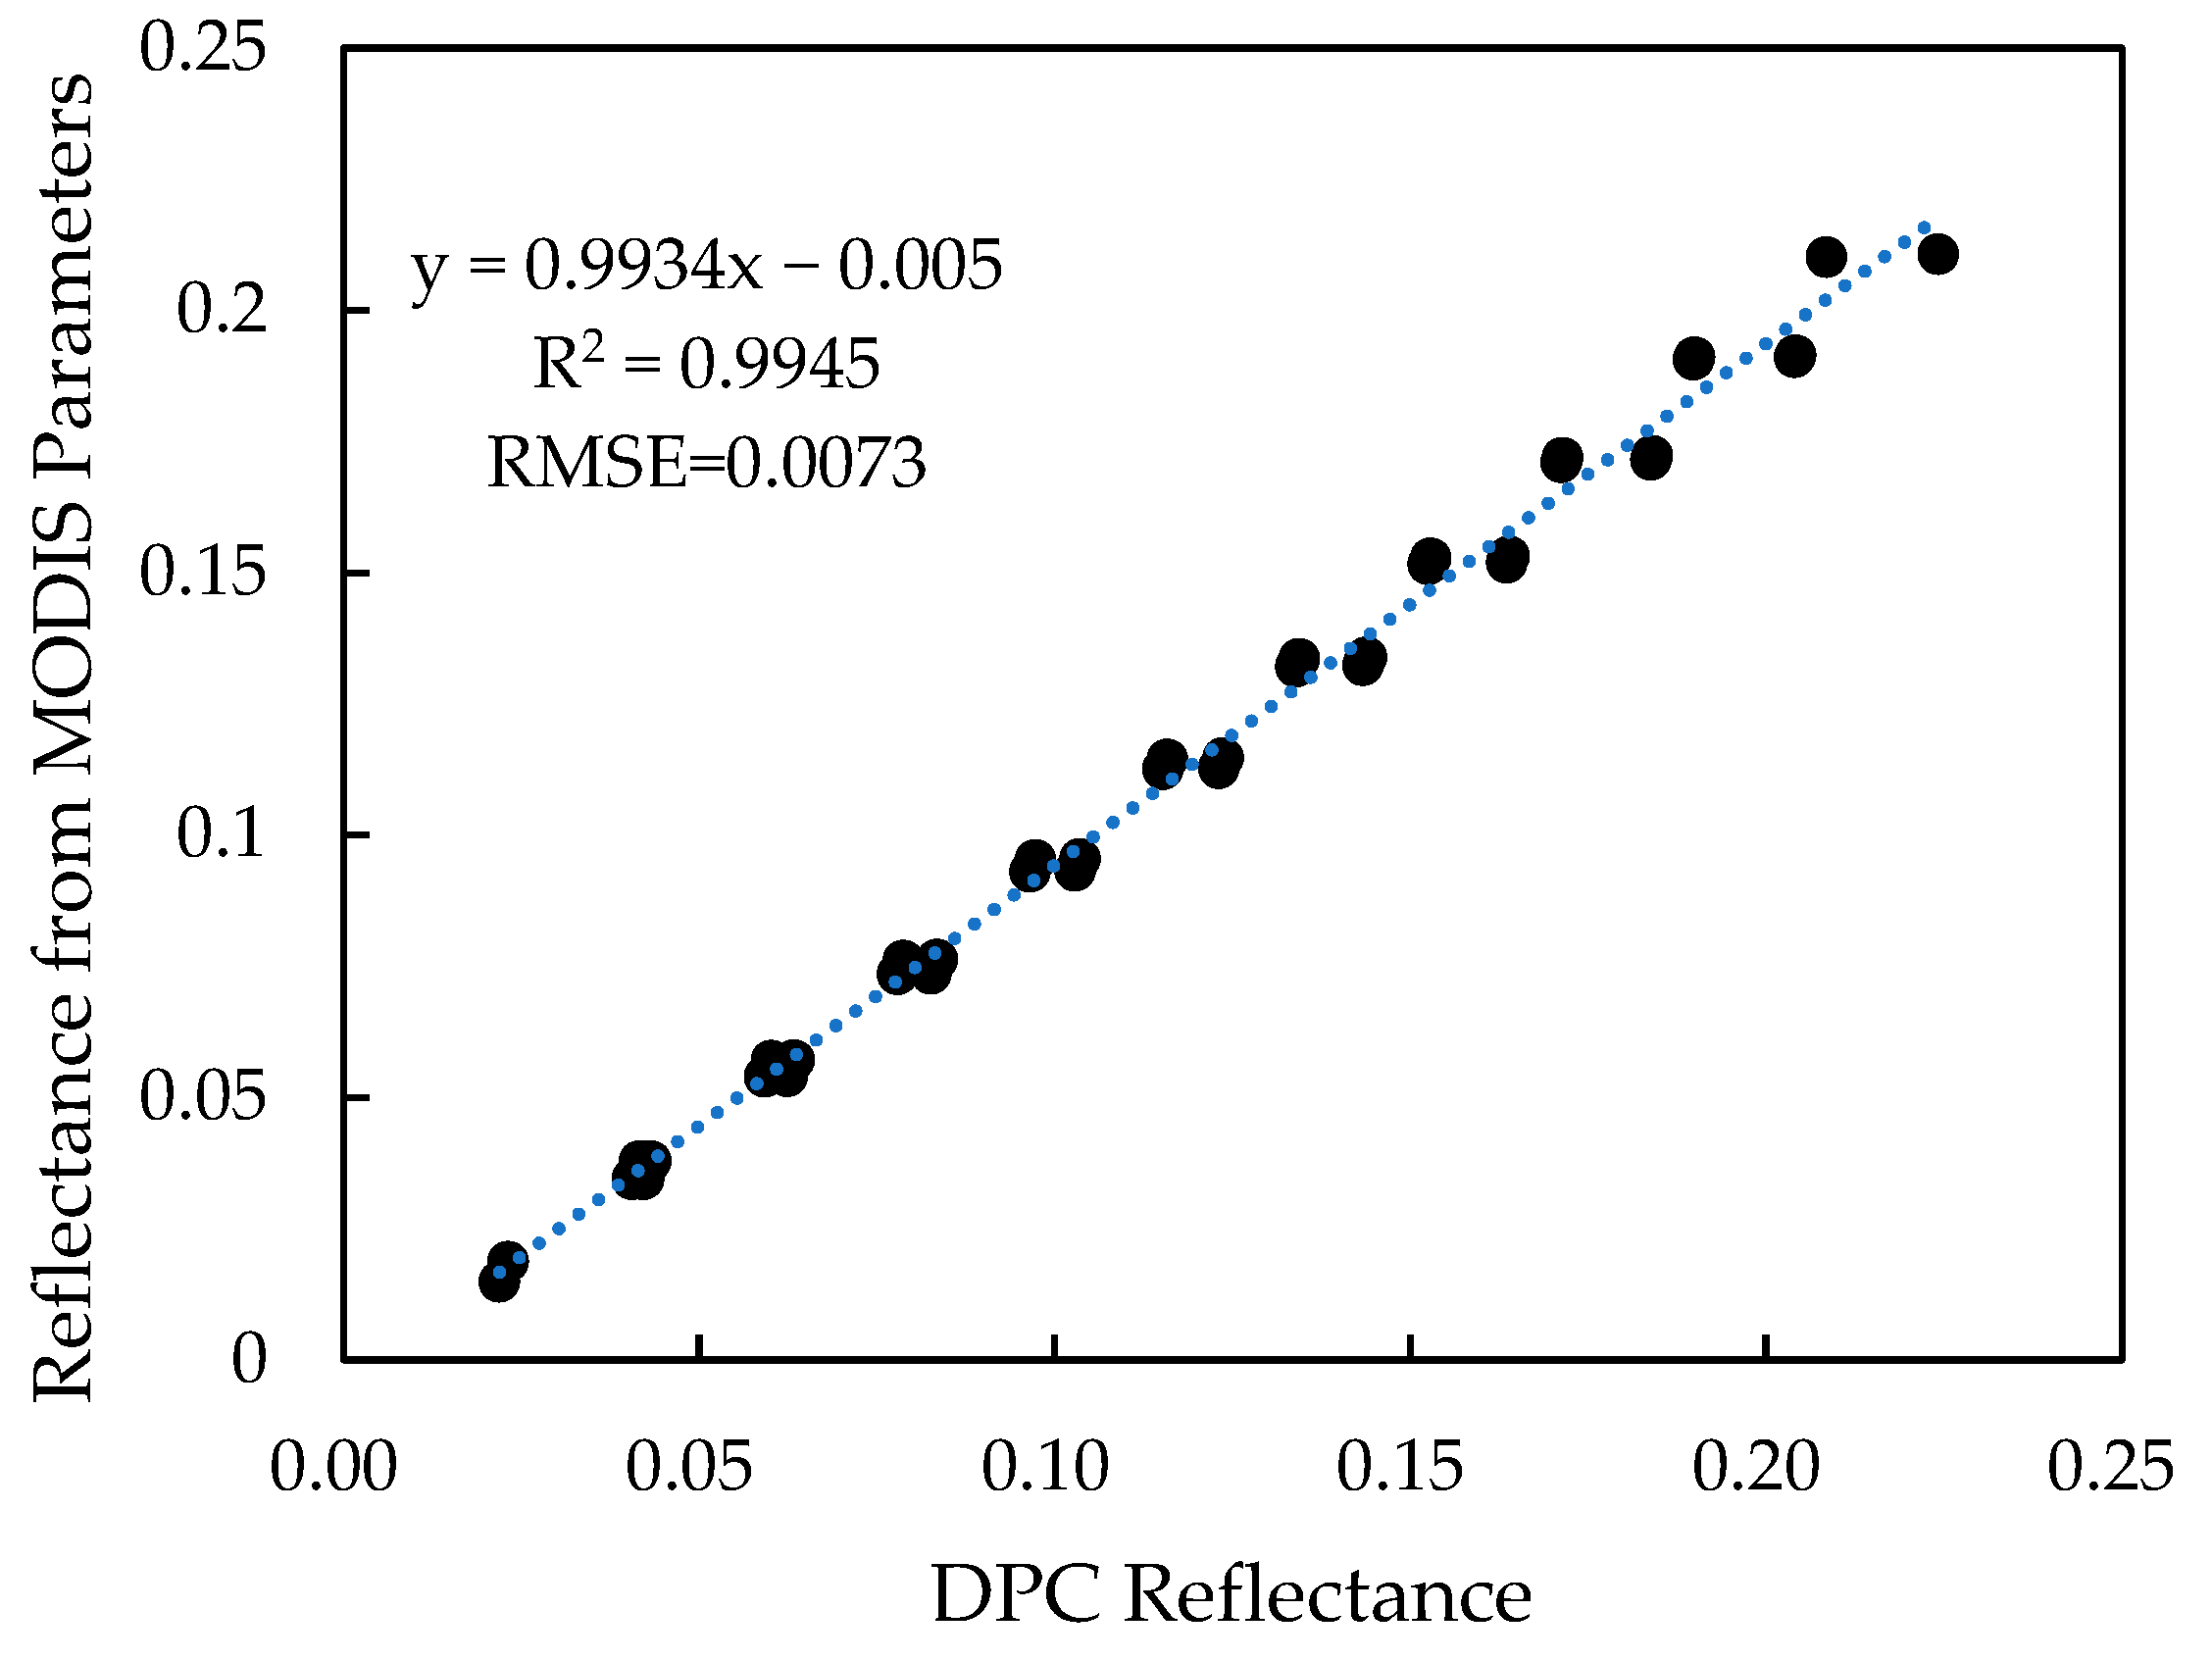
Next, the DPC and MODIS reflectance data, mixed with vegetation and soil spectra, were used to calculate the parameters a and b (Figure 15). The parameters derived from the MODIS SRF were similar to those obtained from the DPC SRF. This similarity arises because the increase in the central wavelength of the blue and red bands partially offsets the impact on the fitting process. Figure 16 shows the comparison between the DPC reflectance and the reflectance calculated using the MODIS parameters. The reflectance error resulting from the different SRFs was approximately 0.0073, which could lead to an AOD error of about 0.1 [1]. To receive more accurate AOD, parameters a and b will be obtained from DPC in the future.
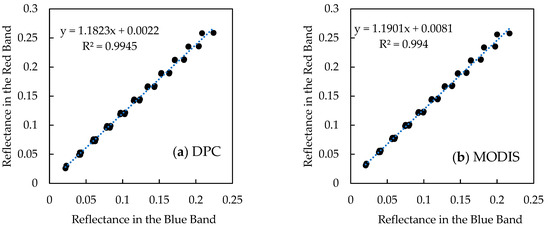
Figure 15.
Linear fitting of mixed pixels between the blue and red bands. The left (a) is DPC, and the right (b) is MODIS. The black dots are the reflectance data, and the blue dashed line is the regression.
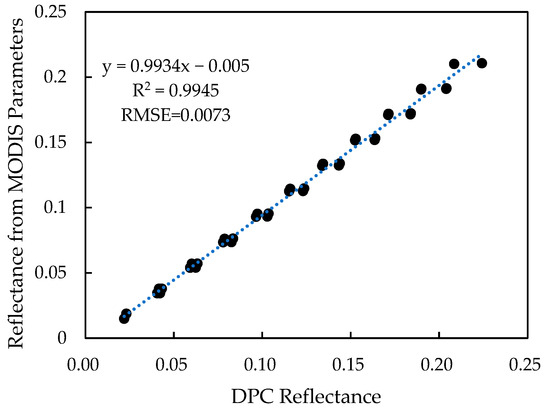
Figure 16.
The comparison between DPC reflectance and calculated reflectance from the MODIS parameters. The black dots are the reflectance data, and the blue dashed line is the regression.
6.3. The Variance Threshold
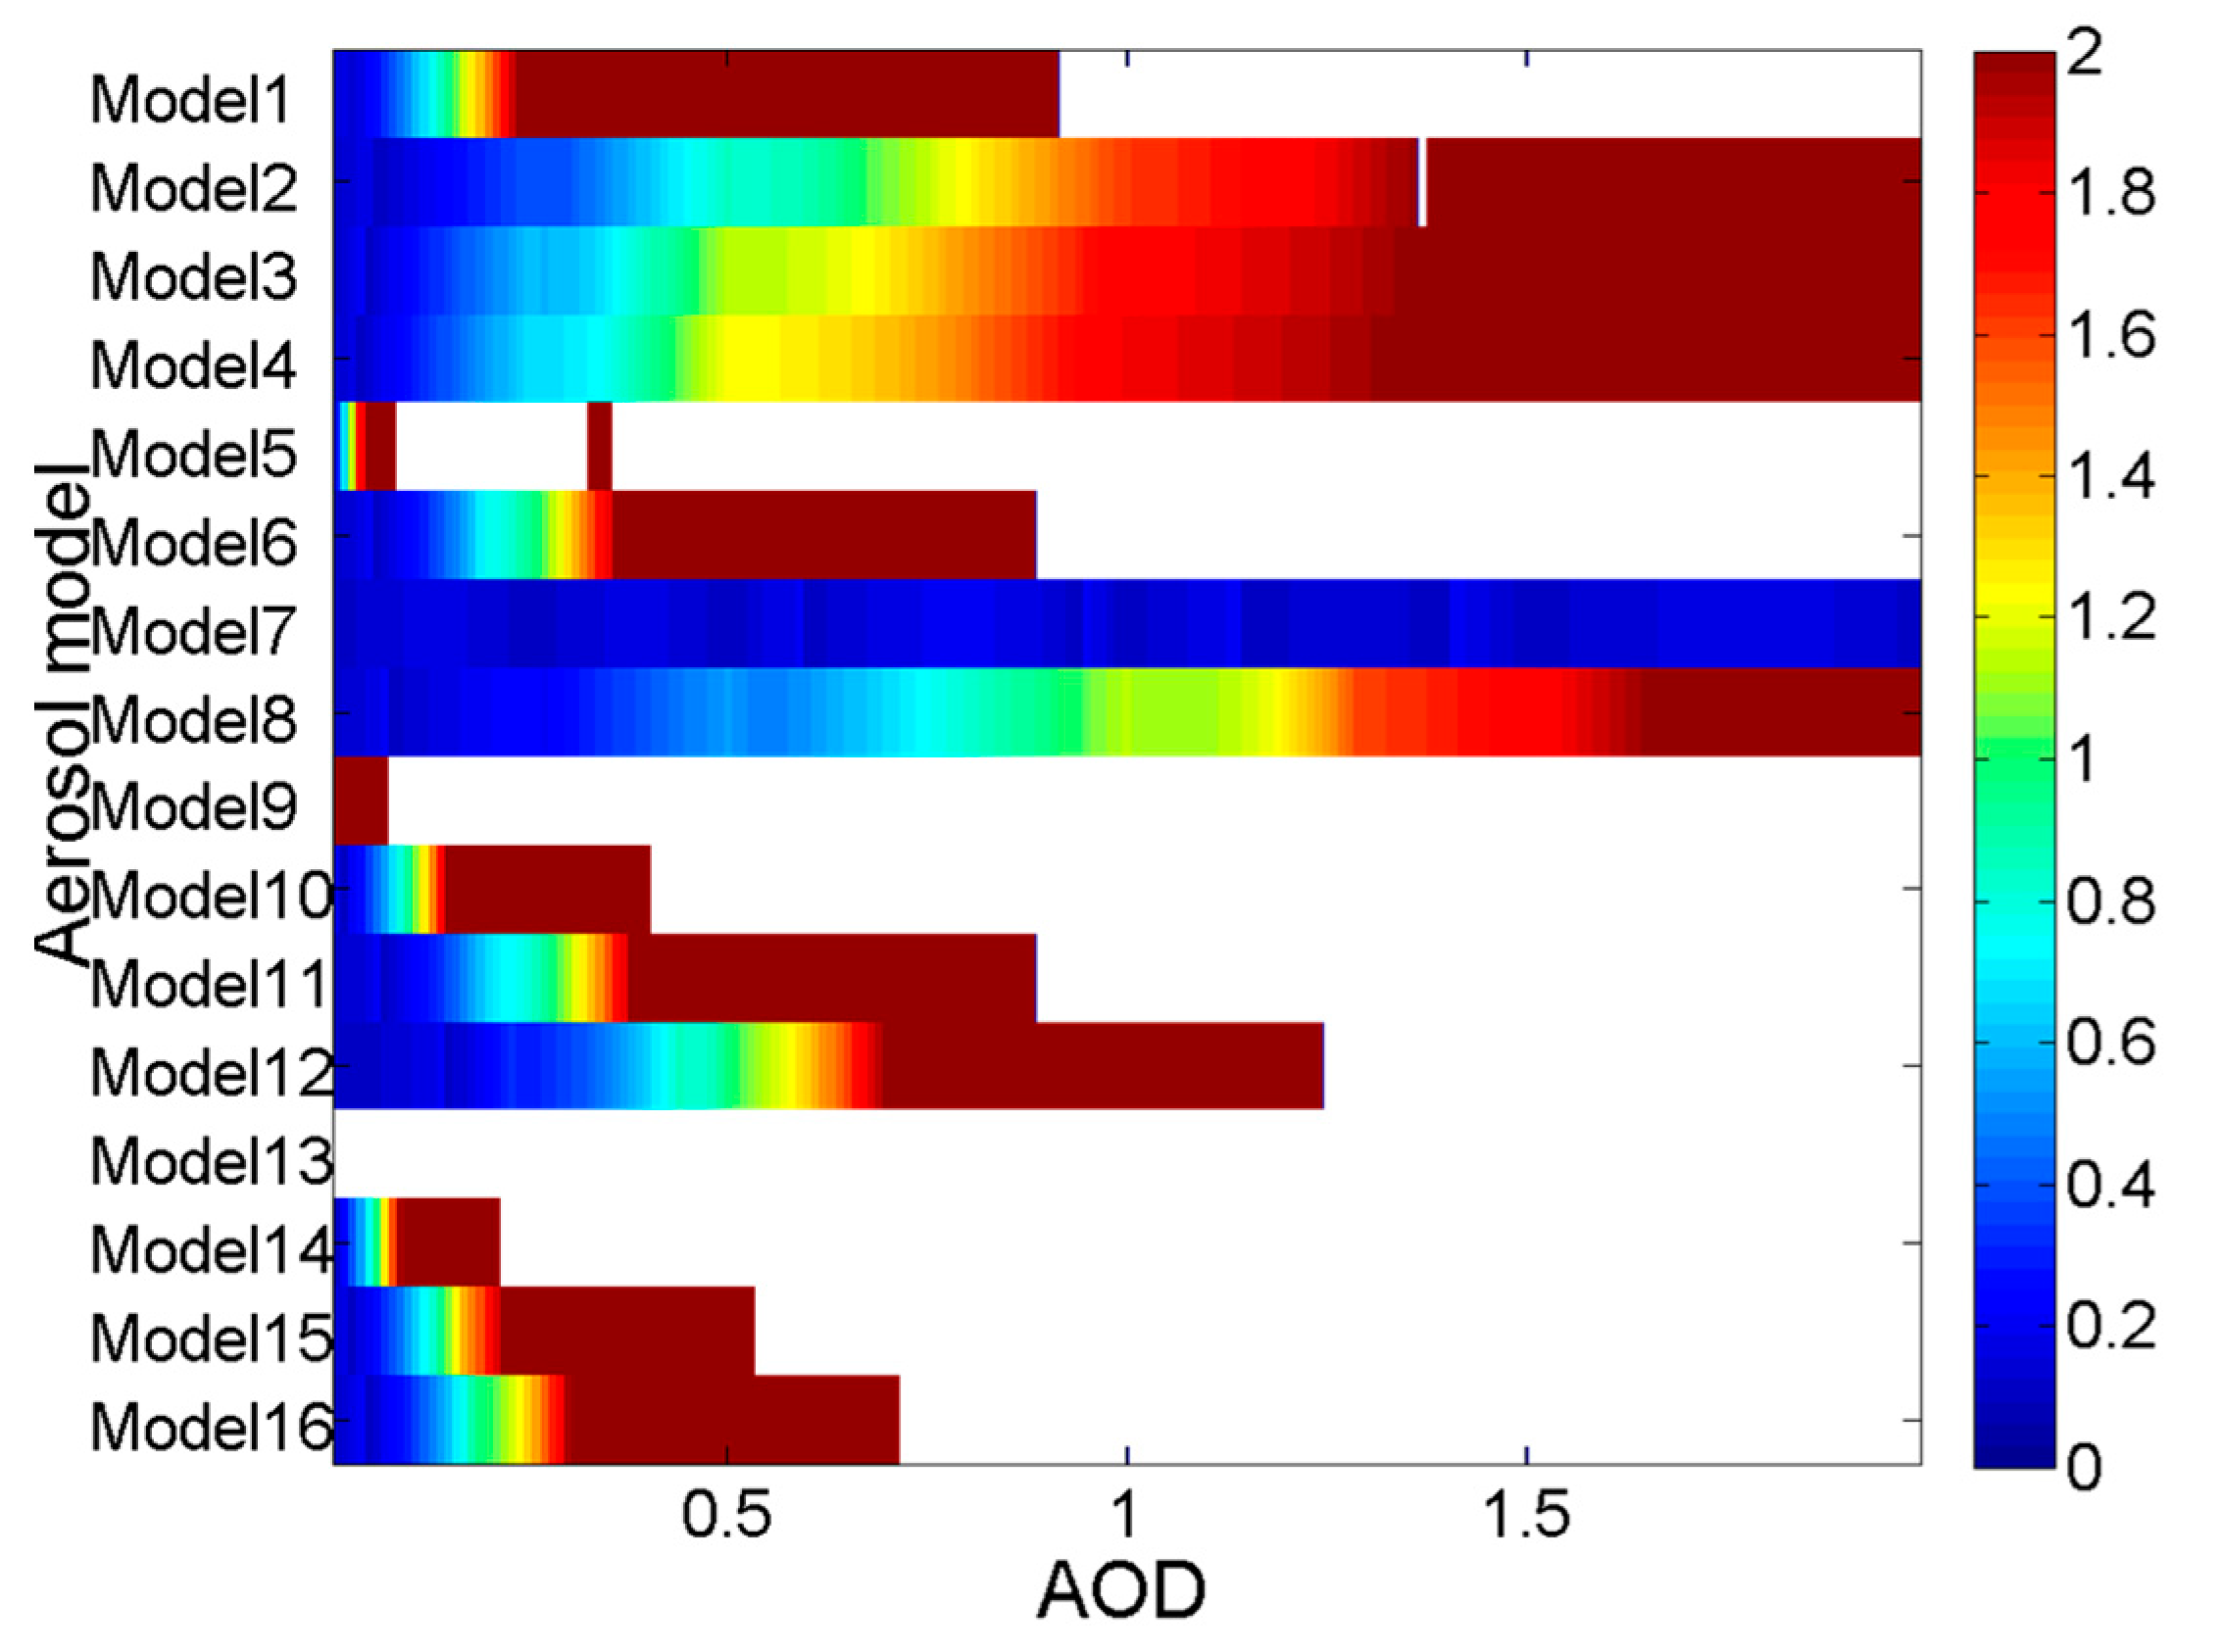
In our method, the variance threshold was determined through retrieval simulations. During the simulation phase, apparent reflectance values for 17 viewing angles under Model 7 were generated with a solar zenith angle of 63°. As demonstrated in Figure 17, Model 7 exhibited variances consistently below 1, whereas other models predominantly showed variances exceeding 2. This systematic comparison established the optimal threshold at 2.0. Notably, under low aerosol optical depth (AOD < 1.0) conditions, Models 2–4 and 8 displayed variances below this threshold, revealing our method limitations. Future enhancements will specifically address performance optimization at low AOD.

Figure 17.
The simulated variances of 16 aerosol models at different AOD. The blank represents the retrieval failure. The apparent reflectance was simulated at Model 7 when sun zenith angle was 63°.
7. Conclusions
Focused on the JJJ region, this study introduces a terrestrial aerosol inversion framework leveraging DPC multi-angle observational data. The key breakthroughs and comparative advantages include the following: (1) novel hybrid methodology, in which we pioneer a synergistic algorithm integrating DDV theory with multi-angle analysis, establishing a new paradigm for aerosol retrieval that overcomes limitations of single-method systems; (2) good practical performance, in which, when implemented in the JJJ region, our method achieves exceptional consistency (R > 0.9) with the benchmark GRASP algorithm while requiring 30% less computational resources, demonstrating enhanced operational efficiency.
This next-generation inversion framework not only enables high-precision AOD monitoring at low AOD but also offers three strategic advantages: (1) adaptability to polarized data integration; (2) built-in calibration optimization pathways for error reduction; (3) simultaneous retrieval of the proportion of the aerosol components. These distinctive features will apply to our method for future atmospheric sensing advancements. Meanwhile, our method will be validated in more regions and over a longer time span.
Author Contributions
All authors made significant contributions to the work. Conceptualization and methodology, Z.W.; validation, C.C.; data processing, S.J. and H.C.; writing—original draft preparation, H.L. and S.Z.; writing—review and editing, C.Z., R.Z. and Z.L. All authors have read and agreed to the published version of the manuscript.
Funding
This research was supported by the National Natural Science Foundation of China (Grant No. 41971324), the China Postdoctoral Science Foundation (Grant No. 2024M763063), and China Scholarship Council.
Data Availability Statement
The original contributions presented in the study are included in the article, further inquiries can be directed to the corresponding author.
Acknowledgments
We thank Zhengqiang Li and their staff for establishing and maintaining the Beijing-RADI sites used in this investigation, Vermote E. for 6S Vector 1.1 code, and LAADS DAAC for MODIS MOD09 and aerosol product. We thank Oleg Dubovik and Pavel Litvinov for their suggestions that helped improve the manuscript. We thank the editor and reviewers for their contributions to the paper.
Conflicts of Interest
The authors declare no conflicts of interest.
References
- Kaufman, Y.J.; Tanré, D.; Remer, L.A.; Vermote, E.F.; Chu, A.; Holben, B.N. Operational remote sensing of tropospheric aerosol over land from EOS moderate resolution imaging spectroradiometer. J. Geophys. Res. 1997, 102, 17051–17067. [Google Scholar] [CrossRef]
- Levy, R.C.; Remer, L.A.; Mattoo, S.; Vermote, E.F.; Kaufman, Y.J. Second-generation operational algorithm: Retrieval of aerosol properties over land from inversion of Moderate Resolution Imaging Spectroradiometer spectral reflectance. J. Geophys. Res. D Atmos. 2007, 112, D13211. [Google Scholar] [CrossRef]
- Li, Y.J.; Xue, Y.; de Leeuw, G.; Li, C.; Yang, L.K.; Hou, T.T.; Marir, F. Retrieval of aerosol optical depth and surface reflectance over land from NOAA AVHRR data. Remote Sens. Environ. 2013, 133, 1–20. [Google Scholar] [CrossRef]
- Mei, L.L.; Rozanov, V.; Vountas, M.; Burrows, J.P.; Levy, R.C.; Lotz, W. Retrieval of aerosol optical properties using MERIS observations: Algorithm and some first result. Remote Sens. Environ. 2017, 197, 125–140. [Google Scholar] [CrossRef]
- Xue, Y.; He, X.W.; de Leeuw, G.; Mei, L.L.; Che, Y.H.; Rippin, W.; Guang, J.; Hu, Y.C. Long-time series aerosol optical depth retrieval from AVHRR data over land in North China and Central Europe. Remote Sens. Environ. 2017, 198, 471–489. [Google Scholar] [CrossRef]
- Wang, Z.T.; Ma, P.F.; Chen, H.; Zhang, Y.H.; Zhang, L.J.; Li, S.S.; Li, Q.; Chen, L.F. Aerosol retrieval in the autumn and winter from the red and 2.12 μm bands of MODIS. Trans. Geosci. Remote Sens. 2019, 57, 2372–2380. [Google Scholar] [CrossRef]
- Sun, L.; Sun, C.; Liu, Q.; Zhong, B. Aerosol optical depth retrieval by HJ-1/CCD supported by MODIS surface reflectance data. Sci. China Earth Sci. 2010, 53, 74–80. [Google Scholar] [CrossRef]
- Bao, F.W.; Gu, X.F.; Cheng, T.H.; Wang, Y.; Guo, H.; Chen, H.; Wei, X.; Xiang, K.S.; Li, Y.N. High-Spatial-Resolution Aerosol Optical Properties Retrieval Algorithm Using Chinese High-Resolution Earth Observation Satellite I. IEEE Trans. Geosci. Remote Sens. 2016, 54, 5544–5552. [Google Scholar] [CrossRef]
- Ge, B.Y.; Li, Z.Q.; Liu, L.; Yang, L.K.; Chen, X.F.; Hou, W.Z.; Zhang, Y.; Li, Q.H.; Li, L.; Qie, L.L. A Dark Target Method for Himawari-8/AHI Aerosol Retrieval: Application and Validation. IEEE Trans. Geosci. Remote Sens. 2019, 57, 381–394. [Google Scholar] [CrossRef]
- Jackson, J.M.; Liu, H.; Laszlo, I.; Kondragunta, S.; Remer, L.A.; Huang, J.; Huang, H.C. Suomi-NPP VIIRS aerosol algorithms and data products. J. Geophys. Res. Atmos. 2013, 118, 12673–12689. [Google Scholar] [CrossRef]
- Jin, S.K.; Zhang, M.; Ma, Y.; Gong, W.; Chen, C.; Yang, L.; Hu, X.; Liu, B.; Chen, N.; Du, B.; et al. Adapting the Dark Target Algorithm to Advanced MERSI Sensor on the FengYun-3-D Satellite: Retrieval and Validation of Aerosol Optical Depth Over Land. IEEE Trans. Geosci. Remote Sens. 2021, 59, 8781–8797. [Google Scholar] [CrossRef]
- Hsu, N.; Jeong, M.J.; Bettenhausen, C.; Sayer, A.M.; Hansell, R.; Seftor, C.S.; Huang, J.; Tsay, S.C. Enhanced deep blue aerosol retrieval algorithm: The second generation. J. Geophys. Res. Atmos. 2013, 118, 9296–9315. [Google Scholar] [CrossRef]
- Hsu, N.C.; Lee, J.; Sayer, A.M.; Carletta, N.; Chen, S.H.; Tucker, C.J.; Holben, B.N.; Tsay, S.C. Retrieving near-global aerosol loading over land and ocean from AVHRR. J. Geophys. Res. Atmos. 2017, 122, 9968–9989. [Google Scholar] [CrossRef]
- Mishra, M.K. Retrieval of Aerosol Optical Depth from INSAT-3D Imager over Asian Landmass and Adjoining Ocean: Retrieval Uncertainty and Validation. J. Geophys. Res. Atmos. 2018, 123, 5484–5508. [Google Scholar] [CrossRef]
- Sun, K.; Chen, X.L.; Zhu, Z.M.; Zhang, T.H. High Resolution Aerosol Optical Depth Retrieval Using Gaofen-1 WFV Camera Data. Remote Sens. 2017, 9, 89–107. [Google Scholar] [CrossRef]
- Lyapustin, A.; Martonchik, J.; Wang, Y.; Laszlo, I.; Korkin, S. Multi-Angle Implementation of Atmospheric Correction (MAIAC): Part 1. Radiative Transfer Basis and Look-Up Tables. J. Geophys. Res. 2011, 116, D03210. [Google Scholar] [CrossRef]
- Diner, D.J.; Martonchik, J.V.; Kahn, R.; Pinty, B.; Gobron, N.; Nelson, D.L.; Holben, B.N. Using Angular and Spectral Shape Similarity Constraints to Improve MISR Aerosol and Surface Retrievals over Land. Remote Sens. Environ. 2005, 94, 155–171. [Google Scholar] [CrossRef]
- Wang, Y.Q.; Jiang, X.; Yu, B.; Jiang, M. A Hierarchical Bayesian Approach for Aerosol Retrieval Using MISR Data. J. Am. Stat. Assoc. 2013, 108, 483–493. [Google Scholar] [CrossRef]
- Shi, S.Y.; Cheng, T.H.; Gu, X.F.; Chen, H.; Guo, H.; Wang, Y.; Bao, F.W.; Xu, B.; Wang, W.N.; Zuo, X.; et al. Synergy of MODIS and AATSR for better retrieval of aerosol optical depth and land surface directional reflectance. Remote Sens. Environ. 2017, 195, 130–141. [Google Scholar] [CrossRef]
- Veefkind, J.P.; de Leeuw, G.; Durkee, P. Retrieval of aerosol optical depth over land using two-angle view satellite radiometry during TARFOX. Geophys. Res. Lett. 1998, 25, 3135–3138. [Google Scholar] [CrossRef]
- Herman, M.; Deuzé, J.L.; Devaux, C.; Goloub, P.; Bréon, F.M.; Tanré, D. Remote sensing of aerosols over land surfaces including polarization measurements and application to POLDER measurements. J. Geophys. Res. 1997, 102, 17039–17049. [Google Scholar] [CrossRef]
- Deuzé, J.L.; Bréon, F.M.; Devaux, C.; Goloub, P.H.; Herman, M.; Lafrance, B.; Maignan, F.; Marchand, A.; Nadal, F.; Perry, G.; et al. Remote sensing of aerosols over land surfaces from POLDER-ADEOS 1 polarized measurements. J. Geophys. Res. 2001, 106, 4913–4926. [Google Scholar] [CrossRef]
- Russell, P.B.; Kacenelenbogen, M.; Livingston, J.M.; Hasekamp, O.P.; Burton, S.P.; Schuster, G.L.; Johnson, M.S.; Knobelspiesse, K.D.; Redemann, J.; Ramachandran, S.; et al. A multiparameter aerosol classification method and its application to retrievals from spaceborne polarimetry. J. Geophys. Res. Atmos. 2014, 119, 9838–9863. [Google Scholar] [CrossRef]
- Fu, G.; Hasekamp, O. Retrieval of aerosol microphysical and optical properties over land using a multimode approach. Atmos. Meas. Tech. 2018, 11, 6627–6650. [Google Scholar] [CrossRef]
- Dubovik, O.; Herman, M.; Holdak, A.; Lapyonok, T.; Tanré, D.; Deuzé, J.L.; Ducos, F.; Sinyuk, A.; Lopatin, A. Statistically optimized inversion algorithm for enhanced retrieval of aerosol properties from spectral multi-angle polarimetric satellite observations. Atmos. Meas. Tech. 2011, 4, 975–1018. [Google Scholar] [CrossRef]
- Ou, Y.; Li, L.; Li, Z.; Zhang, Y.; Dubovik, O.; Derimian, Y.; Chen, C.; Fuertes, D.; Xie, Y.; Lopatin, A.; et al. Spatio-Temporal Variability of Aerosol Components, Their Optical and Microphysical Properties over North China during Winter Haze in 2012, as Derived from POLDER/PARASOL Satellite Observations. Remote Sens. 2021, 13, 22. [Google Scholar] [CrossRef]
- Li, L.; Dubovik, O.; Derimian, Y.; Schuster, G.L.; Lapyonok, T.; Litvinov, P.; Ducos, F.; Fuertes, D.; Chen, C.; Li, Z.; et al. Retrieval of aerosol components directly from satellite and ground-based measurements. Atmos. Chem. Phys. 2019, 19, 13409–13443. [Google Scholar] [CrossRef]
- Chen, C.; Dubovik, O.; Fuertes, D.; Litvinov, P.; Lapyonok, T.; Lopatin, A.; Ducos, F.; Derimian, Y.; Herman, M.; Tanré, D.; et al. Validation of GRASP algorithm product from POLDER/PARASOL data and assessment of multi-angular polarimetry potential for aerosol monitoring. Earth Syst. Sci. Data 2020, 12, 3573–3620. [Google Scholar] [CrossRef]
- Di Noia, A.; Hasekamp, O.P.; Wu, L.; van Diedenhoven, B.; Cairns, B.; Yorks, J.E. Combined neural network/Phillips–Tikhonov approach to aerosol retrievals over land from the NASA research scanning polarimeter. Atmos. Meas. Techn. 2017, 10, 4235–4252. [Google Scholar] [CrossRef]
- Chen, X.; Wang, J.; Gomes, J.; Dubovik, O.; Yang, P.; Saito, M. Analytical prediction of scattering properties of spheroidal dust particles with machine learning. Geophys. Res. Lett. 2022, 49, 49. [Google Scholar] [CrossRef]
- Kang, Y.; Kim, M.; Kang, E.; Cho, D.; Im, J. Improved retrievals of aerosol optical depth and fine mode fraction from GOCI geostationary satellite data using machine learning over East Asia. ISPRS J. Photogramm. Remote Sens. 2022, 183, 253–268. [Google Scholar] [CrossRef]
- Tao, M.; Chen, J.; Xu, X.; Man, W.; Xu, L.; Wang, L.; Chen, L.; Wang, Y.; Wang, J.; Fan, M.; et al. A robust and flexible satellite aerosol retrieval algorithm for multi-angle polarimetric measurements with physics-informed deep learning method. Remote Sens. Environ. 2023, 297, 113763. [Google Scholar] [CrossRef]
- Li, Z.; Hou, W.; Hong, J.; Zheng, F.; Luo, D.; Wang, J.; Gu, X.; Qiao, Y. Directional Polarimetric Camera (DPC): Monitoring aerosol spectral optical properties over land from satellite observation. J. Quant. Spectrosc. Radiat. Transf. 2018, 218, 21–37. [Google Scholar] [CrossRef]
- Huang, H.-L.; Ti, R.-F.; Zhang, D.-Y.; Fang, W.; Sun, X.-B.; Yi, W.-N. Inversion of aerosol optical depth over land from directional polarimetric camera onboard Chinese Gaofen-5 satellite. J. Infrared Millim. Waves 2020, 39, 454–461. [Google Scholar]
- Ge, B.Y.; Li, Z.; Chen, C.; Hou, W.; Xie, Y.; Zhu, S.; Qie, L.; Zhang, Y.; Li, K.; Xu, H.; et al. An Improved Aerosol Optical Depth Retrieval Algorithm for Multiangle Directional Polarimetric Camera (DPC). Remote Sens. 2022, 14, 25. [Google Scholar] [CrossRef]
- Fang, L.; Hasekamp, O.; Fu, G.; Gong, W.; Wang, S.; Wang, W.; Han, Q.; Tang, S. Retrieval of Aerosol Optical Properties over Land Using an Optimized Retrieval Algorithm Based on the Directional Polarimetric Camera. Remote Sens. 2022, 14, 20. [Google Scholar] [CrossRef]
- Jin, S.K.; Ma, Y.; Chen, C.; Dubovik, O.; Hong, J.; Liu, B.; Gong, W. Performance evaluation for retrieving aerosol optical depth from the Directional Polarimetric Camera (DPC) based on the GRASP algorithm. Atmos. Meas. Tech. 2022, 15, 4323–4337. [Google Scholar] [CrossRef]
- Li, L.; Che, H.; Zhang, X.; Chen, C.; Chen, X.; Gui, K.; Liang, Y.; Wang, F.; Derimian, Y.; Fuertes, D.; et al. A satellite-measured view of aerosol component content and optical property in a haze-polluted case over North China Plain. Atmos. Res. 2022, 266, 11. [Google Scholar] [CrossRef]
- Zhang, R.; Zhou, W.; Chen, H.; Zhang, L.; Zhang, L.; Ma, P.; Zhao, S.; Wang, Z. Aerosol Information Retrieval from GF-5B DPC Data over North China Using the Dark Dense Vegetation Algorithm. Atmosphere 2023, 14, 241. [Google Scholar] [CrossRef]
- Vermote, E.; Tanre, D.; Deuzé, J.L.; Herman, M.; Morcrette, J.J. Second simulation of the satellite signal in the solar spectrum: An overview. IEEE Trans. Geosci. Remote Sens. 1997, 35, 675–686. [Google Scholar] [CrossRef]
- Zhang, Y.M.; Chen, H.; Wang, Z.T. Terrestrial aerosol retrieval over Beijing from Chinese GF-1 data based on the blue/red correlation. Remote Sens. Lett. 2021, 12, 219–228. [Google Scholar] [CrossRef]
- Kotchenova, S.Y.; Vermote, E.F.; Matarrese, R.; Klemm, F.J., Jr. Validation of a Vector Version of the 6S Radiative Transfer Code for Atmospheric Correction of Satellite Data. Part I: Path radiance. Appl. Opt. 2006, 45, 6762–6774. [Google Scholar] [CrossRef] [PubMed]
- Wei, P.; Li, Z.Q.; Wang, Y.; Xie, Y.S.; Zhang, Y.; Xu, H. Remote sensing estimation of aerosol composition and radiative effects in haze days. J. Remote Sens. 2013, 17, 1021–1031. [Google Scholar]
- Levy, R.C.; Munchak, L.A.; Mattoo, S.; Patadia, F.; Remer, L.A.; Holz, R.E. Towards a long-term global aerosol optical depth record: Applying a consistent aerosol retrieval algorithm to MODIS and VIIRS-observed reflectance. Atmos. Meas. Tech. 2015, 8, 4083–4110. [Google Scholar] [CrossRef]
- Sayer, A.M.; Munchak, L.A.; Hsu, N.C.; Levy, R.C.; Bettenhausen, C.; Jeong, M.-J. MODIS Collection 6 aerosol products: Comparison between Aqua’s e-Deep Blue, Dark Target, and “merged” data sets, and usage recommendations. J. Geophys. Res. Atmos. 2014, 119, 13965–13989. [Google Scholar] [CrossRef]
- Levy, R.C.; Mattoo, S.; Munchak, L.A.; Remer, L.A.; Sayer, A.M.; Patadia, F.; Hsu, N.C. The Collection 6 MODIS aerosol products over land and ocean. Atmos. Meas. Tech. 2013, 6, 2989–3034. [Google Scholar] [CrossRef]
- Sayer, A.M.; Hsu, N.C.; Bettenhausen, C.; Jeong, M.-J.; Meister, G. Effect of MODIS Terra radiometric calibration improvements on Collection 6 Deep Blue aerosol products: Validation and Terra/Aqua consistency. J. Geophys. Res. Atmos. 2015, 120, 12157–12174. [Google Scholar] [CrossRef]
- Dubovik, O.; Fuertes, D.; Litvinov, P.; Lopatin, A.; Lapyonok, T.; Doubovik, I.; Xu, F.; Ducos, F.; Chen, C.; Torres, B.; et al. A Comprehensive Description of Multi-Term LSM for Applying Multiple a Priori Constraints in Problems of Atmospheric Remote Sensing: GRASP Algorithm, Concept, and Applications. Front. Remote Sens. 2021, 2, 706851. [Google Scholar] [CrossRef]
- Angstrom, A. The parameters of atmospheric turbidity. Tellus 1964, 16, 64–75. [Google Scholar] [CrossRef]
- Zhu, S.; Li, Z.; Qie, L.; Xu, H.; Ge, B.; Xie, Y.; Qiao, R.; Xie, Y.; Hong, J.; Meng, B.; et al. In-Flight Relative Radiometric Calibration of a Wide Field of View Directional Polarimetric Camera Based on the Rayleigh Scattering over Ocean. Remote Sens. 2022, 14, 1211. [Google Scholar] [CrossRef]
- Lei, X.; Liu, Z.; Tao, F.; Dong, H.; Hou, W.; Xiang, G.; Qie, L.; Meng, B.; Li, C.; Chen, F.; et al. Data Comparison and Cross-Calibration between Level 1 Products of DPC and POSP Onboard the Chinese GaoFen-5(02) Satellite. Remote Sens. 2023, 15, 1933. [Google Scholar] [CrossRef]


Disclaimer/Publisher’s Note: The statements, opinions and data contained in all publications are solely those of the individual author(s) and contributor(s) and not of MDPI and/or the editor(s). MDPI and/or the editor(s) disclaim responsibility for any injury to people or property resulting from any ideas, methods, instructions or products referred to in the content. |
© 2025 by the authors. Licensee MDPI, Basel, Switzerland. This article is an open access article distributed under the terms and conditions of the Creative Commons Attribution (CC BY) license (https://creativecommons.org/licenses/by/4.0/).