Abstract
Azerbaijan is known as a hydrocarbon-rich region for its extensive mud volcanoes and complex tectonic settings. In this research, we analyzed a long-term InSAR time-series from Sentinel-1 SAR data spanning January 2017 to October 2024, which revealed the dynamics of active deformation and mud volcanoes. The study area, with its unique geological complexity characterized by rapid eruptions, subsurface pressure, and fault systems, is a one-of-a-kind natural laboratory for examining the interplay between tectonics and mud volcano activity. Based on extensive data collection, the results showed significant deformation on the primary mud volcanoes, such as Ayazakhtarma and Akhtarma-Pashaly. These patterns, characterized by observed subsidence and uplift, result from subsurface pressure fluctuations and hydrocarbon migration. Furthermore, the examination has demonstrated evidence of temporal deformation episodes intricately linked to the periodic buildup and release of subsurface pressures. A significant result of our study was the reactivation of faults and high deformation rate in almost all observed mud volcanoes during the February 2023 Türkiye Kahramanmaraş earthquakes (Mw 7.8 and 7.6). This dynamic far-field triggering effect reactivated faults and induced widespread deformation. This study indicates that the far-field triggering effect has uncovered deformation patterns that persist for several months after the earthquakes, reflecting prolonged subsurface adjustments. The findings demonstrate that mud volcanoes are subsurface fluid dynamics and tectonic stress indicators and have significant practical implications. Overall, the results provide important insights into the reaction of hydrocarbon-rich regions to seismic energy that can be directly applied to improve regional seismic hazard assessments and tectonic studies. By combining different geodetic data with geological interpretations, this work emphasizes the implication of monitoring hydrocarbon-rich regions like Azerbaijan to assess natural hazards and subsurface dynamics, making the research highly relevant and applicable.
1. Introduction
The Caucasus region, between the Arabian and Eurasian tectonic plates, is a geologically active zone known for its intense tectonic deformation, seismicity, and volcanism. As part of this region, Azerbaijan has a unique combination of tectonic and hydrocarbon-related phenomena. The country is famous for its numerous mud volcanoes, predominantly driven by subsurface hydrocarbon deposits. These mud volcanoes, which continually erupt, emitting methane gas and other hydrocarbons, are natural wonders and valuable indicators of the region’s geological processes. The underlying Maykop Series, a crucial hydrocarbon-bearing formation, exerts significant pressure on the region’s subsurface, leading to frequent mud volcano eruptions that are often triggered by external pressures such as tectonic movement [1]. Researchers are exploring the potential connections between the extensive mud volcanoes of the region and seismic activity [2,3].
The more than 300 mud volcanoes in Azerbaijan are part of a dynamic geological system driven by subsurface pressure, rapid sedimentation, and hydrocarbon migration, which contribute to their unique activity. The Oligo-Miocene Maykop Formation, as the primary source of mud breccia, is critical in fueling this dynamic activity in the region [4]. The combination of tectonic stress, subsurface pressure, and hydrocarbon migration forms a dynamic system where far-field seismic events, as powerful triggers, can significantly influence the system. This dynamic, especially in Azerbaijan, underscores the complex interplay of geological forces driving mud volcanism. Subsurface pressure, tectonic stress regimes, and hydrocarbon migration are part of the complex geological dynamics of mud volcanoes and contribute to their activity and morphological diversity.
The Caucasus region is well known for its complex tectonic activity, particularly the significant role of the Main Caucasus Thrust Fault (MCTF) in creating seismic hazards. The convergence of the Arabian Plate with the Eurasian Plate results in considerable deformation. The MCTF, one of the primary fault systems in the region, has varying slip rates, with the eastern portion near Azerbaijan exhibiting slip rates of up to 14.3 mm/year [5]. This fault system creates complex tectonic settings and high seismic possibilities. Current investigations using GPS data have confirmed that the region experiences significant deformation, highlighting the ongoing and dynamic nature of the tectonic processes [5,6,7]. A comprehensive interpretation of the tectonic settings is essential for evaluating seismic hazards and developing effective mitigation techniques. Integrating geodetic techniques, such as InSAR and GPS observations, helps us understand the deformation patterns of the region, strain accumulation, and seismic potential. Such datasets contribute to an in-depth understanding of the ongoing tectonic processes defining geodynamic behavior and associated risks.
Significant differences exist between flat and conical mud volcanoes, particularly their eruption dynamics and subsurface structures. The use of reliable research methods such as microgravity measurements and InSAR data has confirmed the presence of subsurface chambers and shallow mud bodies that act as reservoirs for eruptive activity [8]. These chambers, often located just meters below the surface for flat edifices and up to several hundred meters in-depth for conical ones, are distinguished by significant mass deficits and density differences indicative of pressurized mud fluids and hydrocarbon concentrations. The spatial correlation between the distribution of mud volcanoes and fault systems has long been acknowledged, indicating that fault activity may act as a necessary mechanism for controlling the rate of mud extrusion. The authors of [2,9] showed a statistically significant correlation between earthquakes and mud volcano eruptions in Azerbaijan. Their conclusions also indicate that seismic events do not instantly increase the prevalence of eruptions. Recent work by Ahadov and Kadirov [3] used the InSAR technique to examine the relationship between moderate earthquakes and mud volcano activity in Azerbaijan. Their conclusions indicated that moderate earthquakes cannot trigger mud volcano eruptions unless the volcano is already ready for eruption.
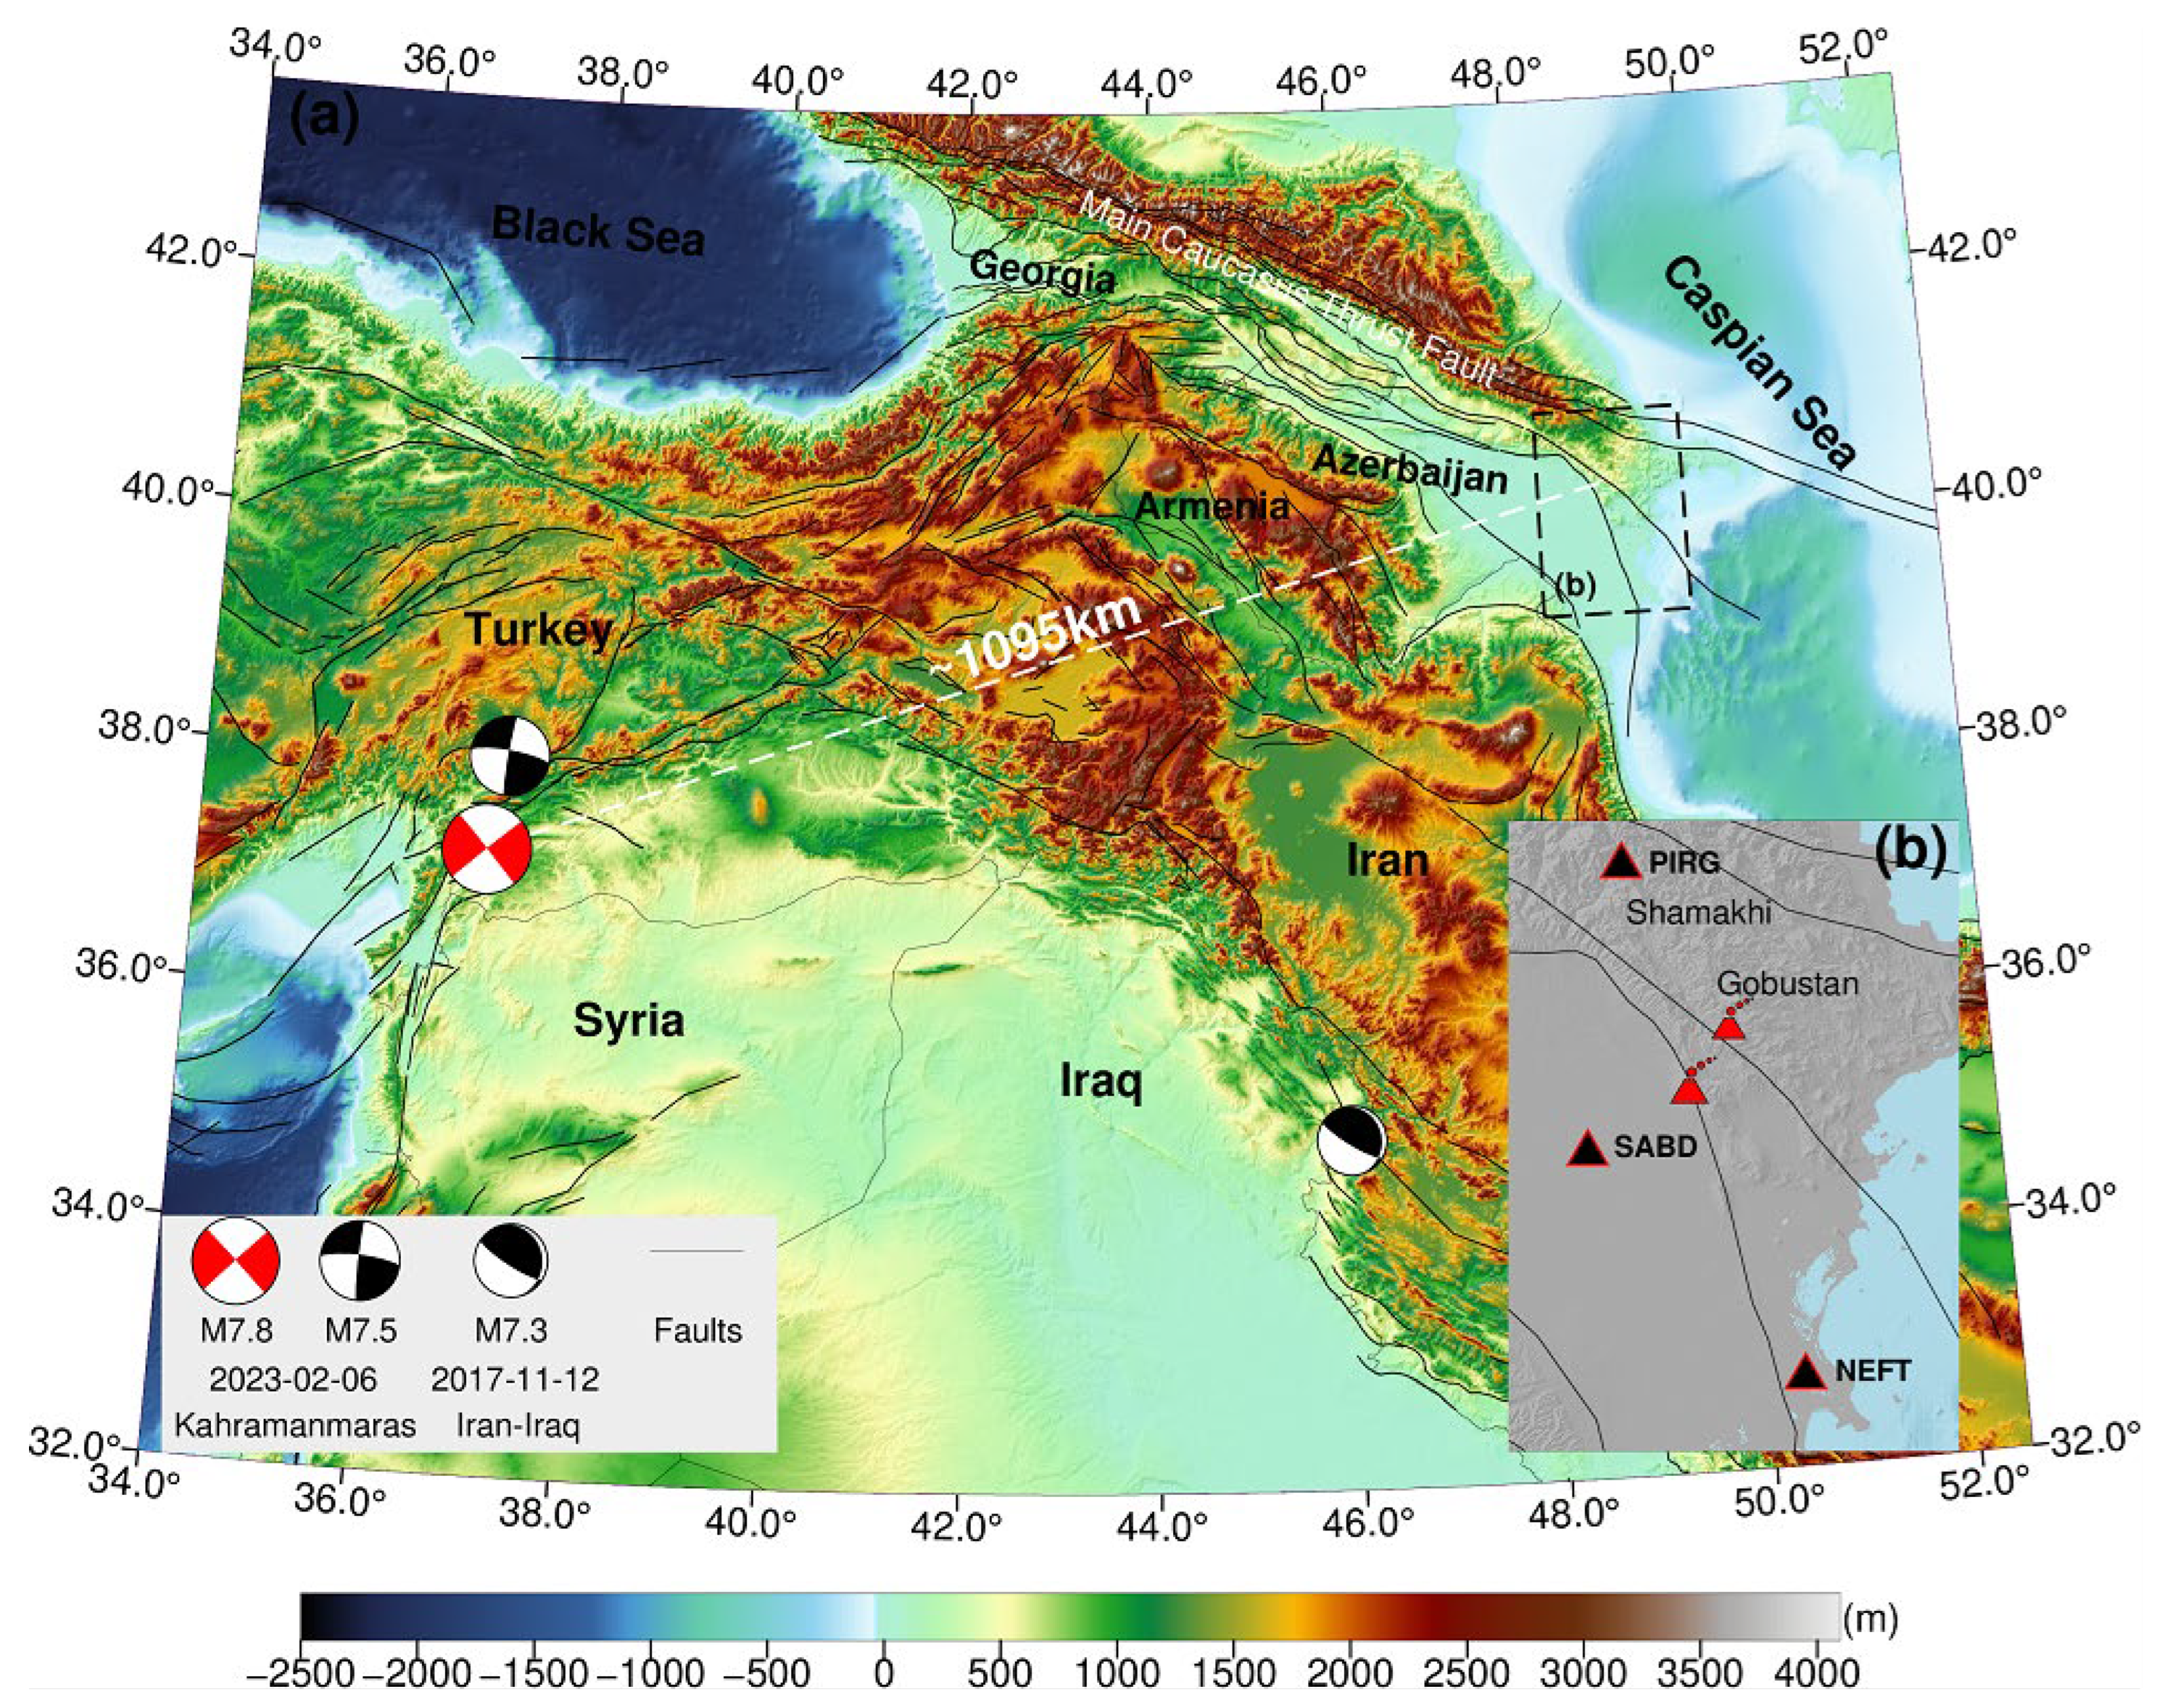
The research area under study (Figure 1) is highly sensitive to local and far-field seismic events, a sensitivity further complicated by its unique geology. As seismic waves pass through these fluid-saturated, high-pressure environments, they can trigger the subsurface, causing mud volcanoes to erupt or faults to slip. The Kahramanmaraş earthquakes provided crucial insights into these approaches and highlighted the importance of understanding far-field seismic impacts in tectonically active and hydrocarbon-rich regions. Fluids play a crucial role in the development of deformation processes, strongly influencing the nature of applied stresses and the strength characteristics of the environment. The close connection between fluid flows and tectonic processes highlights the importance of assessing them together as fundamental factors in the evolution of the lithosphere and geodynamics [10]. Studies on mud volcanism and tectonics highlight the broader role of geological processes in hydrocarbon-rich environments but do not address the specifics of far-field seismic impacts [9,11]. The recent investigation of the Kahramanmaraş earthquakes proved far-field crustal deformations exceeding 700 km, surpassing predictions from elastic dislocation models [12]. The February 2023 Kahramanmaraş earthquakes (Mw 7.8 and 7.6) provide a unique and significant example of regional seismic connectivity. These conclusions suggest that tectonic interactions and seismic hazards in Azerbaijan, which are sensitive to seismic energy, may demand review in light of such unexpected large-scale deformation.

Figure 1.
The map displays the region’s tectonic settings and recent deadly earthquakes (USGS). (a) The study area features the active and large mud volcanoes Akhtarma-Pashaly and Ayazakhtarma. (b) The rectangular inset shows the NEFT, SABD, and PIRG continuous GNSS station.
Our observations utilizing InSAR technology reveal that these earthquakes dynamically triggered fault and mud volcano activity about 1095 km away in Azerbaijan (Figure 1). This phenomenon of dynamic triggering, where seismic waves from a remote event induce fault slip and volcanic eruption, underscores the sensitivity of the geological environment to far-field seismic energy. Subsurface hydrocarbon pressure, connected with the tectonic structure, is mainly sensitive to seismic triggering. The area’s sensitivity for triggering effects highlights the high level of seismic vulnerability, where even far-field seismic events can prompt crustal deformation and mud volcano activity. A notable example of this is the relationship between the 1992 Landers earthquake (M 7.3) and the 1999 Hector Mine earthquake (M 7.1) in California. This relationship was discovered through detailed statistical analyses, which indicated that the Hector Mine earthquake was not directly caused by the Landers earthquake but was initiated by smaller foreshocks that were indirectly influenced by the Landers main shock [13]. This highlights the intricate relationships among main shocks, aftershocks, and stress redistribution in driving subsequent seismic events. Dynamic earthquake triggering occurs across near- and far-field regions, with overlapping but distinct mechanisms influencing each of them. In the near field, triggering is primarily driven by static stress changes, high-frequency dynamic stresses, or a high concentration of nucleation sites close to the main shock fault [14,15]. In contrast, far-field triggering is predominantly governed by minor dynamic strains, which can induce fault slip when the faults are already critically stressed but the static stress changes are minimal [16].
InSAR has become a powerful tool for monitoring and understanding active geological processes and capturing surface displacements at the millimeter level by comparing radar signal phase information at different times, enhancing its precision. This approach is invaluable when observing regions where deformation is driven by tectonic and volcanic activity and other geophysical processes. InSAR has been widely applied to measure the crustal deformation associated with seismic events, such as earthquakes and volcanic eruptions, and to monitor ground subsidence in areas with hydrocarbon or groundwater extraction [17,18,19].
2. Materials and Methods
This comprehensive examination utilized Copernicus Sentinel-1 Synthetic Aperture Radar (SAR) data to monitor crustal deformation and mud volcano activity in Azerbaijan. The SAR data, collected from ascending and descending tracks from January 2017 to October 2024, provide an extended multi-temporal and multi-directional analysis (Table 1). This time range was chosen to capture any pre-existing deformation trends and mud volcano eruptions and to observe possible shifts triggered by significant seismic events, such as the 2023 Kahramanmaraş earthquakes. The 12-day revisit cycle of Sentinel-1 data offers high-quality, frequent observations that are ideal for monitoring dynamic geological processes over a wide area in the research site.

Table 1.
Summary of Sentinel-1 data processing.
The broad approach is evident in the complementary views on line-of-sight (LOS) displacements from ascending and descending tracks, which enable a more precise definition of ground motions associated with tectonic activity, hydrocarbon-induced subsidence, and mud volcano eruptions in regions with complex deformation patterns.
For the processing of Sentinel-1 interferometric wide-swath SAR data, we used the InSAR Scientific Computing Environment (ISCE2) software, version 2.6.3, developed by the NASA Jet Propulsion Laboratory (JPL) in collaboration with the California Institute of Technology (Caltech), Pasadena. ISCE2 provided the necessary tools for interferometric SAR (InSAR) data processing, including stack coregistration, interferogram generation, and geocoding, facilitating the derivation of line-of-sight displacement maps essential for this study [20]. For multi-temporal analysis, we applied the Small Baseline Subset (SBAS) technique [21] using MintPy 1.6.1 (Miami INsar Time-series software in Python) [22]. MintPy enabled the selection and processing of interferometric pairs with small baselines, reducing temporal and spatial decorrelation and making it particularly effective for tracking slow-moving deformations over extended periods. The combined use of both ascending and descending tracks allowed for a comprehensive view of deformation patterns. The ISCE2 and MintPy software packages enabled the detection and quantification of ground displacements associated with crustal fault activity and mud volcano eruptions, which were dynamically triggered by the 2023 Kahramanmaraş earthquakes, highlighting the urgency and relevance of our study.
We applied atmospheric corrections using the European Center for Medium-range Weather Forecasting (ECMWF) weather reanalysis data (ERA5), which provided hourly calculations of atmospheric conditions, including water vapor, temperature, and pressure. This correction action decreased atmospheric phase delays for each interferogram, confirming that the observed displacement signals more accurately represent ground deformation rather than atmospheric artifacts [23]. The ISCE2 and MintPy software packages, with their advanced capabilities and ERA5 atmospheric and DEM corrections, played a crucial role in enabling the detection and quantification of ground displacements associated with crustal fault activity and mud volcano eruptions. Topographic effects were removed using the Shuttle Radar Topography Mission (SRTM) v003 one arc-second digital elevation model (DEM) [24]. The use of the SRTM DEM significantly enhanced the accuracy of the InSAR results, providing a more reliable understanding of deformation patterns across the study area.
3. Results
The 1992 M7.3 Landers earthquake in Southern California advanced the concept of dynamically triggered earthquakes and fault slips. Seismic activity was triggered at distances exceeding 1250 km from the epicenter [25]. It is worth noting that many of these triggered events occurred in areas with geothermal or volcanic activity [25]. Dynamic triggering was further validated in nonvolcanic settings, as seen in the 1999 M7.4 Izmit earthquake in Türkiye, which was associated with similar effects [26]. The observed dynamic triggering of seismic and volcanic activity in Azerbaijan aligns with findings from other studies on far-field earthquake impacts.
We performed a second analysis of the InSAR time-series to estimate the co-seismic step function at the time of the Kahramanmaraş earthquakes, in addition to the linear velocity [22], shown as wrapped phase maps from ascending and descending tracks in Figure 2 and Figure 3, respectively.
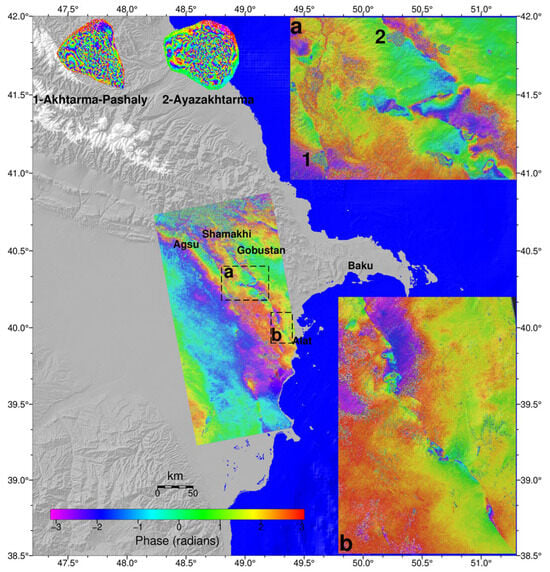
Figure 2.
These maps demonstrate the co-seismic phase change (wrapped) in the study region at the time of the 2023 Kahramanmaraş earthquakes from the ascending Sentinel-1 track. It is divided into (a,b), offering close-up views of the main active areas along the faults. Additionally, two major mud volcanoes, Ayazakhtarma and Akhtarma-Pashaly, are presented separately on the maps.
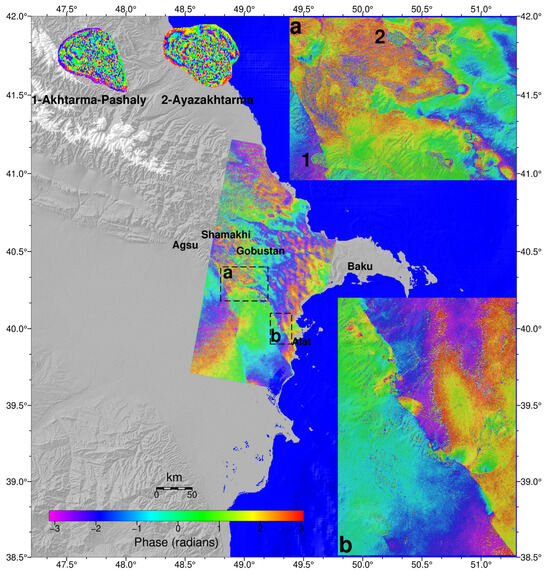
Figure 3.
These maps demonstrate the co-seismic phase change (wrapped) in the study region at the time of the 2023 Kahramanmaraş earthquakes from the descending Sentinel-1 track. It is divided into (a,b), offering close-up views of the main active areas along the faults. Additionally, two major mud volcanoes, Ayazakhtarma and Akhtarma-Pashaly, are presented separately on the maps.
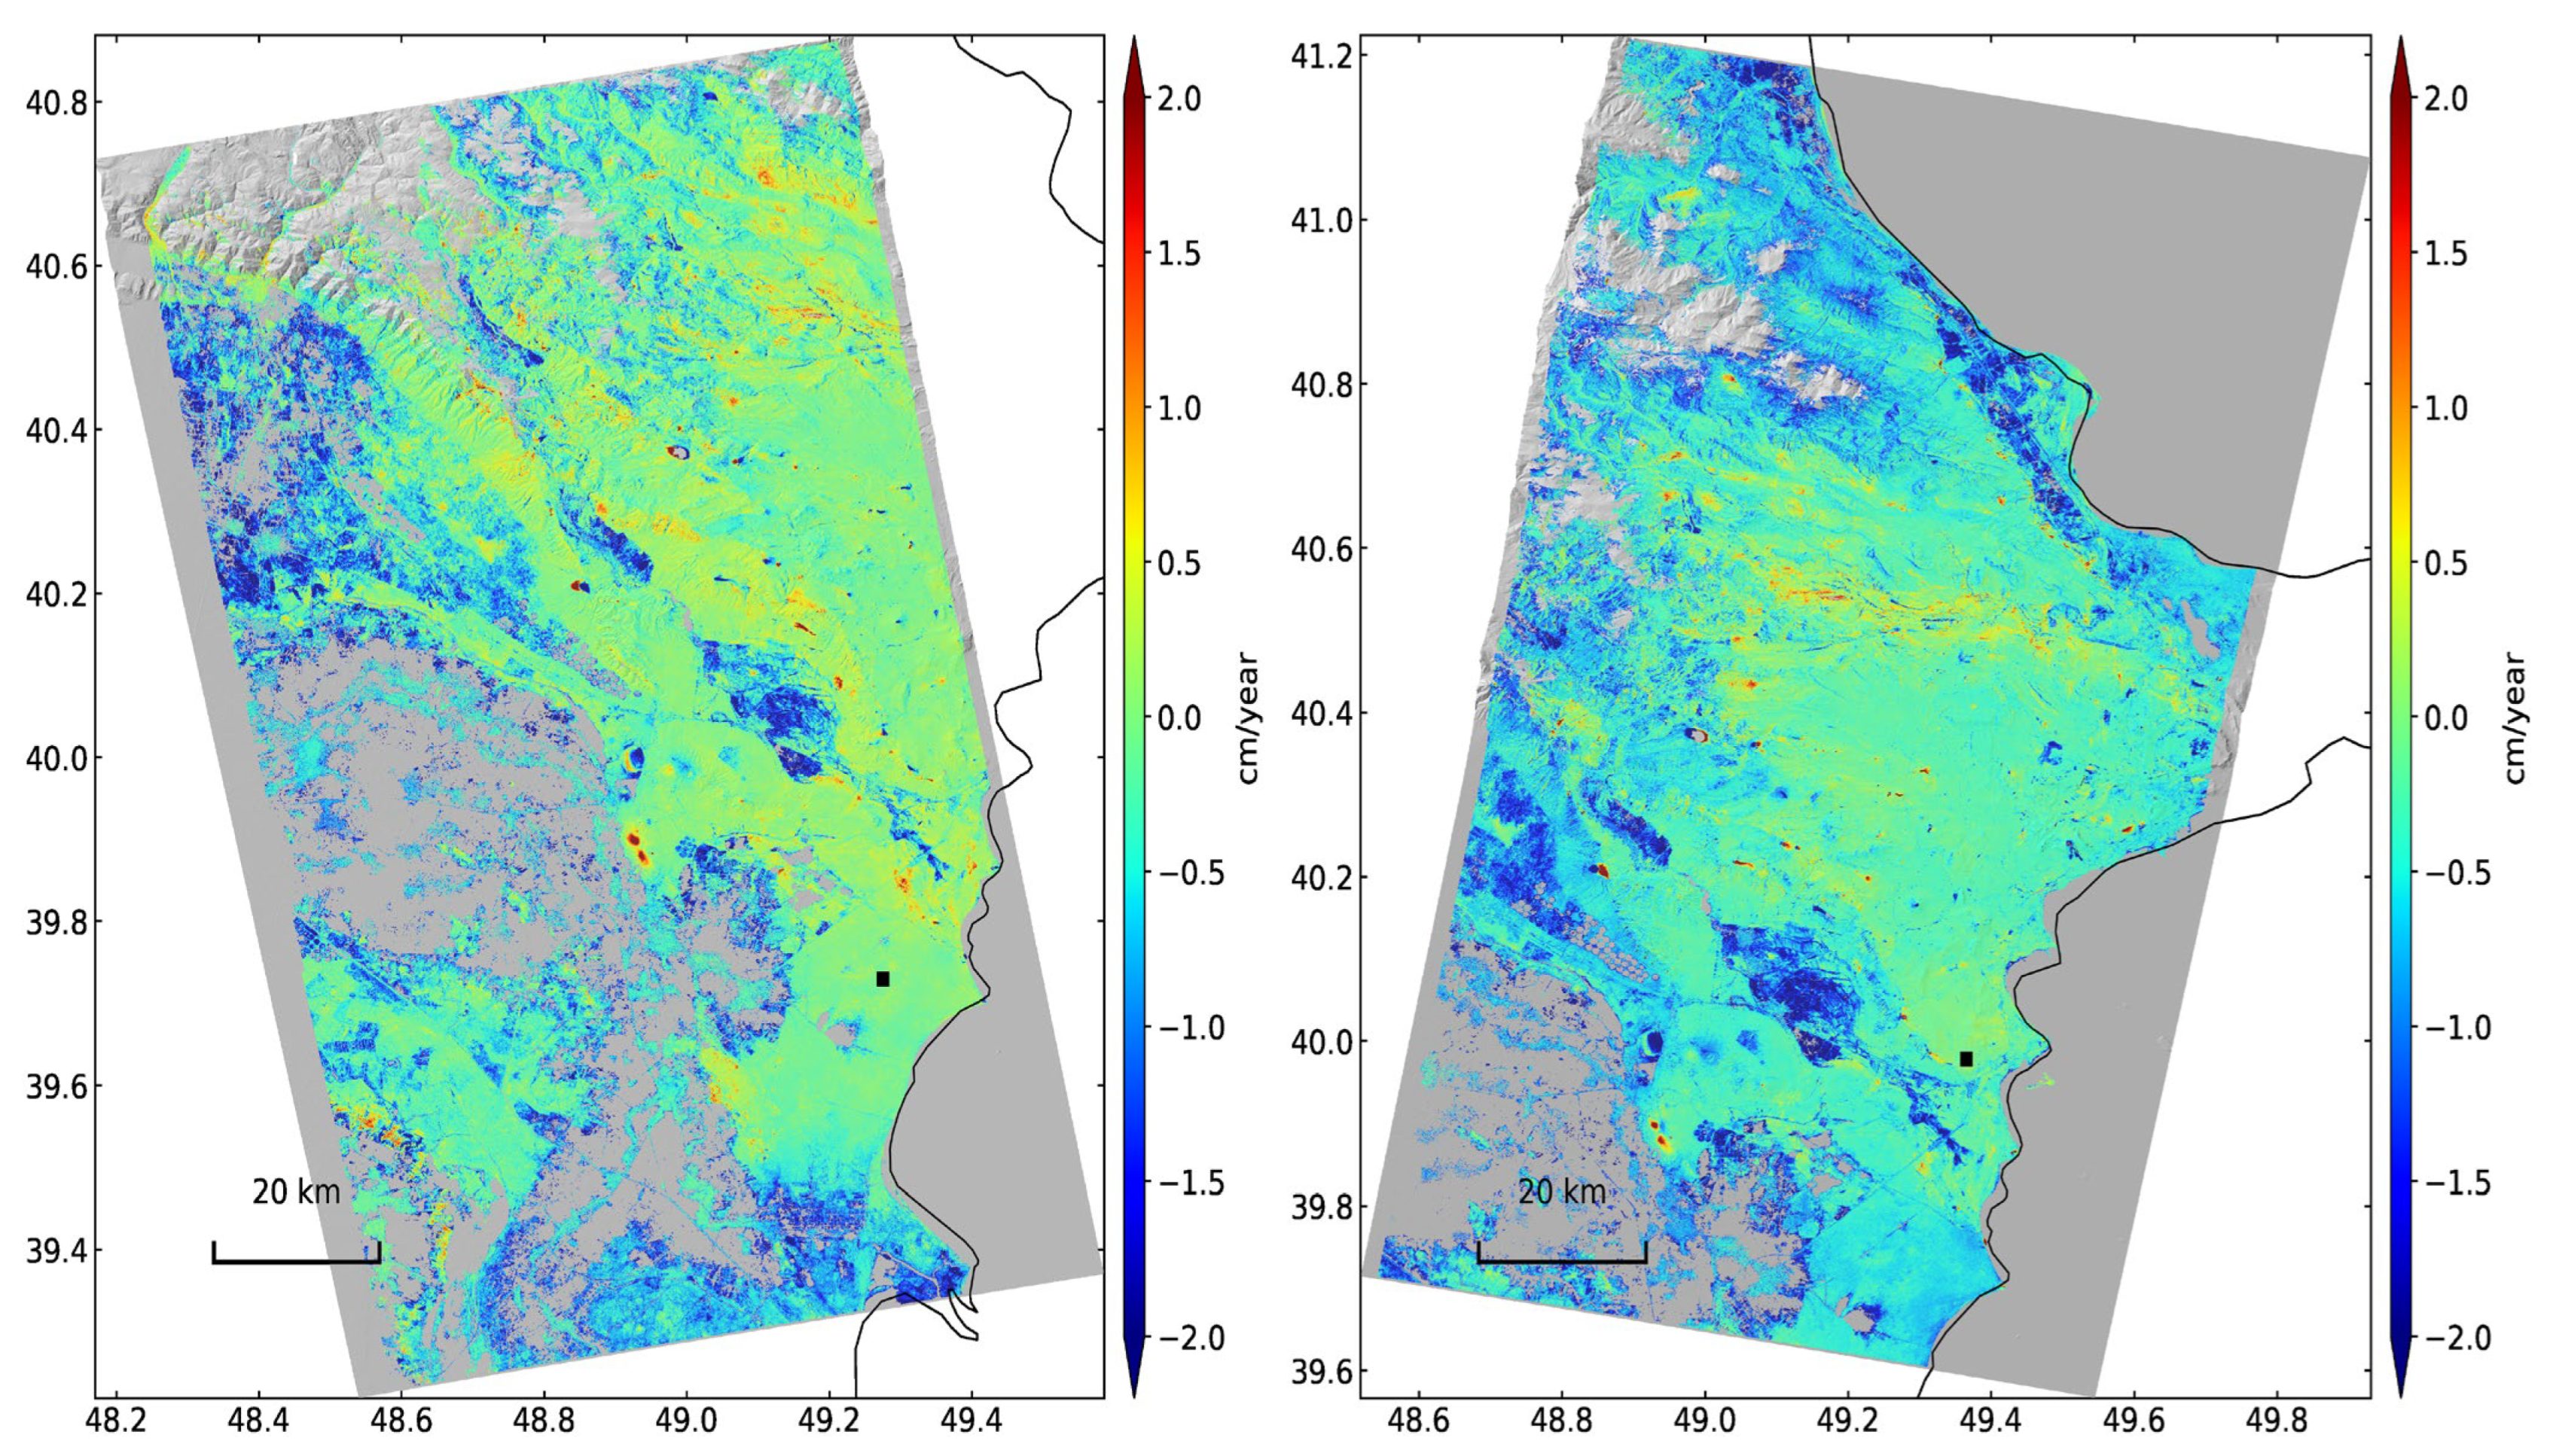
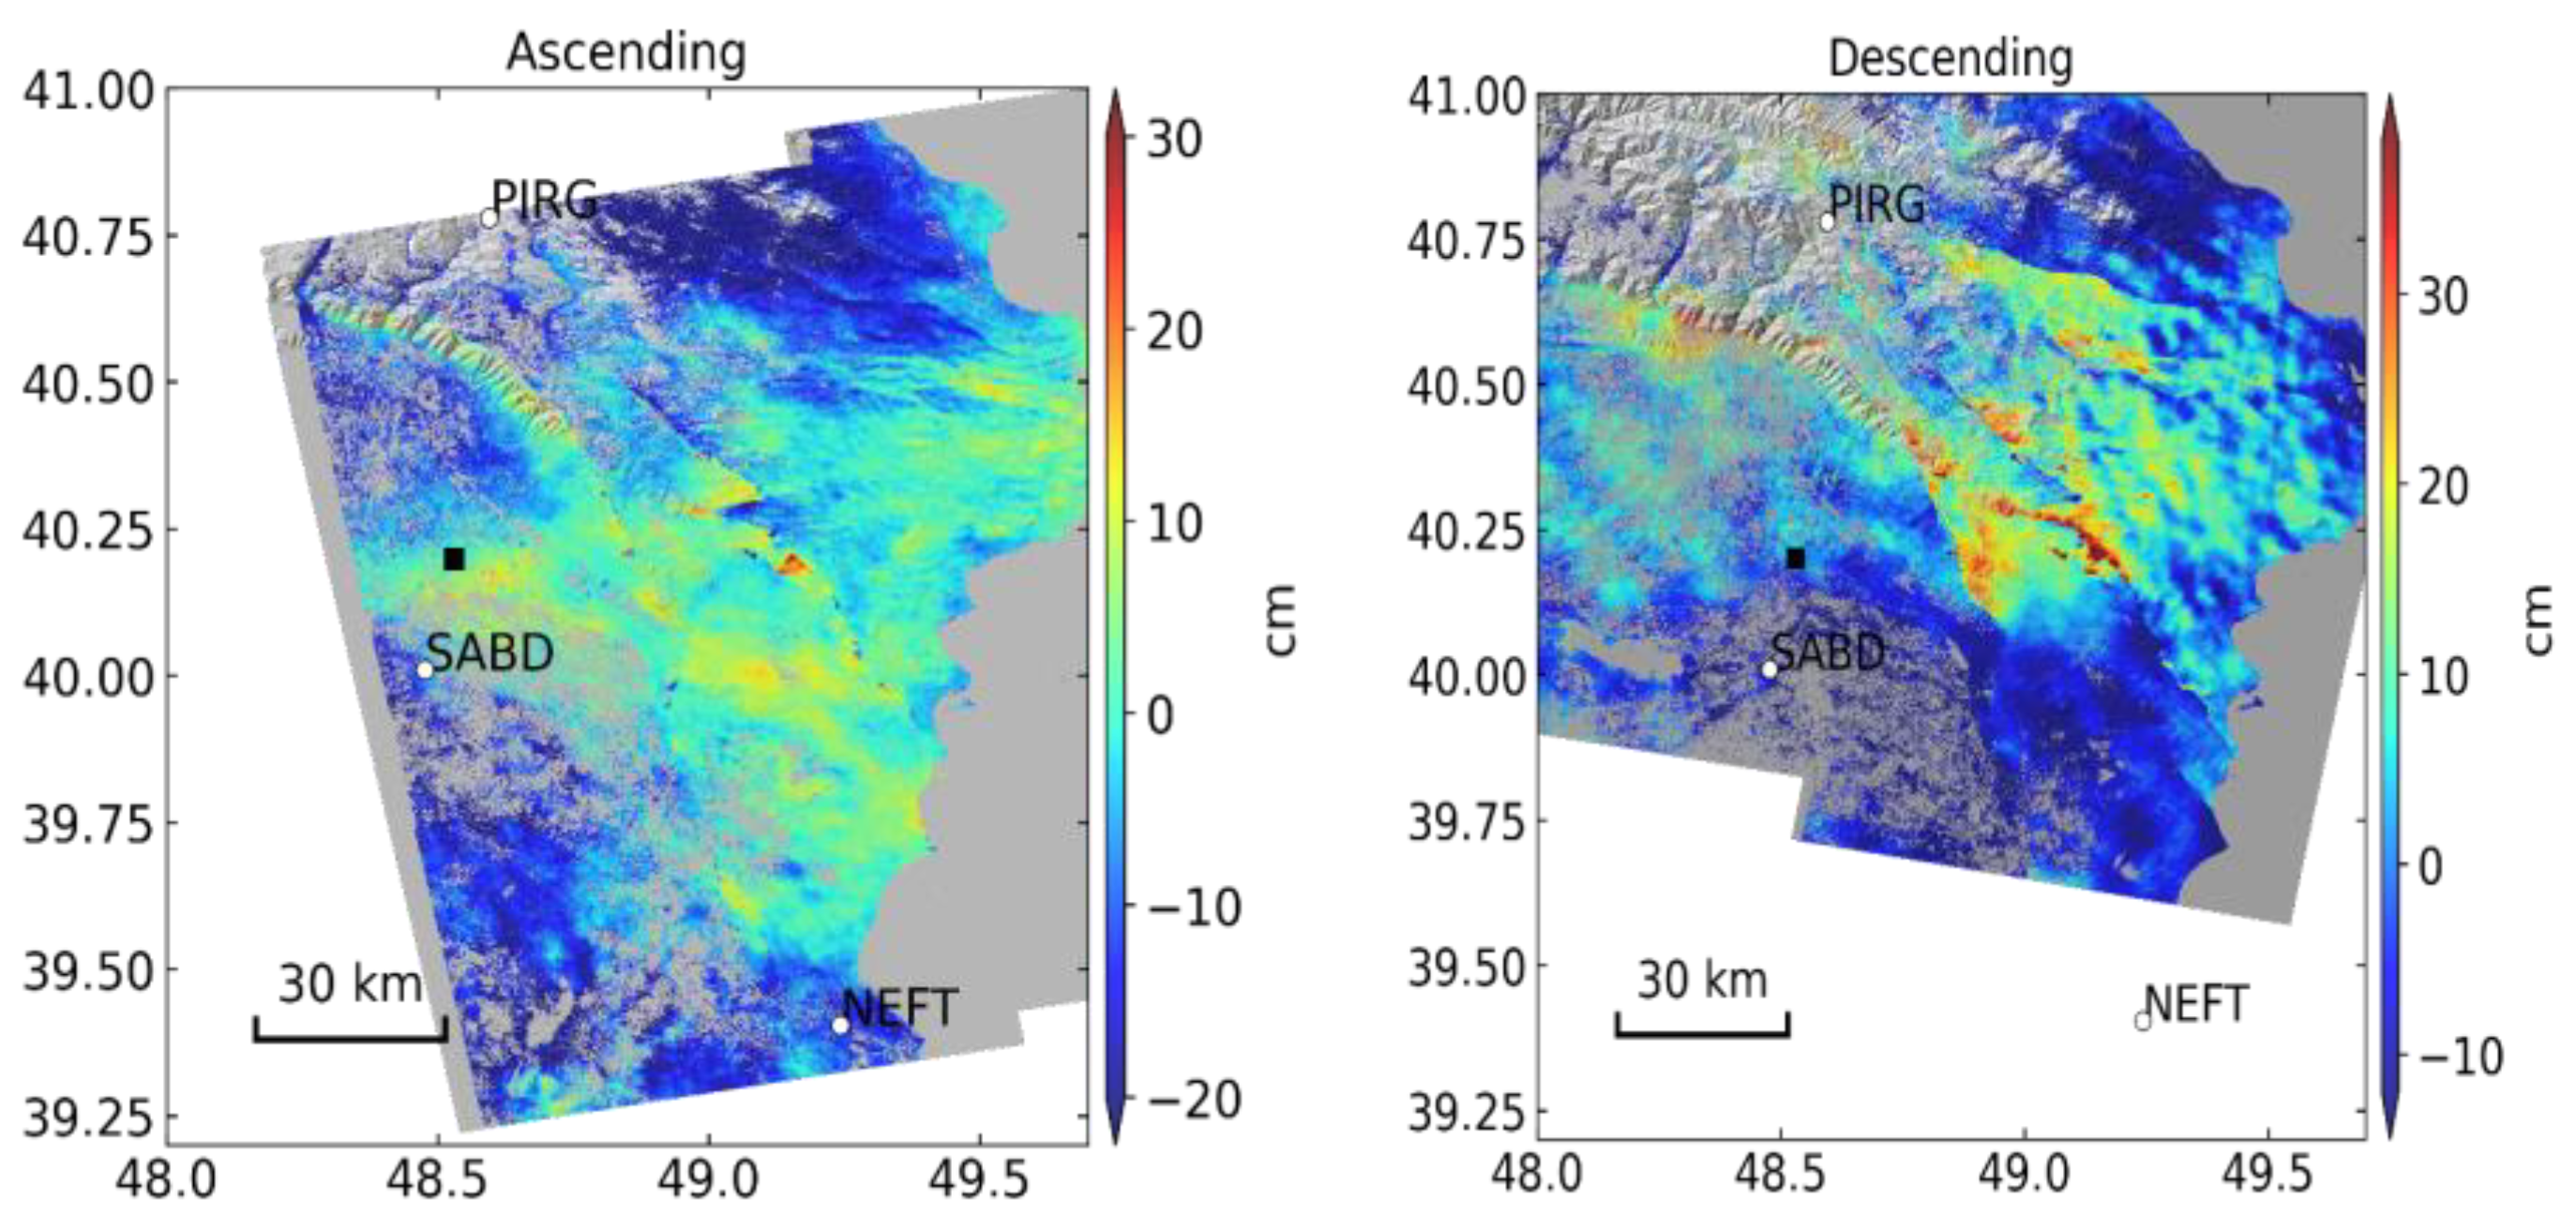
These maps provided compelling evidence of deformation during the 12-day interval that included the Kahramanmaraş co-seismic period. Co-seismic deformation maps captured changes in the surface, reflecting the direct impact of far-field events. The observed deformation patterns were consistent across multiple datasets, confirming the robustness of the findings. Over seven years of InSAR time-series datasets from 2017 to 2024 were used to investigate crustal deformation and mud volcano activity in the study region, estimating the mean velocity with MintPy (Figure 4). This approach has revealed significant deformation patterns across the area, with strong evidence of a far-field dynamic triggering effect associated with the February 2023 Kahramanmaraş earthquakes, located over 1000 km away. The time-series analysis reveals significant crustal deformation across the study area. The average velocity maps (Figure 4) derived from the ascending and descending Sentinel-1 tracks highlight strong deformation patterns, particularly around mud volcanoes and along active faults. The results indicate mainly horizontal deformation, which is evident on both tracks with opposite line-of-sight displacements.
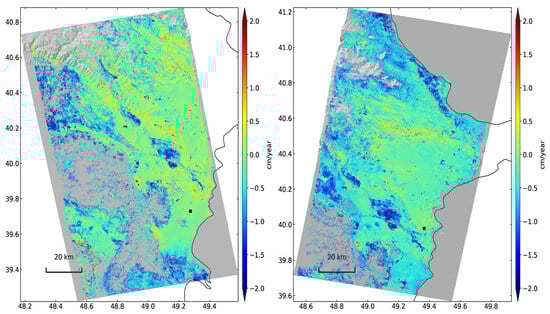
Figure 4.
Mean linear velocity of the region over 7 years (2017–2024) from ascending (left) and descending (right) satellite tracks.
The deformation is not uniform but shows localized variability, with some regions exhibiting higher displacement rates. The analysis uncovered reactivated faults that had either been previously unmapped or incorrectly delineated, emphasizing the impact of the seismic event on the region’s tectonic structures. Notably, multiple faults exhibited apparent activation during the earthquakes and nearly all monitored mud volcanoes showed strong deformation signals, demonstrating their sensitivity to distant seismic energy.
Following large or great earthquakes, seismic activity is commonly observed at distances greater than one to two fault lengths. This phenomenon is attributed to transient seismic waves, which can carry dynamic stress over extensive distances. A typical feature of dynamic triggering is the alignment of triggered seismic events with the direction of the rupture. While these impacts are more apparent at remote distances, similar processes likely appear in close proximity, increasing questions about their contribution to aftershock patterns. There is a demand for further investigation of remotely triggered seismicity, especially on its contribution to aftershock patterns. Determining whether dynamic triggering is predominantly limited to geothermal or volcanic regions is crucial. Since transient stress changes do not leave ongoing alterations in the static stress field, the mechanism by which they lead to fault activation remains poorly understood [27].
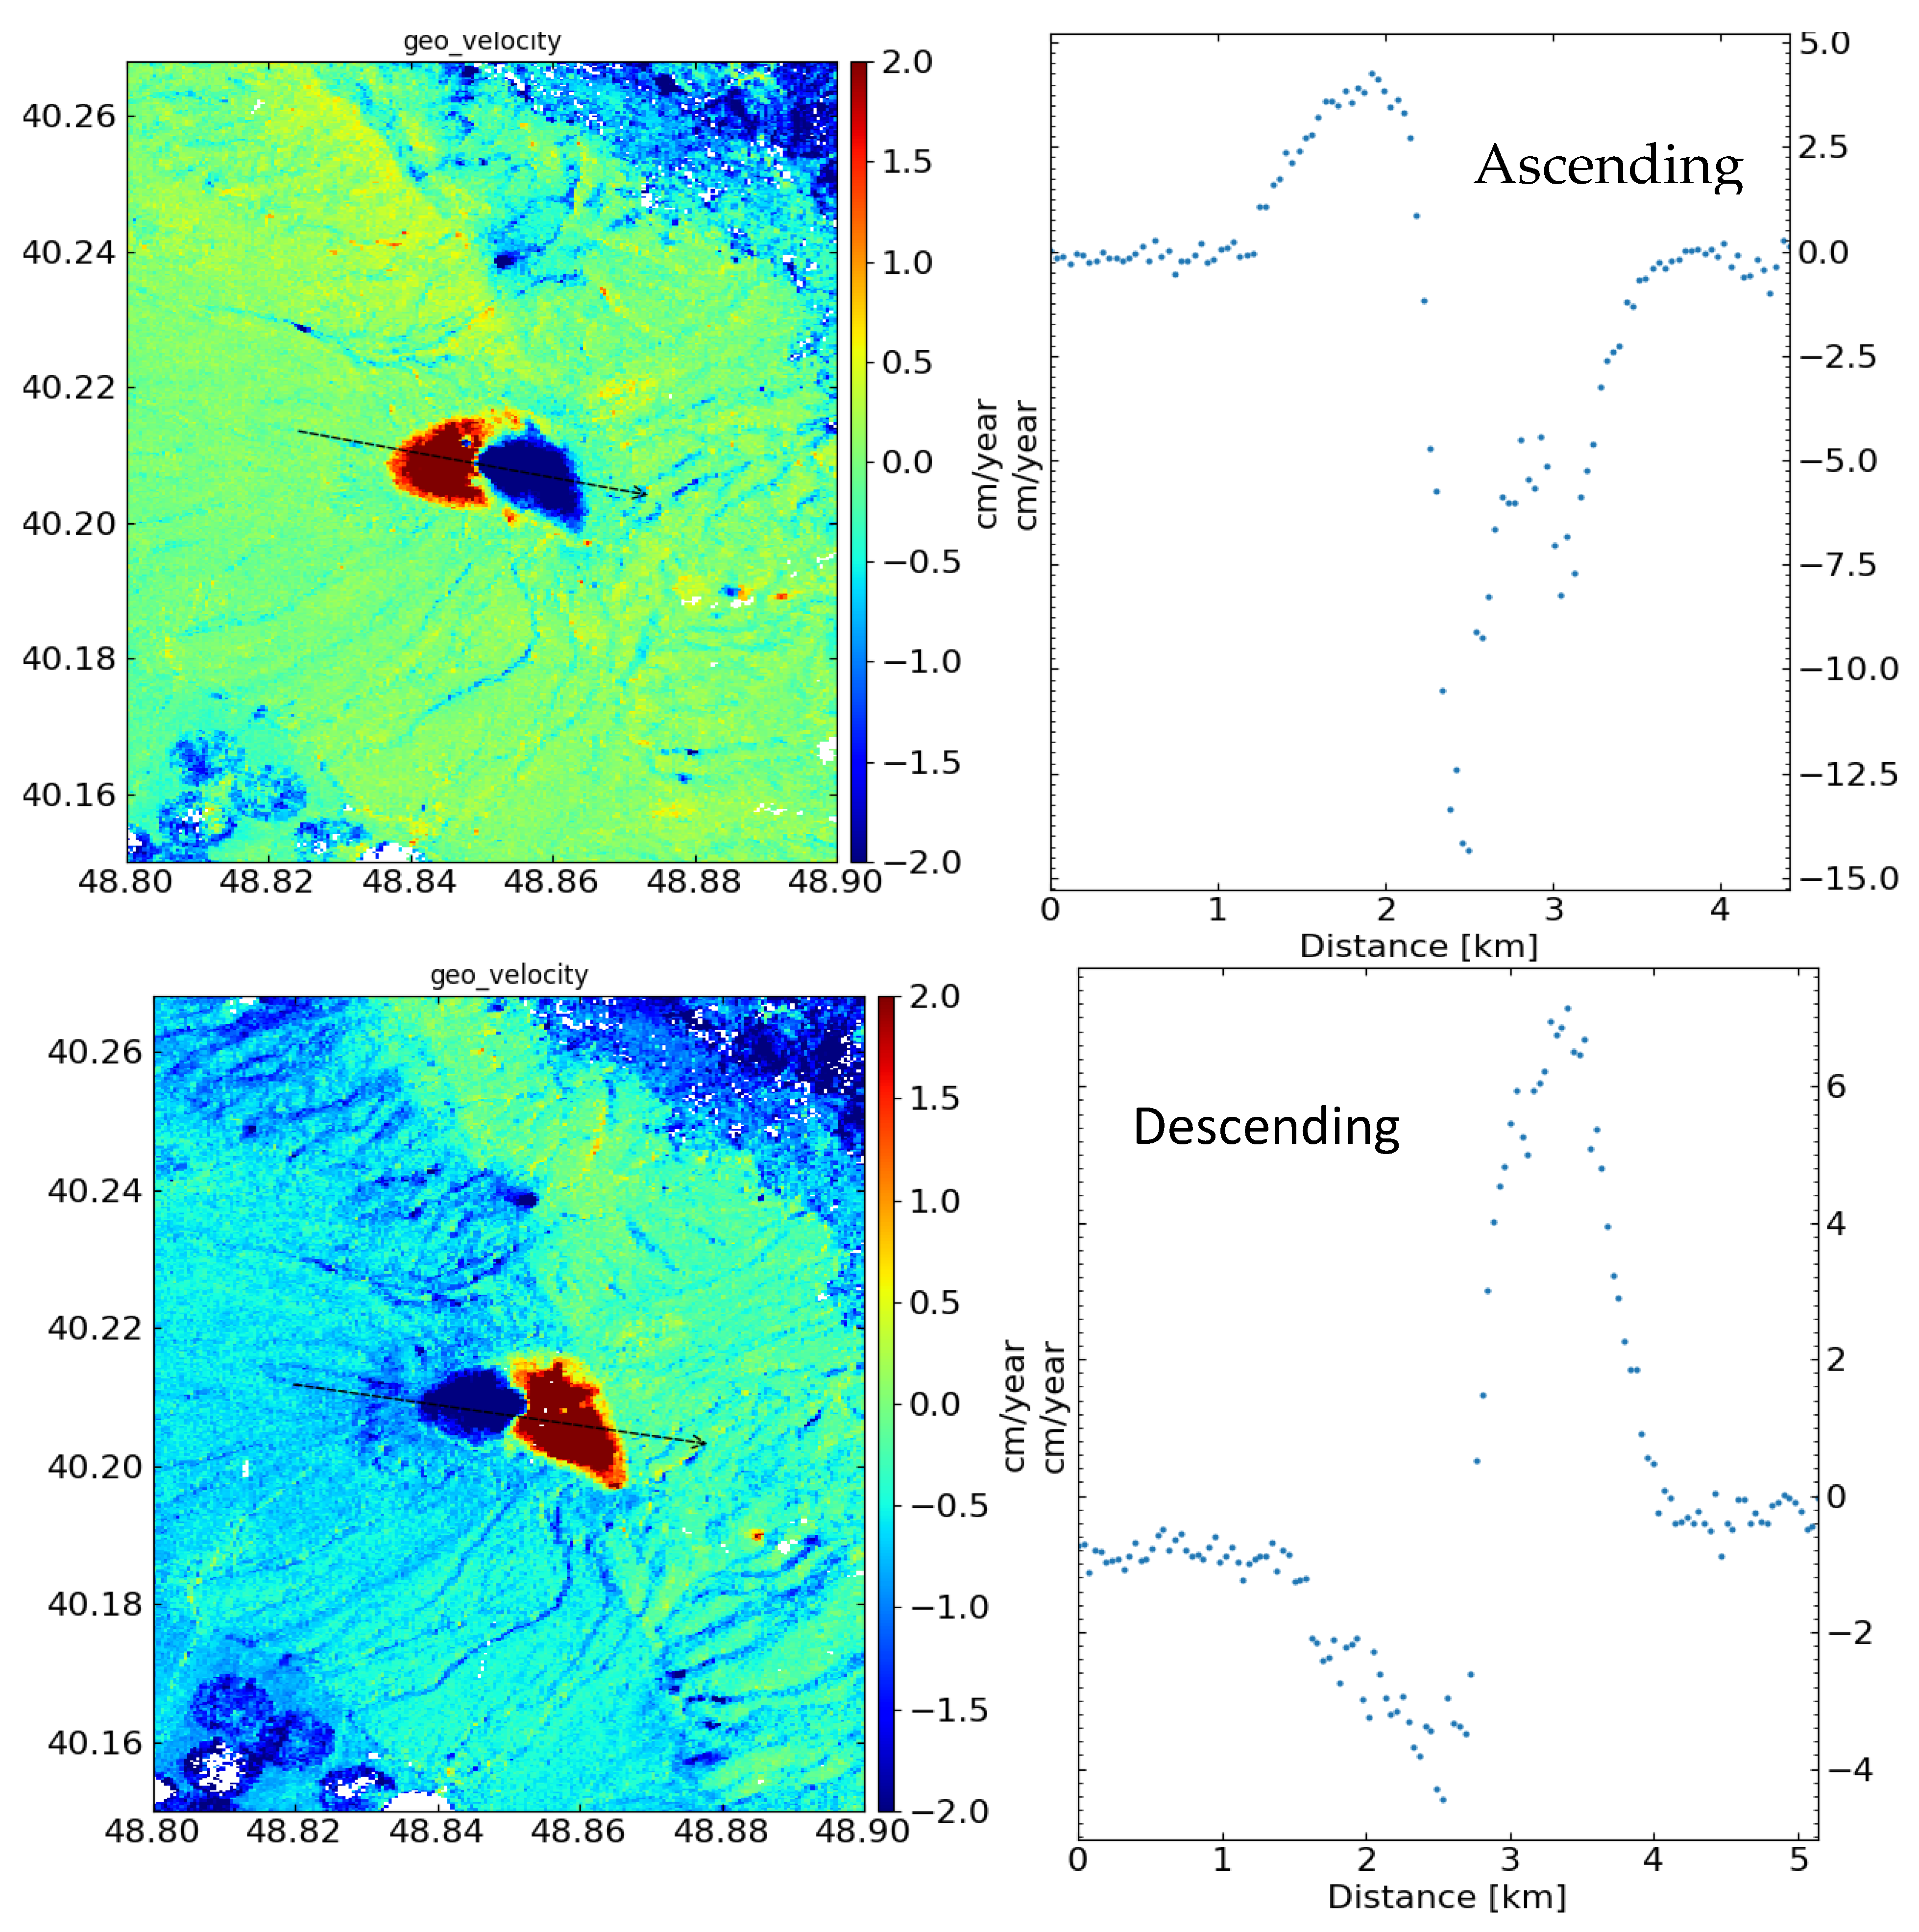
We observed substantial deformation at the Akhtarma-Pashaly mud volcano, and it consistently exhibited substantial deformation (Figure 5). The time-series analysis from the ascending and descending tracks with transection profiles clearly describes how the mud volcano deformed over time.

Figure 5.
Figure 5. Mean velocity profile across the Akhtarma-Pashaly mud volcano, highlighting LOS deformation patterns from the ascending and descending tracks during 2017–2024. Arrows indicate the profiles.
The results highlight persistent and localized deformation patterns, where substantial displacement was observed throughout the study period. The positive (towards the satellite) motion of the western half of the mud volcano on the ascending track and negative motion on the descending track indicates that west side of the volcano is moving westward, whereas the opposite pattern on the eastern half shows the east side is moving eastward; thus, the volcanic edifice has been enlarging over the last 7 years. The reverse displacements observed on the eastern and western flanks of the Akhtarma-Pashaly mud volcano can be interpreted as localized responses to stress redistribution. These opposing motions may reflect the interaction of subsurface overpressured fluids with near-surface fault systems. Such behavior is consistent with previous models that link surface deformation in mud volcanoes to internal pressurization and lithological contrasts [9]. These dynamics may also indicate that the volcano is structurally affected by underlying thrusts or extensional fractures that respond differently to dynamic seismic loading on either side. This consistent deformation underscores the ongoing and dynamic nature of the subsurface processes, which is crucial for understanding the unique characteristics of mud volcanoes. Using time-series analysis, a study on the Ayazakhtarma mud volcano revealed significant and persistent deformation. Notably, we observed a strong response to the Kahramanmaraş earthquake, with significant displacement on both sides of the volcano during the 12-day interval when the earthquake shook the area (Figure 6).
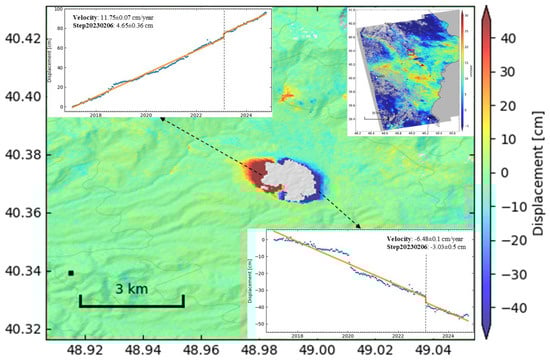
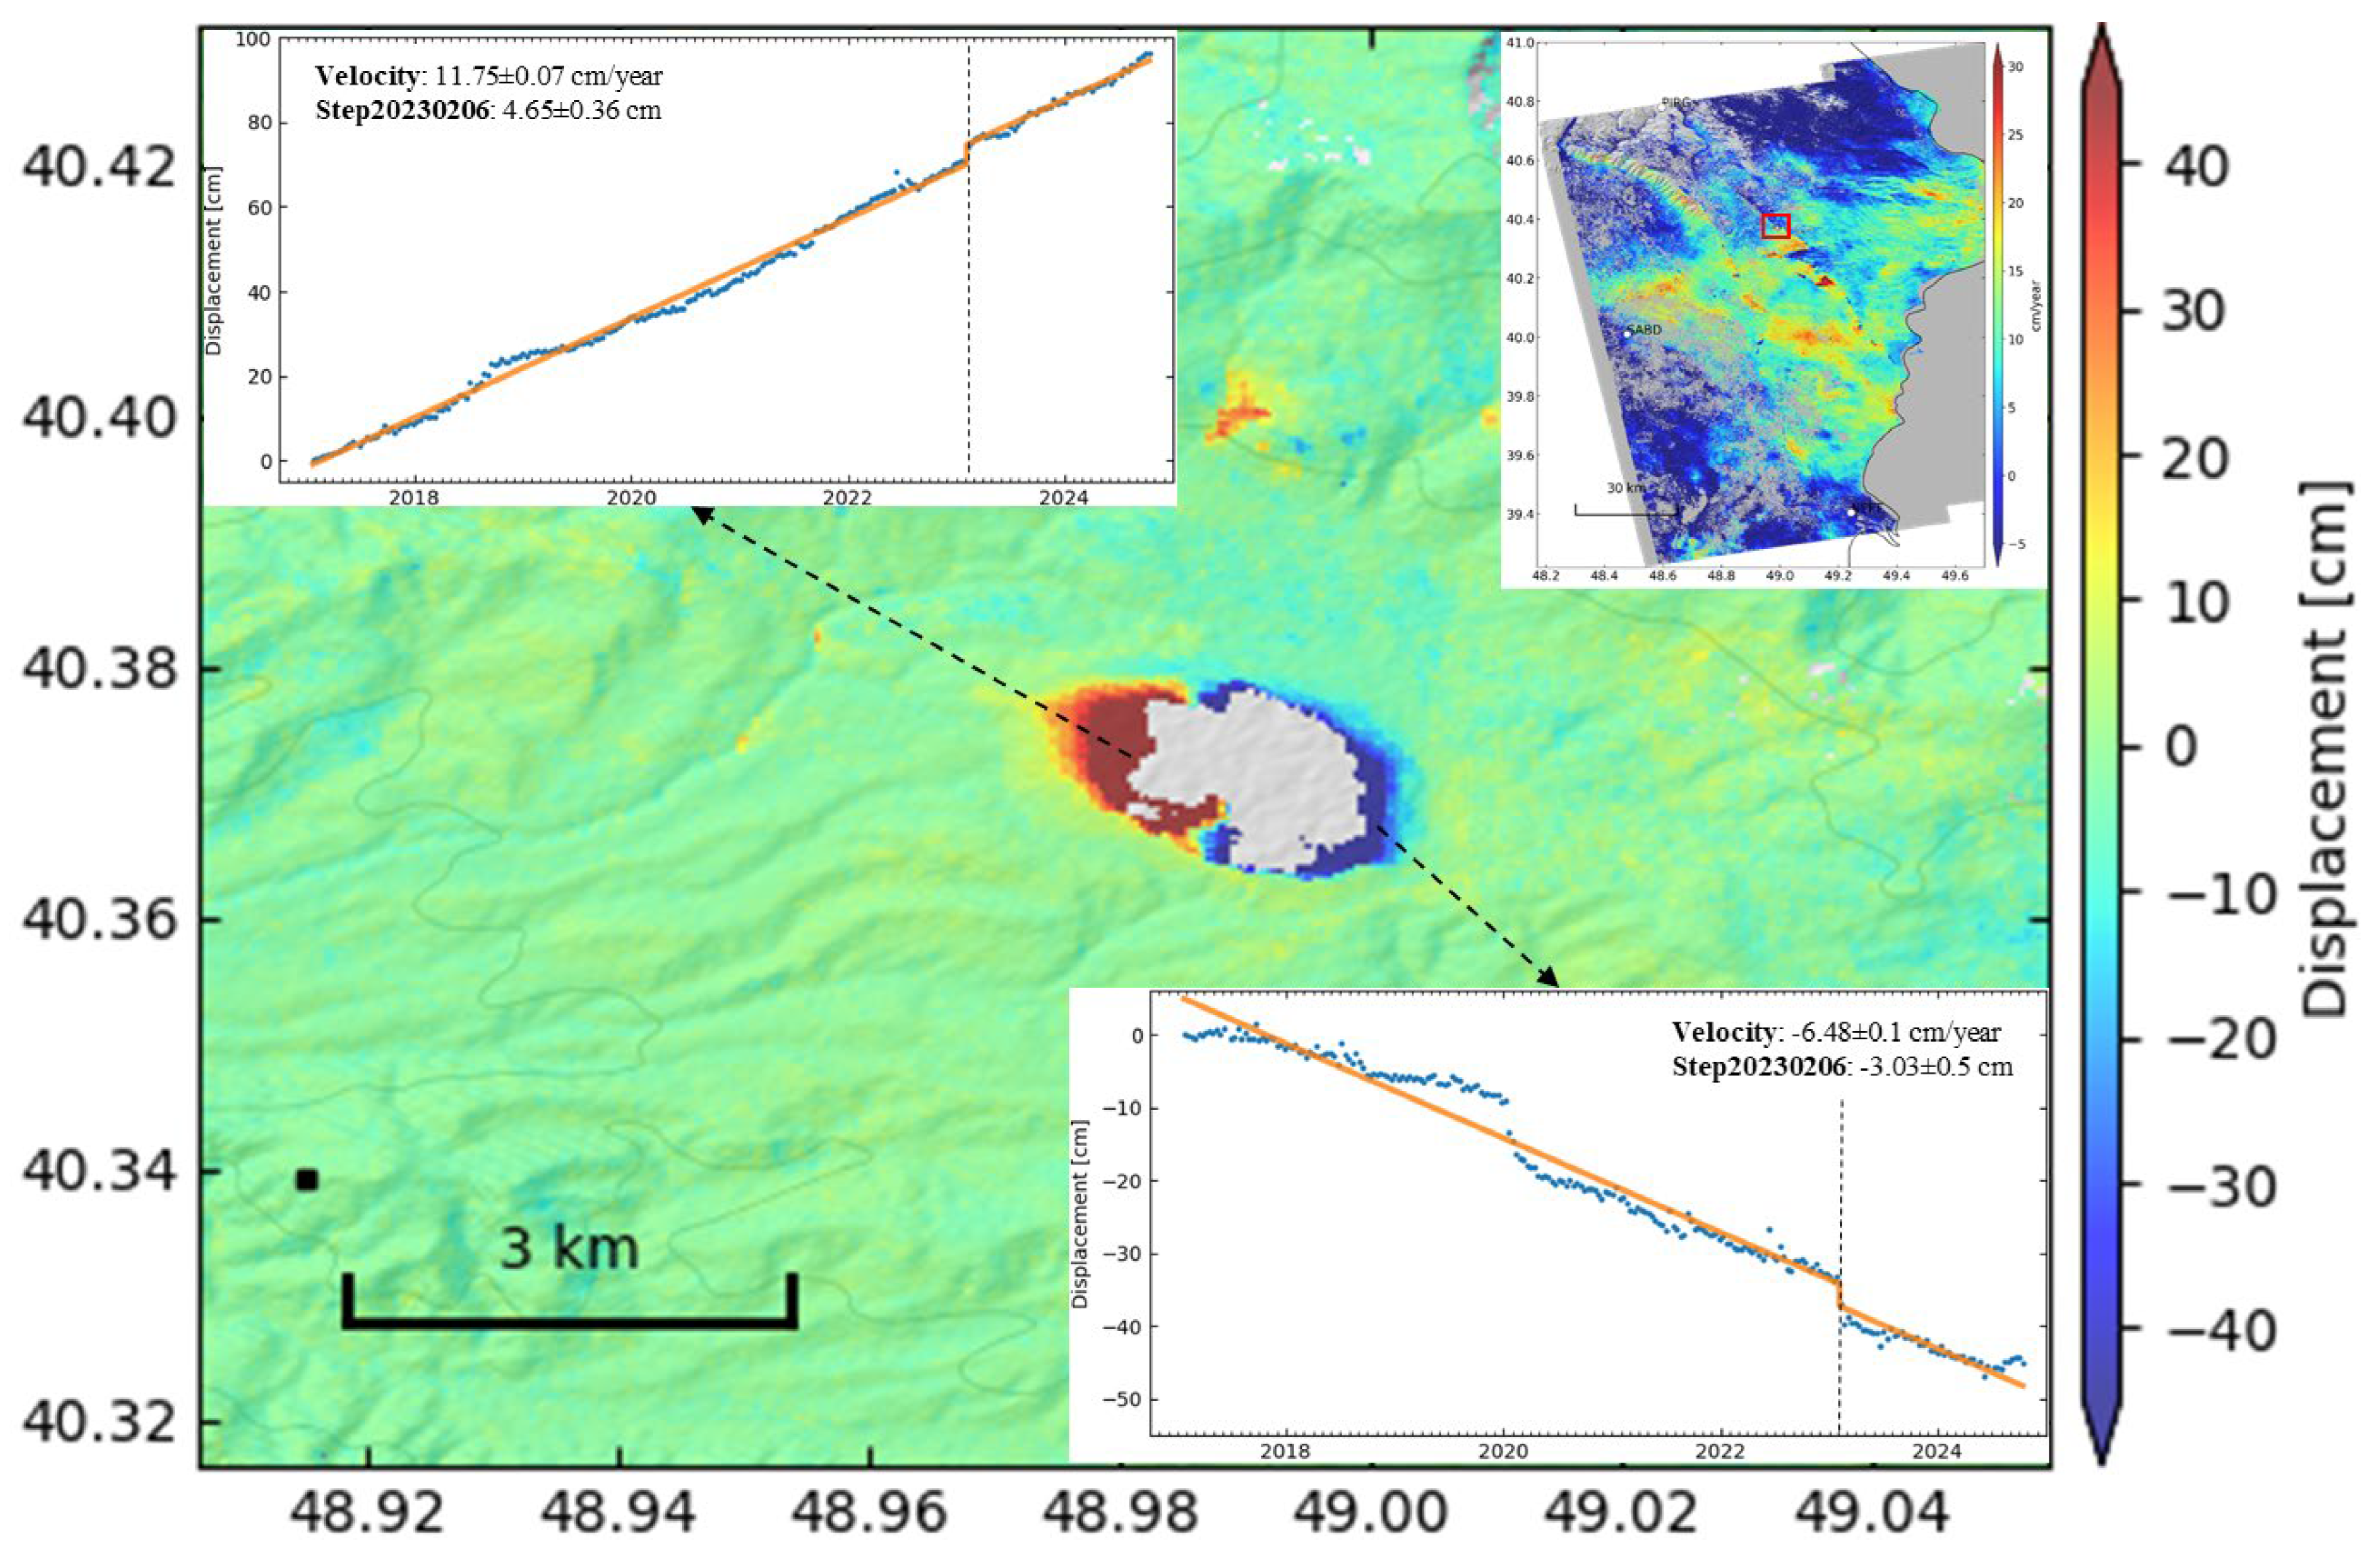
Figure 6.
The ascending cumulative total LOS displacements map of the Ayazakhtarma mud volcano over the 7-year study period and its reaction to the seismic event. The time-series plots for selected points (insets) show the linear velocity with additional step changes (4.6 cm on the west side and 3 cm on the east side) at the time of the large 2023 earthquakes in Türkiye. The center of the volcano had a chaotic motion that could not be measured with InSAR and was masked out. The black square indicates the reference point, and the red rectangle marks the location of the area. Dashed lines on the graph mark the occurrence of the Kahramanmaraş earthquake on 6 February 2023.
In 2020, we also observed significant deformation in the Ayazakhtarma mud volcano, a potential precursor to an eruption. Despite the lack of confirming information in existing catalogs or reports, this discovery underscores the crucial role of time-series analysis in identifying and monitoring dynamic processes in regions with limited ground-based observations. Using a source model, Iio and Furuya [28] explored the deformation at the Ayazakhtarma mud volcano. They analyzed ALOS (2007–2011) and ALOS-2 (2014–2017) InSAR and multiple-aperture interferometry (MAI) data and demonstrated that surface displacements at Ayazakhtarma are horizontal, with significant north–south displacement components detected via their MAI analysis that are not visible in regular InSAR. Their source model, in particular, suggests a semi-radially distributed normal dip–slip driven by the continuous intrusion of mud and gas.
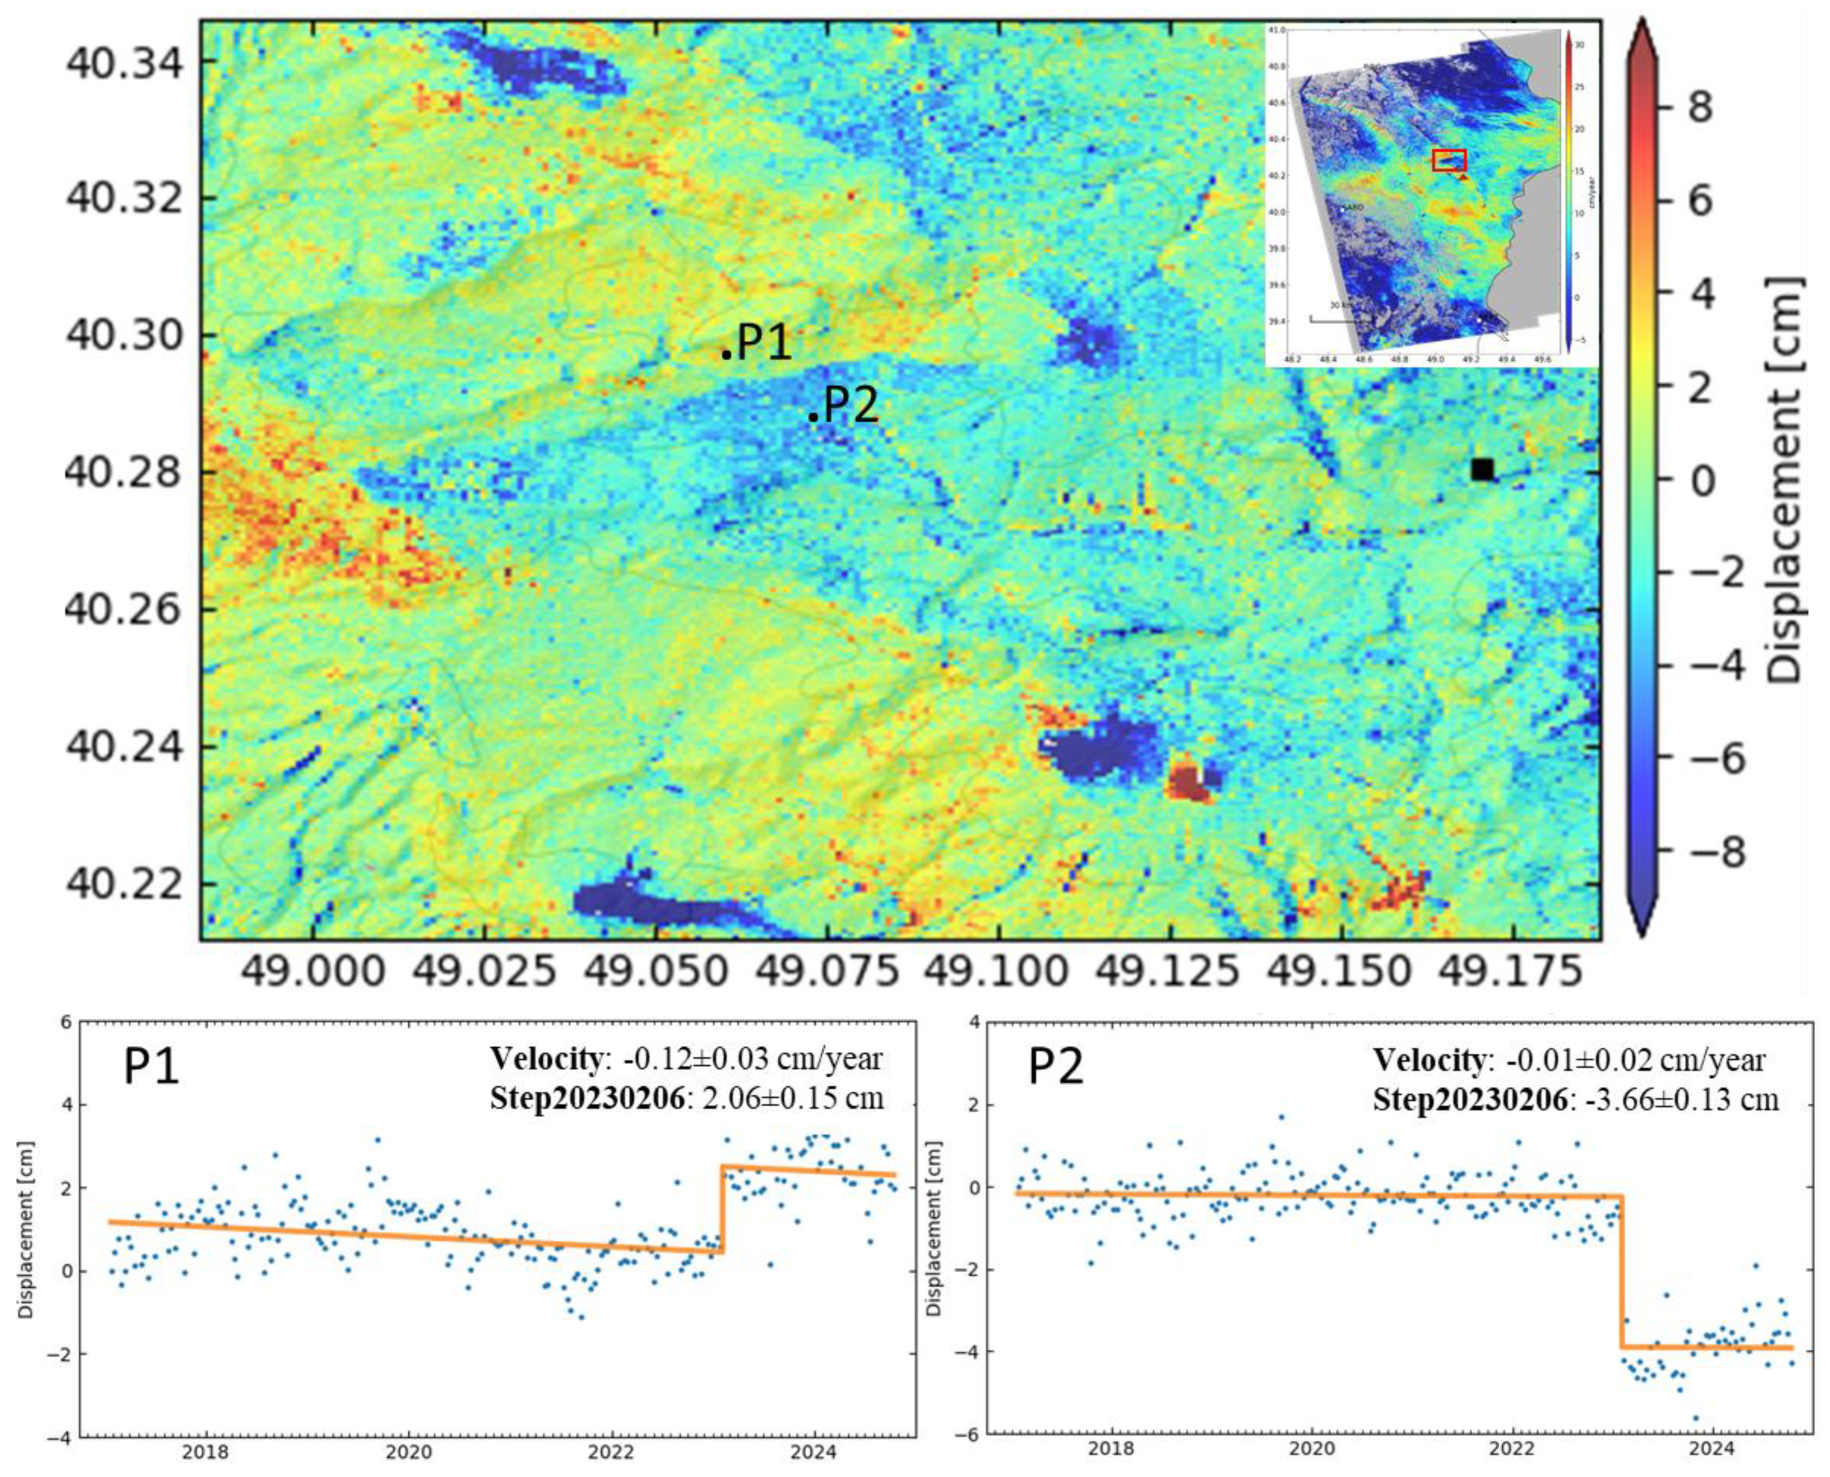
Time-series analyses (Figure 7) revealed significant fault deformation in addition to the mud volcano deformation during far-field earthquakes, providing clear and substantial evidence of dynamic triggering effects on fault movement. The observed displacement patterns from InSAR measurements are predominantly characterized by horizontal displacement and indicate substantial fault reactivation. These findings significantly enhance our understanding of fault activity during earthquakes and its potential impact on seismic hazard estimation. Displacement of more than 3 cm was observed at the same time as the earthquakes; transient seismic waves must have caused this extent of deformation. Unlike the ongoing deformation of the mud volcanoes, the fault slip seems to be limited to the period during the Kahramanmaraş earthquakes. The results show the sensitivity of faults in Azerbaijan to far-field seismic energy, particularly in areas where pre-existing tectonic stress and subsurface pressure are already elevated.
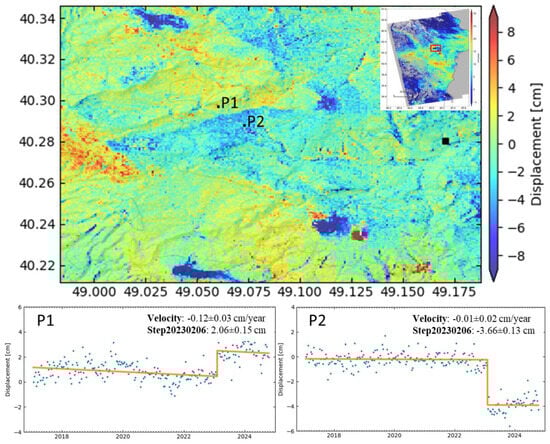
Figure 7.
Displacement map from the step function fit at the time of the earthquake (top) and time-series for two points, P1 and P2 (bottom). This shows crustal deformation along the fault, highlighting the fault activity observed during the seismic event from the ascending track. The reference point for the displacements represented by a black square and the red rectangle marks the location of the area.
The direction of the observed displacement (northside towards the satellite on the ascending track and southside away) is consistent with left-lateral motion on the north–east trending fault in Figure 7 and offers valuable insights into the mechanical behavior of the fault and the stress regime. It is important to note that dynamic triggering mechanisms, such as transient stress redistribution and resonance effects caused by seismic wave passage, play a significant role in the observed slip. This fault was not previously mapped, so we cannot compare this triggered slip to other measurements of the fault. These findings let us understand the importance of considering these dynamic stress interactions in tectonically active and hydrocarbon-rich regions, where faults can respond to far-field seismic effects.
4. Discussion
A combination of high fluid pressures, gas exsolution, and the buoyancy of low-density subsurface mud layers primarily drives mud volcano eruptions. Impermeable seals often inhibit these processes between the pressurized mud source and the surface [29]. However, the balance can be dramatically altered by earthquakes, which have the potential to significantly increase fluid pressure, initiate the growth or nucleation of gas bubbles, or create hydraulic pathways that connect the overpressured reservoirs to the surface. This dynamic potential of earthquakes alters the balance of the dynamic nature of geological processes. The role of transient seismic waves in this process cannot be overstated, particularly given that dynamic strains typically outweigh static stress changes in magnitude. Although static stress changes are often considered in earthquake-triggered deformation, Manga et al. [29] found no clear evidence linking static stress changes to eruptions, such as at the Niikappu mud volcano. This indicates that dynamic stress changes caused by the passage of seismic waves are more influential in triggering eruptions. The time-series investigation results validate the dynamic triggering hypothesis and provide a quantitative basis for understanding the nature of deformation along activated faults. These findings are not just another set of results but a significant validation of a key hypothesis in our field. They open up exciting possibilities for future research and have the potential to reshape our understanding of seismic activity.
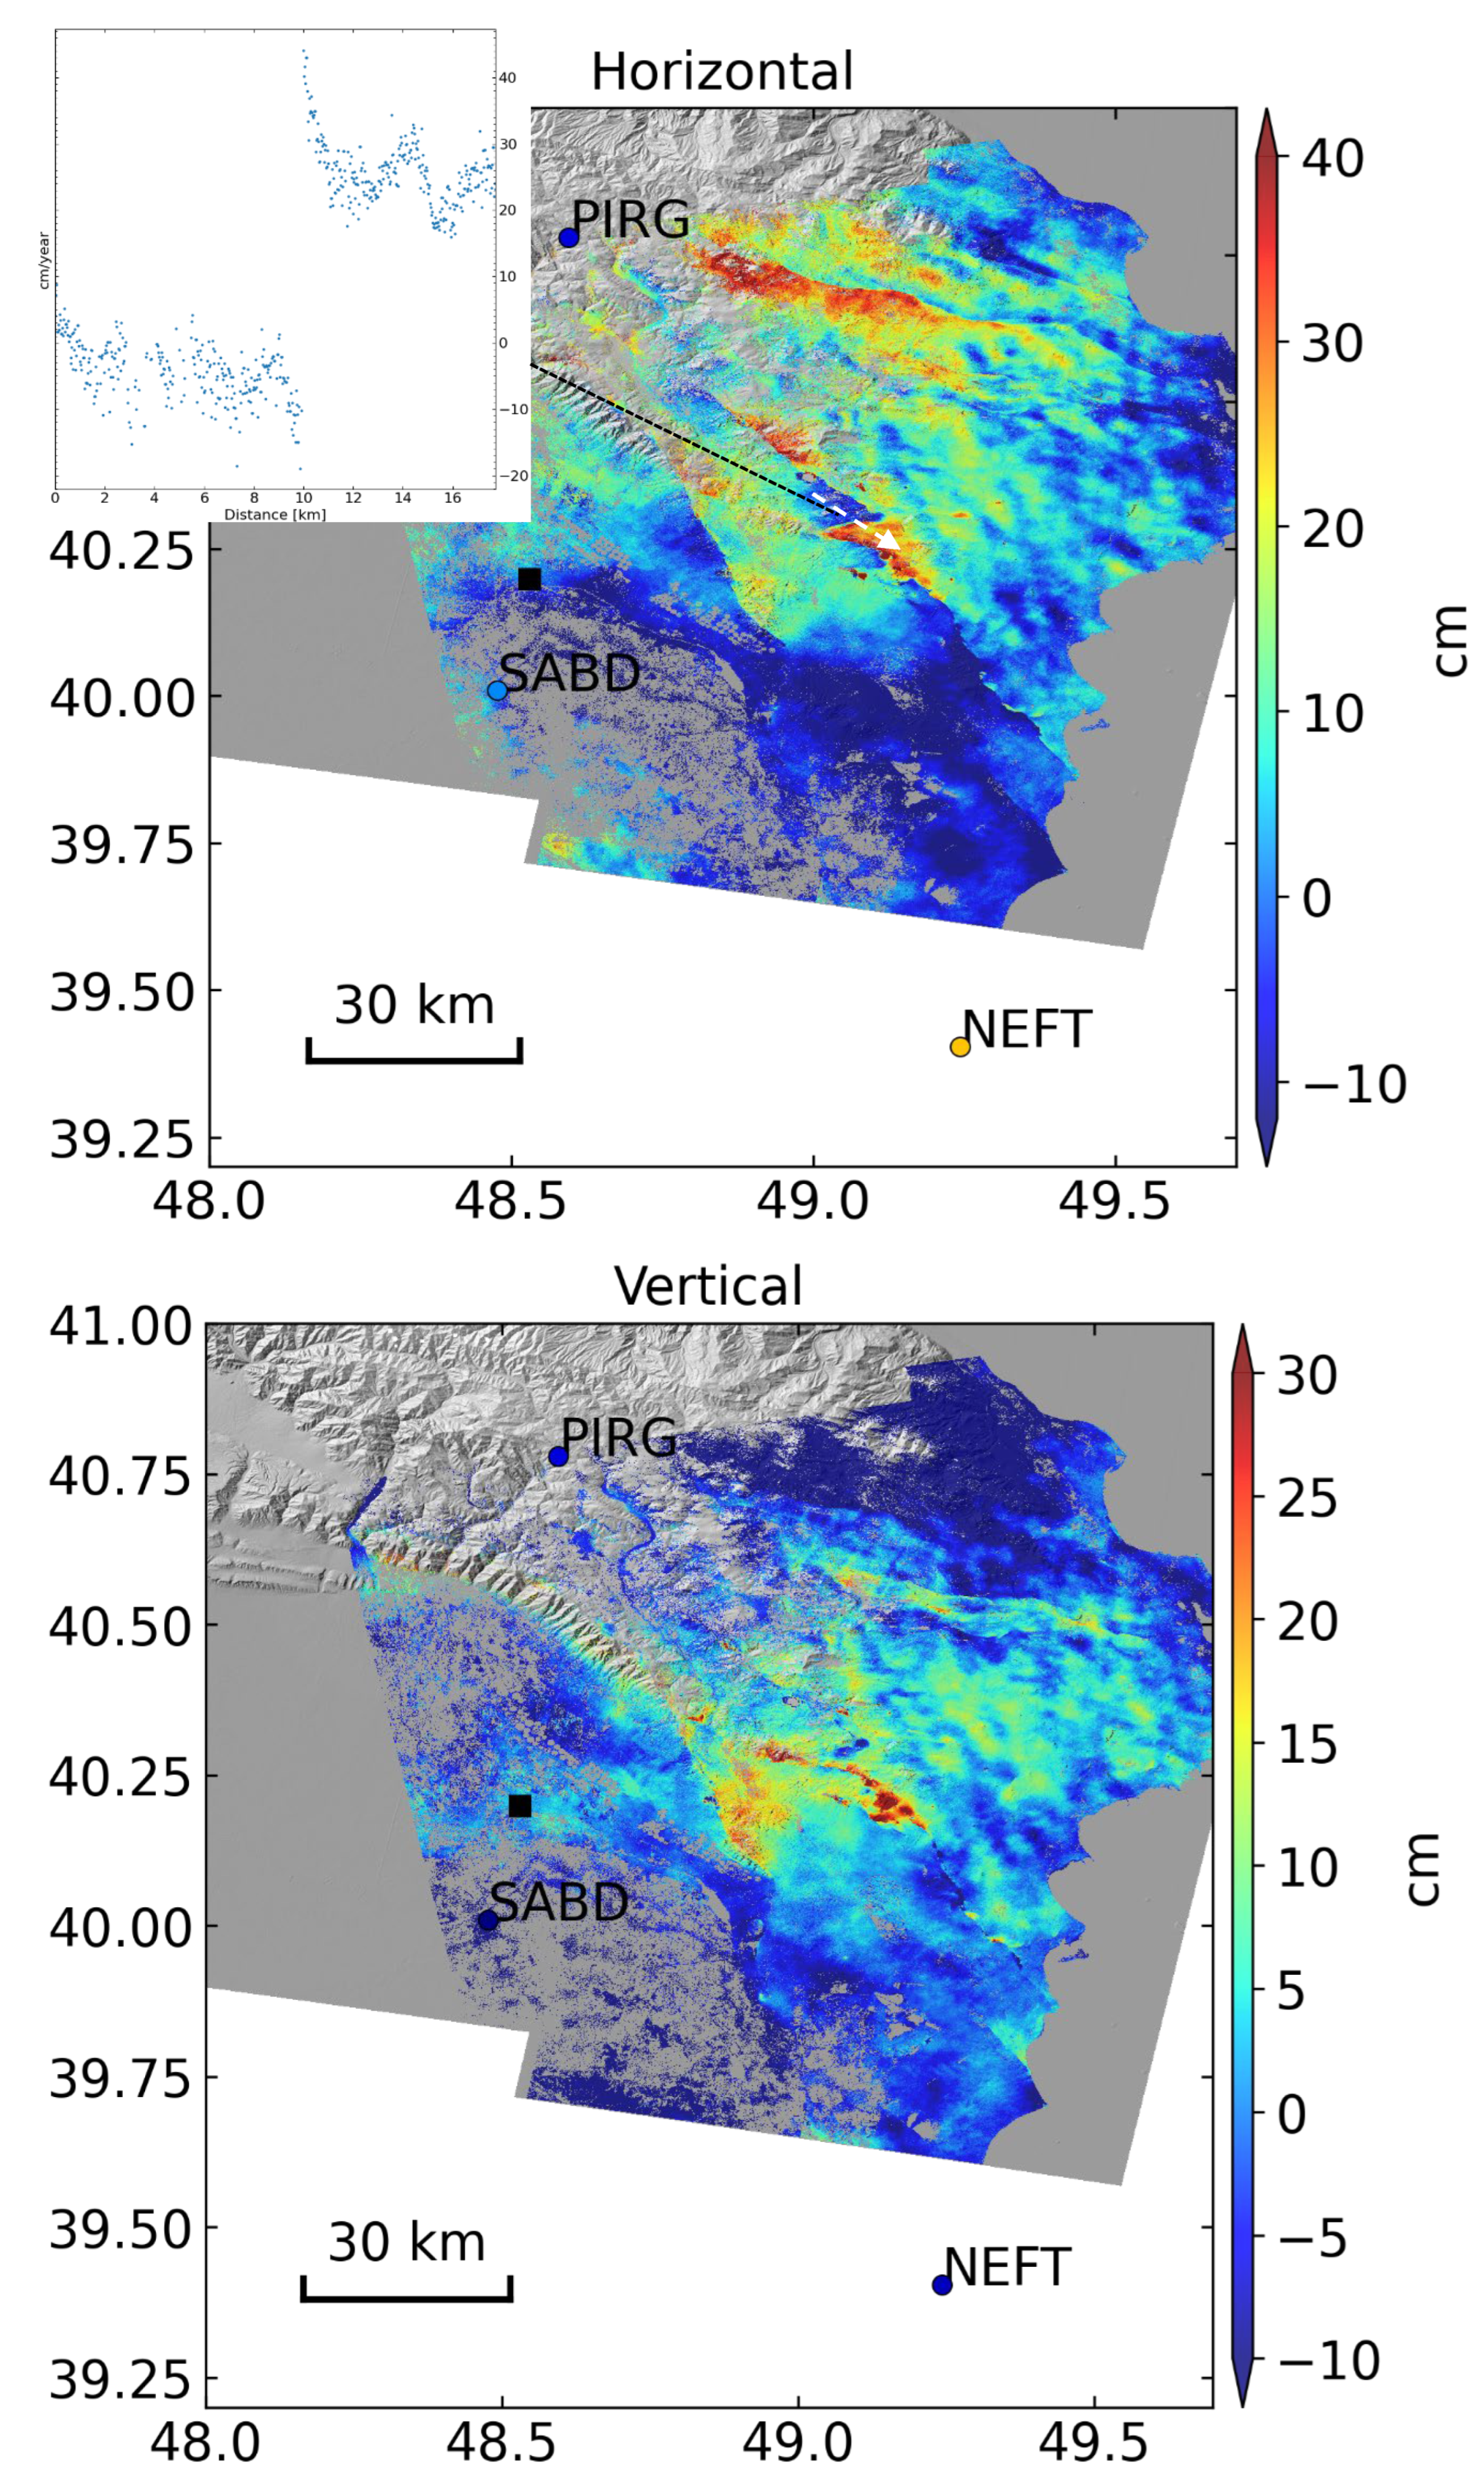
We converted the co-seismic deformation results from ascending and descending tracks (Figure 8) to estimate horizontal (east) and vertical displacements. This decomposition provided a more detailed interpretation of ground motion dynamics during the far-field seismic event. Mud volcano zones indicate underlying tectonic and fluid-related processes. The horizontal east displacement patterns align well with fault structures, presenting an interplay between fault movements and mud volcano dynamics, further proving our existing knowledge.


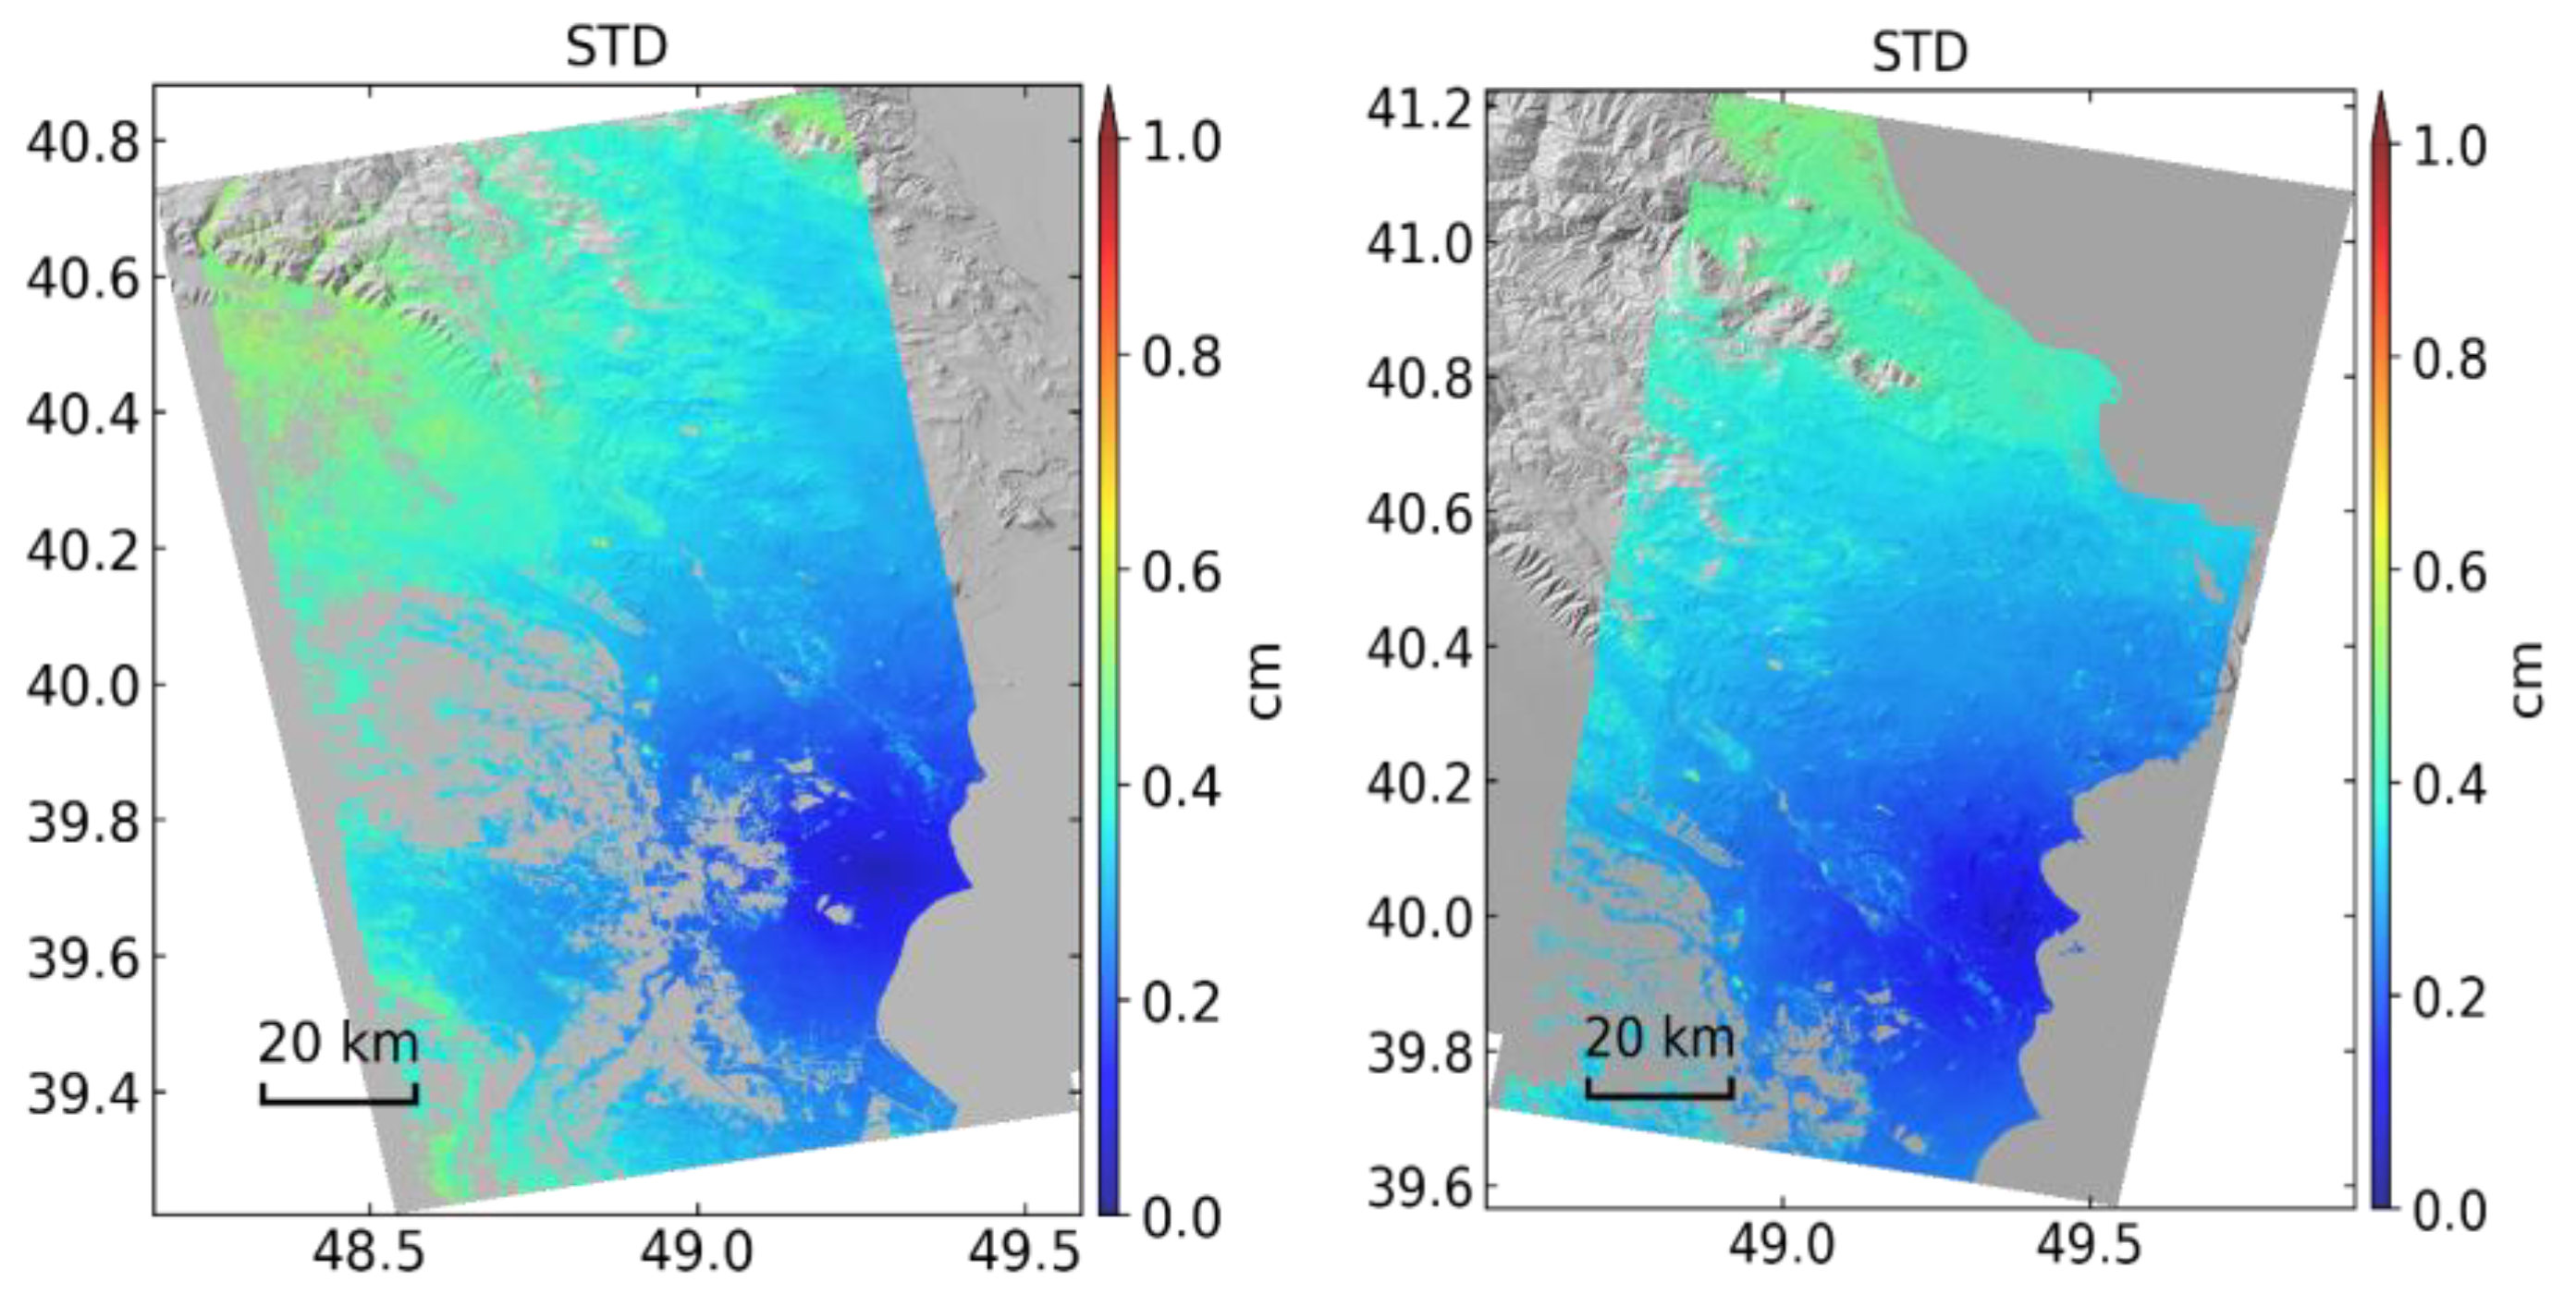
Figure 8.
Co-seismic results (step function fit) from ascending (left) and descending (right) tracks indicate a dynamic triggering effect on the faults in Azerbaijan. Uncertainty maps for the step function displacements (below) show the reliability of the observed deformation in the main affected zones. The reference point for the displacements represented by a black square.
The results reveal significant horizontal (east) and vertical displacements along the active fault zones during the 12-day Sentinel-1 acquisition interval of the earthquakes, emphasizing the complex crustal response to the February 2023 Kahramanmaraş earthquakes (Figure 9). There is a pattern of conjugate faulting with the short east–west trending fault shown in Figure 7 and Figure 9 having left-lateral slip and the northwest–southeast trending faults that connect to it having right-lateral slip. Other faults to the north and south primarily show vertical displacements. The Sentinel-1 line-of-sight InSAR measurements are insensitive to the north component of slip, so we cannot construct a full three-dimensional displacement model.

Figure 9.
Horizontal east and vertical displacements in the study area at the time of the Kahramanmaraş earthquakes. Inset shows the profile of the horizontal displacement across the fault at the location of the white dashed line. The reference point for the displacements represented by a black square.
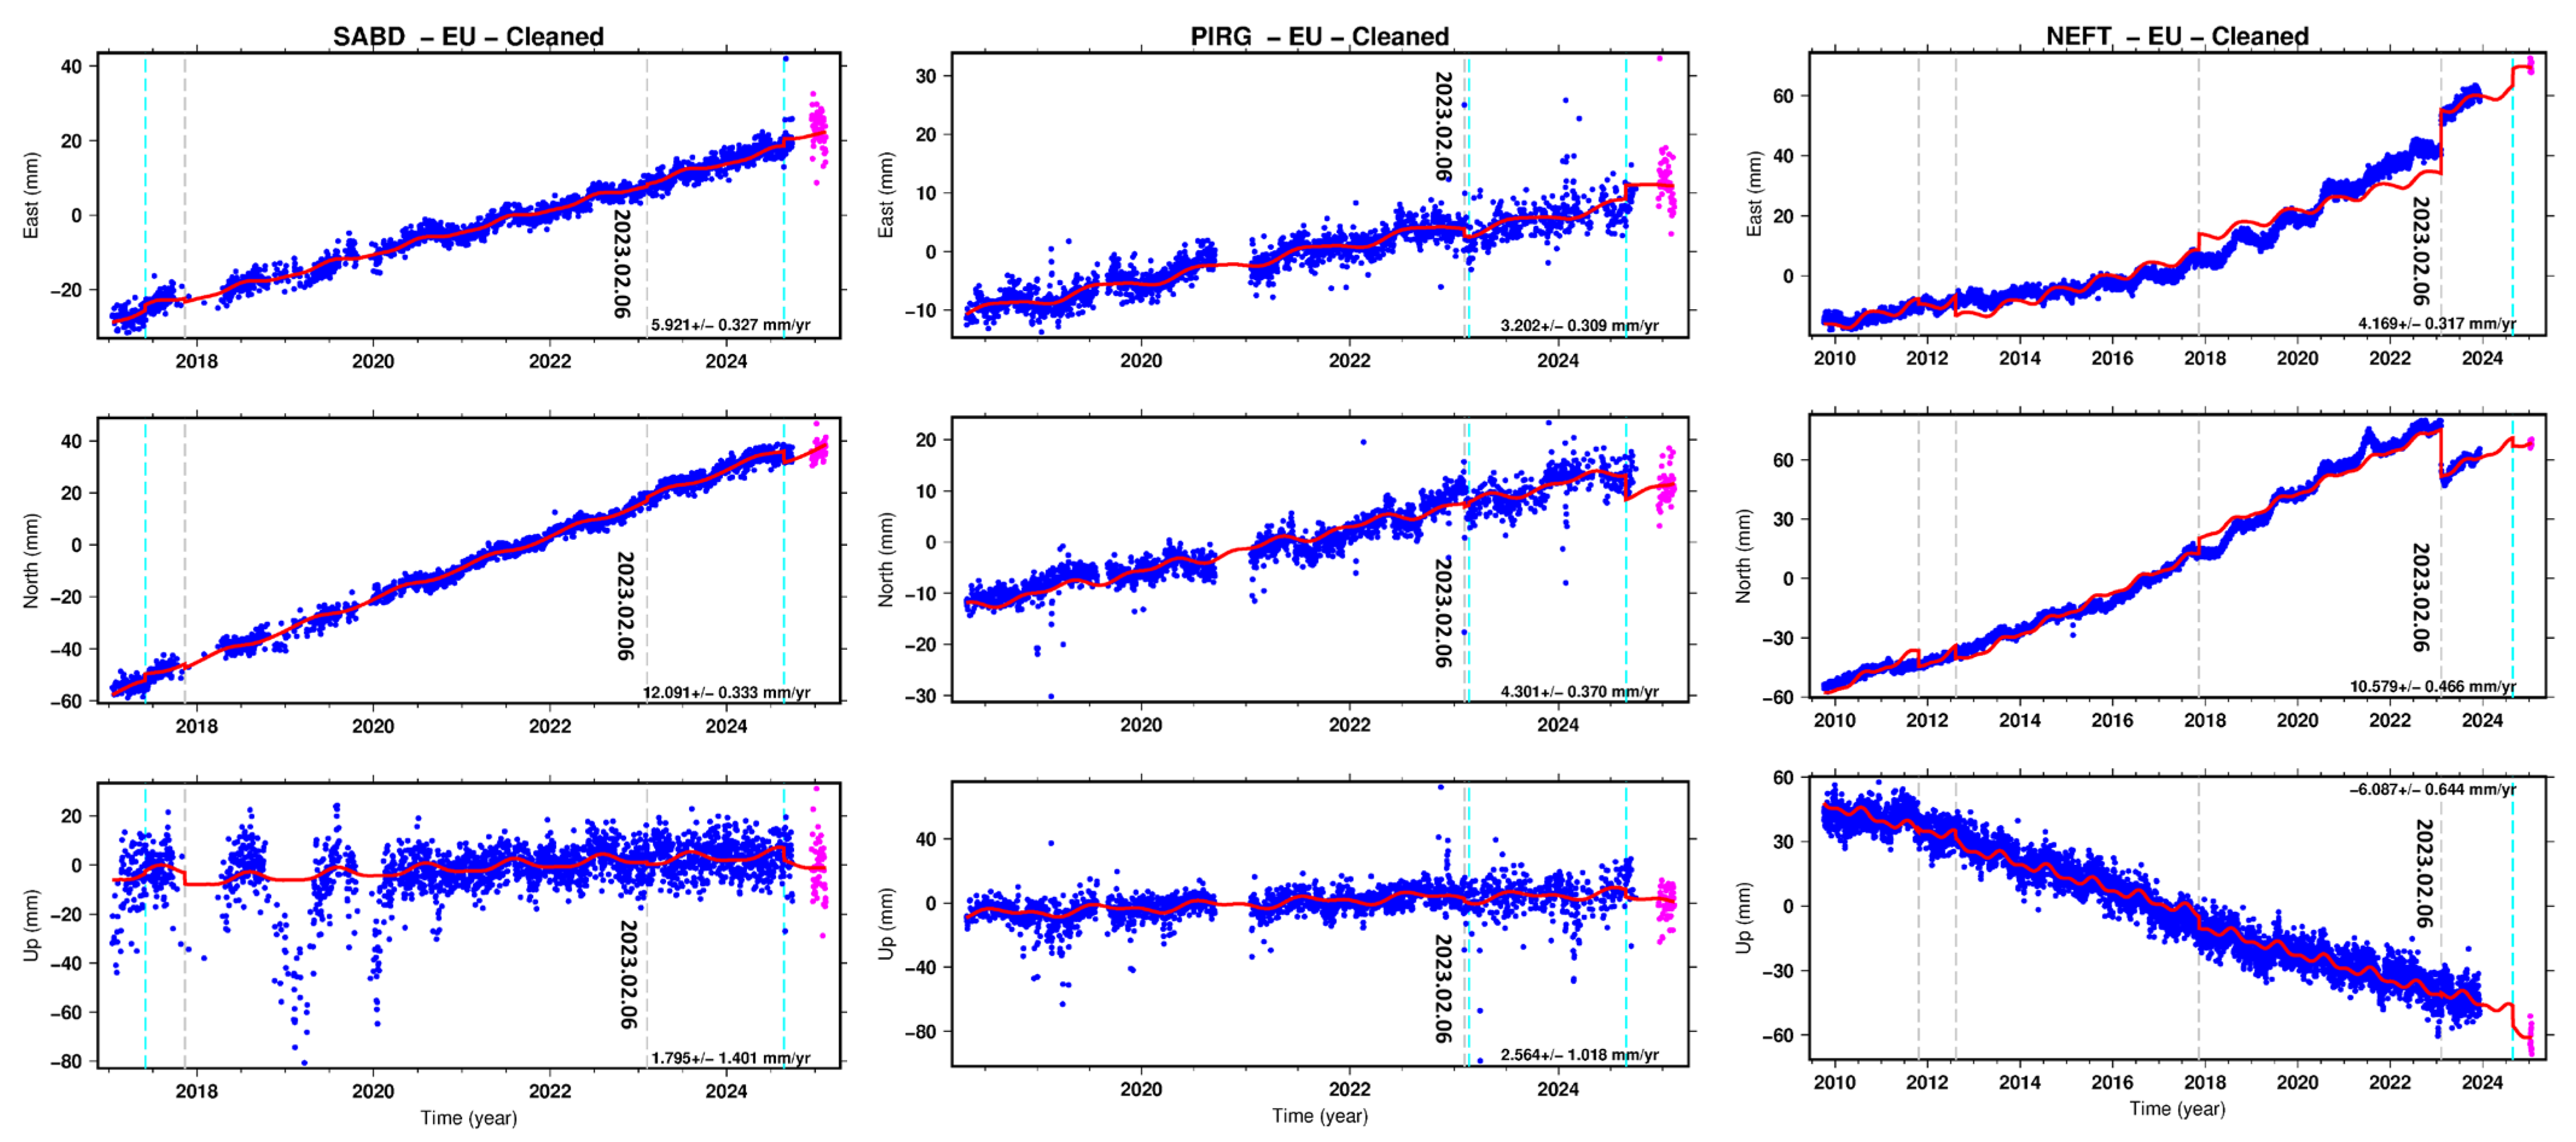
The GNSS daily position data revealed a precise displacement that occurred on the same day as the large Kahramanmaraş seismic event, demonstrating a robust response to the passage of seismic waves (Figure 10). The three continuous GNSS station datasets collected within the study area are additional proof, capturing the dynamic triggering impacts during the February 2023 Kahramanmaraş earthquakes.
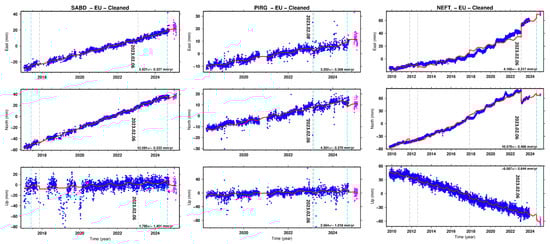
Figure 10.
GNSS time-series data for the SABD, PIRG and NEFT stations in the Eurasian reference frame.
Among the three stations, Pirgulu (PIRG), Neftchala (NEFT), and Sabirabad (SABD) [30,31], Neftchala exhibited the most pronounced reaction, while PIRG also recorded a triggered displacement. These stations are managed by the Institute of Geology and Geophysics under the Ministry of Science and Education of the Republic of Azerbaijan. We used three continuous GNSS datasets from the PIRG, SABD, and NEFT stations to support the InSAR results. The SABD and NEFT stations near the active fault zones recorded considerable horizontal and vertical displacements consistent with the deformation results observed in the InSAR results. This consistency between the two independent datasets validates the InSAR findings and highlights the reliability of combining geodetic techniques for precise deformation monitoring. The GNSS dataset was calculated horizontally and vertically to compare the ground-based measurements with the satellite observations more precisely. This conversion further confirmed that the deformation captured by InSAR accurately reflects ground displacement patterns, especially near active faults. The InSAR displacement with GNSS observations comprehensively evaluated crustal movements. This multisensor technique allows a more robust interpretation of fault activation and surface deformation. Time-series from the NEFT and PIRG stations showed deformation at the time of the seismic event. The NEFT station recorded significantly higher deformation (Figure 10).
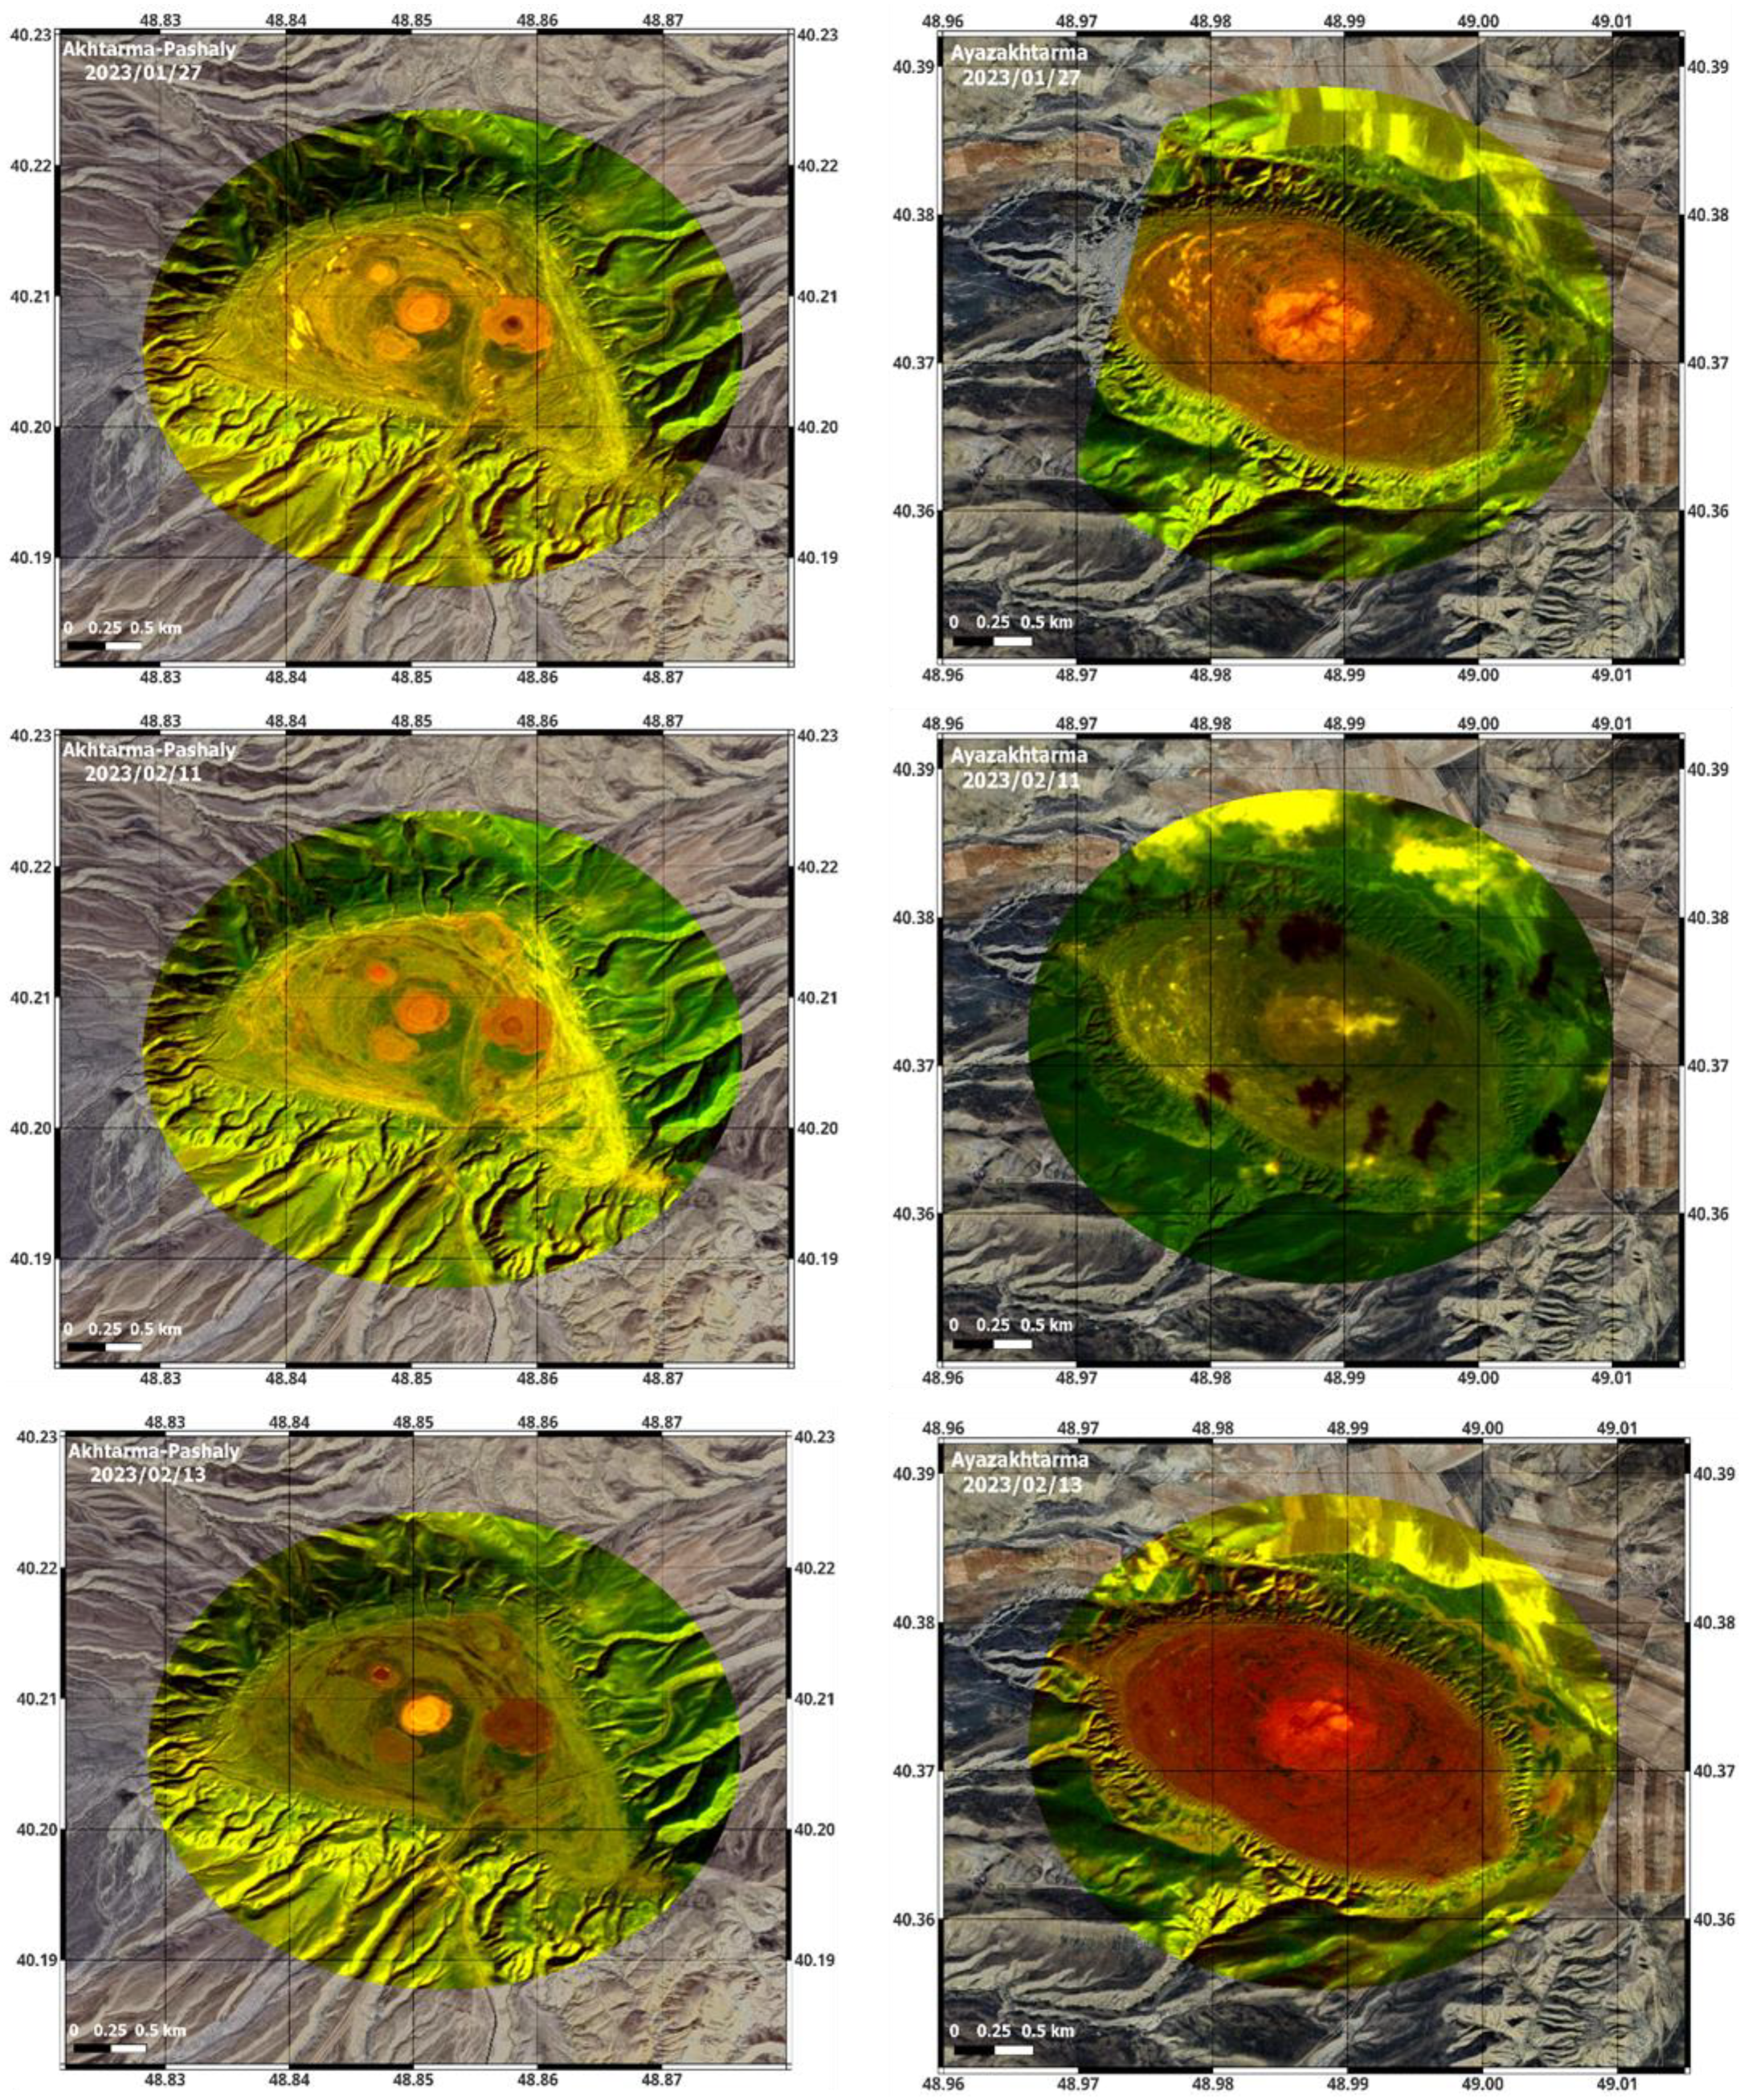
A significant deformation during the seismic event of February 2023 led to substantial changes in the activity of mud volcanoes. The combination of geodetic analyses and high-resolution optical data from PlanetScope (2.5 m resolution, Planet Labs), played a crucial role in providing unique and key insights into the Akhtarma-Pashaly and Ayazakhtarma mud volcanoes (Figure 11), highlighting their sensitivity to the far-field event. For Akhtarma-Pashaly, significant texture differences were observed between 27 January and 13 February 2023. Initially, the surface is stable, with well-defined cones and a relatively uniform distribution of surface features. However, post-earthquake observations on February 13 revealed striking changes, with multiple cones and patches exhibiting signs of active mud presence. The brighter and more concentrated features indicated elevated venting activity or localized mudflows, likely triggered by increased subsurface pressures. These observations indicate the reaction of Akhtarma-Pashaly to seismic energy, with transient stresses likely breaching subsurface seals and mobilizing fluids.
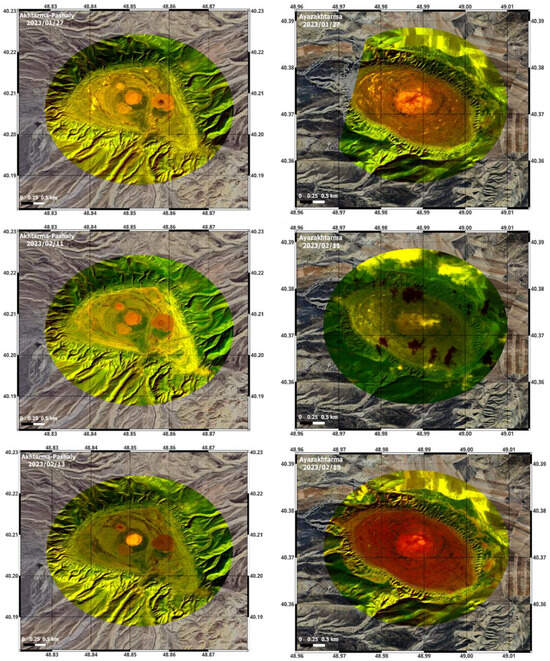
Figure 11.
These maps show changes in the Akhtarma-Pashaly and Ayazakhtarma mud volcanoes before and after the seismic event. They were analyzed using high-resolution PlanetScope optical data (blue- and red-edge band combination). Dark colors show areas of mud and surface moisture.
In contrast, Ayazakhtarma displayed a more diffuse surface response. Although the area was covered by cloud on 11 February, comparisons between 27 January and 13 February revealed significant darkening in the central region. This surface transformation suggests increased moisture levels or minor fluid seepage, potentially caused by subsurface pressure redistribution following the earthquake. Unlike Ayazakhtarma, the changes in Akhtarma-Pashaly were more widespread, indicating a broader adjustment in its subsurface system. These findings suggest variability in how mud volcanoes respond to seismic waves depending on their internal structures and pressure regimes. Our detailed technique, combining high-resolution PlanetScope optical data with InSAR-derived deformation maps and GNSS data, provides a deeper understanding of the surface changes and their correlation with geodetic motions.
We incorporated GNSS horizontal and vertical displacement data from the NEFT, PIRG, and SABD stations to further validate and enhance the spatial interpretation of our InSAR results. These values were plotted over the InSAR-derived horizontal and vertical displacement fields, obtained through the decomposition of ascending and descending tracks. The comparison indicated strong consistency between the GNSS and InSAR results at the SABD, NEFT, and PIRG stations near active fault zones. This cross-validation highlights the complementary strengths of GNSS and InSAR in capturing both local and regional deformation patterns. The ability to follow pre- and post-event situations provided a broad view of the temporal evolution of mud volcano activity. This investigation improves our understanding of mud volcano behavior and delivers valuable insights for future studies and hazard assessments. In Figure 12, the red lines represent the faults activated during the event, as identified in this study. In contrast, the black lines indicate globally recognized active faults mapped by the Global Earthquake Model (GEM) Global Active Faults database [32]. The differences between these datasets underscore the value of InSAR in creating fault maps, particularly in regions where traditional geological surveys may lack accuracy or resolution.
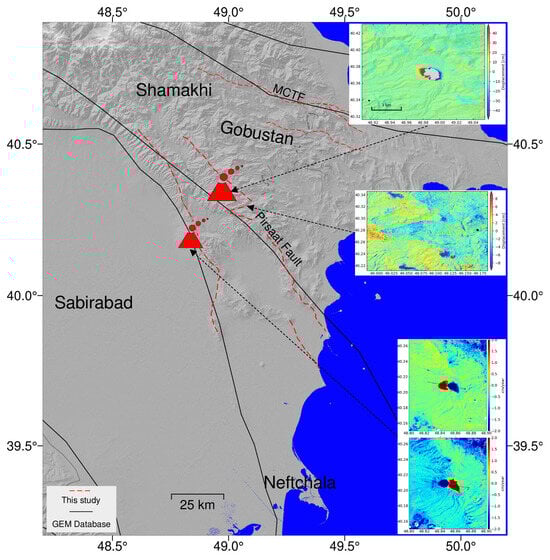
Figure 12.
Observed active faults during the study period (red lines) and Global Active Faults (black line) [32]. Insets show previous figures in the context of a larger area. Red volcano symbols on the map show where the Akhtarma-Pashaly and Ayazkhatarma mud volcanoes are located.
This study confirms the dynamic triggering effects generated by the February 2023 Kahramanmaraş earthquakes, with significant fault activity observed across the study area. Using ascending and descending tracks, we analyzed the reactivated faults. Time-series analysis of the InSAR was used to calculate the mean velocity and co-seismic step function maps were instrumental in recognizing these faults, many of which were either previously unmapped or inaccurately plotted. The ability of InSAR to detect and delineate fault activity with high precision allowed us to plot these reactivated structures effectively. The observed faults provide an understanding of the deformation patterns triggered by the far-field earthquake, a seismic event that occurred at a significant distance from the study area, and highlight the complex interplay between tectonic stress and subsurface dynamics in Azerbaijan.
5. Conclusions
This study provided new insights into the dynamic interaction between seismic activity and geological processes in Azerbaijan, a region characterized by its tectonic complexity and hydrocarbon-rich subsurface systems. Using a long-term InSAR time-series, we determined significant deformation along the faults and mud volcanoes, indicating their sensitivity to far-field seismic events. Previously unmapped or incorrectly delineated faults were detected. The February 2023 Kahramanmaraş earthquakes in Türkiye triggered widespread fault reactivation and mud volcano activity across the region, with co-seismic deformation phase maps capturing high surface displacements and structural changes. The results highlight the dominant role of transient seismic waves in influencing fault dynamics and subsurface processes. Horizontal displacements exceeding 3 cm occurring at the same time as the distant earthquakes provide clear evidence of dynamic triggering. The observed deformation patterns and mud volcano eruptions highlight the interplay between tectonic stress, subsurface fluid pressures, and seismic triggers, advancing our understanding of the geological behavior of hydrocarbon-rich regions. By integrating different geodetic data, this study emphasizes the importance of monitoring sensitive regions like Azerbaijan, where seismic and subsurface dynamics converge. The combination of GNSS, InSAR data, and geodetic techniques validates and completes our results. The strong and consistent agreement between the two datasets confirms the dynamic triggering effects and provides spatial and temporal insight into the fault movement caused by the earthquakes. Significant displacement further underscores the sensitivity of the faults in the region to far-field seismic energy, particularly in areas with pre-existing stress conditions, leaving no doubt about the validity of findings. The results confirm the impact of far-field seismic events and contribute to broader discussions on seismic hazard assessments and the mechanisms driving fault and volcanic activity. This work lays the groundwork for future research to explore the long-term implications of dynamic triggering on tectonic and volcanic systems in similar geological settings.
Author Contributions
Conceptualization, B.A. and E.F.; methodology, B.A.; software, B.A.; validation, B.A., E.F. and F.K.; formal analysis, B.A.; investigation, B.A. and E.F.; resources, E.F.; data curation, B.A. and E.F.; writing—original draft preparation, B.A.; writing—review and editing, B.A., E.F. and F.K.; visualization, B.A.; supervision, E.F.; project administration, E.F.; funding acquisition, E.F. All authors have read and agreed to the published version of the manuscript.
Funding
This research was supported by the Institute of International Education, Fulbright Visiting Scholar Program (2024–2025). Part of this research also was supported by the NASA Earth Surface and Interior focus area.
Data Availability Statement
The original contributions presented in this study are included in the article. Further inquiries can be directed to the corresponding author.
Acknowledgments
In this study, we used GMT6 [33] and QGIS [34] for mapping and visualizations. Part of this research was supported by the NASA Earth Surface and Interior focus area and performed at the Jet Propulsion Laboratory, California Institute of Technology, Pasadena, CA, USA. This study includes copyrighted material of Planet Labs PBC. All rights reserved. This work utilized Planet data made available through the NASA Commercial Satellite Data Acquisition (CSDA) Program. The analysis contains modified Copernicus Sentinel data (2017–2024) processed by the European Space Agency. We sincerely thank the three anonymous reviewers for their helpful comments and productive suggestions, which enhanced the quality of this manuscript. We also thank the editor for their guidance and support throughout the review process.
Conflicts of Interest
The authors declare no conflicts of interest.
References
- Komatsu, G.; Feyzullayev, A.A. Geomorphology of subaerial mud volcanoes in Azerbaijan: Issues about edifice construction and degradation. Geomorphology 2024, 463, 109352. [Google Scholar] [CrossRef]
- Mellors, R.; Kilb, D.; Aliyev, A.; Gasanov, A.; Yetirmishli, G. Correlations between earthquakes and large mud volcano eruptions. J. Geophys. Res. Solid Earth 2007, 112, B4. [Google Scholar] [CrossRef]
- Ahadov, B.G.; Kadirov, F.A. Insar analysis of the Ayazakhtarma mud volcano and its response to the 2021 Shamakhi earthquake: Understanding seismo-volcanic interactions. SOCAR Proc. 2023, 4, 7–12. [Google Scholar] [CrossRef]
- Aliyev, A.A.; Guliyev, I.S.; Rakhmanov, R.R. Catalogue of Mud Volcanoes Eruptions of Azerbaijan: 1810–2007; Nafta-Press: Baku, Azerbaijan, 2009; 110p. [Google Scholar]
- Ahadov, B.; Jin, S. Slip Rates and Seismic Potential along Main Faults in the Eastern Mediterranean and Caucasus from dense GPS Observations and Seismic Data. Pure Appl. Geophys. 2021, 178, 39–54. [Google Scholar] [CrossRef]
- Ahadov, B.; Jin, S. Present-day kinematics in the Eastern Mediterranean and Caucasus from dense GPS observations. Phys. Earth Planet. Inter. 2017, 268, 54–64. [Google Scholar] [CrossRef]
- Kadrov, F.; Yetirmishli, G.; Safarov, R.; Mammadov, S.; Kazimov, I.; Floyd, M.; Reilinger, R.; King, R. Results from 25 years (1998–2022) of crustal deformation monitoring inAzerbaijan and adjacent territory using GPS. ANAS Trans. Earth Sci. 2024, 1, 28–43. [Google Scholar] [CrossRef]
- Odonne, F.; Imbert, P.; Remy, D.; Gabalda, G.; Aliyev, A.A.; Abbasov, O.R.; Baloglanov, E.E.; Bichaud, V.; Juste, R.; Dupuis, M.; et al. Surface structure, activity and microgravimetry modeling delineate contrasted mud chamber types below flat and conical mud volcanoes from Azerbaijan. Mar. Pet. Geol. 2021, 134, 105315. [Google Scholar] [CrossRef]
- Kopf, A.J. Significance of mud volcanism. Rev. Geophys. 2002, 40, 2-1–2-52. [Google Scholar] [CrossRef]
- Fyfe, W.S. Fluids in the Earth’s Crust: Their Significance in Metamorphic, Tectonic and Chemical Transport; Elsevier: Amsterdam, The Netherlands, 1978; p. 383. [Google Scholar]
- Bonini, M.; Mazzarini, F. Mud volcanoes as potential indicators of regional stress and pressurized layer depth. Tectonophysics 2010, 494, 32–47. [Google Scholar] [CrossRef]
- Ergintav, S.; Vernant, P.; Tan, O.; Karabulut, H.; Özarpacı, S.; Floyd, M.; Konca, A.Ö.; Çakır, Z.; Acarel, D.; Çakmak, R.; et al. Unexpected far-field deformation of the 2023 Kahramanmaraş earthquakes revealed by space geodesy. Science 2024, 386, 328–335. [Google Scholar] [CrossRef]
- Felzer, K.R.; Becker, T.W.; Abercrombie, R.E.; Ekström, G.; Rice, J.R. Triggering of the 1999 Mw 7.1 Hector Mine earthquake by aftershocks of the 1992 Mw 7.3 Landers earthquake. J. Geophys. Res. Solid Earth 2002, 107, ESE-6. [Google Scholar] [CrossRef]
- King, G.C.P.; Stein, R.S.; Lin, J. Static stress changes and the triggering of earthquakes. Bull. Seismol. Soc. Am. 1994, 84, 935–953. [Google Scholar]
- Stein, R.S.; King, G.C.P.; Lin, J. Stress triggering of the 1994 M=6.7 Northridge, California, earthquake by its predecessors. Science 1994, 265, 1432–1435. [Google Scholar] [CrossRef]
- Van Der Elst, N.J.; Brodsky, E.E. Connecting near-field and far-field earthquake triggering to dynamic strain. J. Geophys. Res. Solid Earth 2010, 115, B7. [Google Scholar] [CrossRef]
- Massonnet, D.; Feigl, K.L. Radar interferometry and its application to changes in the Earth’s surface. Rev. Geophys. 1998, 36, 441–500. [Google Scholar] [CrossRef]
- Burgmann, R.; Rosen, P.A.; Fielding, E.J. Synthetic aperture radar interferometry to measure earth’s surface topography and its deformation. Annu. Rev. Earth Planet. Sci. 2000, 28, 169–209. [Google Scholar] [CrossRef]
- Fielding, E.J.; Liu, Z.; Stephenson, O.L.; Zhong, M.; Liang, C.; Moore, A.; Yun, S.H.; Simons, M. Surface deformation related to the 2019 Mw 7.1 and 6.4 Ridgecrest earthquakes in California from GPS, SAR interferometry, and SAR pixel offsets. Seismol. Res. Lett. 2020, 91, 2035–2046. [Google Scholar] [CrossRef]
- Rosen, P.A.; Hensley, S.; Joughin, I.; Li, F.; Madsen, S.; Rodríguez, E.; Goldstein, R. Synthetic Aperture Radar Interferometry. Proc. IEEE 2012, 88, 333–382. [Google Scholar] [CrossRef]
- Berardino, P.; Fornaro, G.; Lanari, R.; Sansosti, E. A new algorithm for surface deformation monitoring based on small baseline differential SAR interferograms. IEEE Trans. Geosci. Remote Sens. 2002, 40, 2375–2383. [Google Scholar] [CrossRef]
- Yunjun, Z.; Fattahi, H.; Amelung, F. Small baseline InSAR time series analysis: Unwrapping error correction and noise reduction. Comput. Geosci. 2019, 133, 104331. [Google Scholar] [CrossRef]
- Jolivet, R.; Agram, P.S.; Lin, N.Y.; Simons, M.; Doin, M.; Peltzer, G.; Li, Z. Improving InSAR geodesy using Global Atmospheric Models. J. Geophys. Res. Solid Earth 2014, 119, 2324–2341. [Google Scholar] [CrossRef]
- Kobrick, M.; Crippen, R. SRTMGL1: NASA Shuttle Radar Topography Mission Global 1 Arc Second V003; NASA EOSDIS Land Processes DAAC; USGS Earth Resources Observation and Science (EROS) Center: Sioux Falls, SD, USA, 2013. [Google Scholar]
- Hill, D.P.; Reasenberg, P.A.; Michael, A.; Arabaz, W.J.; Beroza, G.; Brumbaugh, D.; Brune, J.N.; Castro, R.; Davis, S.; Depolo, D.; et al. Seismicity remotely triggered by the magnitude 7.3 Landers, California, earthquake. Science 1993, 260, 1617–1623. [Google Scholar] [CrossRef]
- Brodsky, E.E.; Karakostas, V.; Kanamori, H. A new observation of dynamically triggered regional seismicity: Earthquakes in Greece following the August 1999 Izmit, Turkey earthquake. Geophys. Res. Lett. 2000, 27, 2741–2744. [Google Scholar] [CrossRef]
- Freed, A.M. Earthquake triggering by static, dynamic, and postseismic stress transfer. Annu. Rev. Earth Planet. Sci. 2005, 33, 335–367. [Google Scholar] [CrossRef]
- Iio, K.; Furuya, M. Surface deformation and source modeling of Ayaz-Akhtarma mud volcano, Azerbaijan, as detected by ALOS/ALOS-2 InSAR. Prog. Earth Planet. Sci. 2018, 5, 61. [Google Scholar] [CrossRef]
- Manga, M.; Brumm, M.; Rudolph, M.L. Earthquake triggering of mud volcanoes. Mar. Pet. Geol. 2009, 26, 1785–1798. [Google Scholar] [CrossRef]
- Kadirov, F.; Mammadov, S.; Reilinger, R.; McClusky, S. Some new data on modern tectonic deformation and active faulting in Azerbaijan (according to Global Positioning System measurements). Proc. Azerbaijan Natl. Acad. Sci. Sci. Earth 2008, 1, 82–88. [Google Scholar]
- Blewitt, G.; Hammond, W.; Kreemer, C. Harnessing the GPS data explosion for interdisciplinary science. Eos 2018, 99, e2020943118. [Google Scholar] [CrossRef]
- Styron, R.; Pagani, M. The GEM Global Active Faults Database. Earthq. Spectra 2020, 36, 160–180. [Google Scholar] [CrossRef]
- Wessel, P.; Luis, J.F.; Uieda, L.; Scharroo, R.; Wobbe, F.; Smith WH, F.; Tian, D. The Generic Mapping Tools Version 6. Geochem. Geophys. Geosyst. 2019, 20, 5556–5564. [Google Scholar] [CrossRef]
- QGIS Development Team. QGIS Geographic Information System. Open Source Geospatial Foundation Project. 2023. Available online: http://qgis.osgeo.org (accessed on 15 October 2024).


Disclaimer/Publisher’s Note: The statements, opinions and data contained in all publications are solely those of the individual author(s) and contributor(s) and not of MDPI and/or the editor(s). MDPI and/or the editor(s) disclaim responsibility for any injury to people or property resulting from any ideas, methods, instructions or products referred to in the content. |
© 2025 by the authors. Licensee MDPI, Basel, Switzerland. This article is an open access article distributed under the terms and conditions of the Creative Commons Attribution (CC BY) license (https://creativecommons.org/licenses/by/4.0/).