Article

A Cross-Estimation Method for Spaceborne Synthetic Aperture Radar Range Antenna Pattern Using Pseudo-Invariant Natural Scenes

1
Aerospace Information Research Institute, Chinese Academy of Sciences, Beijing 100094, China
2
Key Laboratory of Target Cognition and Application Technology (TCAT), Aerospace Information Research Institute, Chinese Academy of Sciences, Beijing 100190, China
3
School of Electronic, Electrical and Communication Engineering, University of Chinese Academy of Sciences, Beijing 101408, China
4
Key Laboratory of Technology in Geo-Spatial Information Processing and Application System, Aerospace Information Research Institute, Chinese Academy of Sciences, Beijing 100190, China
5
College of Information Science and Technology, Beijing University of Chemical Technology, Beijing 100029, China
*
Author to whom correspondence should be addressed.
Remote Sens. 2025, 17(8), 1459; https://doi.org/10.3390/rs17081459
Submission received: 3 March 2025 / Revised: 7 April 2025 / Accepted: 17 April 2025 / Published: 19 April 2025
(This article belongs to the Section Engineering Remote Sensing)

Abstract

:
The estimation and correction of antenna patterns are essential for ensuring the relative radiometric quality of SAR images. Traditional methods for antenna pattern estimation rely on artificial calibrators or specific stable natural scenes like the Amazon rainforest, which are limited by cost, complexity, and geographic constraints, making them unsuitable for frequent imaging demands. Meanwhile, general natural scenes are imaged frequently using SAR systems, but their true scattering characteristics are unknown, posing a challenge for direct antenna pattern estimation. Therefore, it is considered to use the calibrated SAR to obtain the scattering characteristics of these general scenarios; that is, introducing the concept of cross-calibration. Accordingly, this paper proposes a novel method for estimating the SAR range antenna pattern based on cross-calibration. The method addresses three key challenges: (1) Identifying pseudo-invariant natural scenes suitable as reference targets through spatial uniformity and temporal stability assessments using standard deviation and amplitude correlation analyses; (2) Achieving pixel-level registration of heterogeneous SAR images with an iterative method despite radiometric imbalances; (3) Extracting stable power values by segmenting images and applying differential screening to minimize outlier effects. The proposed method is validated using Gaofen-3 SAR data and shows robust performance in bare soil, grassland, and forest scenarios. Comparing the results of the proposed method with the tropical forest-based calibration method, the maximum shape deviation between the range antenna patterns of the two methods is less than 0.2 dB.

1. Introduction

Synthetic aperture radar (SAR) operates by sending radar signals from an antenna to the Earth’s surface and receiving the reflected signals, enabling high-resolution imaging regardless of weather or lighting conditions. The SAR antenna pattern refers to the radiation characteristics of the SAR antenna as a function of range or azimuth direction [1]. The energy radiated by the antenna decreases as the angle increases from the center of the main lobe. This characteristic is a crucial aspect of the antenna pattern and is typically evaluated through rigorous pre-launch testing, followed by corrections made during the SAR imaging process. However, the actual performance of the SAR antenna in space may deviate from pre-launch measurements due to various factors, including mechanical deformation, thermal conditions, and changes in the satellite’s orbit [2,3,4]. Therefore, there is a need to estimate the antenna pattern in orbit to correct for these effects and maintain optimal radar performance [5].
The SAR antenna pattern encompasses both the range and azimuth antenna patterns [1]. In SAR imaging modes such as Stripmap and ScanSAR, the gain effect of the antenna pattern in the azimuth direction accumulates as the SAR sensor moves. Consequently, the gain introduced by the antenna pattern in this direction remains constant in the SAR image, and there are only small relative radiation changes in the azimuth direction. However, the antenna pattern in the range direction has significant gain variations along the range direction. SAR images with uncorrected range antenna patterns display a pronounced relative radiation imbalance, which negatively impacts the radiometric quality of the images and their associated applications.
Traditional range antenna pattern estimation methods rely on artificial calibrators or specific natural scenes such as the Amazon rainforest. These approaches are constrained by cost, complexity, and geographic conditions, while also consuming substantial satellite resources, making them unsuitable for frequent imaging demands. In contrast, SAR systems frequently image general natural scenes, but the true scattering characteristics of these scenes remain unknown. A novel cross-calibration approach leverages other calibrated SAR satellites to derive the scattering characteristics of general targets, which are then used as the “true value” required for calibrating the uncalibrated SAR satellite. The cross-calibration method has been applied by researchers to SAR absolute radiometric calibration. Based on the above, this paper proposes a novel SAR range antenna pattern estimation method based on cross-calibration.
Due to differences between relative and absolute radiometric calibration and variations in imaging principles, existing cross-calibration methods cannot be directly applied to antenna pattern estimation. This presents three key challenges that need to be addressed:
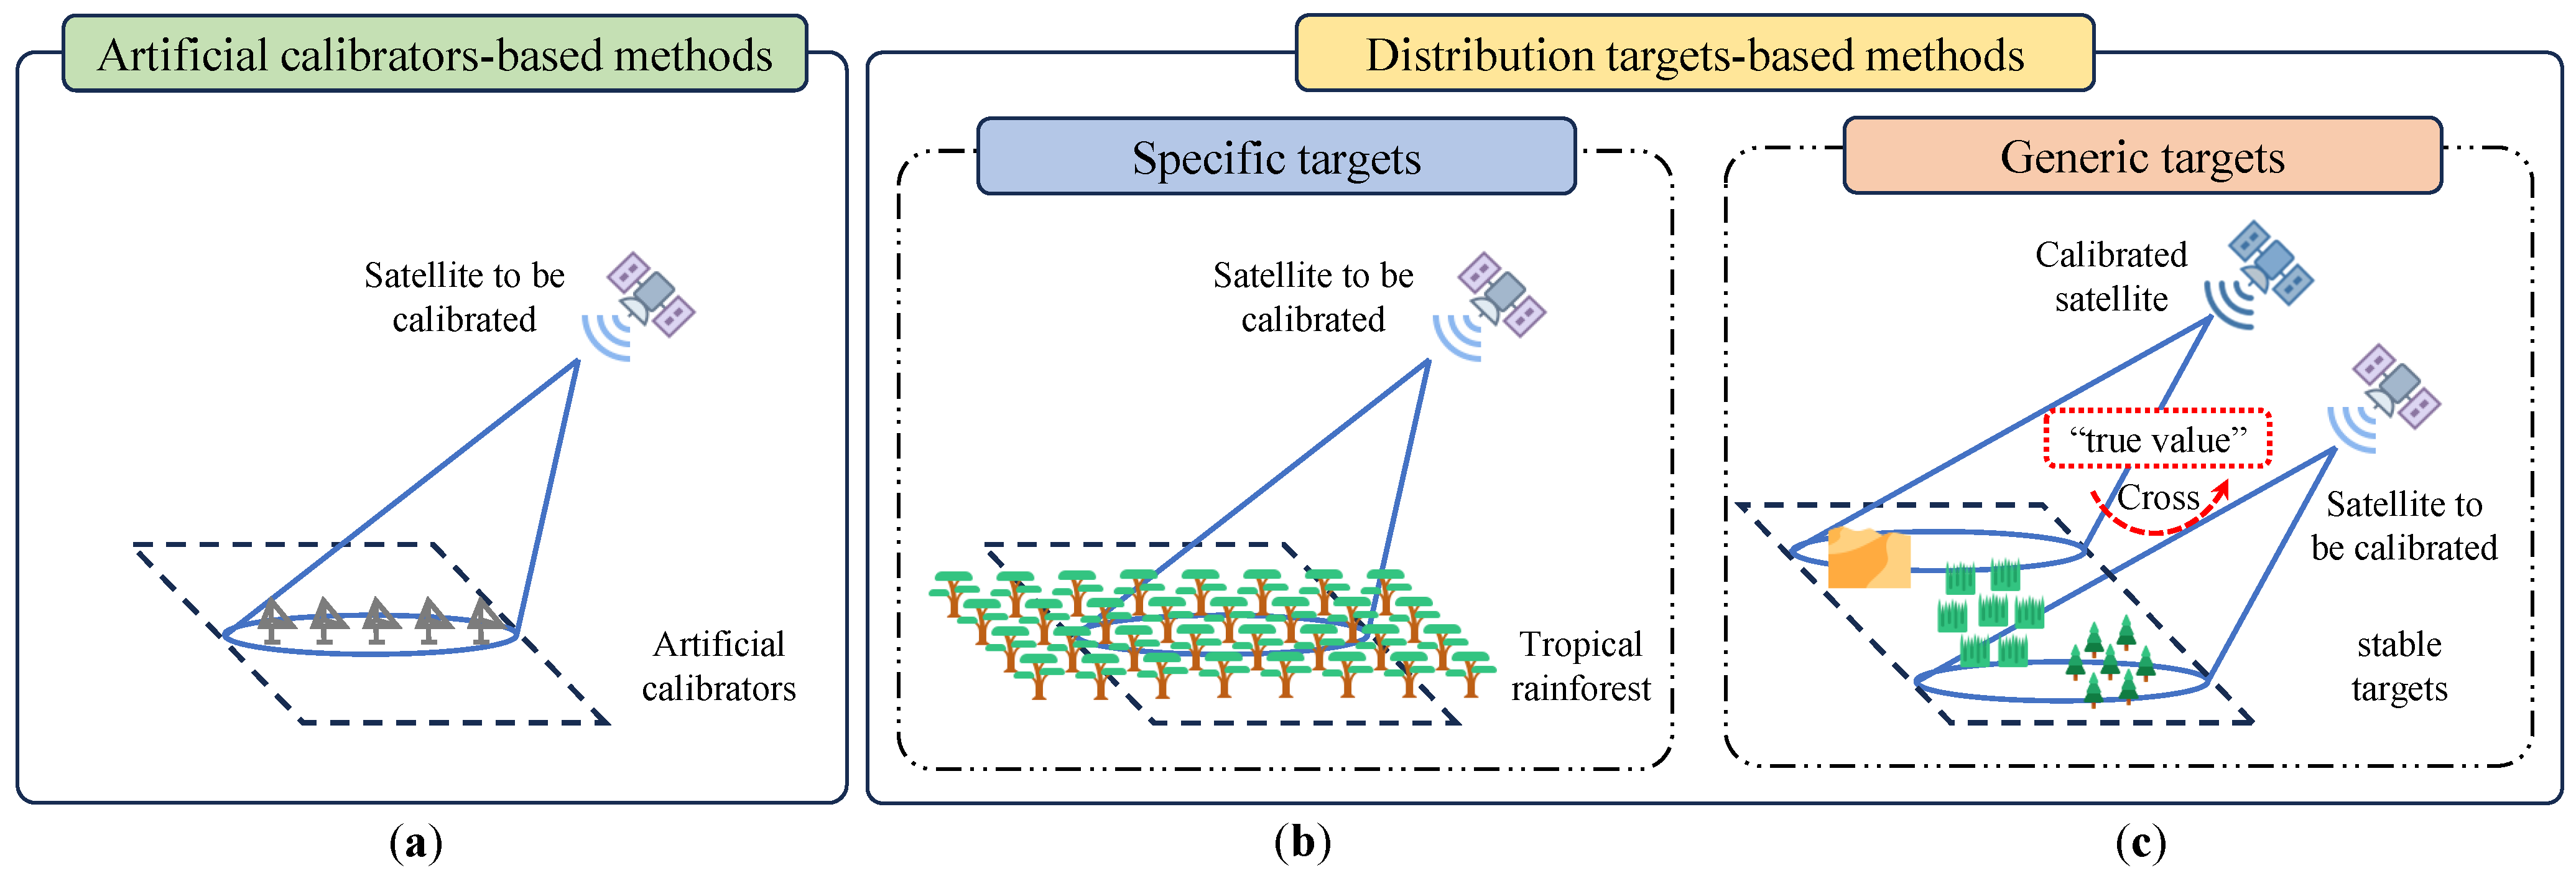
  • Selection of Stable Reference Targets: To ensure that the backscattering values derived from calibrated SAR images can be used as reference values for the uncalibrated SAR images, the reference targets need to satisfy two criteria. The first is temporal stability, which ensures the consistency of the overpass times of the two SAR satellites. The second is spatial stability, which aims to minimize the influence of registration errors following image alignment [6]. This study proposes a method for selecting reference targets for relative radiometric cross-calibration, assessing spatial uniformity and stability using standard deviations, and evaluating temporal stability through amplitude correlation between the two SAR images. Targets that meet both criteria are selected as reference targets.
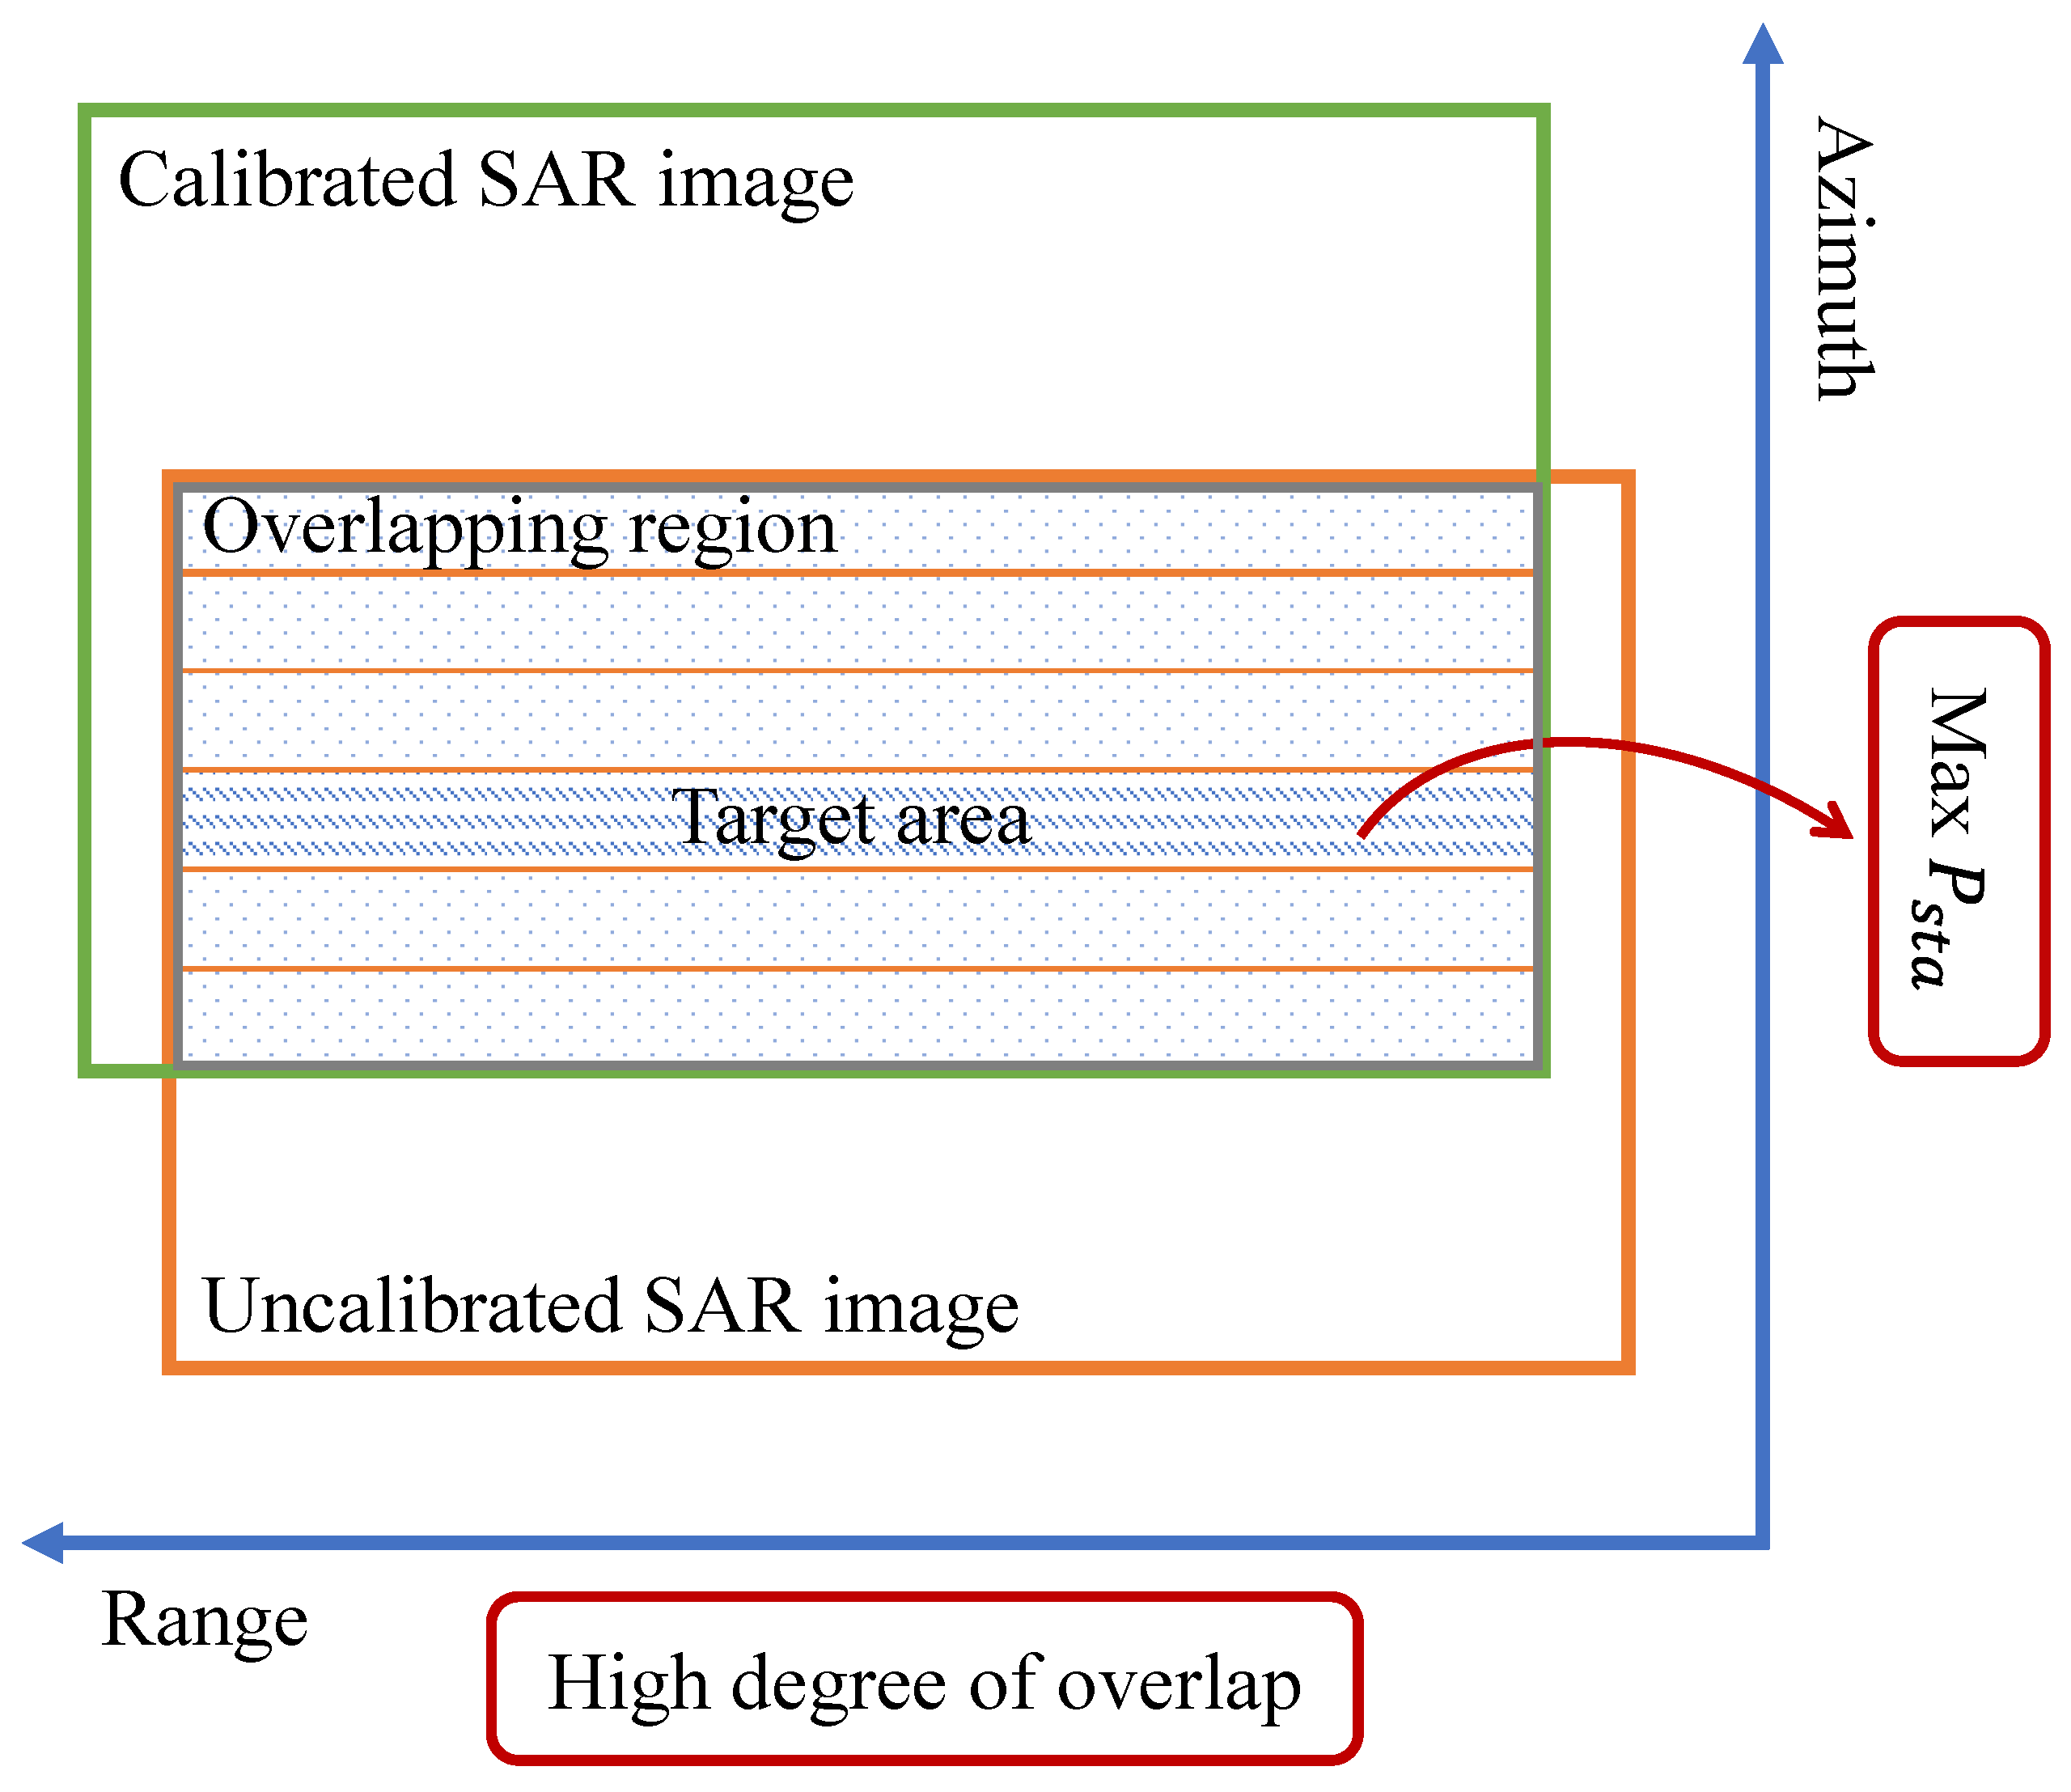
  • Registration of Heterogeneous SAR Images: Uncalibrated satellite images exhibit amplitude imbalances in the range direction compared to calibrated images [7,8]. Classic image registration methods cannot achieve accurate alignment in this context. This study proposes a refined registration method based on iterative estimation, which uses the coarse estimated antenna pattern to minimize the impact of amplitude imbalance in uncalibrated images on registration. The uncalibrated antenna pattern gain is obtained by calculating the average power of each range direction in the overlapping area of the two satellite images, and a coarse estimate of the antenna pattern is fitted. The maximum correlation coefficient method is then used to achieve pixel-level registration between the calibrated satellite image and the uncalibrated satellite image, which has been compensated using the coarse estimated antenna pattern. A more accurate estimation of the range-direction antenna pattern is achieved using precisely registered images.
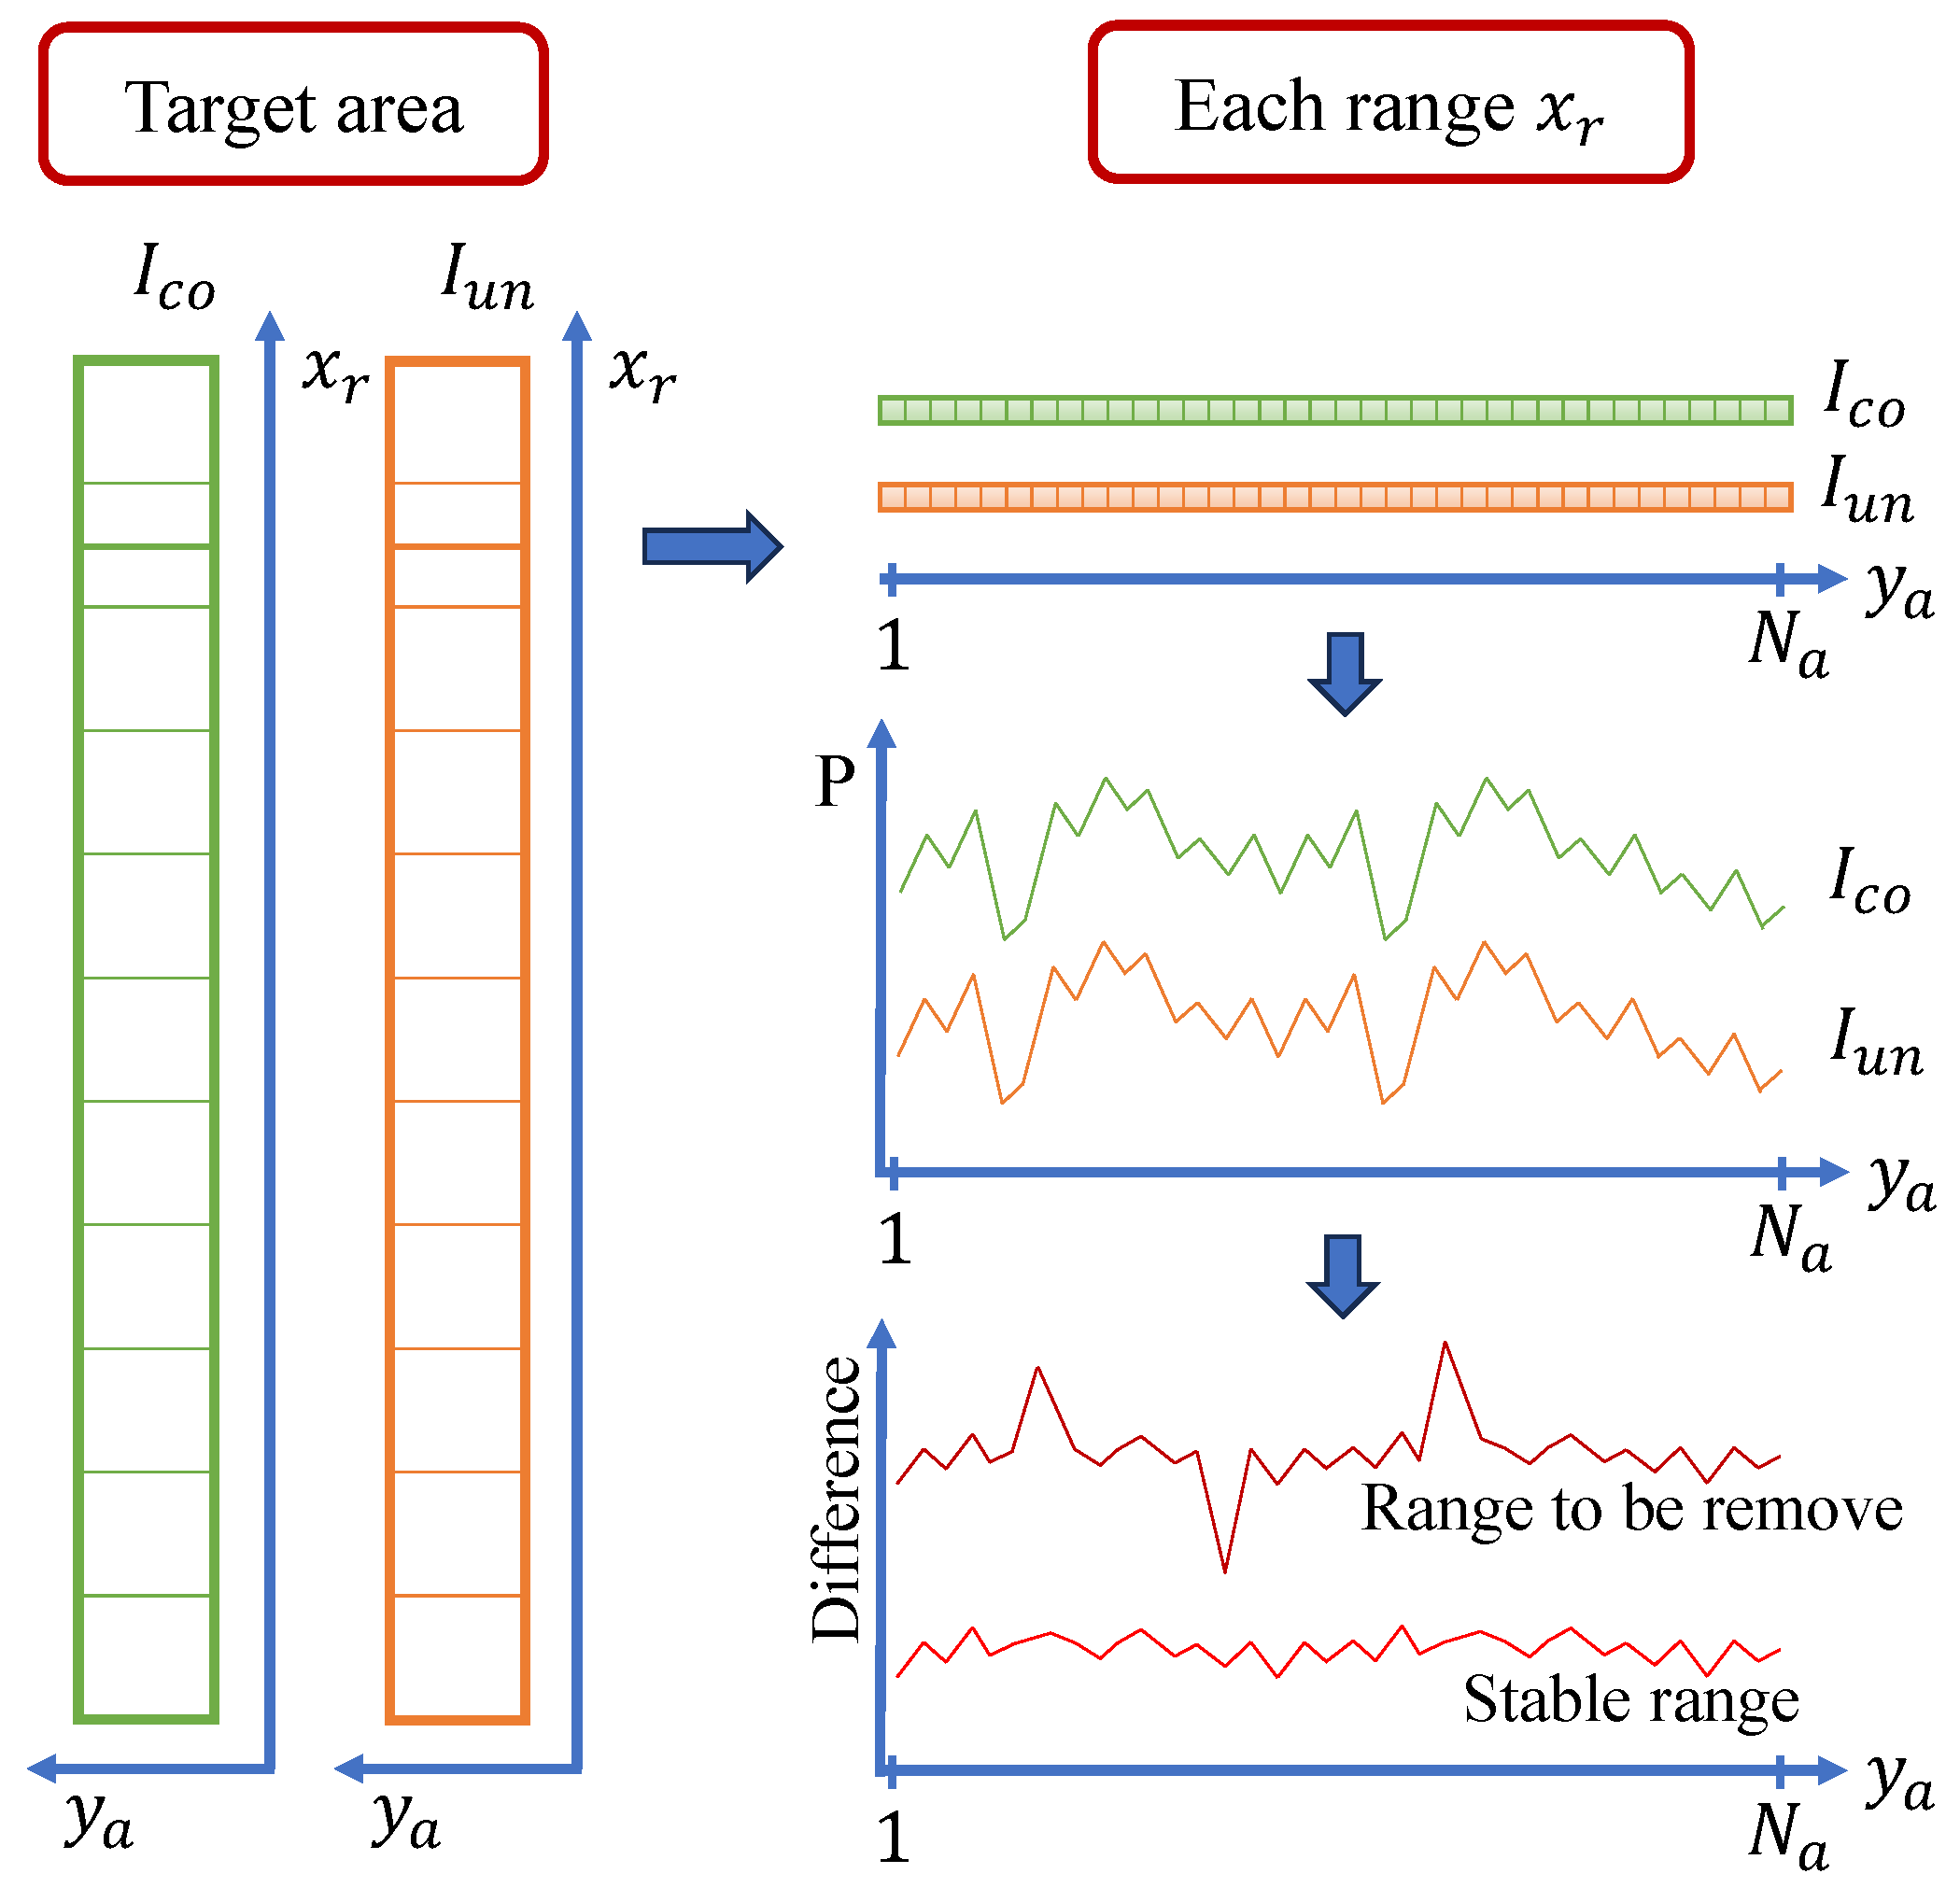
  • Extraction of Range-Direction Stable Power: SAR relative radiometric calibration requires calibrating the non-uniform gain variations caused by the antenna pattern. Sufficient sampling across the entire range direction is needed for accurate estimation while avoiding interference from strong noise and other outliers. Current SAR absolute radiometric cross-calibration methods use artificial stable targets [9] or stable points from homogeneous natural surfaces [10], but these stable points only provide limited range sampling. This study proposes a method for extracting stable power to support cross-estimating range antenna patterns. The standard deviation of power differences for corresponding pixels in the two images is calculated for each range, and the images are segmented into multiple subsets along the range direction. Range power values with relatively low standard deviations are selected within each subset, and the mean power of these values is taken as the stable power.
In summary, the main contributions of this paper are as follows:
  • A method for selecting target regions for cross-estimating antenna patterns is proposed, identifying temporally and spatially stable targets as calibration scenes for SAR range antenna pattern cross-estimation. This method addresses the issue of the current lack of reference target selection methods for antenna pattern estimation.
  • A method for fine registration of heterogeneous SAR images based on iterative estimation is proposed, enabling pixel-level alignment of the reference SAR image and the uncalibrated SAR image in the cross-estimation of range antenna patterns. This approach addresses the significant amplitude differences between two SAR satellites caused by radiometric imbalance in the uncalibrated satellite, thereby facilitating precise image registration.
  • A method for extracting stable power in the range direction based on difference screening is presented, significantly reducing the impact of outliers in SAR images while ensuring sufficient sampling across the entire range. This approach achieves accurate extraction of stable power values, improving the accuracy of antenna pattern fitting.
The remainder of this paper is organized as follows: Section 2 provides a review of related work on range antenna pattern estimation methods and cross-calibration techniques. Section 3 describes the derivation and overall process of the SAR range antenna pattern cross-estimation method, with detailed descriptions of each step. Section 4 presents experimental results validating the proposed method using Gaofen-3 SAR data. Finally, Section 5 summarizes this paper’s findings.

2. Related Work

Current methods for estimating the range antenna pattern primarily fall into two categories: those based on artificial calibrators [11,12,13,14] and those utilizing distributed targets like tropical rainforests [15,16,17,18,19,20,21,22,23]. The artificial calibrator approach involves positioning a series of calibrators within a designated calibration site in the range direction. Subsequently, the gain of the antenna pattern at each calibrator’s location in the SAR image is calculated. The antenna pattern gain at each calibrator’s location in the SAR image is then computed. These gains are subsequently used to fit and derive the range antenna pattern, as illustrated in Figure 1a. However, this method is both costly and complex due to the high expense of the calibrators and the intricate deployment process. Additionally, since the calibrators must be positioned in suitable calibration sites, the method is constrained by the availability and location of such areas. The tropical rainforest method, on the other hand, involves using a SAR satellite to illuminate rainforest regions known for their uniform and stable scattering characteristics, as illustrated in Figure 1b. By extracting gain variations along the range direction from the acquired images, the range antenna pattern can be derived through fitting [15]. Studies on the Amazon rainforest have demonstrated that the scattering characteristics in these areas are highly uniform and stable, allowing for relative radiometric calibration accuracy within 0.3 dB [18]. However, this method relies heavily on rainforest regions with optimal scattering properties. Clearly, the application of this method is precluded for SAR satellite systems that lack operational coverage over rainforest areas. Furthermore, increasing human activities in recent years have contributed to the degradation of rainforest environments, reducing available tropical rainforest areas for calibration purposes.
Compared with traditional artificial calibrator methods, the tropical rainforest approach demonstrates significant advantages in reducing both human and material costs. However, this method remains dependent on SAR satellite acquisitions over specific rainforest regions, inevitably resulting in additional consumption of satellite resources. Given the scarcity and high value of SAR satellite imaging resources, this requirement presents a particularly significant challenge. Contemporary SAR satellite systems are typically equipped with multiple imaging modes, and implementing calibration procedures for each mode would exacerbate the strain on satellite resources. More critically, the utilization of rainforests for routine antenna pattern monitoring would inevitably lead to substantial satellite resource consumption, a pressing issue that demands immediate attention and resolution.
In summary, the current range antenna pattern estimation methods, which rely on artificial calibrators or specific stable natural scenes such as the Amazon tropical rainforests, are constrained by their limited availability. The estimation process necessitates high-frequency SAR imaging of reference targets to ensure accuracy. In fact, uncalibrated SAR frequently images general natural scenes, which are very good reference targets [10,24,25]. However, these scenes do not have known scattering characteristics like artificial calibration targets or the Amazon rainforest. A novel and promising approach is to utilize other SAR satellites that have already undergone precise calibration to derive the scattering characteristics of these general targets, which can then serve as ground truth for calibrating the range antenna pattern. This process is referred to as cross-calibration.
Cross-calibration is a calibration method that employs a precisely calibrated satellite to calibrate a to-be-calibrated satellite [26,27,28,29,30]. Specifically, it utilizes physical information extracted from the calibrated satellite’s images as ’truth values’ to calibrate the uncalibrated satellite, thereby reducing the reliance on artificial calibrators and tropical rainforests. Cross-calibration techniques have been extensively applied to optical satellites [31], leading to the development of several classical optical cross-calibration methods, such as the Synchronous Nadir Overpass (SNO) method [32], the statistical mutual calibration method [33], and the double-difference method [34]. Scholars have also explored absolute radiometric cross-calibration in the SAR domain. In 1993, Zink et al. [35] conducted absolute radiometric calibration experiments using NASA/JPL DC-8 SAR C-band data and DLR E-SAR C-band data collected at the Oberpfaffenhofen calibration site, demonstrating the feasibility of absolute radiometric cross-calibration between different airborne SAR sensors. In 2004, Zaharoff et al. [9] conducted cross-calibration of ERS SAR and ENVISAT ASAR, employing a parabolic antenna to compare the radiometric stability of both systems. In recent years, SAR cross-calibration research has advanced significantly. In 2022, Zhou et al. [10] proposed an absolute radiometric cross-calibration method for spaceborne SAR based on general natural distributed targets, employing time-series stability analysis to select stable targets for absolute radiometric cross-calibration. In 2024, Zhou et al. [36] proposed a polarimetric SAR cross-calibration method based on stable distribution targets, utilizing calibrated polarimetric SAR data as true scattering values to estimate copolarization imbalance in the phase and amplitude of uncalibrated polarimetric SAR data. Zhou et al. [37] also improved the SAR radiometric cross-calibration method based on scene-driven incidence angle difference correction and weighted regression. However, current research has primarily focused on absolute radiometric cross-calibration, with little investigation into the cross-estimation of SAR antenna patterns.
Based on cross-calibration techniques, this paper presents a novel method for cross-estimating range antenna patterns, as illustrated in Figure 1c. This approach addresses the limitations of relying on artificial calibrators and tropical rainforests, enabling frequent estimation of range antenna patterns for spaceborne SAR systems. A comparison between the proposed method, the artificial calibrator method, and the tropical rainforest method is presented in Table 1.

3. Methodology

A cross-estimation model for range antenna pattern gain is derived based on radar operating principles. This paper proposes a cross-estimation method for the range antenna pattern of spaceborne SAR based on ubiquitous natural distributed targets. The proposed method comprises five key components: target area selection, fine image registration, stable power extraction and gain calculation, antenna pattern fitting, and antenna pattern correction.

3.1. Cross-Estimation Model

This paper focuses on estimating the antenna pattern in the range direction. The core of the cross-estimation method is the cross-estimation model for range antenna pattern gain, which involves calculating stable power values for each range in the uncalibrated SAR image and the corresponding stable power values in the calibrated SAR image. The range antenna pattern gain is obtained after compensating for a constant gain that does not vary with the elevation angle. The equation for the model is expressed as follows:
G u n 2 ( θ e l u n ) = P r u n ( θ e l u n ) P r c o ( θ e l c o ) · σ c o ( θ e l c o ) σ u n ( θ e l u n ) · A 1
where θ e l u n and θ e l c o represent the elevation angles of the uncalibrated and calibrated SAR, respectively, for the same ground target. G u n 2 denotes the antenna pattern gain of the uncalibrated SAR. P r u n and σ u n are the received power of the uncalibrated SAR without antenna pattern correction and the corresponding backscattering coefficient. In contrast, P r c o and σ c o are the received power of the calibrated SAR with antenna pattern correction and the corresponding backscattering coefficient. A 1 is a constant that is independent of the elevation angle. The proposed model is derived based on the radar operating principle [38], as illustrated in Figure 2. The following three equations define the model:

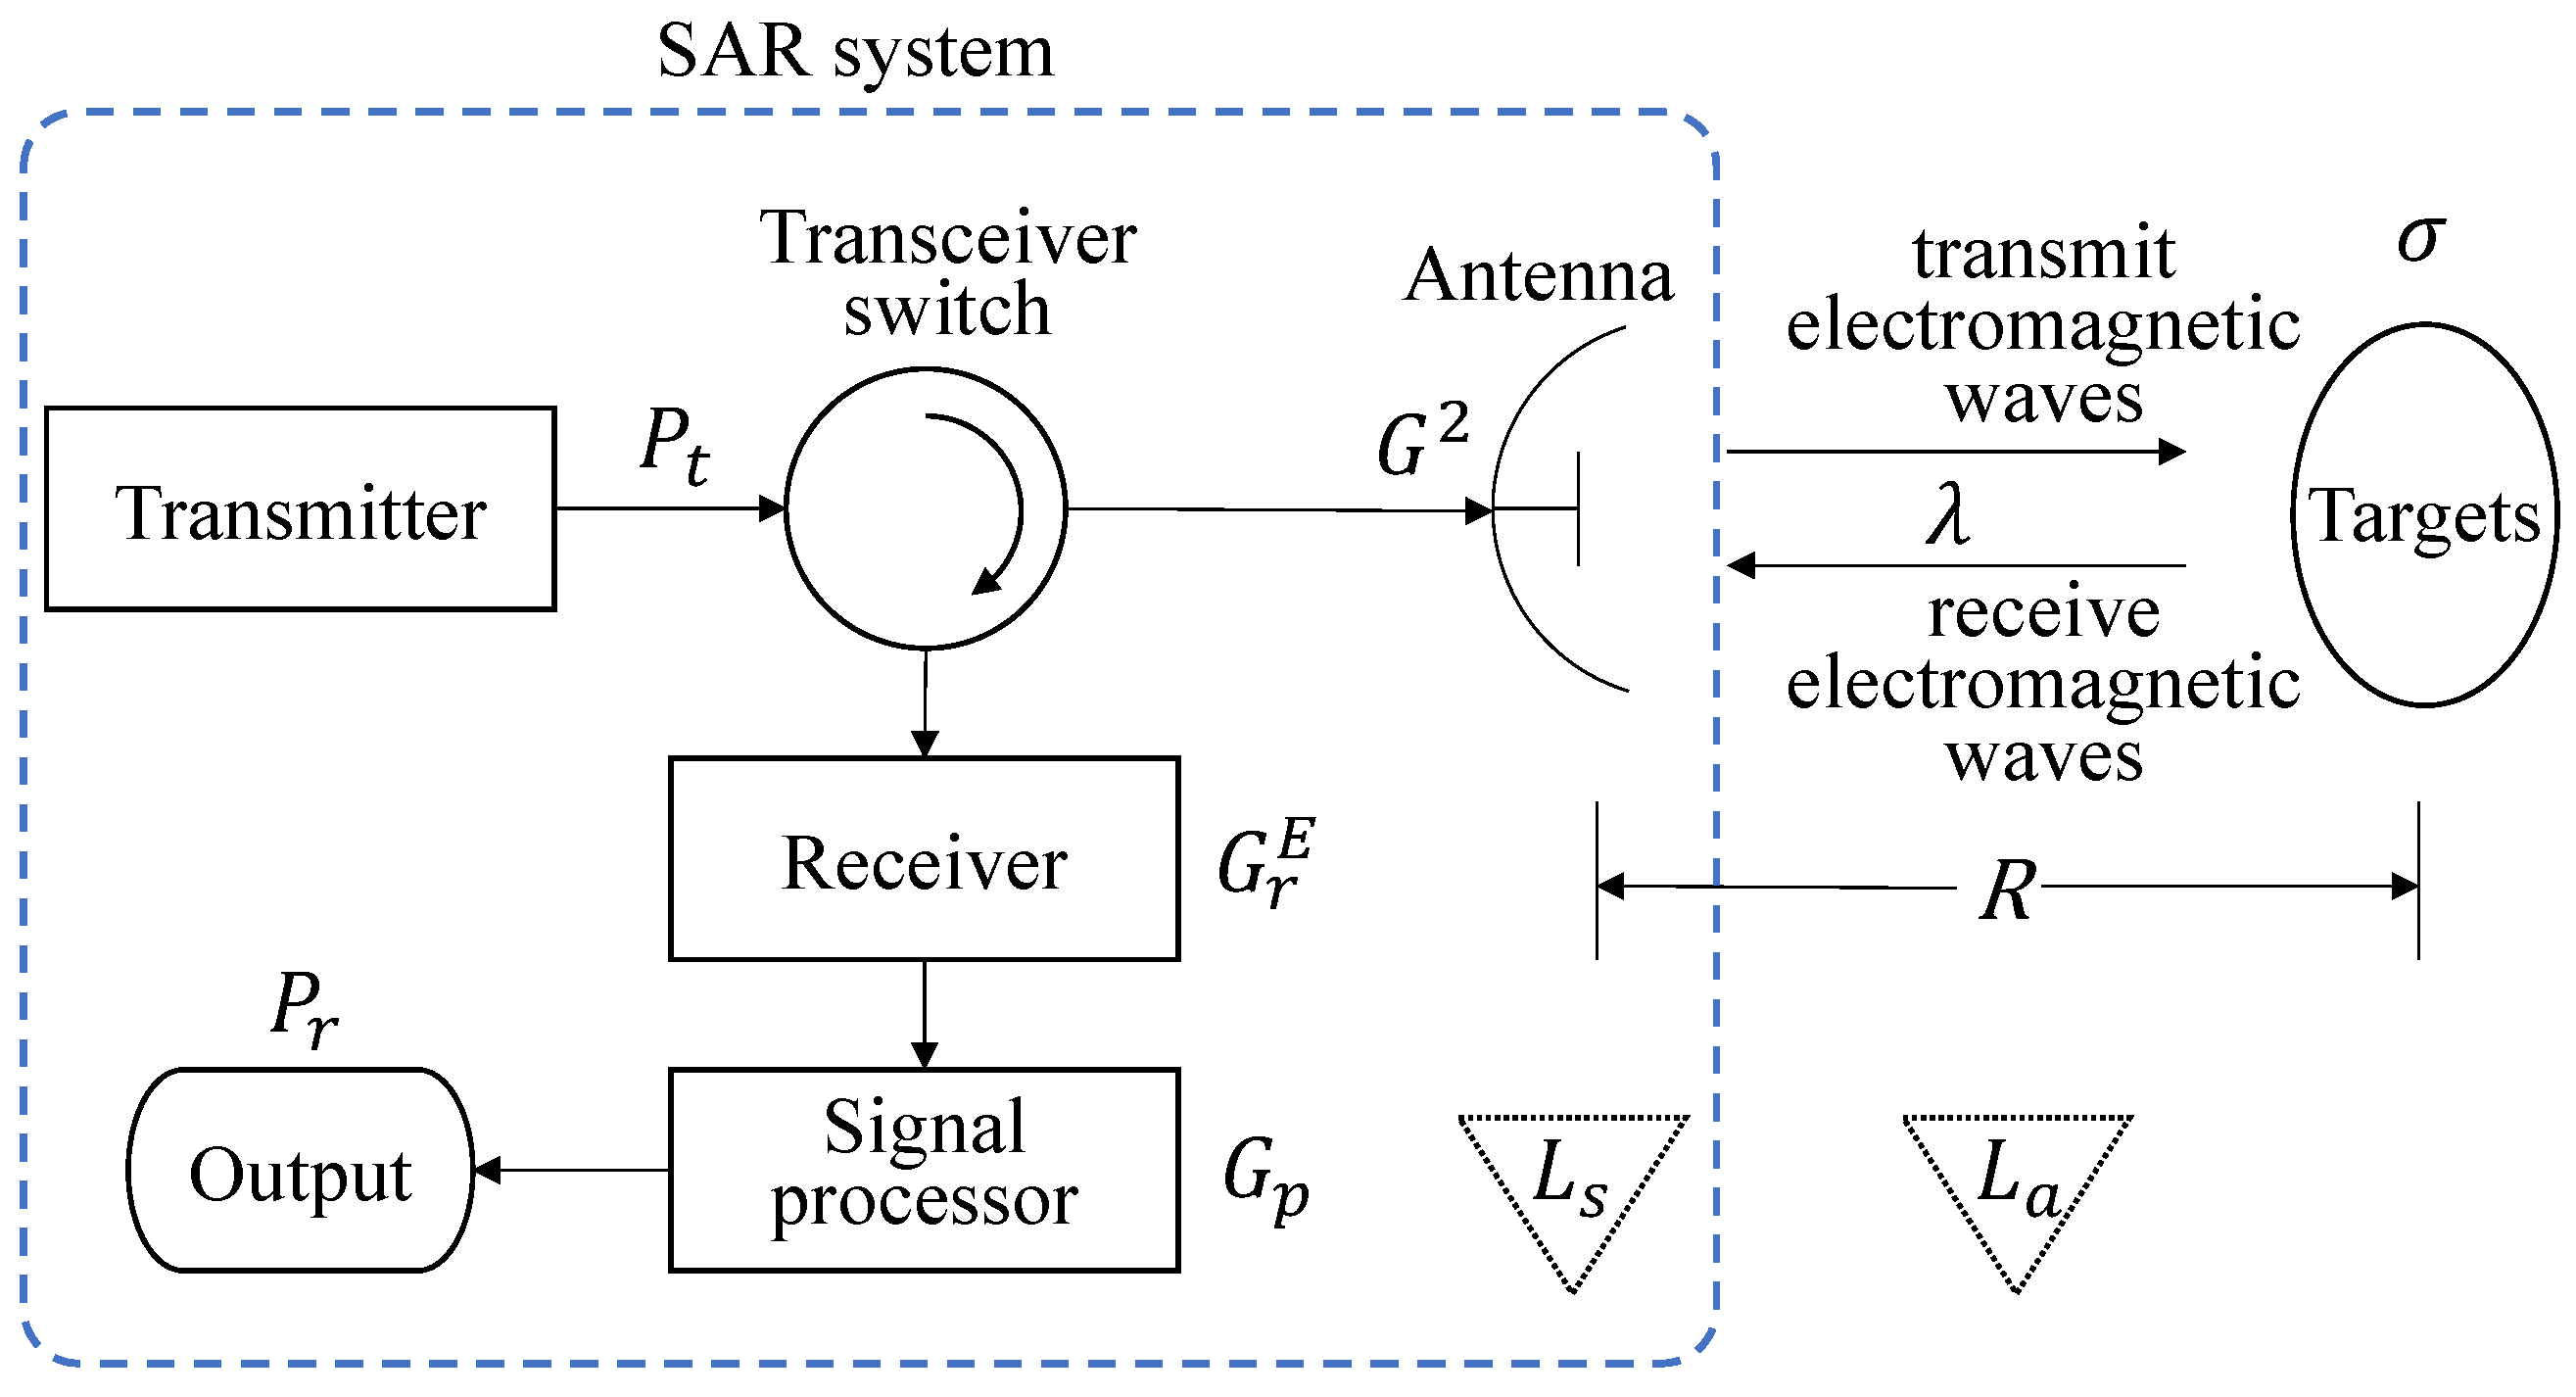
3.1.1. The Received Power of the Uncalibrated SAR Satellite Without Antenna Pattern Correction Derived from the Radar Equation

P r u n ( θ e l u n ) = λ 2 P t u n G r u n E G p u n σ u n ( θ e l u n ) ( 4 π ) 3 L s u n L a u n R u n 4 · G u n 2 ( θ e l u n )
Here, λ represents the wavelength of the electromagnetic wave, and P t u n is the peak transmit power of the uncalibrated SAR. G r u n E and G p u n denote the receiver gain and processor gain of the uncalibrated SAR, respectively. L s u n and L a u n represent system losses and atmospheric attenuation for the uncalibrated SAR, while R u n is the slant range from the uncalibrated SAR to the ground target.

3.1.2. The Received Power of the Calibrated SAR with Antenna Pattern Correction Derived from the Radar Equation

P r c o ( θ e l c o ) = λ 2 P t c o G r c o E G p c o σ c o ( θ e l c o ) ( 4 π ) 3 L s c o L a c o R c o 4
Here, P t c o is the peak transmit power of the calibrated SAR, and G r c o E and G p c o represent the receiver gain and processor gain of the calibrated SAR. L s c o and L a c o denote the system losses and atmospheric attenuation for the calibrated SAR, and R c o is the slant range from the calibrated SAR to the ground target.

3.1.3. A Constant Coefficient Independent of the Elevation Angle

A 1 = L s u n L a u n R u n 4 P t u n G r u n E G p u n · P t c o G r c o E G p c o L s c o L a c o R c o 4
Here, A 1 is the compensation factor used to normalize the antenna pattern, ensuring that the antenna pattern peaks at 1 after compensation. When deriving the antenna gain G u n 2 by taking the ratio of both sides of Equations (2) and (3), the received power P r and backscattering coefficient σ , which are dependent on the elevation angle, are explicitly separated out. The remaining terms that do not cancel constitute A 1 . It is evident that L s , L a , P t , G r , and G p are all independent of the elevation angle. In addition, since range correction factors are typically applied during SAR image formation, the slant range R in this context refers to the scene center-to-antenna distance. If such correction is not applied, the slant ranges at different positions can be easily adjusted to this reference using simple geometric relationships. The scene center slant range is independent of the elevation angle. The slant range to the scene center is independent of the elevation angle. Therefore, A 1 is independent of the elevation angle as well.
Specifically, when calibrated and uncalibrated satellites acquire images under comparable conditions, including nearly identical incidence angles and similar acquisition times, the difference between σ u n ( θ e l u n ) and σ c o ( θ e l c o ) can be neglected [10,39,40,41]. Under these circumstances, Equation (1) can be rewritten as follows:
G u n 2 ( θ e l ) = P r u n ( θ e l ) P r c o ( θ e l ) · A 1

3.2. Methodological Process

Based on the derived cross-estimation model for range antenna pattern gain, we propose a cross-based method for estimating the range antenna pattern, as illustrated in Figure 3.
Initially, spatially and temporally stable ground targets illuminated by the calibrated and uncalibrated SAR satellites are selected as calibration targets for cross-estimation. Overlapping regions of the calibrated and uncalibrated SAR satellite images are identified based on latitude and longitude information. Subsequently, utilizing these overlapping regions, a rough estimate of the uncalibrated satellite’s antenna pattern is obtained through cross-estimation. The maximum correlation coefficient method is then employed to fine-register the two images, utilizing the estimated antenna pattern information. Following this, stable power values along the range direction for the uncalibrated SAR image and the corresponding values for the calibrated SAR image are extracted and calculated. The derived cross-estimation model for range antenna pattern gain is then used to compute the antenna pattern gain for each range of the uncalibrated SAR. The estimated range antenna pattern of the uncalibrated SAR satellite is obtained by fitting the antenna pattern model using the calculated gain values. Finally, the amplitude deviation caused by the range antenna pattern in the uncalibrated SAR image is compensated, thereby completing the relative radiometric correction of the SAR image.

3.2.1. Selection of Cross-Estimation Target Areas

The time at which the calibrated and uncalibrated SAR observe the same calibration reference target varies. During the time interval between imaging, the reference target’s scattering characteristics change due to factors such as rainfall [42,43], which can cause errors in the cross-estimation.
To ensure that the target’s power values from the calibrated SAR can serve as reference true values for the uncalibrated SAR, this study selects temporally and spatially stable regions as calibration reference target areas for cross-estimation. The proposed method selects cross-estimation target areas by evaluating the amplitude correlation between the two SAR images. This approach assesses regional temporal stability by identifying areas with relatively stable backscattering coefficients between the acquisition times of the two SAR satellites. Spatial uniformity and stability are evaluated by integrating the overall standard deviation and local standard deviation, identifying regions where the backscattering coefficient varies gradually in space, thereby reducing residual registration error between images from the two satellites. The formal expression for the proposed method for selecting cross-estimation target areas is as follows:
P s t a = α 1 · r m a x + α 2 · 1 σ o v e + α 3 · 1 σ l o c
where P s t a represents the parameter proposed by this method to describe the spatiotemporal stability of the target area, with higher values indicating greater stability. r m a x denotes the maximum correlation coefficient between the two SAR images, σ o v e is the overall standard deviation, σ l o c is the average value of the local standard deviations, and α 1 , α 2 , and α 3 are the weighting factors.
After determining the quantitative parameters for selecting cross-estimation target regions, it is also necessary to define the range and azimuth extent of the target area. Firstly, sufficient sampling points from near to far along the SAR beam are needed to ensure accurate estimation of the range antenna pattern across the entire range. Therefore, this study selects calibrated and uncalibrated SAR images with significant overlap in the range direction as inputs for the cross-estimation process. The range width of the overlapping area is used to define the target area’s range width. Secondly, the azimuth width is determined by balancing the need to reduce errors and ensure the timeliness of the method. A narrow azimuth width may not effectively use the available image information and make the calibration more susceptible to noise. If the azimuth width is overly broad, it will reduce the computational efficiency of the method. Additionally, it may introduce regions with significant variations, which could affect computational accuracy to some extent. Therefore, the azimuth width should be appropriately chosen based on factors such as the scale of relatively homogeneous area and computational efficiency. In the overlapping area of the two images, the region with appropriate azimuth width and the largest P s t a is chosen as the target area, as illustrated in Figure 4.
In addition to the aforementioned requirements on the spatiotemporal stability of the target area, several terrain-related considerations must also be taken into account: (a) The backscattering intensity of the target area should not be too low. Regions with weak backscattering are more susceptible to interference from Gaussian noise, salt-and-pepper noise, and other sources, which can significantly degrade calibration accuracy. (b) The terrain of the target area should not be excessively rugged. For example, highly mountainous areas may suffer from radar shadows and drastic variations in local incidence angles. Radar shadows can lead to signal loss and radiometric distortion, while abrupt incidence angle changes can increase errors in the estimation of backscattering coefficients.
Furthermore, the acquisition of the overlapping region is also addressed. SAR geometric calibration provides geometric information about SAR images, including the latitude and longitude of the corner points [44,45]. In this study, the latitude and longitude data of the SAR images are used to identify overlapping regions within the calibration area. The latitude and longitude range of the overlapping region are calculated from the corner points of both SAR images. This range, combined with the range–azimuth mapping relationships, helps to determine the overlapping sections of the two images.

3.2.2. Registration of Target Region Images

Despite geometric calibration, there may still be positional discrepancies between the images from the two SAR satellites [44]. Therefore, the selected images, based on the latitude and longitude information, require further registration. Compared to the calibrated satellite image with a compensated antenna pattern, the uncalibrated satellite image exhibits amplitude imbalance in the range direction. A rough estimate of the antenna pattern is obtained by cross-estimating the unregistered overlapping region images. The compensated uncalibrated SAR image based on the obtained antenna pattern and the calibrated SAR image are then used as inputs for the maximum correlation coefficient method, facilitating fine registration of the SAR images.
Common image registration methods include the maximum correlation coefficient method [46,47] and the phase correlation method [48]. This study uses the maximum correlation coefficient method, which relies on amplitude information. The maximum correlation coefficient method is an image registration technique based on similarity measurement. It calculates the correlation coefficients between two images at different displacements and searches for the transformation parameters that yield the highest correlation, thereby enabling precise registration. This method is particularly suitable for registering images with amplitude correlations and enables pixel-level registration. Unlike sub-pixel registration techniques, it involves less computational complexity and avoids interpolation errors.
The maximum correlation coefficient method registers images by measuring their similarity through the cross-correlation function.
C ( u , v ) = x , y I 1 ( x , y ) · I 2 ( x + u , y + v )
where I 1 and I 2 represent the two images to be registered, x , y denotes the image coordinates, and u , v indicates the relative displacement.
Normalized cross-correlation is a common operation in the maximum correlation coefficient method. This operation involves subtracting the mean and dividing by the standard deviation of the cross-correlation coefficients, which enhances robustness to speckle noise and improves adaptability to radiometric differences. The normalized cross-correlation coefficient is defined as follows:
N C C ( u , v ) = x , y ( I 1 ( x , y ) I 1 ¯ ) x , y ( I 1 ( x , y ) I 1 ¯ ) 2 · x , y ( I 2 ( x + u , y + v ) I 2 ¯ ) x , y ( I 2 ( x + u , y + v ) I 2 ¯ ) 2
where I 1 ¯ and I 2 ¯ represent the average gray values of images I 1 and I 2 , respectively. By maximizing the normalized cross-correlation N C C u , v over all possible displacements u , v , the optimal registration displacement between the two images can be found:
( u m , v m ) = arg max ( u , v ) N C C ( u , v )
where u m , v m represents the displacement that maximizes the normalized cross-correlation coefficient, constituting the registration result.
It is worth noting that if the resolution of the calibrated and uncalibrated images differs, appropriate downsampling or interpolation should be applied.

3.2.3. Stable Power Value Extraction and Total Gain Calculation

The core of the proposed method involves extracting stable power values in the range direction from the uncalibrated SAR image, as well as the corresponding stable power from the calibrated SAR image, and using these values to calculate the antenna pattern gain for each range of the uncalibrated SAR image. The stability of the power values used to calculate the antenna pattern gain is crucial for ensuring the accuracy of the estimated range antenna pattern. To address this, this study proposes a method for selecting stable power values from the target area images to cross-estimate the antenna pattern. For a given range position, all points in that range from both the uncalibrated and calibrated SAR images are extracted, forming two lines in the azimuth direction. The differences between these two sets of values are computed, and the standard deviation of these differences is calculated. A large standard deviation indicates the presence of significant noise or abrupt variations at that range position, requiring the exclusion of the corresponding power values. The standard deviation for the two SAR images at a specific range position is defined as follows:
σ R ( x r ) = 1 N a y a = 1 N a ( I u n ( x r , y a ) I c o ( x r , y a ) ) 2
where I u n represents the uncalibrated SAR image without range antenna pattern correction, and I c o represents the calibrated SAR image. The coordinates x r , y a denote pixel positions in the range and azimuth directions, respectively, while N a indicates the total number of azimuth pixels in the SAR image.
This method segments the images into multiple subsets along the range direction. Range positions with relatively small standard deviations are selected within each subset, as illustrated in Figure 5, and the mean power of this range position is taken as the desired stable power value. This ensures sufficient sampling along the entire range while reducing noise and minimizing the range antenna pattern estimation error. The stable power values for the uncalibrated and calibrated SAR images are expressed as follows:
P u n ¯ ( x r ) = 1 N a y a = 1 N a I u n ( x r , y a )
P c o ¯ ( x r ) = 1 N a y a = 1 N a I c o ( x r , y a )
By substituting (11) and (12) into (5), the normalized total gain of the range antenna pattern can be expressed as follows:
G u n 2 ( x r ) = P u n ¯ ( x r ) P c o ¯ ( x r ) · P c o ¯ ( x r m ) P u n ¯ ( x r m )
where x r m denotes the range coordinate that maximizes the ratio P c o ¯ x r m / P u n ¯ x r m .

3.2.4. Antenna Pattern Fitting

The antenna pattern gain at each range gate in an SAR system is a range antenna pattern variation curve sample. The complete range antenna pattern variation can be derived by fitting the uncalibrated antenna pattern gain at each range gate and regularizing the resulting curve. Selecting an accurate range antenna pattern model is critical, as it directly affects the precision of the fitted range antenna pattern.
Typically, higher-order polynomials are used to model the range antenna pattern, with second-order and fourth-order models common in spaceborne SAR systems. Experimental validation [18] has demonstrated that the computational results of the fourth-order model exhibit high accuracy compared to real measurements, particularly in controlling the 3 dB beamwidth point. Measurement results from SIR-B, SIR-C, and JERS-1 indicate that the fourth-order model’s accuracy can reach up to 0.1 dB. The fourth-order model is expressed as follows:
G e l e 2 ( θ ) = a ( θ θ 0 ) 2 + b + c ( θ θ 0 ) 4
Thus, our method also utilizes a fourth-order antenna pattern model to fit the relative variation curve of the range antenna pattern. After obtaining the total gain scatter values at each range gate, these values are substituted into the fourth-order model for fitting, yielding the estimated model parameters and the complete range antenna pattern variation curve.

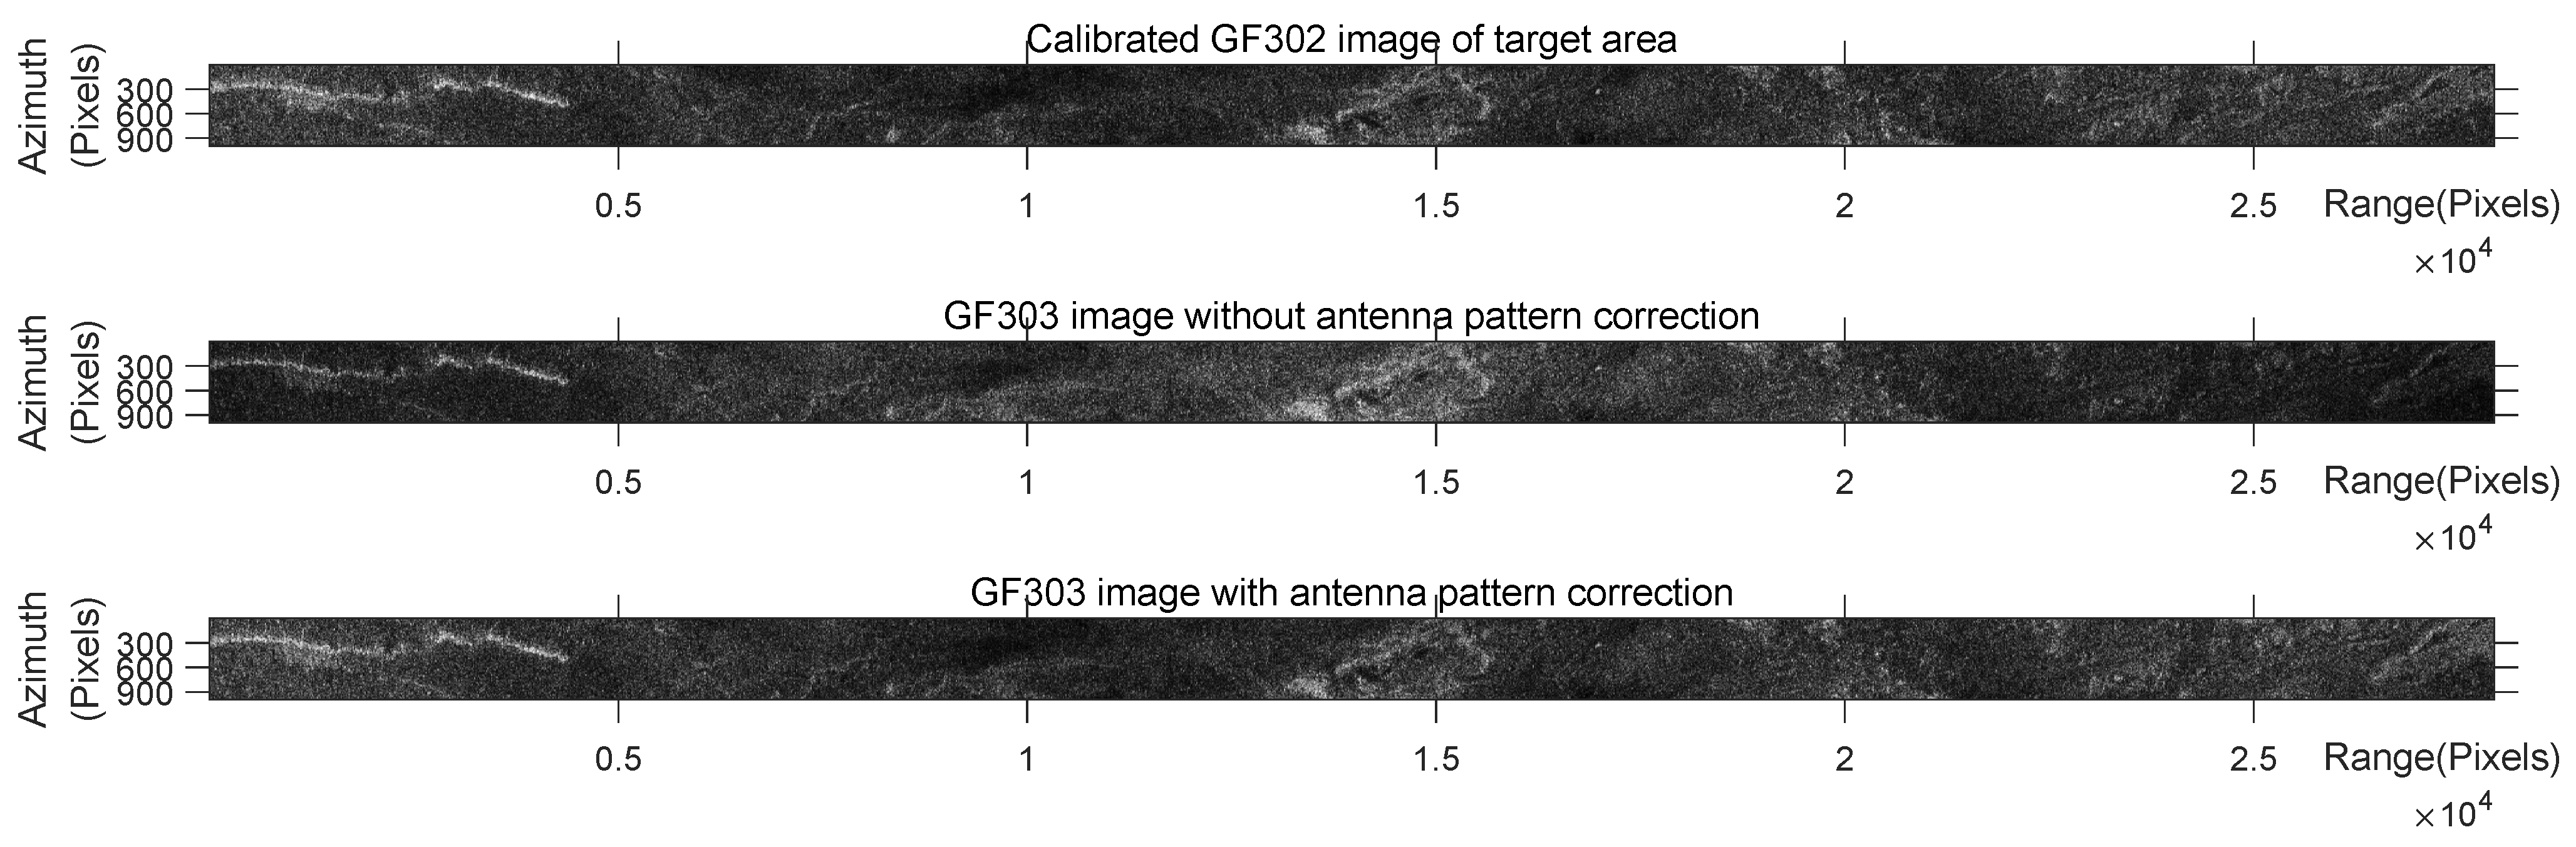
3.2.5. Antenna Pattern Correction

After obtaining the range antenna pattern, correcting the relative amplitude variations introduced by the antenna pattern in the SAR image is essential [49]. The compensation for the range antenna pattern in the uncalibrated SAR image can be expressed as follows:
I u n * ( x r , y a ) = I u n ( x r , y a ) · 1 G e l e 2 ( x r )
By applying this correction, the relative amplitude distortions due to the antenna pattern are mitigated. Comparing the corrected uncalibrated SAR image with the calibrated SAR image allows for an evaluation of the accuracy of the proposed method. On the other hand, once the antenna pattern is accurately corrected, the image will exhibit high-quality relative radiometric fidelity, enabling it to be used in subsequent absolute radiometric calibration and other applications.

4. Experiment and Discussion

The GF-3 (Gaofen-3) synthetic aperture radar dataset is employed to quantitatively evaluate the effectiveness and accuracy of the proposed cross-estimation method for spaceborne SAR range antenna patterns using ubiquitous natural distributed targets. Additionally, this study examines the method’s applicability across various land cover types, the impact of precise registration on estimation accuracy, and the influence of stable range power extraction on estimation precision through a series of experiments.

4.1. Experimental Data

The validation experiments utilize Stripmap data from the GF-3 satellites 02 and 03 as the experimental dataset. The selected SAR data come from the same region, where relative radiometric calibrated data from GF-3 02 and uncalibrated data from GF-3 03 are used. Additionally, the images from the two satellites used in the experiments have the same resolution, so downsampling or interpolation is not required. Table 2 provides detailed information on the images used in the experiments.
It is worth noting that when selecting experimental data, differences in incidence angles between the two satellites and temporal variations can introduce errors in the backscattering coefficient. Therefore, experimental data should be selected with minimal differences in incidence angles and temporal variations to ensure the accuracy of the obtained antenna pattern. In addition to the errors introduced by the aforementioned two factors, errors caused by various types of noise are also unavoidable. These errors can be formally expressed using the following equation:
δ E = δ i n c i d 2 + δ t e m 2 + δ n o i s e 2
where δ E represents the total error, δ i n c i d denotes the error introduced by differences in incidence angles, δ t e m corresponds to the error caused by variations in acquisition time, and δ n o i s e represents the error induced by noise.
During the formation mission of the GF-3 satellites, two satellites acquire data over the same region using identical beam position on two consecutive days. As shown in Table 2, the incidence angle difference for each experimental data point pair is within 0.2°, and the acquisition time interval is less than 24 h. Based on the results in Section 4.2, when the acquisition time and incidence angle are nearly identical, the proposed method achieves a worst-case result of 0.17 dB across common terrain types such as deserts, Gobi, grasslands, and forests. To meet the practical engineering requirements and redundancy design constraints, ensuring a shape deviation of less than 0.3 dB, the error introduced by the difference in incidence angles between the two satellites should be kept below 0.1 dB when the acquisition times are similar. The incidence angles of the experimental data are all around 30°. Among the various land cover types used in the experiment, bare soil exhibits the most significant variation in backscattering coefficient with respect to changes in incidence angle. Therefore, the analysis of bare soil data is used to determine the boundary for incidence angle differences. By analyzing the backscattering coefficient model of bare soil, it is found that when the incidence angle difference is less than 2°, the introduced error remains below 0.1 dB. This requirement is easily met, as the incidence angle differences in the experimental data are all within 0.2°, which satisfies the conditions of Equation (5).

4.2. Experimental Results

The data in Table 2 are used to experimentally validate the proposed cross-estimation method for spaceborne SAR range antenna patterns based on generic scenes.
In Figure 6, the left subplot shows a scatterplot of the range antenna pattern gain (dB) for the uncalibrated SAR calculated using the proposed method. In the right subplot, the blue line represents the relative variation curve of the range antenna pattern estimated using the proposed method. In contrast, the red line corresponds to the relative variation curve estimated using the tropical rainforest method. According to the results shown in Table 3, the maximum shape error between the experimental results of the proposed method and the tropical rainforest method is less than 0.2 dB.
Figure 7 shows the location of the target region within the overlapping area of the Gobi images. On the one hand, it serves as an example to present the experimental data using the Gobi image; on the other hand, it demonstrates the effectiveness of the stable target region selection method based on spatiotemporal stability parameters, as described in Section 3.2.1. Figure 8 illustrates the correction performance of the proposed method, using Gobi target region images as an example. The first subfigure shows the image of the calibrated GF-3 02 satellite as a reference. The second subfigure presents the image from the GF-3 03 satellite before correction, where evident amplitude imbalance can be observed. The third subfigure shows the image from the GF-3 03 satellite after correction, where the amplitude imbalance is effectively eliminated. These results indicate that the proposed method successfully addresses the radiometric imbalance in uncorrected images, thereby improving the relative radiometric quality of the SAR images.
The effectiveness of the proposed method has been demonstrated through experiments using data from GF-3 satellites 02 and 03. Since the derivation of Equation (1) does not rely on restrictive assumptions, the proposed method is also applicable to other satellites. The GF-3 series satellites can readily satisfy the conditions specified in Equation (5); thus, no additional processing of the backscattering coefficient is required. However, discrepancies in backscattering coefficients may exist between different satellites due to a variety of factors. Addressing these discrepancies requires case-specific analysis and appropriate correction strategies. For instance, significant variations in incidence angles can lead to non-negligible changes in backscattering, which require correction using appropriate scattering models. In addition, the backscattering response of the same target may differ significantly when observed in different radar frequency bands. In scenarios involving complex surface features, it may be difficult to effectively compensate for such differences, which could limit the applicability of the proposed method.

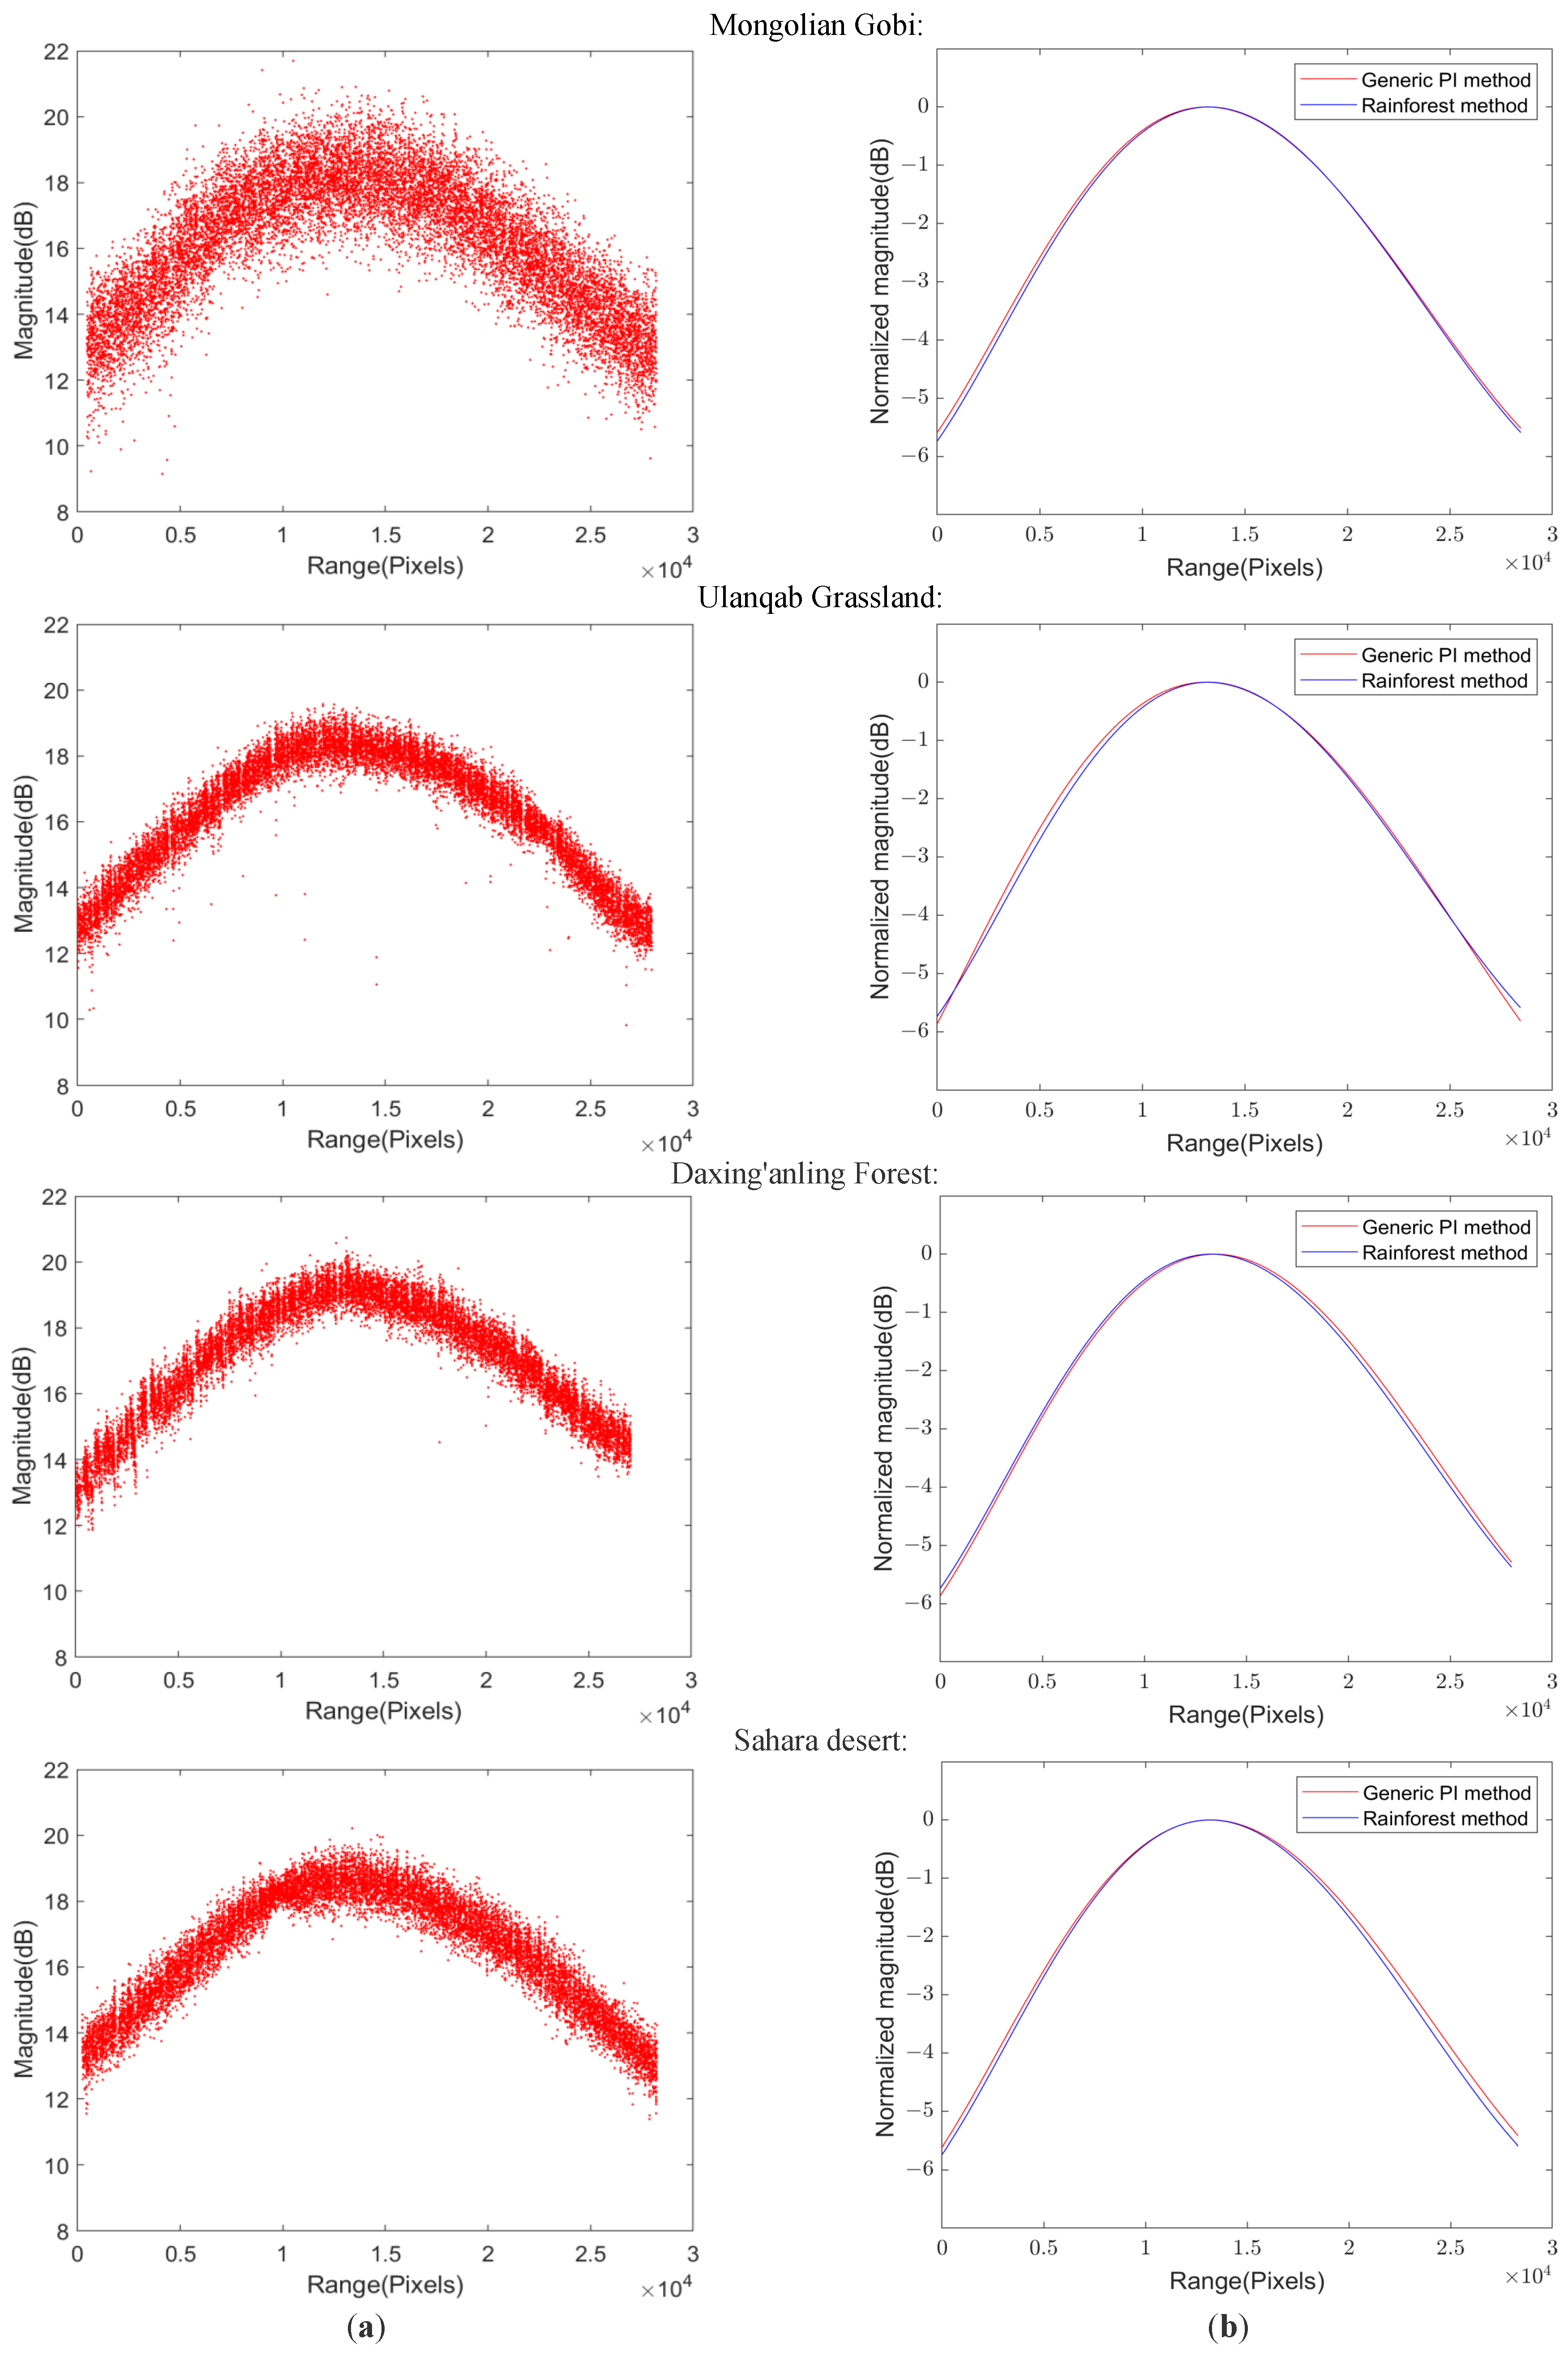
4.2.1. Analysis of Applicability Across Different Scenes

To verify the applicability of the proposed cross-estimation method for range antenna patterns across different scenes, experiments were conducted on regions predominantly consisting of the Gobi desert, grassland, forest, desert, lake, and ocean. Some regions, such as grassland and forest, also contained small portions of artificial buildings.
In this experiment, considering the scale of relatively homogeneous area and computational efficiency, each image was divided into sub-images of 1000 pixels along the azimuth direction. Cross-estimation experiments were conducted on each sub-image to analyze the performance of the proposed method in different regions. The results for each dataset are shown in Figure 9, where the vertical axis represents the maximum shape deviation.
The results indicate the following: (a) The proposed method performs well in Gobi, desert, grassland, and forest areas, meeting accuracy requirements for antenna pattern estimation. In addition, most of the best results were obtained for areas with relatively flat terrain. (b) Performance over oceans and lakes was notably poor, indicating that water surfaces are not suitable for the application of our method. On the one hand, the stability of water surfaces is poor due to the influence of wind, tides, and other factors. On the other hand, their low scattering intensity makes them highly susceptible to noise interference. (c) The results for urban areas and regions at the water–land interface were relatively poor, highlighting the importance of homogeneity. These results validate the rationale of the terrain-related requirements discussed in Section 3.2.1.
The experiments also confirmed two critical criteria for target areas in antenna pattern cross-estimation: (a) The target area should be relatively stable over time; thus, regions with significant changes, such as lakes and oceans, should be avoided. (b) The target area should exhibit gradual spatial changes; regions like urban areas or land–water boundaries may introduce unacceptable errors in the cross-estimation method.

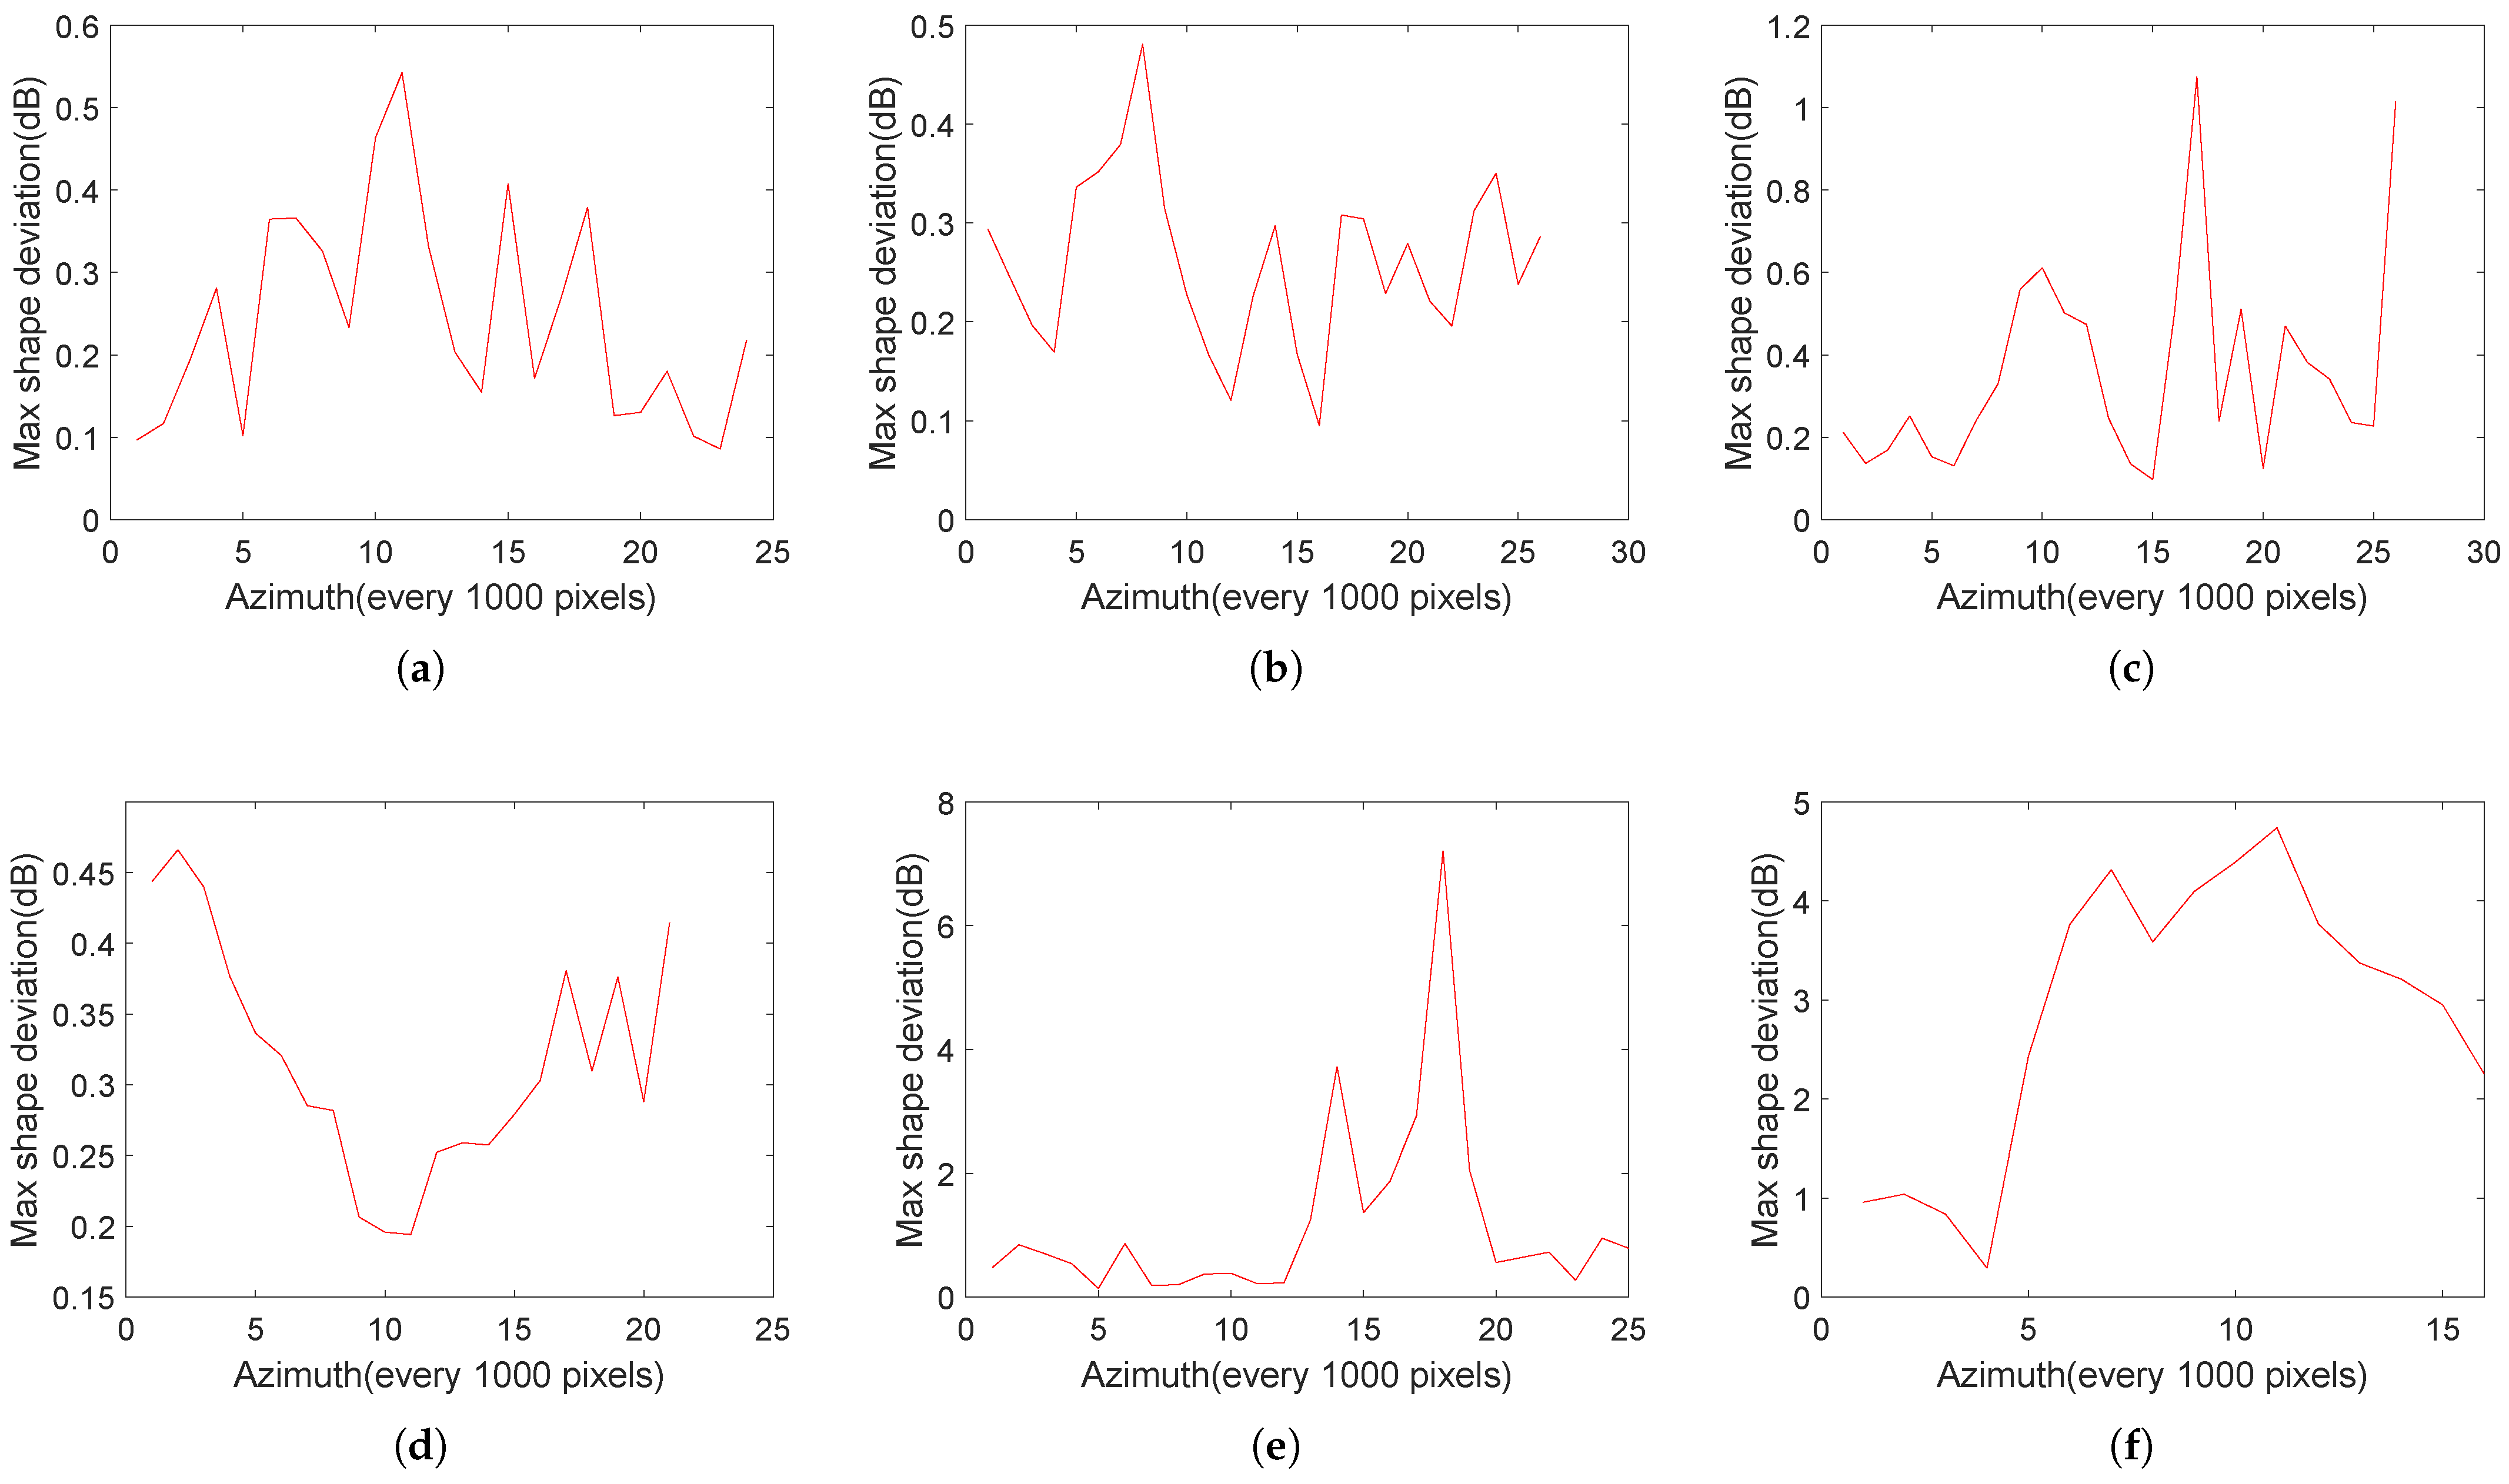
4.2.2. Impact of Fine Registration on Estimation Accuracy

Despite undergoing geometric calibration, positional discrepancies can still exist between the images from the two SAR satellites. Relying solely on the latitude and longitude information obtained from geometric calibration to select overlapping areas may lead to significant errors, necessitating additional registration. The effectiveness of the proposed registration method was experimentally validated using SAR image data primarily featuring Gobi, desert, grassland, and forest landscapes.
As shown in Table 4, the proposed registration method reduced the average maximum shape deviation across scenes from 0.2558 dB to 0.1319 dB, significantly improving the SAR range antenna pattern cross-estimation accuracy.

4.2.3. Impact of Stable Range Power Extraction on Estimation Accuracy

In regions such as Gobi, desert, grassland, and forest, which meet the requirements for target area selection in cross-estimation (as outlined in Section 3.2.1), features like rivers, ponds, and artificial structures may still introduce errors. This study enhances the method’s accuracy by selecting more stable range-direction power values.
As shown in Table 5, extracting stable range-direction power values effectively mitigates outliers in the antenna gain, thus reducing errors caused by features such as artificial structures. Compared to the experimental results without stable range power extraction, the proposed stable power extraction method decreases the average maximum shape deviation across scenes from 0.1772 dB to 0.1518 dB, effectively enhancing the accuracy of SAR range antenna pattern cross-estimation in various scenarios.

5. Conclusions

This study proposes an estimation method based on cross-calibration and generic natural scenes to address the limitations of current spaceborne SAR range antenna pattern estimation methods, which rely on artificial calibrators or specific natural scenes. By employing a selection method that combines temporal stability and spatial uniformity, stable target areas within these generic scenes are identified as calibration regions. Furthermore, the accuracy and stability of range antenna pattern cross-estimation are enhanced through a fine registration method for heterogeneous SAR images based on iterative estimation, as well as a stable range power extraction method utilizing difference screening. Experimental validation is conducted using data from the Gaofen-3 series SAR satellites. The results demonstrate that, in generic scenes featuring stable characteristics, the maximum shape deviation of the proposed method is less than 0.2 dB compared to results obtained using the tropical rainforest method. The proposed approach performs effectively in stable environments such as Gobi, grassland, forest, and desert; however, it is not suitable for areas with significant temporal variations, such as lakes and oceans, or regions exhibiting substantial spatial changes, including urban areas and land–water boundaries. Comparative experiments further indicate that the proposed fine registration and stable power selection methods improve the accuracy of range antenna pattern cross-estimation. Overall, the experimental findings provide preliminary validation for the applicability of the proposed distance antenna pattern cross-estimation method in generic scenes.

Author Contributions

Conceptualization, C.X., J.D. and Y.Z.; methodology, C.X., J.D. and Y.Z.; software, C.X.; validation, C.X., J.D., Y.Z., F.T., F.Z. and W.H.; resources, F.T., F.Z. and W.H.; writing—original draft preparation, C.X.; writing—review and editing, J.D., Y.Z. and W.H.; supervision, W.H.; funding acquisition, Y.Z. All authors have read and agreed to the published version of the manuscript.

Funding

This work was partly supported by the National Natural Science Foundation of China under Grant 6217012512 and was partly supported by the Fundamental Research Funds for the Central Universities under Grant buctrc202001.

Data Availability Statement

The original contributions presented in the study are included in the article, further inquiries can be directed to the corresponding author.

Conflicts of Interest

The authors declare no conflicts of interest.

References

  1. Curlander, J.C.; McDonough, R.N. Synthetic Aperture Radar: Systems and Signal Processing; Wiley: New York, NY, USA, 1991; Volume 11. [Google Scholar]
  2. Ossowska, A.; Kim, J.H.; Wiesbeck, W. Influence of mechanical antenna distortions on the performance of the HRWS SAR system. In Proceedings of the 2007 IEEE International Geoscience and Remote Sensing Symposium, Barcelona, Spain, 23–28 July 2007; pp. 2152–2155. [Google Scholar] [CrossRef]
  3. Su, X.; Li, D.; Ye, S.; Ma, Y.; Cui, Z.; Ouyang, S. Structure design and thermal deformation simulation of spaceborne SAR antenna. In Proceedings of the 2021 2nd China International SAR Symposium (CISS), Shanghai, China, 3–5 November 2021; pp. 1–4. [Google Scholar] [CrossRef]
  4. Ji, L.; Wang, H. Analysis of On-orbit Thermal Deformation of Flexible SAR Antenna. In Proceedings of the 2021 2nd China International SAR Symposium (CISS), Shanghai, China, 3–5 November 2021; pp. 1–6. [Google Scholar] [CrossRef]
  5. Seifert, P.; Blötscher, H. Preparatory investigations concerning the calibration of spaceborne SAR-systems. In Proceedings of the IGARSS 1991: Proceedings of the 11th Annual International Geoscience and Remote Sensing Symposium, Espoo, Finland, 3–6 June 1991; Volume 3, pp. 1381–1384. [Google Scholar] [CrossRef]
  6. Eriksson, L.E.; Demchev, D.; Hildeman, A.; Dierking, W. Alignment of L-and C-band SAR images for enhanced observations of sea ice. In Proceedings of the IGARSS 2022–2022 IEEE International Geoscience and Remote Sensing Symposium, Kuala Lumpur, Malaysia, 17–22 July 2022; pp. 3798–3801. [Google Scholar] [CrossRef]
  7. Bachmann, M.; Schwerdt, M.; Bräutigam, B. Accurate Antenna Pattern Modeling for Phased Array Antennas in SAR Applications—Demonstration on TerraSAR-X. Int. J. Antennas Propag. 2009, 2009, 492505. [Google Scholar] [CrossRef]
  8. Li, H.; Zhang, H.; Chen, Q.; Gao, Y.; Shi, X.; Zhang, L. Accuracy analysis of radiometric calibration in-orbit for SuperView Neo-2 SAR satellite. IEEE J. Sel. Top. Appl. Earth Obs. Remote. Sens. 2024, 17, 2234–2244. [Google Scholar] [CrossRef]
  9. Zakharov, A.; Zherdev, P.; Sokolov, A. Intercalibration of ERS AMI and ENVISAT ASAR with ground-based parabolic antennas. In Proceedings of the Envisat & ERS Symposium, Salzburg, Austria, 6–10 September 2004; pp. 6–10. [Google Scholar]
  10. Zhou, Y.; Zhuang, L.; Duan, J.; Zhang, F.; Hong, W. Synthetic aperture radar radiometric cross calibration based on distributed targets. IEEE J. Sel. Top. Appl. Earth Obs. Remote. Sens. 2022, 15, 9599–9612. [Google Scholar] [CrossRef]
  11. Dobson, M.C.; Ulaby, F.T.; Brunfeldt, D.R.; Held, D.N. External calibration of SIR-B imagery with area-extended and point targets. IEEE Trans. Geosci. Remote. Sens. 1986, GE-24, 453–461. [Google Scholar] [CrossRef]
  12. Shen, Y.; Klein, J.; Freeman, A. Tone generators in SAR applications. In Proceedings of the 10th Annual International Symposium on Geoscience and Remote Sensing, College Park, MD, USA, 20–24 May 1990; p. 1121. [Google Scholar]
  13. Seifert, P.; Lentz, H.; Zink, M.; Heel, F. Ground-based measurements of inflight antenna patterns for imaging radar systems. IEEE Trans. Geosci. Remote. Sens. 1992, 30, 1131–1136. [Google Scholar] [CrossRef]
  14. Thompson, A.A.; Racine, D.; Luscombe, A.P. RADARSAT2 antenna calibration using Ground Receivers/Transmitters. In Proceedings of the IEEE International Geoscience and Remote Sensing Symposium, Toronto, ON, Canada, 24–28 June 2002; Volume 3, pp. 1465–1467. [Google Scholar]
  15. Moore, R.K.; Hemmat, M. Determination of the vertical pattern of the SIR-B antenna. Int. J. Remote. Sens. 1988, 9, 839–847. [Google Scholar] [CrossRef]
  16. Hawkins, R.K. Determination of antenna elevation pattern for airborne SAR using the rough target approach. IEEE Trans. Geosci. Remote. Sens. 1990, 28, 896–905. [Google Scholar] [CrossRef]
  17. Freeman, A.; Alves, M.; Chapman, B.; Cruz, J.; Kim, Y.; Shaffer, S.; Sun, J.; Turner, E.; Sarabandi, K. SIR-C data quality and calibration results. IEEE Trans. Geosci. Remote. Sens. 1995, 33, 848–857. [Google Scholar] [CrossRef]
  18. Shimada, M.; Freeman, A. A technique for measurement of spaceborne SAR antenna patterns using distributed targets. IEEE Trans. Geosci. Remote. Sens. 1995, 33, 100–114. [Google Scholar] [CrossRef]
  19. Fang, Y.; Moore, R.K. Inflight vertical antenna patterns for SIR-C from Amazon rain-forest observations. Remote. Sens. Environ. 1997, 59, 407–414. [Google Scholar] [CrossRef]
  20. Lukowski, T.; Hawkins, R.; Cloutier, C.; Wolfe, J.; Teany, L.; Srivastava, S.; Banik, B.; Jha, R.; Adamovic, M. RADARSAT elevation antenna pattern determination. In Proceedings of the IGARSS’97. 1997 IEEE International Geoscience and Remote Sensing Symposium Proceedings. Remote Sensing—A Scientific Vision for Sustainable Development, Singapore, 3–8 August 1997; Volume 3, pp. 1382–1384. [Google Scholar] [CrossRef]
  21. Moore, R.K.; Rediawan, H. Further analysis of SIR-C antenna patterns for radiometric corrections: Use of new calibration areas. In Proceedings of the IGARSS’99. IEEE 1999 International Geoscience and Remote Sensing Symposium, Hamburg, Germany, 28 June–2 July 1999; Volume 1, pp. 437–439. [Google Scholar] [CrossRef]
  22. Zink, M.; Rosich, B. Antenna elevation pattern estimation from rain forest acquisitions. In Proceedings of the SAR Workshop on Calibration/Validation, London, UK, 24–26 September 2003; Volume 526, p. 11. [Google Scholar]
  23. Yun, R.; Guo, W.; Wei, M. Algorithm for radiometric calibration of satellite-borne SAR in the Amazon rainforest. Radar Sci. Technol. 2007, 5, 139–143. [Google Scholar]
  24. Jiang, S.; Qiu, X.; Han, B.; Hu, W. A quality assessment method based on common distributed targets for GF-3 polarimetric SAR data. Sensors 2018, 18, 807. [Google Scholar] [CrossRef]
  25. Shi, L.; Li, P.; Yang, J.; Zhang, L.; Ding, X.; Zhao, L. Polarimetric SAR calibration and residual error estimation when corner reflectors are unavailable. IEEE Trans. Geosci. Remote. Sens. 2020, 58, 4454–4471. [Google Scholar] [CrossRef]
  26. Semunegus, H.; Berg, W.; Bates, J.J.; Knapp, K.R.; Kummerow, C. An extended and improved Special Sensor Microwave Imager (SSM/I) period of record. J. Appl. Meteorol. Climatol. 2010, 49, 424–436. [Google Scholar] [CrossRef]
  27. Kamei, A.; Nakamura, K.; Yamamoto, H.; Nakamura, R.; Tsuchida, S.; Yamamoto, N.; Sekiguchi, S.; Kato, S.; Liu, C.C.; Hsu, K.H.; et al. Cross Calibration of Formosat-2 Remote Sensing Instrument (RSI) Using Terra Advanced Spaceborne Thermal Emission and Reflection Radiometer (ASTER). IEEE Trans. Geosci. Remote. Sens. 2012, 50, 4821–4831. [Google Scholar] [CrossRef]
  28. Angal, A.; Xiong, X.; Shrestha, A. Cross-calibration of MODIS reflective solar bands with Sentinel 2A/2B MSI instruments. IEEE Trans. Geosci. Remote. Sens. 2020, 58, 5000–5007. [Google Scholar] [CrossRef]
  29. Gross, G.; Helder, D.; Leigh, L. Extended Cross-Calibration Analysis Using Data from the Landsat 8 and 9 Underfly Event. Remote. Sens. 2023, 15, 1788. [Google Scholar] [CrossRef]
  30. Xie, Y.; Feng, D.; Shao, W.; Han, J.; Chen, Y. Radiometric Cross-Calibration of HY-1C/COCTS Based on Sentinel-3/OLCI. IEEE J. Sel. Top. Appl. Earth Obs. Remote. Sens. 2024, 17, 10422–10431. [Google Scholar] [CrossRef]
  31. Chander, G.; Hewison, T.J.; Fox, N.; Wu, X.; Xiong, X.; Blackwell, W.J. Overview of intercalibration of satellite instruments. IEEE Trans. Geosci. Remote. Sens. 2013, 51, 1056–1080. [Google Scholar] [CrossRef]
  32. Cao, C.; Xiong, X.; Wu, A.; Wu, X. Assessing the consistency of AVHRR and MODIS L1B reflectance for generating fundamental climate data records. J. Geophys. Res. Atmos. 2008, 113. [Google Scholar] [CrossRef]
  33. Miesch, C.; Cabot, F.; Briottet, X.; Henry, P.J. Assimilation of satellite data over the Sahara desert for intercalibration of optical satellite sensors. In Proceedings of the Sensors, Systems, and Next-Generation Satellites V. SPIE, Toulouse, France, 17–21 September 2001; Volume 4540, pp. 469–475. [Google Scholar]
  34. Angal, A.; Xiong, X.; Thome, K.; Wenny, B.N. Cross-calibration of Terra and Aqua MODIS using RadCalNet. IEEE Geosci. Remote. Sens. Lett. 2020, 18, 188–192. [Google Scholar] [CrossRef]
  35. Zink, M.; Olivier, P.; Freeman, A. Cross-calibration between airborne SAR sensors. IEEE Trans. Geosci. Remote. Sens. 1993, 31, 237–245. [Google Scholar] [CrossRef]
  36. Chen, X.; Zhou, Y.; Ma, F.; Yin, Q.; Zhang, F. Optimized selection of pseudo-invariant calibration sites for radiometric cross-calibration of spaceborne SAR sensors. In Proceedings of the 2023 SAR in Big Data Era (BIGSARDATA), Beijing, China, 20–22 September 2023; pp. 1–4. [Google Scholar]
  37. Zhou, Y.; Yang, B.; Yin, Q.; Ma, F.; Zhang, F. Improved SAR Radiometric Cross-Calibration Method Based on Scene-Driven Incidence Angle Difference Correction and Weighted Regression. IEEE Trans. Geosci. Remote. Sens. 2024, 62, 1–16. [Google Scholar] [CrossRef]
  38. Mahafza, B.R. Radar Systems Analysis and Design Using MATLAB; Chapman and Hall/CRC: New York, Ny, USA, 2005. [Google Scholar] [CrossRef]
  39. Mladenova, I.E.; Jackson, T.J.; Bindlish, R.; Hensley, S. Incidence Angle Normalization of Radar Backscatter Data. IEEE Trans. Geosci. Remote. Sens. 2013, 51, 1791–1804. [Google Scholar] [CrossRef]
  40. Torres, R.; Navas-Traver, I.; Bibby, D.; Lokas, S.; Snoeij, P.; Rommen, B.; Osborne, S.; Ceba-Vega, F.; Potin, P.; Geudtner, D. Sentinel-1 SAR system and mission. In Proceedings of the 2017 IEEE Radar Conference (RadarConf), Seattle, WA, USA, 8–12 May 2017; pp. 1582–1585. [Google Scholar] [CrossRef]
  41. Zhang, M.; Chen, F.; Tian, B.; Liang, D.; Yang, A. High-Frequency Glacial Lake Mapping Using Time Series of Sentinel-1A/1B SAR Imagery: An Assessment for the Southeastern Tibetan Plateau. Int. J. Environ. Res. Public Health 2020, 17, 1072. [Google Scholar] [CrossRef]
  42. Oh, Y.; Sarabandi, K.; Ulaby, F.T. An empirical model and an inversion technique for radar scattering from bare soil surfaces. IEEE Trans. Geosci. Remote. Sens. 1992, 30, 370–381. [Google Scholar] [CrossRef]
  43. Oh, Y.; Kweon, S.K.; Hwang, J.H. Soil moisture retrieval from single-polarized measurements of well-calibrated radars for bare soil surfaces. In Proceedings of the Conference Proceedings of 2013 Asia-Pacific Conference on Synthetic Aperture Radar (APSAR), Tsukuba, Japan, 23–27 September 2013; pp. 45–48. [Google Scholar]
  44. Feng, Y.; Lei, Z.; Tong, X.; Xi, M.; Li, P. An improved geometric calibration model for spaceborne SAR systems with a case study of large-scale Gaofen-3 images. IEEE J. Sel. Top. Appl. Earth Obs. Remote. Sens. 2022, 15, 6928–6942. [Google Scholar] [CrossRef]
  45. Mu, M.; Li, Z.; Xu, B.; He, X.; Han, K.; Du, X.; Han, Q.; Wang, A. LT-1A/B Satellite SAR Geometric Calibration and Absolute Location Error Analysis. IEEE J. Sel. Top. Appl. Earth Obs. Remote. Sens. 2024, 17, 16497–16510. [Google Scholar] [CrossRef]
  46. Kim, J.; Fessler, J.A. Intensity-based image registration using robust correlation coefficients. IEEE Trans. Med. Imaging 2004, 23, 1430–1444. [Google Scholar] [CrossRef]
  47. Evangelidis, G.D.; Psarakis, E.Z. Parametric image alignment using enhanced correlation coefficient maximization. IEEE Trans. Pattern Anal. Mach. Intell. 2008, 30, 1858–1865. [Google Scholar] [CrossRef]
  48. Luo, D.; Wu, Y.; Chen, Y.; Yuan, Z.; Liu, Y. An improved ORB image matching algorithm based on phase correlation method. Electron. Qual. 2023, 8, 22–26. [Google Scholar] [CrossRef]
  49. Huang, J.; Chen, J.; Guo, Y.; Wang, P. Analysis and Correction of Antenna Pattern Effects in AMAO Spaceborne SAR Images. Remote. Sens. 2022, 14, 2141. [Google Scholar] [CrossRef]
Figure 1. Artificial calibrator method and distributed target method. (a) Artificial calibrator method. (b) Specific target method. (c) Generic target method.
Remotesensing 17 01459 g001
Figure 2. Radar operating principle. The electromagnetic waves generated by the radar transmitter are directionally radiated through the antenna. As the waves propagate through space and encounter targets, scattering occurs. The backscattered echoes are then captured by the antenna, received by the radar receiver, and processed by the signal processor to retrieve target information.
Remotesensing 17 01459 g002
Figure 3. Overall flowchart of the proposed range antenna pattern cross-estimation method.
Remotesensing 17 01459 g003
Figure 4. Selection of target area. By computing the spatiotemporal stability parameter, the target region is selected from the overlapping area of the calibrated and uncalibrated images.
Remotesensing 17 01459 g004
Figure 5. Selection of stable range. The difference between corresponding pixel values from the calibrated and uncalibrated SAR images is calculated for each range. The standard deviation of these differences is then used to select the stable range.
Remotesensing 17 01459 g005
Figure 6. Experimental results of the proposed method in stable regions. (a) Scatterplot of range antenna pattern gain. (b) Fitted range antenna pattern curve.
Remotesensing 17 01459 g006
Figure 7. Selection of target area in Gobi image. The red-bordered area represents the selected target region.
Remotesensing 17 01459 g007
Figure 8. Images before and after antenna pattern correction. The correction effect is demonstrated using the target region selected in Figure 7 as an example.
Remotesensing 17 01459 g008
Figure 9. Experimental results under different scenes. (af) Results at different azimuths across six distinct terrain types: Gobi desert, grassland, forest, desert, lake, and ocean, respectively.
Remotesensing 17 01459 g009
Table 1. Comparison of methods for estimating range antenna patterns.
MethodReference TargetOperating ComplexityCostImaging SwathAccuracyFrequency
Artificial calibrator methodArtificial calibratorsComplexHighNarrowHighLow
Tropical rainforest methodStable tropical rainforestsSimpleLowWideMediumLow
The proposed methodGeneric pseudo-invariant sceneMediumLowWideMediumHigh
Table 2. Experimental data information.
GroupsSceneSatelliteAcquisition TimeLatitude and Longitude
aMongolian GobiGF3023 June 202343.5445°N, 108.1588°E
GF3032 June 202343.4320°N, 108.1407°E
bUlanqab GrasslandGF30216 October 202342.7768°N, 112.1318°E
GF30315 October 202342.7666°N, 112.1479°E
cDaxing’anling ForestGF30222 May 202452.4663°N, 114.9489°E
GF30321 May 202452.5037°N, 114.9751°E
dSahara desertGF30222 December 202324.0124°N, 0.7805°W
GF30321 December 202323.7720°N, 0.7393°W
eNam LakeGF30230 December 202330.9049°N, 90.7801°E
GF30329 December 202330.8587°N, 90.8072°E
fYellow SeaGF30219 May 202432.8141°N, 123.9271°E
GF30318 May 202432.3250°N, 124.0477°E
gAmazon rainforestGF30329 June 20231.4180°S, 72.1038°W
Table 3. Method accuracy under different scenes.
SceneGobiGrasslandForestDesert
Max shape deviation<0.12 dB<0.11 dB<0.14 dB<0.17 dB
Table 4. Effects of fine registration on estimation accuracy.
SceneMax Shape Deviation (Not Fine Registration)Max Shape Deviation (Fine Registration)
Gobi0.2378 dB0.1166 dB
Grassland0.2113 dB0.1099 dB
Forest0.2860 dB0.1317 dB
Desert0.2879 dB0.1694 dB
On average0.2558 dB0.1319 dB
Table 5. Effects of stable range power extraction on estimation accuracy.
SceneMax Shape Deviation (No Stable Power Extraction)Max Shape Deviation (Stable Power Extraction)
Gobi0.1581 dB0.1350 dB
Grassland0.1352 dB0.1207 dB
Forest0.1949 dB0.1655 dB
Desert0.2205 dB0.1859 dB
On average0.1772 dB0.1518 dB
Disclaimer/Publisher’s Note: The statements, opinions and data contained in all publications are solely those of the individual author(s) and contributor(s) and not of MDPI and/or the editor(s). MDPI and/or the editor(s) disclaim responsibility for any injury to people or property resulting from any ideas, methods, instructions or products referred to in the content.

