Article

A Geospatial Livestock-Carrying Capacity Model (GLCC) in the Akmola Oblast, Kazakhstan

by
Jiaguo Qi
1,
Zihan Lin
2,
Mark A. Weltz
3,†,
Kenneth E. Spaeth
4,
Gulnaz Iskakova
5,*,
Jason Nesbit
3,
David Toledo
6,
Tlektes Yespolov
7,†,
Maira Kussainova
8,
Lyazzat K. Makhmudova
9 and
Xiaoping Xin
10
1
Department of Geography, Environment, and Spatial Sciences, Michigan State University, East Lansing, MI 48823, USA
2
Department of Biological, Geological and Environmental Sciences, Cleveland State University, Cleveland, OH 44115, USA
3
Great Basin Rangelands Research Unit, US Department of Agriculture (USDA)—Agricultural Research Service, Reno, NV 89512, USA
4
US Department of Agriculture (USDA)—Natural Resources Conservation Service, Ft. Worth, TX 76115, USA
5
Faculty of Water Resources and IT Technologies, Kazakh National Agrarian Research University (KazNARU), Almaty 050010, Kazakhstan
6
Northern Great Plains Research Laboratory, US Department of Agriculture (USDA)—Agricultural Research Service, Mandan, ND 58554, USA
7
Kazakh National Agrarian Research University (KazNARU), Almaty 050010, Kazakhstan
8
Center for Sustainable Agriculture, Kazakh National Agrarian Research University (KazNARU), Almaty 050010, Kazakhstan
9
Institute of Geography and Water Safety, Almaty 050010, Kazakhstan
10
National Hulunber Grassland Ecosystem Observation and Research Station, Institute of Agricultural Resources and Regional Planning, Chinese Academy of Agricultural Sciences, Beijing 100081, China
*
Author to whom correspondence should be addressed.
Retired.
Remote Sens. 2025, 17(8), 1477; https://doi.org/10.3390/rs17081477
Submission received: 22 February 2025 / Revised: 10 April 2025 / Accepted: 15 April 2025 / Published: 21 April 2025

Abstract

:
Spatial disparities in rangeland conditions across Kazakhstan complicate field-based assessments of livestock-carrying capacity (LCC), a critical metric for the country’s food security and economic planning. This study developed a geospatial livestock-carrying capacity (GLCC) modeling framework to quantify LCC spatio-temporal dynamics at the Oblast level, by integrating satellite-derived data on vegetation, water resources, and terrain with in situ measurements. By providing ground-truth observations and contextual detail, field-based measurements complement remote sensing data and help to validate estimates and improve the reliability of the GLCC model. The modeling framework was successfully applied and validated in a case study in the Akmola Oblast, Kazakhstan, to specifically map the spatial and temporal distributions of LCC, using publicly available MODIS NPP data and in situ data from 51 field sites. The modeling results showed distinct spatial patterns of LCC across the Oblast, reflecting variability in rangeland productivity with higher values concentrated in southern and southeastern regions (up to 0.5 animals/ha). The results also depicted significant interannual LCC fluctuations (ranging from 0.099 to 0.17 animals/ha) possibly due to rainfall variability, and thus an indicator of climate-related risks for livestock management. Although there is still room for further improvement, particularly in model parameterization to account for grazing pressures, forage quality, and livestock species, the GLCC modeling framework represents a simple modeling tool to map livestock-carrying capacity, a more meaningful indicator to rangeland managers. Further, this work underscores the value of integrating remote sensing with field-based observations to support data-driven rangeland management planning and resilient investment strategies.

1. Introduction

Livestock managers prioritize profitability while maintaining rangeland health and sustainability of rangelands [1,2]. Livestock-carrying capacity (LCC) at the field scale can be determined by sampling the current year’s growth; larger scale estimates can be determined by integrating geospatial data (e.g., satellite-derived vegetation trends, soil moisture, water resources) with field-based measurements to generate site-specific LCC indicators tailored to decision-makers in the rangeland and agro-industrial sectors. For Kazakhstan, where livestock production is central to food security and agro-industrial development strategies, a national-scale LCC assessment is urgently needed to balance ecological constraints with economic priorities.
Following the dissolution of the Soviet Union in 1991 and the cessation of large-scale subsidies for state-owned farms, Kazakhstan’s beef production declined sharply. The cattle population dropped from 9.5 million head in 1992 to under 4 million head by 1999 [3], transforming Kazakhstan from a meat exporter to a meat importer, including breeding cattle [4]. Today, the country aims to boost livestock production by repurposing abandoned agricultural lands for grazing as part of its national economic strategy. However, quantitative data on grazing capacity remain limited [5,6].
Rangelands dominate Kazakhstan’s land cover (Figure 1) and have supported livestock grazing (horses, cattle, sheep, goats, and camels) since the Bronze Age [7,8]. These rangelands are critical for the agro-industrial sector and food security. Kazakhstan’s four major ecoregions—steppe (25%), semidesert (25%), desert (40%), and mountains (7%) [9]—include the vast temperate Kazakh steppe, covering approximately 804,500 km2. This semi-arid region experiences average precipitation of 200 to 400 mm and mean temperatures ranging from 20–26 °C in July to −12–18 °C in January. The flora is diverse, with over 13,000 species, including 5754 vascular plants [10]. The steppe features 23 dominant plant communities on chestnut soils, with Mollisols—characterized by a silty clay loam texture and thick, organic-rich horizons—being the dominant soil type [11].
The livestock-carrying capacity, rangeland conditions, and health of Kazakhstan’s extensive rangelands remain poorly quantified, with current stocking rates either undocumented or inaccurately reported due to the absence of a systematic monitoring and assessment framework. This lack of reliable data hinders the establishment of targeted livestock production goals [12]. Accurate LCC estimation is therefore critical for implementing Kazakhstan’s national strategy to enhance meat production sustainably, ensuring that livestock development aligns with the ecological health of rangelands and supports the agro-industrial sector, particularly in the Akmola region.
Remote sensing has emerged as a pivotal tool for capturing the spatial and temporal dynamics of rangeland conditions, providing large-scale insights into biophysical attributes such as biomass production, water resources, land use/cover and ecosystem productivity. However, translating these insights into actionable information for livestock management remains challenging.
Recent advancements in geospatial modeling and remote sensing have significantly improved the capacity to monitor rangeland ecosystems, enabling better-informed decisions in livestock and land management. For example, numerous studies have applied time-series NDVI, fractional vegetation cover, and other spectral indices from MODIS, Landsat, and Sentinel platforms to detect land degradation, estimate plant biomass, and track climate-driven vegetation trends [13,14].
Previous research efforts [15,16,17,18] have utilized remote sensing to analyze rangeland vegetation dynamics. For instance, Dara et al. [19] employed Landsat imagery to classify grazing intensity and map grazing pressure in northwest Kazakhstan but did not estimate sustainable LCC due to the inability of remote sensing to distinguish between forage and non-forage biomass. Similarly, De Leeuw et al. [18] used MODIS-derived net primary production (NPP) and a temperature-based correction equation [20] to estimate aboveground biomass in Azerbaijan, concluding that stocking rate exceeded LCC and recommended destocking on slopes exceeding 10%. Their approach, which applied a Proper Use Factor (PUF) of 65%, assumes all vegetation is forage, a simplification that contrasts with more conservative practices, such as those in the United States [21].
Modern approaches increasingly integrate remote sensing and field data to improve the accuracy and spatial resolution of rangeland assessment in dryland environments [22,23]. Studies employing a combination of methods have shown that vegetation responses to climate extremes and grazing intensity are central to assessing rangeland condition changes in semi-arid and arid regions [14,24,25].
In Central Asia, one of the most comprehensive remote sensing applications for rangeland condition monitoring integrated Sentinel-2 imagery with field geobotanical surveys across six regions in Kazakhstan [26]. This study highlighted the use of vegetation indices such as leaf-area index (LAI), fraction of absorbed photosynthetically active radiation (FAPAR), and canopy chlorophyll content (CCC) to evaluate rangeland productivity and biomass dynamics, while also estimating livestock-carrying capacity at the district level [26].
Accurate LCC estimation requires models that account for a broader range of environmental and management factors, including forage quality, species composition, toxic weeds, water accessibility, terrain slope, grazing duration, weather conditions, and supplemental feeding practices during non-grazing periods. Since remote sensing alone has limitations in distinguishing forage from non-forage biomass, estimating grazing efficiency, and assessing the influence of site-specific factors like soil conditions and livestock behavior, our framework incorporates field-based measurements to validate remotely sensed estimates. However, field-based measurements without the support of remote sensing also have limitations, as they are typically confined to specific study areas and lack scalability to broader regions because of prohibitive cost limitation.
Current methods often rely on NPP-based estimates without considering these variables [1,21], leading to potential overestimations of forage availability. A more comprehensive modeling approach is needed to integrate these factors and provide realistic LCC assessments.
This study aims to develop and validate a geospatial livestock-carrying capacity (GLCC) modeling framework that combines field-based stocking rate estimates with remotely sensed data to provide current LCC. The framework will quantitatively map LCC by incorporating key variables such as available forage, grazing duration, terrain slope, travel distance to water, and grazing efficiency. Grazing efficiency refers to the share of total above ground plant growth that livestock consume through grazing. It is a critical parameter in estimating the intensity of forage use and interpreting modeled rangeland condition. By addressing these factors, the study supports Kazakhstan’s agro-industrial development and food security goals, ensuring that livestock production contributes to sustainable economic growth, particularly in the Akmola region. The GLCC model is intended to assist policymakers, planners, and researchers in setting priorities for sustainable land management and resource allocation. The model is best applied as a point-in-time assessment tool for regional to national-scale planning rather than for fine-scale, day-to-day management decisions.

2. Materials and Methods

2.1. A GLCC Modeling Framework

Modeling LCC requires integrating ecological, environmental, and management factors to ensure accurate and sustainable estimates [4,17,27,28]. Ecological conditions such as plant species composition, plant species diversity, invasive and noxious plants, toxicity, and grazing tolerance directly influence the quantity and quality of available forage, which is a critical input for LCC calculations. Additionally, the class of livestock must be considered, as different species or classes exhibit varying foraging behaviors. For example, goats can browse shrubs that are typically avoided by cattle, necessitating species-specific adjustments in LCC models. The integration of remote sensing with field-based data is essential for capturing both spatial and contextual variation in rangeland systems.
Environmental factors, including geophysical factors, soil characteristics, terrain steepness, plant community types, proximity to water resources, and climatic conditions (e.g., temperature, precipitation, and extreme weather events), also play a significant role in determining LCC. The model incorporates environmental inputs through remote sensing data, such as precipitation and temperature, at the time of model parameterization and execution. However, due to limitations in the availability of the field-based measurements, the model does not simulate sub-seasonal or ongoing climate fluctuations. Annual composites were selected to match the temporal resolution of field data collection, ensuring consistency across input sources and aligning with the model’s purpose as a regional planning tool. Steep slopes and long distances to water sources can restrict livestock movement and reduce grazing efficiency, while climatic stressors such as droughts and heatwaves can limit forage availability and quality. These environmental factors collectively influence livestock-grazing patterns, energy expenditure, and overall productivity.
Management practices further complicate LCC estimation. The duration of the grazing season, supplemental feeding strategies, and the nutritional quality of supplemental rations must be accounted for to ensure accurate modeling. Supplemental feeding, for instance, can offset forage deficits during non-grazing periods but requires careful consideration of feed quality and availability.
Given these complexities, a simplified LCC model for a ranch site can be expressed as a function of the following key variables:
L C C ( N A ) = G A × A F × D × W × S D U × D F I
and
A F = ( A N P P A N F P ) × G E
where
  • AF = Available forage (kg/ha/year), the proportion of ANPP that is accessible and suitable for livestock consumption, adjusted for factors such as plant toxicity and species-specific preferences, known as aboveground non-forage productivity (ANFP) and grazing efficiency (GE, default 35%).
  • ANPP = Aboveground net primary production (kg/ha/year), the total biomass produced by vegetation, which serves as the primary source of forage.
  • GA = The total area (ha) available for livestock grazing.
  • DFI = Daily feed intake (kg/day/animal), specific to livestock species (e.g., cattle vs. goats).
  • DU = Days of use, the duration of the grazing season, reflecting the period over which forage is utilized.
  • D, W, S = Adjustments for climate extremes such as climate-related droughts (D), distance to water (W), and terrain slope (S).
Ecological drivers (ANPP, ANFP, GA) and environmental adjustments (D, W, S) can be quantified using remote sensing and geospatial data, while management variables (DU, DFI) incorporate field surveys or operational data. By integrating these inputs, the model estimates spatially explicit geospatial LCC or GLCC (Figure 2), scaling site-level calculations to regional assessments of sustainable livestock density (NA/unit area).

2.2. Model Parameterization

2.2.1. Remotely Sensed Parameters

The GLCC model integrates multisource remote sensing data to quantify ecological and environmental drivers of livestock-carrying capacity (Table 1). Landsat imagery classifies land use and land cover (LULC) to delineate GA and calculate W. MODIS NPP products provide spatially explicit estimates of the ANPP, a critical input for determining AF (Equation (2)). These data are supplemented by Shuttle Radar Topography Mission (SRTM) Digital Elevation Models (DEMs), which derive terrain slope S, a key factor influencing livestock-grazing accessibility and behavior. All datasets were rigorously validated for accuracy and consistency with field observations, ensuring suitability for regional-scale GLCC modeling. For example:
  • MODIS NPP (1 km spatial resolution, annual composites) aligns with the temporal and spatial scales of forage production dynamics.
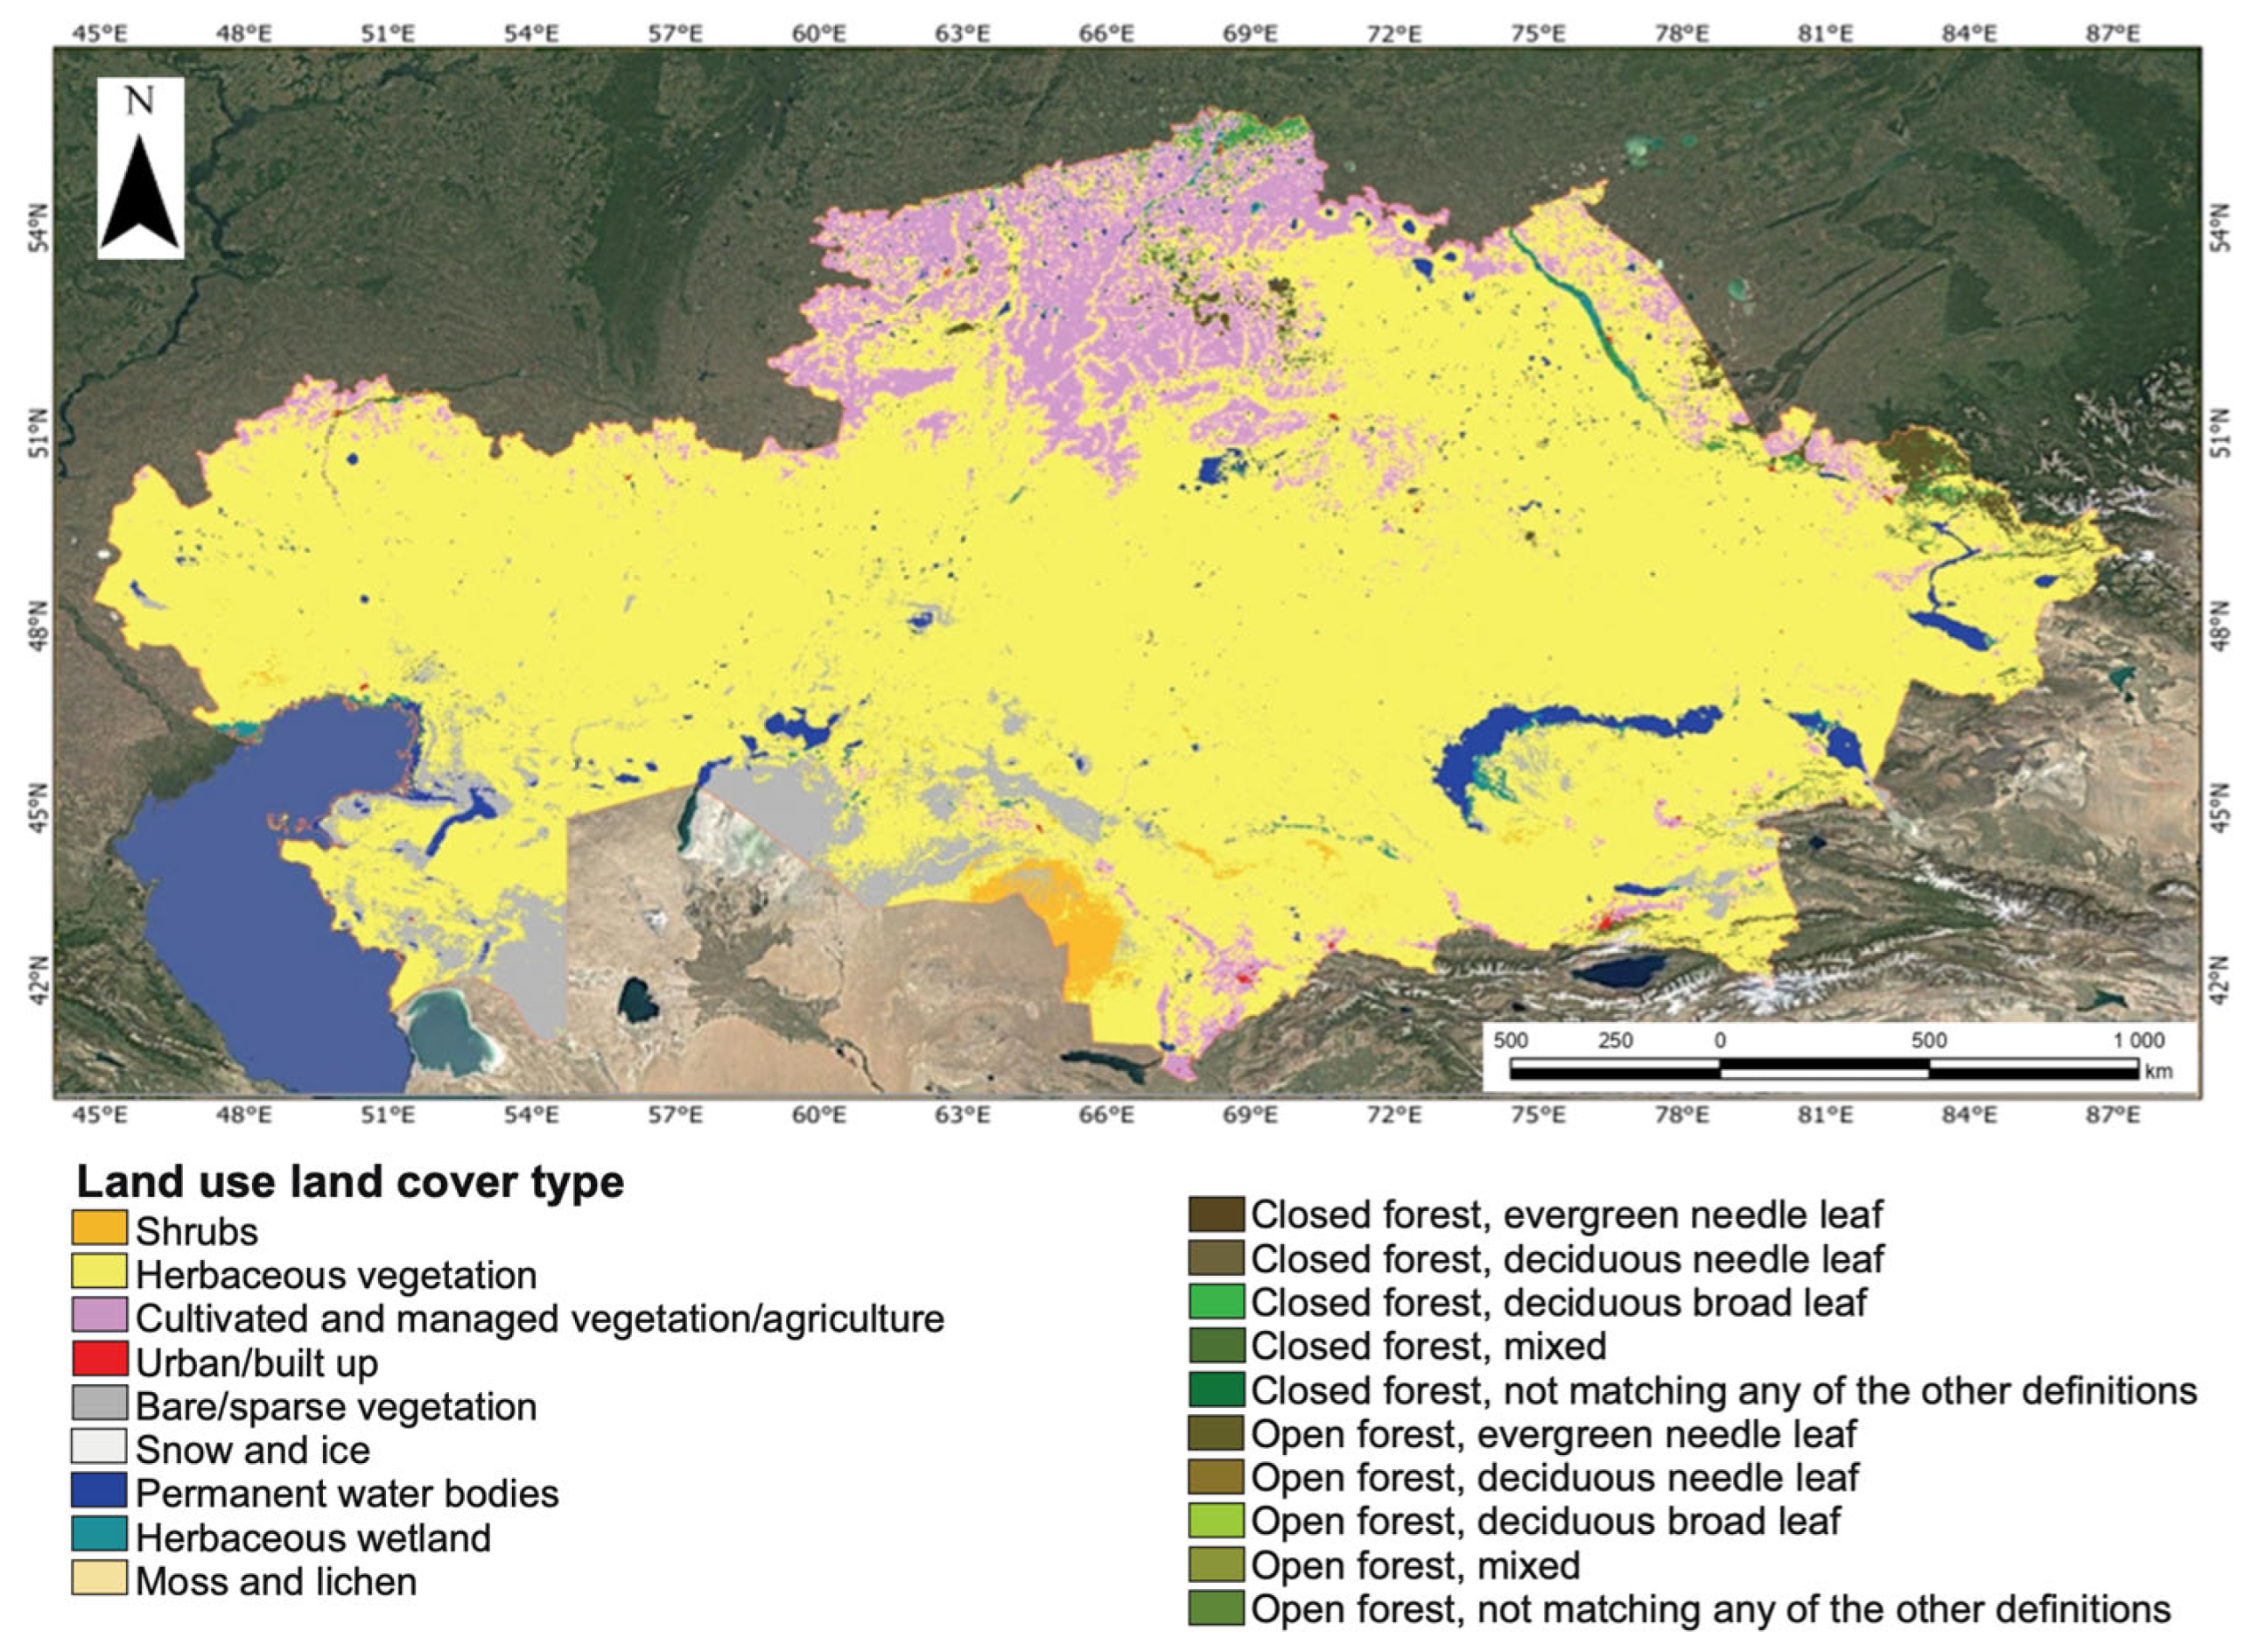
  • Landsat-based LULC (30 m resolution) discriminates between grazable rangelands, non-forage vegetation (e.g., forests, urban areas), and water bodies, directly informing GA and ANFP (non-forage biomass).
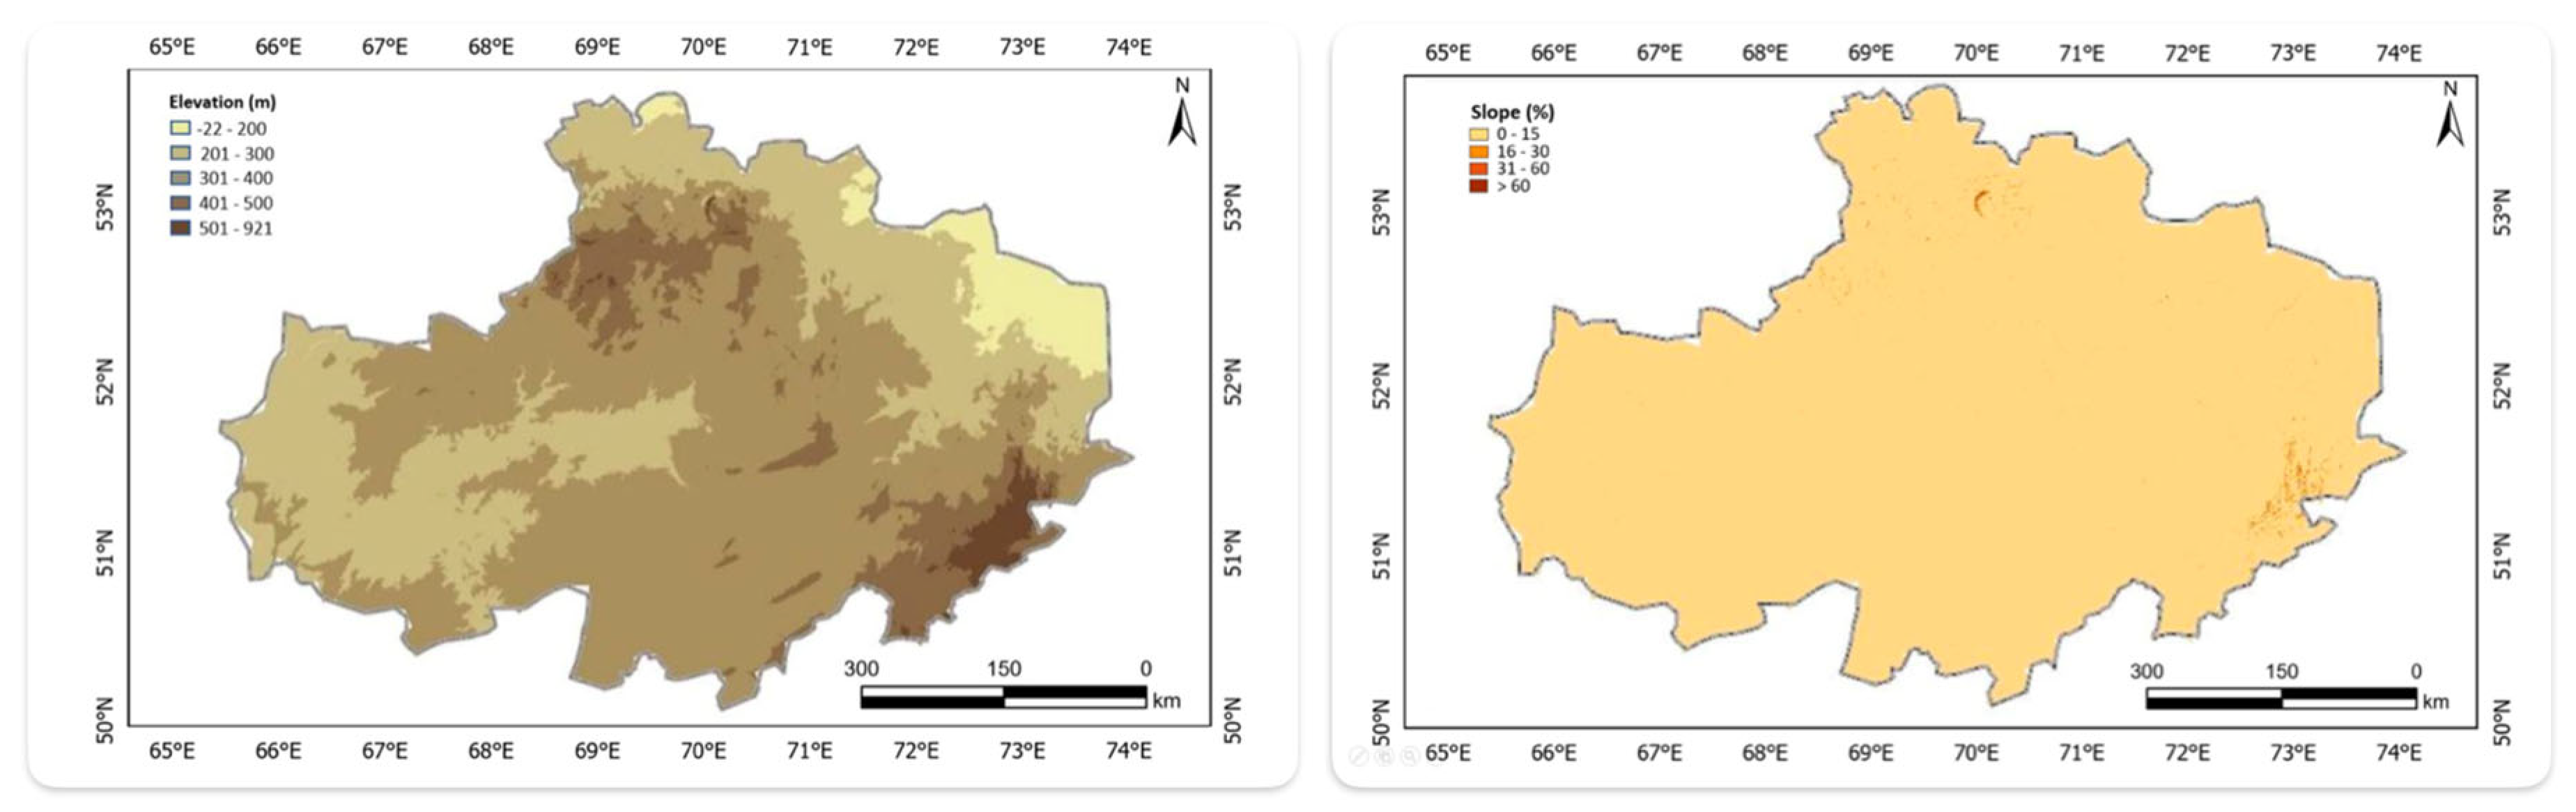
  • SRTM DEM (30 m resolution) calculates slope gradients, with adjustments applied to reflect reduced grazing efficiency in steep terrain.
By harmonizing these geospatial inputs, the model dynamically links ecological productivity (ANPP), environmental constraints (S, W), and management-defined grazing parameters (DU, DFI) to estimate spatially explicit livestock-carrying capacity (Equation (1)). This integration ensures the GLCC framework accounts for both biophysical limitations and operational realities, enhancing its utility for sustainable rangeland management.

2.2.2. Grazing Area, GA

To operationalize the GLCC framework, grazing areas (GAs) were derived from land use and land cover (LULC) data (Table 1, Figure 2), which identified rangelands suitable for livestock grazing. For example, MODIS-based LULC products (500 m resolution, soft classification) provide pixel-level fractional coverage of vegetation types, enabling dynamic thresholding to define GA. In this study, pixels with ≥30% grass cover and <30% water surface (validated through field surveys in Akmola Oblast, Kazakhstan; Figure 3) were classified as grazable rangelands. These thresholds reflect practical trade-offs between forage availability and physical constraints (e.g., waterlogged areas), though they can be calibrated regionally to account for ecological or management differences (e.g., desert vs. temperate grasslands). The resulting grazing area (GA) (in hectares) is then integrated into the GLCC model (Equation (1)) to spatially constrain forage supply calculations, ensuring alignment with real-world grazing landscapes.

2.2.3. Terrain Slope, S

Slope steepness (S) directly impacts livestock-grazing patterns and forage accessibility, necessitating downward adjustments to carrying capacity in steeper terrain to prevent overgrazing in accessible areas [38]. Using Shuttle Radar Topography Mission (SRTM) DEMs, slope gradients are calculated as a percent rise (Figure 4). These values are then converted into adjustment factors (S) based on predefined thresholds:
  • Slopes ≤ 15%: Minimal adjustment (S = 100%), as the terrain does not restrict grazing efficiency (e.g., Akmola Oblast, Figure 4).
  • Slopes > 15%: Progressive reduction in S (e.g., S = 70–90%), reflecting reduced livestock mobility, forage utilization in mountainous regions, higher erosion risks due to significantly higher runoff
Thresholds align with field observations and literature on slope-dependent grazing behavior. For instance, Kazakhstan’s mountainous areas (>15% slope) require region-specific S adjustments, while Akmola’s gentler, predominantly composed of open steppe, terrain (<15%) with limited topographic complexity retains near-full grazing efficiency. The S factor is integrated into the GLCC model (Equation (1)) as a multiplicative correction, ensuring spatially explicit estimates account for topographic constraints.

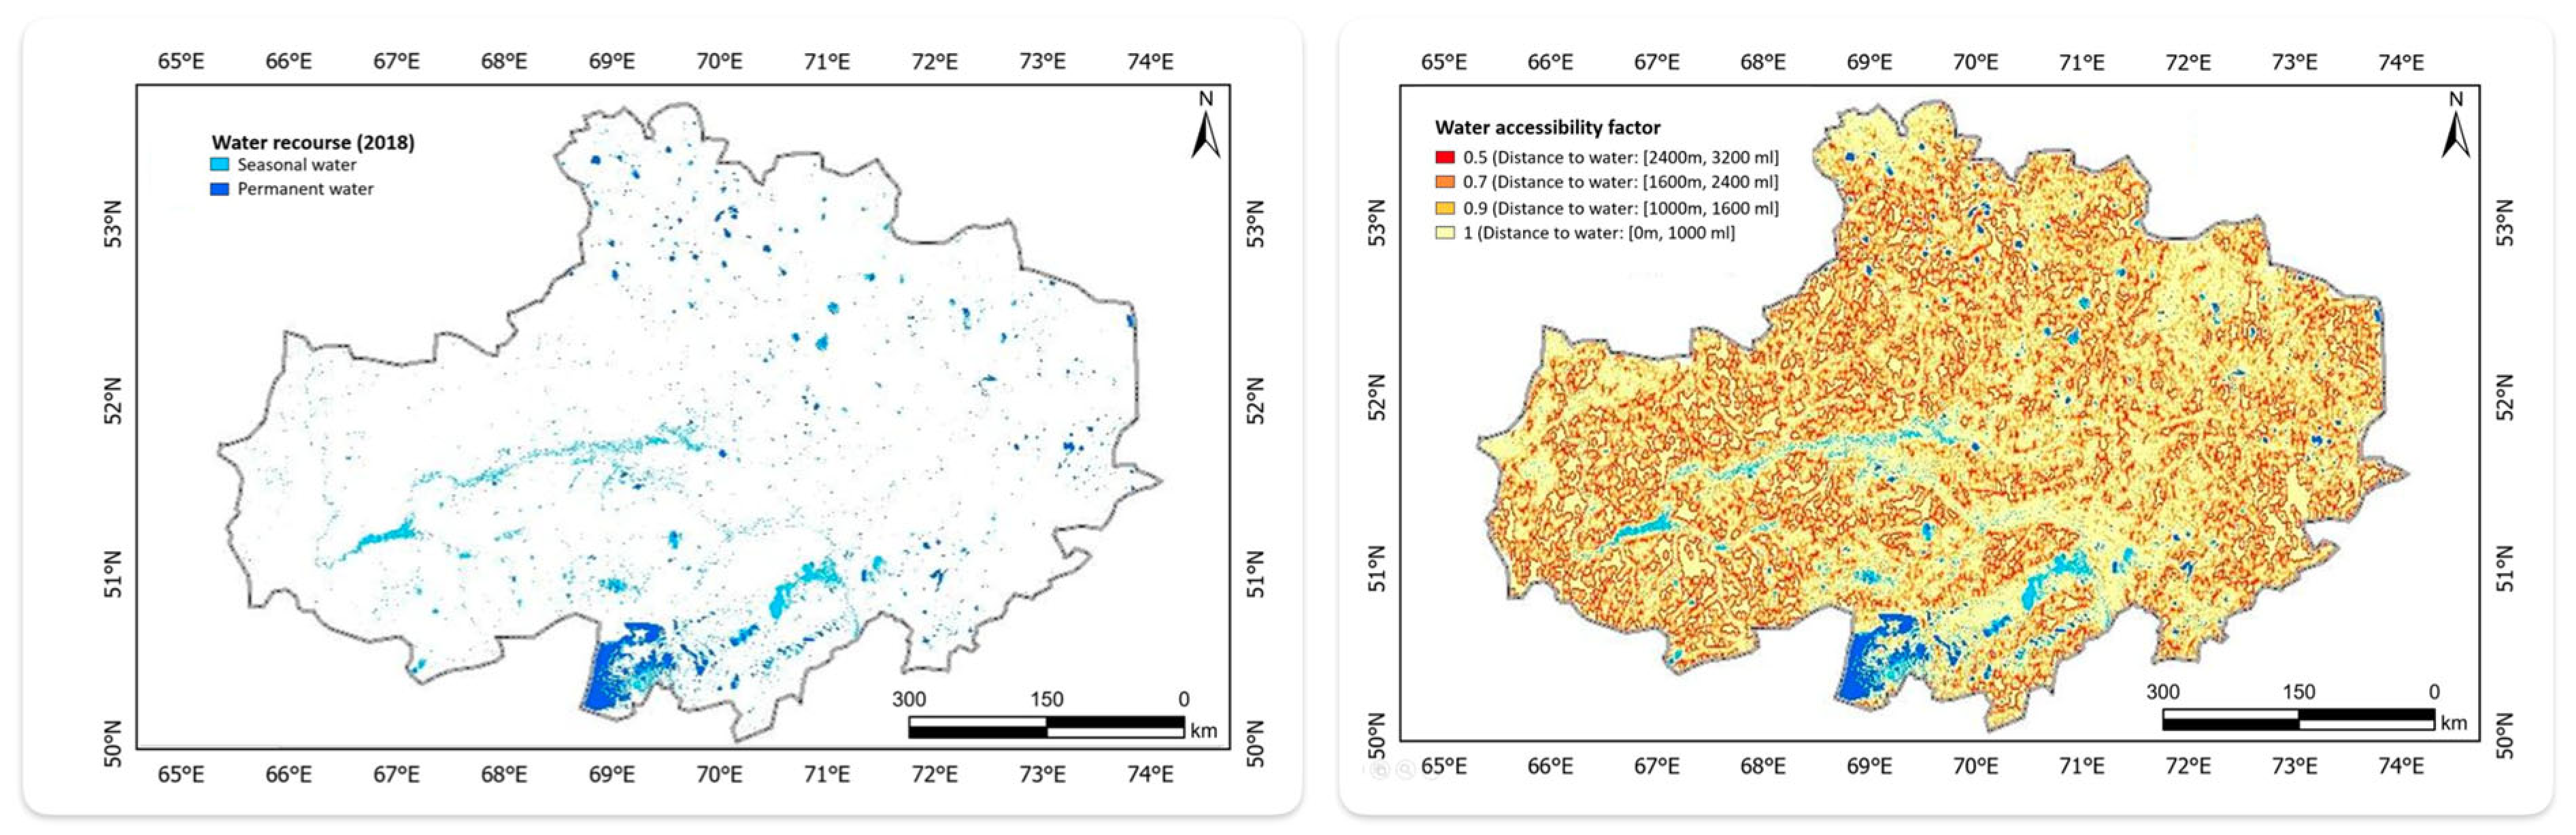
2.2.4. Distance to Water Area, W

Water accessibility (W) is a critical determinant of livestock-carrying capacity, as grazing intensity declines with increasing distance from reliable water resources. In Akmola Oblast, seasonal variability (e.g., ephemeral ponds, fluctuating streams like the Yesil River) and limited across to permanent water bodies (e.g., lakes reserved for recreation) necessitate spatially explicit adjustments (Figure 5). Using remote sensing-derived water surface maps (Table 1), W is calculated as follows:
  • Identify accessible water sources: Seasonal water bodies within grazing areas (e.g., streams, ponds) are prioritized, excluding inaccessible permanent reservoirs.
  • Compute distance thresholds: For each grazing pixel, Euclidean distance to the nearest accessible water source is calculated using GIS tools.
  • Apply adjustment factors:
    ≤3 km to water: Minimal reduction (W = 100%), reflecting optimal grazing efficiency.
    >3 km: Progressive reduction (e.g., W = 70–90%), based on empirical observations of livestock-grazing radius limitations.
In Akmola, where seasonal water scarcity is pronounced (Figure 5), W adjustments account for cyclic drought phases and human impacts on water flow. For instance, during dry years, W values may be further reduced to reflect diminished water availability. These adjustments are integrated into the GLCC model (Equation (1)) alongside slope (S) and climate-related drought (D) factors, ensuring realistic estimates of forage utilization.

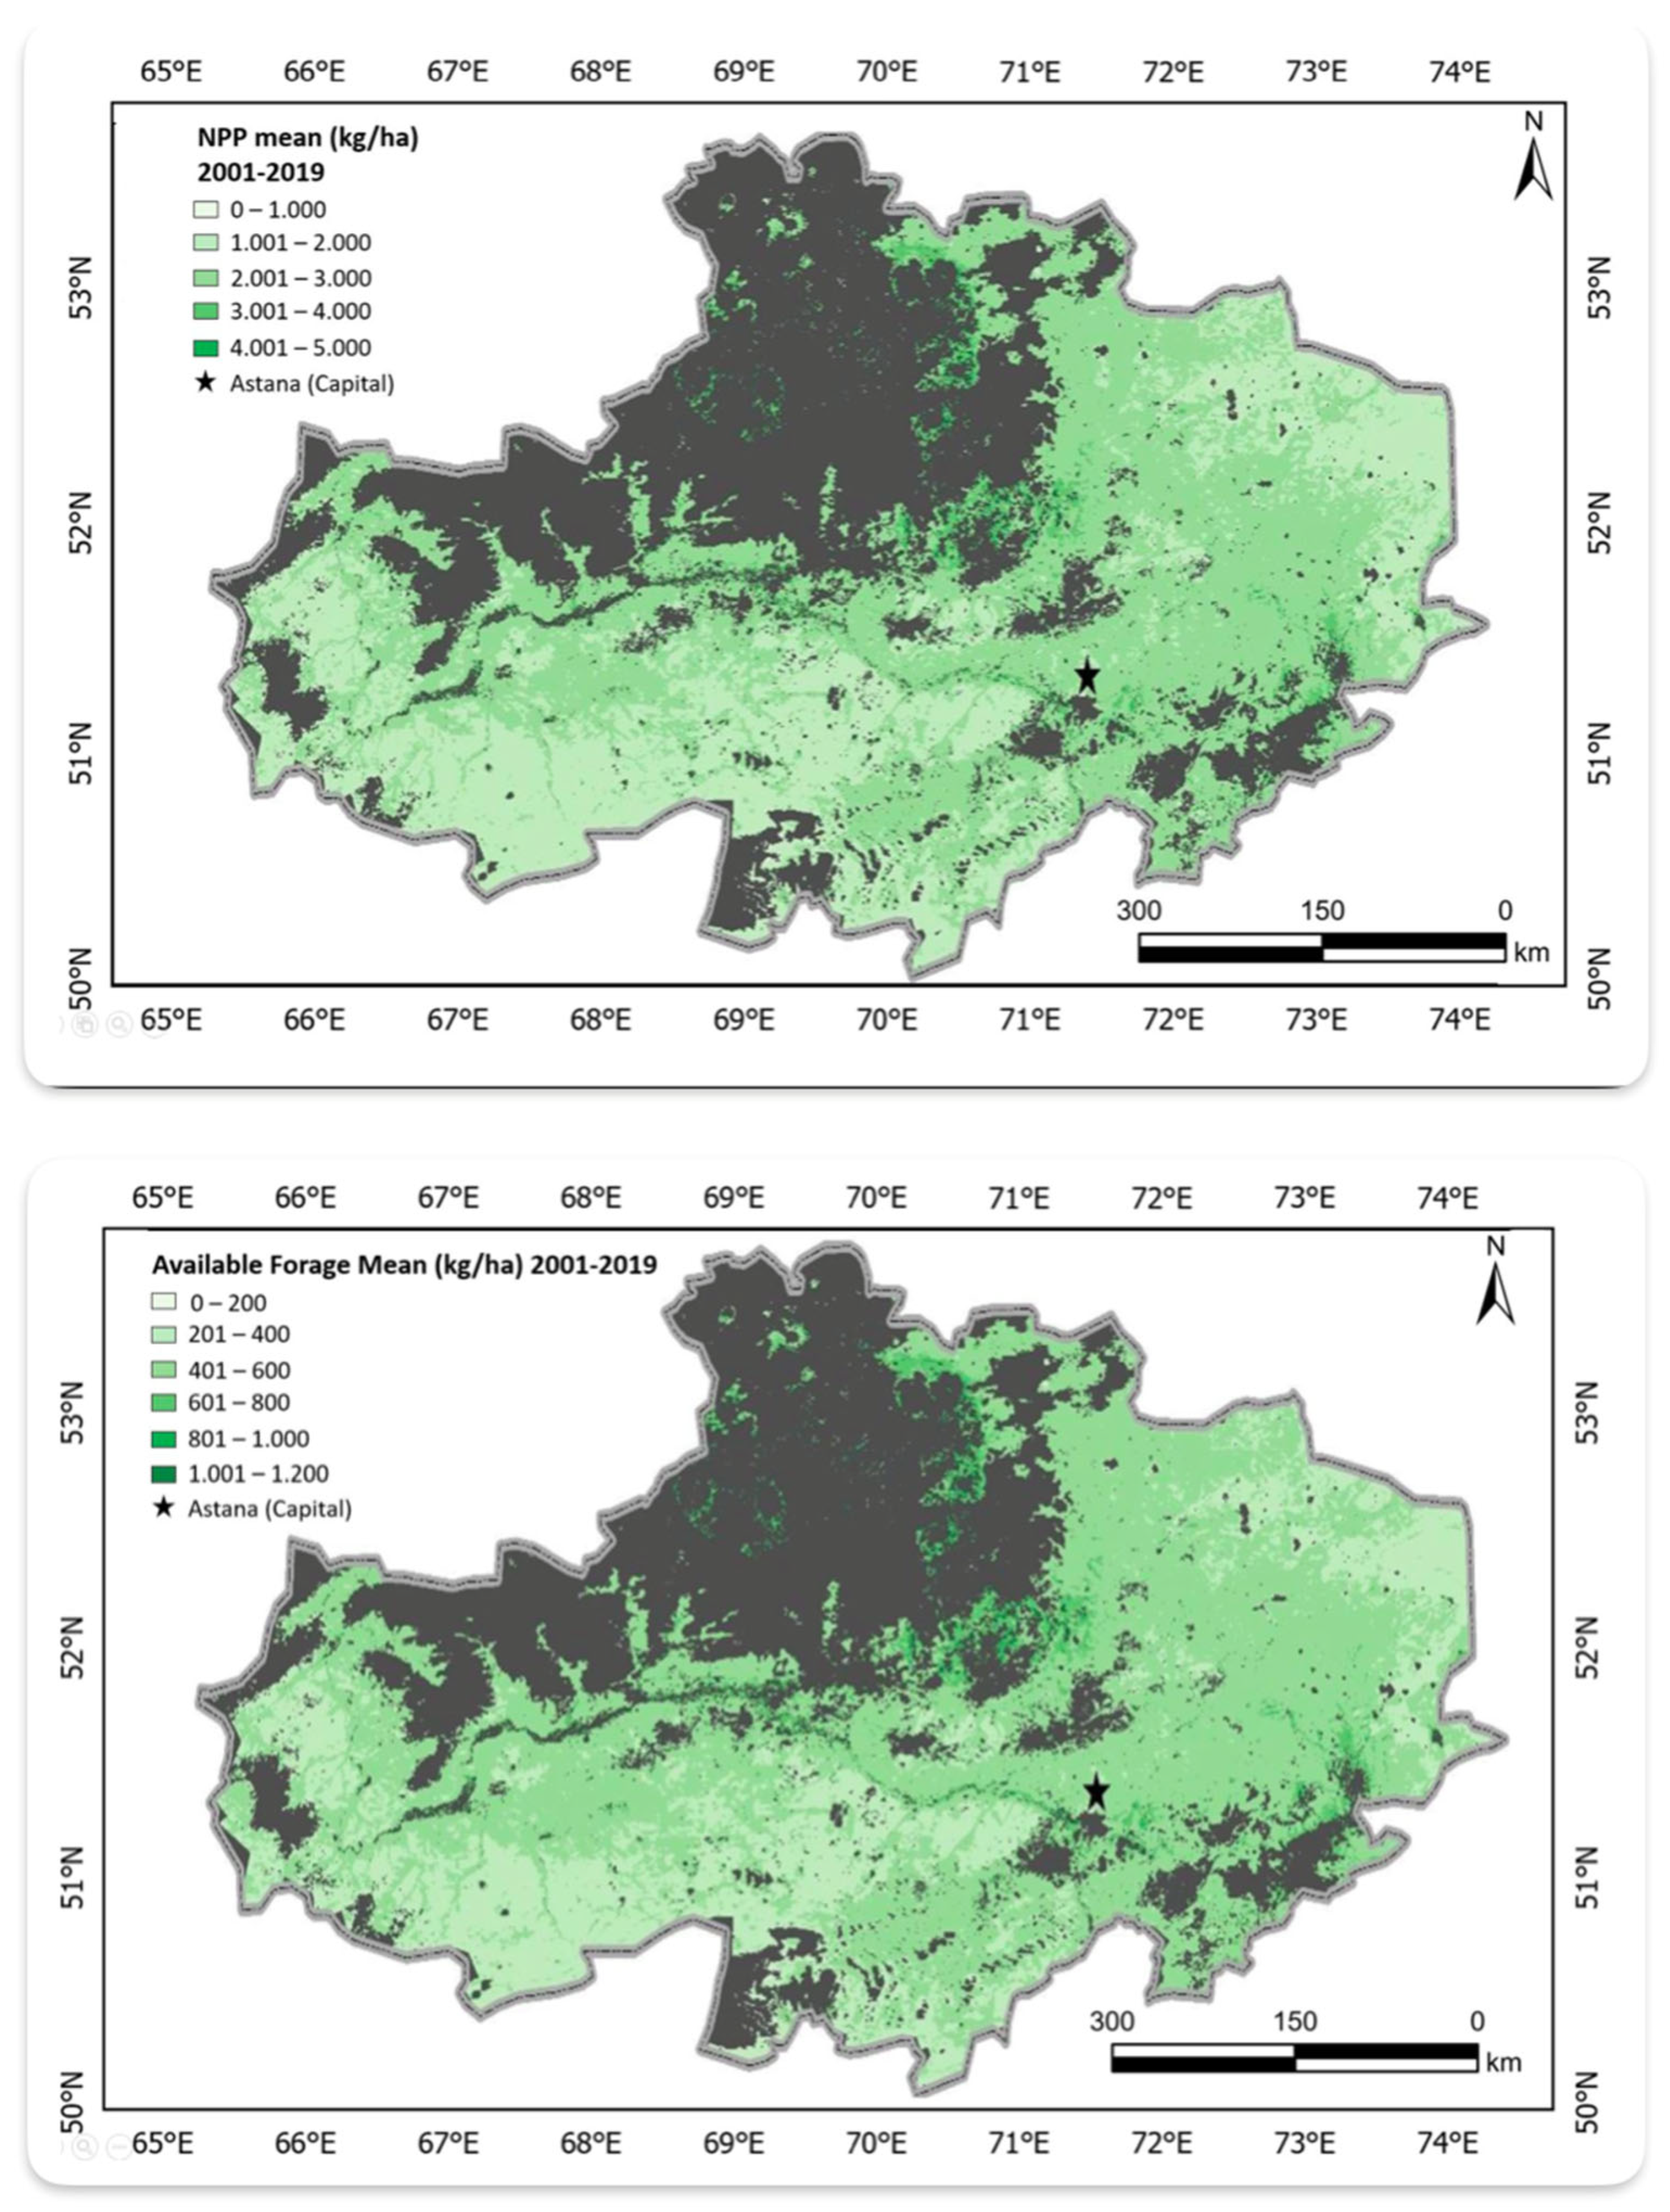
2.2.5. Aboveground Net Primary Productivity and Available Forage

Aboveground net primary productivity (ANPP) represents the total dry plant biomass produced annually and is derived from MODIS NPP products (Figure 6), which include total net primary productivity of both belowground and aboveground biomass. To isolate the aboveground component relevant to livestock grazing, a region-specific conversion factor is applied. For Central Asia’s grasslands, which reflect moderate grazing pressure in semi-arid rangeland, field studies and literature [39,40] indicate that 37% of total NPP represents ANPP (i.e.,  A N P P = N P P × 0.37 ). This accounts for the proportional allocation of biomass to aboveground versus belowground plant structures in arid to semi-arid ecosystems. However, not all ANPP is consumable by livestock. To address this, available non-forage productivity (ANFP) refers to the fraction of total biomass that is unsuitable for grazing—the non-forage portion of total biomass, such as toxic, woody, or unpalatable species—therefore excluded from the calculation of available forage. Field surveys in Central Asia estimate non-forage biomass at 20% of ANPP, leaving 80% as potentially available forage (AF). This estimate was derived from vegetation surveys conducted across 51 rangeland sites in Akmola Oblast, where the proportion of unpalatable or avoided species was recorded [41]. The above-mentioned adjustment into the calculation of the AF is expressed as follows:
A F = A N P P A N F P × G E = ( 0.8 × A N P P ) × 0.35
The 35% grazing efficiency (GE) used in this study was tailored for Akmola Oblast based on a combination of expert consultation, literature guidance, and field data collected from 51 ranches across the region (see Section 2.3.1 for details) [41]. GE represents the proportion of total annual forage production (ANPP) that is actually consumed by livestock typically ranging from 30–50% in semi-arid rangelands [42]. It accounts for forage that must be left for plant recovery, as well as losses due to trampling, selective grazing, ungrazed residue, and terrain inaccessibility. The selected 35% GE reflects a conservative and sustainable rate, consistent with the widely accepted “take half, leave half” principle [43]. Under this guideline, approximately 50% of forage is considered harvestable, of which only about 70% is typically consumed by livestock (the unconsumed portion consisting mostly of trampled vegetation or non-forage plants), resulting in an effective grazing efficiency of 35% [44]. Observed grazing practices in Akmola Oblast showed moderate utilization and further justify a conservative estimate. This value aligns with published benchmarks for semi-arid rangelands [38,41,42,44] and supports sustainable stocking and rangeland health under local conditions. The final AF value (kg/ha/year) is integrated into the GLCC model (Equation (1)) to quantify forage supply (Figure 6).
Remote sensing data were validated using field measurements collected during ground surveys. These included estimates of vegetation cover, species composition, and biomass, which were compared with satellite-derived LCC indicators. Ground-truthing was conducted at multiple points across representative ecological zones within the study area (orange dots in Figure 3) [41]. Consistency between field and satellite data was assessed through visual comparison, qualitative scoring, and correlation analysis where applicable as detailed below and in earlier publication [41]. Limitations in this process included potential mismatches in spatial resolution, timing of data acquisition, and observer variability in field assessments.

2.3. Model Validation and Application
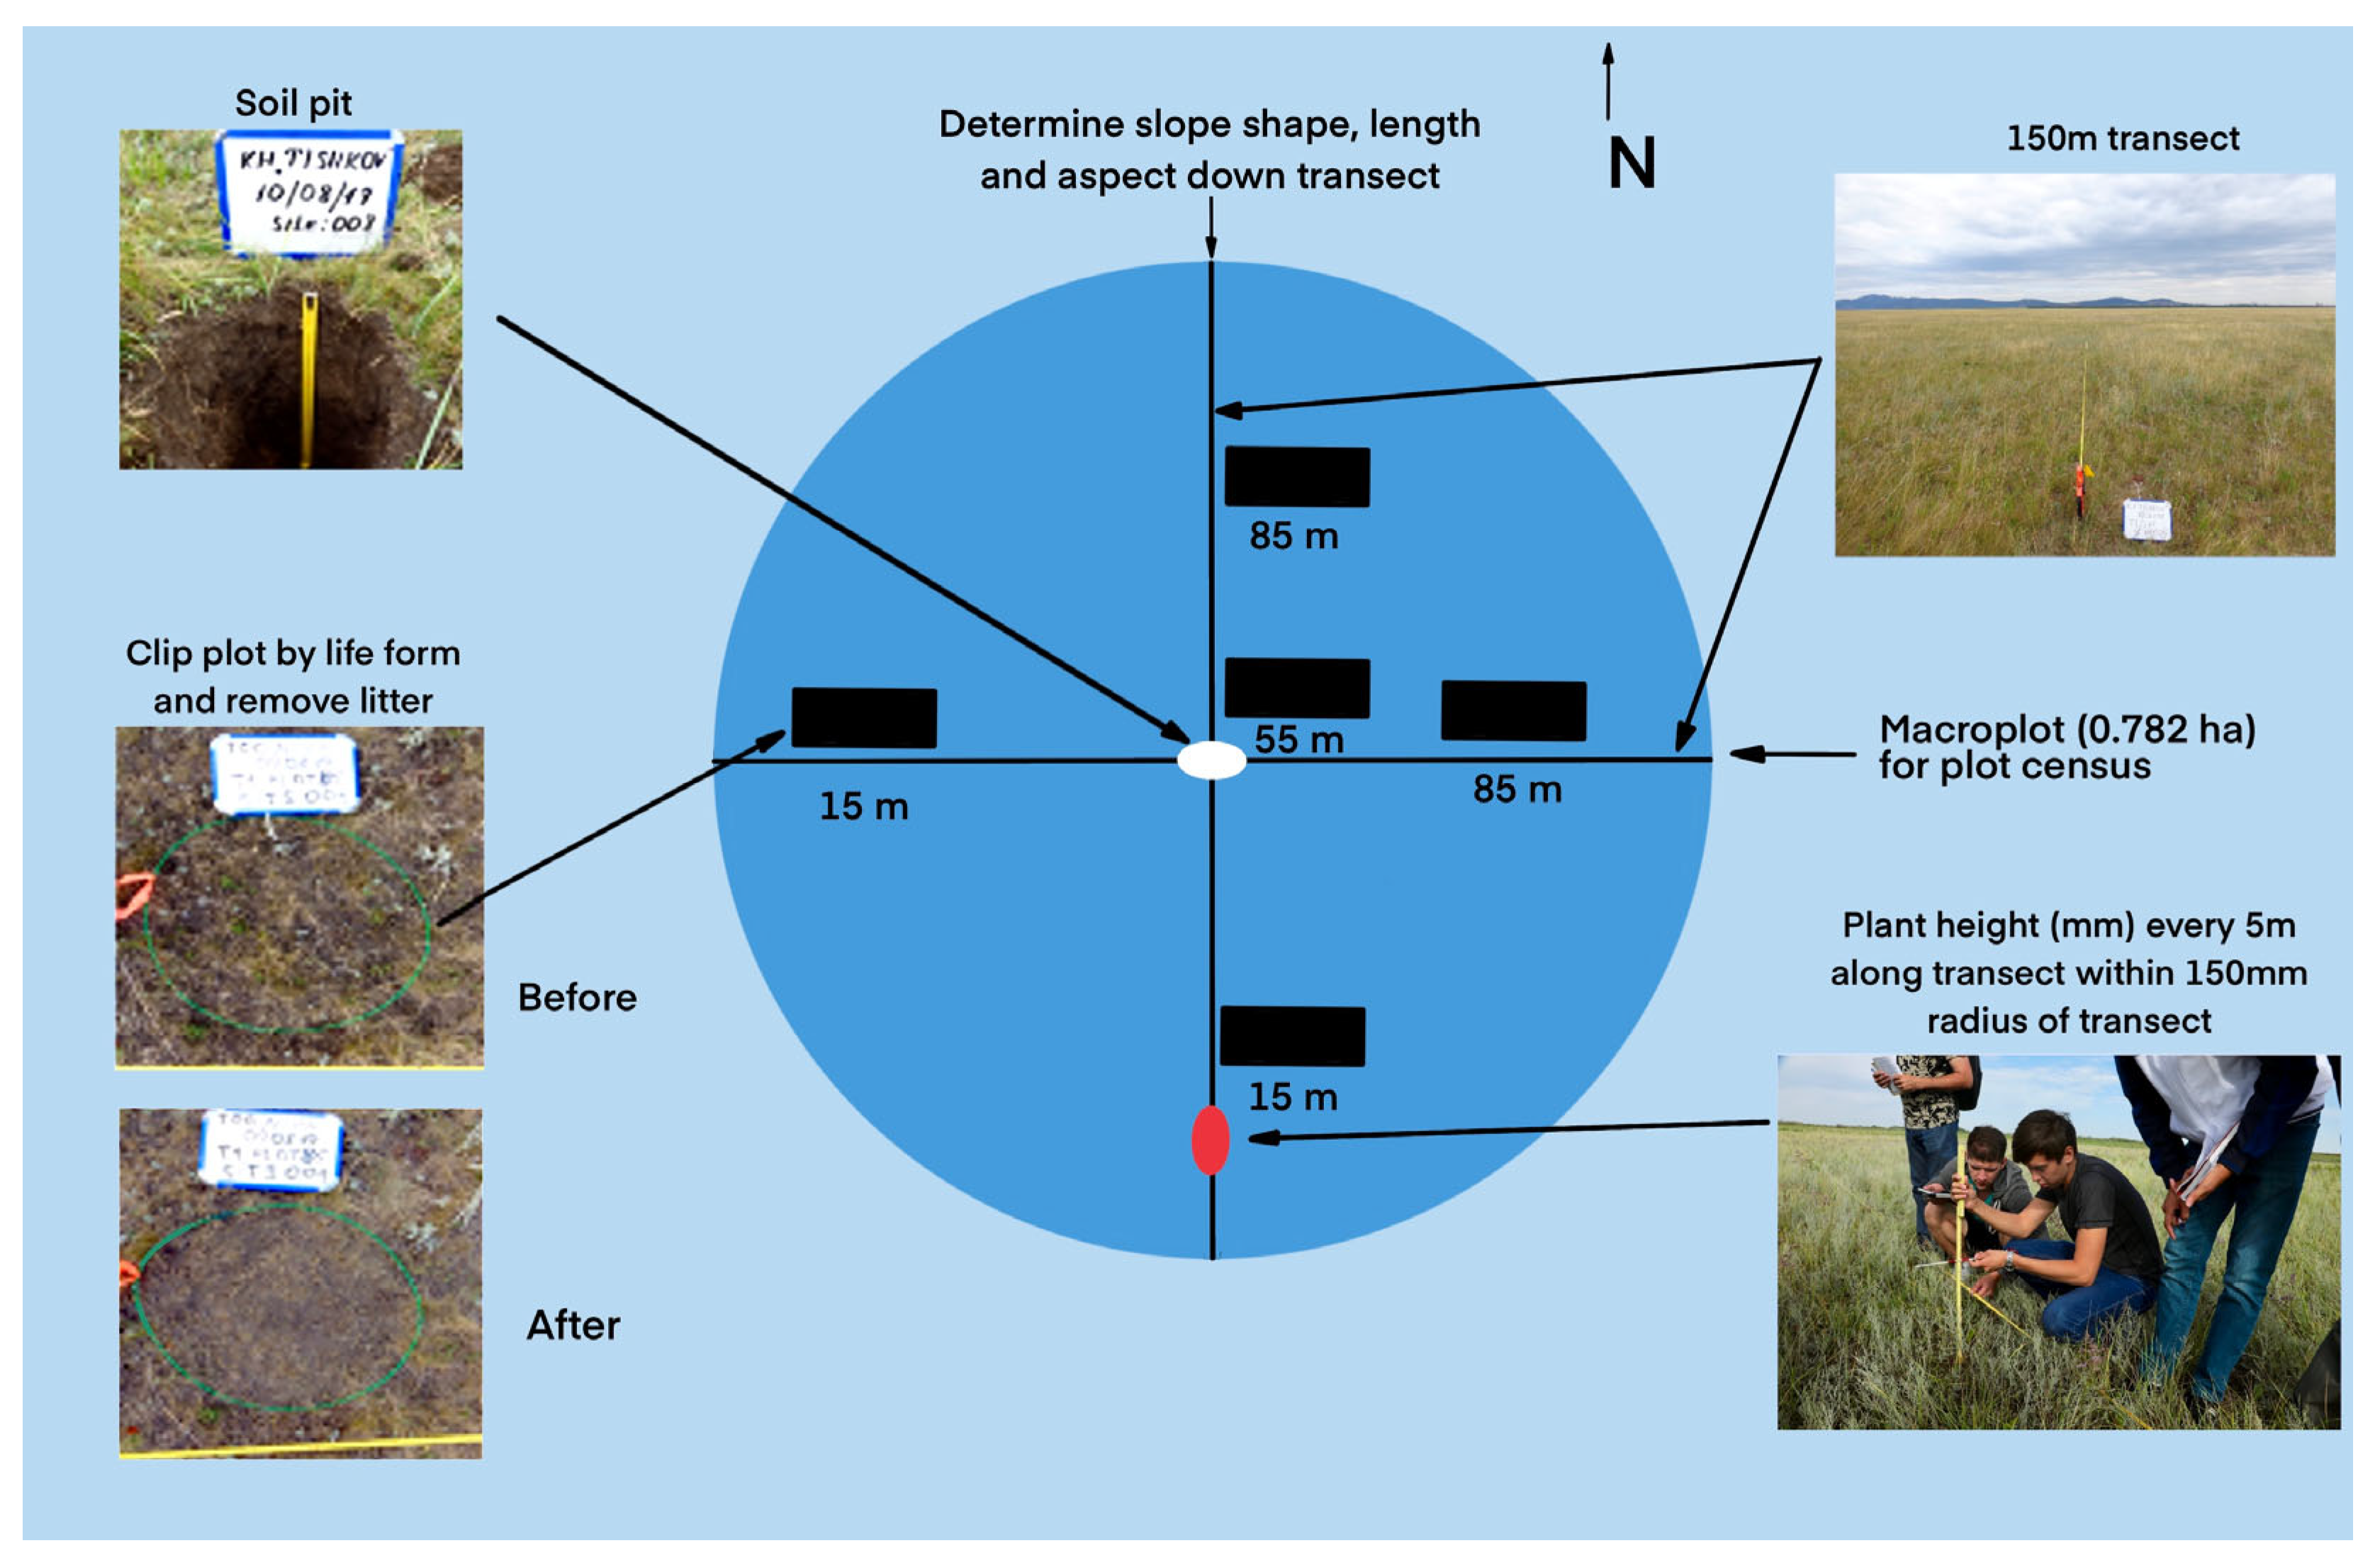
2.3.1. In Situ Data

To validate the GLCC model, 51 rangeland sites across the Akmola Oblast, Kazakhstan, were sampled following the USDA National Resources Inventory [43] protocol (Figure 7). The methods, detailed in [41], are summarized below:
Each sampling site consists of two 100 m intercepting transects and represents a 0.782 ha area. Sampling plots for standing biomass assessment were established along these transects. Data collection focused on plant species composition, soil characteristics, slope, animal characteristics, and ranch management practices, which were calibrated to the GLCC model. The geographic coordinates were recorded at each site to enable spatial integration with remote sensing layers. This georeferencing allowed for spatial overlay between field measurements and satellite-derived indicators (such as MODIS NPP), supporting the validation of remote sensing inputs and the GLCC model outputs. Visual inspections and qualitative assessments were conducted to ensure that land cover classifications (e.g., grassland, shrubland, water bodies) matched observed field conditions. High-resolution photographs were also taken at each site to support data interpretation.
  • Vegetation Sampling
    • Standing biomass (kg/ha): Sampled from five 0.25 m² quadrats per site, dried, and weighed.
    • Species composition: Plant species identified, with density classified into five categories (1–10, 11–100, 101–500, 501–1000, >1000 plants).
    • Foliar/ground cover (%): Measured via line-point intercept (100 points/transect), distinguishing life forms (bunchgrass, sodgrass, forb, shrub, etc.).
    • Plant height (mm) and litter biomass: Recorded to assess forage structure and residue.
  • Soil and Topographic Data
    • Soil properties: Texture, pH, organic carbon, and color analyzed from top 25 mm samples.
    • Slope, aspect, and terrain shape: Georeferenced to align with SRTM DEM-derived variables (S).
  • Management Context
    • Grazing intensity: Classified as none, light, moderate, or heavy continuous grazing (April–October).
    • Water access: Proximity to seasonal/permanent sources noted for W adjustment validation.
  • Geographic and Environmental Data
    • Geographic coordinates (latitude and longitude) were recorded for each site.
    • Terrain characteristics, including slope steepness, shape, length, and aspect, were documented.
    • Climatic conditions during the sampling period were noted.
This comprehensive dataset provides a robust foundation for validating the GLCC model, ensuring that it accurately reflects the ecological and management dynamics of rangelands in the Akmola Oblast.

3. Results

Important insights about the rangeland livestock-carrying capacity were obtained using the GLCC model and the parameters calibrated for the Akmola Oblast, briefly summarized here followed by detailed discussions:
  • There is a significant spatial variability across the Oblast in livestock-carrying capacity with a general decreasing trend from south to north and localized high-and-lows, suggesting that a spatially variable grazing management practice is needed, as detailed in Section 3.1.
  • There is a significant annual temporal variability in livestock-carrying capacity across the region, indicating that forage availability differs from year to year possibly due to annual variations in climate or grazing pressure. This suggests challenges in livestock management planning because of uncertainties in weather patterns, as detailed in Section 3.2.
  • There is therefore a grazing suitability difference across the region because of the spatial variability of livestock-carrying capacity in the region. The suitability indicator is a result of both localized carrying capacity values and their annual variabilities, as detailed in Section 3.3.

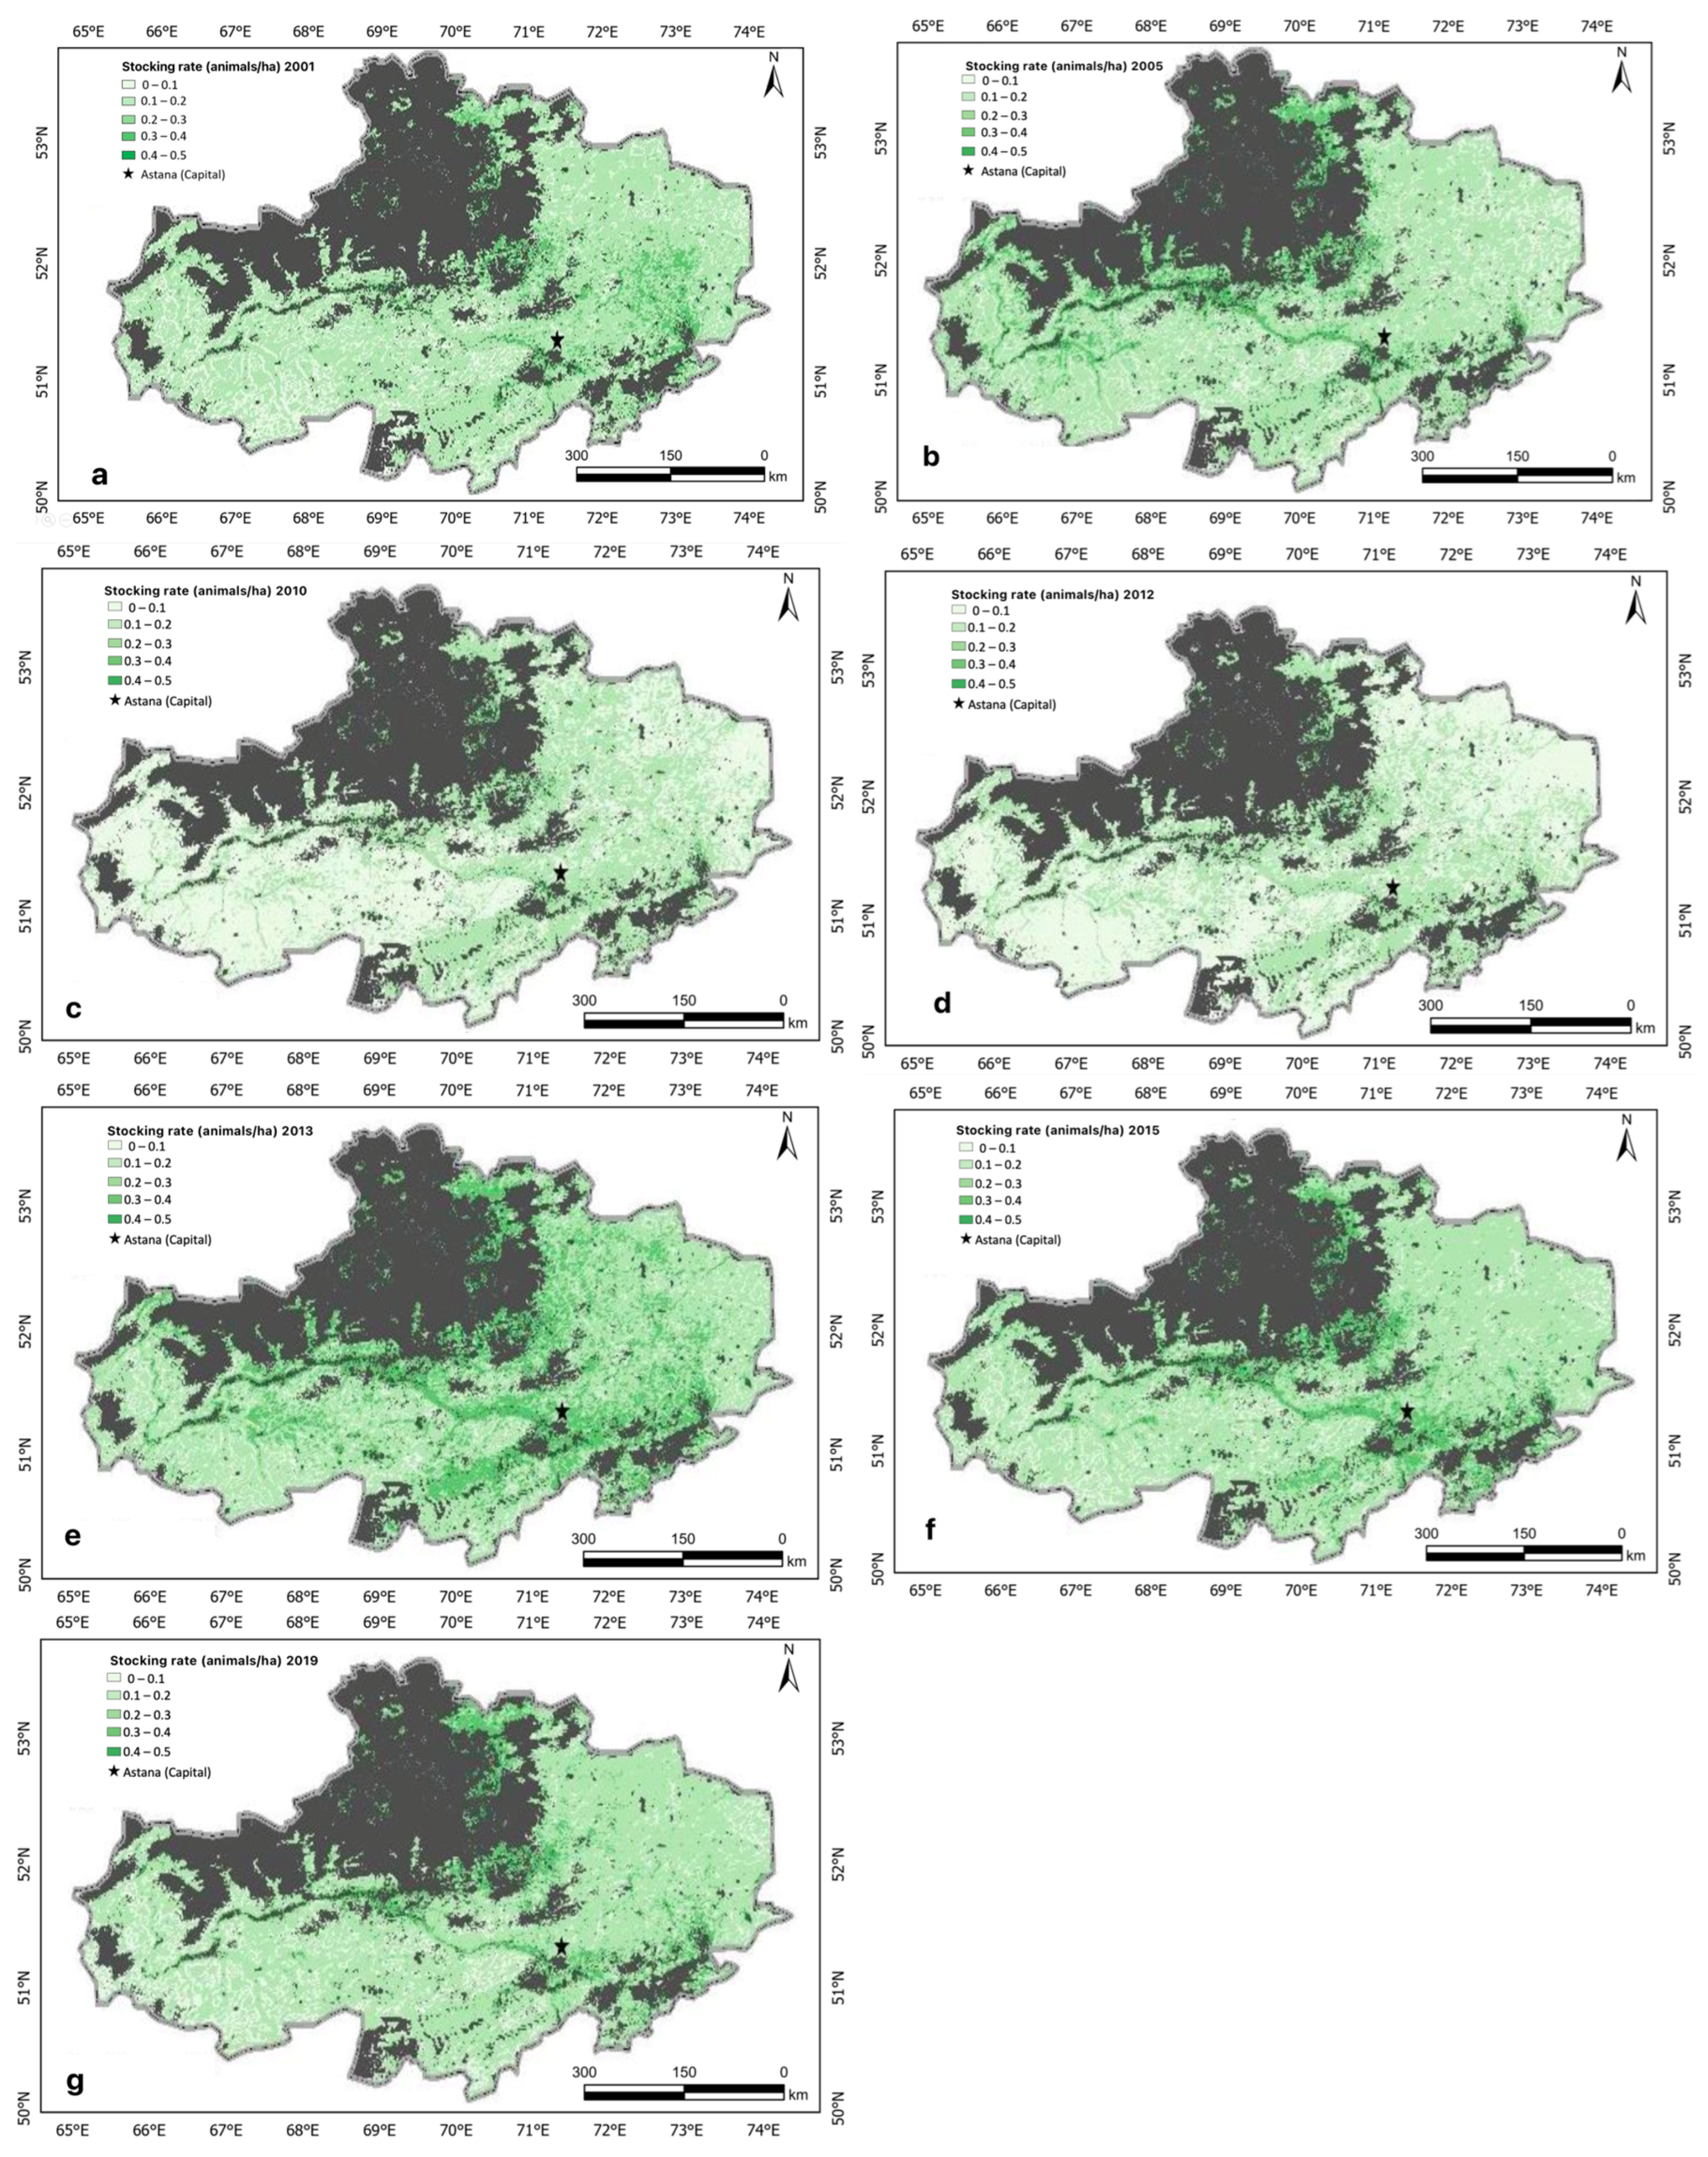
3.1. Spatial Patterns of Livestock-Carrying Capacity in the Akmola Oblast

Using the GLCC framework (Figure 2) and integrating remote sensing products and associated environmental factors, the spatio-temporal patterns of livestock-carrying capacity were calculated from 2001 to 2019. Key changes in stocking rate over time are illustrated in years: 2001, 2005, 2010, 2012, 2013, 2015, 2019 (Figure 8a–g). The results revealed distinct geographic and temporal trends in LCC across the Akmola Oblast. First, geographically, the southern part of the Oblast exhibits higher LCC, particularly along river corridors and streams. These areas likely have high forage density and easier access to water resources, supporting up to 0.5 animals per hectare. The southeastern region and riverine zones emerged as hotspots for LCC, reflecting the influence of favorable ecological conditions on livestock productivity.

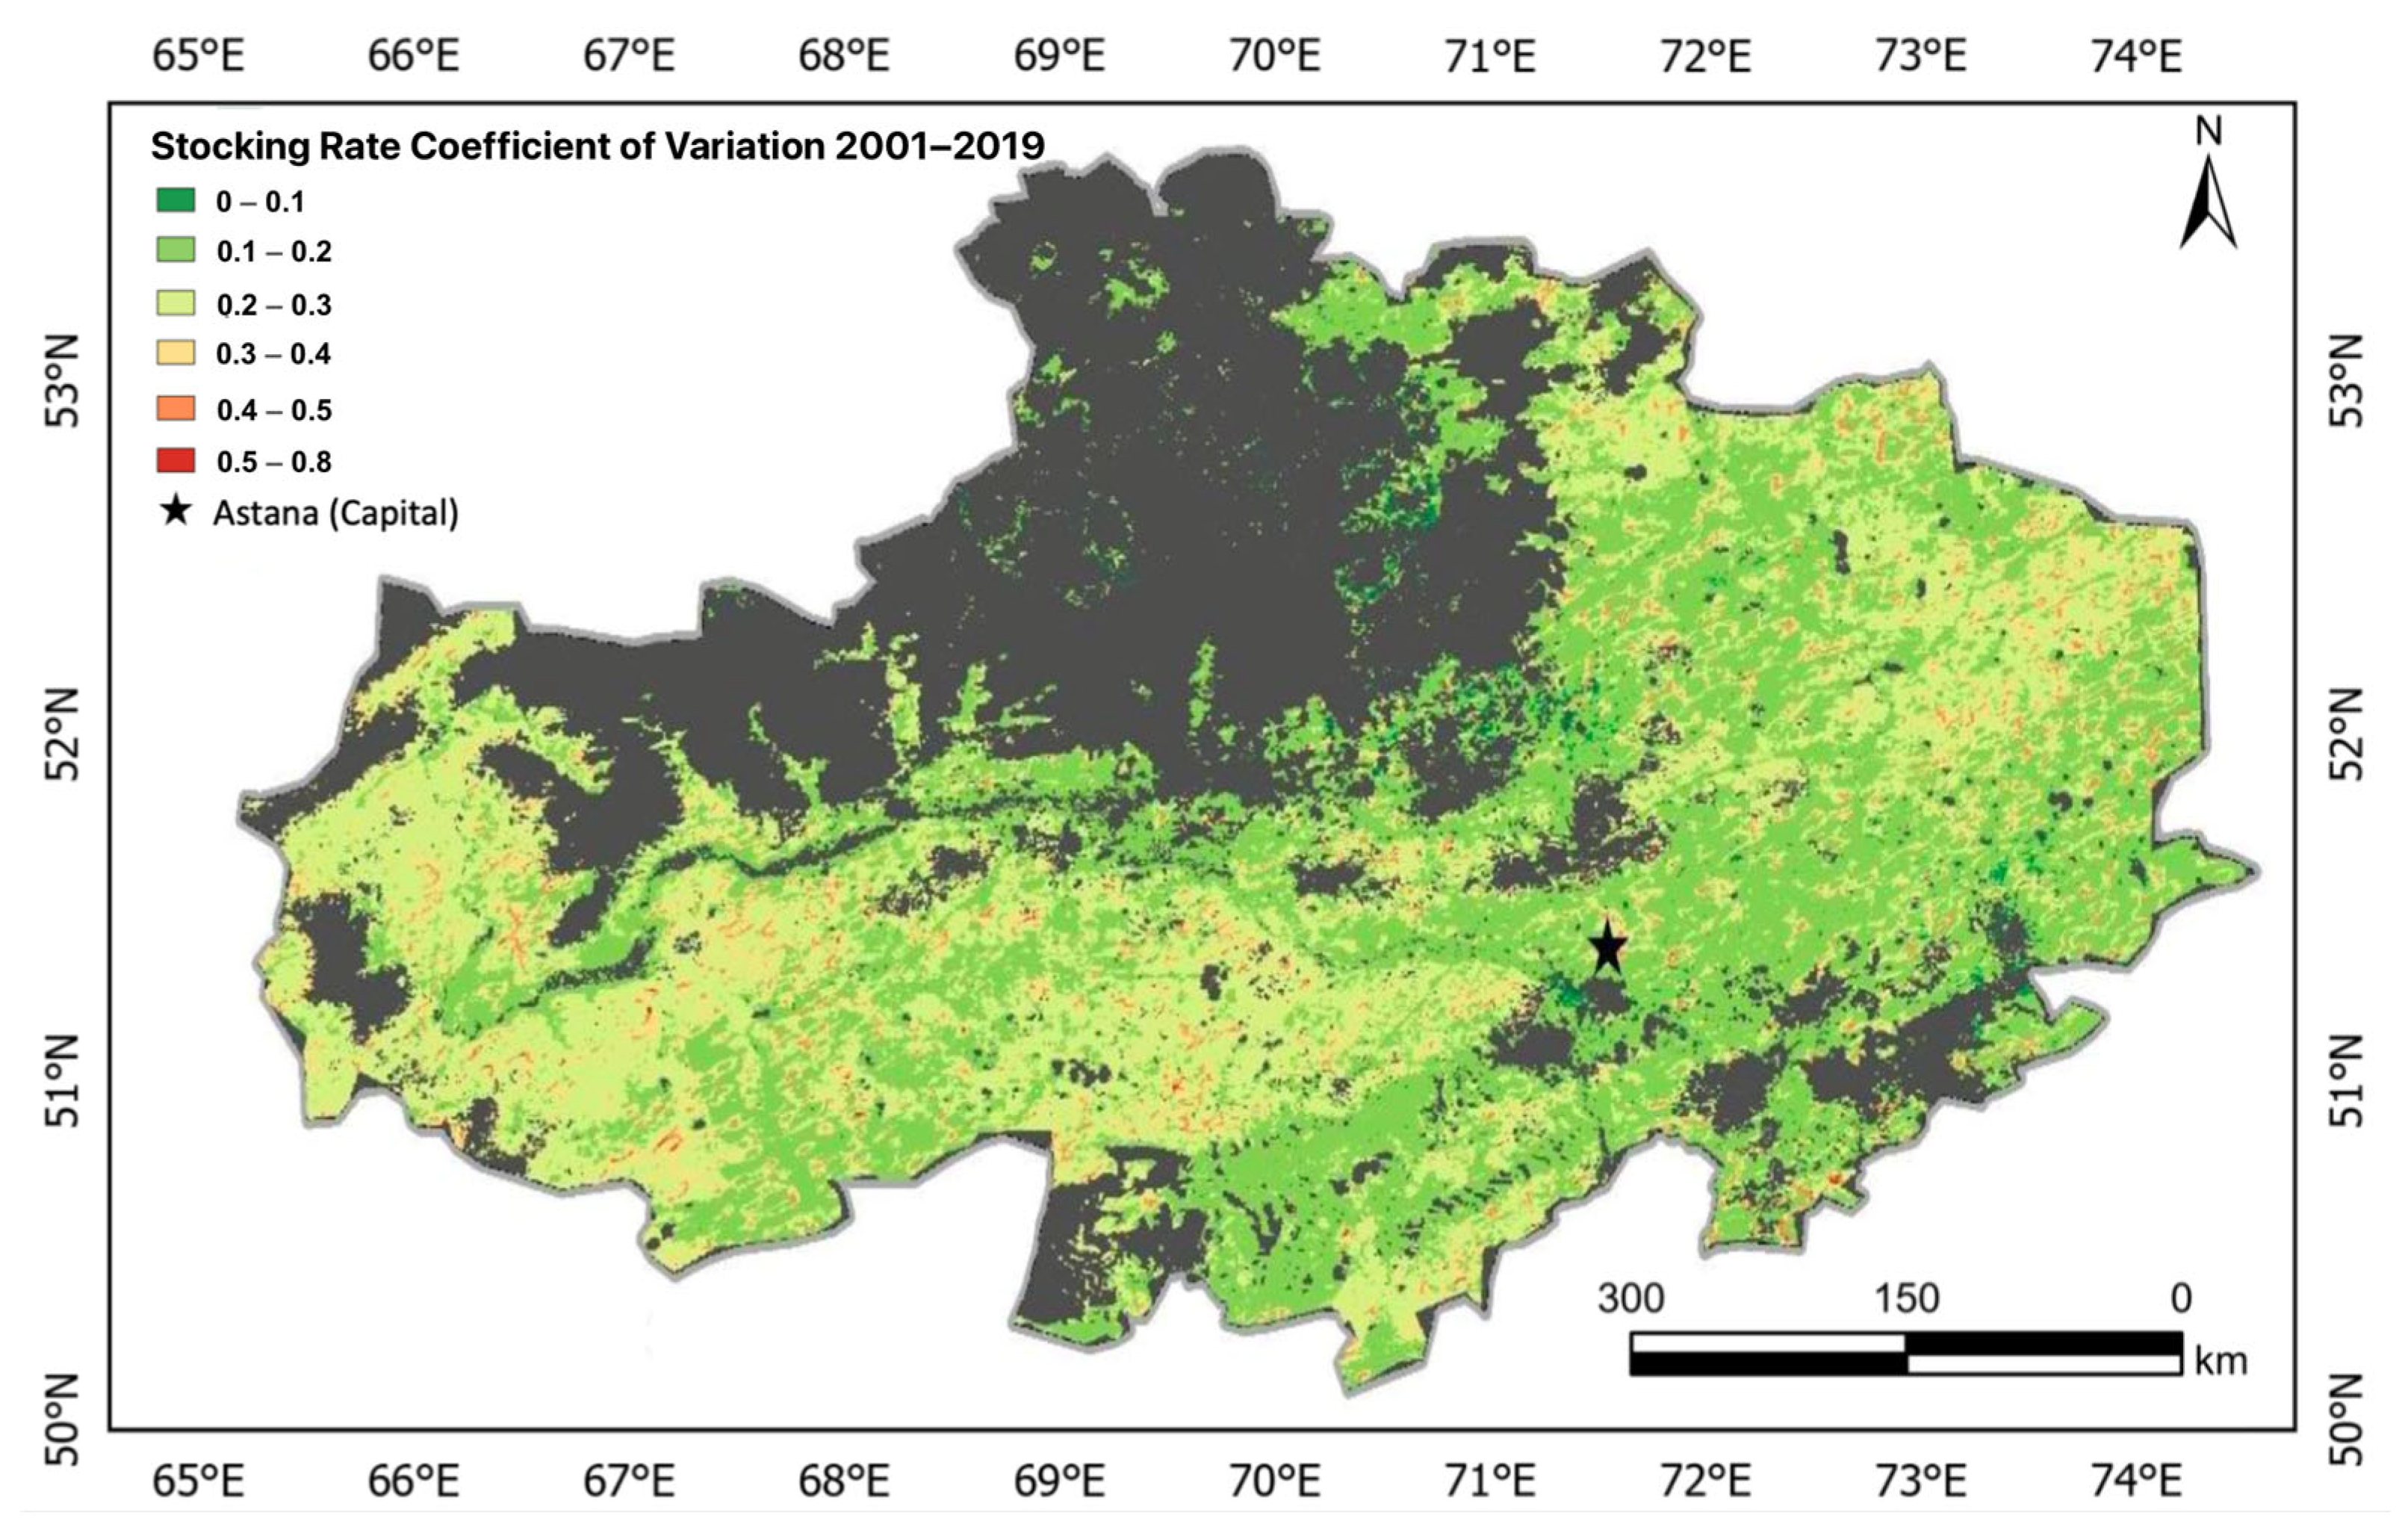
3.2. Temporal Variabilities of Livestock-Carrying Capacity in Akmola Oblast

Second, temporal analysis of LCC from 2001 to 2019 shows that the mean LCC across the Oblast ranged from 0.099 to 0.17 animals per hectare (Figure 9 black line). Areas with higher LCC exhibited greater variability, fluctuating between 0.31 and 0.42 animals per hectare—a 34% change (Figure 9 orange line). The overall trend reveals a decline in mean LCC until 2012 (Figure 8d), followed by stabilization (Figure 8e). This trend may be associated with cumulative climatic effects and potential shifts in grazing management following the early 2010s. However, the continued decline in annual minimum LCC values suggests deteriorating grazing capacity in less productive areas, underscoring the vulnerability of marginal rangelands to environmental and management pressures (Figure 9—blue line).
Spatio-temporal variability, measured by the coefficient of variation (CoV) from 2001 to 2019, further highlights distinct patterns (Figure 10). High CoV values (red or orange) mark volatile, high-risk hotspots with significant year-to-year LCC fluctuations, while low CoV values indicate stable LCC areas, offering more reliable opportunities for livestock investment.
These findings underscore the importance of spatially explicit and temporally dynamic approaches to rangeland management. The GLCC framework provides a robust tool for identifying areas with high LCC potential while also highlighting regions at risk of overgrazing and degradation.

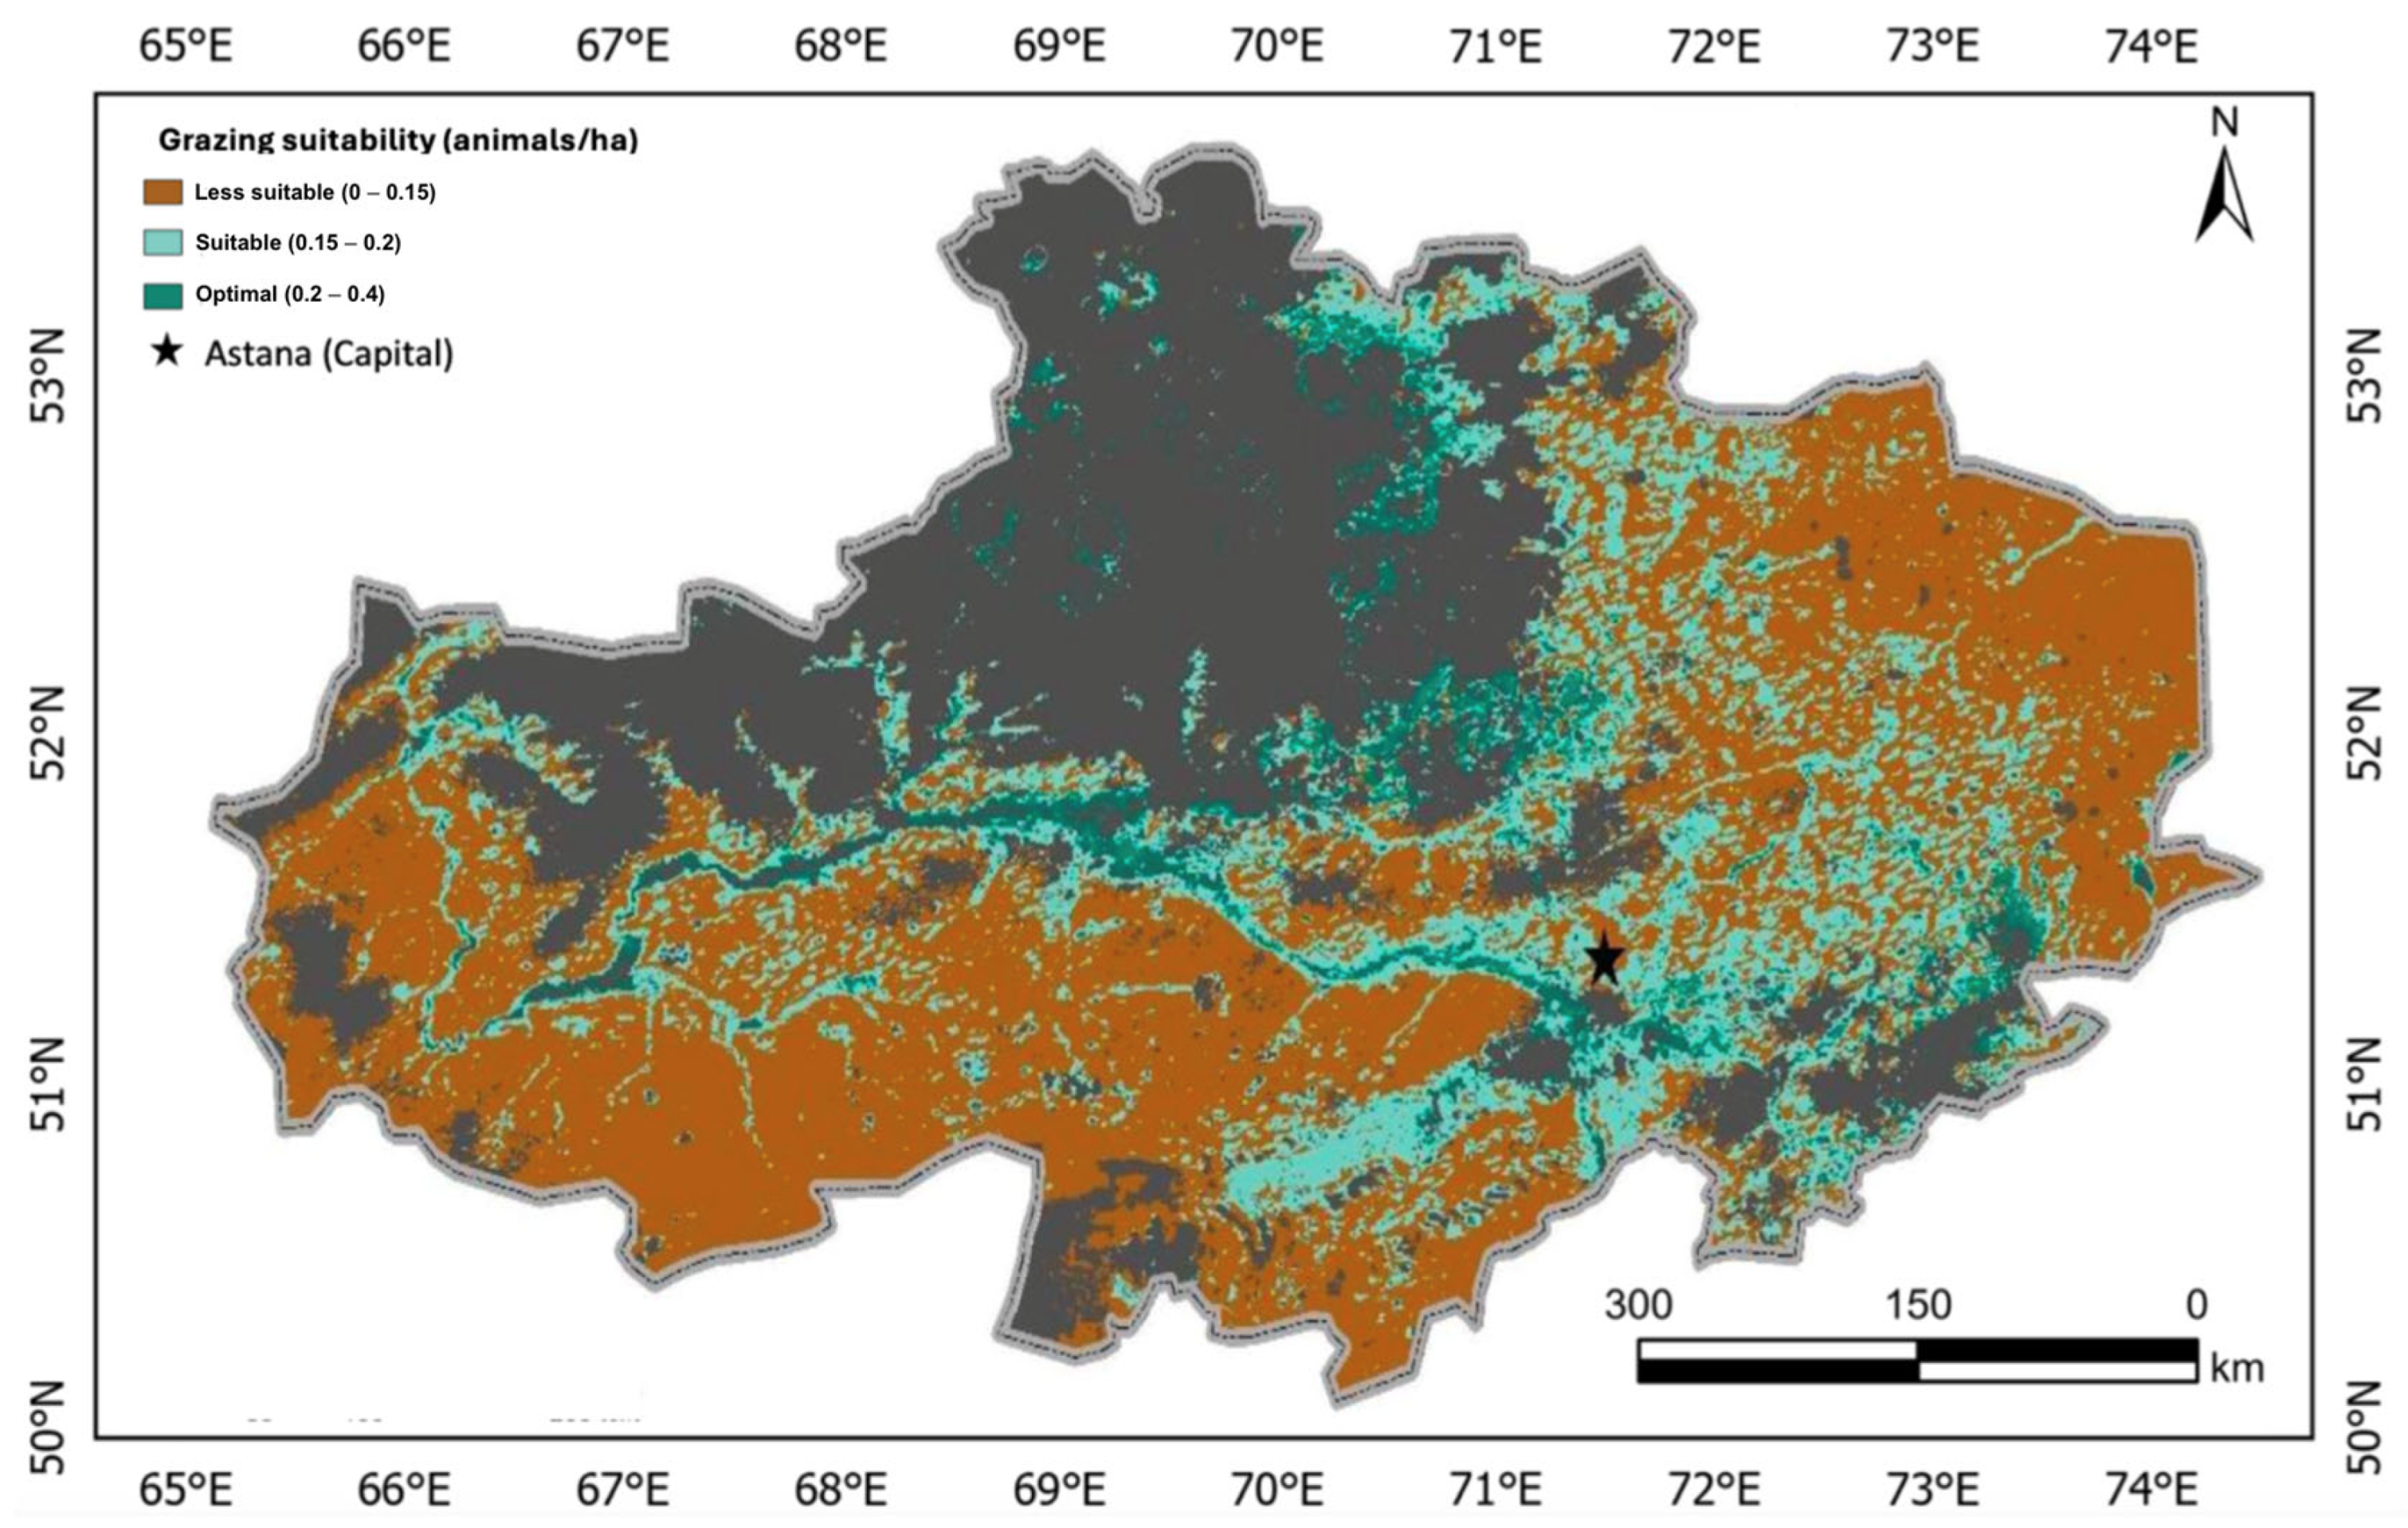
3.3. Spatial Patterns of Grazing Suitability

The spatio-temporal patterns of LCC and their variability, expressed through the CoV, were further analyzed to assess the grazing suitability across the region. This analysis is critical for guiding future investment in livestock production. Using the ISO cluster analysis tools, the CoV distribution was separated into distinct unimodal groups, revealing spatial patterns of livestock-grazing suitability (Figure 11). The ISO cluster method grouped pixels based on natural variation in CoV, resulting in three dominant clusters corresponding to optimal (CoV < 20%), suitable (CoV 20–35%), and less suitable (CoV > 35%) grazing zones [45], although these breakdowns are somewhat subjective. Compared to the original LCC map (Figure 8), the grazing suitability map provides a more streamlined and actionable assessment of rangeland potential, simplifying decision-making for stakeholders.
The grazing suitability analysis highlights areas with stable LCC (low CoV) as prime candidates for sustainable livestock investment, while regions with high CoV (volatile LCC) are identified as high-risk zones requiring careful management. These findings not only refine the understanding of rangeland productivity but also support the development of targeted investment strategies to optimize livestock production in the region.
It is important to note that this analysis used cattle as the grazing livestock to assess livestock-carrying capacity. However, the same methodology can be adapted for other grazing species, such as horses, sheep, goats, and camels, as well as mixed-species herds. Adjustments to grazing parameters, such as species-specific forage preferences, grazing behavior, and supplemental feeding requirements, can be incorporated to tailor the model for diverse livestock systems. This flexibility enhances the framework’s applicability across different ecological and management contexts, supporting sustainable rangeland use and economic development.

4. Discussion

The GLCC model accounts for the interplay of environmental and ecological factors throughout the grazing season influencing LCC, including soil properties, grass species diversity, precipitation patterns, temperature regimes, and grazing practices at the time of the model parameterization and execution. These findings align with previous studies [12,46,47], underscoring the importance of land management in sustaining livestock productivity and ensuring food and water security. The grazing suitability classes derived from ISO clustering of CoV values can inform rangeland decision-making by distinguishing areas with consistent forage availability from those prone to seasonal or interannual variability. This supports planning for infrastructure, rotation, or rest. Temporal variability in LCC is closely tied to annual climate patterns, particularly precipitation, which drives the critical model input, the remotely sensed net primary productivity [48,49,50,51]. The identification of spatial hotspots and risk areas for unsustainable grazing practices provides actionable insights for stakeholders as a planning tool [8,47,52].
However, the GLCC model is a simplified representation of reality, as it does not explicitly account for all factors influencing LCC interannual variations, such as grazing pressure, climate variability, soil erosion, and ecological degradation. For instance, high grazing pressure can reduce vegetation cover, compact soils, and increase erosion, leading to long-term ecological degradation [46,53,54], which can alter net primary productivity, impacting rangeland productivity and forage availability. Implicitly, the impacts of these factors should be partially accounted for in the MODIS NPP products. Similarly, climate extremes, including sudden droughts and dzhut (extreme ice and snow events), pose significant risks to forage production and livestock health, necessitating adaptive management strategies such as destocking and supplemental feeding [8,55,56,57,58]. Therefore, although the model does not track climate dynamics continuously, its outputs inherently capture vegetation responses to climate variability at discrete time points through the NPP.
These fast-changing variables are better captured through on-ground adaptive monitoring. The integration of field-based indicators, such as observed grazing pressure, vegetation degradation, or soil erosion, supports the calibration and interpretation of remote sensing outputs. Furthermore, while the GLCC model does not explicitly simulate erosion or degradation processes, nor predict future LCC values, it reflects their cumulative effects over time through observed declines in productivity (e.g., ANPP) at the time of model execution. Remote sensing products (e.g., MODIS NPP, water layers) inherit climatic signals and indirectly register vegetation responses to drought and water limitations. These elements, along with the model’s modular structure, allow it to support adaptive grazing management while being updated through seasonal or annual field observations.
Compared to traditional models that rely solely on remote sensing or field-based observations, the GLCC framework offers an integrated, scalable, and ecologically grounded approach. Remote sensing-only models often provide broad spatial coverage but lack ground validation and fail to capture site-specific management and ecological conditions [59,60]. Conversely, field-based assessments offer detailed local information but are limited in broader spatial and temporal scope, underscoring the limitations of such assessments in capturing large-scale ecological processes [61,62]. By combining both data sources, the GLCC model captures fine-scale ecological complexity while maintaining regional applicability. This dual-source integration ensures more reliable, interpretable, and actionable LCC estimates across variable landscapes and climate zones [63], thus outperforming models that rely on a single data stream. Although a full benchmarking analysis is outside the scope of this study, the main contribution of our work is in translating this integration into a practical, adaptable modeling framework that can be applied across regions and scaled as needed.
Plant species composition and diversity also play a critical role in determining forage availability and LCC. Grazing-tolerant species can sustain moderate biomass removal, but exceeding critical thresholds can lead to plant loss and reduced forage production [64,65,66]. In the Akmola region, a 35% utilization rate is recommended to account for trampling and wildlife impacts [42,44,67].
Seasonality further influences LCC, with the Akmola grazing season spanning 210 days (mid-April to mid-November). The remaining 155 days require supplemental feeding, with an estimated 2108 kg of forage (dry weight) per cattle during winter. Alternative feeds, such as barley, can help meet nutritional needs during this period [68,69].
The GLCC model is primarily intended to support land and resource management decisions at the regional or national level. As a spatially explicit, geospatial data-driven tool, it enables stakeholders—such as policymakers, environmental agencies, and development planners—to identify areas showing signs of land degradation or recovery. This information can inform land rehabilitation efforts and support the development of grazing management strategies. In particular, GLCC outputs can help guide decisions related to rotational grazing, forage resource planning, and early warning systems for overgrazing. While the model is not designed for daily or in-season operational management at the field scale, it serves as a valuable tool for strategic planning, monitoring long-term trends, and aligning land use policies with climate resilience and sustainability objectives.
To enhance the GLCC model’s accuracy, improvements to the modeling framework and additional factors such as grazing pressure, climate variability, and ecological degradation can be made to focus on the following:
  • Higher-resolution remote sensing data to account for spatial variability: Incorporate high-resolution satellite imagery (e.g., Sentinel-2, PlanetScope) to improve the precision of vegetation and land cover mapping. This would be helpful for ranchers as it would provide landscape-scale information that is relevant for farm-scale decision-making.
  • Advanced remote sensing imagery and methods for improved forage estimation: Utilize advanced satellite imagery such as hyperspectral data and enhanced vegetation indices, together with advanced techniques such as artificial intelligence (AI) and machine learning algorithms to better distinguish between forage and non-forage species.
  • Dynamic climate data to enhance seasonal variations in forage availability: Integrate real-time or near-real-time climate data to account for seasonal and interannual variability in precipitation and temperature, helping ranchers to timely adjust stocking rate and prepare winter feeds.
  • Grazing pressure metrics: Develop metrics to quantify grazing pressure and its impacts on vegetation and soil health, using remote sensing and field data.
  • Ecological degradation indicators: Incorporate indicators of ecological degradation, such as soil erosion and species composition shifts, forage quality etc. into the model.
  • Livestock species-specific forage modeling: Adapt the framework for different livestock species (e.g., horses, sheep, goats, camels) by incorporating species-specific forage preferences and grazing behaviors.

5. Conclusions

This study revealed clear spatial and temporal patterns in livestock-carrying capacity (LCC) across the Akmola Oblast. At the regional scale, higher LCC values were concentrated in the southern and southeastern areas, where vegetation productivity and water availability were greater. Temporally, LCC exhibited significant interannual variability, with a general decline observed until 2012, followed by a period of relative stabilization. These findings reflect how ecological conditions and observed climate variability influence rangeland productivity spatially.
The GLCC model estimates livestock-carrying capacity by integrating environmental factors (soil, climate, vegetation) and remote-sensed net primary productivity, enabling spatial identification of stable vs. variable grazing areas. Its ISO-clustered suitability classes support strategic rangeland planning (rotational grazing, infrastructure) and align with regional policy needs. However, it simplifies ecological complexity, omitting direct tracking of grazing pressure, soil erosion, or climate extremes (e.g., droughts), relying instead on inferred vegetation responses from NPP trends.
Practical applications include adaptive management (e.g., Akmola’s 35% forage utilization threshold, 210-day grazing season with winter supplementation) to balance productivity and resilience. For improvement, the model requires higher-resolution remote sensing, dynamic climate integration, and species-specific metrics such as erosion proxies and livestock foraging behaviors.
Ultimately, the GLCC framework bridges remote sensing and field data to guide sustainable rangeland management, emphasizing scalability for dryland resilience under climate change. Addressing gaps in degradation tracking and climate dynamics could enhance its global utility.

Author Contributions

J.Q. and M.A.W.; Data curation, J.Q., Z.L. and M.K.; Formal analysis, J.Q. and K.E.S.; Funding acquisition, T.Y.; Investigation, J.Q., G.I. and X.X.; Methodology, J.Q., M.A.W. and K.E.S.; Project administration, G.I.; Resources, J.Q., K.E.S. and G.I.; Software, Z.L.; Supervision, J.Q. and G.I.; Validation, J.N., D.T. and L.K.M.; Visualization, J.Q. and M.K.; Writing—original draft, J.Q.; Writing—review and editing, J.Q., G.I. and D.T. All authors have read and agreed to the published version of the manuscript.

Funding

This research was funded by the Asian Development Bank (ADB) Knowledge and Experience Exchange (KEEP) project (TA 9476-KAZ KEEP).

Data Availability Statement

The data presented in this study are available on request from the corresponding author.

Acknowledgments

This project was funded by the Asian Development Bank (ADB) Knowledge and Experience Exchange (KEEP) project (TA 9476-KAZ KEEP). We are grateful for the in-kind contributions from the US Department of Agriculture (USDA)-Agricultural Research Service (ARS), USDA-Natural Resources Conservation Service (NRCS), Michigan State University, Kazakh National Agrarian Research University (KazNARU) and the Asia Hub Initiative, which were instrumental in the successful execution of this work. We extend our sincere thanks to the many individuals who contributed to the field campaigns, data processing, and analyses. Special recognition goes to Arystan Galiev, Hans Woldring, and Giovanni Capannelli at ADB/Kazakhstan; Inna Punda, Jacopo Monzini, Yevgen Shatokhin, and Massimo Cristofaro at the Food and Agriculture Organization of the United Nations; Serik Kubentayev at the Astana Botanical Garden; Kadyrzhan Khamzin at the Republican Chamber of Meat Sheep; Zagipa Sapakhova at the Institute of Plant Biology and Biotechnology, Kazakhstan; Marat Beksultanov, Diana Dushniyazova, Ruslan Nurimbetov, Aigerim Kalybekova, and Stuart Bowlin at AgriTech Hub, Kazakhstan; Timur Tamenov, Bekzat Turegeldiyev, and Askar Imangaliyev at KazNARU, Kazakhstan; Shiqi Tao and Geoffrey Henebry at Michigan State University; Phil Guertin and Shea Burns at the University of Arizona; and Richard Waterman, Wade Anderson (contractor), Beth Newingham, and Tom Geary at USDA. The USDA is an equal opportunity provider and employer. Mention of proprietary products does not constitute endorsement by USDA and does not imply their approval to the exclusion of other suitable products.

Conflicts of Interest

The authors declare no conflicts of interest.

Abbreviations

AF Available Forage
ANPPAboveground Net Primary Production
ANFPAboveground Non-Forage Productivity
CCCCanopy Chlorophyll Content
CoVCoefficient of Variation
DEMDigital Elevation Model
FAPARFraction of Absorbed Photosynthetically Active Radiation
GLCCGeospatial Livestock-Carrying Capacity Model
GEGrazing Efficiency
LAILeaf Area Index
LCCLivestock-Carrying Capacity
LULCLand Use and Land Cover
NDVINormalized Difference Vegetation Index
PUFProper Use Factor
SRTMShuttle Radar Topography Mission

References

  1. Di Virgilio, A.; Lambertucci, S.A.; Morales, J.M. Sustainable Grazing Management in Rangelands: Over a Century Searching for a Silver Bullet. Agric. Ecosyst. Environ. 2019, 283, 106561. [Google Scholar] [CrossRef]
  2. Chen, J.; John, R.; Sun, G.; Fan, P.; Henebry, G.M.; Fernández-Giménez, M.E.; Zhang, Y.; Park, H.; Tian, L.; Groisman, P.; et al. Prospects for the Sustainability of Social-Ecological Systems (SES) on the Mongolian Plateau: Five Critical Issues. Environ. Res. Lett. 2018, 13, 123004. [Google Scholar] [CrossRef]
  3. Tazhibaev, S.; Musabekov, K.; Yesbolova, A.; Ibraimova, S.; Mergenbayeva, A.; Sabdenova, Z.; Seidahmetov, M. Issues in the Development of the Livestock Sector in Kazakhstan. Procedia Soc. Behav. Sci. 2014, 143, 610–614. [Google Scholar] [CrossRef]
  4. Zou, X.; Song, D.; Chen, S. Ecological Carrying Capacity of Grasslands and Animal Husbandry Sustainability in Central Asia. J. Res. Ecol. 2019, 10, 598. [Google Scholar] [CrossRef]
  5. Klein, I.; Gessner, U.; Kuenzer, C. Regional Land Cover Mapping and Change Detection in Central Asia Using MODIS Time-Series. Appl. Geogr. 2012, 35, 219–234. [Google Scholar] [CrossRef]
  6. Dubovyk, O.; Landmann, T.; Dietz, A.; Menz, G. Quantifying the Impacts of Environmental Factors on Vegetation Dynamics over Climatic and Management Gradients of Central Asia. Remote Sens. 2016, 8, 600. [Google Scholar] [CrossRef]
  7. Ventresca Miller, A.R.; Bragina, T.M.; Abil, Y.A.; Rulyova, M.M.; Makarewicz, C.A. Pasture Usage by Ancient Pastoralists in the Northern Kazakh Steppe Informed by Carbon and Nitrogen Isoscapes of Contemporary Floral Biomes. Archaeol. Anthr. Sci. 2019, 11, 2151–2166. [Google Scholar] [CrossRef]
  8. Kerven, C.; Robinson, S.; Behnke, R. Pastoralism at Scale on the Kazakh Rangelands: From Clans to Workers to Ranchers. Front. Sustain. Food Syst. 2021, 4, 590401. [Google Scholar] [CrossRef]
  9. Ryabushkina, N.; Gemedjieva, N.; Kobaisy, M.; Cantrell, C.L. Brief Review of Kazakhstan Flora and Use of Its Wild Species. Asian Australas. J. Plant Sci. Biotechnol. 2008, 2, 64–77. [Google Scholar]
  10. Ministry of Environmental protection of the Republic of Kazakhstan. The Fourth National Report on Progress Implementation of the Convention on Biological Diversity; Ministry of Environmental Protection of the Republic of Kazakhstan: Astana, Kazakhstan, 2009.
  11. Medeu, A. The National Atlas of the Republic of Kazakhstan, 2nd ed.; Medeu, A., Ed.; Natural Conditions and Resources; Institut Geografii Respubliki Kazakhstan: Almaty, Kazakhstan, 2010; Volume I, ISBN 978-601-7150-06-8. [Google Scholar]
  12. Hankerson, B.R.; Schierhorn, F.; Prishchepov, A.V.; Dong, C.; Eisfelder, C.; Müller, D. Modeling the Spatial Distribution of Grazing Intensity in Kazakhstan. PLoS ONE 2019, 14, e0210051. [Google Scholar] [CrossRef]
  13. Burrell, A.L.; Evans, J.P.; Liu, Y. Detecting Dryland Degradation Using Time Series Segmentation and Residual Trend Analysis (TSS-RESTREND). Remote Sens. Environ. 2017, 197, 43–57. [Google Scholar] [CrossRef]
  14. Fesenmyer, K.A.; Dauwalter, D.C.; Evans, C.; Allai, T. Livestock Management, Beaver, and Climate Influences on Riparian Vegetation in a Semi-Arid Landscape. PLoS ONE 2018, 13, e0208928. [Google Scholar] [CrossRef] [PubMed]
  15. Hilker, T.; Natsagdorj, E.; Waring, R.H.; Lyapustin, A.; Wang, Y. Satellite Observed Widespread Decline in Mongolian Grasslands Largely Due to Overgrazing. Glob. Change Biol. 2014, 20, 418–428. [Google Scholar] [CrossRef]
  16. Zhou, X.; Yamaguchi, Y.; Arjasakusuma, S. Distinguishing the Vegetation Dynamics Induced by Anthropogenic Factors Using Vegetation Optical Depth and AVHRR NDVI: A Cross-Border Study on the Mongolian Plateau. Sci. Total Environ. 2018, 616, 730–743. [Google Scholar] [CrossRef]
  17. Vargas, L.; Willemen, L.; Hein, L. Assessing the Capacity of Ecosystems to Supply Ecosystem Services Using Remote Sensing and An Ecosystem Accounting Approach. Environ. Manag. 2019, 63, 1–15. [Google Scholar] [CrossRef]
  18. De Leeuw, J.; Rizayeva, A.; Namazov, E.; Bayramov, E.; Marshall, M.T.; Etzold, J.; Neudert, R. Application of the MODIS MOD 17 Net Primary Production Product in Grassland Carrying Capacity Assessment. Int. J. Appl. Earth Obs. Geoinf. 2019, 78, 66–76. [Google Scholar] [CrossRef]
  19. Dara, A.; Baumann, M.; Freitag, M.; Hölzel, N.; Hostert, P.; Kamp, J.; Müller, D.; Prishchepov, A.V.; Kuemmerle, T. Annual Landsat Time Series Reveal Post-Soviet Changes in Grazing Pressure. Remote Sens. Environ. 2020, 239, 111667. [Google Scholar] [CrossRef]
  20. Hui, D.; Jackson, R.B. Geographical and Interannual Variability in Biomass Partitioning in Grassland Ecosystems: A Synthesis of Field Data. New Phytol. 2006, 169, 85–93. [Google Scholar] [CrossRef]
  21. National Academies Press. Nutrient Requirements of Beef Cattle, 8th ed.; National Academies Press: Washington, DC, USA, 2015; p. 19014. ISBN 978-0-309-31702-3. [Google Scholar]
  22. Retallack, A.; Finlayson, G.; Ostendorf, B.; Clarke, K.; Lewis, M. Remote Sensing for Monitoring Rangeland Condition: Current Status and Development of Methods. Environ. Sustain. Indic. 2023, 19, 100285. [Google Scholar] [CrossRef]
  23. Liu, H.; Dahlgren, R.A.; Larsen, R.E.; Devine, S.M.; Roche, L.M.; O’ Geen, A.T.; Wong, A.J.Y.; Covello, S.; Jin, Y. Estimating Rangeland Forage Production Using Remote Sensing Data from a Small Unmanned Aerial System (sUAS) and PlanetScope Satellite. Remote Sens. 2019, 11, 595. [Google Scholar] [CrossRef]
  24. Ali, I.; Cawkwell, F.; Dwyer, E.; Barrett, B.; Green, S. Satellite Remote Sensing of Grasslands: From Observation to Management. J. Plant Ecol. 2016, 9, 649–671. [Google Scholar] [CrossRef]
  25. Muminov, M.A.; Nosirov, M.; Bohodirjodzha, I.; Avutkhanov, B.; Khujanov, A.; Tursunov, A.; Ergasheva, O.; Ismailova, A.; Umarova, D. Monitoring and Mapping Rangeland Health Using Remote Sensing and GIS Methods: A Case Study in the Foothill Artemisia-Ephemeral Rangeland Region in Samarkand. E3S Web Conf. 2024, 563, 03070. [Google Scholar] [CrossRef]
  26. Kabzhanova, G.; Arystanova, R.; Bissembayev, A.; Arystanov, A.; Sagin, J.; Nasiyev, B.; Kurmasheva, A. Remote Sensing Applications for Pasture Assessment in Kazakhstan. Agronomy 2025, 15, 526. [Google Scholar] [CrossRef]
  27. Piipponen, J.; Jalava, M.; De Leeuw, J.; Rizayeva, A.; Godde, C.; Cramer, G.; Herrero, M.; Kummu, M. Global Trends in Grassland Carrying Capacity and Relative Stocking Density of Livestock. Glob. Change Biol. 2022, 28, 3902–3919. [Google Scholar] [CrossRef] [PubMed]
  28. Wang, G.; Li, Y.; Fan, L.; Ma, X.; Liang, Y.; Hui, T.; Zhang, W.; Li, W.; Mao, J. Assessment of Grassland Carrying Capacity Drivers and Evaluation of Pasture-Livestock Balance: A Case Study of Xinjiang, China. Glob. Ecol. Conserv. 2024, 55, e03203. [Google Scholar] [CrossRef]
  29. Running, S.; Zhao, M. MOD17A3HGF MODIS/Terra Net Primary Production Gap-Filled Yearly L4 Global 500 m SIN Grid V006; NASA EOSDIS Land Processes Distributed Active Archive Center: Sioux Falls, SD, USA, 2019.
  30. Friedl, M.; Sulla-Menashe, D. MCD12Q1 MODIS/Terra+Aqua Land Cover Type Yearly L3 Global 500m SIN Grid V006; NASA EOSDIS Land Processes Distributed Active Archive Center: Sioux Falls, SD, USA, 2019.
  31. Buchhorn, M.; Smets, B.; Bertels, L.; Roo, B.D.; Lesiv, M.; Tsendbazar, N.-E.; Herold, M.; Fritz, S. Copernicus Global Land Service: Land Cover 100 m: Collection 3: Epoch 2015: Globe 2020; Wageningen University & Research: Wageningen, The Netherlands, 2020. [Google Scholar]
  32. Buchhorn, M.; Smets, B.; Bertels, L.; Roo, B.D.; Lesiv, M.; Tsendbazar, N.-E.; Herold, M.; Fritz, S. Copernicus Global Land Service: Land Cover 100 m: Collection 3: Epoch 2016: Globe 2020; Wageningen University & Research: Wageningen, The Netherlands, 2020. [Google Scholar]
  33. Buchhorn, M.; Smets, B.; Bertels, L.; Roo, B.D.; Lesiv, M.; Tsendbazar, N.-E.; Herold, M.; Fritz, S. Copernicus Global Land Service: Land Cover 100 m: Collection 3: Epoch 2017: Globe 2020; Wageningen University & Research: Wageningen, The Netherlands, 2020. [Google Scholar]
  34. Buchhorn, M.; Smets, B.; Bertels, L.; Roo, B.D.; Lesiv, M.; Tsendbazar, N.-E.; Herold, M.; Fritz, S. Copernicus Global Land Service: Land Cover 100 m: Collection 3: Epoch 2018: Globe 2020; Wageningen University & Research: Wageningen, The Netherlands, 2020. [Google Scholar]
  35. Buchhorn, M.; Smets, B.; Bertels, L.; Roo, B.D.; Lesiv, M.; Tsendbazar, N.-E.; Herold, M.; Fritz, S. Copernicus Global Land Service: Land Cover 100 m: Collection 3: Epoch 2019: Globe 2020; Wageningen University & Research: Wageningen, The Netherlands, 2020. [Google Scholar]
  36. Pekel, J.-F.; Cottam, A.; Gorelick, N.; Belward, A.S. High-Resolution Mapping of Global Surface Water and Its Long-Term Changes. Nature 2016, 540, 418–422. [Google Scholar] [CrossRef]
  37. Farr, T.G.; Rosen, P.A.; Caro, E.; Crippen, R.; Duren, R.; Hensley, S.; Kobrick, M.; Paller, M.; Rodriguez, E.; Roth, L.; et al. The Shuttle Radar Topography Mission. Rev. Geophys. 2007, 45, 2005RG000183. [Google Scholar] [CrossRef]
  38. Spaeth, K.E., Jr.; Gillaspy, B.; Margo, M. National Range and Pasture Handbook (Handbook Number 465); United States Department of Agriculture, Natural Resources Conservation Service: Washington, DC, USA, 2022; Subpart B(1–24). Available online: https://rangelandsgateway.org/sites/default/files/2024-02/National%20Range%20and%20Pasture%20Handbook%20%28Part%20645%29.pdf (accessed on 1 January 2025).
  39. Sala, O.E.; Austin, A.T. Methods of Estimating Aboveground Net Primary Productivity. In Methods in Ecosystem Science; Sala, O.E., Jackson, R.B., Mooney, H.A., Howarth, R.W., Eds.; Springer: New York, NY, USA, 2000; pp. 31–43. ISBN 978-0-387-98743-9. [Google Scholar]
  40. Sun, Y.; Yang, Y.; Zhao, X.; Tang, Z.; Wang, S.; Fang, J. Global Patterns and Climatic Drivers of Above- and Belowground Net Primary Productivity in Grasslands. Sci. China Life Sci. 2021, 64, 739–751. [Google Scholar] [CrossRef]
  41. Spaeth, K.E.; Weltz, M.A.; Nesbit, J.; Qi, J.; Rutherford, W.A.; Williams, C.J.; Toledo, D.; Newingham, B.A.; Iskakova, G.; Kussainova, M.; et al. Rangeland Resource Assessment in the Aqmola Region of Kazakhstan. Rangel. Ecol. Manag. 2025, 98, 389–398. [Google Scholar] [CrossRef]
  42. Carter, R.; Thacker, E.; Heaton, K.; Burritt, B. Grazing and Harvest Efficiency of Forage by Cattle on Western Rangelands. Agric. Ext. All Current Publications; Paper 2029; Utah State University Extension: Orem, UT, USA, 2019; Available online: https://digitalcommons.usu.edu/extension_curall/2029/ (accessed on 1 January 2025).
  43. United States Department of Agriculture, Natural Resources Conservation Service. National Resources Inventory (NRI) Program Technical Manual 2023; United States Department of Agriculture, Natural Resources Conservation Service: Washington, DC, USA, 2023. Available online: https://www.nrcs.usda.gov/sites/default/files/2023-10/NRI-TechnicalManual-October2023.pdf. (accessed on 1 November 2024).
  44. Green, S.; Brazee, B. Harvest Efficiency in Prescribed Grazing; Technical Note No. TN Range No. 73; USDA National Resources Conservation Service: Boise, ID, USA, 2012.
  45. Lemenkova, P. ISO Cluster Classifier by ArcGIS for Unsupervised Classification of the Landsat TM Image of Reykjavík. Bull. Nat. Sci. Res. 2021, 11, 29–37. [Google Scholar] [CrossRef]
  46. Greene, R.; Kinnell, P.; Wood, J. Role of Plant Cover and Stock Trampling on Runoff and Soil-Erosion from Semi-Arid Wooded Rangelands. Soil Res. 1994, 32, 953. [Google Scholar] [CrossRef]
  47. Kerven, C.; Shanbaev, K.; Alimaev, I.; Smailov, A.; Smailov, K. Livestock Mobility and Degradation in Kazakhstan’s Semi-Arid Rangelands. In The Socio-Economic Causes and Consequences of Desertification in Central Asia; Behnke, R., Ed.; NATO Science for Peace and Security Series; Springer Netherlands: Dordrecht, The Netherlands, 2008; pp. 113–140. ISBN 978-1-4020-8543-7. [Google Scholar]
  48. Zhang, W.; Zhang, F.; Qi, J.; Hou, F. Modeling Impacts of Climate Change and Grazing Effects on Plant Biomass and Soil Organic Carbon in the Qinghai–Tibetan Grasslands. Biogeosciences 2017, 14, 5455–5470. [Google Scholar] [CrossRef]
  49. Boone, R.B.; Conant, R.T.; Sircely, J.; Thornton, P.K.; Herrero, M. Climate Change Impacts on Selected Global Rangeland Ecosystem Services. Glob. Change Biol. 2018, 24, 1382–1393. [Google Scholar] [CrossRef] [PubMed]
  50. Chen, T.; Bao, A.; Jiapaer, G.; Guo, H.; Zheng, G.; Jiang, L.; Chang, C.; Tuerhanjiang, L. Disentangling the Relative Impacts of Climate Change and Human Activities on Arid and Semiarid Grasslands in Central Asia during 1982–2015. Sci. Total Environ. 2019, 653, 1311–1325. [Google Scholar] [CrossRef]
  51. Xin, X.; Lan, X.; Li, L.; Tang, H.; Guo, H.; Li, H.; Jiang, C.; Liu, F.; Shao, C.; Qin, Y.; et al. Anthropogenic and Climate Impacts on Carbon Stocks of Grassland Ecosystems in Inner Mongolia and Adjacent Region. Sci. Total Environ. 2024, 946, 174054. [Google Scholar] [CrossRef] [PubMed]
  52. Ghazali, S.; Zibaei, M.; Azadi, H. Impact of Livelihood Strategies and Capitals on Rangeland Sustainability and Nomads’ Poverty: A Counterfactual Analysis in Southwest Iran. Ecol. Econ. 2023, 206, 107738. [Google Scholar] [CrossRef]
  53. Trimble, S.W.; Mendel, A.C. The Cow as a Geomorphic Agent—A Critical Review. Geomorphology 1995, 13, 233–253. [Google Scholar] [CrossRef]
  54. Field, J.P.; Breshears, D.D.; Whicker, J.J.; Zou, C.B. Interactive Effects of Grazing and Burning on Wind- and Water-Driven Sediment Fluxes: Rangeland Management Implications. Ecol. Appl. 2011, 21, 22–32. [Google Scholar] [CrossRef]
  55. Qi, J.; Xin, X.; John, R.; Groisman, P.; Chen, J. Understanding Livestock Production and Sustainability of Grassland Ecosystems in the Asian Dryland Belt. Ecol. Process 2017, 6, 22. [Google Scholar] [CrossRef]
  56. Guo, H.; Bao, A.; Ndayisaba, F.; Liu, T.; Jiapaer, G.; El-Tantawi, A.M.; De Maeyer, P. Space-Time Characterization of Drought Events and Their Impacts on Vegetation in Central Asia. J. Hydrol. 2018, 564, 1165–1178. [Google Scholar] [CrossRef]
  57. Qi, J.; Pueppke, S.; Kulmatov, R.; Bobushev, T.; Tao, S.; Yespolov, T.I.; Beksultanov, M.; Chen, X. The Complexity and Challenges of Central Asia’s Water-Energy-Food Systems. In Landscape Dynamics of Drylands Across Greater Central Asia: People, Societies and Ecosystems; Gutman, G., Chen, J., Henebry, G.M., Kappas, M., Eds.; Landscape Series; Springer International Publishing: Cham, Switzerland, 2020; Volume 17, pp. 71–85. ISBN 978-3-030-30741-7. [Google Scholar]
  58. Godde, C.M.; Mason-D’Croz, D.; Mayberry, D.E.; Thornton, P.K.; Herrero, M. Impacts of Climate Change on the Livestock Food Supply Chain; a Review of the Evidence. Glob. Food Secur. 2021, 28, 100488. [Google Scholar] [CrossRef] [PubMed]
  59. Abdelmajeed, A.Y.A.; Juszczak, R. Challenges and Limitations of Remote Sensing Applications in Northern Peatlands: Present and Future Prospects. Remote Sens. 2024, 16, 591. [Google Scholar] [CrossRef]
  60. Delaney, B.; Tansey, K.; Whelan, M. Satellite Remote Sensing Techniques and Limitations for Identifying Bare Soil. Remote Sens. 2025, 17, 630. [Google Scholar] [CrossRef]
  61. Pijl, A.; Quarella, E.; Vogel, T.A.; D’Agostino, V.; Tarolli, P. Remote Sensing vs. Field-Based Monitoring of Agricultural Terrace Degradation. Int. Soil Water Conserv. Res. 2021, 9, 1–10. [Google Scholar] [CrossRef]
  62. Estes, L.; Elsen, P.R.; Treuer, T.; Ahmed, L.; Caylor, K.; Chang, J.; Choi, J.J.; Ellis, E.C. The Spatial and Temporal Domains of Modern Ecology. Nat. Ecol. Evol. 2018, 2, 819–826. [Google Scholar] [CrossRef]
  63. Yono, A.; Mokua, R.A.; Dube, T. Remote Sensing of Land Cover Change Dynamics in Mountainous Catchments and Semi-Arid Environments: A Review. Geocarto Int. 2025, 40, 2476602. [Google Scholar] [CrossRef]
  64. Matches, A.G. Plant Response to Grazing: A Review. J. Prod. Agric. 1992, 5, 1–7. [Google Scholar] [CrossRef]
  65. Damhoureyeh, S.A.; Hartnett, D.C. Variation in Grazing Tolerance among Three Tallgrass Prairie Plant Species. Am. J Bot. 2002, 89, 1634–1643. [Google Scholar] [CrossRef]
  66. Schmitz, A.; Isselstein, J. Effect of Grazing System on Grassland Plant Species Richness and Vegetation Characteristics: Comparing Horse and Cattle Grazing. Sustainability 2020, 12, 3300. [Google Scholar] [CrossRef]
  67. Smart, A.J.; Derner, J.D.; Hendrickson, J.R.; Gillen, R.L.; Dunn, B.H.; Mousel, E.M.; Johnson, P.S.; Gates, R.N.; Sedivec, K.K.; Harmoney, K.R.; et al. Effects of Grazing Pressure on Efficiency of Grazing on North American Great Plains Rangelands. Rangel. Ecol. Manag. 2010, 63, 397–406. [Google Scholar] [CrossRef]
  68. Carpio, A.J.; Apollonio, M.; Acevedo, P. Wild Ungulate Overabundance in Europe: Contexts, Causes, Monitoring and Management Recommendations. Mammal Rev. 2021, 51, 95–108. [Google Scholar] [CrossRef]
  69. Hassen, A.; Ahmed, R.; Alam, M.S.; Chavula, P.; Mohammed, S.S.; Dawid, A. The Effect of Feed Supplementation on Cow Milk Productivity and Quality: A Brief Study. Int. J. Agric. Vet. Sci. 2022, 4, 13–25. [Google Scholar] [CrossRef]
Figure 1. Land use and land cover classification of Kazakhstan.
Remotesensing 17 01477 g001
Figure 2. Geospatial livestock-carrying capacity modeling conceptual framework to integrate remotely sensed data with in situ data and other environmental information for livestock-carrying capacity assessment. Key variables include ANPP, AF, S, W, and D.
Remotesensing 17 01477 g002
Figure 3. Land use, land cover map of the geographical location of the study area—Akmola Oblast with 51 rangeland sampling sites (orange dots) of the Akmola Oblast, Kazakhstan. Sampling sites were used for GLCC model validation.
Remotesensing 17 01477 g003
Figure 4. The map on the left shows the Digital Elevation Model (DEM) data and the one on the right illustrates the derived slope S in % for Akmola Oblast. The data from the Shuttle Radar Topography Mission (SRTM) had a 30 m spatial resolution [37].
Remotesensing 17 01477 g004
Figure 5. The map on the left displays the seasonal water surface area using the year 2018 as an example, and the map on the right illustrates water accessibility factor W, which represents reductions in grazing efficiency relative to the distance from water sources.
Remotesensing 17 01477 g005
Figure 6. Illustration of the Akmola Oblast mean values (2001–2019) of Net Primary Production (NPP) (top) and available forage (AF), derived from MODIS data (bottom). Darker areas represent the non-rangeland areas, which were excluded from the calculation of the AF.
Remotesensing 17 01477 g006
Figure 7. Microplot sampling design based on the USDA NRCS National Resources Inventory protocol [43] to assess ecological condition at the site level. The figure illustrates the transect layout and quadrat positions for field assessment of vegetation, soil, and livestock indicators.
Remotesensing 17 01477 g007
Figure 8. Visual representation of the estimated livestock-carrying capacity in animals per hectare (animals/ha) for mother cows and calves < 4 months of age over a 210-day grazing season in Akmola Oblast for the selected years: 2001, 2005, 2010, 2012, 2013, 2015, and 2019 (ag). Figures were derived using Equation (1) and incorporating spatial adjustments for slope, water, and forage. The dark areas represent non-rangeland areas and were excluded from the calculation.
Remotesensing 17 01477 g008
Figure 9. Mean livestock-carrying capacity (animals/ha) in Akmola Oblast from 2001 to 2019 (black line) ranged from 0.099 to 0.17 animals per hectare. The values are estimated using conservative livestock management options. The orange line represents the maximum stocking rate, while the blue line represents the minimum.
Remotesensing 17 01477 g009
Figure 10. Temporal coefficient of variation (CoV) of annual livestock-carrying capacity from 2001 to 2019 in Akmola Oblast in animals per hectare. High values indicate areas with greater interannual variability and potential grazing risk. The dark areas represent non-rangeland areas and were excluded from the calculation.
Remotesensing 17 01477 g010
Figure 11. Grazing suitability classification map of the Akmola Oblast based on ISO cluster analysis of LCC coefficient of variation. Cluster analysis of the Akmola Oblast stocking rate classifies rangelands into 3 categories: less suitable (0–0.15), suitable (0.15–0.2), and optimal (0.2–0.4) based on its spatial and temporal variability resulting from climate and other environmental factors.
Remotesensing 17 01477 g011
Table 1. Remote sensing datasets used in this study.
Name Spatial Resolution (m)Temporal Range/Resolution
NPP(MOD17A3HGF) [29]500 m2001–2019/annual
Land use land cover (MCD12Q1/CGLS-LC100 collection 3) [30,31,32,33,34,35] 2001–2019/annual
500 m/100 m2015–2019/annual
Water (JRC Yearly/Monthly Water Classification History Layers) [36]30 m1984–2018/annual/monthly
Elevation (NASA SRTM Digital Elevation Data Version) [37]30 m2008/one-time
Disclaimer/Publisher’s Note: The statements, opinions and data contained in all publications are solely those of the individual author(s) and contributor(s) and not of MDPI and/or the editor(s). MDPI and/or the editor(s) disclaim responsibility for any injury to people or property resulting from any ideas, methods, instructions or products referred to in the content.

