Abstract
Photonic integrated interferometric imaging systems (PIISs) provide a compact solution for high-resolution Earth observation missions with stringent size, weight, and power (SWaP) constraints. As an indirect imaging method, a PIIS exhibits fundamentally different noise response characteristics compared to conventional remote sensing systems, and its imaging performance under practical operational scenarios has not been thoroughly investigated. The primary objective of this paper is to evaluate the operational capabilities of PIISs under remote sensing conditions. We (1) establish a signal-to-noise-ratio model for PIISs with balanced four-quadrature detection, (2) analyze the impacts of intensity noise and turbulent phase noise based on radiative transfer and turbulence models, and (3) simulate imaging performance with WorldView-3-like parameters. The results of the visibility signal-to-noise ratio (SNR) analysis demonstrate that the system’s minimum detectable fringe visibility is inversely proportional to the reciprocal of the sub-aperture intensity signal-to-noise ratio. When the integration time reaches 100 ms, the minimum detectable fringe visibility ranges between and (at 10 dB system efficiency). Imaging simulations demonstrate that recognizable image reconstruction requires integration times exceeding 10 ms for 10 cm baselines, achieving approximately 25 dB PSNR and 0.8 SSIM at 100 ms integration duration. These results may provide references for potential applications of photonic integrated interferometric imaging systems in remote sensing.
1. Introduction
High-resolution optical imaging systems offer significant potential for remote sensing and astronomical observation applications; however, conventional photoelectric imaging systems face fundamental resolution limitations imposed by aperture size. Increasing aperture dimensions exacerbates design complexity, manufacturing difficulties, and calibration challenges, while simultaneously elevating system volume, weight, and power requirements [1]. For space-based systems, launch costs and payload capacity further constrain maximum aperture. Unlike single-aperture diffraction imaging, pupil-plane interferometric imaging system, based on the Van Cittert–Zernike theorem [2], uses multiple small apertures to form interference baselines and measure complex fringe visibility, enabling high-resolution imaging without large apertures. Since Michelson’s first application in 1921 [3], interferometry has advanced significantly in radio, optical, and infrared wavelengths. Ground-based systems like LBT [4], VLTI [5], and CHARA [6] achieve ultra-high resolution but require precise alignment and long baselines, making them complex and bulky. Advances in fiber optics and integrated optics have enabled compact, lightweight systems. Single-mode fibers, first demonstrated in FLUOR [7], are now widely used in instruments like VLTI [8,9] and CHARA [10]. Integrated waveguide devices, such as the GRAVITY instrument at VLTI [11], further enhance system integration and measurement capabilities. Building on these advancements, Lockheed Martin and UC Davis researchers proposed SPIDER [12,13,14], a compact photonic integrated interferometric imaging system for space-based applications. Unlike astronomical interferometers, which target distant stars and require long baselines, SPIDER focuses on extended objects with shorter baselines and dense aperture arrays, enabling real-time imaging.
Since the concept of SPIDER was proposed, numerous researchers have conducted extensive studies on this new imaging method [15,16,17,18,19,20,21,22,23,24,25,26,27,28]. Chu et al. first analyzed its imaging characteristics through numerical simulations and proposed methods for designing adjustable baseline systems [29]. Similar to astronomical interferometric imaging systems, the SPIDER system measures the spatial frequency spectrum of the target through discrete sampling of the (u,v) frequency plane using an aperture array. Generally, more sampling points and wider sampling ranges result in higher-quality reconstructed images. Subsequently, researchers conducted extensive studies on the arrangement of aperture arrays. Yu et al. proposed a "checkerboard" aperture layout [30], which uses quadrant pairing to achieve uniform sampling in two orthogonal directions. Following this, multi-level and hexagonal lens arrangements were proposed [31,32,33,34], further improving uv coverage. Lanford sequence pairing methods were also introduced to achieve dense sampling without changing the array layout, allowing for integration with single-aperture systems [35]. In the original SPIDER system, each sub-aperture could only be used once, meaning a pair of sub-apertures could only form a single interferometric baseline corresponding to one sampling point in the spatial frequency domain. To improve sampling efficiency, Song et al. proposed using multimode interference couplers to measure interference signals, enabling each sub-aperture to pair with multiple others, thereby increasing the number of spatial frequency domain sampling points for the same number of apertures [36]. To address the redundancy in the radial aperture arrangement of SPIDER and the sparsity issue in the azimuthal direction, Pan et al. introduced an S-shaped aperture array configuration, achieving denser sampling coverage. Additionally, they proposed a deep learning-based image reconstruction method using a conditional denoising diffusion probabilistic model (Con-DDPM), significantly enhancing the quality of reconstructed images [24]. In the following, we shall call such a system SPIDER-like.
Besides improving system uv coverage, efficient image reconstruction algorithms can also compensate for sampling deficiencies. Compressive sensing [37,38,39], maximum entropy [40], and deep learning [41,42,43] have been applied to image reconstruction in SPIDER-like systems. The Photonic Integrated Circuit (PIC) devices used in SPIDER systems have undergone several iterations, achieving a maximum baseline of about 10 cm with overall losses exceeding 10 dB [13,14,15]. Maximum baseline is mainly limited by PIC size, which cannot exceed the maximum wafer size used in semiconductor fabrication processes. However, fiber interconnection can overcome this limitation, enabling longer baseline interferometric imaging. In SPIDER-like systems, fiber interconnection is widely used [26,28]. In fact, fiber connectivity of sub-apertures and photonic chips is a common method in large astronomical interferometers due to the flexibility and low loss of fibers. Currently, SPIDER’s imaging capabilities have been validated in laboratory settings [19,20], and more advanced PICs are continuously being developed, further enhancing the maturity of this technology [17,21].
For Earth remote sensing applications, SPIDER-like interferometric imaging systems present a promising alternative to traditional large-aperture systems such as WorldView-3, offering potential advantages in overcoming size and weight limitations while maintaining comparable resolution. However, their operational performance under realistic remote sensing conditions remains insufficiently investigated. Although existing studies have examined measurement errors in SPIDER-type systems [44,45,46], they frequently lack comprehensive analysis of the complete signal transmission chain, including critical factors like atmospheric turbulence effects and noise propagation mechanisms. Similar to ground-based astronomical interferometers, space-based interferometric imaging platforms for remote sensing applications are affected by atmospheric turbulence. Turbulence-induced wavefront distortions and random optical path difference (OPD) degrade both fringe visibility and phase measurement accuracy. The impact of phase errors is particularly significant as they disproportionately affect image reconstruction quality compared to visibility amplitude errors. When OPD exceeds either the coherence length or even the optical wavelength, active fringe tracking becomes essential [47,48]. However, implementing such stabilization techniques inevitably increases system complexity, potentially compromising SPIDER’s inherent advantages in simplicity and compactness.
A fundamental question remains unresolved: whether photonic integrated interferometric imaging systems like SPIDER can be effectively applied to remote sensing without employing any turbulence mitigation measures. For traditional diffraction-limited monolithic aperture systems, the atmospheric coherence length fundamentally limits the achievable resolution [49]. However, interferometric systems differ fundamentally as they do not directly capture intensity images but rather reconstruct targets through complex visibility measurements. Consequently, the impact of atmospheric turbulence on resolution cannot be directly extrapolated from traditional remote sensing systems and requires specific analysis of how turbulence affects interferometric measurements and subsequent image reconstruction.The signal-to-noise ratio (SNR), a critical performance metric for traditional imaging systems, plays an equally important but more complex role in interferometric imaging. While sub-aperture SNR determines light collection capability, the ultimate visibility SNR depends on noise propagation characteristics through the interferometric measurement process. This distinction highlights the necessity for comprehensive system-level performance modeling to properly assess the operational viability of photonic integrated imaging systems.
This study evaluates the performance of photonic integrated interferometric imaging systems in remote sensing applications by analyzing the energy transfer process, interference fringe visibility measurement methods, and the impact of atmospheric turbulence on phase measurements. To assess the signal-to-noise ratio of visibility measurements, we first examine the energy transfer process in remote sensing scenarios. Building on the balanced four-quadrature visibility measurement method employed in current Photonic Integrated Interferometric Imaging Systems, we establish an SNR and error model for visibility measurements. This model allows us to analyze the influence of sub-aperture intensity noise and turbulence-induced phase noise on visibility measurements. For a realistic assessment of the SNR in remote sensing conditions, we integrate the 6S [50,51] radiative transfer model and the HV-5/7 [52] atmospheric turbulence model with specific parameters to compute sub-aperture signal intensity, noise levels, and turbulence-induced phase noise. To further evaluate the system’s imaging performance, we utilize a checkerboard aperture array and reference the spectral bands and response of the WorldView-3 sensor [53] to analyze the system’s multispectral imaging capabilities in the visible and near-infrared bands.
2. Materials and Methods
2.1. Principle of Integrated Interferometric Imaging System
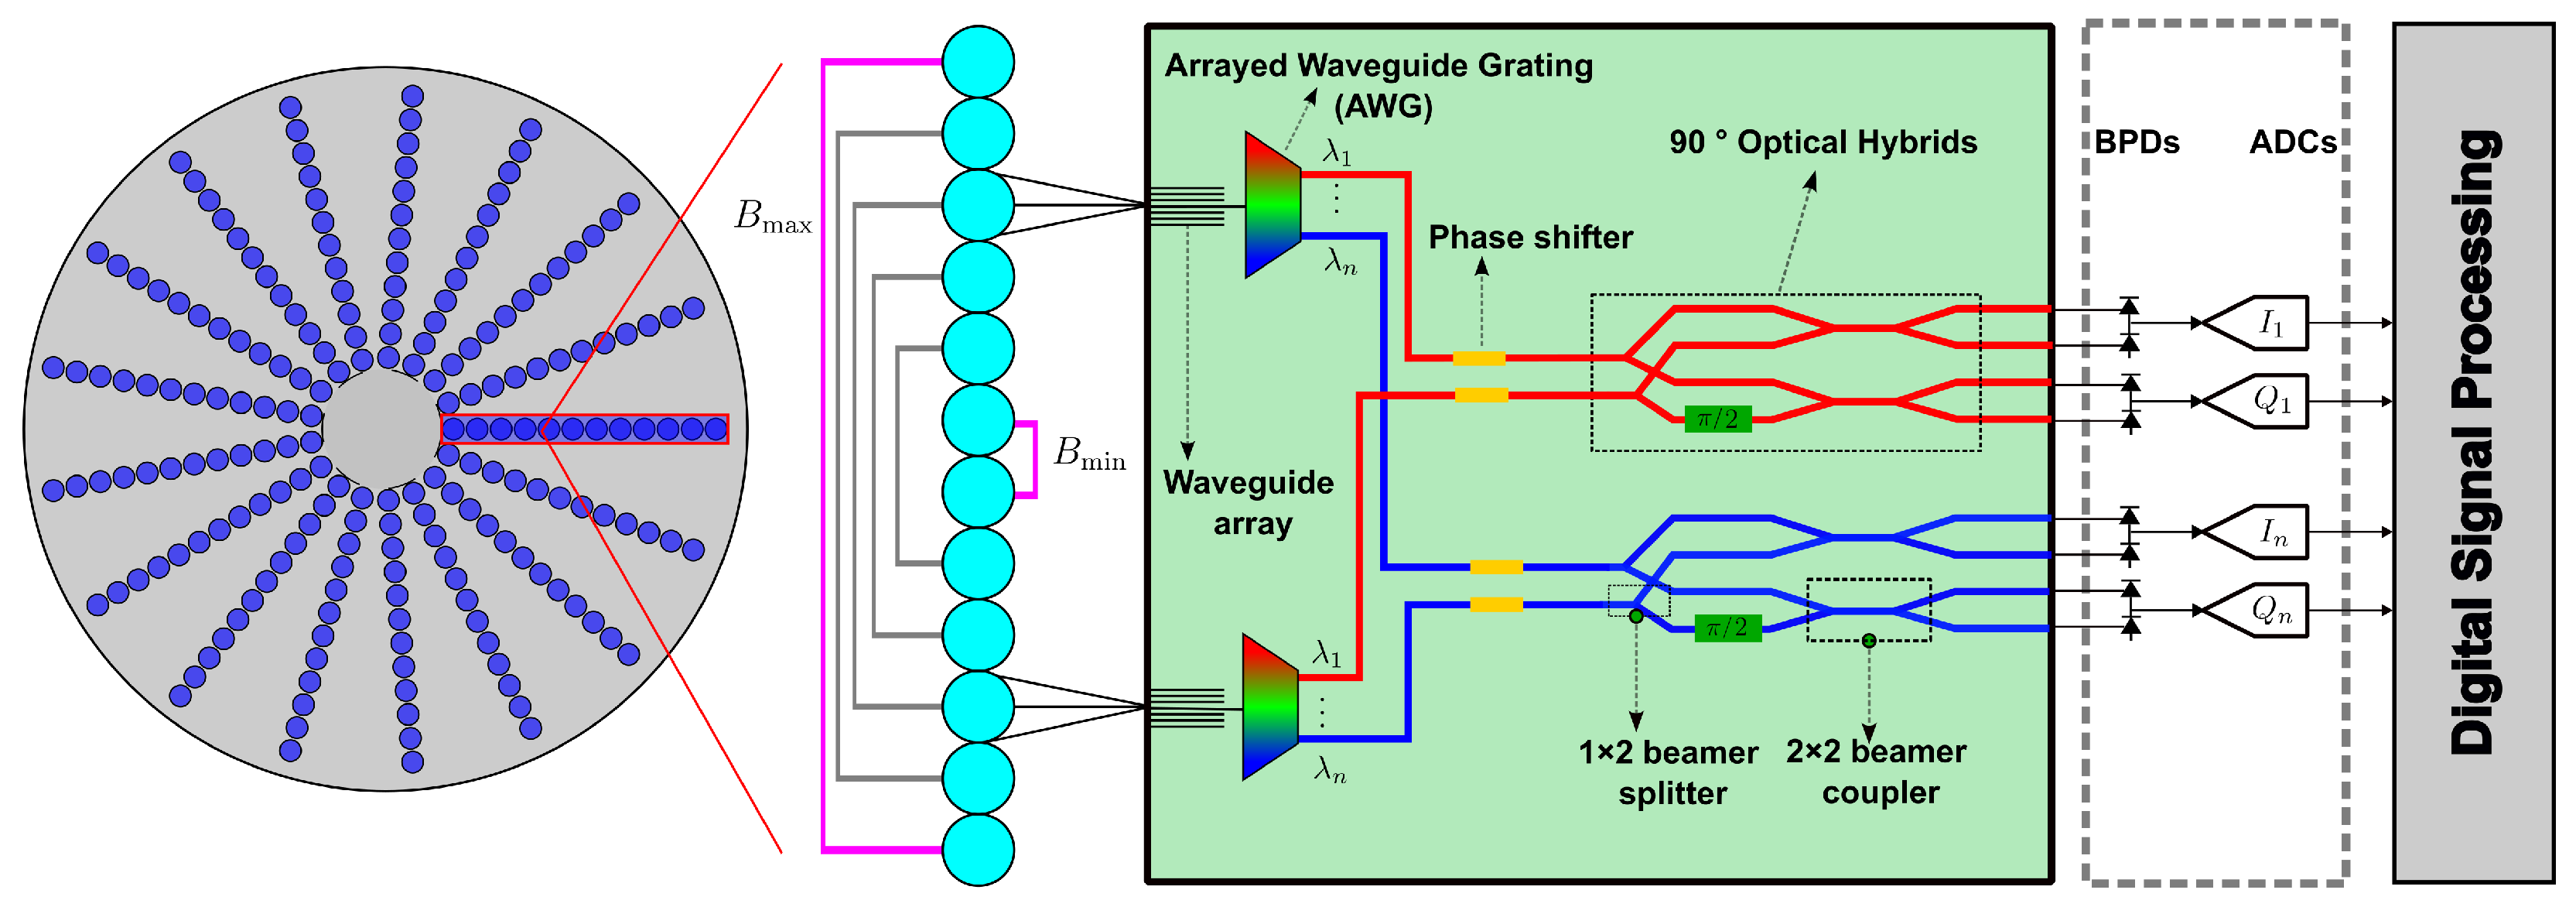
The structure of SPIDER is illustrated in Figure 1. The aperture array consists of 37 radially disposed one-dimensional sub-aperture arrays, each followed by a Photonic Integrated Circuit (PIC). Essentially, it functions as a multi-aperture optical interferometer where components such as waveguides, Arrayed Waveguide gratings (AWGs), beam combiners, and phase shifters are integrated into the PIC, thereby replacing complex optical systems. Balanced four-quadrature detection is employed to measure the real and imaginary parts of the complex visibility of interference fringes, and the measurement results are processed by a digital signal processing module to achieve interference fringe visibility measurement.
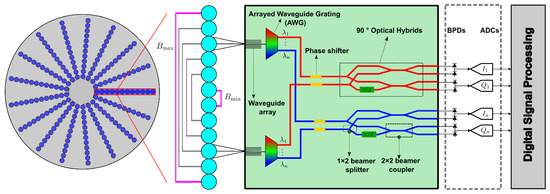
Figure 1.
Schematic diagram of the SPIDER system structure.
When the incident light is quasi-monochromatic, the interference signal formed by the aperture pair can be expressed as:
Here, represents the baseline vector formed by the dual apertures, denotes the introduced phase modulation, and is the complex coherence factor/complex visibility. According to the Van Cittert–Zernike theorem [54], the relationship between and the object intensity is given by the Fourier transform:
Here, equals , representing the sampling points corresponding to the baseline in the frequency domain (uv plane). Pupil-plane interferometry achieves sampling of the target’s spatial frequency spectrum through the baseline formed by the aperture array. After obtaining , image reconstruction can be performed using reconstruction algorithms. The simplest reconstructed image is known as a “dirty image”, which can be obtained through inverse Fourier transform:
For photonic integrated interferometric imaging systems, resolution is no longer determined by a single aperture but rather by the maximum baseline formed by the aperture array:
2.2. Checkerboard Aperture Arrangement
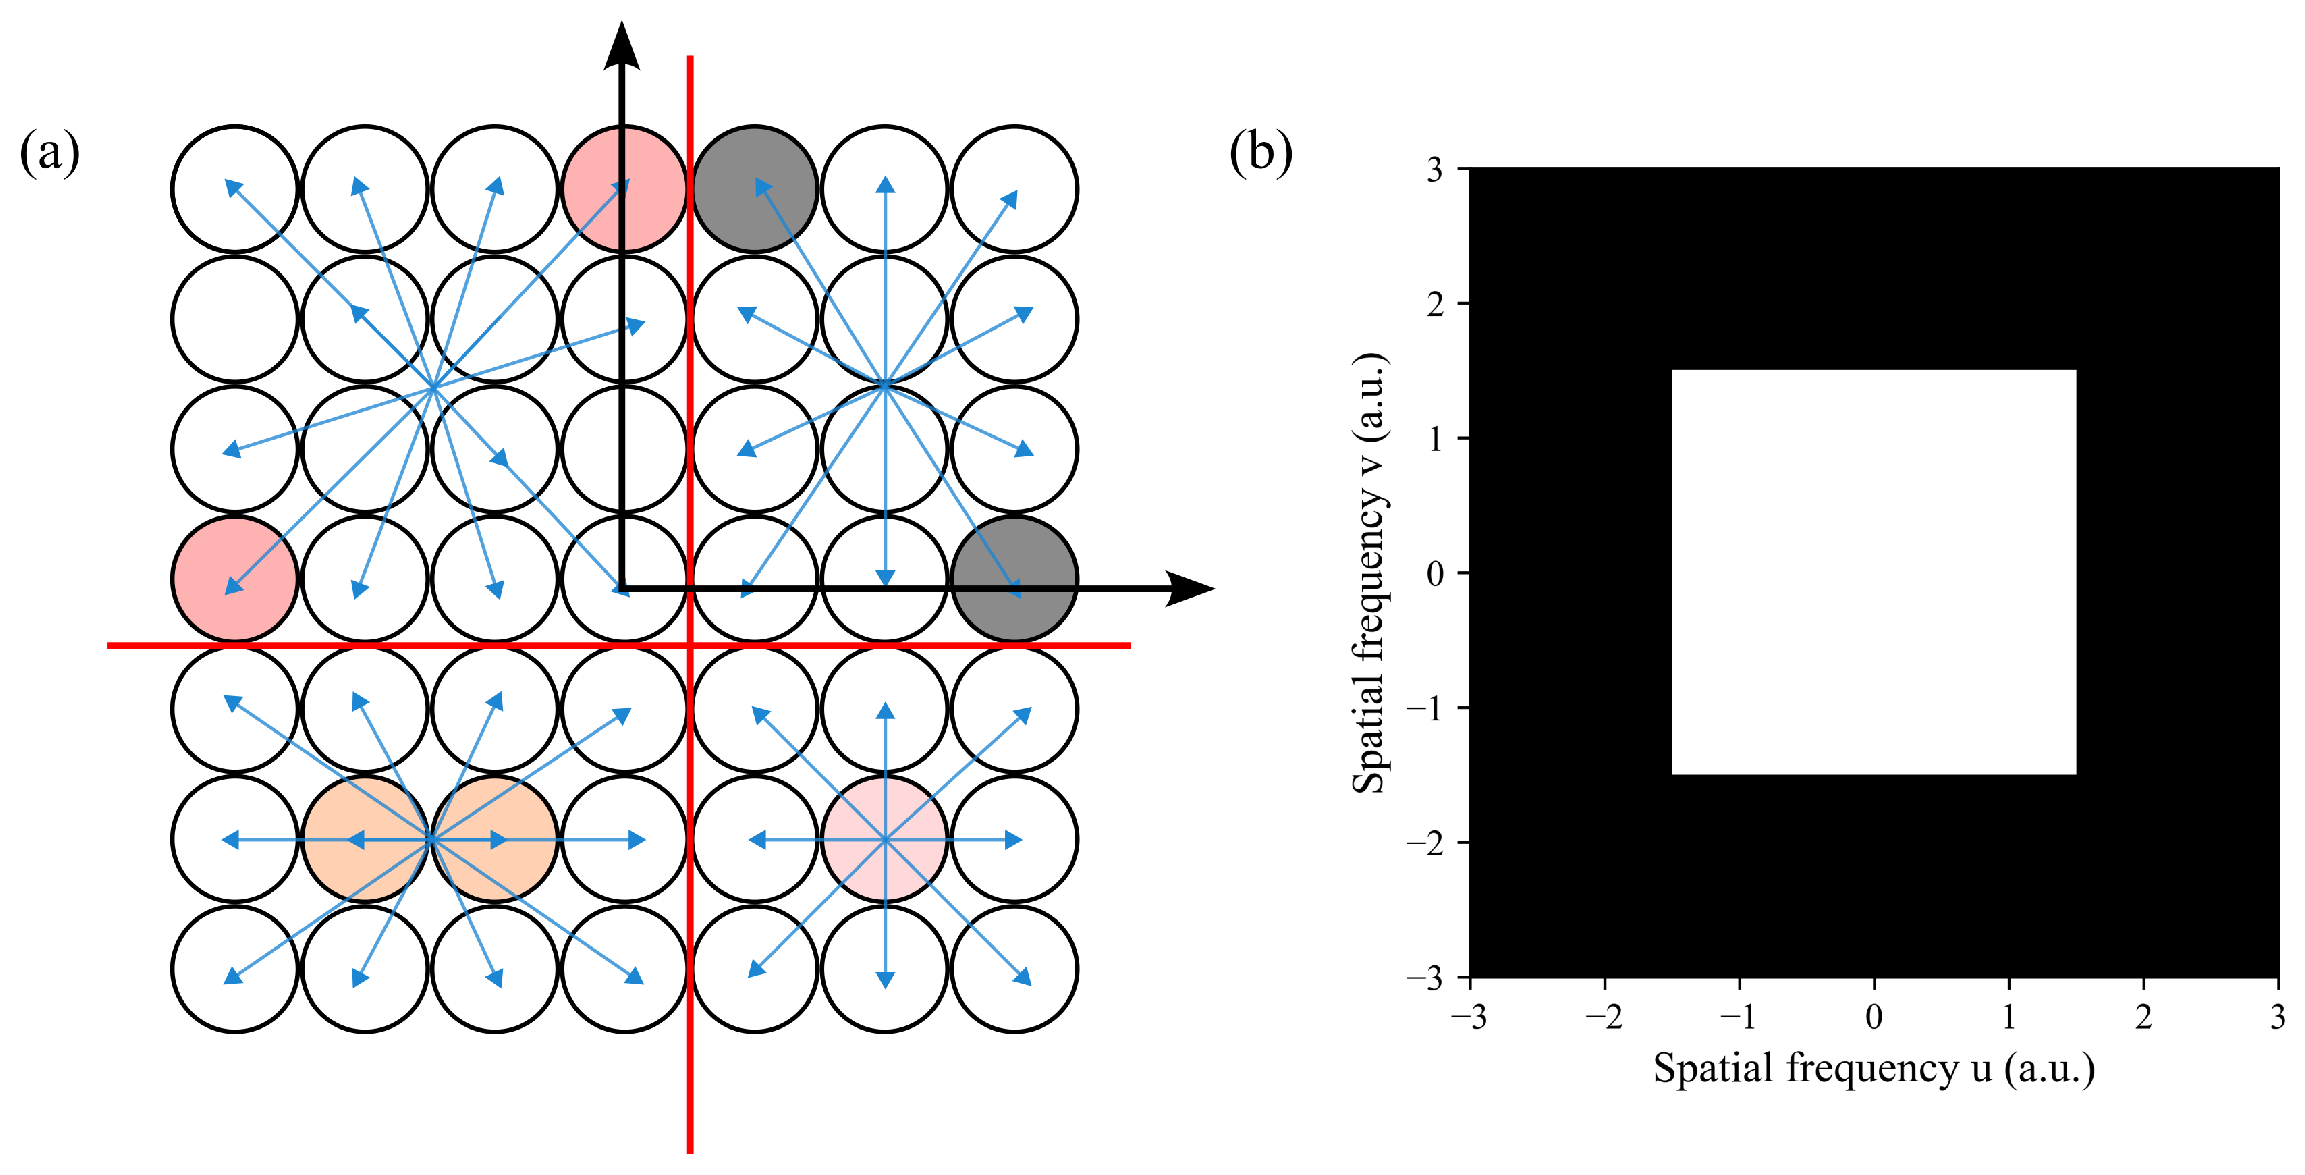
The SPIDER system adopts a radially disposed aperture array, as shown in Figure 1, where each radial one-dimensional sub-aperture array forms an interferometric baseline. If the number of sub-apertures in the 1D array is N, a possible simple pairing method is . Although other pairing methods exist, this approach maximizes the baseline under equal lens quantities and enables uniform radial sampling of the target spectrum. However, sampling in Cartesian coordinates is non-uniform, making it impossible to directly apply FFT algorithms during image inversion. Although gridding algorithms can be used for interpolation in the spatial frequency domain to obtain uniformly sampled frequency, the simplest gridding method, nearest-neighbor interpolation, assigns the measurement value at grid points to the nearest sample point, leading to significant errors. To avoid gridding affecting subsequent image simulations, we use a rectangular aperture array, specifically a checkerboard aperture arrangement, whose aperture arrangement is shown in Figure 2a. This compact arrangement achieves a high fill factor and, when combined with a specialized pairing method, allows for the continuous and uniform sampling pattern illustrated in Figure 2b [30].
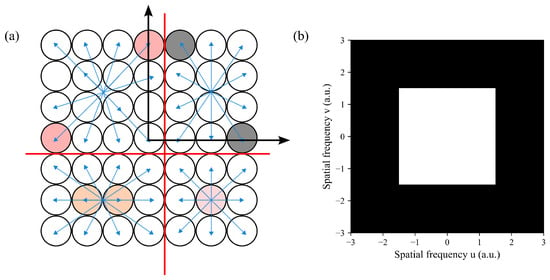
Figure 2.
(a) Schematic diagram of the checkerboard aperture array structure. (b) Sampling pattern of the checkerboard aperture array in the uv plane.
2.3. Signal Transmission Process
To analyze the actual measurement accuracy of space-based interferometric imaging systems, it is necessary to establish a full-chain energy transmission model from the target to the interferometric measurement signals. For space-based applications, the signal transmission process of the interferometric imaging system, as shown in Figure 3, can be divided into three main parts:

Figure 3.
Schematic diagram of the signal transmission process in space-based interferometric imaging systems.
2.3.1. Atmospheric Transmission
For passive optical imaging systems, the observed target radiation consists of two principal components: (1) thermal emission from the target’s blackbody radiation and (2) reflected solar radiation. In space-to-ground observation scenarios, the total spectral radiance at the system’s entrance pupil can be expressed as
Here, , , and represent solar irradiance, target irradiance, and atmospheric diffuse irradiance, respectively. , , and denote atmospheric transmission/reflection coefficients, target reflection/emission coefficients, and atmospheric diffuse factors, respectively. and are the zenith angles for the Sun and the observation platform, respectively. Similar to traditional remote sensing systems, the atmosphere’s own reflection of solar radiation (, including Rayleigh scattering and aerosol scattering) cannot be avoided. Although this radiation increases the radiance at the entrance pupil, it does not contain target information and thus degrades image quality. Therefore, atmospheric correction is required to improve image contrast.
2.3.2. Coupling into Waveguides
SPIDER uses an array of single-mode waveguides placed at the focal plane of sub-aperture to couple light from different field-of-view into the Photonic Integrated Circuit (PIC). The coupling efficiency is similar to that of typical fiber interferometers such as FLUOR and can be expressed as [55]
Here, , , where is the incidence angle corresponding to the object point, is the waveguide mode field radius, and f and D are the focal length and diameter of the sub-aperture, respectively. According to the calculation based on Equation (6), the maximum coupling efficiency is approximately 81%, corresponding to an incidence angle of . When the incidence angle increases to , the coupling efficiency drops to about one-tenth of that at normal incidence. Therefore, this value is typically used to define the field of view (FOV) of an interferometric imaging system employing a single-mode waveguide [55]:
when using an waveguide array, the system’s imaging field of view can be extended to .
Combining the radiance distribution of object with the coupling efficiency, the optical power coupled into the PIC by sub-aperture l is
where represents the optical efficiency of the PIC.
2.3.3. Signal Transmission Within the PIC
After the light is coupled into the PIC via sub-aperture, it undergoes dispersion by an Arrayed Waveguide Grating (AWG) and waveguide transmission before entering the beam combiner for interference. The interference signal formed by sub-apertures m and l is given by
Here, the superscript denotes the four output signals from the optical hybrid, , represent the corresponding transmission efficiencies, and indicates the respective phase modulation. The detailed description of interference in PIC is provided in Section 2.4.3. After arriving at the detector, the optical power is converted into photoelectrons. Considering the detector integration time and quantum efficiency , the interference signal can be expressed as
where and .
2.4. Noise and Signal-to-Noise Ratio Model
2.4.1. Intensisty Noise
The direct measurement in interferometric imaging systems is the intensity of interference fringes, which is equivalent to single-pixel measurements in traditional remote sensing imaging systems. Thus, in terms of fringe intensity, the noise sources are identical to those in traditional imaging systems. In this paper, we define this noise as intensity noise. Intensity noise consists of photon noise and detector intrinsic noise. The photon noise follows Poisson statistics. Let N denote the average number of photoelectrons detected by the sub-aperture; then, the random fluctuation due to photon noise satisfies:
The detector intrinsic noise mainly includes dark current noise (), readout noise (), fixed pattern noise (FPN), etc. Except for photon noise, other noise components can be suppressed by appropriate methods. In this paper, we primarily consider three types of intensity noise: photon noise , dark current noise , and readout noise . The total intensity noise is given by
2.4.2. Phase Noise
In space-based remote sensing interferometric imaging systems, phase noise can be categorized into two types:
- Environment-related phase noise (): Caused by factors such as thermal fluctuations and platform vibrations. This type of noise must be characterized based on actual device performance and satellite platform parameters.
- Atmospheric turbulence-induced phase noise (): This is the primary focus of our analysis.
The total phase noise can be expressed as
2.4.3. SNR Model of Interference Visibility
The signal-to-noise ratio (SNR) is a critical performance metric for remote sensing imaging systems, and it plays an equally vital role in interferometric imaging systems. The precision of amplitude and phase measurements depends on both the measurement method and the noise in the interferometric signal intensity. For phase measurements, there is an additional impact from phase noise, as previously discussed. Compared to amplitude measurements, phase accuracy has a more substantial effect on imaging quality [56,57,58]. To analyze the SNR of space-based interferometric systems, this section first describes the fundamental principles of the balanced four-quadrature detection method used in PIIS. It then calculates the visibility noise using error propagation laws. As shown in Figure 4, the balanced four-quadrature detection system consists of a 90° optical hybrid and heterodyne detectors. The hybrid modulates the two collected light fields, and , from sub-apertures l and m, producing four output signals:

Figure 4.
Schematic diagram of balanced four-quadrature detection.
The corresponding signal intensities contain visibility information, theoretically given by
Here, represents the phase, and S denotes the visibility reduction due to the interferometric bandwidth, representing temporal coherence. If the interferometric bandwidth is and the central wavelength is , then S can be expressed as . When , even if is large, the actual fringe visibility is much less than 1, making measurement impossible. After passing through the heterodyne detectors, the outputs I and Q correspond to the real and imaginary parts of the visibility:
When , the fringe visibility and phase can be calculated using the following formulas:
The visibility amplitude and phase calculated using Equation (16) incorporates the degradation factor S caused by finite bandwidth effects. In practical systems, all interferometric measurement setups exhibit intrinsic visibility due to device imperfections. These include:
- Unequal waveguide lengths;
- Differential loss coefficients among transmitting apertures;
- Deviations from ideal 3 dB splitting ratios in beam splitters;
- Phase modulation inaccuracies.
While these factors introduce systematic measurement biases, their effects can be effectively compensated through proper calibration procedures under stable operating conditions. Therefore, this study does not account for the influence of in the subsequent analysis. To simplify the analysis, assume .
From Equations (15)–(17), it is clear that both the amplitude and phase of the visibility function are derived from intensity measurements. Consequently, any errors in intensity detection will directly propagate into these visibility parameters. Furthermore, the noise variances due to intensity noise affecting visibility amplitude and phase can be calculated:
For visibility noise, it should be noted that the visibility obtained from quadrature measurements is actually , evident from the denominator in the expression for . The above noise variances represent only the transfer effect of intensity noise, while phase noise itself is also affected by atmospheric and other random noises. In fact, for remote sensing scenarios, the corresponding visibility is generally weak, so . Under first-order approximation, we obtain
Here, represents the phase measurement error induced by intensity noise. Following the definition of signal-to-noise ratio (SNR), we can derive the SNR expression for visibility amplitude as
Based on the above formulation, we can define a visibility amplitude threshold to characterize the minimum detectable fringe visibility for space-based interferometric imaging systems. When the signal-to-noise ratio of visibility reaches unity (), the interference fringes become completely indistinguishable from the noise floor. Consequently, the visibility threshold can be quantitatively defined as the reciprocal of the visibility signal-to-noise ratio (SNR), expressed as . As derived from Equation (19), when , the phase measurement error induced solely by intensity noise already exceeds 1 radian.
When photon noise dominates over other noise sources, we obtain
2.5. Sub-Aperture Energy Level
According to the SNR formula (18), analysis of the visibility SNR level requires knowledge of the sub-aperture’s energy level. To determine the detection signal strength of the sub-aperture, the radiance at the entrance pupil of the system must be known. In the visible and near-infrared bands, the target’s self-radiation can be neglected, and the radiance at the entrance pupil of a space-based observation system can be simulated based on atmospheric parameters, aerosols, and geometric parameters. This study employs the 6S radiative transfer model [50,51] to simulate the entrance pupil radiance. By combining the entrance pupil radiance with system parameters including optical throughput efficiency , relative spectral response , and others, the number of photoelectrons collected by the sub-aperture can be calculated as
where represents the integration time and denotes the field of view determined by the minimum baseline. When sub-apertures are tightly packed, . The quantum efficiency of the detector is given by , while and D represent the optical throughput efficiency and aperture diameter of the PIC, respectively, with specific values provided in Table 1.

Table 1.
Parameters of Imager.
2.6. Impact of Atmospheric Turbulence on Interferometric Measurements
2.6.1. Turbulence Phase Noise
Unlike ground-based observation systems, the influence of turbulence diminishes with increasing satellite altitude for remote sensing applications. For interferometric imaging systems, atmospheric turbulence-induced phase noise constitutes a primary noise source. The standard deviation of this phase noise, , can be derived from the Kolmogorov turbulence model [59]:
where is the Fried parameter, a critical metric for characterizing atmospheric turbulence effects. For space-based remote sensing imaging, can be calculated using the following formulation [49]:
where H represents the observation platform altitude, denotes the zenith angle of observation, and is the refractive index structure constant that quantifies atmospheric turbulence intensity. For space-based platform calculations, we adopt the widely recognized HV-5/7 model [52], where is expressed as:
2.6.2. Maximum Baseline Constraint
Without employing any turbulence suppression techniques, the resolution limit of traditional remote sensing imaging systems is determined by the parameter described in Equation (24) [49]. However, for interferometric imaging systems where the direct measurements represent interference signals rather than target intensity distributions, the system resolution does not have a direct correspondence with . As the baseline increases, turbulence-induced phase errors become more significant, causing the measured phase to deviate substantially from theoretical values. Under such conditions, employing longer baselines does not improve reconstructed image resolution, suggesting the existence of a baseline threshold beyond which image quality degrades severely. Chen et al. investigated the influence of varying phase noise levels on reconstructed image quality using Monte Carlo methods. Their results demonstrate that, when the system’s phase measurement error does not exceed , the reconstructed image quality remains acceptable [44]. This phase threshold corresponds to an equivalent optical path error about . Combining this with Equation (23) yields a maximum baseline :
2.7. System Parameter Specification for Performance Analysis of Photonic Integrated Interferometric Imagers
Currently, photonic integrated interferometric imaging systems such as SPIDER remain in the conceptual design and experimental validation phase. For our analysis, we adopt the orbital and spectral parameters of the WorldView-3 as reference benchmarks. This selection is justified by two key considerations: First, WorldView-3 represents a state-of-the-art high-resolution multispectral remote sensing system whose performance specifications closely align with the objectives of space-based interferometric imaging systems. Second, the current SPIDER system design features a maximum baseline of approximately 10 cm—comparable to the aperture size of the WorldView-3 camera.
Our analysis assumes a total system optical throughput efficiency of (accounting for coupling losses), which aligns with the PIC throughput attenuation specifications for the fourth-generation SPIDER design [16]. For intensity noise, in addition to the intrinsic photon noise, we consider two representative noise sources for the detector: readout noise and dark current noise, with typical values of 10 and 5 /s, respectively.
For the aperture configuration, we employ a checkerboard rectangular array pattern. This specific arrangement was deliberately selected to mitigate potential artifacts that could emerge from gridding effects inherent in alternative configurations, consequently improving the fidelity of our imaging simulations detailed in Section 3.2. Additional parameters, including detector noise levels and quantum efficiency, are assigned typical values based on standard references. The complete set of system parameters is systematically cataloged in Table 1.
3. Results
3.1. System Performance Analysis
3.1.1. Entrance Pupil Radiance
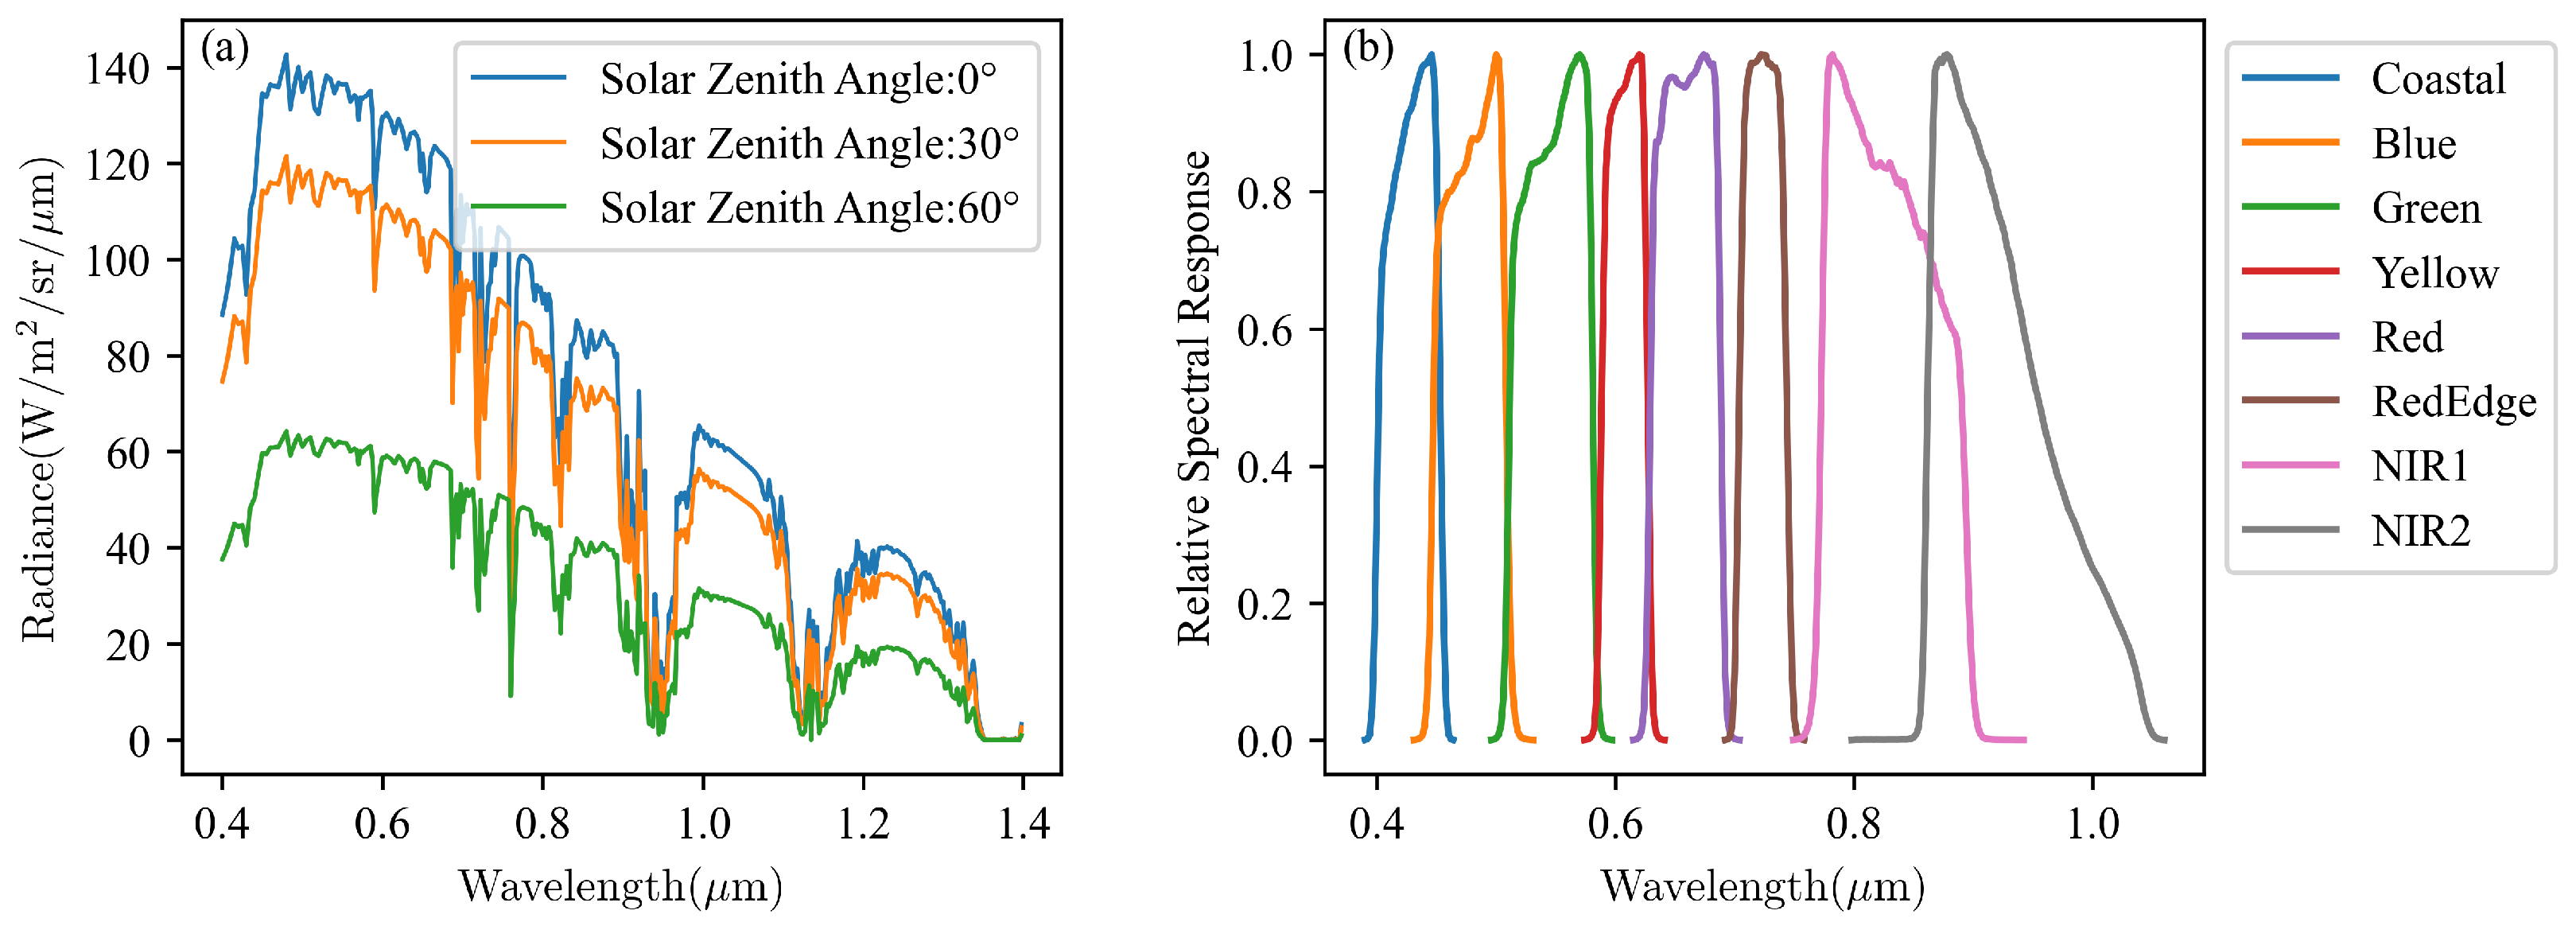
To characterize the optical energy collection performance of the space-based photonic integrated interferometric imaging system, we employed the parameters listed in Table 2 to compute the system’s entrance pupil radiance using the 6S radiative transfer model. Figure 5a presents the calculated spectral radiance distribution across the visible and near-infrared bands, while Figure 5b displays the corresponding relative spectral response (RSR) of the WorldView-3 sensor. Under this spectral configuration, the ratio of center wavelength to bandwidth () exceeds 5 for all spectral channels, ensuring that the bandwidth-induced visibility degradation factor remains negligible ().

Table 2.
Simulation parameters of 6S.
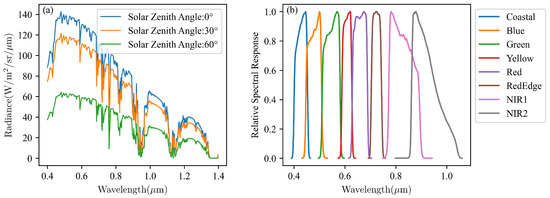
Figure 5.
(a) Entrance pupil radiance calculated based on Table 2. (b) Relative spectral response of WorldView-3 VNIR.
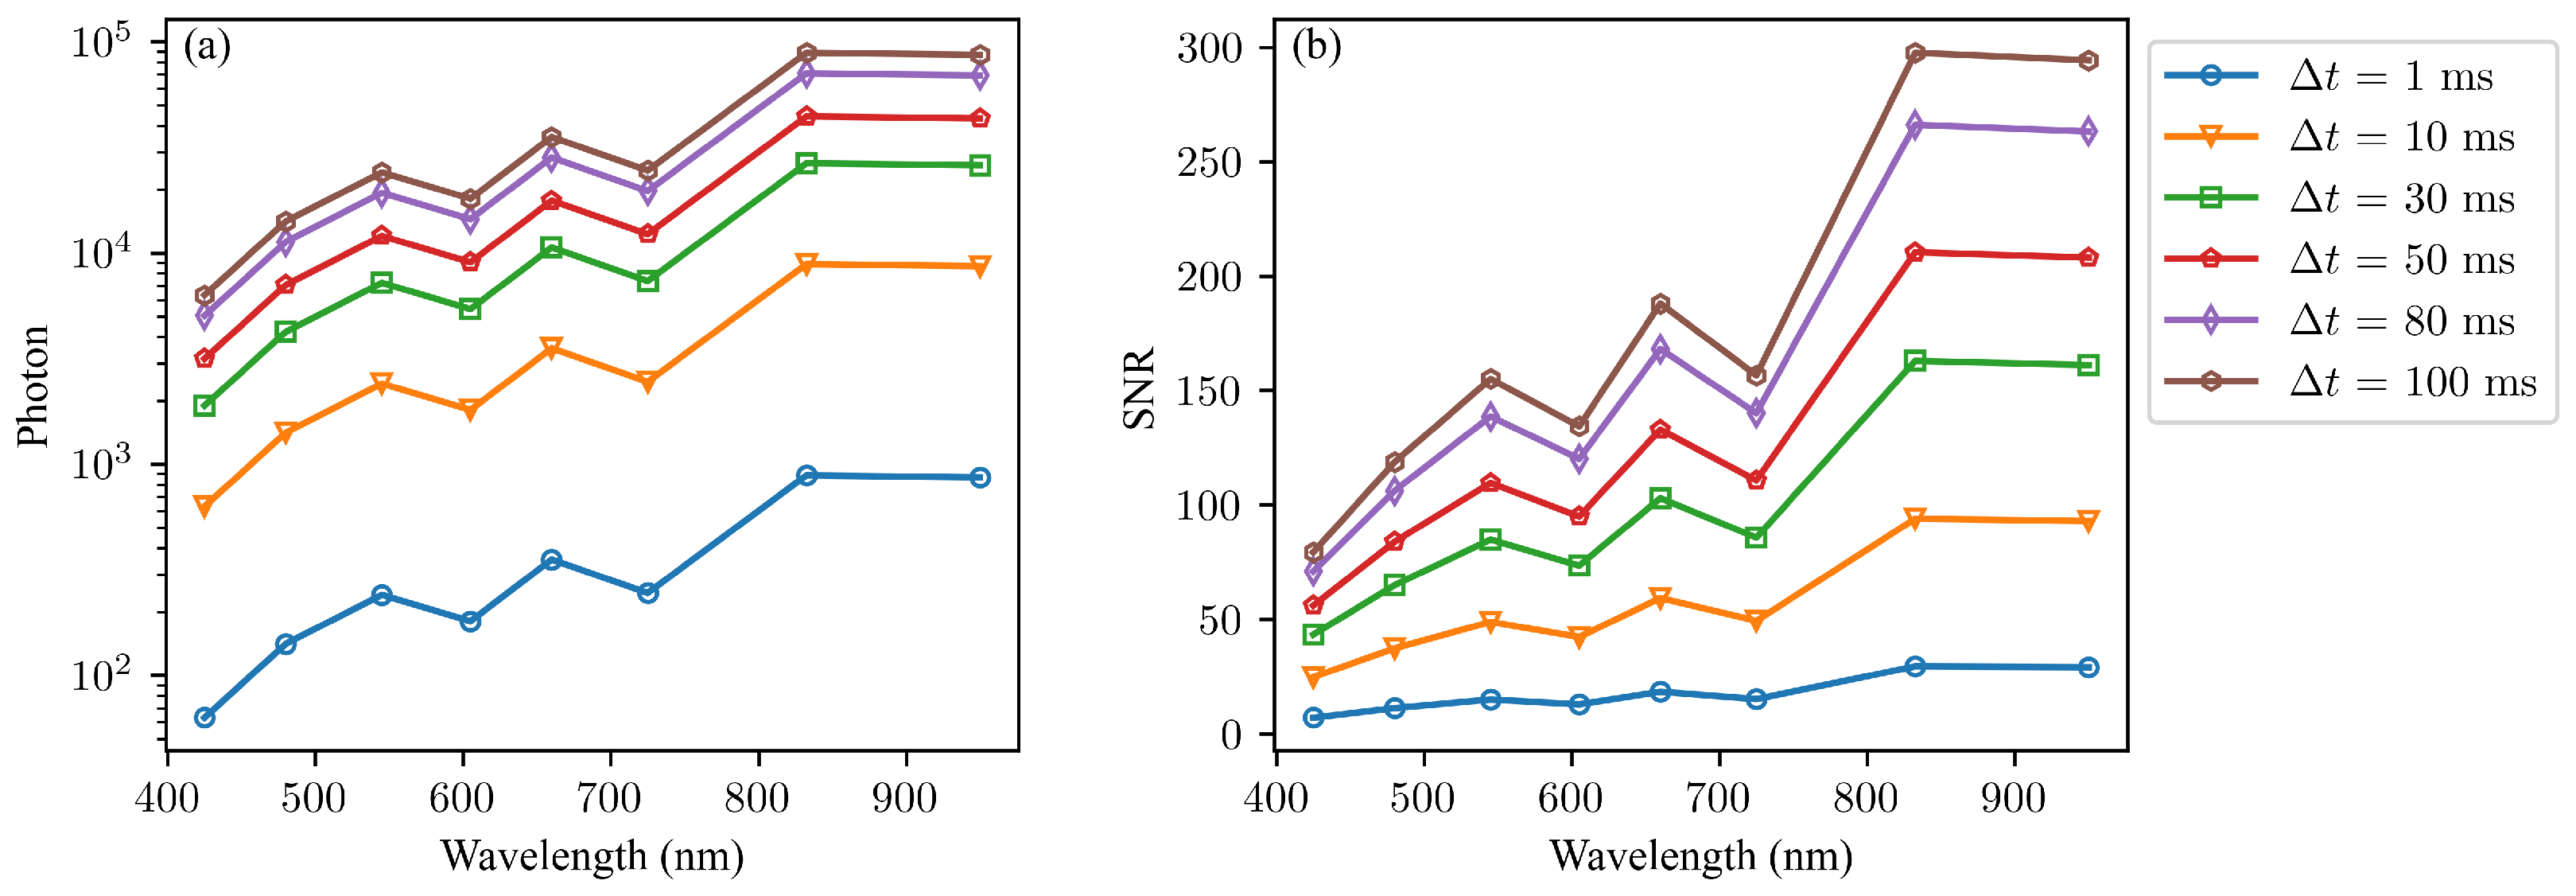
Figure 6 illustrates the detected photoelectron counts and corresponding signal-to-noise ratio (SNR) of sub-aperture for varying integration times. The results demonstrate that photon noise dominates both detector readout noise and dark current noise, establishing the system as fundamentally photon-noise-limited. With an optical throughput efficiency of dB, the sub-aperture SNR ranges between 10 and 30 for a 1 ms integration period. Given the photon-noise-limited nature of the system, the SNR scales with the square root of integration time, following the relationship .
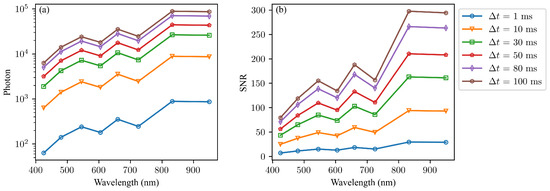
Figure 6.
(a) Number of photons detected by the sub-aperture for different wavelengths and integration times. (b) SNR for each wavelength band at various integration times.
3.1.2. Turbulence Phase Noise and Maximum Baseline
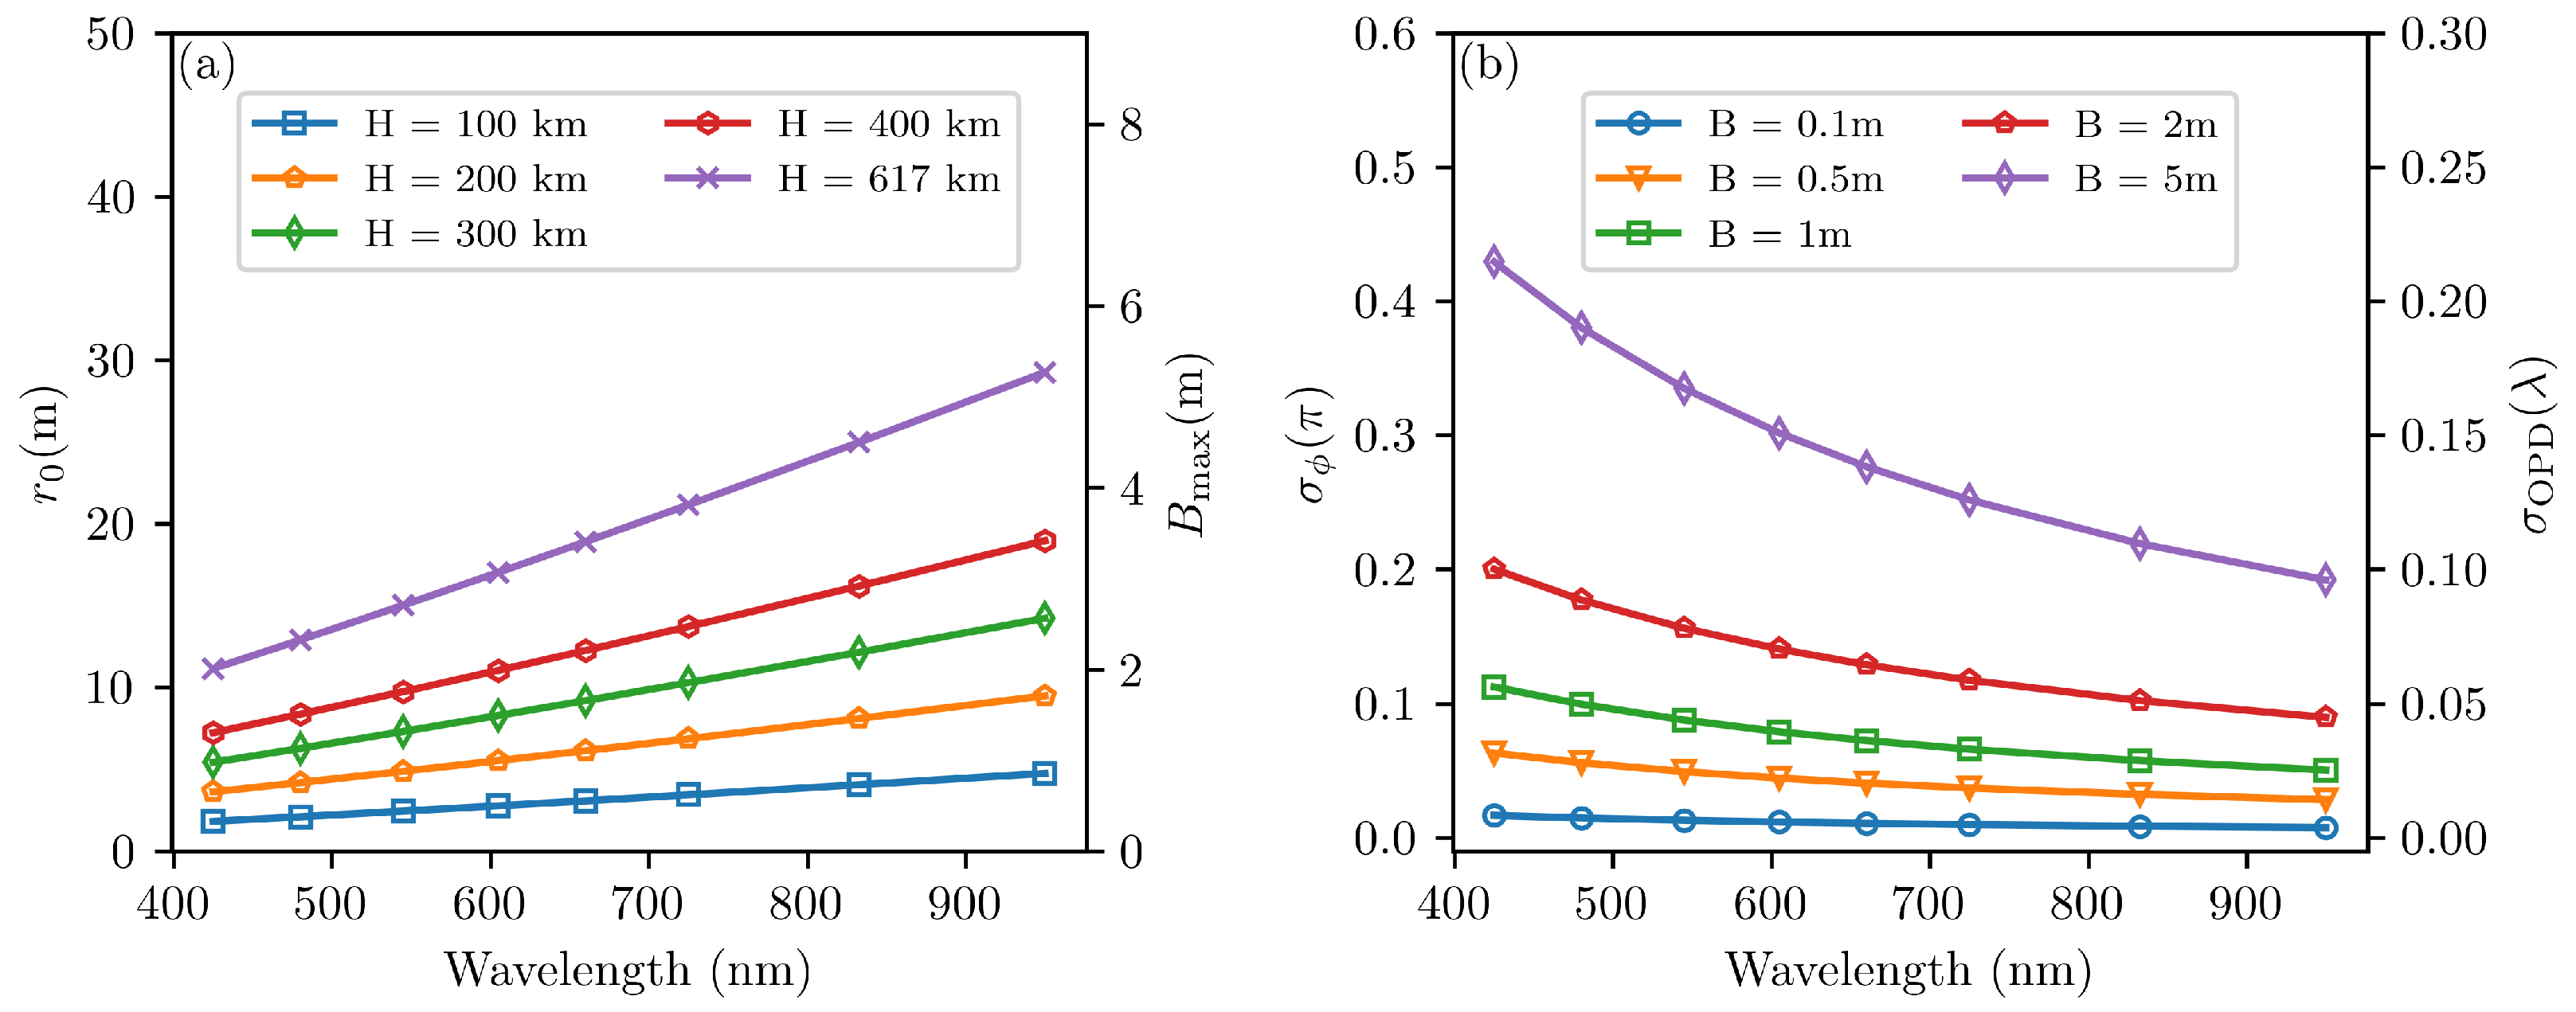
By combining Equations (23)–(25), we can quantitatively evaluate both the Fried parameter and the standard deviation of turbulence-induced phase noise for space-based interferometric imaging systems. Figure 7a presents the calculated Fried parameter and the maximum baseline defined by Equation (26) across various orbital altitudes exceeding 100 km in the visible and near-infrared spectral bands. The results demonstrate that, for space-based remote sensing applications, consistently exceeds 1 m, indicating that the turbulence-limited upper baseline threshold typically surpasses 20 cm.
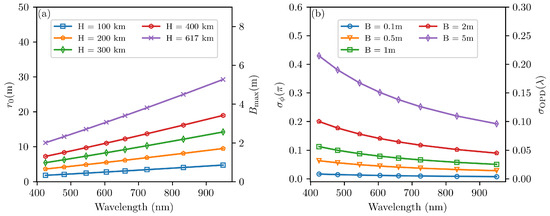
Figure 7.
(a) Fried parameter and max at different orbital altitudes H at the visible and near-infrared bands. (b) Standard deviation of atmospheric phase noise and OPD noise for different interferometric baselines at an orbital altitude of 617 km.
Figure 7b illustrates the atmospheric phase noise for different baseline lengths at a representative orbital altitude of 617 km. The analysis reveals that, at this altitude, phase jitter remains within (one-tenth wavelength) for baseline lengths below 2 m. For shorter baselines around 1 m, the corresponding phase error reduces to approximately . Considering the WorldView-3 imaging system’s aperture of 11 cm (WV-110) as a reference case, the atmospheric phase error amounts to merely in the VNIR spectral band.
3.1.3. SNR of Visibility Measurement
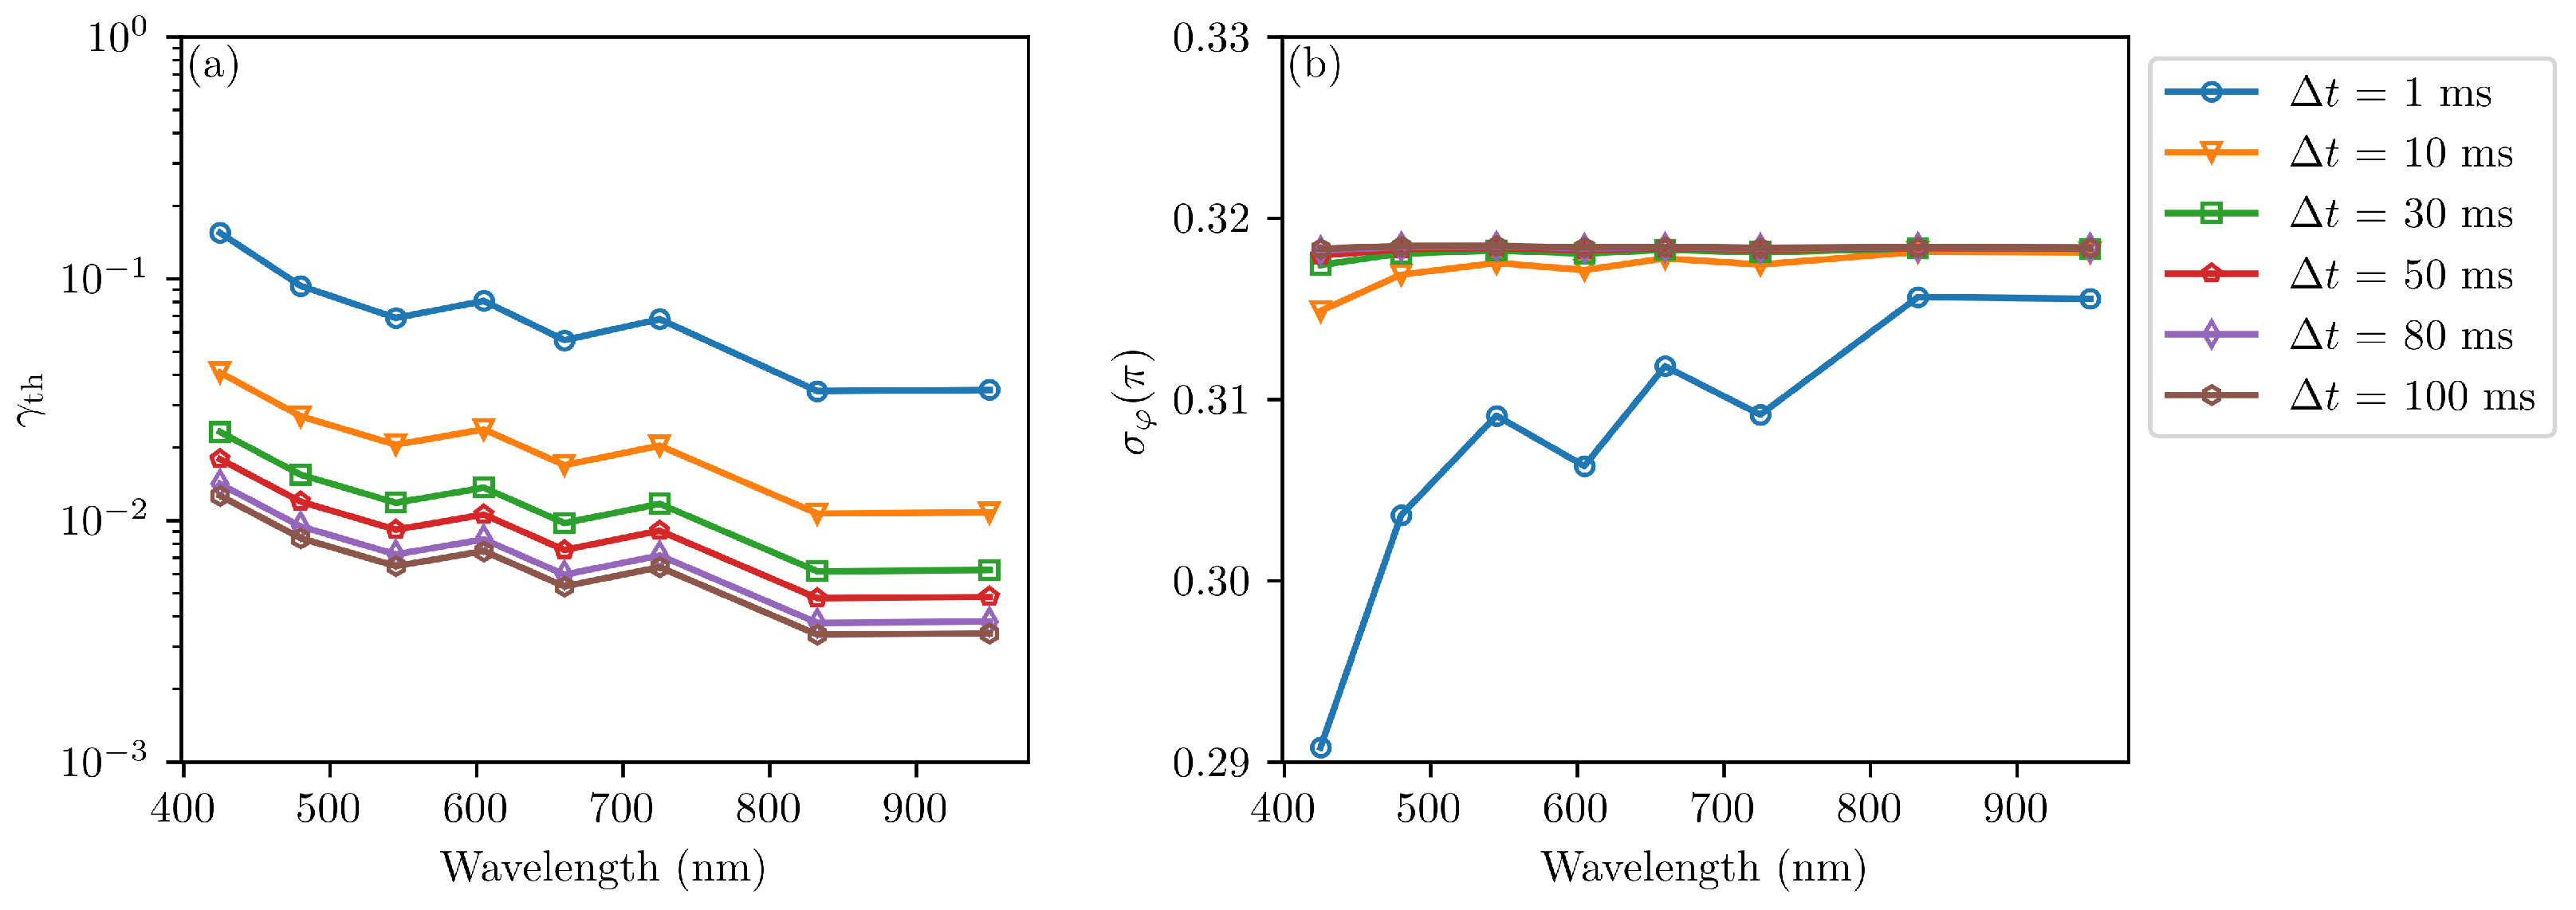
Figure 8 shows the visibility measurement thresholds for different spectral channels at various integration times. As the integration time increases, the visibility threshold gradually decreases, indicating improved measurement accuracy. From the figure, it can be observed that, for integration times within 100 ms, the threshold remains . As mentioned earlier, visibility below this threshold will result in significant errors in both amplitude and phase detection.
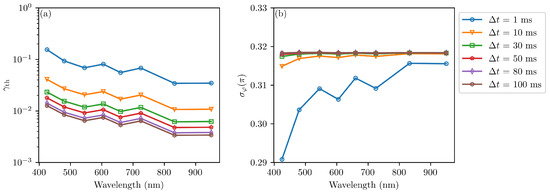
Figure 8.
(a) Thresholds of visibility measurement for different spectral channels at various integration times. (b) Phase noise at these visibility thresholds at various integration times.
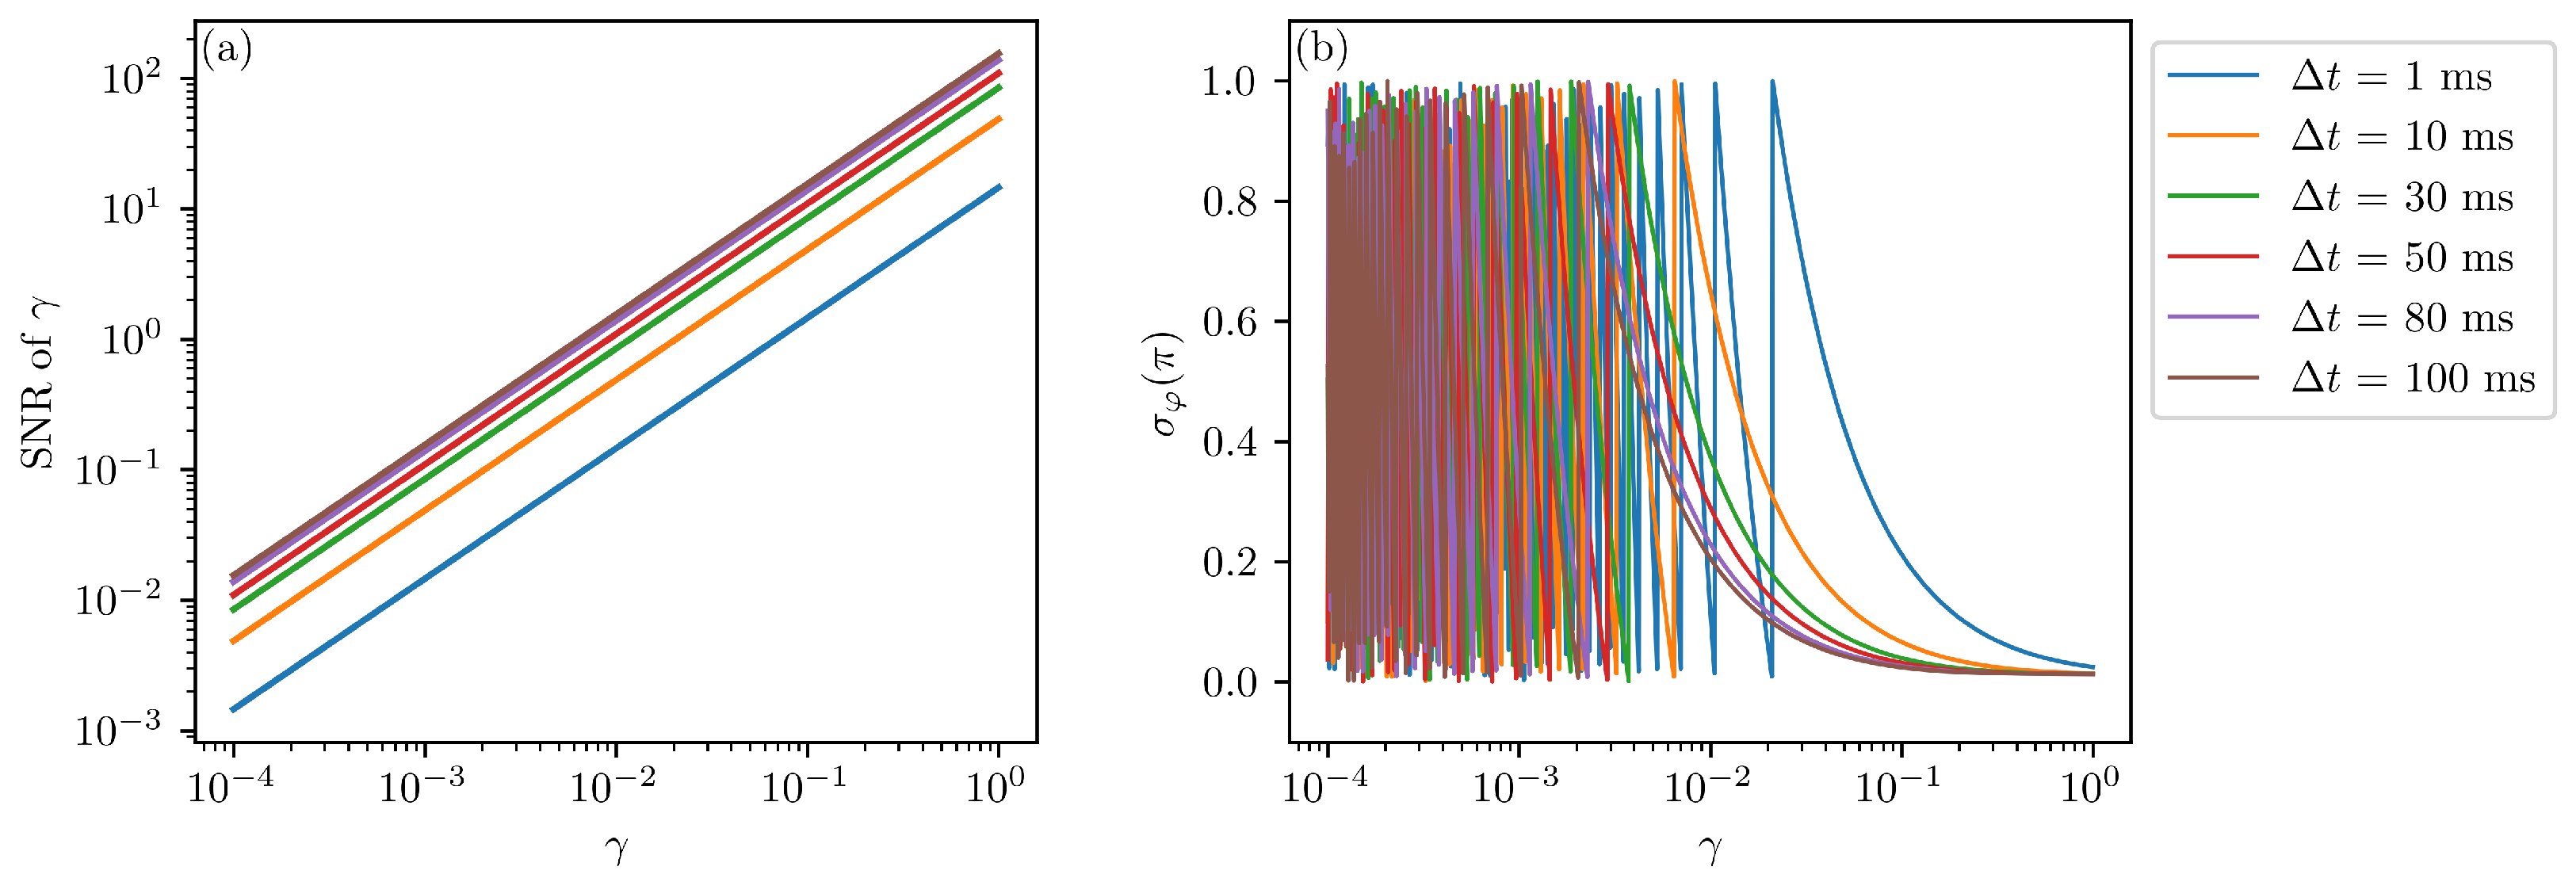
Figure 9a shows the amplitude measurement SNR at different integration and phase noise for the green band with a baseline of . This baseline is comparable to that of the WorldView-3 camera (WV-110). The x-axis of the figure represents the range of visibility amplitude , which varies from to 1. From Figure 9a, it can be observed that increasing the integration time improves the measurement SNR, thereby reducing the phase measurement noise. However, as shown in Figure 9b, phase noise tends to stabilize as the visibility amplitude increases. Therefore, long integration times can only effectively reduce the phase measurement noise caused by intensity noise, while the influence of turbulence becomes dominant. For Earth observation scenes, especially in the high-frequency regions of the spectrum, visibility is usually much smaller than 1. These spectral components correspond to finer structures in images, which are critical for high-resolution imaging. To detect these high-frequency components, longer baselines are required. At a fixed orbital altitude, longer baselines mean greater phase errors due to turbulence. If specific measurement accuracy is required, the signal strength must be increased to reduce the measurement error caused by intensity noise; for example, using integration times of 10 ms or even 100 ms to achieve a threshold of to . To achieve high-resolution imaging, longer interferometric baselines are needed, but the minimum detectable visibility must also be considered. From a system design perspective, to fully utilize the high-resolution capability of long baselines, it is necessary to increase system optical efficiency or extend integration times to reduce the impact of intensity noise. Under limited integration times, appropriate baseline lengths must be chosen; otherwise, longer baselines may not provide higher imaging resolution. However, there is no direct relationship between the visibility threshold and the maximum baseline, but empirical relationships can be derived for specific scenarios to guide system design.
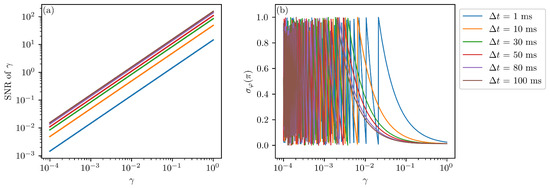
Figure 9.
For green (510–580 nm) band and 0.1 m baseline, (a) SNR of visibility measurement at different integration times. (b) Phase measurement noise at different integration times.
3.2. Characterization of Imaging Performance
The preceding system performance analysis primarily focused on visibility measurement errors. As an indirect imaging system, all the aforementioned measurement errors contribute to varying degrees of degradation in the reconstructed image quality of target scenes. Therefore, this section evaluates the system’s imaging performance through simulation experiments based on the parameters specified in Table 1.
For simulation inputs, we selected authentic remote sensing images acquired by the WorldView-3 satellite from the Rareplanes dataset [60]. To account for the varying fields of view and resolutions across different spectral bands while maintaining the uniform Ground Sample Distance (GSD) characteristic of WorldView-3 imagery, all input images were properly rescaled to match the corresponding band-specific fields of view and resolutions.
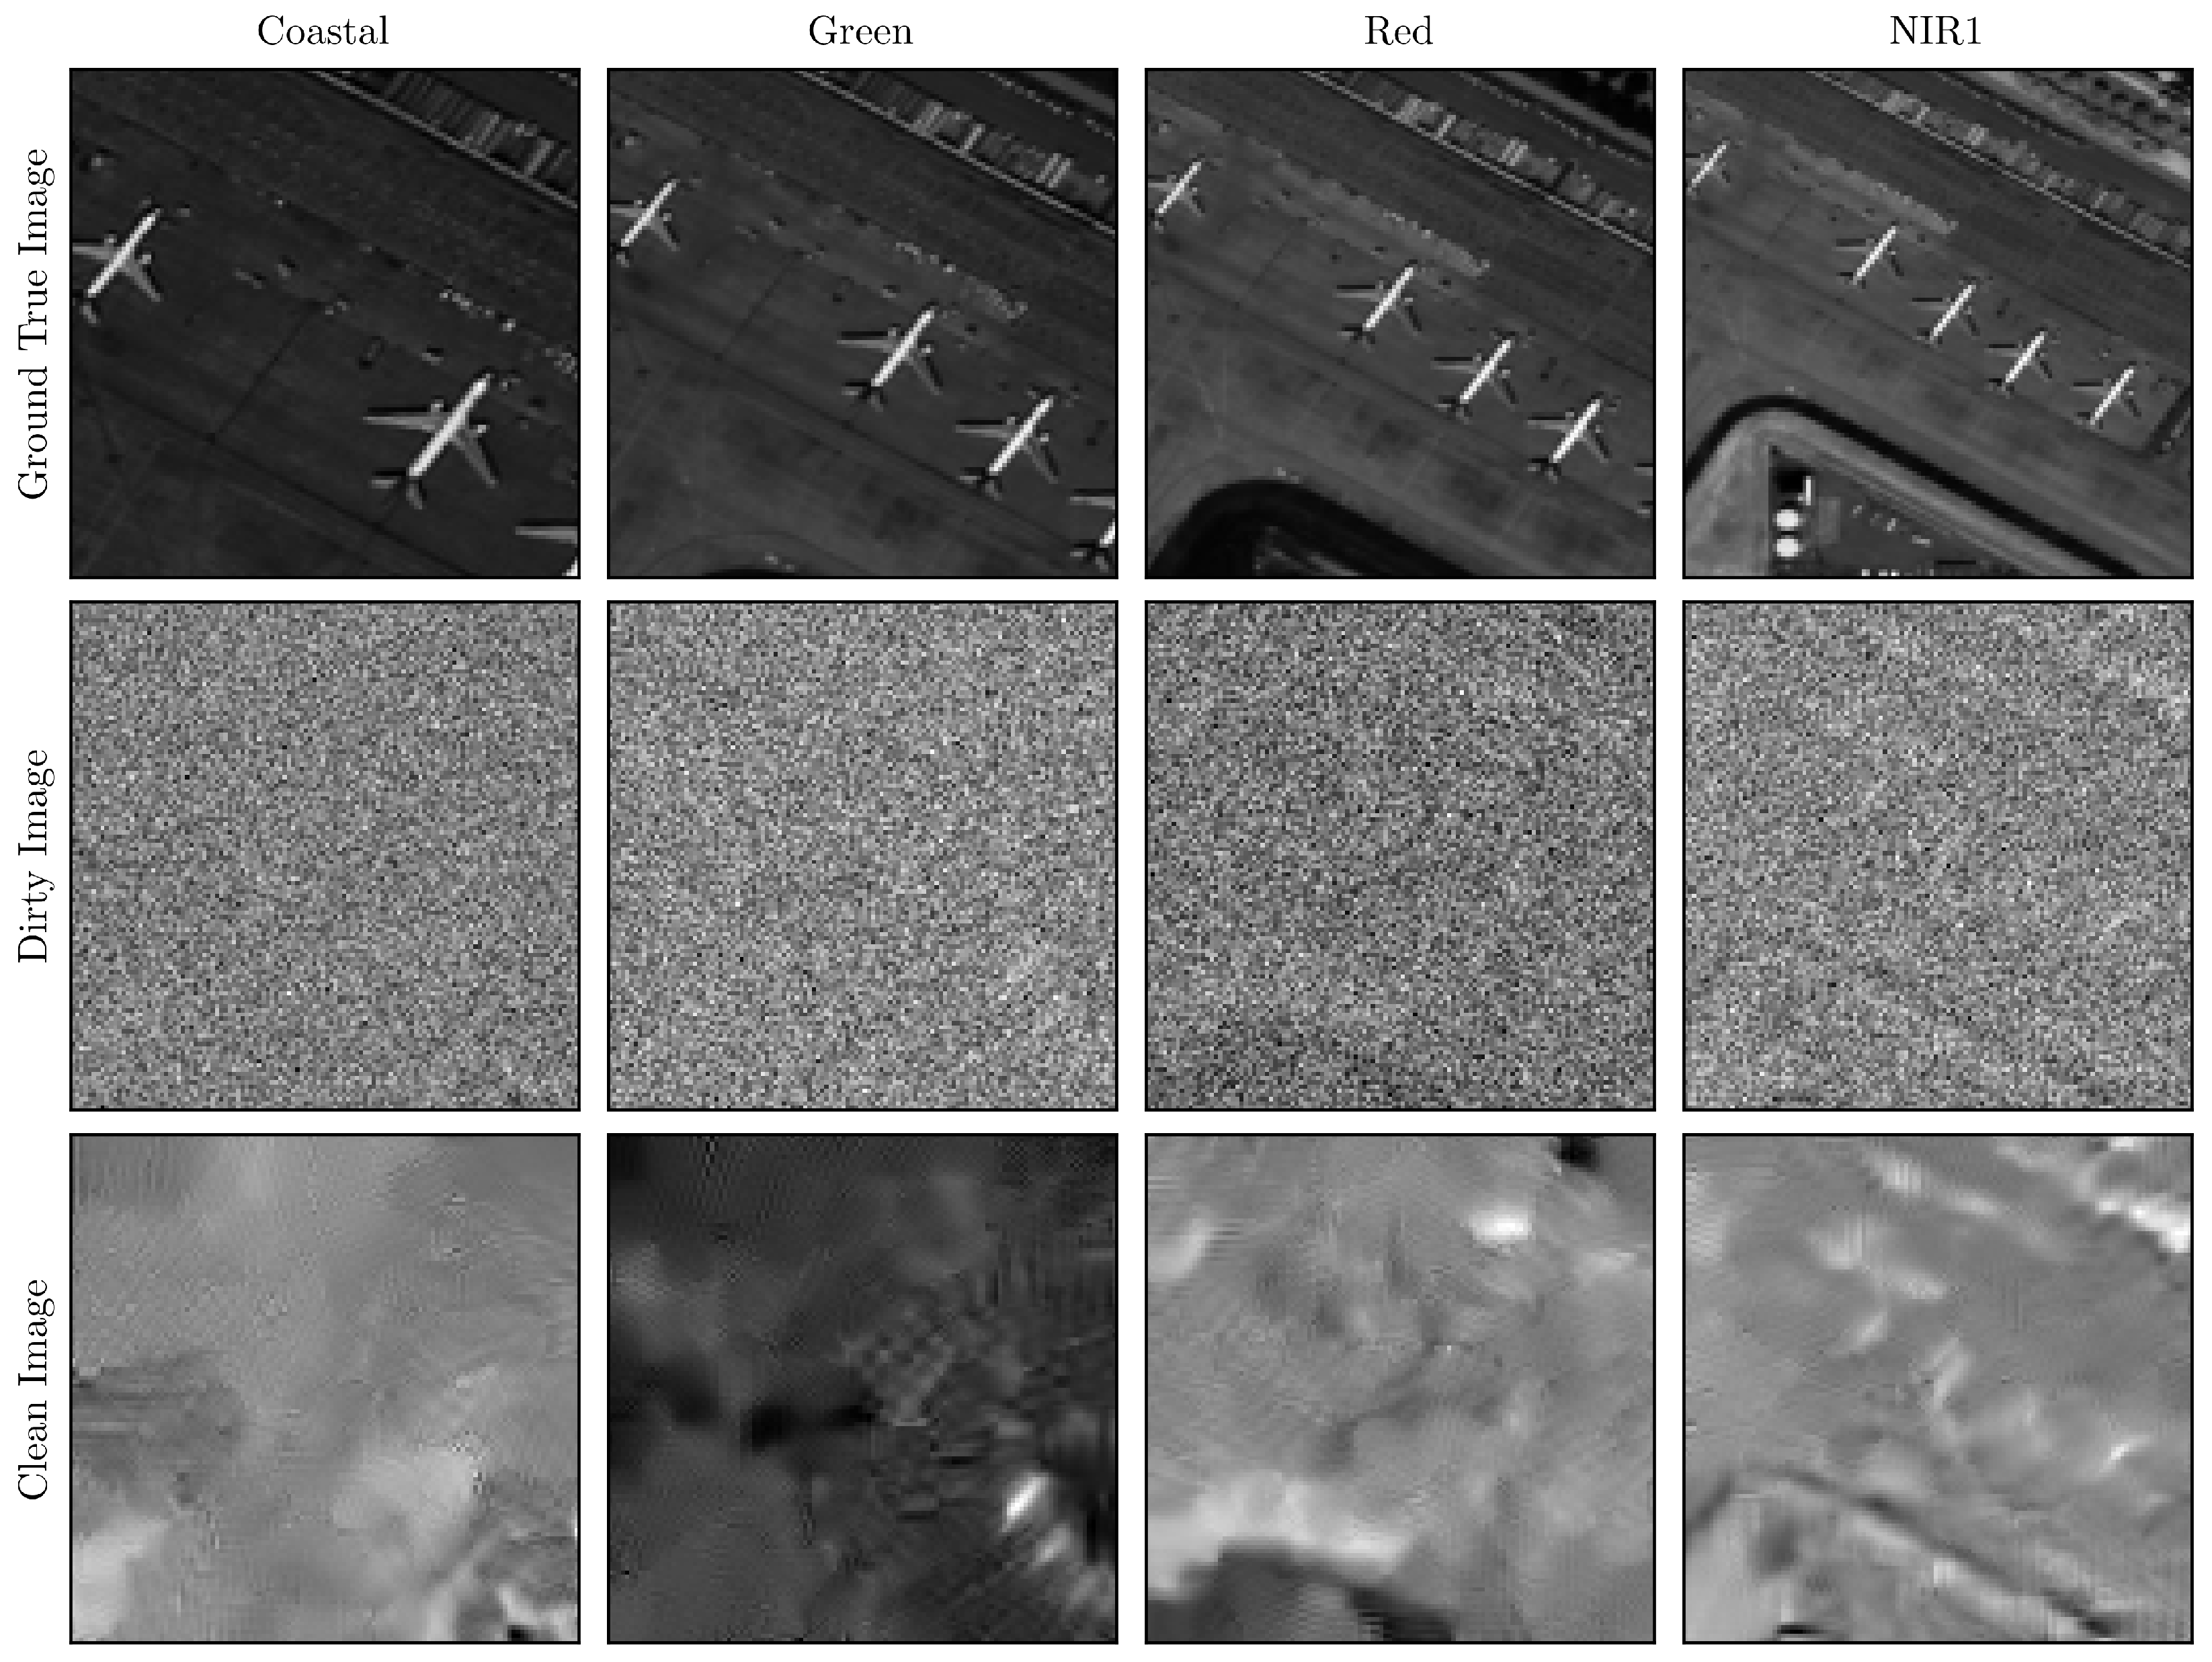
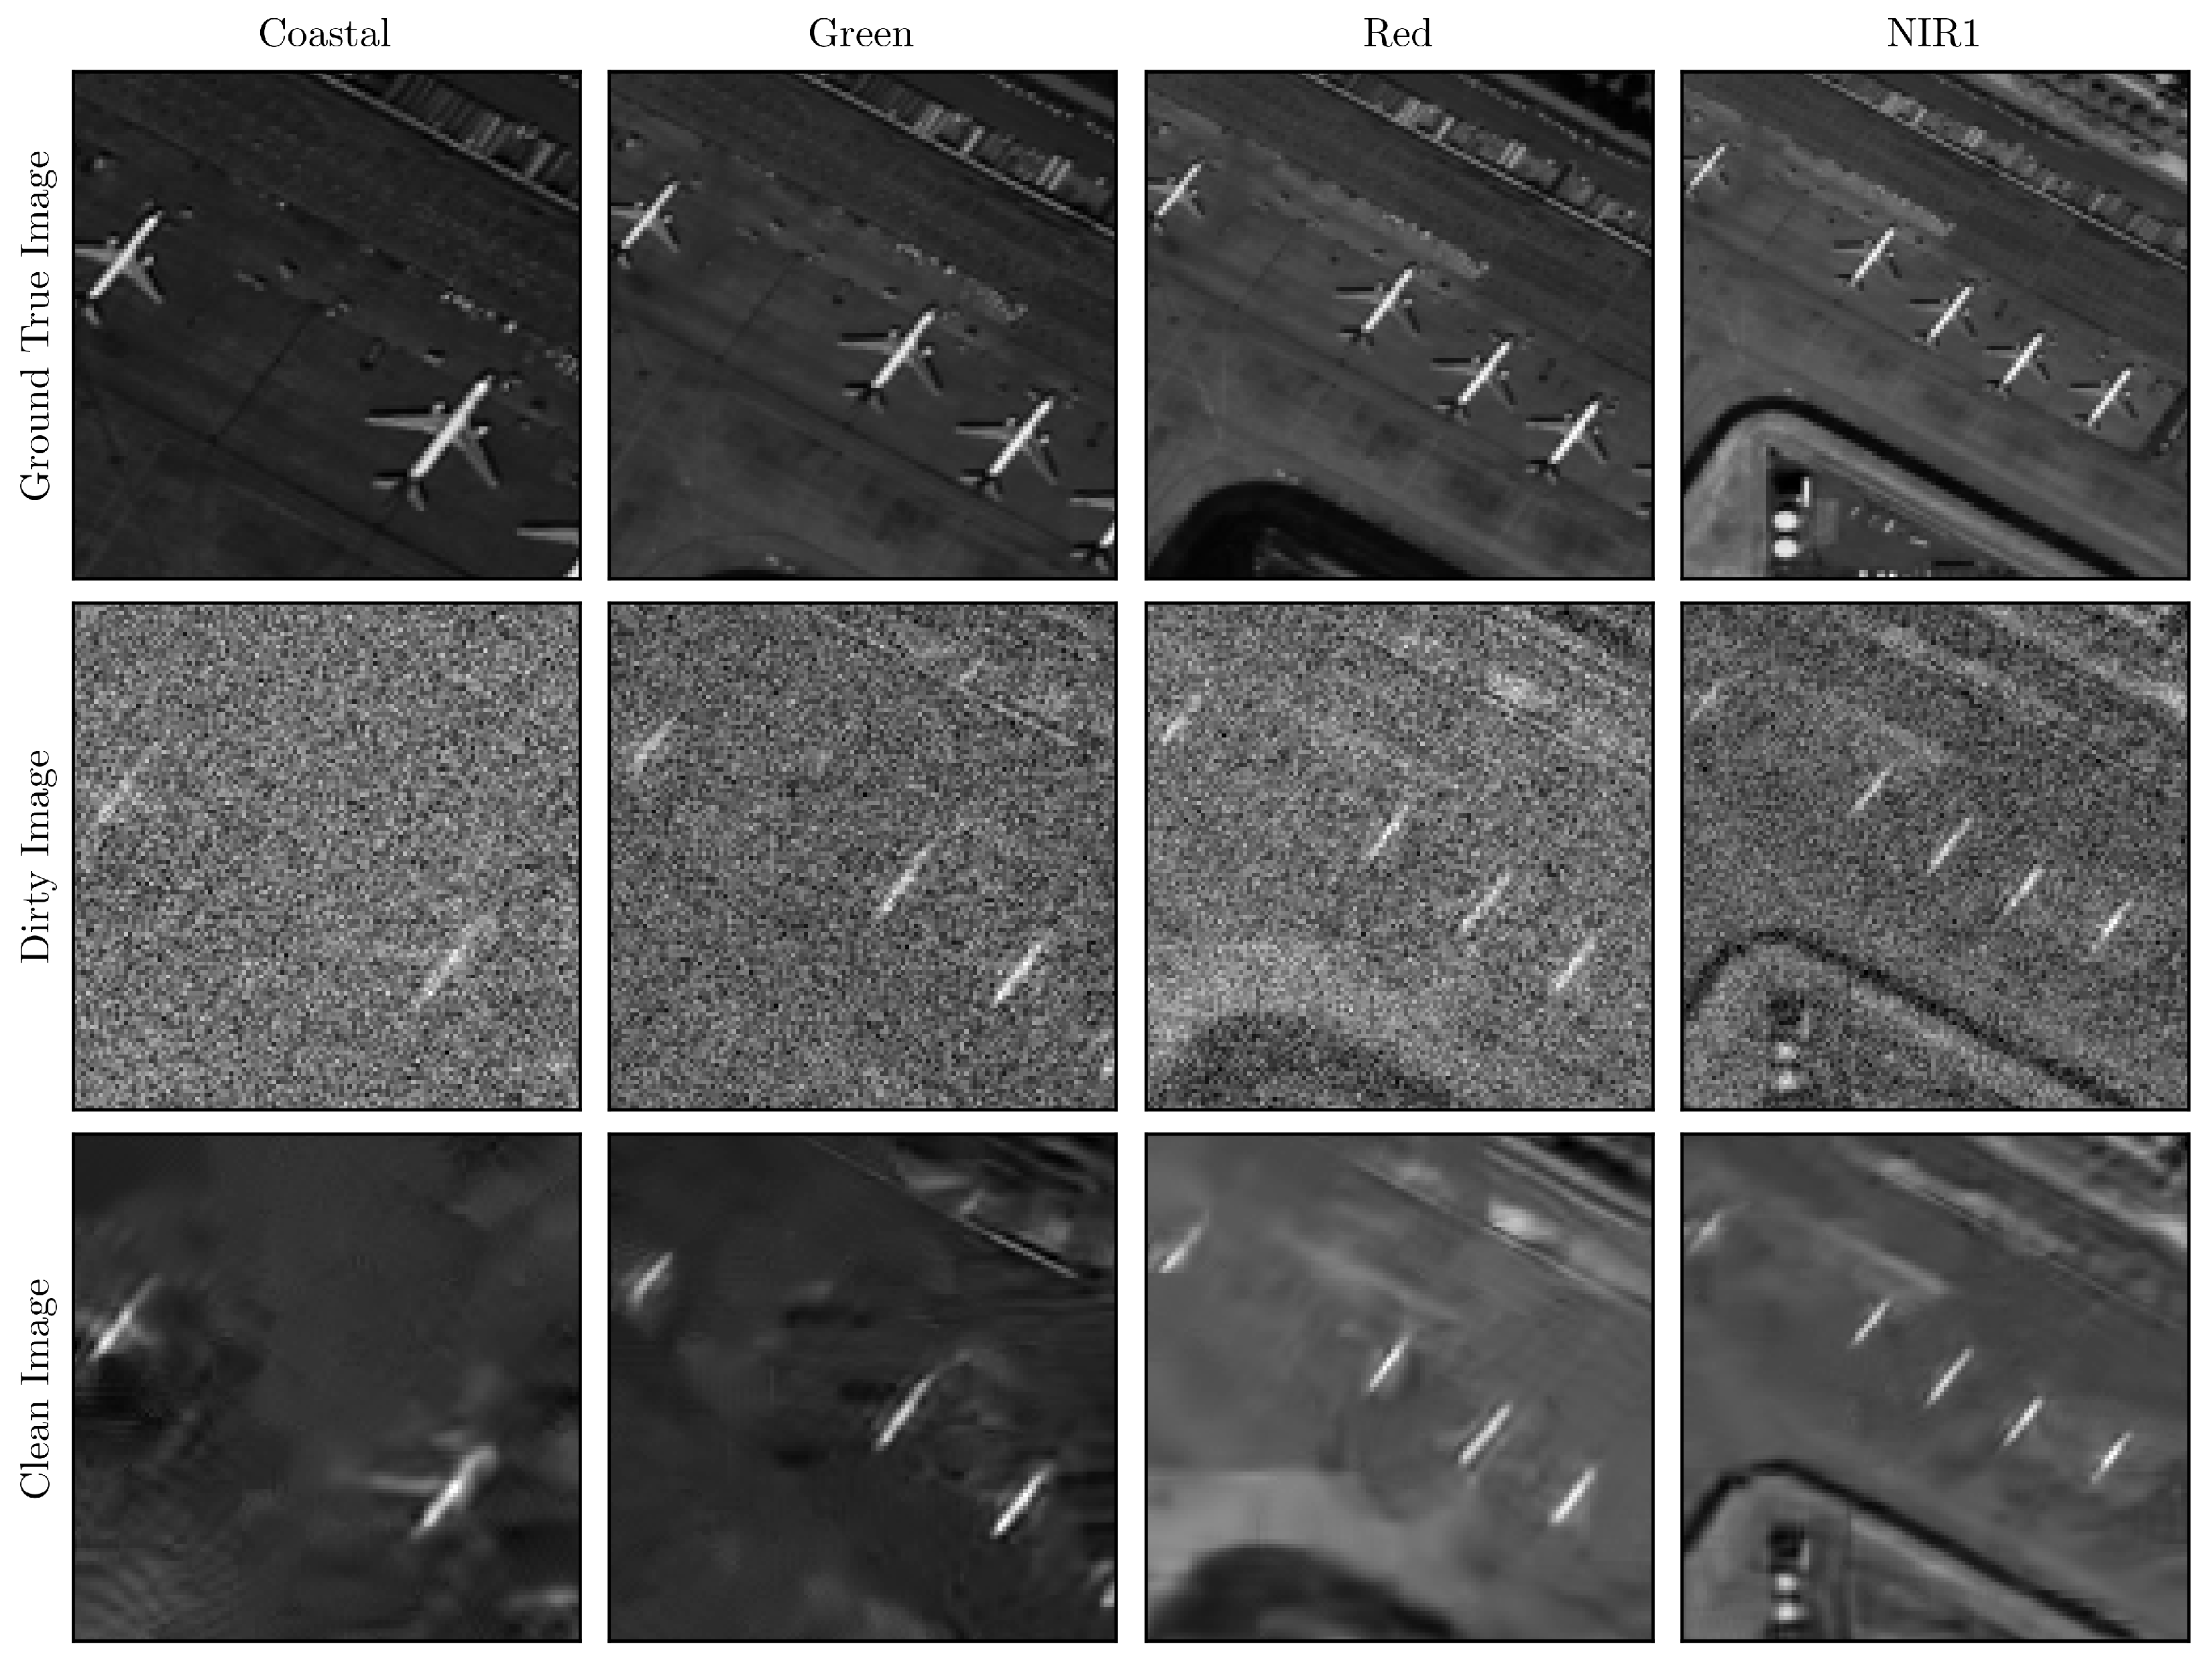
Figure 10 demonstrates the imaging results for four spectral bands at an integration time of . The visualization includes: First row: Ground truth reference images; Second row: “dirty images” reconstructed through inverse Fourier transform; Third row: BM3D-denoised “clean images” [61]. The results clearly indicate substantial image degradation due to noise at this integration time setting.
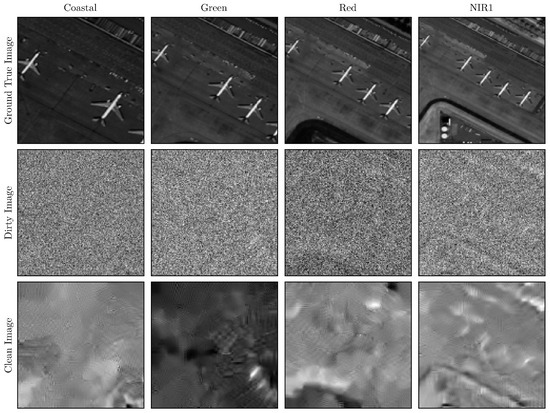
Figure 10.
Simulated multispectral imaging (4 bands) at . Row 1: Input Images | Row 2: Dirty Images (Inverse FT) | Row 3: Clean Images (BM3D).
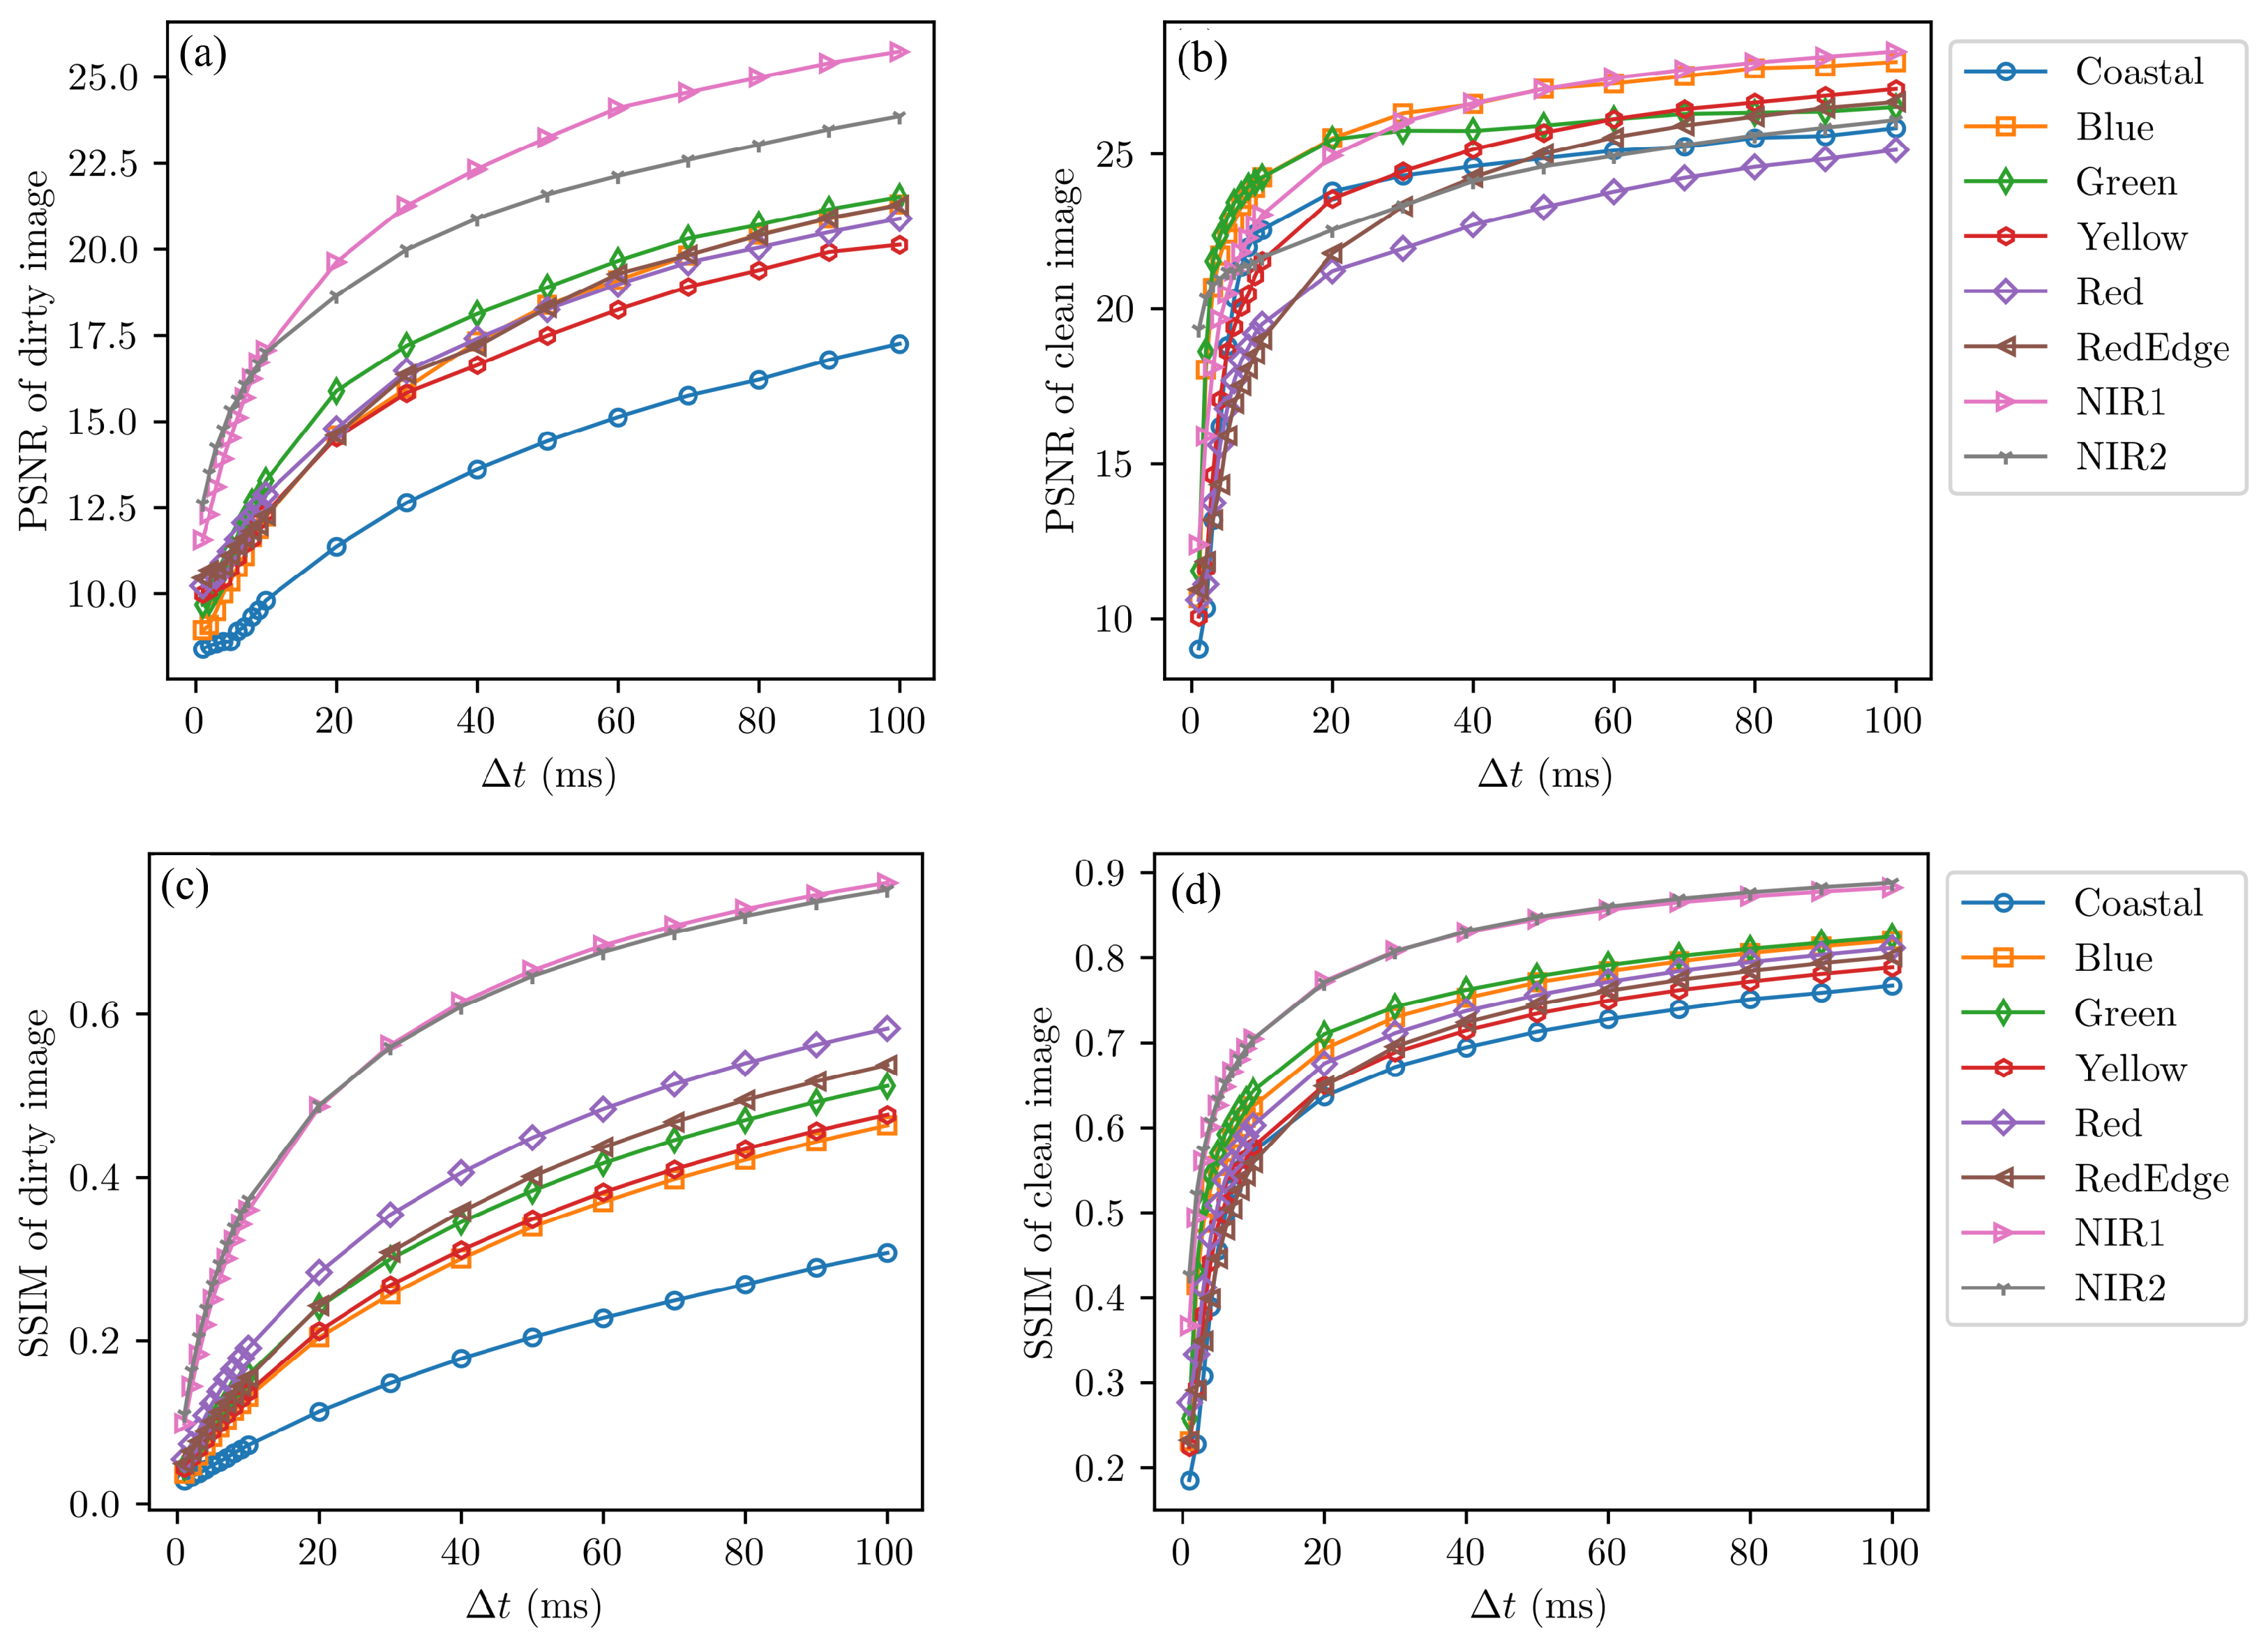
When the integration time is increased to 10 ms, the results presented in Figure 11 demonstrate significantly improved image quality. Figure 12a,b displays the Peak Signal-to-Noise Ratio (PSNR) metrics for both “dirty images” and “clean images” across eight spectral bands at varying integration times. The data reveal that, while image quality improves substantially with increasing integration time, the enhancement becomes progressively less pronounced beyond a certain threshold, eventually converging to approximately 25 dB. Figure 12c,d present the Structural Similarity Index Measure (SSIM) values for reconstructed images under identical conditions. The SSIM metrics exhibit a trend consistent with the PSNR curves, with values stabilizing around 0.8 as the integration time increases.
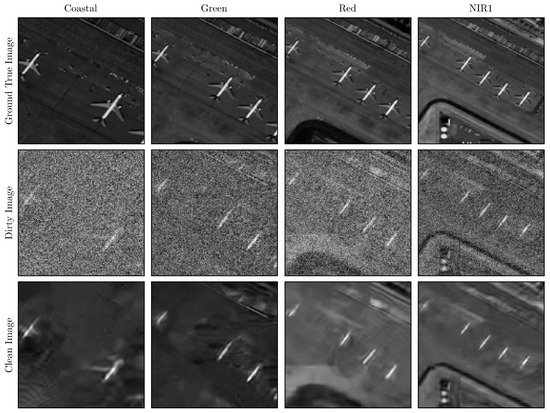
Figure 11.
Simulated multispectral imaging (4 bands) at . Row 1: Input Images | Row 2: Dirty Images (Inverse FT) | Row 3: Clean Images (BM3D).
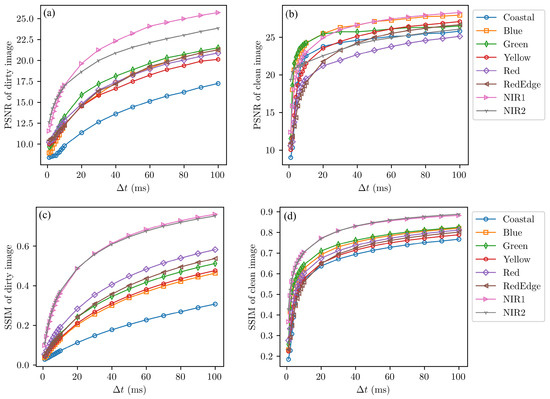
Figure 12.
PSNR and SSIM of reconstructed images under different wavelength bands and integration time conditions. (a) PSNR of dirty image; (b) PSNR of clean image; (c) SSIM of dirty image; (d) SSIM of clean image.
This trend suggests that visibility measurement errors due to intensity noise diminish, while phase noise introduced by turbulence becomes dominant. These findings corroborate our previous analysis.
4. Discussion
For ground-based interferometric imaging systems, the atmospheric Fried parameter in the visible spectrum is typically less than 10 cm [62], implying that phase measurements become fundamentally inaccurate for baselines exceeding 10 cm. However, as demonstrated in Section 3.1.2, space-based remote sensing interferometric systems exhibit meter-scale values, significantly larger than their ground-based counterparts. At orbital altitudes above 100 km in the visible near-infrared bands, the turbulence-limited maximum baseline exceeds 20 cm, enabling photonic integrated interferometric imaging systems to achieve high-resolution imaging without active turbulence suppression.
Equation (23) indicates an inverse relationship between and orbital altitude H, suggesting theoretically that increases with altitude. However, this potential gain is counterbalanced by the corresponding degradation in ground resolution at higher orbits, ultimately leading to convergence toward a stable resolution limit. Since while ground resolution scales inversely with , the turbulence-limited maximum achievable ground resolution remains essentially constant across spectral bands.
The visibility error analysis demonstrates that sub-aperture signal strength determines the minimum detectable fringe visibility . While increasing integration time enhances signal strength and improves visibility amplitude measurement accuracy—simultaneously reducing phase errors from intensity noise—the benefits are ultimately constrained by turbulence-induced and environmental phase noise dominating at longer integration times. This establishes turbulence phase noise as the fundamental limit for phase measurement precision.
These analyses collectively demonstrate that atmospheric turbulence imposes fundamental performance limitations on photonic integrated interferometric imaging for remote sensing applications. However, imaging simulations confirm that the interferometric imaging system can achieve performance comparable to state-of-the-art systems like WorldView-3 when operating within turbulence-constrained baselines, using practical integration times, and employing appropriate reconstruction algorithms. Indeed, the core design principle of photonic integrated interferometric imaging is to maintain traditional imaging resolution while drastically reducing system size, weight, and power consumption [12]. Thus, when extreme resolution (requiring longer baselines) is not essential, this approach presents a viable, low-cost alternative for space-based remote sensing.
5. Conclusions
Similar to traditional single-aperture systems, the SNR critically affects interferometric imaging performance. However, the intensity noise impacts fringe visibility measurements differently due to fundamental methodological differences. We analyze the signal transmission process in photonic integrated interferometric imaging systems for remote sensing applications, and establish quantitative relationships between visibility measurement errors and intensity noise based on balanced four-quadrature detection and error propagation theory.
Using WorldView-3 parameters with radiative transfer and turbulence models, we evaluate measurement impacts. The preliminary analysis results show that, in remote sensing applications, the system operates in the photon-noise-limited regime, and the visibility threshold is approximately inversely proportional to the reciprocal of the SNR of sub-aperture received signal. When the integration time is extended to 100 ms, reaches approximately . Benchmarked simulations demonstrate that imaging quality improves with integration time until turbulence noise dominates, with specific PSNR and SSIM values reaching approximately 25 dB and 0.8, respectively. Both signal-to-noise ratio and imaging analysis indicate that, as intensity noise decreases, atmospheric turbulence constitutes the upper limit of system performance; therefore, further resolution gains require turbulence mitigation techniques. We believe that the analysis and research work presented in this paper can provide a practical reference for the design and optimization of future space-based photon-integrated interferometric imaging systems for Earth observation.
While this study primarily examines the influence of sub-aperture intensity noise and turbulence-induced phase noise on visibility measurement errors, it should be noted that practical operational environments introduce additional challenges—including satellite platform vibrations and temperature variations—which constitute potential error sources not considered here, and while the HV-5/7 model employed in this study provides a foundational analysis, its applicability may be limited under extreme conditions, particularly given that our analysis does not account for the temporal characteristics of atmospheric turbulence, which is inherently dynamic, nor does it address noise sources introduced by photonic integrated circuit (PIC) chips themselves due to the current lack of performance data in space environments.
To enable further in-depth research, future work will address these limitations through comprehensive system analysis and experimental validation of photonic integrated interferometry for remote sensing applications, including the development of time-resolved turbulence models, characterization of environmental perturbation effects, and performance analysis of PIC.
Author Contributions
Conceptualization, C.Z. and Q.Y.; methodology, C.Z.; software, C.Z; validation, C.Z.; formal analysis, C.Z.; investigation, C.Z.; resources, Q.Y.; data curation, C.Z. and Q.Y.; writing—original draft preparation, C.Z; writing—review and editing, C.Z., Q.Y. and Y.H.; visualization, C.Z., Q.Y. and Y.H.; supervision, Q.Y.; project administration, Q.Y.; funding acquisition, Q.Y. All authors have read and agreed to the published version of the manuscript.
Funding
This study was funded by National Natural Science Foundation of China under Grant 62475274.
Data Availability Statement
The data presented in this study are available upon request from the corresponding author.
Conflicts of Interest
The authors declare no conflicts of interest.
Abbreviations
The following abbreviations are used in this manuscript:
| WV-110 | WorldView3 110 camera |
| PIC | Photonic Integrated Circuit |
| PIIIS | Photonic Integrated Interferometric Imaging System |
| SPIDER | Segmented Planar Imaging Detector for EO Reconnaissance |
| RSR | Relative Spectral Response |
| OPD | Optical Path Difference |
References
- Kendrick, S.E.; Stahl, H.P. Large Aperture Space Telescope Mirror Fabrication Trades. Proc. SPIE 2008, 7010, 70102G. [Google Scholar] [CrossRef]
- Goodman, J. Statistical Optics; Wiley Series in Pure and Applied Optics; Wiley: Hoboken, NJ, USA, 2015. [Google Scholar]
- Michelson, A.A.; Pease, F.G. Measurement of the Diameter of Alpha-Orionis by the Interferometer. Proc. Natl. Acad. Sci. USA 1921, 7, 143–146. [Google Scholar] [CrossRef] [PubMed]
- Hill, J.M. The large binocular telescope. Appl. Opt. 2010, 49, D115–D122. [Google Scholar] [CrossRef] [PubMed]
- Glindemann, A.; Abuter, R.; Carbognani, F.; Delplancke, F.; Derie, F.; Gennai, A.; Gitton, P.B.; Kervella, P.; Koehler, B.; Leveque, S.A.; et al. The VLT Interferometer: A unique instrument for high-resolution astronomy. Proc. SPIE 2000, 4006, 2–12. [Google Scholar]
- Pannetier, C.; Mourard, D.; Bério, P.; Cassaing, F.; Allouche, F.; Anugu, N.; Bailet, C.; ten Brummelaar, T.; Dejonghe, J.; Gies, D.; et al. Progress of the CHARA/SPICA project. Proc. SPIE 2020, 11446, 192–206. [Google Scholar]
- Coudé du Foresto, V.; Ridgway, S. Fluor—A stellar interferometer using single-mode fibers. In Proceedings of the ESO Conference on High-Resolution Imaging by Interferometry II, Munich, Germany, 15–18 October 1991; p. 731. [Google Scholar]
- Kervella, P.; Coude du Foresto, V.; Glindemann, A.; Hofmann, R. VINCI: The VLT Interferometer commissioning instrument. Proc. SPIE 2000, 4006, 31–42. [Google Scholar] [CrossRef]
- Perrin, G.; Jocou, L.; Perraut, K.; Berger, J.P.; Dembet, R.; Fédou, P.; Lacour, S.; Chapron, F.; Collin, C.; Poulain, S.; et al. Single-Mode Waveguides for GRAVITY. II. Single-mode Fibers and Fiber Control Unit. Astron. Astrophys. 2024, 681, A26. [Google Scholar] [CrossRef]
- Mourard, D.; Berio, P.; Pannetier, C.; Nardetto, N.; Allouche, F.; Bailet, C.; Dejonghe, J.; Geneslay, P.; Jacqmart, E.; Lagarde, S.; et al. CHARA/SPICA: A six-telescope visible instrument for the CHARA Array. Proc. SPIE 2022, 12183, 59–71. [Google Scholar]
- Gillessen, S.; Eisenhauer, F.; Perrin, G.; Brandner, W.; Straubmeier, C.; Perraut, K.; Amorim, A.; Schöller, M.; Araujo-Hauck, C.; Bartko, H.; et al. GRAVITY: A four telescope beam combiner instrument for the VLTI. Proc. SPIE 2010, 7734, 318–337. [Google Scholar]
- Kendrick, R.; Duncan, A.; Wilm, J.; Thurman, S.T.; Stubbs, D.M.; Ogden, C. Flat Panel Space Based Space Surveillance Sensor. In Proceedings of the Advanced Maui Optical & Space Surveillance Technologies Conference, Maui, HI, USA, 10–13 September 2013. [Google Scholar]
- Duncan, A.; Kendrick, R.; Thurman, S.; Wuchenich, D.; Scott, R.P.; Yoo, S.J.B.; Su, T.; Yu, R.; Ogden, C.; Proiett, R. SPIDER: Next Generation Chip Scale Imaging Sensor. In Proceedings of the Advanced Maui Optical & Space Surveillance Technologies Conference, Maui, HI, USA, 15–18 September 2015. [Google Scholar]
- Duncan, A.L.; Kendrick, R.L.; Ogden, C.E.; Wuchenich, D.M.R.; Thurman, S.T.; Su, T.; Lai, W.; Chun, J.; Li, S.; Liu, G.; et al. SPIDER: Next Generation Chip Scale Imaging Sensor Update. In Proceedings of the Advanced Maui Optical and Space Surveillance Technologies Conference, Maui, HI, USA, 20–23 September 2016. [Google Scholar]
- Badham, K.; Kendrick, R.L.; Wuchenich, D.; Ogden, C.; Chriqui, G.; Duncan, A.; Thurman, S.T.; Yoo, S.J.B.; Su, T.; Lai, W.; et al. Photonic Integrated Circuit-Based Imaging System for SPIDER. In Proceedings of the 2017 Conference on Lasers and Electro-Optics Pacific Rim (CLEO-PR), Singapore, 31 July–4 August 2017; pp. 1–5. [Google Scholar] [CrossRef]
- Badham, K.; Duncan, A.; Kendrick, R.L.; Wuchenich, D.; Ogden, C.; Chriqui, G.; Thurman, S.T.; Su, T.; Lai, W.; Chun, J. Testbed Experiment for SPIDER: A Photonic Integrated Circuit-Based Interferometric Imaging System. In Proceedings of the Advanced Maui Optical and Space Surveillance (AMOS) Technologies Conference, Maui, HI, USA, 19–22 September 2017; p. 58. [Google Scholar]
- Chen, H.; Fu, M.; Shing, L.; Vasudevan, G.; Kowalczyk, T.; Hurlburt, N.; Yoo, S.J.B. Silicon Photonic Integrated Circuits for Heterodyne Interferometric Imaging of Incoherent Light Source. In Proceedings of the 2024 Conference on Lasers and Electro-Optics (CLEO), Charlotte, NC, USA, 5–10 May 2024; pp. 1–2. [Google Scholar]
- Mugnier, L.; Michau, V.; Debary, H.; Cassaing, F. Analysis of a Compact Interferometric Imager. Proc. SPIE 2022, 12180, 121803. [Google Scholar]
- Su, T.; Scott, R.P.; Ogden, C.; Thurman, S.T.; Kendrick, R.L.; Duncan, A.; Yu, R.; Yoo, S.J.B. Experimental Demonstration of Interferometric Imaging Using Photonic Integrated Circuits. Opt. Express 2017, 25, 12653–12665. [Google Scholar] [CrossRef] [PubMed]
- Su, T.H.; Liu, G.Y.; Badham, K.E.; Thurman, S.T.; Kendrick, R.L.; Duncan, A.; Wuchenich, D.; Ogden, C.; Chriqui, G.; Feng, S.Q.; et al. Interferometric Imaging Using Si3N4 Photonic Integrated Circuits for a SPIDER Imager. Opt. Express 2018, 26, 12801–12812. [Google Scholar] [CrossRef]
- Zhang, Y.; Ravichandran, R.; Zhang, Y.; Yoo, S.J.B. Large Scale Si3N4 Integrated Circuit for High-resolution Interferometric Imaging. In Proceedings of the 2023 Conference on Lasers and Electro-Optics (CLEO), San Jose, CA, USA, 7–12 May 2023; pp. 1–2. [Google Scholar]
- Liu, G.; Wen, D.S.; Song, Z.X. System Design of an Optical Interferometer Based on Compressive Sensing. Mon. Not. R. Astron. Soc. 2018, 478, 2065–2073. [Google Scholar] [CrossRef]
- Liu, G.; Wen, D.; Fan, W.; Song, Z.; Sun, Z. Fully Connected Aperture Array Design of the Segmented Planar Imaging System. Opt. Lett. 2022, 47, 4596–4599. [Google Scholar] [CrossRef]
- Pan, X.; Yang, Z.; Jia, R.; Ren, G.; Peng, Q. Photonic Integrated Interference Imaging System Based on Front-End S-shaped Microlens Array and Con-DDPM. Opt. Express 2024, 32, 29112–29124. [Google Scholar] [CrossRef] [PubMed]
- Pan, X.; Yang, Z.; Jia, R.; Zhao, J.; Wang, H.; Ren, G.; Peng, Q. Research on Improving the Performance of Photonic Integrated Interference Imaging Systems Using Wave-Shaped Microlens Array. Opt. Laser Technol. 2025, 185, 112614. [Google Scholar] [CrossRef]
- Wang, Z.; Cai, X.; Jiang, P.; Shi, G.; He, J.; Gao, D.; Sun, Y.; Liao, J.; Jin, L.; Feng, J. Research on Optical Interferometric Imaging with Flexible Control Using Optical Fibers and PIC Chip. Opt. Express 2024, 32, 31311–31324. [Google Scholar] [CrossRef]
- Yao, M.; Cui, H.; Wang, S.; Wei, K. System Design of Segmented Planar Imaging System. Opt. Eng. 2023, 62, 034111. [Google Scholar] [CrossRef]
- Liu, G.; Wen, D.; Fan, W.; Song, Z.; Li, B.; Jiang, T. Single Photonic Integrated Circuit Imaging System with a 2D Lens Array Arrangement. Opt. Express 2022, 30, 4905–4918. [Google Scholar] [CrossRef]
- Chu, Q.; Shen, Y.; Yuan, M.; Gong, M. Numerical Simulation and Optimal Design of Segmented Planar Imaging Detector for Electro-Optical Reconnaissance. Opt. Commun. 2017, 405, 288–296. [Google Scholar] [CrossRef]
- Yu, Q.; Ge, B.; Li, Y.; Yue, Y.; Sun, S. System Design for a “Checkerboard” Imager. Appl. Opt. 2018, 57, 10218. [Google Scholar] [CrossRef]
- Ding, C.; Zhang, X.; Liu, X.; Meng, H.; Xu, M. Structure Design and Image Reconstruction of Hexagonal-Array Photonics Integrated Interference Imaging System. IEEE Access 2020, 8, 139396–139403. [Google Scholar] [CrossRef]
- Zhao, Z.; Yuan, Y.; Zhang, C.; Wang, X.; Gao, W. Imaging Quality Characterization and Optimization of Segmented Planar Imaging System Based on Honeycomb Dense Azimuth Sampling Lens Array. Opt. Express 2023, 31, 35670–35684. [Google Scholar] [CrossRef]
- Gao, W.P.; Wang, X.R.; Ma, L.; Yuan, Y.; Guo, D.F. Quantitative Analysis of Segmented Planar Imaging Quality Based on Hierarchical Multistage Sampling Lens Array. Opt. Express 2019, 27, 7955–7967. [Google Scholar] [CrossRef] [PubMed]
- Gao, W.; Wang, X.; He, Y.; Zang, J.; Li, P.; Wang, F. Research on the Quality Improvement of the Segmented Interferometric Array Integrated Optical Imaging Based on Hierarchical Non-Uniform Sampling Lens Array. Symmetry 2025, 17, 336. [Google Scholar] [CrossRef]
- Debary, H.; Mugnier, L.M.; Michau, V. Aperture Configuration Optimization for Extended Scene Observation by an Interferometric Telescope. Opt. Lett. 2022, 47, 4056–4059. [Google Scholar] [CrossRef]
- Song, X.; Zuo, Y.; Zeng, T.; Si, B.; Hong, X.; Wu, J. Structural Design of an Improved SPIDER Optical System Based on a Multimode Interference Coupler. Opt. Express 2023, 31, 33704–33718. [Google Scholar] [CrossRef]
- Liu, G.; Wen, D.; Song, Z.; Li, Z.; Zhang, W.; Wei, X. Optimized Design of an Emerging Optical Imager Using Compressive Sensing. Opt. Laser Technol. 2019, 110, 158–164. [Google Scholar] [CrossRef]
- Liu, G.; Wen, D.; Song, Z.; Jiang, T. System Design of an Optical Interferometer Based on Compressive Sensing: An Update. Opt. Express 2020, 28, 19349–19361. [Google Scholar] [CrossRef]
- Yong, J.; Li, K.; Feng, Z.; Wu, Z.; Ye, S.; Song, B.; Wei, R.; Cao, C. Research on Photon-Integrated Interferometric Remote Sensing Image Reconstruction Based on Compressed Sensing. Remote Sens. 2023, 15, 2478. [Google Scholar] [CrossRef]
- Chen, T.; Zeng, X.; Zhang, Z.; Zhang, F.; Bai, Y.; Zhang, X. REM: A Simplified Revised Entropy Image Reconstruction for Photonics Integrated Interference Imaging System. Opt. Commun. 2021, 501, 127341. [Google Scholar] [CrossRef]
- Mars, M.; Betcke, M.M.; McEwen, J.D. Learned Interferometric Imaging for the SPIDER Instrument. RAS Tech. Instrum. 2023, 2, 760–778. [Google Scholar] [CrossRef]
- Sun, Y.; Liu, C.; Ma, H.; Zhang, W. Image Reconstruction Based on Deep Learning for the SPIDER Optical Interferometric System. Curr. Opt. Photonics 2022, 6, 260–269. [Google Scholar]
- Xu, Q.; Chang, W.; Huang, F.; Zhang, W. Image Reconstruction Method for Photonic Integrated Interferometric Imaging Based on Deep Learning. Curr. Opt. Photonics 2024, 8, 391–398. [Google Scholar] [CrossRef]
- Chen, J.; Ge, B.; Yu, Q. Influence of Measurement Errors of the Complex Coherence Factor on Reconstructed Image Quality of Integrated Optical Interferometric Imagers. Opt. Eng. 2022, 61, 105108. [Google Scholar] [CrossRef]
- Deng, X.; Tao, W.; Diao, Y.; Sang, B.; Sha, W. Imaging Analysis of Photonic Integrated Interference Imaging System Based on Compact Sampling Lenslet Array Considering On-Chip Optical Loss. Photonics 2023, 10, 797. [Google Scholar] [CrossRef]
- Ziran, Z.; Guomian, L.; Huajun, F.; Zhihai, X.; Qi, L.; Hao, Z.; Yueting, C. Analysis of Signal Energy and Noise in Photonic Integrated Interferometric Imaging System. Acta Opt. Sin. 2022, 42, 1311001. [Google Scholar]
- Pedretti, E.; Traub, W.A.; Monnier, J.D.; Millan-Gabet, R.; Carleton, N.P.; Schloerb, F.P.; Brewer, M.K.; Berger, J.P.; Lacasse, M.G.; Ragland, S. Robust Determination of Optical Path Difference: Fringe Tracking at the Infrared Optical Telescope Array Interferometer. Appl. Opt. 2005, 44, 5173–5179. [Google Scholar] [CrossRef]
- Lacour, S.; Dembet, R.; Abuter, R.; Fédou, P.; Perrin, G.; Choquet, E.; Pfuhl, O.; Eisenhauer, F.; Woillez, J.; Cassaing, F.; et al. The GRAVITY fringe tracker. Astron. Astrophys. 2019, 624, A99. [Google Scholar] [CrossRef]
- Fried, D.L. Limiting Resolution Looking Down Through the Atmosphere. J. Opt. Soc. Am. 1966, 56, 1380. [Google Scholar] [CrossRef]
- Vermote, E.; Tanre, D.; Deuze, J.; Herman, M.; Morcette, J.J. Second Simulation of the Satellite Signal in the Solar Spectrum, 6S: An Overview. IEEE Trans. Geosci. Remote Sens. 1997, 35, 675–686. [Google Scholar] [CrossRef]
- Wilson, R.T. Py6S: A Python Interface to the 6S Radiative Transfer Model. Comput. Geosci. 2013, 51, 166–171. [Google Scholar] [CrossRef]
- Stotts, L.B.; Andrews, L.C. Improving the Hufnagel-Andrews-Phillips refractive index structure parameter model using turbulent intensity. Opt. Express 2023, 31, 14265–14277. [Google Scholar] [CrossRef] [PubMed]
- Cantrell, S.J.; Christopherson, J.; Anderson, C.; Stensaas, G.L.; Chandra, S.N.R.; Kim, M.; Park, S. System Characterization Report on the WorldView-3 Imager; Technical Report; US Geological Survey: Sioux Falls, SD, USA, 2021. [Google Scholar]
- Born, M.; Wolf, E. Principles of Optics: Electromagnetic Theory of Propagation, Interference and Diffraction of Light; Elsevier: Amsterdam, The Netherlands, 2013. [Google Scholar]
- Guyon, O. Wide field interferometric imaging with single-mode fibers. Astron. Astrophys. 2002, 387, 366–378. [Google Scholar] [CrossRef]
- Levrier, F.; Falgarone, E.; Viallefond, F. Fourier phase analysis in radio-interferometry. Astron. Astrophys. 2006, 456, 205–214. [Google Scholar] [CrossRef]
- Juvells, I.; Vallmitjana, S.; Carnicer, A.; Campos, J. The role of amplitude and phase of the Fourier transform in the digital image processing. Am. J. Phys. 1991, 59, 711–718. [Google Scholar] [CrossRef]
- Singal, A.K. Radio astronomical imaging and phase information. Bull. Astron. Soc. India 2005, 33, 245. [Google Scholar]
- Roddier, F. The Effects of Atmospheric Turbulence in Optical Astronomy; Elsevier: Amsterdam, The Netherlands, 1981. [Google Scholar]
- Shermeyer, J.; Hossler, T.; Van Etten, A.; Hogan, D.; Lewis, R.; Kim, D. RarePlanes Dataset. 2020. Available online: https://paperswithcode.com/dataset/rareplanes (accessed on 9 March 2025).
- Dabov, K.; Foi, A.; Katkovnik, V.; Egiazarian, K. Image denoising by sparse 3-D transform-domain collaborative filtering. IEEE Trans. Image Process. 2007, 16, 2080–2095. [Google Scholar] [CrossRef]
- Irbah, A.; Borgnino, J.; Djafer, D.; Damé, L.; Keckhut, P. Solar Seeing Monitor MISOLFA: A New Method for Estimating Atmospheric Turbulence Parameters. Antike Abendl. 2016, 591, A150. [Google Scholar] [CrossRef]
Disclaimer/Publisher’s Note: The statements, opinions and data contained in all publications are solely those of the individual author(s) and contributor(s) and not of MDPI and/or the editor(s). MDPI and/or the editor(s) disclaim responsibility for any injury to people or property resulting from any ideas, methods, instructions or products referred to in the content. |
© 2025 by the authors. Licensee MDPI, Basel, Switzerland. This article is an open access article distributed under the terms and conditions of the Creative Commons Attribution (CC BY) license (https://creativecommons.org/licenses/by/4.0/).

