
Post-Little Ice Age Equilibrium-Line Altitude and Temperature Changes in the Greater Caucasus Based on Small Glaciers

 ,
,  , ,
, , 
Abstract
:1. Introduction
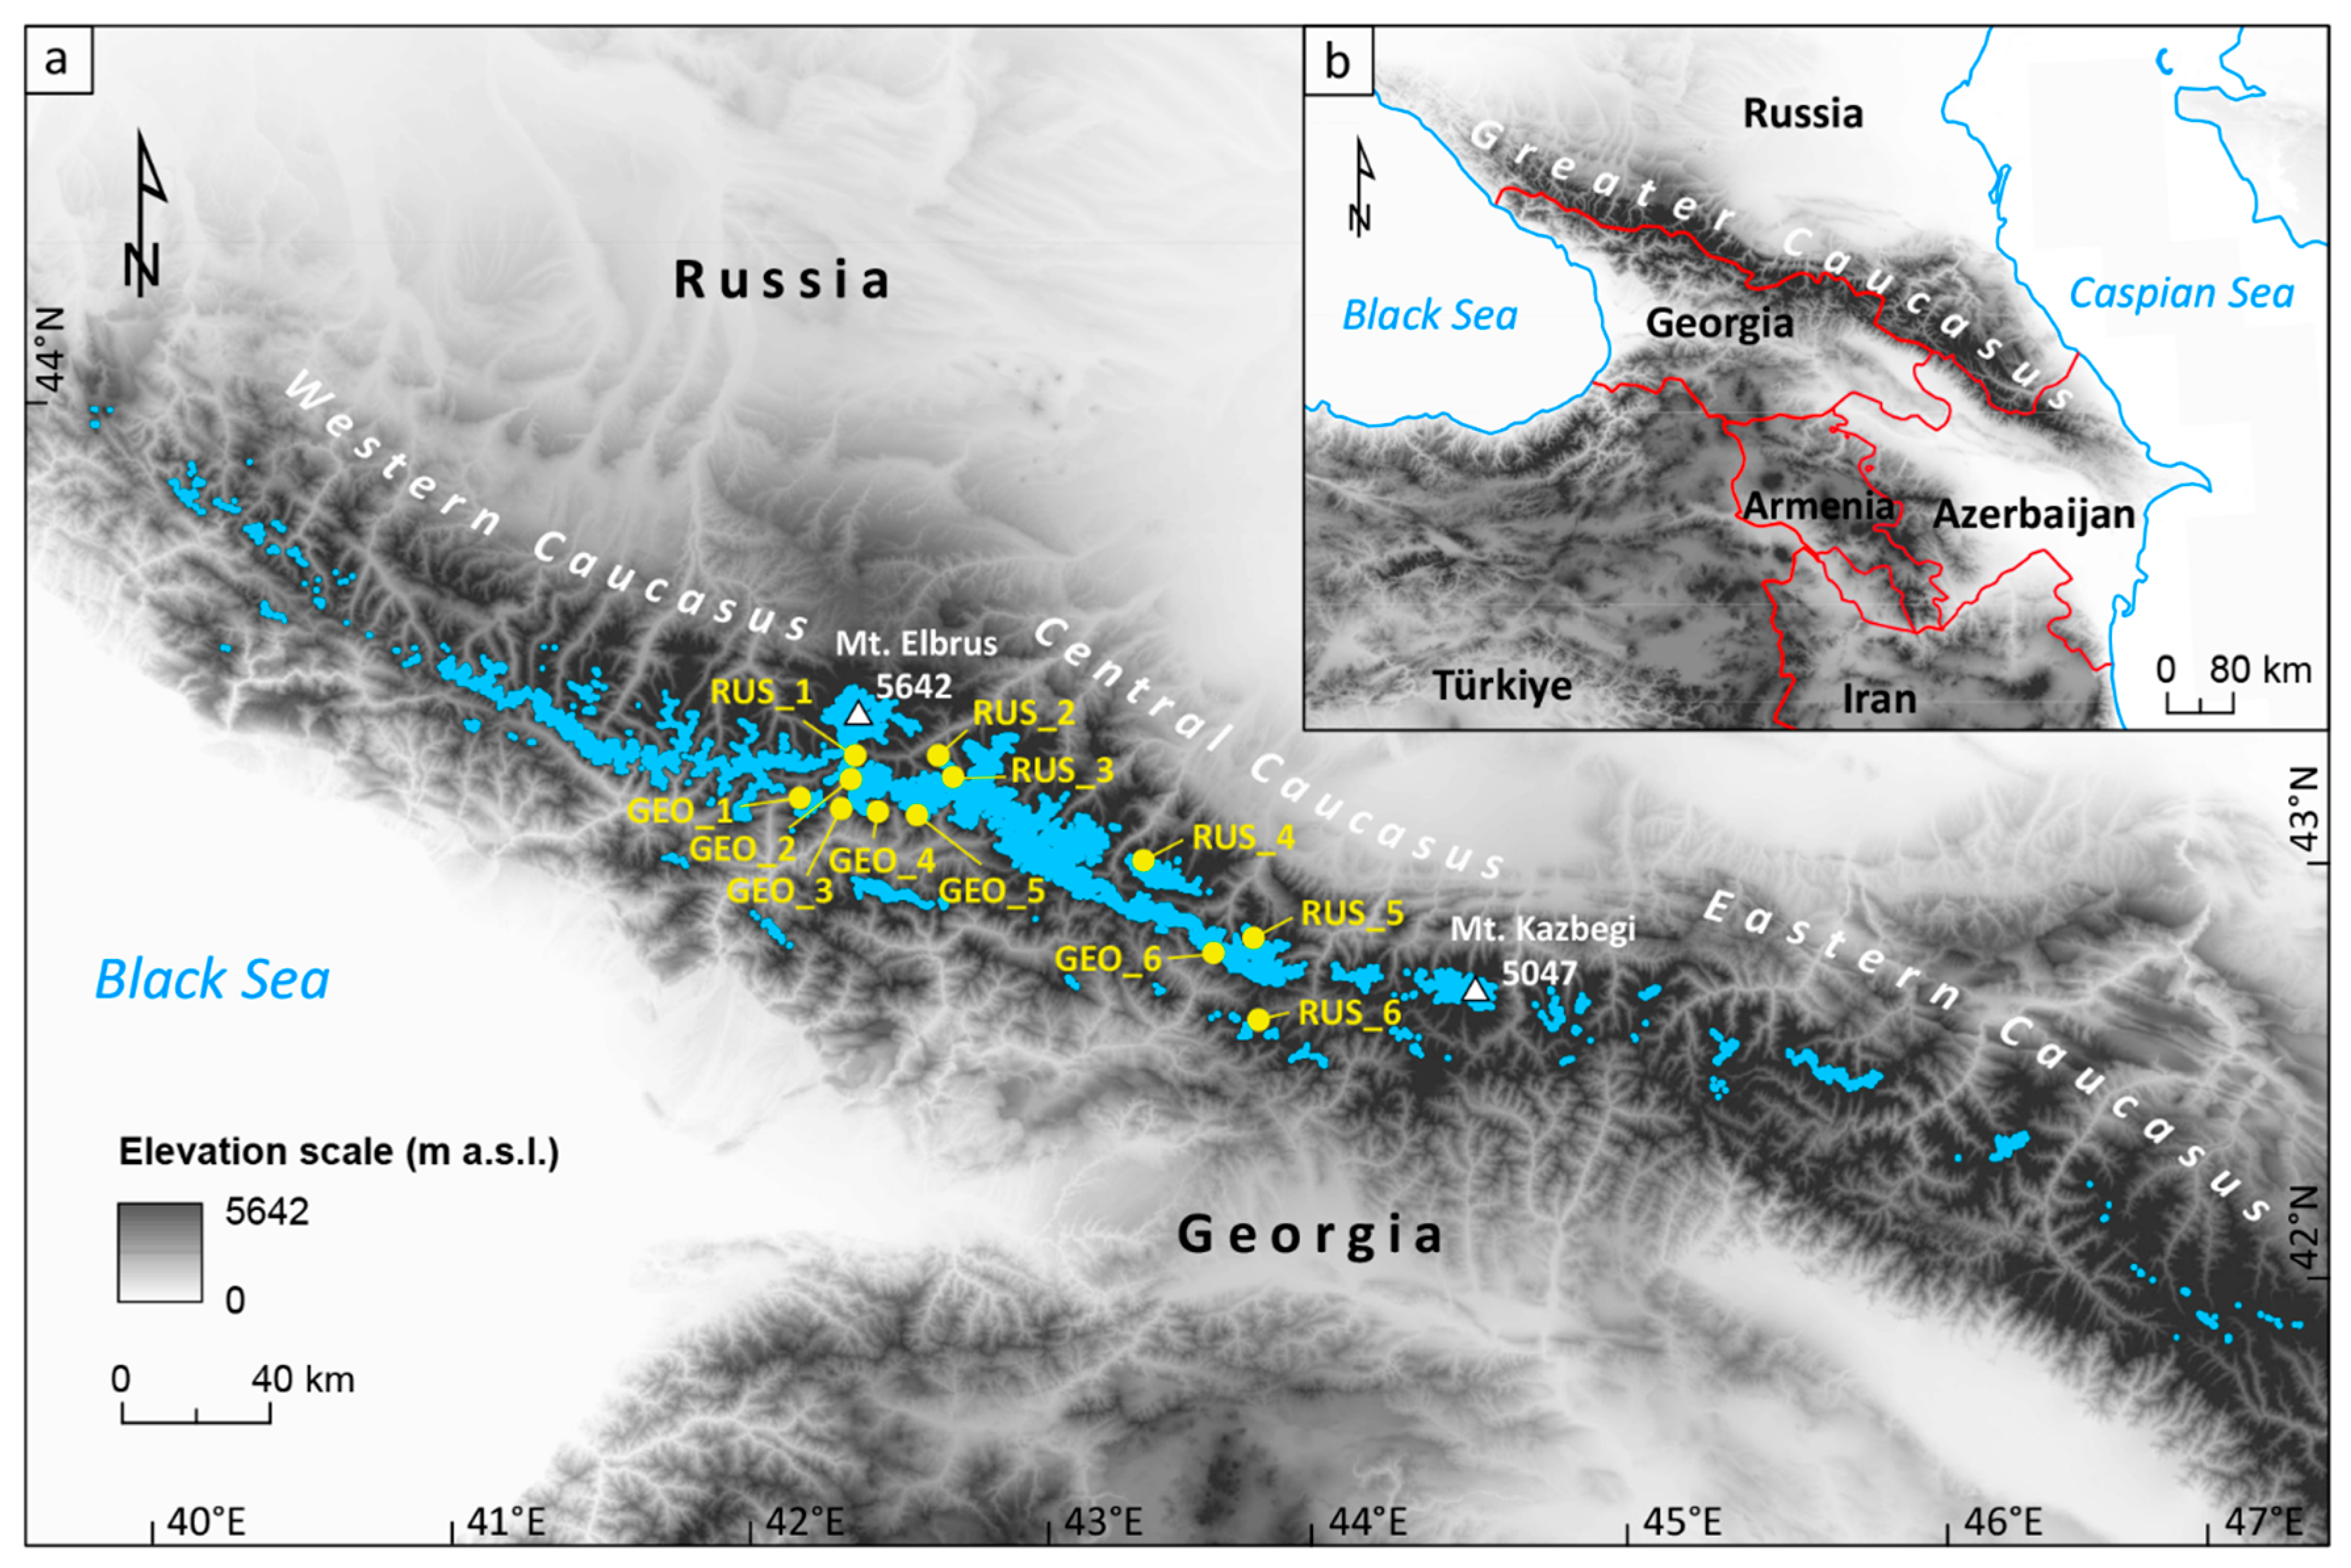
2. Study Area
3. Previous Studies
4. Data and Methods
4.1. Data
4.1.1. Satellite Imagery and Digital Elevation Models
4.1.2. Old Maps
4.2. Methods
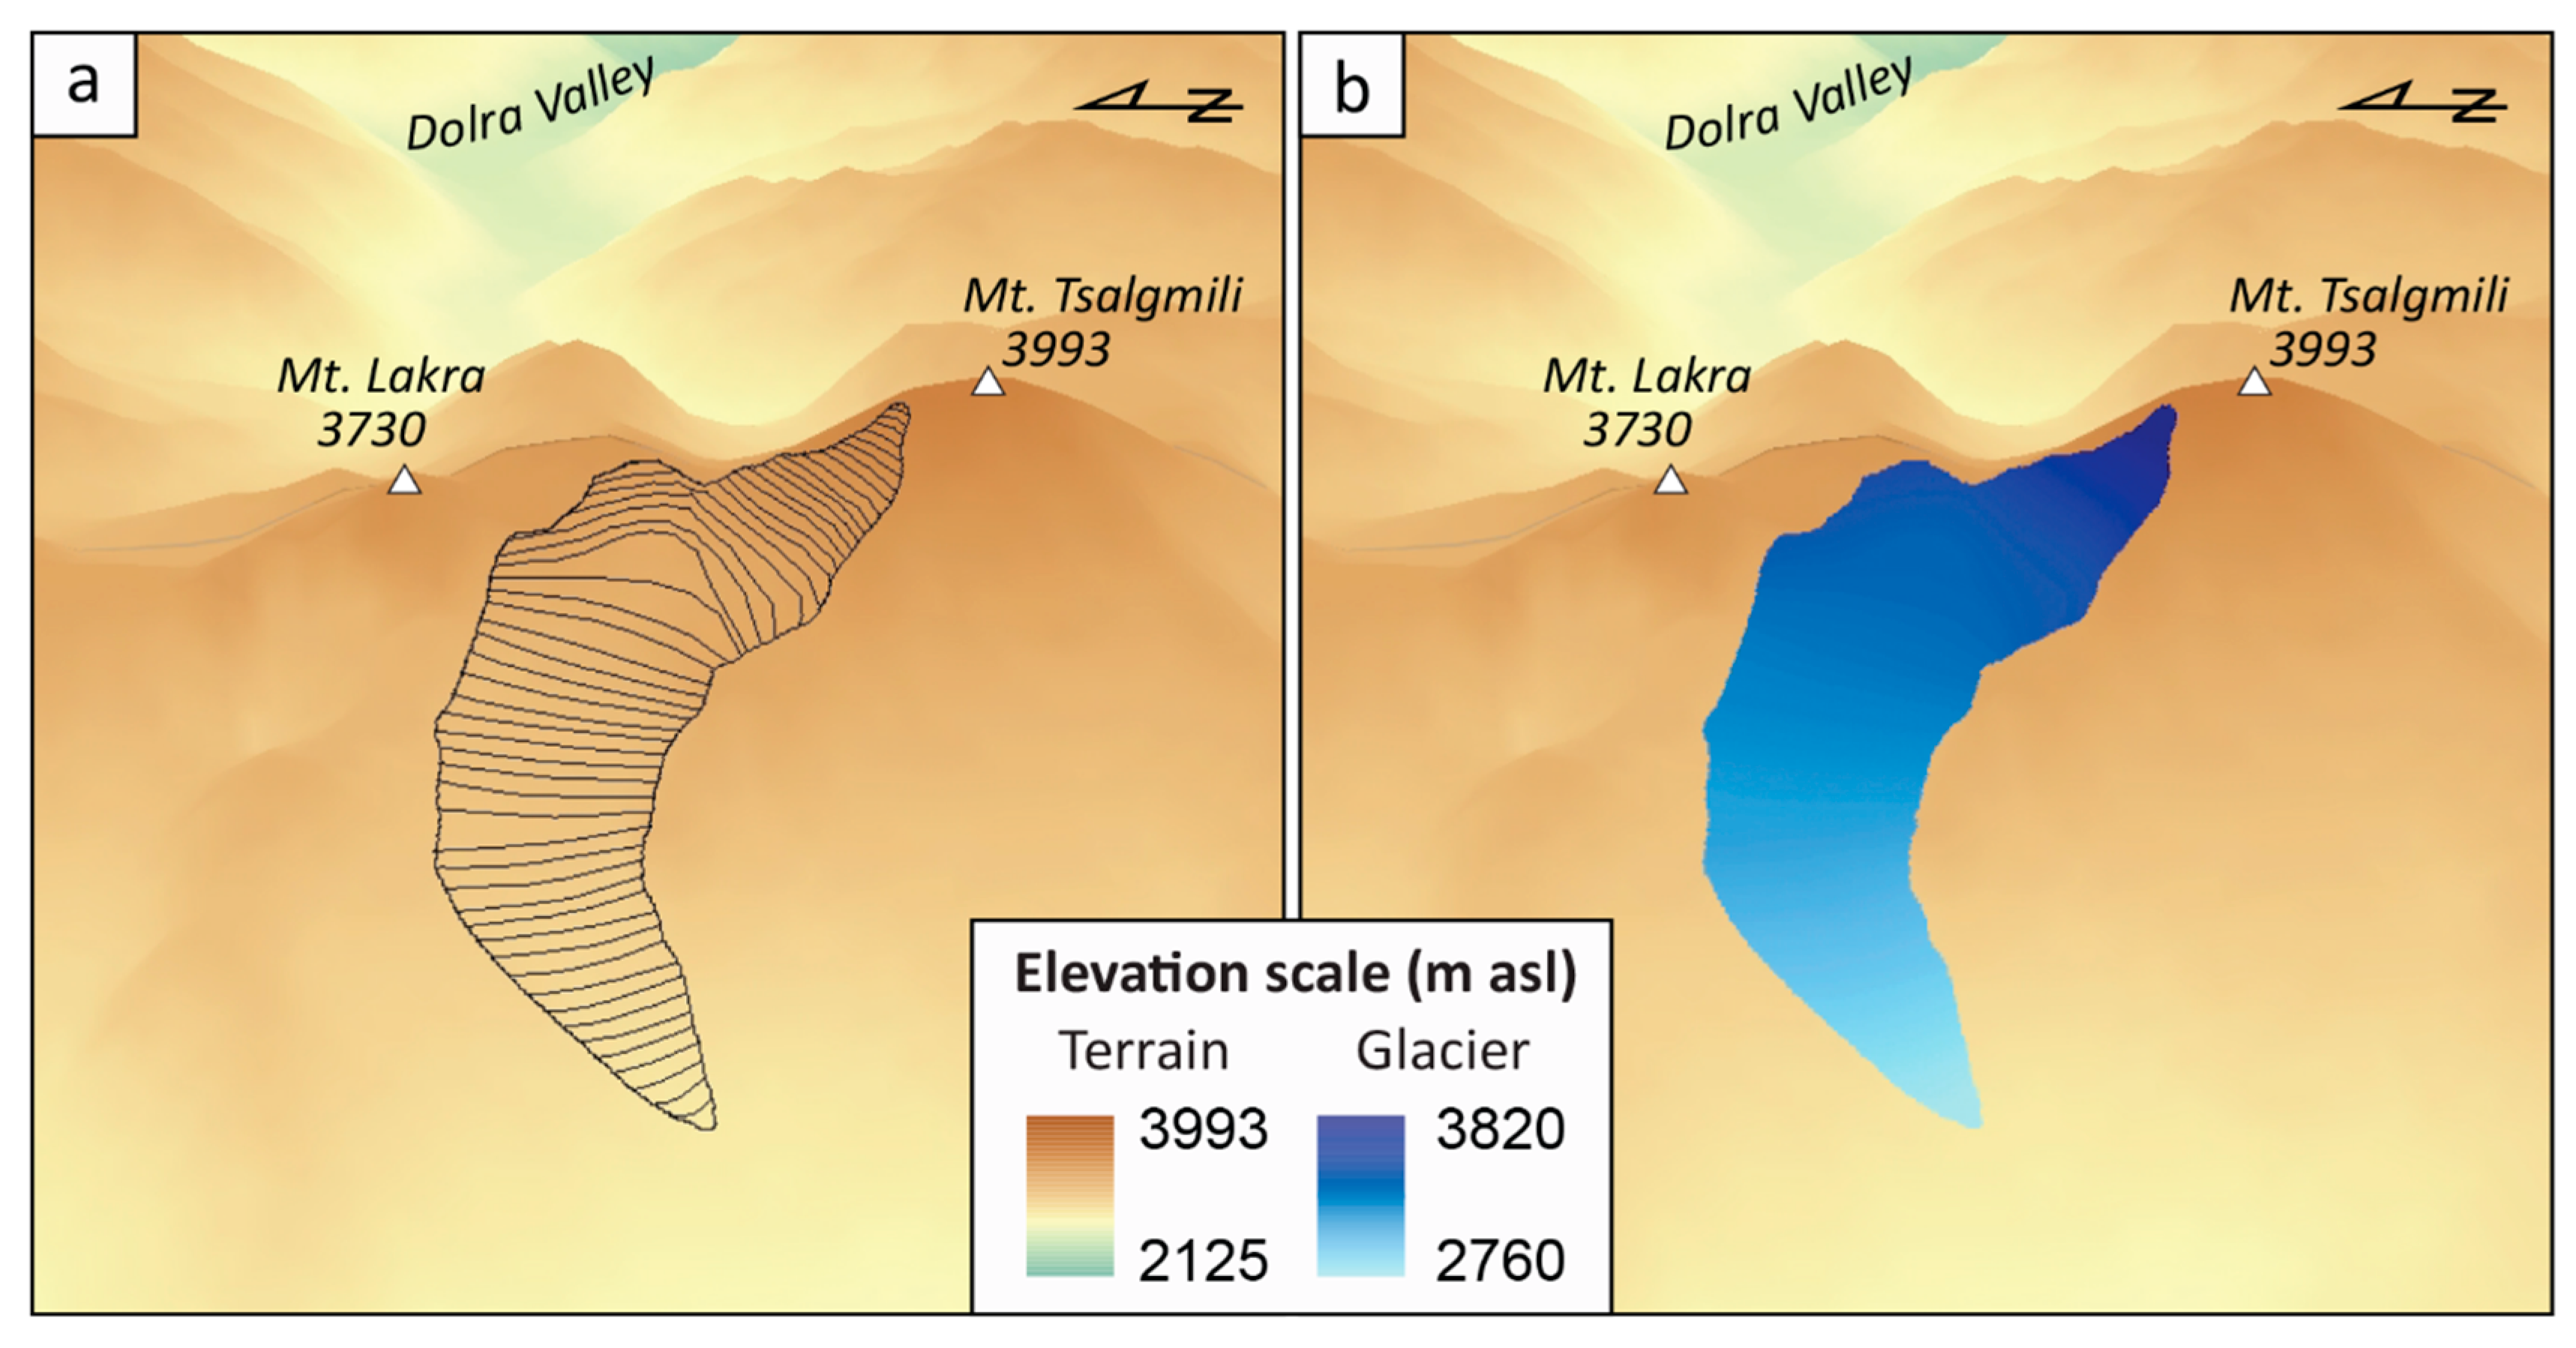
4.2.1. Reconstruction of Glacier Geometry
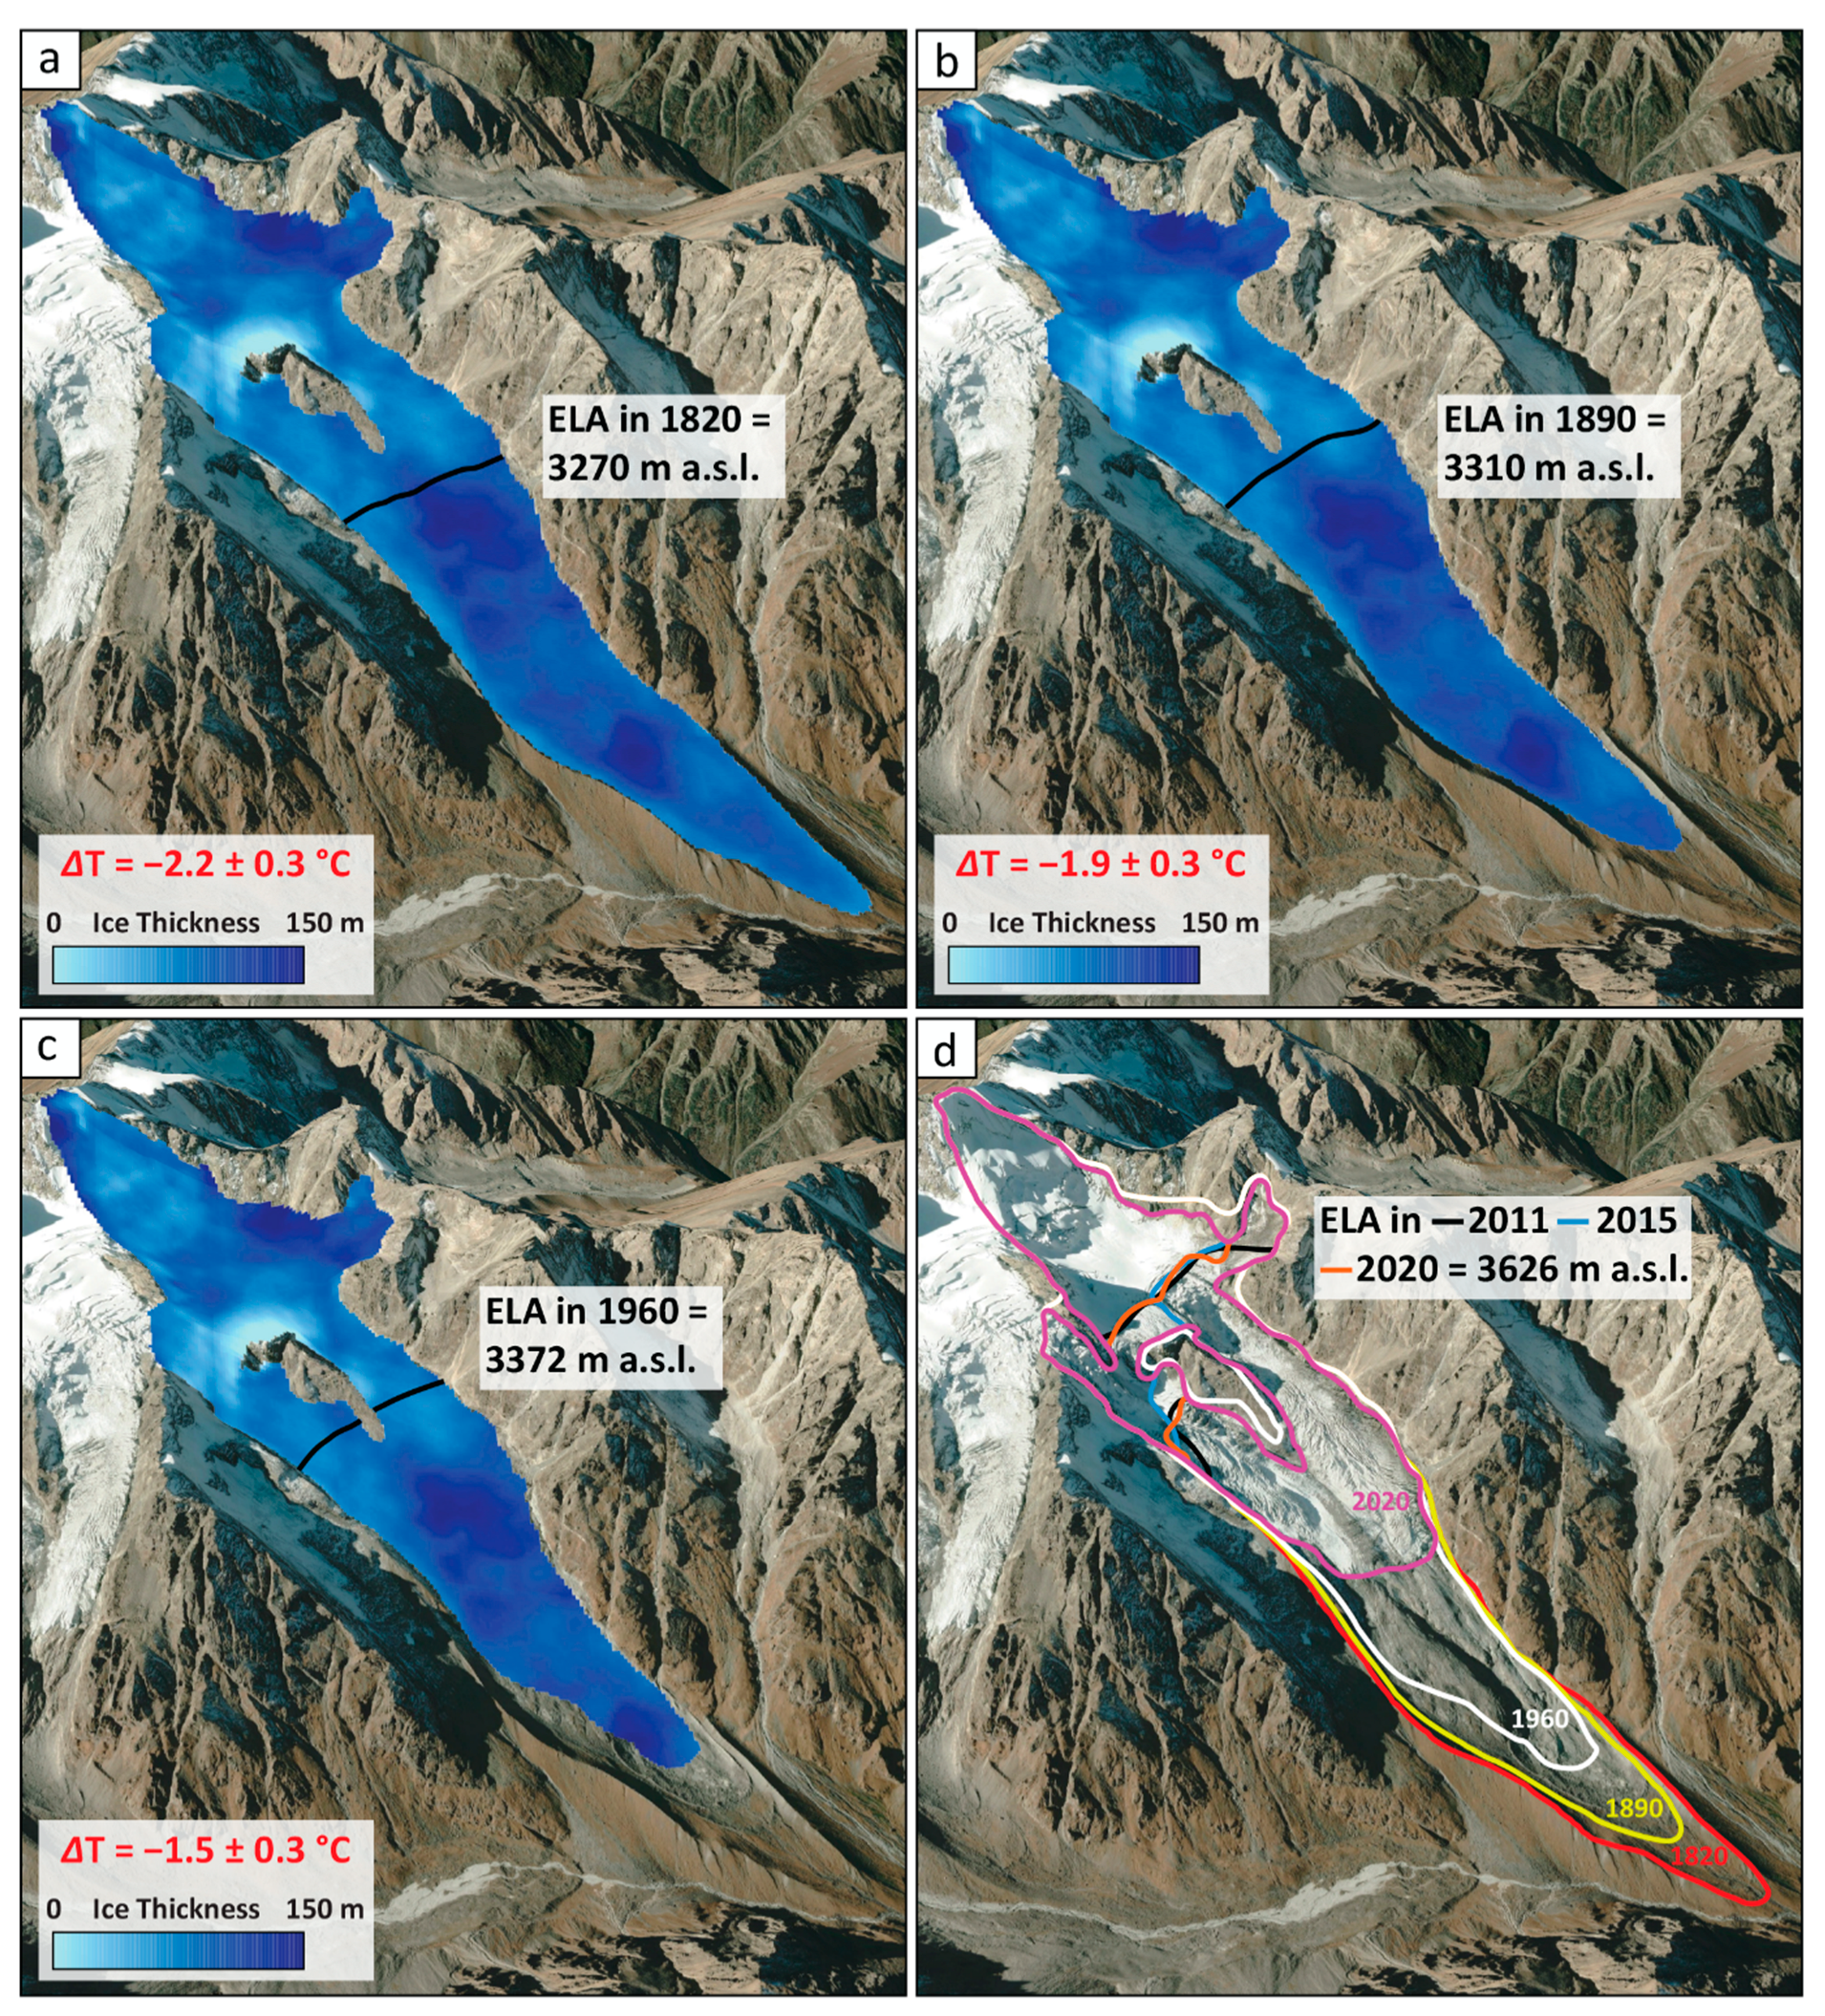
4.2.2. Reconstruction of Equilibrium Line Altitude
4.2.3. Reconstruction of Late Summer Snowline
4.2.4. Temperature Reconstructions
4.2.5. Terminus Measurement
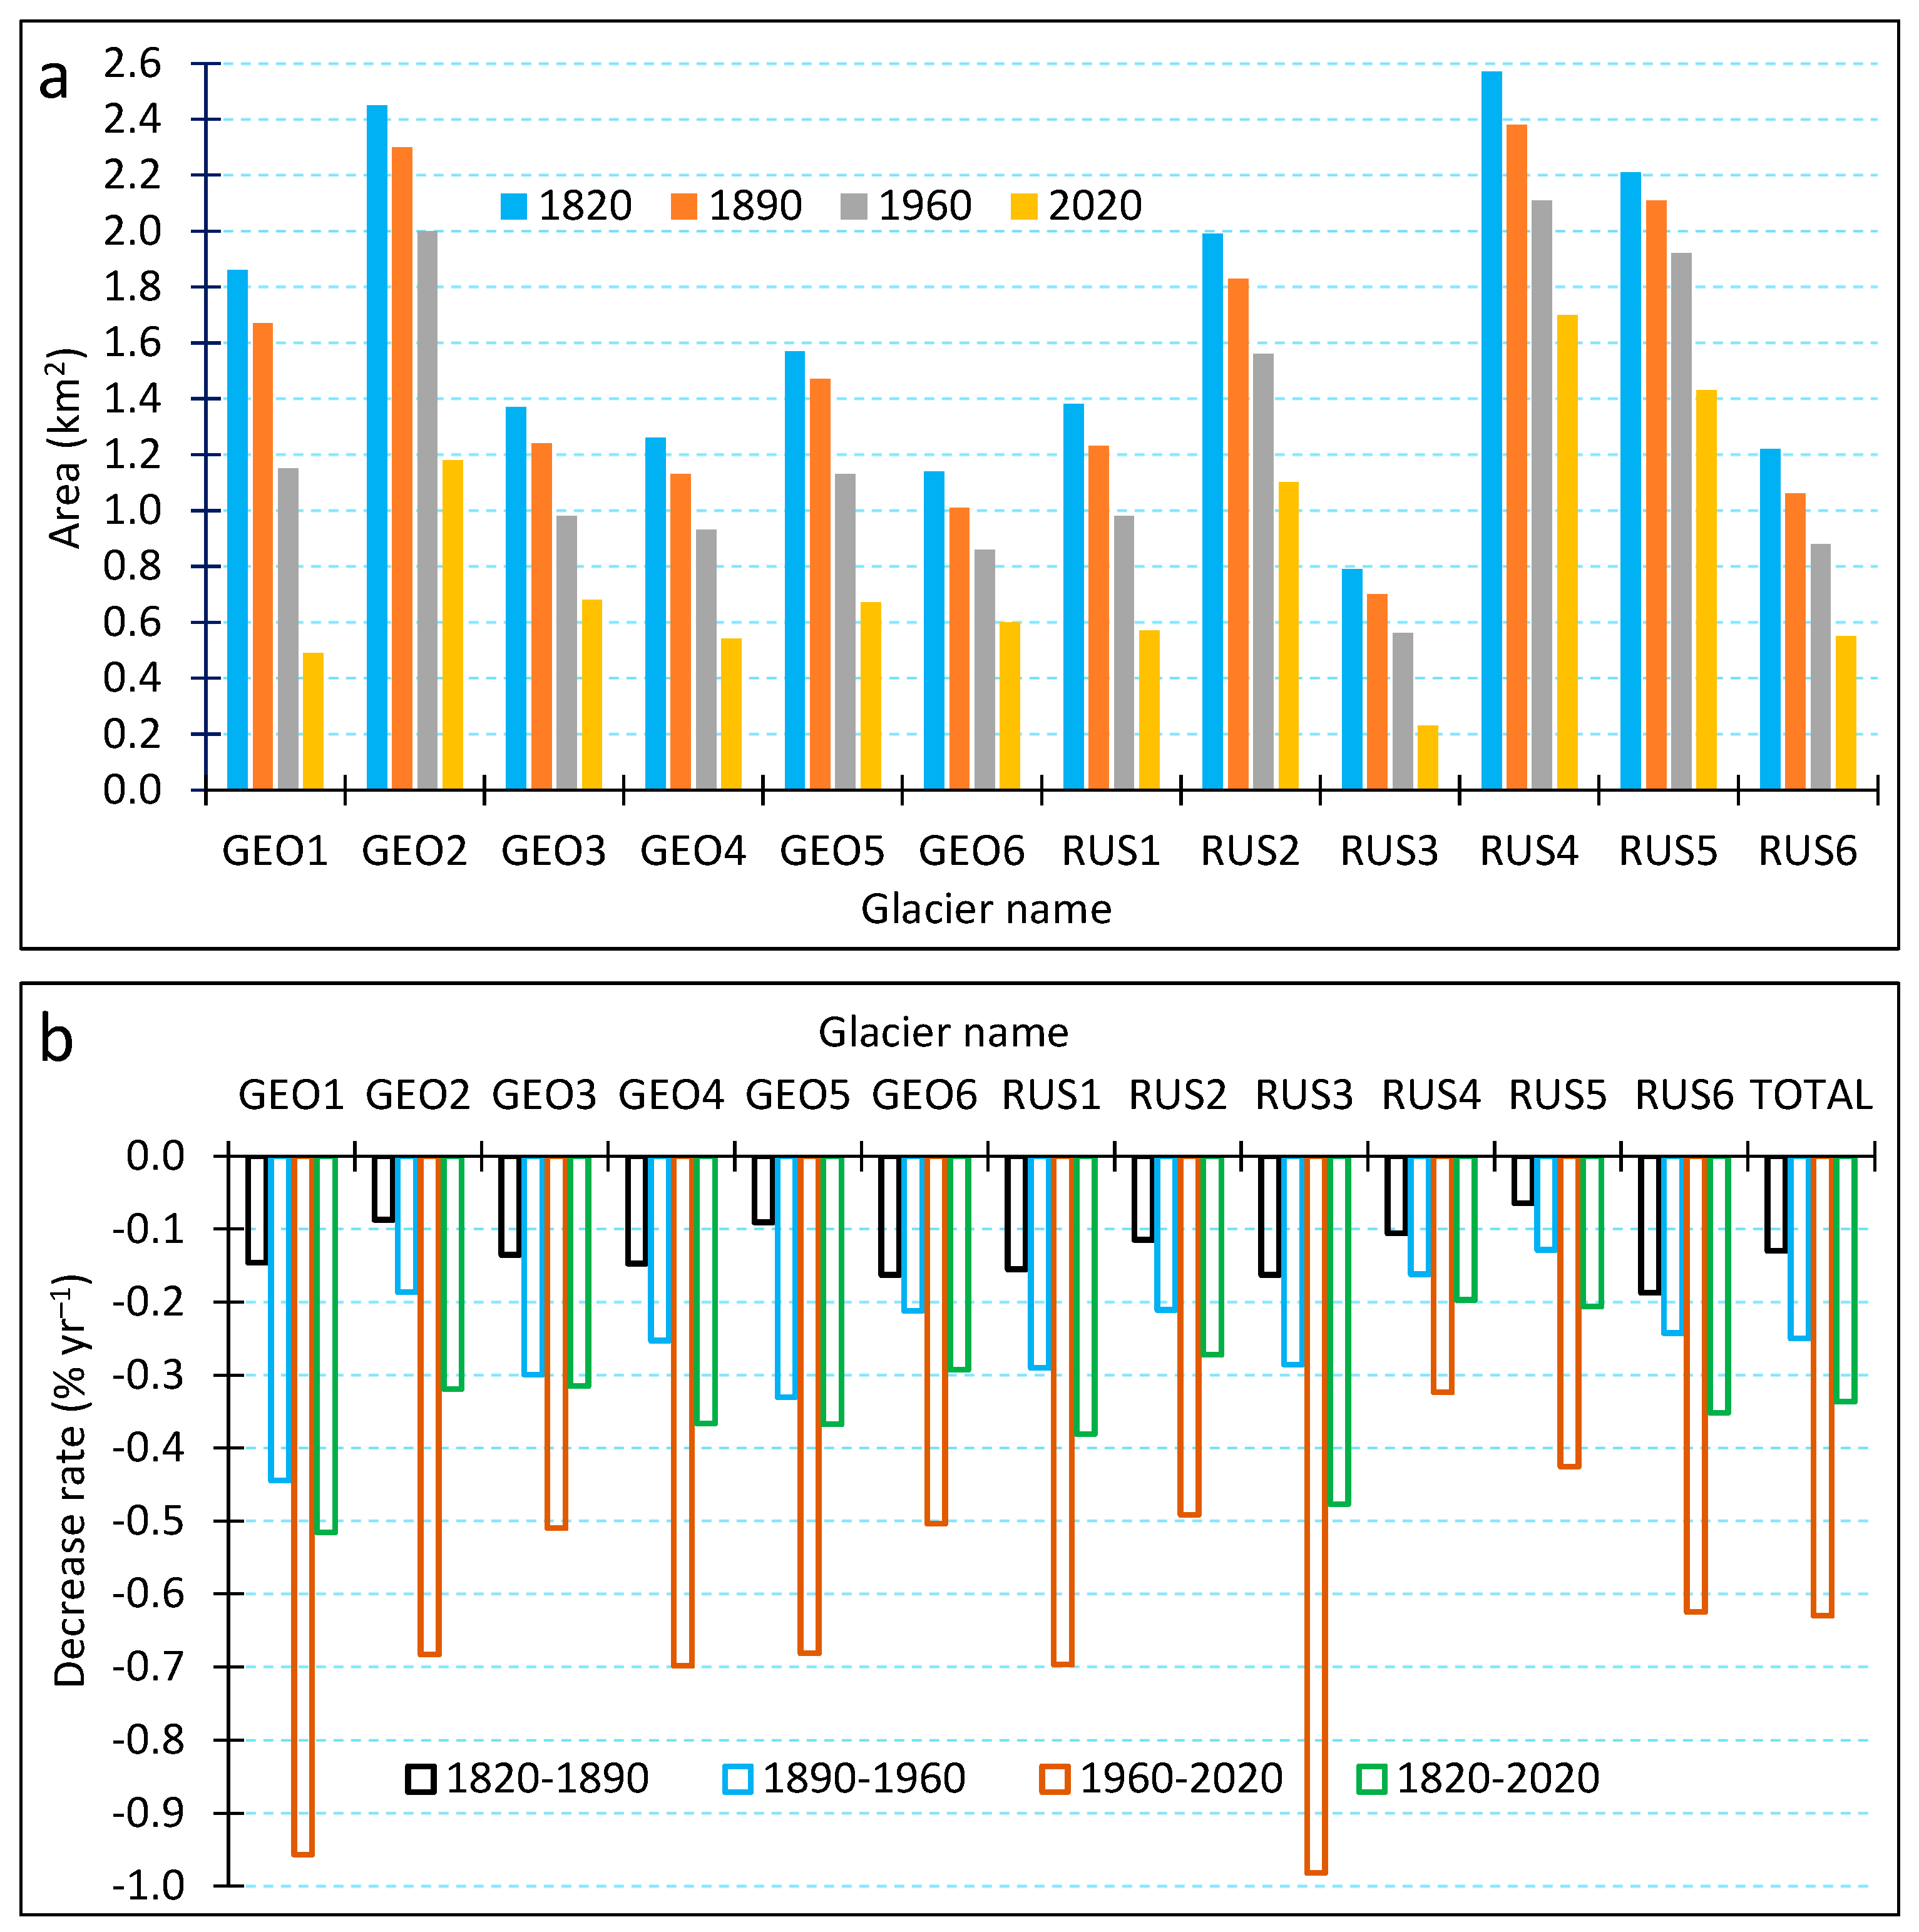
5. Results
6. Discussion
6.1. Comparison of Glacier Changes Within the Greater Caucasus
6.2. Comparison with Glacier Changes in Other Regions and Implications for Water Security
7. Conclusions
Supplementary Materials
Author Contributions
Funding
Data Availability Statement
Acknowledgments
Conflicts of Interest
References
- Porter, S.C. Pattern and forcing of Northern Hemisphere glacier variations during the last millennium. Quat. Res. 1986, 26, 27–48. [Google Scholar] [CrossRef]
- Grove, J. The Little Ice Age; Routledge, the Taylor & Francis Group: London, UK; New York, NY, USA; Methuen, MA, USA, 1988; 498p. [Google Scholar] [CrossRef]
- Grove, J.M. The initiation of the “Little Ice Age” in regions round the North Atlantic. Clim. Change 2001, 48, 53–82. [Google Scholar] [CrossRef]
- Knoll, C.; Kerschner, H.; Heller, A.; Rastner, P. A GIS-based Reconstruction of Little Ice Age Glacier Maximum Extents for South Tyrol, Italy. Trans. GIS 2009, 13, 449–463. [Google Scholar] [CrossRef]
- Barr, I.D.; Lovell, H. A review of topographic controls on moraine distribution. Geomorphology 2014, 226, 44–64. [Google Scholar] [CrossRef]
- Deswal, S.; Sharma, M.C.; Saini, R.; Chand, P.; Prakash, S.; Kumar, P.; Barr, I.D.; Latief, S.U.; Dalal, P.; Bahuguna, I.M. Reconstruction of post-little ice age glacier recession in the Lahaul Himalaya, north-west India. Geogr. Ann. Ser. A Phys. Geogr. 2022, 105, 1–26. [Google Scholar] [CrossRef]
- Solomina, O.N.; Bradley, R.S.; Jomelli, V.; Geirsdottir, A.; Kaufman, D.S.; Koch, J.; McKay, N.P.; Masiokas, M.; Miller, G.; Nesje, A.; et al. Glacier fluctuations during thepast 2000 years. Quat. Sci. Rev. 2016, 149, 61–90. [Google Scholar] [CrossRef]
- Marta, S.; Azzoni, R.S.; Fugazza, D.; Tielidze, L.; Chand, P.; Sieron, K.; Almond, P.; Ambrosini, R.; Anthelme, F.; Alviz Gazitúa, P.; et al. The Retreat of Mountain Glaciers since the Little Ice Age: A Spatially Explicit Database. Data 2021, 6, 107. [Google Scholar] [CrossRef]
- Reinthaler, J. Digital Reconstructions of Little Ice Age Glacier Extents and Surfaces. Doctoral Dissertation, Faculty of Science, University of Zurich, Zürich, Switzerland, 2024. [Google Scholar] [CrossRef]
- Marzeion, B.; Cogley, G.; Richter, K.; Parkes, D. Attribution of global glacier mass loss to anthropogenic and natural causes. Science 2014, 345, 919–921. [Google Scholar] [CrossRef]
- Hock, R.; Rasul, G.; Adler, C.; Cáceres, B.; Gruber, S.; Hirabayashi, Y.; Jackson, M.; Kääb, A.; Kang, S.; Kutuzov, S.; et al. High Mountain Areas. In IPCC Special Report on the Ocean and Cryosphere in a Changing Climate; Pörtner, H.O., Roberts, D.C., Masson-Delmotte, V., Zhai, P., Tignor, M., Poloczanska, E., Mintenbeck, K., Alegría, A., Nicolai, M., Okem, A., et al., Eds.; Cambridge University Press: Cambridge, UK; New York, NY, USA, 2019; pp. 131–202. [Google Scholar] [CrossRef]
- Rangwala, I.; Sinsky, E.; Miller, J.R. Amplified warming projections for high altitude regions of the northern hemisphere mid-latitudes from CMIP5 models. Environ. Res. Lett. 2013, 8, 024040. [Google Scholar] [CrossRef]
- Rucevska, I.; Emelin, V.; Malashkhia, N.; Kirkfeldt, T.; Jørstad, H.; Yemelin, V.; Aliyev, M.; Lengyel, Z. Climate Change and Security in the South Caucasus Republic of Armenia, Republic of Azerbaijan and Georgia: Regional Assessment, UNDP, UN Environment, OSCE, UNECE, REC. Norway. 2017. Available online: https://coilink.org/20.500.12592/ccw3qv (accessed on 7 April 2025).
- Tielidze, L.G.; Nosenko, G.A.; Khromova, T.E.; Paul, F. Strong acceleration of glacier area loss in the Greater Caucasus between 2000 and 2020. Cryosphere 2022, 16, 489–504. [Google Scholar] [CrossRef]
- UNEP—United Nations Environment Programme. Caucasus Environment Outlook-Second Edition. 2024. Available online: https://wedocs.unep.org/handle/20.500.11822/46485;jsessionid=8824D6DC65A6EE825CE41CD9C152505D (accessed on 20 March 2025).
- Stadelbauer, J. Alpine Ecosystems in the Northwest Caucasus. Mt. Res. Dev. 2005, 25, 296–297. [Google Scholar] [CrossRef]
- Etzold, J.; Münzner, F.; Manthey, M. Sub-alpine and alpine grassland communities in the northeastern Greater Caucasus of Azerbaijan. Appl. Veg. Sci. 2016, 19, 316–335. [Google Scholar] [CrossRef]
- Nakhutsrishvili, G.; Batsatsashvili, K.; Bussmann, R.W.; Ur Rahman, I.; Hart, R.E.; Haq, S.M. The subalpine and alpine vegetation of the Georgian Caucasus—A first ethnobotanical and phytosociological synopsis. Ethnobot. Res. Appl. 2022, 23, 1–60. Available online: https://ethnobotanyjournal.org/index.php/era/article/view/3509 (accessed on 11 February 2025). [CrossRef]
- Zemp, M.; Huss, M.; Thibert, E.; Eckert, N.; McNabb, R.; Huber, J.; Barandun, M.; Machguth, H.; Nussbaumer, S.U.; Gärtner-Roer, I.; et al. Global glacier mass changes and their contributions to sea-level rise from 1961 to 2016. Nature 2019, 568, 382–386. [Google Scholar] [CrossRef]
- Shahgedanova, M.; Nosenko, G.; Kutuzov, S.; Rototaeva, O.; Khromova, T. Deglaciation of the Caucasus Mountains, Russia/Georgia, in the 21st century observed with ASTER satellite imagery and aerial photography. Cryosphere 2014, 8, 2367–2379. [Google Scholar] [CrossRef]
- Kutuzov, S.; Lavrentiev, I.; Smirnov, A.; Nosenko, G.; Petrakov, D. Volume Changes of Elbrus Glaciers From 1997 to 2017. Front. Earth Sci. 2019, 7, 153. [Google Scholar] [CrossRef]
- Tielidze, L.G.; Jomelli, V.; Nosenko, G.A. Analysis of Regional Changes in Geodetic Mass Balance for All Caucasus Glaciers over the Past Two Decades. Atmosphere 2022, 13, 256. [Google Scholar] [CrossRef]
- GlaMBIE Team. Community estimate of global glacier mass changes from 2000 to 2023. Nature 2025, 639, 382–388. [Google Scholar] [CrossRef]
- Tielidze, L.G.; Kumladze, R.M.; Wheate, R.D.; Gamkrelidze, M. The Devdoraki Glacier Catastrophes, Georgian Caucasus. Hung. Geogr. Bull. 2019, 68, 21–35. [Google Scholar] [CrossRef]
- Tielidze, L.G.; Charton, J.; Jomelli, V.; Solomina, O.N. Glacial geomorphology of the Notsarula and Chanchakhi river valleys, Georgian Caucasus. J. Maps 2023, 19, 2261490. [Google Scholar] [CrossRef]
- Evans, S.G.; Tutubalina, O.V.; Drobyshev, V.N.; Chernomorets, S.S.; McDougall, S.; Petrakov, D.A.; Hungr, O. Catastrophic detachment and high-velocity long-runout flow of Kolka Glacier, Caucasus Mountains, Russia in 2002. Geomorphology 2009, 105, 314–321. [Google Scholar] [CrossRef]
- Chernomorets, S.S.; Petrakov, D.A.; Aleynikov, A.A.; Bekkiev, M.Y.; Viskhadzhieva, K.S.; Dokukin, M.D.; Kalov, R.K.; Kidyaeva, V.M.; Krylenko, V.V.; Krylenko, I.V.; et al. The outburst of Bashkara glacier lake (Central Caucasus, Russia) on September 1, 2017. Earth’s Cryosphere 2018, XXII, 70–80. [Google Scholar] [CrossRef]
- Tennant, C.; Menounos, B.; Wheate, R.; Clague, J.J. Area change of glaciers in the Canadian Rocky Mountains, 1919 to 2006. Cryosphere 2012, 6, 1541–1552. [Google Scholar] [CrossRef]
- Weber, P.; Andreassen, L.M.; Boston, C.M.; Lovell, H.; Kvarteig, S. An ~1899 glacier inventory for Nordland, northern Norway, produced from historical maps. J. Glaciol. 2020, 66, 259–277. [Google Scholar] [CrossRef]
- Bevington, A.R.; Menounos, B. Accelerated change in the glaciated environments of western Canada revealed through trend analysis of optical satellite imagery. Remote Sens. Environ. 2022, 270, 112862. [Google Scholar] [CrossRef]
- Rastner, P.; Joerg, P.C.; Huss, M.; Zemp, M. Historical analysis and visualization of the retreat of Findelengletscher, Switzerland, 1859–2010. Glob. Planet. Change 2016, 145, 67–77. [Google Scholar] [CrossRef]
- Freudiger, D.; Mennekes, D.; Seibert, J.; Weiler, M. Historical glacier outlines from digitized topographic maps of the Swiss Alps. Earth Syst. Sci. Data 2018, 10, 805–814. [Google Scholar] [CrossRef]
- Carrivick, J.L.; Andreassen, L.M.; Nesje, A.; Yde, J.C. A reconstruction of Jostedalsbreen during the Little Ice Age and geometric changes to outlet glaciers since then. Quat. Sci. Rev. 2022, 284, 107501. [Google Scholar] [CrossRef]
- Mackintosh, A.N.; Anderson, B.M.; Pierrehumbert, R.T. Reconstructing climate from glaciers. Annu. Rev. Earth Planet. Sci. 2017, 45, 649–680. [Google Scholar] [CrossRef]
- Tielidze, L.G.; Eaves, S.R.; Norton, K.P.; Mackintosh, A.N.; Pedro, J.B.; Hidy, A.J. Early glacier advance in New Zealand during the Antarctic Cold Reversal. J. Quat. Sci. 2023, 38, 544–562. [Google Scholar] [CrossRef]
- Tielidze, L.G.; Solomina, O.N.; Jomelli, V.; Dolgova, E.A.; Bushueva, I.S.; Mikhalenko, V.N.; Brauche, R.; ASTER Team. Change of Chalaati Glacier (Georgian Caucasus) since the Little Ice Age based on dendrochronological and Beryllium-10 data. Ice Snow 2020, 60, 453–470. [Google Scholar] [CrossRef]
- Solomina, O.; Jomelli, V.; Bushueva, I. Holocene glacier variations in the Northern Caucasus, Russia. In European Glacial Landscapes; Elsevier: Amsterdam, The Netherlands, 2024; pp. 353–365. [Google Scholar] [CrossRef]
- Morice, C.P.; Kennedy, J.J.; Rayner, N.A.; Winn, J.P.; Hogan, E.; Killick, R.E.; Dunn, R.J.H.; Osborn, T.J.; Jones, P.D.; Simpson, I.R. An updated assessment of near-surface temperature change from 1850: The HadCRUT5 data set. J. Geophys. Res. Atmos. 2021, 126, e2019JD032361. [Google Scholar] [CrossRef]
- Morice, C.P.; Berry, D.I.; Cornes, R.C.; Cowtan, K.; Cropper, T.; Hawkins, E.; Kennedy, J.J.; Osborn, T.J.; Rayner, N.A.; Rivas, B.R.; et al. An observational record of global gridded near surface air temperature change over land and ocean from 1781. Earth Syst. Sci. Data Discuss. 2024; preprint. [Google Scholar] [CrossRef]
- Wang, Y.; Xiao, C. An Increase in the Antarctic Surface Mass Balance during the Past Three Centuries, Dampening Global Sea Level Rise. J. Clim. 2023, 36, 8127–8138. [Google Scholar] [CrossRef]
- Calvert, B.T.T. Improving global temperature datasets to better account for non-uniform warming. Q. J. R. Meteorol. Soc. 2024, 150, 3672–3702. [Google Scholar] [CrossRef]
- Nesje, A. Reconstructing Paleo ELAs on Glaciated Landscapes. In Reference Module in Earth Systems and Environmental Sciences; Elsevier: Amsterdam, The Netherlands, 2014. [Google Scholar] [CrossRef]
- Porter, S.C. Equilibrium-line altitudes of late Quaternary glaciers in the Southern Alps, New Zealand. Quat. Res. 1975, 5, 27–47. [Google Scholar] [CrossRef]
- Benn, D.I.; Lehmkuhl, F. Mass balance and equilibrium-line altitudes of glaciers in high-mountain environments. Quat. Int. 2000, 65–66, 15–29. [Google Scholar] [CrossRef]
- Klein, A.G.; Isacks, B.L. Alpine glacial geomorphological studies in the central Andes using Landsat Thematic Mapper images. Glacial Geology and Geomorphology. 1998. Available online: https://www.scribd.com/document/434035253/glaciology (accessed on 20 March 2025).
- Porter, S.C. Snowline depression in the tropics during the Last Glaciation. Quat. Sci. Rev. 2001, 20, 1067–1091. [Google Scholar] [CrossRef]
- Mosar, J.; Mauvilly, J.; Koiava, K.; Gamkrelidze, I.; Enna, N.; Lavrishev, V.; Kalberguenova, V. Tectonics in the Greater Caucasus (Georgia—Russia): From an intracontinental rifted basin to a doubly verging fold-and-thrust belt. Mar. Pet. Geol. 2022, 140, 105630. [Google Scholar] [CrossRef]
- Trexler, C.; Cowgill, E.; Vasey, D.; Niemi, N. Total Shortening Estimates Across the Western Greater Caucasus Mountains from Balanced Cross Sections and Area Balancing. Tektonika 2023, 1, 198–208. [Google Scholar] [CrossRef]
- Gobejishvili, R.; Lomidze, N.; Tielidze, L. Late Pleistocene (Würmian) glaciations of the Caucasus. In Quaternary Glaciations: Extent and Chronology; Ehlers, J., Gibbard, P.L., Hughes, P.D., Eds.; Elsevier: Amsterdam, The Netherlands, 2011; pp. 141–147. [Google Scholar] [CrossRef]
- Adamia, S.A.; Chkhotua, T.; Kekelia, M.; Lordkipanidze, M.; Shavishvili, I.; Zakariadze, G. Tectonics of the Caucasus and adjoining regions: Implications for the evolution of the Tethys ocean. J. Struct. Geol. 1981, 3, 437–447. [Google Scholar] [CrossRef]
- Adamia, S.; Zakariadze, G.; Chkhotua, T.; Sadradze, N.; Tsereteli, N.; Chabukiani, A.; Gventsadze, A. Geology of the Caucasus: A review. Turk. J. Earth Sci. 2011, 20, 489–544. [Google Scholar] [CrossRef]
- Bochud, M. Tectonics of the Eastern Greater Caucasus in Azerbaijan. Ph.D. Thesis, Faculty of Sciences of the University of Fribourg, Fribourg, Switzerland, 2011. [Google Scholar]
- Volodicheva, N. The Caucasus. In The Physical Geography of Northern Eurasia; Shahgedanova, M., Ed.; Oxford University Press: Oxford, UK, 2002; pp. 350–376. [Google Scholar]
- Ashabokov, B.A.; Tashilova, A.A.; Kesheva, L.A.; Teunova, N.V.; Kalov, K.M.; Fedchenko, L.M.; Kalov, R.K.; Khavtsukov, A.K. Climate of the Caucasus Region of the Last 60 Years: Precipitation and Temperature Trends and Anomalies. In Proceedings of the International Symposium “Engineering and Earth Sciences: Applied and Fundamental Research” (ISEES 2019), Grozny, Russia, 10–13 June 2019. [Google Scholar] [CrossRef]
- Sylvén, M.; Reinvang, R.; Andersone-Lilley, Ž. Climate Change in Southern Caucasus: Impacts on Nature, People and Society (WWF Overview Report); WWF Norway WWF Caucasus Programme. 2008. Available online: https://www.caucasus-mt.net/climate-change-in-southern-caucasus-impacts-on-nature.html (accessed on 17 October 2024).
- Blau, M.T.; Kad, P.; Turton, J.V.; Ha, K.J. Uneven global retreat of persistent mountain snow cover alongside mountain warming from ERA5-land. NPJ Clim. Atmos. Sci. 2024, 7, 278. [Google Scholar] [CrossRef]
- Tielidze, L.G. Glacier change over the last century, Caucasus Mountains, Georgia, observed from old topographical maps, Landsat and ASTER satellite imagery. Cryosphere 2016, 10, 713–725. [Google Scholar] [CrossRef]
- Abich, H.V. A few words about the current state of the Devdoraki glacier. Izv. Cauc. Dep. IRGO 1877, 5, 57–64. [Google Scholar]
- Mushketov, I.V. Study of Russian glaciers in 1898. Izv. Imp. RGO 1898, 35, 228–230. (In Russian) [Google Scholar]
- Rossikov, K.N. Conditions of glaciers on the northern slope of the Central Caucasus. Zap. KORGO 1896, 18, 279–322. (In Russian) [Google Scholar]
- Freshfield, D.W. The Exploration of the Caucasus. V. II. Edinburgh: T. and A. Constable, Printers to Her Majesty; Edward Arnold Publishers Ltd.: London, UK, 1896. [Google Scholar]
- Dinik, N.Y. Modern and ancient glaciers of the Caucasus. Tiflis Zap. Cauc. Dep. RGO 1890, 14, 282–417. [Google Scholar]
- Bush, N.A. Glaciers of the Western Caucasus. Zap. Imp. Geogr. Obs. Po Obs. Geografii 1905, 32, 87–89. (In Russian) [Google Scholar]
- Bush, N.A. On the state of the glaciers of the northern slope of the Caucasus in 1907, 1909, 1911 and 1913. Izv. RGO 1914, 50, 461–510. (In Russian) [Google Scholar]
- Déchy, M. Kaukasus: Reisen und Forschungen im Kaukakischen Hochgebirge; Berlin D. Reimer (E. Vohsen) Publisher: Berlin, Germany, 1906; Volume 2, 512p, ISBN-10: 0364603887. (In German) [Google Scholar]
- Podozerskiy, K.I. Ledniki Kavkazskogo Khrebta (Glaciers of the Caucasus Range): Zapiski Kavkazskogo otdela Russkogo Geograficheskogo Obshchestva. Publ. Zap. KORGO Tifis 1911, 29, 200. [Google Scholar]
- Reinhardt, A.L. Snejnaya granica Kavkaze (The snow line in the Caucasus). Izv. Kavk. Otd. Imp. Rus. Geogr. Obs. 1916, 3, 275–307. [Google Scholar]
- Rutkovskaya, V.A. Sections: Upper Svaneti Glaciers. Trans. Glacial Exped. 1936, 5, 404–448. (In Russian) [Google Scholar]
- Tsereteli, D. Glacier change in the southern slope of the Greater Caucasus during the last 20–25 years. Work. Georgian Natl. Acad. Sci. (Moambe) 1959, XII. (In Georgian) [Google Scholar]
- Tsereteli, D.; Khazaradze, R.; Lomtatidze, G.; Inashvili Sh Lashkhi, T.; Kurdghelaidze, G.; Kalandadze, G.; Chekurishvili, R. Glaciological observations on the Chalaati and Lechziri glaciers (Upper Svaneti) in the spring of 1959. Georgian Natl. Acad. Sci. Work. Vakhushti Inst. Geogr. 1962, XVIII, 223–256. (In Georgian) [Google Scholar]
- Shengelia, R. Chalaati and Lekhziri glaciers regime in the summer of 1961. Georgian Natl. Acad. Sci. Work. Vakhushti Inst. Geogr. 1964, XX, 233–244. (In Georgian) [Google Scholar]
- Stokes, C.R.; Gurney, S.D.; Popovnin, V.; Shahgedanova, M. Late-20th-century changes in glacier extent in the Caucasus Mountains, Russia/Georgia. J. Glaciol. 2006, 52, 99–109. [Google Scholar] [CrossRef]
- Tielidze, L.G.; Wheate, R.D. The Greater Caucasus Glacier Inventory (Russia, Georgia and Azerbaijan). Cryosphere 2018, 12, 81–94. [Google Scholar] [CrossRef]
- Stokes, C.R.; Popovnin, V.V.; Aleynikov, A.; Shahgedanova, M. Recent glacier retreat in the Caucasus Mountains, Russia, and associated changes in supraglacial debris cover and supra/proglacial lake development. Ann. Glaciol. 2007, 46, 196–203. [Google Scholar] [CrossRef]
- Tielidze, L.G.; Bolch, T.; Wheate, R.D.; Kutuzov, S.S.; Lavrentiev, I.I.; Zemp, M. Supra-glacial debris cover changes in the Greater Caucasus from 1986 to 2014. Cryosphere 2020, 14, 585–598. [Google Scholar] [CrossRef]
- Tielidze, L.G.; Iacob, G.; Holobâcă, I.H. Mapping of Supra-Glacial Debris Cover in the Greater Caucasus: A Semi-Automated Multi-Sensor Approach. Geosciences 2024, 14, 178. [Google Scholar] [CrossRef]
- von Déchy, M. Kaukasus Reisen und Forschungen imkaukasischen Hochgebirge (Travel and research in the Caucasian high mountains). Band 1905, 1, 313–314. (In German) [Google Scholar]
- Drygalski, E.V.; Fritz, M. Glaciology. In Part of the Encyclopedia; Franz Deuticke Scientific Publishing Company: Vienna, Austria, 1942; 251p. (In German) [Google Scholar]
- Gobejishvili, R.G. Present day Glaciers of Georgia and Evolution of Glaciation in the Mountains of Eurasia in Late Pleistocene and Holocene. Doctoral Thesis, Institute of Geography, Georgian National Academy of Sciences, Tbilisi, Georgia, 1995; 320p. [Google Scholar]
- Tielidze, L. The Morphological Types, Exposition, Snow, and Firn Line Location of the Glaciers of Georgia. In Glaciers of Georgia; Geography of the Physical Environment; Springer: Cham, Switzerland, 2017. [Google Scholar] [CrossRef]
- Kotlyakov, V.M.; Krenke, A.N. The régime of the present-day glaciation of the Caucasus. Z. Für Gletscherkunde Und Glazialgeologie 1979, 15, 7–21. [Google Scholar]
- Panov, V.D. Evolution of the Modern Glaciation of the Caucasus; Gidrometeoizdat: Saint-Petersburg, Russia, 1993. (In Russian) [Google Scholar]
- Bushueva, I.S. Fluctuations of Glaciers on the Central and Western Caucasus Using Cartographical, Historical and Proxy Data over the Last 200 Years. Ph.D. Thesis, Institute of Geography Russian Academy of Sciences, Moscow, Russia, 2013. (In Russian). [Google Scholar]
- Klok, E.J.; Oerlemans, J. Climate Reconstructions Derived from Global Glacier Length Records. Arct. Antarct. Alp. Res. 2004, 36, 575–583. Available online: http://www.jstor.org/stable/1552311 (accessed on 15 March 2025). [CrossRef]
- Baumann, S.; Winkler, S.; Andreassen, L.M. Mapping glaciers in Jotunheimen, South-Norway, during the “Little Ice Age” maximum. Cryosphere 2009, 3, 231–243. [Google Scholar] [CrossRef]
- Zumbühl, H.J.; Nussbaumer, S.U. Little ice age glacier history of the central and western Alps from pictorial documents. Geogr. Res. Lett. 2018, 44, 115–136. [Google Scholar] [CrossRef]
- Belloni, V.; Di Rita, M.; Fugazza, D.; Traversa, G.; Hanson, K.; Diolaiuti, G.; Crespi, M. High-resolution high-accuracy orthophoto map and digital surface model of Forni Glacier tongue (Central Italian Alps) from UAV photogrammetry. J. Maps 2023, 19, 2217508. [Google Scholar] [CrossRef]
- Reinthaler, J.; Paul, F. Using a Web Map Service to map Little Ice Age glacier extents at regional scales. Ann. Glaciol. 2023, 64, 206–224. [Google Scholar] [CrossRef]
- Planet Labs PBC. Planetscope Product Specifications. 2023. Available online: https://assets.planet.com/docs/Planet_Combined_Imagery_Product_Specs_letter_screen.pdf (accessed on 22 January 2025).
- Pudełko, R.; Angiel, P.J.; Potocki, M.; Jędrejek, A.; Kozak, M. Fluctuation of glacial retreat rates in the eastern part of Warszawa Icefield, King George Island, Antarctica, 1979–2018. Remote Sens. 2018, 10, 892. [Google Scholar] [CrossRef]
- Steiner, J.F.; Kraaijenbrink, P.D.; Jiduc, S.G.; Immerzeel, W.W. Brief communication: The Khurdopin glacier surge revisited–extreme flow velocities and formation of a dammed lake in 2017. Cryosphere 2018, 12, 95–101. [Google Scholar] [CrossRef]
- Chand, P.; Jain, S.K.; Thakur, H.P.; Kumar, S.; Sharma, M.C. Recessional pattern and surface elevation change of the Parvati Glacier, North-Western Himalaya (1965–2018) using remote sensing. Int. J. Remote Sens. 2020, 41, 9360–9392. [Google Scholar] [CrossRef]
- Shaw, T.E.; Ulloa, G.; Farías-Barahona, D.; Fernandez, R.; Lattus, J.M.; McPhee, J. Glacier albedo reduction and drought effects in the extratropical Andes, 1986–2020. J. Glaciol. 2021, 67, 158–169. [Google Scholar] [CrossRef]
- Tarca, G.; Hoelzle, M.; Guglielmin, M. Using PlanetScope images to investigate the evolution of small glaciers in the Alps. Remote Sens. Appl. Soc. Environ. 2023, 32, 101013. [Google Scholar] [CrossRef]
- Guo, W.; Liu, S.; Xu, J.; Wu, L.; Shangguan, D.; Yao, X.; Wei, J.; Bao, W.; Yu, P.; Liu, Q.; et al. The second Chinese glacier inventory: Data, methods and results. J. Glaciol. 2015, 61, 357–372. [Google Scholar] [CrossRef]
- Schmid, M.O.; Baral, P.; Gruber, S.; Shahi, S.; Shrestha, T.; Stumm, D.; Wester, P. Assessment of permafrost distribution maps in the Hindu Kush Himalayan region using rock glaciers mapped in Google Earth. Cryosphere 2015, 9, 2089–2099. [Google Scholar] [CrossRef]
- Rusli, N.; Majid, M.R.; Din, A.H.M. Google Earth’s derived digital elevation model: A comparative assessment with Aster and SRTM data. IOP Conf. Ser. Earth Environ. Sci. 2014, 18, 012065. [Google Scholar] [CrossRef]
- Jiang, Z.L.; Liu, S.Y.; Peters, J.; Lin, J.; Long, S.C.; Han, Y.S.; Wang, X. Analyzing Yengisogat Glacier surface velocities with ALOS PALSAR data feature tracking, Karakoram, China. Environ. Earth Sci. 2012, 67, 1033–1043. [Google Scholar] [CrossRef]
- Yang, W.; Zhao, C.; Westoby, M.; Yao, T.; Wang, Y.; Pellicciotti, F.; Zhou, J.; He, Z.; Miles, E. Seasonal Dynamics of a Temperate Tibetan Glacier Revealed by High-Resolution UAV Photogrammetry and In Situ Measurements. Remote Sens. 2020, 12, 2389. [Google Scholar] [CrossRef]
- Holobâcă, I.H.; Tielidze, L.G.; Ivan, K.; Elizbarashvili, M.; Alexe, M.; Germain, D.; Petrescu, S.H.; Pop, O.T.; Gaprindashvili, G. Multi-sensor remote sensing to map glacier debris cover in the Greater Caucasus, Georgia. J. Glaciol. 2021, 67, 685–696. [Google Scholar] [CrossRef]
- Paul, O.J.; Dar, R.A.; Romshoo, S.A. Paleo-glacial and paleo-equilibrium line altitude reconstruction from the Late Quaternary glacier features in the Pir Panjal Range, NW Himalayas. Quat. Int. 2022, 642, 5–16. [Google Scholar] [CrossRef]
- ASFDAAC. ALOS PALSAR—Radiometric Terrain Correction—High Resolution. Includes Material © JAXA/METI. 2007. Accessed Through ASF DAAC. 2015. Available online: https://vertex.daac.asf.alaska.edu (accessed on 25 January 2025). [CrossRef]
- Kotlyakov, V.M.; Dyakova, A.M.; Koryakin, V.S.; Kravtsova, V.I.; Osipova, G.B.; Varnakova, G.M.; Vinogradov, V.N.; Vinogradov, O.N.; Zverkova, N.M. Glaciers of the former Soviet Union. In Satellite Image Atlas of Glaciers of the World Glaciers of Asia; Williams, R.S., Jr., Ferrigno, J.G., Eds.; US Geological Survey Professional Paper 1386-F-1; US Geological Survey: Washington, DC, USA, 2010; pp. 4–5. [Google Scholar]
- Bushueva, I.S.; Solomina, O.N. Fluctuations of Kashkatash Glacier over last 400 years using cartographical, dendrochronological and lichonometrical data. Ice Snow 2012, 2, 121–130. [Google Scholar]
- Leigh, J.R.; Stokes, C.R.; Evans, D.J.A.; Carr, R.J.; Andreassen, L.M. Timing of Little Ice Age maxima and subsequent glacier retreat in northern Troms and western Finnmark, northern Norway. Arct. Antarct. Alp. Res. 2020, 52, 281–311. [Google Scholar] [CrossRef]
- Carr, S.; Coleman, C. An improved technique for the reconstruction of former glacier mass-balance and dynamics. Geomorphology 2007, 92, 76–90. [Google Scholar] [CrossRef]
- Kutuzov, S.; Shahgedanova, M. Glacier retreat and climatic variability in the eastern TerskeyAlatoo, inner Tien Shan between the middle of the 19th century and beginning of the 21st century. Glob. Planet. Change 2009, 69, 59–70. [Google Scholar] [CrossRef]
- Benn, D.I.; Evens, D.J.A. Glaciers and Glaciation, 2nd ed.; Hodder Education: London, UK, 2010. [Google Scholar]
- Martin-Mikle, C.J.; Fagre, D.B. Glacier recession since the Little Ice Age: Implications for water storage in a Rocky Mountain landscape. Arct. Antarct. Alp. Res. 2019, 51, 280–289. [Google Scholar] [CrossRef]
- Nesje, A.; Dahl, S.O. Glaciers as indicators of Holocene climate change. In Global Change in the Holocene; Routledge: London, UK, 2014; pp. 264–280. [Google Scholar]
- Eaves, S.R.; Anderson, B.M.; Mackintosh, A.N. Glacier-based climate reconstructions for the last glacial–interglacial transition: Arthur’s Pass, New Zealand (43°S). J. Quat. Sci. 2017, 32, 877–887. [Google Scholar] [CrossRef]
- Granshaw, F.D.; Fountain, A.G. Glacier change (1958–1998) in the North Cascades National Park Complex, Washington, USA. J. Glaciol. 2006, 52, 251–256. [Google Scholar] [CrossRef]
- Bolch, T.; Menounos, B.; Wheate, R. Landsat-based inventory of glaciers in western Canada, 1985–2005. Remote Sens. Environ. 2010, 114, 127–137. [Google Scholar] [CrossRef]
- Ohmura, A.; Kasser, P.; Funk, M. Climate at the equilibrium line of glaciers. J. Glaciol. 1992, 38, 397–411. [Google Scholar] [CrossRef]
- Bakke, J.; Dahl, S.O.; Paasche, O.; Lovlie, R.; Nesje, A. Glacier fluctuations, equilibrium-line altitudes and palaeoclimate in Lyngen, northern Norway, during the Lateglacial and Holocene. Holocene 2005, 15, 518–540. [Google Scholar] [CrossRef]
- Benn, D.I.; Owen, L.A.; Osmaston, H.A.; Seltzer, G.O.; Porter, S.C.; Mark, B. Reconstruction of equilibrium-line altitudes for tropical and sub-tropical glaciers. Quat. Int. 2005, 138–139, 8–21. [Google Scholar] [CrossRef]
- Meier, M.F.; Post, A.S. Recent variations in mass net budgets of glaciers in western North America. In Symposium at Obergurgl 1962—Variations of the Regime of Existing Glaciers; International Association of Scientific Hydrology Publication: Obergurgl, Austria, 1962; Volume 58, pp. 63–77. [Google Scholar]
- Dahl, S.O.; Nesje, A. Paleoclimatic implications based on equilibrium-line altitude depressions of reconstructed younger dryas and holocene cirque glaciers in inner Nordfjord, Western Norway. Palaeogeogr. Palaeoclimatol. Palaeoecol. 1992, 94, 87–97. [Google Scholar] [CrossRef]
- Kern, Z.; László, P. Size specific steady-state accumulation-area ratio: An improvement for equilibrium-line estimation of small palaeoglaciers. Quat. Sci. Rev. 2010, 29, 2781–2787. [Google Scholar] [CrossRef]
- Paterson, W.S.B. Physics of Glaciers; Butterworth-Heinemann: Oxford, UK, 1994. [Google Scholar]
- Cuffey, K.M.; Paterson, W.S.B. The Physics of Glaciers, 4th ed.; Academic Press Publisher: London, UK, 2006; ISBN 9780080919126. [Google Scholar]
- Cowton, T.; Hughes, P.D.; Gibbard, P.L. Palaeoglaciation of parque natural lago de Sanabria, northwest Spain. Geomorphology 2009, 108, 282–291. [Google Scholar] [CrossRef]
- Bacon, S.N.; Chinn, T.J.; Van Dissen, R.J.; Tillinghast, S.F.; Goldstein, H.L.; Burke, R.M. Paleo-equilibrium line altitude estimates from late Quaternary glacial features in the Inland Kaikoura Range, South Island, New Zealand. N. Z. J. Geol. Geophys. 2001, 44, 55–67. [Google Scholar] [CrossRef]
- Kuhlemann, J.; Frisch, W.; Székely, B.; Dunkl, I.; Danišik, M.; Krumrei, I. Würmian maximum glaciation in Corsica. Austrian J. Earth Sci. 2005, 97, 68–81. [Google Scholar]
- Pellitero, R.; Rea, B.R.; Spagnolo, M.; Bakke, J.; Hughes, P.; Ivy-Ochs, S.; Lukas, S.; Ribolini, A. A GIS tool for automatic calculation of glacier equilibrium-line altitudes. Comput. Geosci. 2015, 82, 55–62. [Google Scholar] [CrossRef]
- Zhang, H.; Xu, X.; Sun, Y.; Li, J.; Xu, B. Reconstructions of Little Ice Age glaciers and climate in the Tanggula Mountains, central Tibet Plateau. Palaeogeogr. Palaeoclimatol. Palaeoecol. 2024, 637, 112008. [Google Scholar] [CrossRef]
- Østrem, G. ERTS data in glaciology—An effort to monitor glacier mass balance from satellite imagery. J. Glaciol. 1975, 15, 403–415. [Google Scholar] [CrossRef]
- Carrivick, J.L.; Brewer, T.R. Improving local estimations and regional trends of glacier equilibrium line altitudes. Geogr. Ann. 2004, 86, 67–79. [Google Scholar] [CrossRef]
- Lorrey, A.M.; Vargo, L.; Purdie, H.; Anderson, B.; Cullen, N.J.; Sirguey, P.; Mackintosh, A.; Willsman, A.; Macara, G.; Chinn, W. Southern Alps equilibrium line altitudes: Four decades of observations show coherent glacier–climate responses and a rising snowline trend. J. Glaciol. 2022, 68, 1127–1140. [Google Scholar] [CrossRef]
- Rabatel, A.; Dedieu, J.P.; Vincent, C. Using remote-sensing data to determine equilibrium-line altitude and mass-balance time series: Validation on three French glaciers, 1994–2002. J. Glaciol. 2005, 51, 539–546. [Google Scholar] [CrossRef]
- Chinn, T.J.; Heydenrych, C.; Salinger, M.J. Use of the ELA as a practical method of monitoring glacier response to climate in New Zealand’s Southern Alps. J. Glaciol. 2005, 51, 85–95. [Google Scholar] [CrossRef]
- Barcaza, G.; Aniya, M.; Matsumoto, T.; Aoki, T. Satellite-derived equilibrium lines in Northern Patagonia Icefield, Chile, and their implications to glacier variations. Arct. Antarct. Alp. Res. 2009, 41, 174–182. [Google Scholar] [CrossRef]
- Kozachek, A.; Mikhalenko, V.; Masson-Delmotte, V.; Ekaykin, A.; Ginot, P.; Kutuzov, S.; Legrand, M.; Lipenkov, V.; Preunkert, S. Large-scale drivers of Caucasus climate variability in meteorological records and Mt El’brus ice cores. Clim. Past 2017, 13, 473–489. [Google Scholar] [CrossRef]
- Tielidze, L.G.; Svanadze, D.; Gadrani, L.; Asanidze, L.; Wheate, R.D.; Hamilton, G.S. A 54-year record of changes at Chalaati and Zopkhito glaciers, Georgian Caucasus, observed from archival maps, satellite imagery, drone survey and ground-based investigation. Hung. Geogr. Bull. 2020, 69, 175–189. [Google Scholar] [CrossRef]
- Stone, P.H.; Carlson, J.H. Atmospheric lapse rate regimes and their parameterization. J. Atmos. Sci. 1979, 36, 415–423. [Google Scholar] [CrossRef]
- Kvaratskhelia, R.; Gavashelishvili, A. Common Yew (Taxus baccata) as a climate archive: Reconstructing 200 years of temperature change in Georgia (Caucasus). Dendrochronologia 2025, 89, 126285. [Google Scholar] [CrossRef]
- Klein Tank, A.M.; Wijngaard, J.B.; Können, G.P.; Böhm, R.; Demarée, G.; Gocheva, A.; Mileta, M.; Pashiardis, S.; Hejkrlik, L.; Kern-Hansen, C.; et al. Daily dataset of 20th-century surface air temperature and precipitation series for the European Climate Assessment. Int. J. Climatol. 2002, 22, 1441–1453. [Google Scholar] [CrossRef]
- Parker, D.E.; Legg, T.P.; Folland, C.K. A new daily Central England Temperature Series, 1772–1991. Int. J. Clim. 1992, 12, 317–342. [Google Scholar] [CrossRef]
- Parker, D.E.; Horton, E.B. Uncertainties in the Central England Temperature series since 1878 and some changes to the maximum and minimum series. Int. J. Climatol. 2005, 25, 1173–1188. [Google Scholar] [CrossRef]
- R Core Team. A Language and Environment for Statistical Computing; R Foundation for Statistical Computing: Vienna, Austria, 2024; Available online: https://www.R-project.org/ (accessed on 22 March 2025).
- Lea, J.M.; Mair, D.W.F.; Rea, B.R. Evaluation of existing and new methods of tracking glacier terminus change. J. Glaciol. 2014, 60, 323–332. [Google Scholar] [CrossRef]
- Tielidze, L.; Mackintosh, A.; Gavashelishvili, A.; Gadrani, L.; Nadaraia, A.; Elashvili, M. Post-Little Ice Age glacier and equilibrium-line altitude changes in the Greater Caucasus [Data set]. Zenodo 2025. [Google Scholar] [CrossRef]
- Leclercq, P.W.; Oerlemans, J. Global and hemispheric temperature reconstruction from glacier length fluctuations. Clim. Dyn. 2012, 38, 1065–1079. [Google Scholar] [CrossRef]
- Racoviteanu, A.E.; Arnaud, Y.; Williams, M.W.; Manley, W.F. Spatial patterns in glacier characteristics and area changes from 1962 to 2006 in the Kanchenjunga–Sikkim area, eastern Himalaya. Cryosphere 2015, 9, 505–523. [Google Scholar] [CrossRef]
- Salerno, F.; Thakuri, S.; Tartari, G.; Nuimura, T.; Sunako, S.; Sakai, A.; Fujita, K. Debris-covered glacier anomaly? Morphological factors controlling changes in the mass balance, surface area, terminus position, and snow line altitude of Himalayan glaciers. Earth Planet. Sci. Lett. 2017, 471, 19–31. [Google Scholar] [CrossRef]
- Scherler, D.; Bookhagen, B.; Strecker, M.R. Hillslope-glacier coupling: The interplay of topography and glacial dynamics in High Asia. J. Geophys. Res. 2011, 116, F02019. [Google Scholar] [CrossRef]
- Li, Y.; Li, Y. Topographic and geometric controls on glacier changes in the central Tien Shan, China, since the Little Ice Age. Ann. Glaciol. 2017, 55, 177–186. [Google Scholar] [CrossRef]
- Brooks, J.P.; Larocca, L.J.; Axford, Y.L. Little Ice Age climate in southernmost Greenland inferred from quantitative geospatial analyses of alpine glacier reconstructions. Quat. Sci. Rev. 2022, 293, 107701. [Google Scholar] [CrossRef]
- Toropov, P.A.; Aleshina, M.A.; Grachev, A.M. Large-scale climatic factors driving glacier recession in the Greater Caucasus, 20th–21st century. Int. J. Climatol. 2019, 39, 4703–4720. [Google Scholar] [CrossRef]
- Rototaeva, O.V.; Nosenko, G.A.; Kerimov, A.M.; Kutuzov, S.S.; Lavrentiev, I.I.; Nikitin, S.A.; Kerimov, A.A.; Tarasova, L.N. Changes of the mass balance of the Garabashy Glacier, Mount Elbrus, at the turn of 20th and 21st centuries. Ice Snow 2019, 59, 5–22. [Google Scholar] [CrossRef]
- Reinthaler, J.; Paul, F. Reconstructed glacier area and volume changes in the European Alps since the Little Ice Age. Cryosphere 2025, 19, 753–767. [Google Scholar] [CrossRef]
- Ganyushkin, D.; Chistyakov, K.; Derkach, E.; Bantcev, D.; Kunaeva, E.; Terekhov, A.; Rasputina, V. Glacier Recession in the Altai Mountains after the LIA Maximum. Remote Sens. 2022, 14, 1508. [Google Scholar] [CrossRef]
- Huss, M.; Hock, R. Global-scale hydrological response to future glacier mass loss. Nat. Clim Change 2018, 8, 135–140. [Google Scholar] [CrossRef]


| Source | ID | Date | Scale/Resolution |
| Map | |||
| Verst maps | XIX25 | 1887–1890 | 1:42,000 |
| XIX26 | 1887–1888 | ||
| XX24 | 1897 | ||
| XX25 | 1890–1896 | ||
| XX26 | 1890 | ||
| XXI30 | 1888–1889 | ||
| XXII30 | 1891 | ||
| Military topographical maps | K_38_25_b | 1960s | 1:50,000 |
| K_38_25_g | 1960s | ||
| K_38_26_a | 1960s | ||
| K_38_26_b | 1960s | ||
| K_38_26_v | 1960s | ||
| K_38_27_g | 1960s | ||
| K_38_39_b | 1960s | ||
| K_38_40_g | 1960s | ||
| K_38_40_v | 1960s | ||
| K_38_52_b | 1960s | ||
| Satellite image | |||
| Landat 5 TM | LT51710302011223MOR00 | 11 August 2011 | 30 m |
| Sentinel L2 A | S2A_MSIL1C_V20150903T075826 | 3 September 2015 | 10 m |
| Sentinel L2 A | S2B_MSIL1C_20200904T080609 | 4 September 2020 | 10 m |
| Planet | 20240817_080904_86_24ee_3B | 17 August 2024 | 3 m |
| Planet | 20240817_080902_50_24ee_3B | 17 August 2024 | 3 m |
| Planet | 20240817_071803_33_24bf_3B | 17 August 2024 | 3 m |
| Planet | 20240818_072525_95_24c2_3B | 18August 2024 | 3 m |
| Planet | 20240818_072528_16_24c2_3B | 18 August 2024 | 3 m |
| Planet | 20240818_080439_91_24e6_3B | 18 August 2024 | 3 m |
| Planet | 20240818_080442_06_24e6_3B | 18 August 2024 | 3 m |
| Planet | 20240819_071632_28_24ca_3B | 19 August 2024 | 3 m |
| Planet | 20240819_071634_49_24ca_3B | 19 August 2024 | 3 m |
| Planet | 20240819_072157_50_24c0_3B | 19 August 2024 | 3 m |
| Planet | 20240819_072159_70_24c0_3B | 19 August 2024 | 3 m |
| Planet | 20240819_082530_60_2488_3B | 19 August 2024 | 3 m |
| Google Earth | - | 2012–2022 | <1 m |
| Digital elevation model | |||
| ALOS PALSAR | AP_07844_FBD_F0840_RT1 | 15 July 2007 | 12.5 m |
| ALOS PALSAR | AP_08340_FBD_F0850_RT1 | 18 August 2007 | 12.5 m |
| ALOS PALSAR | AP_08763_FBD_F0850_RT1 | 16 September 2007 | 12.5 m |
| Name/GLIMS ID | Coordinates | Area (km2) (Uncertainty Range ± 4.5–2.1%) | Terminus Elevation (m a.s.l.) (Uncertainty ± 25 m) | ELA (m a.s.l.) (Uncertainty ± 50 m) | |||||||||
|---|---|---|---|---|---|---|---|---|---|---|---|---|---|
| 1820s | 1890s | 1960s | 2020 | 1820s | 1890s | 1960s | 2020 | 1820s | 1890s | 1960s | 2020 | ||
| Southern Slope | |||||||||||||
| GEO_1/G042320E43145N | 43°8′58″N 42°19′6″E | 1.86 | 1.67 | 1.15 | 0.49 | 2755 | 2812 | 2930 | 3030 | 3084 | 3122 | 3183 | 3268 |
| GEO_2/G042477E43195N | 43°11′49″N 42°28′36″E | 2.45 | 2.30 | 2.00 | 1.18 | 2462 | 2500 | 2546 | 2983 | 3265 | 3290 | 3295 | 3360 |
| GEO_3/G042452E43142N | 43°8′28″N 42°27′5″E | 1.37 | 1.24 | 0.98 | 0.68 | 2750 | 2814 | 2990 | 3065 | 3254 | 3283 | 3332 | 3399 |
| GEO_4/G042542E43110N | 43°6′34″N 42°32′21″E | 1.26 | 1.13 | 0.93 | 0.54 | 2550 | 2675 | 2771 | 2965 | 3024 | 3070 | 3154 | 3292 |
| GEO_5/G042673E43114N | 43°6′48″N 42°40′2″E | 1.57 | 1.47 | 1.13 | 0.67 | 2626 | 2752 | 2825 | 2925 | 3124 | 3146 | 3173 | 3421 |
| GEO_6/G043638E42796N | 42°47′51″N 43°38′14″E | 1.14 | 1.01 | 0.86 | 0.60 | 2635 | 2725 | 2845 | 3085 | 3272 | 3333 | 3397 | 3426 |
| Northern Slope | |||||||||||||
| RUS_1/G042460E43239N | 43°14′16″N 42°27′35″E | 1.38 | 1.23 | 0.98 | 0.57 | 2777 | 2880 | 2954 | 3103 | 3201 | 3227 | 3267 | 3333 |
| RUS_2/G042752E43244N | 43°14′38″N 42°44′48″E | 1.99 | 1.83 | 1.56 | 1.10 | 2556 | 2686 | 2770 | 3185 | 3545 | 3567 | 3610 | 3676 |
| RUS_3/G042782E43211N | 43°12′40″N 42°46′34″E | 0.79 | 0.70 | 0.56 | 0.23 | 2847 | 2889 | 3018 | 3190 | 3173 | 3210 | 3235 | 3334 |
| RUS_4/G043403E43008N | 43° 0′52″N 43°24′34″E | 2.57 | 2.38 | 2.11 | 1.70 | 2498 | 2585 | 2680 | 3060 | 3270 | 3310 | 3372 | 3626 |
| RUS_5/G043772E42828N | 42°49′47″N 43°46′20″E | 2.21 | 2.11 | 1.92 | 1.43 | 2786 | 2825 | 3100 | 3388 | 3604 | 3615 | 3634 | 3705 |
| RUS_6/G043765E42614N | 42°36′51″N 43°45′39″E | 1.22 | 1.06 | 0.88 | 0.55 | 2705 | 2835 | 2960 | 3065 | 3124 | 3176 | 3201 | 3248 |
Disclaimer/Publisher’s Note: The statements, opinions and data contained in all publications are solely those of the individual author(s) and contributor(s) and not of MDPI and/or the editor(s). MDPI and/or the editor(s) disclaim responsibility for any injury to people or property resulting from any ideas, methods, instructions or products referred to in the content. |
© 2025 by the authors. Licensee MDPI, Basel, Switzerland. This article is an open access article distributed under the terms and conditions of the Creative Commons Attribution (CC BY) license (https://creativecommons.org/licenses/by/4.0/).
Share and Cite
Tielidze, L.G.; Mackintosh, A.N.; Gavashelishvili, A.; Gadrani, L.; Nadaraia, A.; Elashvili, M. Post-Little Ice Age Equilibrium-Line Altitude and Temperature Changes in the Greater Caucasus Based on Small Glaciers. Remote Sens. 2025, 17, 1486. https://doi.org/10.3390/rs17091486
Tielidze LG, Mackintosh AN, Gavashelishvili A, Gadrani L, Nadaraia A, Elashvili M. Post-Little Ice Age Equilibrium-Line Altitude and Temperature Changes in the Greater Caucasus Based on Small Glaciers. Remote Sensing. 2025; 17(9):1486. https://doi.org/10.3390/rs17091486
Chicago/Turabian StyleTielidze, Levan G., Andrew N. Mackintosh, Alexander Gavashelishvili, Lela Gadrani, Akaki Nadaraia, and Mikheil Elashvili. 2025. "Post-Little Ice Age Equilibrium-Line Altitude and Temperature Changes in the Greater Caucasus Based on Small Glaciers" Remote Sensing 17, no. 9: 1486. https://doi.org/10.3390/rs17091486
APA StyleTielidze, L. G., Mackintosh, A. N., Gavashelishvili, A., Gadrani, L., Nadaraia, A., & Elashvili, M. (2025). Post-Little Ice Age Equilibrium-Line Altitude and Temperature Changes in the Greater Caucasus Based on Small Glaciers. Remote Sensing, 17(9), 1486. https://doi.org/10.3390/rs17091486