Article

Testing the Applicability of Drone-Based Ground-Penetrating Radar for Archaeological Prospection

1
Z V—Zentrallabor & Geo-Erkundung, Bavarian State Department of Monuments and Sites (BLfD), Hofgraben 4, 80539 Munich, Germany
2
Institute for Geophysics, Department for Earth and Environmental Sciences, Ludwig-Maximilians-University Munich, Theresienstr. 41/IV, 80333 Munich, Germany
3
Drone It GmbH, Dieselstraße 21, 85232 Bergkirchen, Germany
*
Author to whom correspondence should be addressed.
These authors contributed equally to this work.
Remote Sens. 2025, 17(9), 1498; https://doi.org/10.3390/rs17091498
Submission received: 25 February 2025 / Revised: 7 April 2025 / Accepted: 10 April 2025 / Published: 23 April 2025

Abstract

:
Ground-based ground-penetrating radar (GPR) has been applied successfully for decades in archaeological geophysics. However, there are sometimes severe problems arising in cases of rough terrain, permission to enter a site, or due to vegetation. Other issues may also make it impossible to use conventional ground-based GPR. Therefore, mounting the GPR antenna below a drone could be a potential alternative. Successful applications of drone-based GPR have already been reported, e.g., in the fields of geological mapping, glaciology, and UXO-detection. However, it is not clear whether faint archaeological remains can also be mapped using this approach. In the survey discussed below, we tested such a drone-based GPR setup at an archaeological site in Bavaria, where well-preserved Roman foundations at a shallow depth are known from previous geophysical surveys with magnetics and ground-based GPR. The aim was to evaluate the possibilities and problems arising with this new approach through a comparison with the afore-mentioned data, obtained in previous ground-based surveys of this site. The results show that under certain circumstances, the archaeological remains can be resolved while using a drone. However, the remains are much harder to detect with a lower degree of resolution and survey setup and acquisition time play a crucial role for a successful survey. Especially relevant are two factors: First, the correct choice of profile orientation, as there are strong reflections caused by near-surface features (like field boundaries) due to decoupling the antenna from the ground. Second, a very dry soil is mandatory, as otherwise too much signal is lost at the air-ground-interface. Considering these factors, drone-based GPR represents a valuable tool for modern archaeological geophysics.

1. Introduction

Three major geophysical methods are common for non-destructive archaeological prospection. In addition to magnetometry and resistivity prospection, which pioneered the discipline in the 1950s especially in the UK [1,2], researchers rely on ground-penetrating radar (GPR). This technology has become widespread in the course of the development of high-capacity electronic components during and after the 1970s. The first successful results were published at this time, for example, in the USA [3,4], and at the Gizeh pyramids in Egypt [5], Israel [6], and El Salvador [7].
Nearly all surveys up to this point have been based on terrestrial platforms, i.e., with sleds, hand-pushed carts or, within recent years, motorised vehicles. However, sometimes problems can be caused by rough and uneven terrain or higher vegetation. These factors prohibit a sufficient ground coupling of the GPR antennas. Further difficulties can arise when survey teams lack access to the study areas due to a refusal of the owner or due to swampy ground that causes the antenna to sink. For several years now, the rapid development of airborne drone systems and technologies has enabled researchers to mount survey devices underneath an unmanned-aerial vehicle (UAV) and lift it from the ground during the survey to avoid these problems. Furthermore, such approaches could possibly increase the size of survey areas and reduce the time required for data collection. In the case of magnetometry, this method of drone-based archaeological geophysics has been quite established for several years (e.g., [8,9,10,11,12,13]). However, corresponding drone-based GPR surveys have not been widely reported. Some results are published in connection with geology [14,15,16], hydrology [17], glaciology [18,19,20,21,22], mining [23], object localization [24,25], detection of unexploded ordnance (UXO) [26,27,28] or forensics [29]. A quite comprehensive overview on applications of drone-based geophysics with multiple different methods has been published in [30]. In archaeological prospection, only some trials have been reported so far (e.g., [14,31,32,33]). Most studies could only enable the detection of anomalies in single profiles, not a visualisation, as depth slices and these are the most common results reported in connection with ground-based GPR data in archaeology.
Based on the prior work in this area, the survey discussed below was undertaken in order to test the applicability of drone-based GPR for a direct identification of buried archaeological stone walls. We evaluated advantages and limitations of this method. Therefore, methodological aspects such as survey orientation and the influence of decoupling the antenna from the ground and soil parameters are analysed in detail. To evaluate the data quality, a GIS-based visual comparison with ground-based GPR data of the same site is executed.

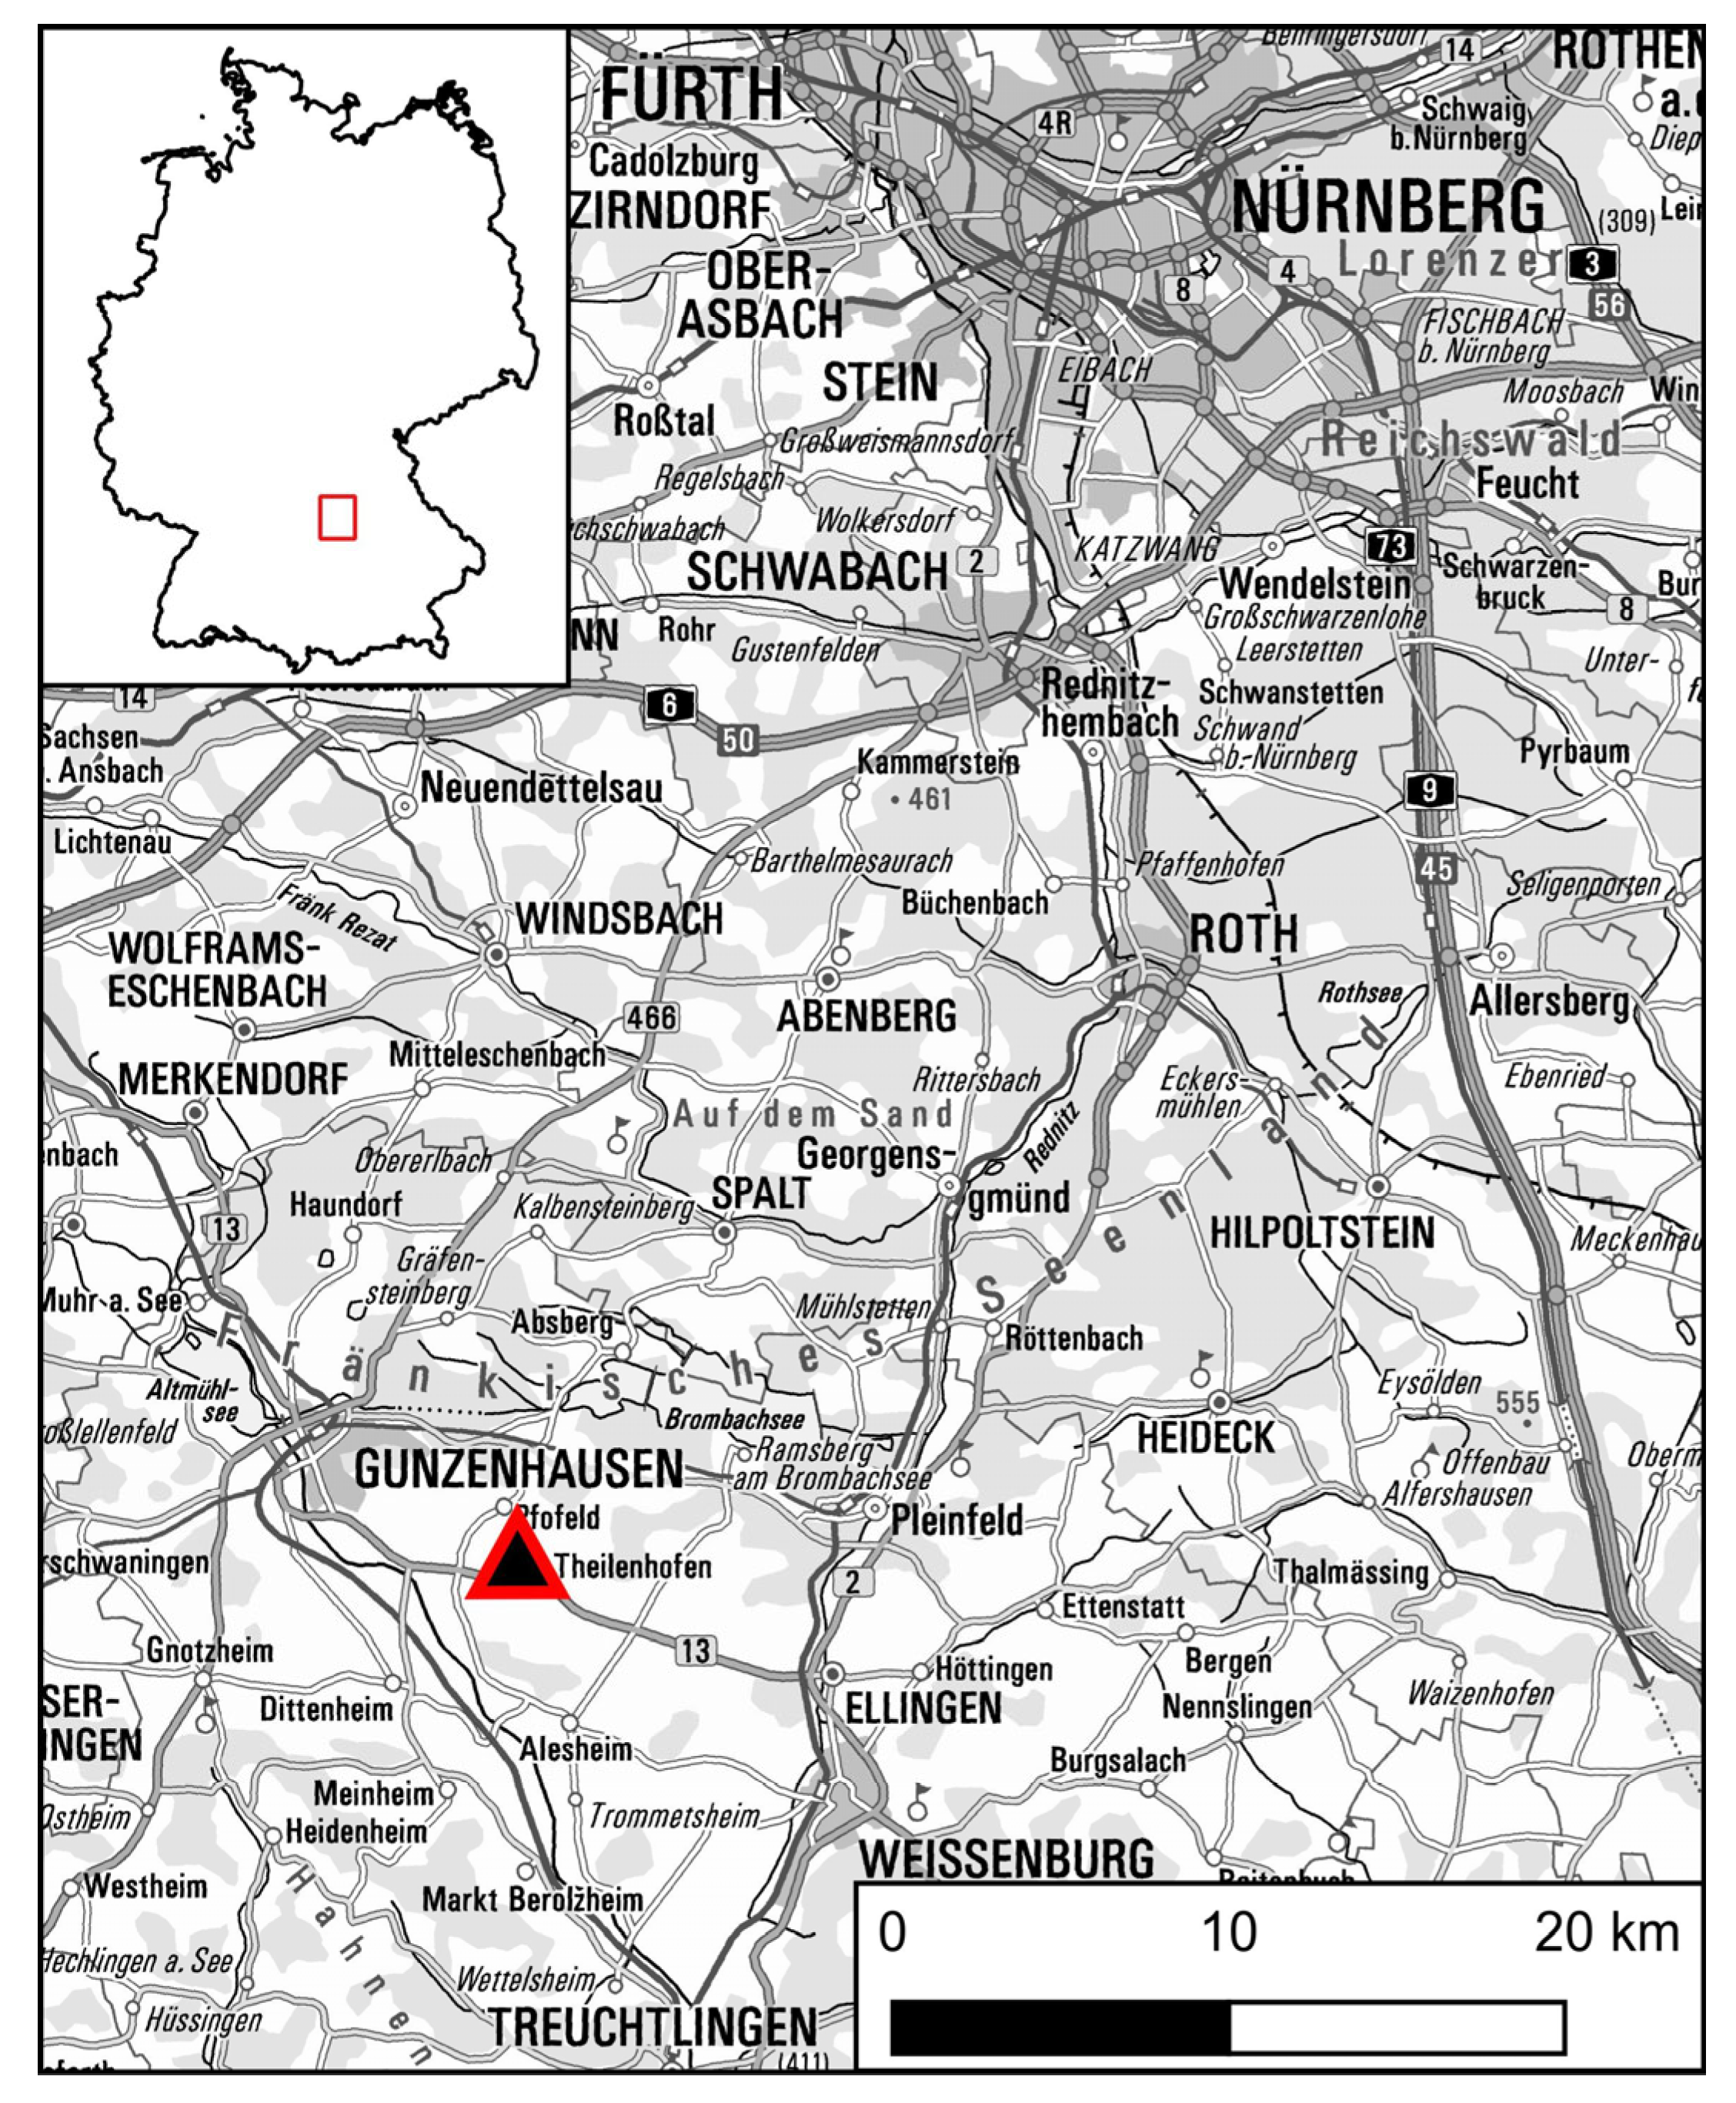
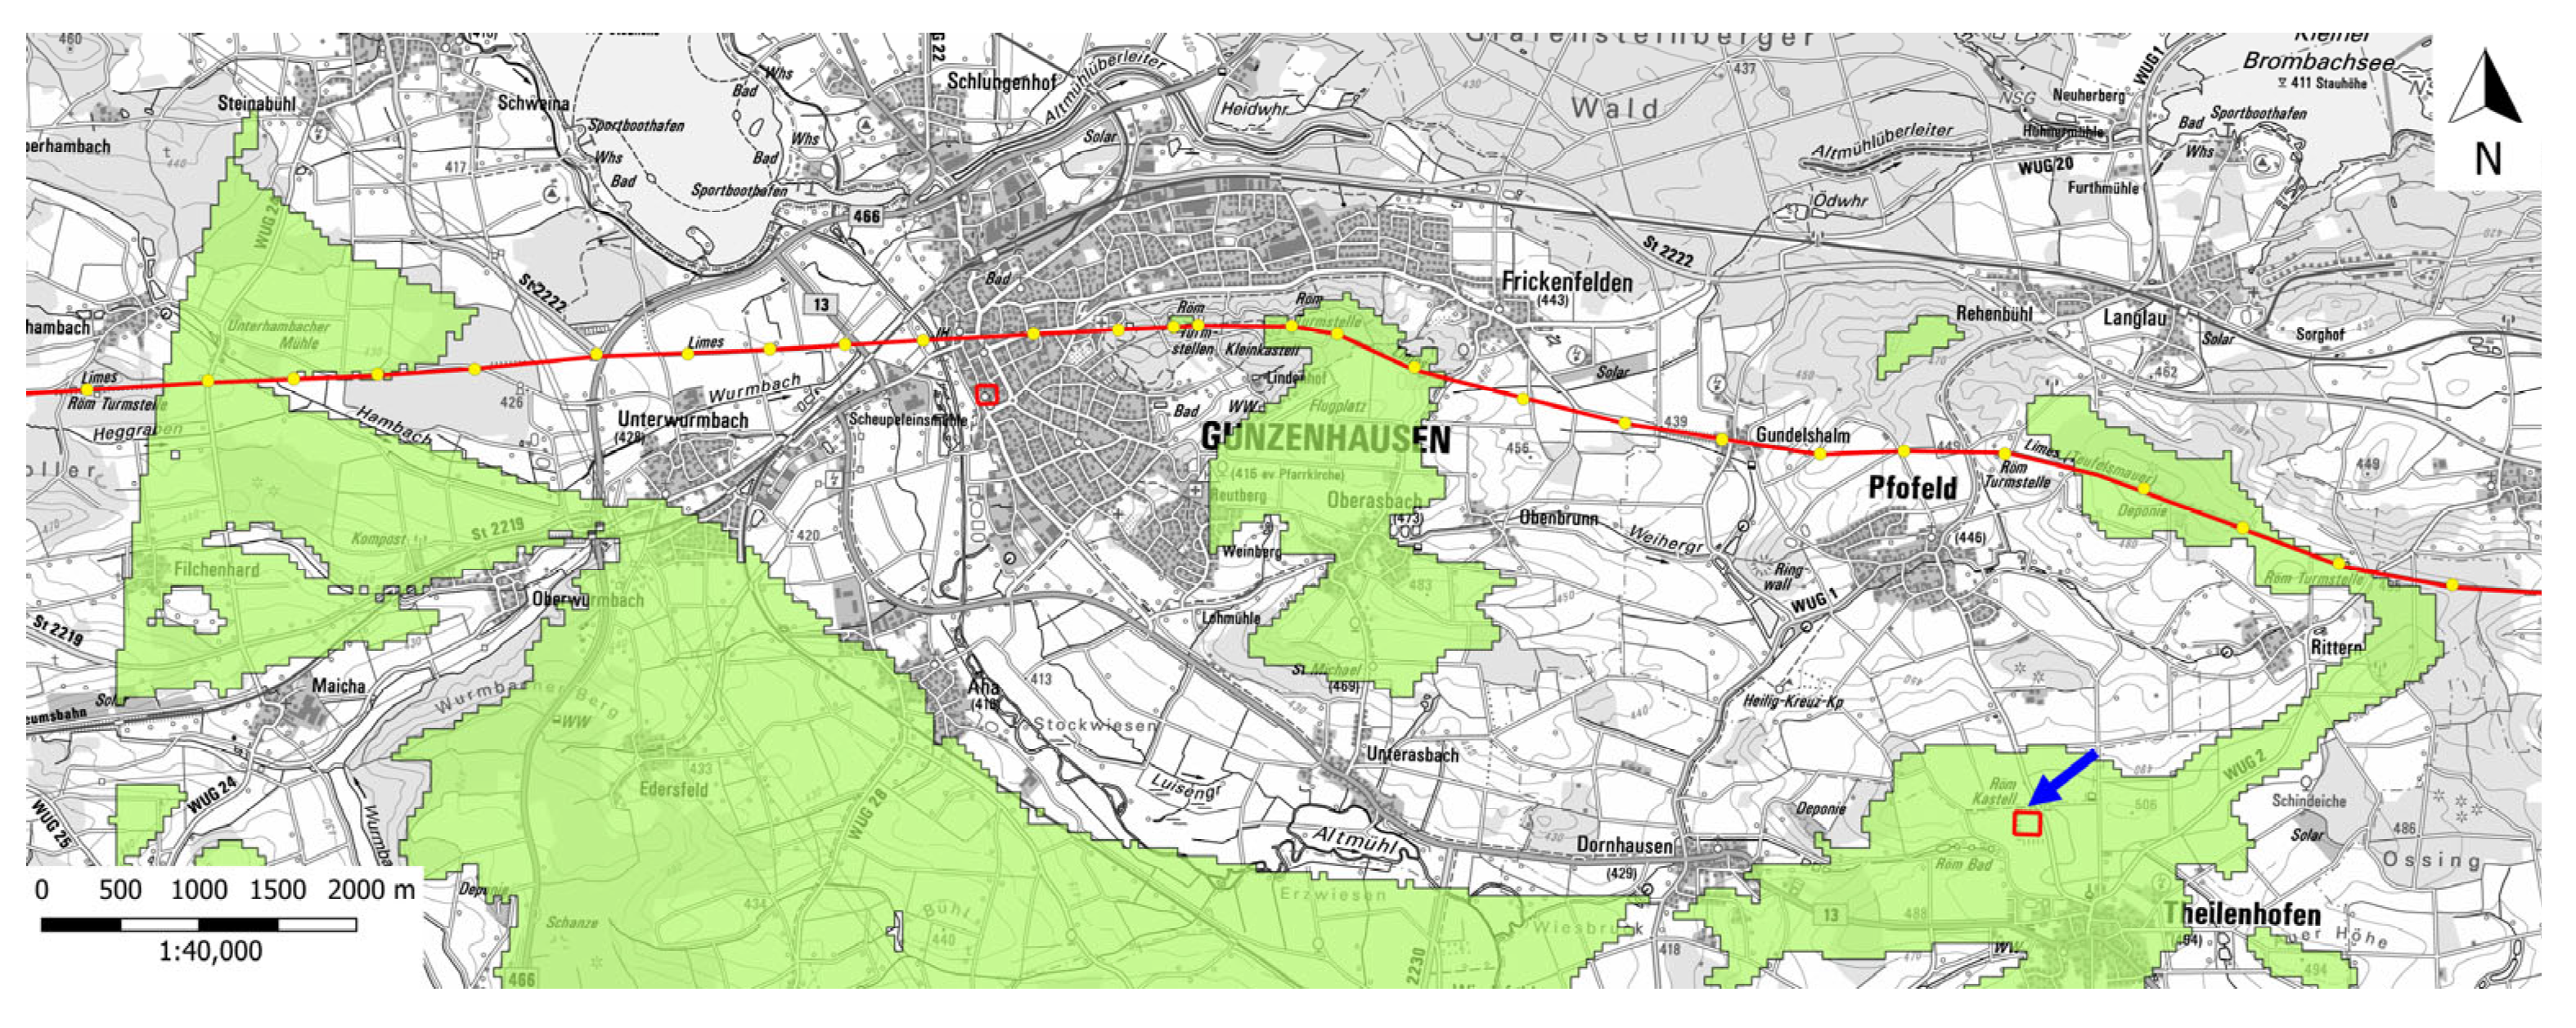
2. Site Location and Archaeological Background

2.1. Description of the Test Site

We chose the Roman fortress Theilenhofen as a suitable test site for drone-based GPR in the archaeological context, as the remains are located at a shallow depth of 40–150 cm (see Section 6.1). The site is presently used as grassland that is mowed once every few weeks. Therefore, the area is accessible regularly and can be used for repeated surveys. In addition, the preserved Roman remains are well known from a multitude of geophysical surveys and even small-scale excavations. Hence, Theilenhofen serves as our standard test site for novel technologies, including drone-based magnetometry [12]. The geological subsurface is characterised by Jurassic limestone formations underlying Calcaric Cambisol soil and forms ideal conditions for GPR investigations.
The site is located ca. 700 m northwest of the modern village of Theilenhofen (Lkr. Weißenburg-Gunzenhausen, Middle Franconia, Bavaria) (Figure 1). It is situated on an approximately 90 m high plateau above the river Altmühl. Hence, in Roman times, the area was favourable because of a 360° unobstructed view, especially towards the Rhaetian Limes which was located about 2.2 km away. The fortress provided a clear intervisibility with 9 to 10 watchtowers [34,35,36] (Figure 2). The Roman name of the fortress had been Iciniacum, being mentioned in the only preserved Roman map, the Tabula Peutingeriana. The first wooden fortification was built around 100 AD; the first stone constructions are dated to the middle of the 2nd century AD in the Hadrianic-Antonin period [37,38]. Until the 3rd century AD, the Cohors III Bracaraugustanorum was garrisoned there. This unit was supported by cavalry, as archaeological findings have proven [35]. The fortress Theilenhofen was destroyed and abandoned in around 254 AD [39,40].
Intact remains of the Roman walls were still visible until the 17th century, when the local landowners removed them [34]. Between 1892 and 1895, the “Reichslimeskomission” (ORL, i.e., German Limes Institution) executed the first excavation in Theilenhofen under the supervision of H. Eidam. These archaeological surveys revealed parts of the fortification, a horreum (i.e., a Roman storage building) and the principia (i.e., the administrative headquarter) [34,35,42]. In 1976, O. Braasch and H. Himsolt detected the Roman remains for the first time as crop marks in aerial photographs [37]. Subsequently, it has been documented in a large number of aerial images stored in the BLfD archive, and there are more than 150 photos showing this archaeological site.
In addition, J.W.E. Fassbinder and his team of the BLfD executed a caesium magnetometry survey of the whole site in 2007/08. The corresponding results are published in [42,43] and, therefore, will not be described here in further detail. The drone-based GPR test concentrated on the well-preserved principia of the fortress, and findings pertaining to this structure will be described in the following section.

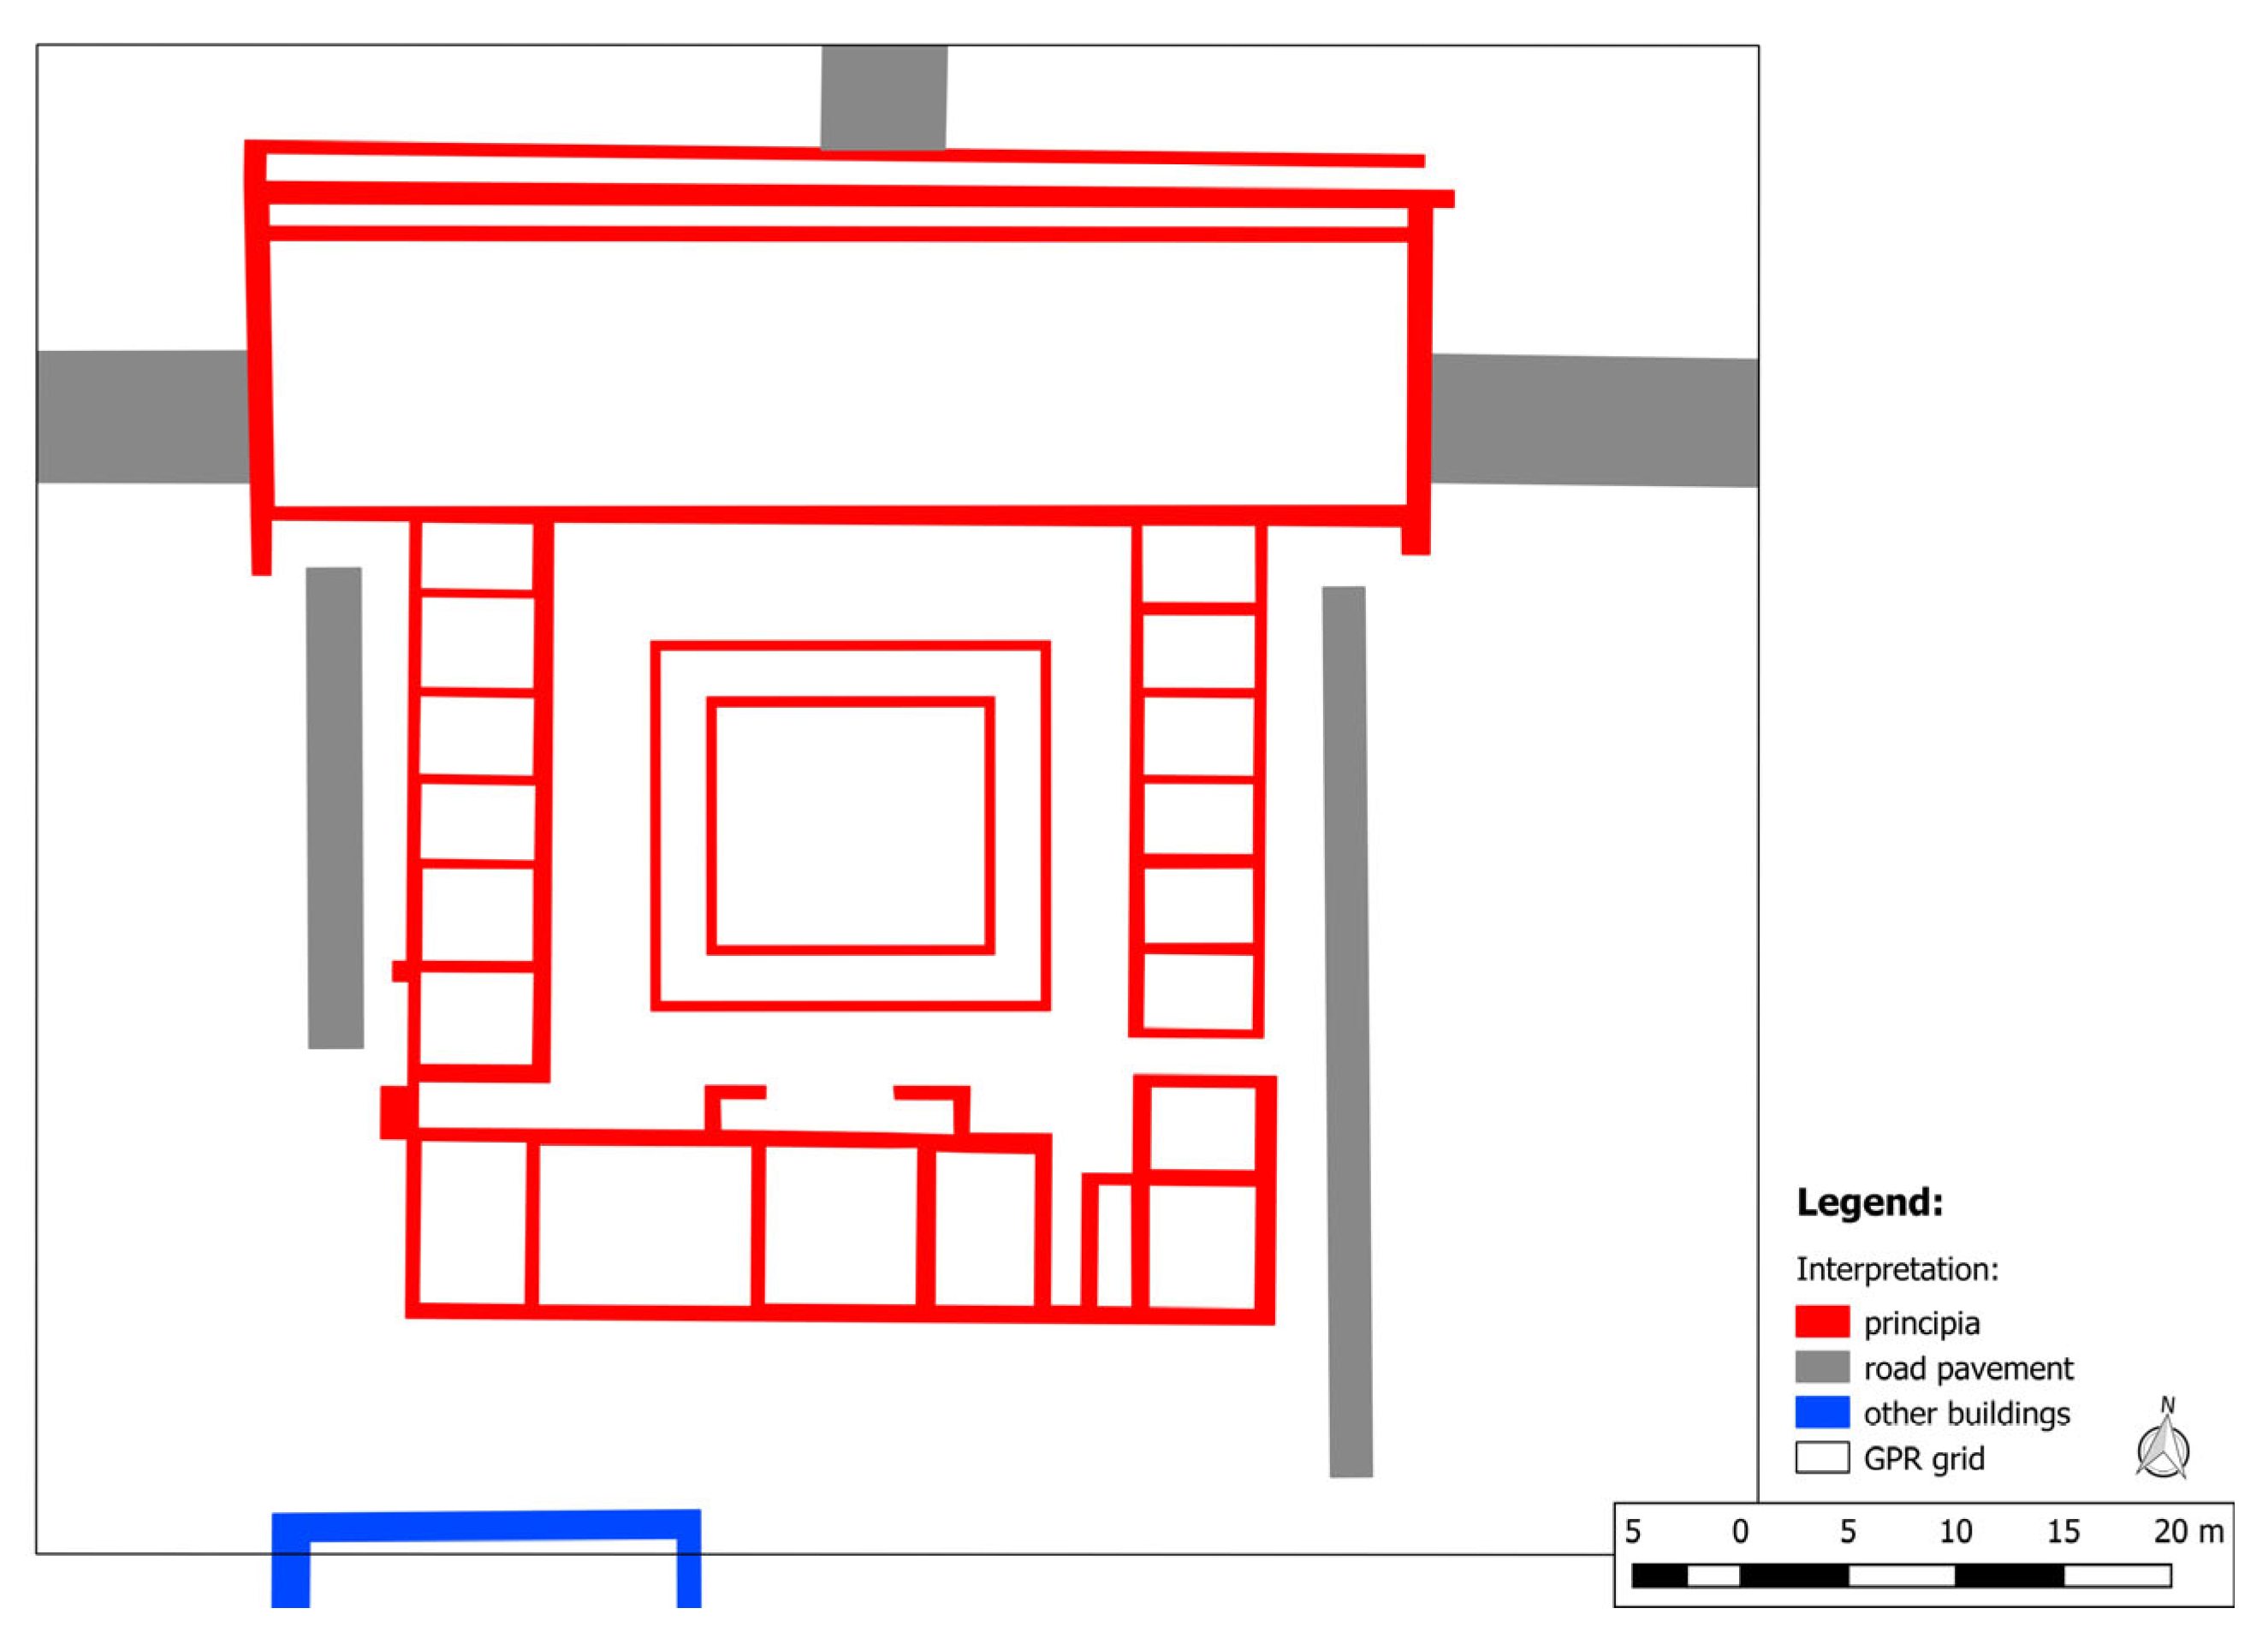
2.2. Introduction to Roman Principia

Principia are the centrally located headquarters of Roman fortresses. They represent the administrative and religious centre of the forts and, therefore, were notable due to their size, architecture, and position at the intersection of the main roads [44]. Such buildings have been found in connection with Roman forts since the Augustean Age and have had a standardised layout with three main parts since the middle of the 1st century AD [44,45]: In front of the actual principia, especially in the Germanic Provinces and Raetia, there is often an open vestibule oriented towards the via principalis. Sometimes this entrance hall spans the whole width of the via principalis and protrudes beyond both sides of the actual principia. The columns of the vestibule were erected on single stone bases or on shallow threshold walls [44,46]. Johnson [44] assumed that the entrance hall was mainly used as a meeting venue and for the purposes of legal appeals, as it usually was too small to be used for military purposes. Behind the vestibule, a courtyard can be found that was surrounded by an open gallery. In one of the corners of this atrium, a well was often built. In cases where a very deep-lying groundwater table or a hard rock represented the subsurface material, it was substituted by a water basin in the centre of the courtyard [44,46]. The atrium was encircled by a multitude of small rooms that served as offices, registrar’s offices (= tabularia) or armoury (= armamentaria) [44,46]. One unique room in the rear row of rooms was usually used as a sanctuary (= aedicula) that often included a strongroom (=aerarium). Between the rear row of rooms and the atrium, a transverse hall was sometimes built [44,46]. The size of the principia was quite variable and ranged from 14 × 11 m (e.g., fort in Hesselbach, Hessen) up to 60 × 45 m (e.g., the Alen forts in Heidenheim and Aalen, both Baden-Württemberg). At the Upper Germanic-Rhaetian Limes, the length of each side was normally between 35 m and 45 m [44]. A virtual reconstruction of a typical principia in Rhaetia illustrating the layout described above is shown in Figure 3.

3. Methodology

GPR is an active geophysical survey method that is based on the transmission and reflection of electromagnetic waves in the soil subsurface. The theoretical background of GPR, and the corresponding methodology applied to archaeological geophysics, are comprehensively described in several textbooks (e.g., [47,48,49]). Hence, this section will mainly focus on the methodological insights that are relevant for drone-based GPR surveys: These are material properties, signal loss through antenna decoupling, and signal polarisation.

3.1. Material Properties and Signal Reflection

The transmission and propagation of the electromagnetic signal in the subsurface depends on the prevailing material parameters and is reflected back to the antenna at significant material boundaries. The main governing parameters of the soil are the dielectric constant εr and the conductivity σ. A higher dielectric value implies more displacement of charges within the material. This displacement can also be a result of the conductivity within the material. Materials with higher electrical conductivity will tend to attenuate the signal. Along with reducing the penetration depth, attenuation will create poor GPR data [50]. For example, water and clays have higher dielectric permittivity compared to dry sand and other rocks (see Table 1). The presence (or absence) of water and clay in the subsurface largely defines the resolution and penetration depth when working within the GPR frequency range and the method is best applicable in areas consisting of low-electrical-loss material [50,51].
The reflection coefficient is defined as the proportion of energy being reflected at the interface between two materials with different dielectric values [47,48]. The reflected energy (i.e., ‘Reflection Coefficient’ R) is considered as a ‘loss’ and can be calculated using Equation (1) [47]:
R = ε r 1 ε r 2 ε r 1 + ε r 2
with εr1 = dielectric value of material 1 and εr2 = dielectric value of material 2. This equation is only valid for antenna frequencies f ≥ 100 MHz. However, these antennas are normally used for GPR surveys in archaeological context [52].
Mounting the GPR antenna below a drone means a decoupling of the system from the ground, resulting in a first reflection being created at the air–ground interface [53]. It is quite strong, as the dielectric value of air is much lower than that of every geological material, especially when water is present in the ground (see Table 1). The dielectric value of the soil normally cannot be determined in situ. Therefore, an indirect investigation by other methods such as Time-Domain Reflectometry (TDR) has to be chosen. Details of the methodological principles behind TDR in archaeological prospection are summarised, e.g., in [54,55]. TDR devices provide values for the current volumetric soil moisture Θ and conductivity σ. Through the so-called ‘Topp-equation’, εr can be calculated [56]:
Θ = 5.3 × 10 2 + 2.92 × 10 2 ε r 5.5 × 10 4 ε r 2 + 4.3 × 10 6 ε r 3
ε r = 3.03 + 9.3 Θ + 146 Θ 2 76.7 Θ 3
This equation can be rearranged to [56]:
The part of the reflected signal created at the air–ground interface has to be regarded as a ‘loss’ because it does not penetrate, and, therefore, bears no information about the buried archaeological remains.
During both of the surveys presented below (executed in summer 2022 and 2023) the soil moisture was quite low due to the dry and hot weather in the days preceding each survey. The TDR surveys reveal a dielectric value of 4.5 for the ground-based data and 7.9 for the drone-based data. Although the latter value is twice as large as the first, both indicate a very dry soil and the influence of the remaining water should be minimal. Therefore, the two data sets show comparable results.
Inserting the dielectric value of air (εr = 1) and the TDR-recorded value of the soil in Theilenhofen (εr = 7.9) into Equation (1), indicates a reflection coefficient R at the air-ground interface of 0.48. This means that roughly half of the emitted energy is already lost here and cannot be used for anomaly detection. Similar values were estimated previously by Forkmann [57].

3.2. Signal Polarisation

Polarisation describes the orientation and strength of the field vector as the wave propagates and interacts with heterogeneities and buried targets [58]. Due to the vectorial nature of the electromagnetic waves, their polarisation depends on two factors: the orientation of the transmitter and receiver with respect to each other and the orientation of the buried structures or objects in relation to the survey direction. Considering a single channel bowtie antenna (as is normally used for standard survey configurations), the transmitter and receiver are aligned parallel to each other [58]. The polarisation loss of energy will be at a minimum, when the object is parallel to the orientations of the antennas (i.e., perpendicular to the survey direction) [59]. For drone-based GPR investigations, polarisation effects have to be taken into account carefully. The reason is that potential reflection anomalies at the surface (e.g., field boundaries) being oriented perpendicular to the survey direction will dramatically increase the above-mentioned signal loss.

4. Survey Instrumentation and Layout

4.1. Ground-Based GPR Survey

The ground-based survey was executed in July 2022 with a GSSI SIR-4000 and an analogue 400 MHz antenna (Geophysical Survey Systems Inc., GSSI, Nashua, NH, USA) (Figure 4a). This is a single-channel bowtie antenna for surveys in common-offset configuration. For the detailed antenna specifications, see Table 2. The grid of 80 × 70 m size was mapped in parallel profiles of 50 cm distance and an inline sample interval of 2 cm. The survey direction was oriented north–south and the profiles were registered in a zigzag mode. To guarantee a full coverage and exactly parallel lines, ropes marked the current profile. Afterwards, the grid’s corners were georeferenced with a RTK-GNSS-system (Stonex S9T, Nienburg, Germany). One single direction was sufficient for this part of the survey, as the GSSI-antenna radiation pattern had previously been investigated thoroughly.
For a better comparison, the grid was cut to the extent of the smaller drone-based survey area and the profile spacing was artificially enlarged to 1 m during a second period of data processing. This ensured that both data sets were as comparable as possible regarding the detectability of the buried archaeological remains.

4.2. Drone-Based GPR Survey
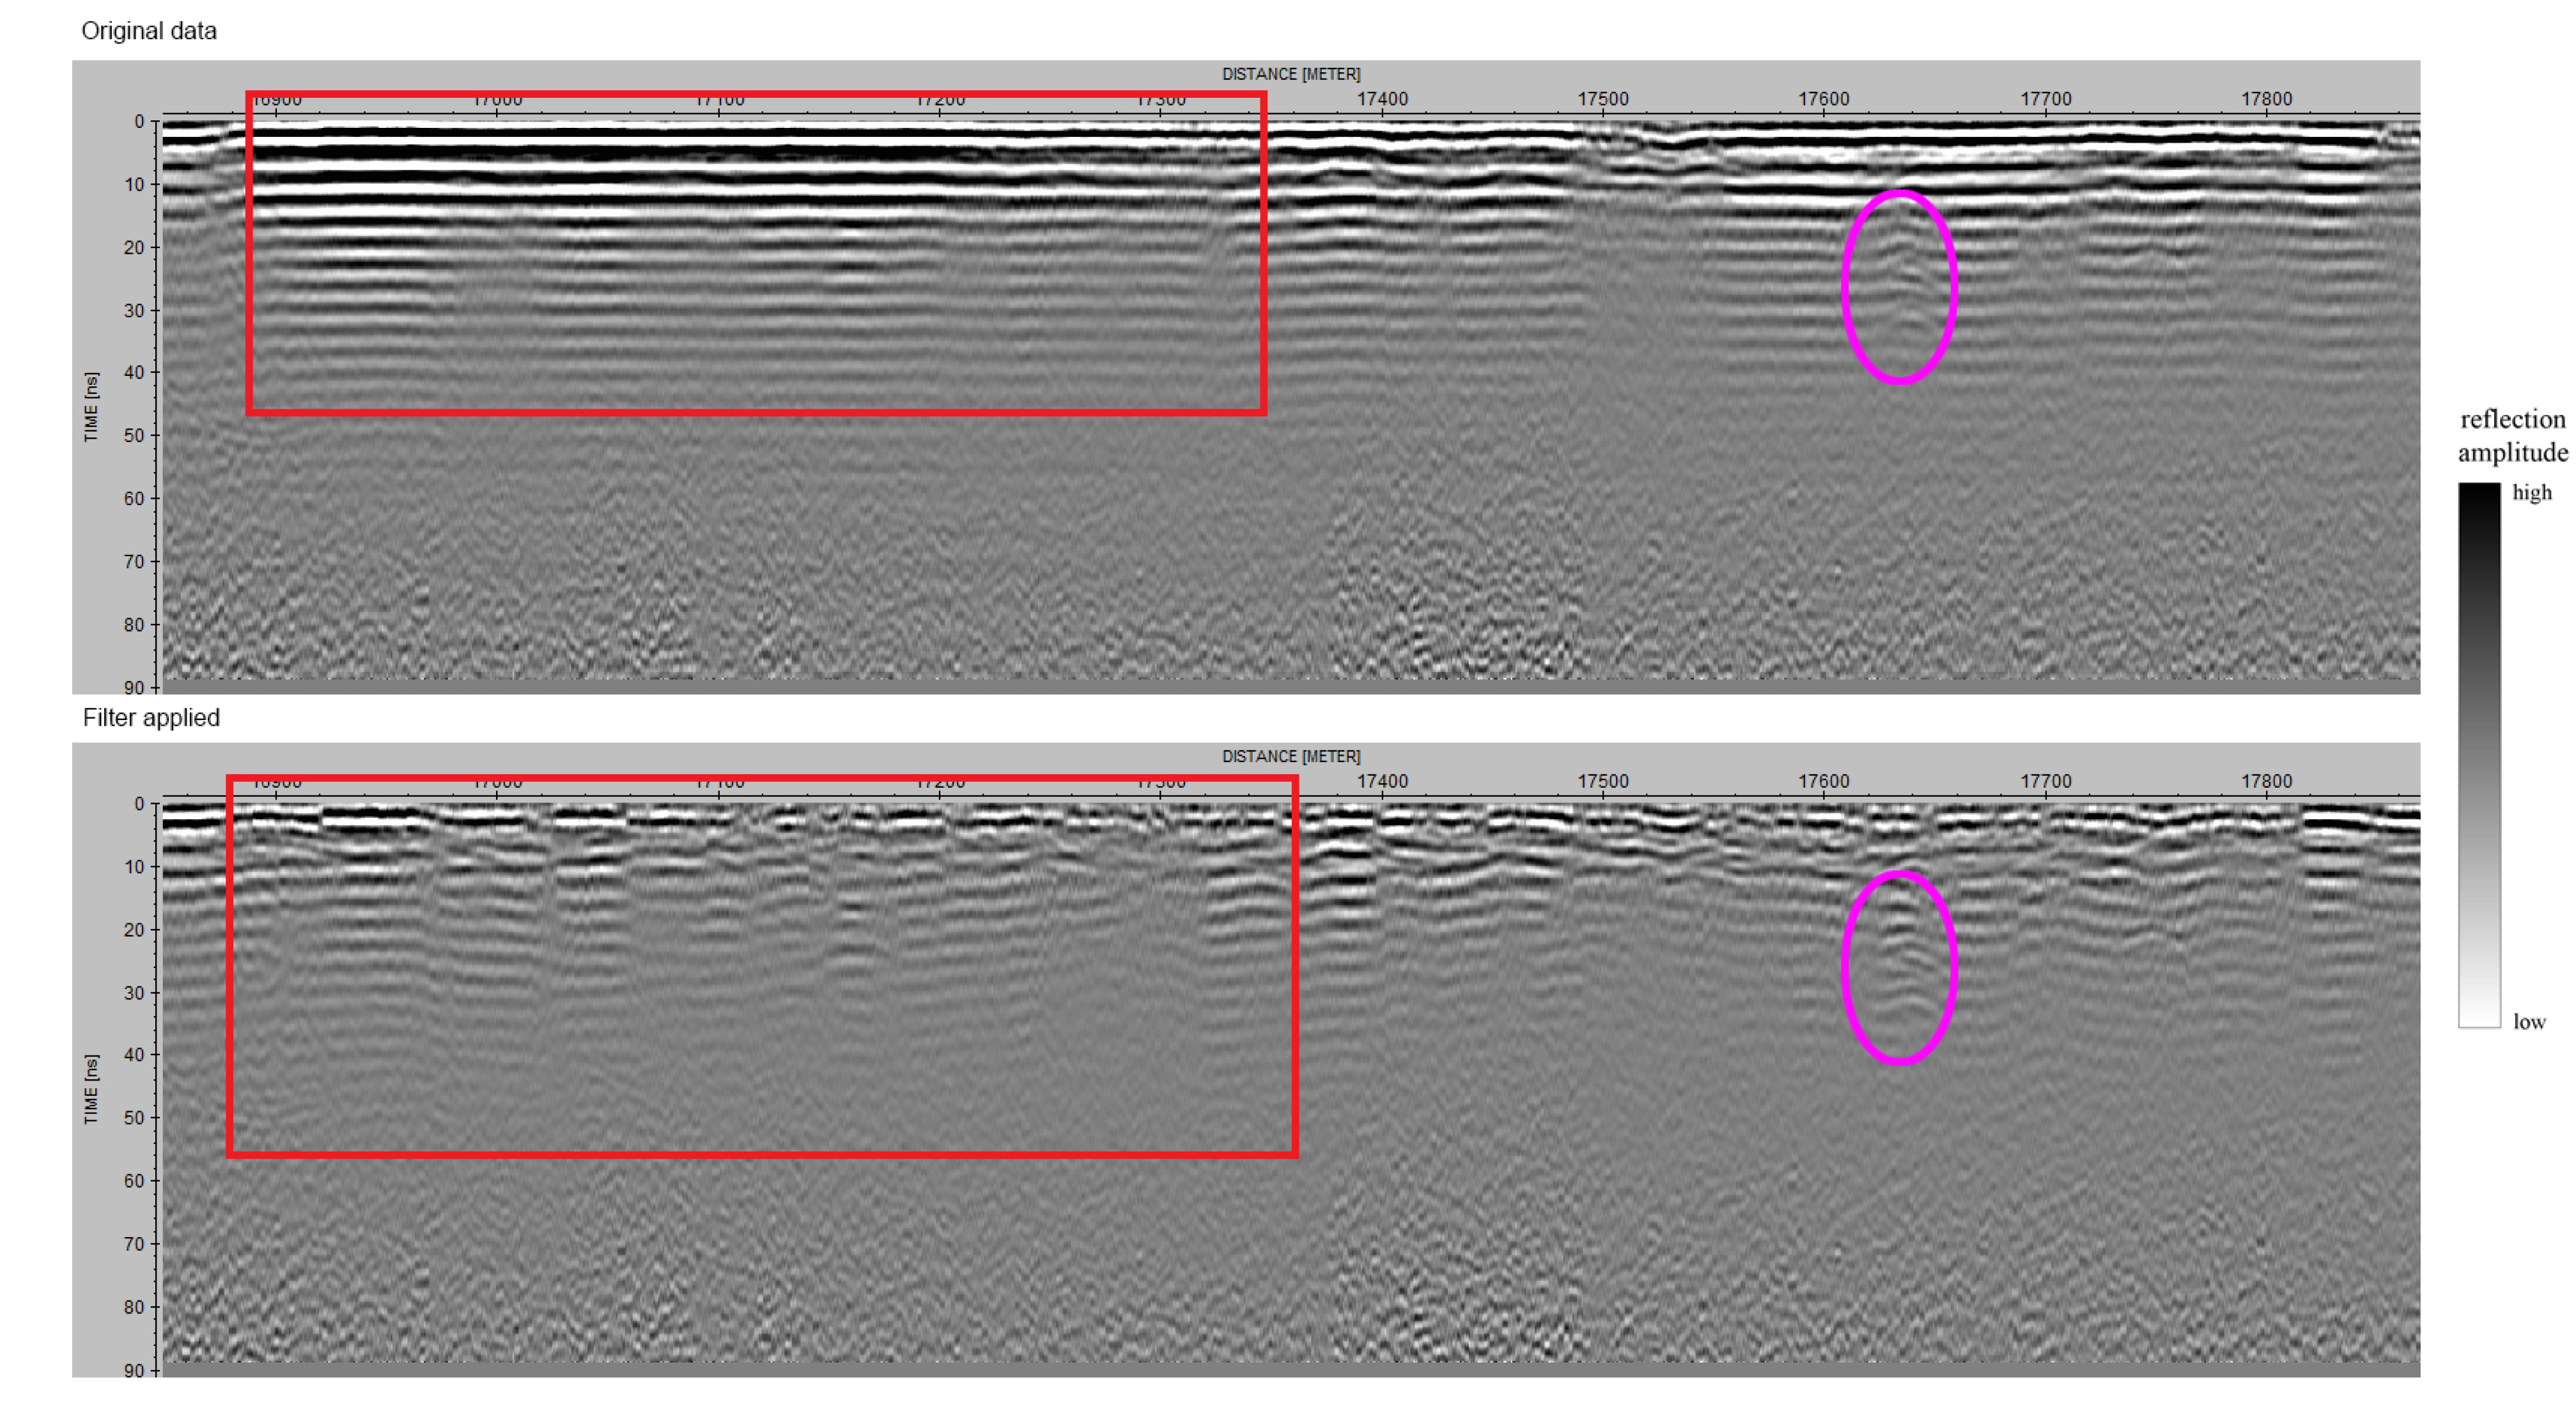
The drone-based survey was conducted in July 2023 under similar soil conditions with a Zond Aero 500 antenna with 500 MHz centre frequency (Radar System Inc., Riga, Latvia) (see Table 2 for further details). This antenna frequency is the most comparable one available with regard to penetration depth and resolution to the used ground-based GPR antenna. The Acecore Technologies NOA 6 hexacopter (Uden, Netherlands) was chosen as the drone platform, as it can carry a payload of up to 20 kg (Figure 4b). The survey was conducted at a flight speed of 2.5 m/s.
Due to the novel experimental test survey, several parameters had to be taken into account. The altitude of the drone is of primary importance. Booth and Koylass [62] suggest a low-altitude flight for precise wave velocity estimates. Therefore, our drone was flown with an automated flight plan, and the antenna was positioned at a constant elevation of 50 cm above ground. This is the lowest safe altitude for a drone to manoeuvre over undulating terrain without any complications. The constant distance to the ground was controlled by an attached laser altimeter. The GPR data were directly georeferenced with the on-board RTK-GNSS coordinates of the drone.
In addition, the drone flight duration is limited by the drone’s battery capacity. This limit was found to be 15–20 min with a GPR antenna payload. As there were only two sets of batteries available for this test survey, the grid size had to be reduced to 50 × 30 m and the profile distance could not be denser than 1 m to cover a reasonably sized area. The reason was that it seemed necessary to cover the grid in cross-grid direction, i.e., in east–west and north–south, as there was no detailed information on the radiation pattern of the Zond-antenna available. Furthermore, through decoupling the antenna from the ground, the influence of the angle between the survey direction and the object extent became even more important due to signal loss at the air–ground interface. Therefore, we decided to put more emphasis on detecting as many archaeological structures as possible and not on obtaining higher resolution results such as50 cm profile spacing.

5. Data Processing

For ground-based GPR data in archaeological prospection, there is a standard processing chain with all relevant steps, which has been developed over several decades. However, for drone-based data there are some slight, but important, changes in the order of the corresponding operations. In addition, some processing steps have to be added. The reasons are mainly due to the strong reflections of the air–ground interface reverberating over the whole travel time. These need to be removed properly to detect the weaker reflections of the buried archaeology underneath. An overview of the processing chains for both data sets executed in the commercial software ReflexW v.10.1 [63] is provided in Table 3. As can be seen, e.g., background noise is removed before increasing the gain of the data. This is necessary because increasing the gain before deleting the background would also intensify the amplitude of the noise and obscure the hyperbolas that are important for the archaeological survey. Due to the far less pronounced noise in ground-based GPR, the gain can be increased here in advance. Actually, this step is often already executed during data acquisition. In the following subsections, the two main differing data processing operations will be explained in more detail.

5.1. Remove Range

The drone-GPR survey was executed in a continuous manner. That means that the data acquisition was started before the first waypoint and stopped after the last one. Therefore, there are also data collected during the approach to the grid, the return to the home position, and of the turns between the parallel survey lines. All of these radar traces were deleted.

5.2. Subtracting Average

Whereas the noise of the first reflection at the air–ground interface can be suppressed quite well with background removal, the corresponding reverberations are still present in the data (Figure 5, upper part). This ringing noise creates nearly horizontal stripes in the radargram. Kim et al. [64] suggest regarding the average trace value of the whole section as the trace containing the ringing noise. The step of ‘subtracting average’ calculates this average value within a given number of traces and deletes it. This processing step is also known as a ‘sliding background removal’. The resulting enhancement of relevant features can be seen in Figure 5 (lower part).

6. Results

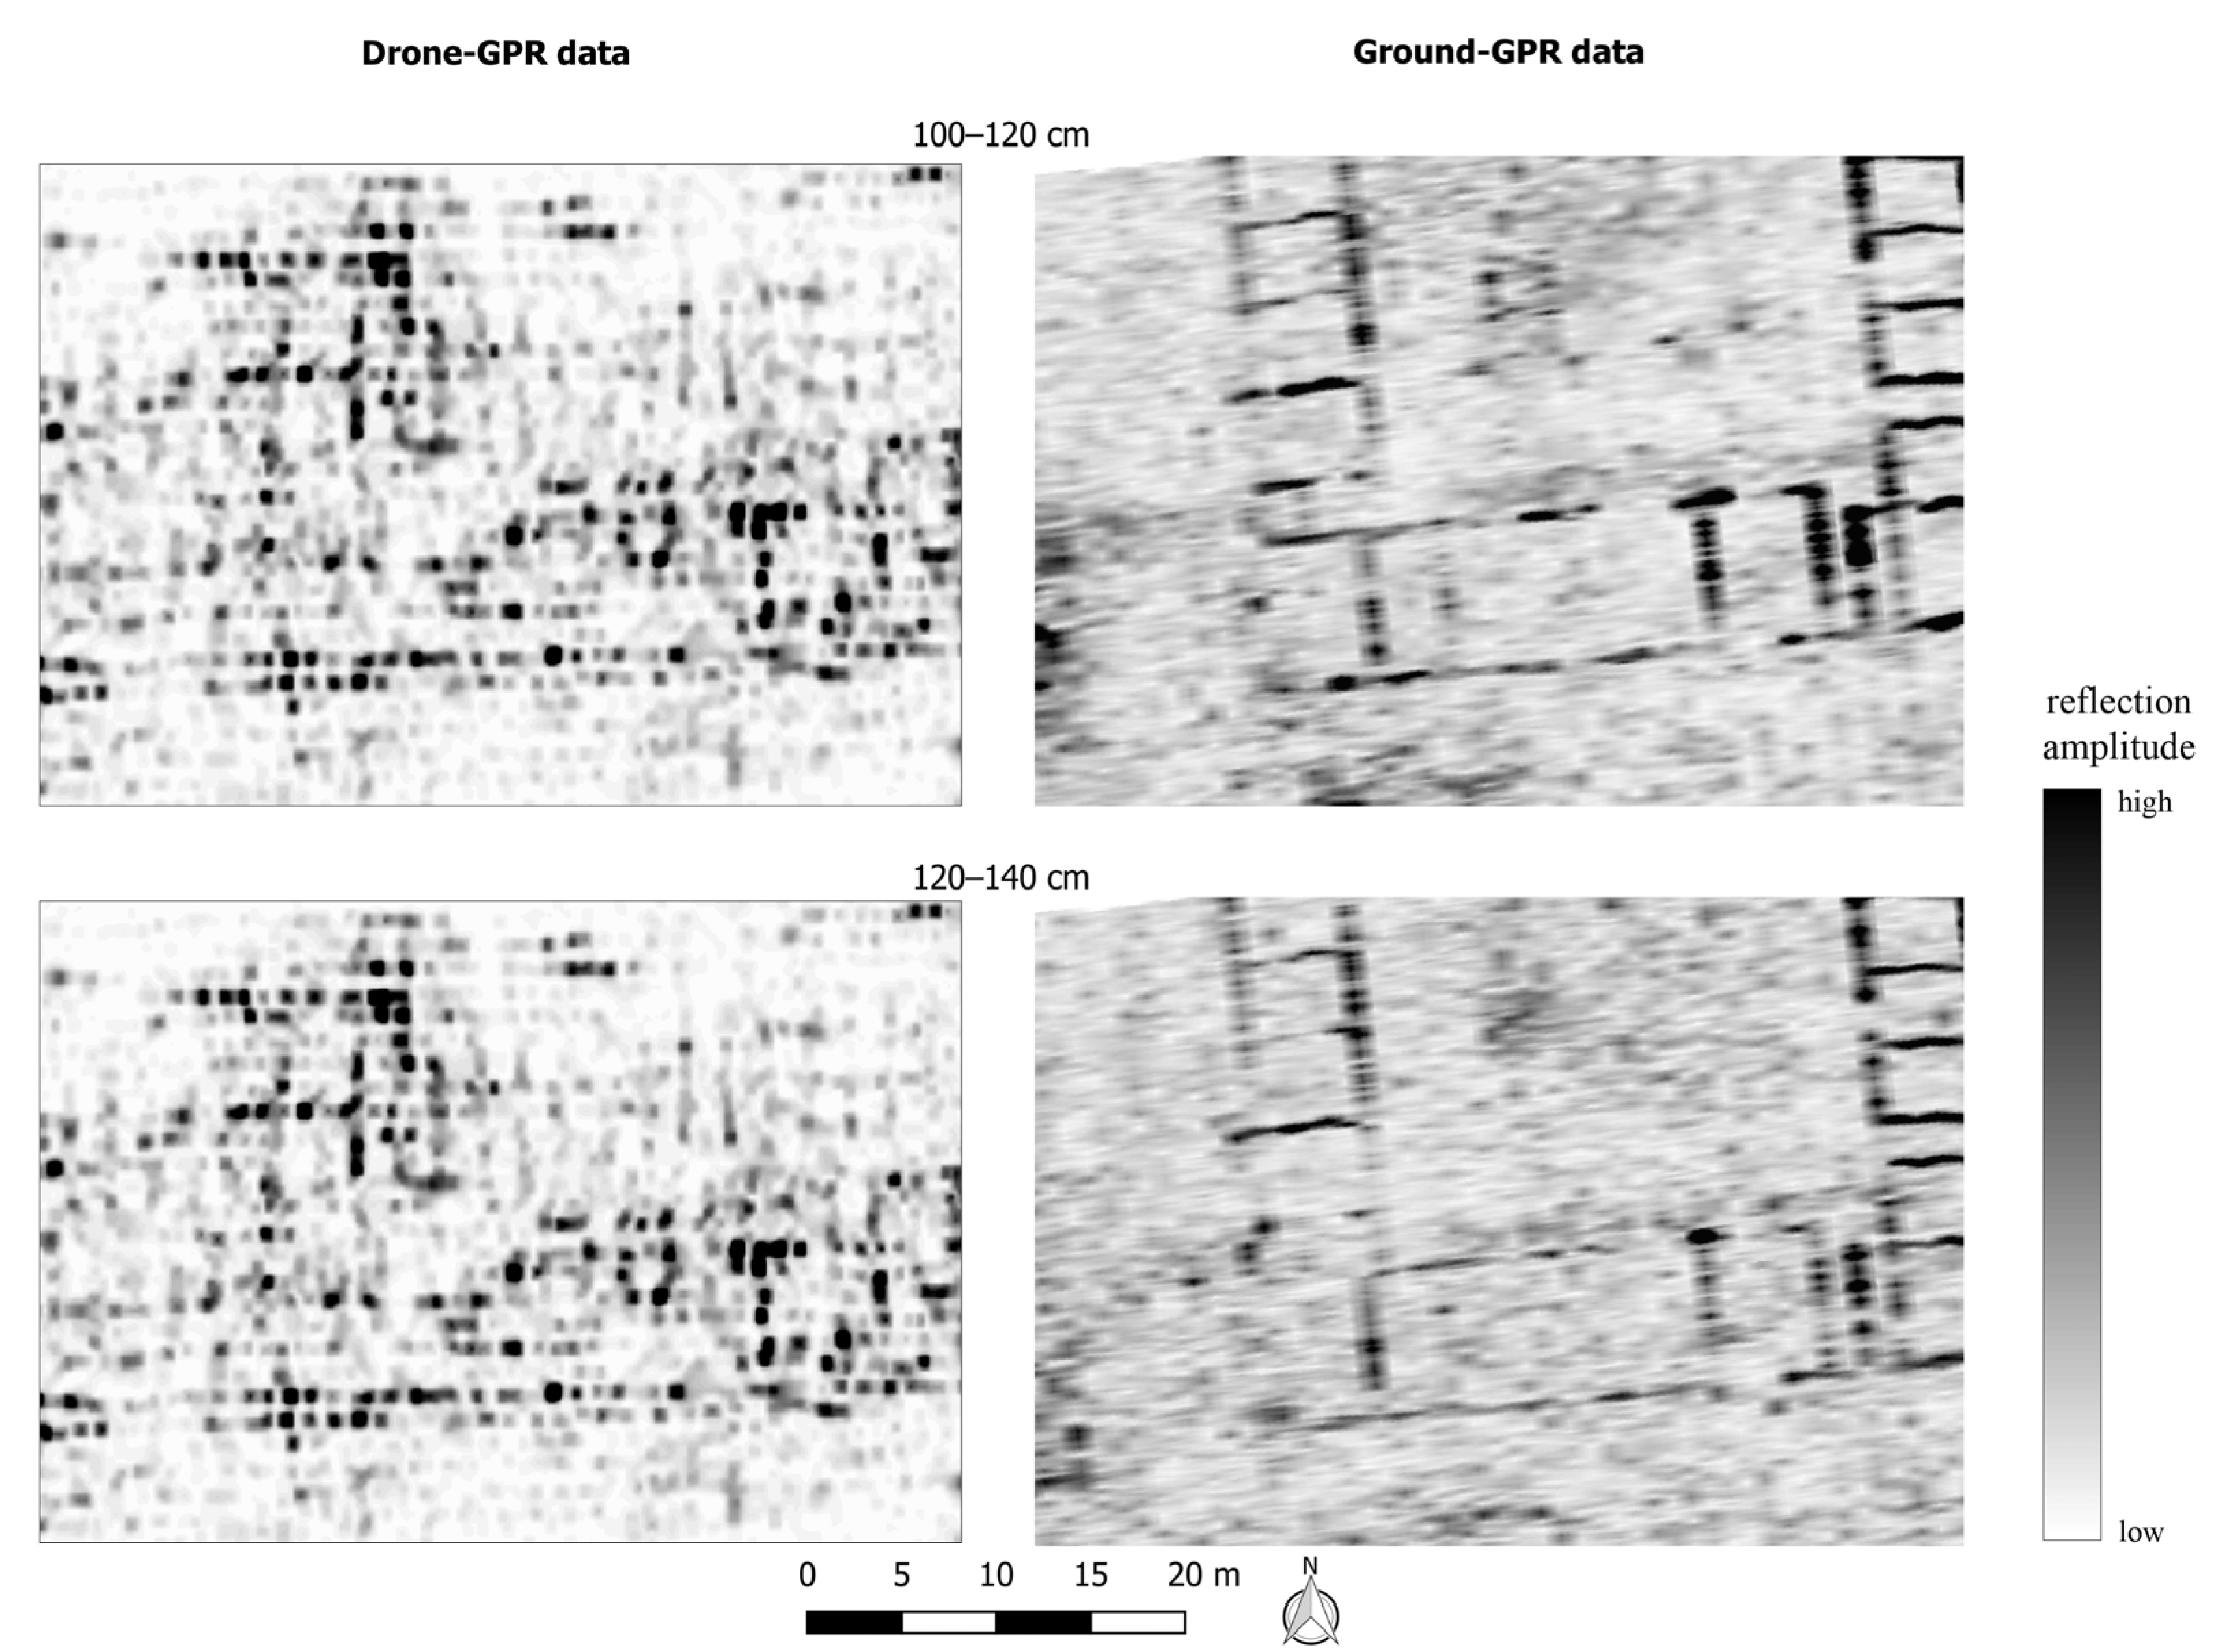
6.1. Ground-Based Data

The survey grid was positioned with regard to the stone-built principia known from the magnetic survey in 2007/08 [42,43]. The GPR data show that the archaeological remains are very well-preserved and covered with a soil layer of 40 cm thickness. The Roman foundations are visible down to a depth of approximately 150 cm, and they gradually begin to vanish below 130 cm. In the topmost depth slices, to a depth of 80 cm below the modern surface, the interior of the principia’s southern rooms shows up as a high-reflective anomaly (Figure 6). These structures can potentially be interpreted as the preserved remains of the Roman floor pavement. Another interpretation could be that these are the remains of the roof’s tiles. However, in this case, similar anomalies should also be visible in the northern entrance hall of the principia. Irrespective of the true origin, it can be stated that the Roman floor level can be found in approximately 80 cm depth and all deeper walls belong to the foundations. This thesis is supported by the fact that the remains of the paving of the east–west main road of the fortress, the so-called via principalis, at both sides of the entrance hall can also be detected only in the uppermost few decimetres and they vanish completely at greater depth.
In total, the interpretation of the principia’s layout, as published by Fassbinder [42,43], can be significantly improved by the GPR survey, as the stone walls are much more visible in radar data than in magnetic survey data due to methodological reasons. The northern part of the building is formed by the vestibule of 53 × 14 m size that served as the entrance gate, assembly hall, and for appeal purposes (Figure 6 and Figure 7). As usual in the Germanic provinces, and especially in Rhaetia [44], the entrance hall in Theilenhofen is much wider than the principia itself and stretches 7 m in both directions. Along the northern wall of the hall, two additional walls can be traced in the data that mark Roman replacement work. These small linear anomalies can be interpreted as the small threshold walls carrying the columns as described in Section 2.2. In the southern part, the room layout of the commandery is clearly visible. These small chambers on both sides of the central courtyard were normally used as offices or armouries and therefore have a comparable small size of ca. 5 × 4 m. The southern limit of the principia is formed by bigger rooms of ca. 5 × 8 m size. The great importance of the central flag sanctuary is expressed by an even bigger size of 7 × 7 m and a small annex towards the courtyard. A quite unusual feature is identifiable in the southeastern corner of the building: next to another small entrance to the central courtyard from the eastern side that is visible as a clear interruption in the walls, one room is significantly smaller and creates an irregular pattern in the southeastern corner. The central courtyard shows up as a strip foundation for supporting pillar locations. It features a thin rectangular wall spanning an area of 13 × 12 m, indicating a former water basin. Such constructions are typical in locations where a rocky subsurface made it difficult to dig a well [44]. The geophysical data does not show any evidence for a transverse hall, as was normally present in Roman principia according to Johnson [44]. Therefore, the fortress in Theilenhofen seems to have lacked this type of structural element. Some remains of further Roman buildings can be identified in the surroundings of the principia. However, they are partly located outside the GPR survey area, as only the principia should be investigated during the survey.

6.2. Drone-Based Data

The drone-based GPR survey concentrated on the southern half of the principia, as the majority of stone walls are located there. Due to the increased profile spacing of 1 m and the fact that the UAV could not be flown in exactly parallel profiles, a rougher interpolation was needed to generate the depth slices. This results in a much coarser appearance of the data.
First, we want to analyse the individual profile orientations. The results of the north–south oriented survey are strongly obscured in the whole depth range by a prominent reflection anomaly in the centre that runs from west to east (Figure 8a). A comparison with older orthophotos reveals that this disturbance is caused by a former field boundary that is still preserved in the subsurface as a density contrast. It is severely enhanced by the profiles crossing it perpendicularly and the polarisation effect described in Section 3.2. The effect is much stronger than for the ground-based data that had profiles in the north–south direction as well, because of the antenna decoupling from the ground resulting in nearly 50% signal reflection at the air–ground interface as discussed above. This had the effect of intensifying the old field boundary, located in the first few centimetres of depth. Furthermore, the special processing steps discussed above, which were actually intended to suppress the reverberation of the first reflection at the surface, also partly removed the usable reflection anomalies. The second flight was in the east–west direction and hence parallel to the problematic field boundary. This data set can be interpreted much more easily with regard to buried archaeology, as the effect of the field boundary is far less significant (Figure 8b).
In order to obtain better resolution, both drone-based survey directions were combined into joint depth slices in ReflexW. The effect of the field boundary can be suppressed effectively, as there is no corresponding anomaly from the east–west data, and therefore the average reflection amplitude is not heavily affected. Nevertheless, the topmost 40 cm are dominated by the strong reflections of the air–ground interface and, although there are Roman walls in this area (see Figure 6), no evidence of them is visible. Javan et al. [30] describe a similar effect, wherein shallow targets are obscured. All electromagnetic fields consist of a near- and a far field. The first one is needed to re-couple the signal to the ground and, therefore, depicts an extension of the antenna. This results in only a signal transmission. In contrast, reflections are only possible in the second one. The boundary between the two fields is approximately at a depth of 1.5 λ [65]. For drone-based GPR, this value seems to be even bigger. At greater depths, between 40 cm and 80 cm, some highly reflective anomalies can be associated with the potential Roman pavement—this is especially true of a small room in the west and the flag sanctuary in the south of the principia (Figure 9). Below 100 cm depth, even in the drone-based GPR data, some hints of Roman walls in the western and southwestern part are visible (Figure 10). Especially the western outer wall and even some single rooms are represented by a higher reflection amplitude. In addition, parts of the southern outer wall of the principia can be faintly identified. As in the case of the ground-based GPR, the archaeological remains start to vanish below 130 cm depth.

7. Discussion

Superimposing the drone-based GPR data on the ground-based one, we find that the location of the detected archaeological remains fits quite well (Figure 11). This can be regarded as proof that the drone-based GPR data really is able to detect buried archaeological remains and that the mapped reflection anomalies do not depict residua of data processing or soil variations. However, only deeper structures can be resolved, as steps taken to suppress the ringing of the air–ground interface during data processing unfortunately calculate the shallow parts out.
For a better comparison, the ground-based GPR data were artificially reprocessed with a profile spacing of 1 m. A direct comparison of a selection of depth slices can be found in Figure 12. The archaeological remains are still quite visible in the ground-based data and only a few very faint walls disappear, as they were not covered by a survey profile anymore. However, as expected, the resolution is much coarser due to the doubled profile spacing. In contrast, the walls are much less pronounced in the drone-GPR data. Therefore, the signal loss at the air–ground interface has a much higher impact on the detectability than the bigger profile spacing, and there is clear evidence indicating a severe effect due to the decoupling of the antenna from the soil surface when drone-based GPR is used.
Similar effects are noted by Sensors & Software [66]. They artificially lifted some of their GPR antennas of varying frequencies off the ground and recorded the same profile over buried utilities. The theory of GPR indicates that antennas should be kept within 1/10 of the centre frequency wavelength (in air) from the surface [66]. Table 4 lists the analysed antennas and the recommended maximum allowable height:
In Figure 13, the corresponding results of the lift test with a 250 MHz antenna are visible. Sensors & Software published conclusions that are very similar to those indicated by our drone-based GPR test: While near-surface reflections are suppressed because the signal needs more time to recouple to the ground and create reflections, deeper-lying features can be resolved in a lower signal amplitude.
Considering these indications, it has to be stated that drone-based GPR will only work properly with low-frequency antennas whose resolution is only sufficient for geological studies (e.g., to map subsurface stratigraphy). For the 500 MHz antenna that we used in our test survey, a maximum height of 1.5 cm would result from Table 4. Such a low flight altitude is not practical at all.

8. Conclusions

The results of the drone-based GPR test survey presented above reveal that under ideal conditions with very dry soil, it is possible to detect buried archaeological remains even after decoupling the antenna from the ground and mounting it below a drone. However, due to the signal loss of nearly 50% at the air–ground interface, only a limited amount of GPR signal can be used to detect objects like the Roman walls that were the subject of this survey. The results therefore show a much less-pronounced difference between the stone structures and the surrounding soil. This effect becomes even worse if the soil moisture content increases because then the reflection coefficient at the interface is raised dramatically. This can lead to severe problems in applying drone-based GPR in moist regions like Bavaria, where we recorded an average soil moisture content of 25 vol% (minimum 4 vol%; maximum 57 vol%) over the survey seasons of the last six years (March to November each year).
Compared with ground-based surveys, the profile direction is even more important, when using an antenna on a drone, as the presented data of Theilenhofen has shown that modern or former field boundaries represent strong reflectors if mapped in a perpendicular orientation. As the resulting data are not usable at all for archaeological purposes, a good knowledge of the site is mandatory in order to plan the survey direction correctly. Additionally, the technique cannot be used to detect features that are shallow because a greater depth is needed in order to couple the signal to the ground again and generate reflection data. In the case of the site at Theilenhofen, the shallower depth slices of up to 100 cm mostly consisted of the reverberating first reflection of the air–ground interface and contained only vague hints of traces generated by the archaeological remains of the site.
Furthermore, at the moment, there is no significant advance in survey progress, as the drone had to be operated at a speed of 2.5 m/s. Even with normal walking, a velocity of 0.8–1.1 m/s can be achieved. Mounting a multichannel GPR antenna array behind an ATV vehicle provides the same survey progress with a much higher resolution. A definite advantage of drone-based geophysics is the fact that there is no necessity to enter the survey area and, hence, even inaccessible areas can be documented. Vegetation cover still has to be as short as possible and, furthermore, not moist with dew, as the amount of reflected signal at the air–ground interface otherwise increases even more.
In order to further evaluate the benefit of drone-based GPR surveys in an archaeological context, additional tests have to be executed, especially with a denser profile spacing of 50 cm that is comparable to standard single-channel ground-GPR surveys. Furthermore, data in moist conditions must be acquired in order to study the influence of soil moisture on the signal loss in detail. In addition, other archaeological sites with less well-preserved buried structures and of other type than stone walls (e.g., refilled ditches or air-filled cavities, etc.) need to be mapped to investigate, whether these are still recognisable in the drone-based data.
Finally, it can be stated that drone-based GPR surveys could serve as a starting point to quickly and roughly map an area to define potential regions for a higher resolution ground-based survey. Similar approaches are already used, e.g., for drone-based magnetometry. A detailed archaeological interpretation of the buried remains solely by drone-based GPR surveys is not possible at the moment.

Author Contributions

Project supervision, R.L.; project concept development, R.L.; data acquisition, R.L., A.S. and J.S.; data processing, M.K. and R.L.; validation, R.L. and A.S.; writing—original draft preparation, R.L. and M.K.; writing—review and editing, A.S. and J.S.; visualisation, M.K. and R.L. All authors have read and agreed to the published version of the manuscript.

Funding

This research received no external funding.

Data Availability Statement

The data that support the findings of this study are available from the corresponding author upon reasonable request.

Acknowledgments

For the permit to use his leased meadow as a test site, we want to thank Stefan Auinger. For her support during fieldwork, we thank Tatjana Gericke (BLfD). A special thank is dedicated to Karl-Josef Sandmeier for his helpful hints and tricks in using his software ReflexW for such a special purpose. For native English correction of the manuscript, we thank Martin Linck (GTI Energy, Chicago, IL, USA).

Conflicts of Interest

The author Joachim Schlechtriem is CEO of the company Drone it GmbH. The remaining authors declare that the research was conducted in the absence of any commercial or financial relationships that could be construed as a potential conflict of interest.

References

  1. Belshé, J.C. Recent magnetic investigations at Cambridge University. Adv. Phys. 1957, 6, 192–193. [Google Scholar] [CrossRef]
  2. Aitken, M.J. Magnetic prospecting I. Archaeometry 1958, 1, 24–26. [Google Scholar] [CrossRef]
  3. Vickers, R.S.; Dolphin, L.T. A Communication on an Archaeological Radar Experiment at Chaco Canyon, New Mexico. MASCA Newsl. 1975, 11, 6–8. [Google Scholar]
  4. Kenyon, J.L.; Bevan, B. Ground-penetrating radar and its application to a historical archaeological site. Hist. Archaeol. 1977, 11, 48–55. [Google Scholar] [CrossRef]
  5. Barakat, N.; Dolphin, L.T.; el Dessouki, T.; el Hennawi, H.; Moussa, A.H.; Tolba, M.F.; Abdel-Wahab, S.; Bollen, R.L.; Johnson, D.A.; Oetzel, G.N.; et al. Electromagnetic Sounder Experiments at the Pyramids of Giza; Stanford Research International: Menlo Park, CA, USA, 1975. [Google Scholar]
  6. Batey, R.A. Subsurface Interface Radar at Sepphoris, Israel, 1985. J. Field Archaeol. 1987, 14, 1–8. [Google Scholar] [CrossRef]
  7. Sheets, P.D.; Loker, W.M.; Spetzler, H.A.W.; Ware, R.W. Geophysical Exploration for Ancient Maya Housing at Ceren, El Salvador. Natl. Geogr. Res. Rep. 1985, 20, 645–656. [Google Scholar]
  8. Gavazzi, B.; Reiller, H.; Munschy, M. An Integrated Approach for Ground and Drone-Borne Magnetic Surveys and their Interpretation in Archaeological Prospection. ArcheoSciences 2021, 45, 165–168. [Google Scholar] [CrossRef]
  9. Pisciotta, A.; Vitale, G.; Scudero, S.; Martorana, R.; Capizzi, P.; D’Alessandro, A. A Lightweight Prototype of a Magnetometric System for Unmanned Aerial Vehicles. Sensors 2021, 21, 4691. [Google Scholar] [CrossRef]
  10. Pozdnyakova, O.A.; Balkov, E.V.; Dyadkov, P.G.; Marchenko, Z.V.; Grishin, A.E.; Evmenov, N.D. Integrative Geophysical Studies at the Novaya Kurya-1 Cemetery in the Kulunda Steppe. Archaeol. Ethnol. Anthropol. Eurasia 2022, 49, 69–79. [Google Scholar] [CrossRef]
  11. Stele, A.; Linck, R.; Schikorra, M.; Fassbinder, J.W.E. UAV magnetometer survey in low-level flight for archaeology: Case study of a Second World War airfield at Ganacker (Lower Bavaria, Germany). Archaeol. Prospect. 2022, 29, 645–650. [Google Scholar] [CrossRef]
  12. Stele, A.; Kaub, L.; Linck, R.; Schikorra, M.; Fassbinder, J.W.E. Drone-based magnetometer prospection for archaeology. J. Archaeol. Sci. 2023, 158, 105818. [Google Scholar] [CrossRef]
  13. Schmidt, V.; Coolen, J.; Fritsch, T.; Klingen, S. Towards drone-based magnetometer measurements for archaeological prospection in challenging terrain. Drone Syst. Appl. 2024, 12, 1–15. [Google Scholar] [CrossRef]
  14. Yarlequé, M.A.; Alvarez, S.; Martínez, H.J.; Canelo, A.C. FMCW GPR radar for archaeological applications: First analytical and measurement results. In Proceedings of the 2017 XXXIInd General Assembly and Scientific Symposium of the International Union of Radio Science (Ursi Gass), Montreal, QC, Canada, 9–26 August 2017; pp. 1–3. [Google Scholar]
  15. Salvini, R.; Beltramone, L.; De Lucia, V.; Ermini, A.; Vanneschi, C.; Zei, C.; Silvestri, D.; Rindinella, A. UAV-mounted Ground Penetrating Radar: An example for the stability analysis of a mountain rock debris slope. J. Mt. Sci. 2023, 20, 2804–2821. [Google Scholar] [CrossRef]
  16. Frid, M.; Frid, V. Vital Views into Drone-Based GPR Application: Precise Mapping of Soil-to-Rock Boundaries and Ground Water Level for Foundation Engineering and Site-Specific Response. Appl. Sci. 2024, 14, 7889. [Google Scholar] [CrossRef]
  17. Wu, K.; Rodriguez, G.A.; Zajc, M.; Jacquemin, E.; Clément, M.; De Coster, A.; Lambot, S. A new drone-borne GPR for soil moisture mapping. Remote Sens. Environ. 2019, 235, 111456. [Google Scholar] [CrossRef]
  18. Jenssen, R.O.R.; Eckerstorfer, M.; Jacobsen, S. Drone-Mounted Ultrawideband Radar for Retrieval of Snowpack Properties. IEEE Trans. Instrum. Meas. 2019, 69, 221–230. [Google Scholar] [CrossRef]
  19. Valence, E.; Baraer, M.; Rosa, E.; Barbecot, F.; Monty, C. Drone-based ground-penetrating radar (GPR) application to snow hydrology. Cryosphere 2022, 16, 3843–3860. [Google Scholar] [CrossRef]
  20. Ruols, B.; Baron, L.; Irving, J. Development of a drone-based ground-penetrating radar system for efficient and safe 3D and 4D surveying of alpine glaciers. J. Glaciol. 2023, 69, 2087–2098. [Google Scholar] [CrossRef]
  21. Li, C.; Li, Z.; Huang, W.; Zhang, B.; Deng, Y.; Li, G. Morphology Dynamics of Ice Cover in a River Bend Revealed by the UAV-GPR and Sentinel-2. Remote Sens. 2023, 15, 3180. [Google Scholar] [CrossRef]
  22. Tjoelker, A.R.; Baraër, M.; Valence, E.; Charonnat, B.; Masse-Dufresne, J.; Mark, B.G.; McKenzie, J.M. Drone-Based Ground-Penetrating Radar with Manual Transects for Improved Field Surveys of Buried Ice. Remote Sens. 2024, 16, 2461. [Google Scholar] [CrossRef]
  23. Saponaro, A.; Dipierro, G.; Cannella, E.; Panarese, A.; Galiano, A.M.; Massaro, A. A UAV-GPR Fusion Approach for the Characterization of a Quarry Excavation Area in Falconara Albanese, Southern Italy. Drones 2021, 5, 40. [Google Scholar] [CrossRef]
  24. Wu, S.; Wang, L.; Zeng, X.; Wang, F.; Liang, Z.; Ye, H. UAV-Mounted GPR for Object Detection Based on Cross-Correlation Background Subtraction Method. Remote Sens. 2022, 14, 5132. [Google Scholar] [CrossRef]
  25. Noviello, C.; Gennarelli, G.; Esposito, G.; Ludeno, G.; Fasano, G.; Capozzoli, L.; Soldovieri, F.; Catapano, I. An Overview on Down-Looking UAV-Based GPR Systems. Remote Sens. 2022, 14, 3245. [Google Scholar] [CrossRef]
  26. Amiri, A.; Tong, K.; Chetty, K. Feasibility Study of Multi-Frequency Ground Penetrating Radar for Rotary UAV Platforms. In Proceedings of the IET International Conference on Radar Systems (Radar 2012), Glasgow, UK, 22–25 October 2012. [Google Scholar]
  27. Colorado, J.; Perez, M.; Mondragon, I.; Mendez, D.; Parra, C.; Devia, C.; Martinez-Moritz, J.; Neira, L. An integrated aerial system for landmine detection: SDR-based Ground Penetrating Radar onboard an autonomous drone. Adv. Robot. 2017, 31, 791–808. [Google Scholar] [CrossRef]
  28. Šipoš, D.; Gleich, D. A Lightweight and Low-Power UAV-Borne Ground Penetrating Radar Design for Landmine Detection. Sensors 2020, 20, 2234. [Google Scholar] [CrossRef]
  29. Nijeholt, L.L.À.; Kronshorst, T.Y.; Van Teeffelen, K.; Van Manen, B.; Emaus, R.; Knotter, J.; Mersha, A. Utilizing Drone-Based Ground-Penetrating Radar for Crime Investigations in Localizing and Identifying Clandestine Graves. Sensors 2023, 23, 7119. [Google Scholar] [CrossRef]
  30. Javan, F.D.; Samadzadegan, F.; Toosi, A.; Van der Meijde, M. Unmanned Aerial Geophysical Remote Sensing: A Systematic review. Remote Sens. 2024, 17, 110. [Google Scholar] [CrossRef]
  31. Noviello, C.; Esposito, G.; Fasano, G.; Renga, A.; Soldovieri, F.; Catapano, I. Small-UAV Radar Imaging System Performance with GPS and CDGPS Based Motion Compensation. Remote Sens. 2020, 12, 3463. [Google Scholar] [CrossRef]
  32. Linck, R.; Kaltak, A. Drone radar: A new survey approach for Archaeological Prospection? In New Global Perspectives on Archaeological Prospection; Bonsall, J., Ed.; Archaeopress: Oxford, UK, 2019; pp. 268–271. [Google Scholar]
  33. Frid, M.; Frid, V. A Case Study of the Integration of Ground-Based and Drone-Based Ground-Penetrating Radar (GPR) for an Archaeological Survey in Hulata (Israel): Advancements, Challenges, and Applications. Appl. Sci. 2024, 14, 4280. [Google Scholar] [CrossRef]
  34. Eidam, H. Das Kastell Theilenhofen. In Der Obergermanisch-Raetische Limes des Roemerreiches B VII Nr. 71a; Fabricius, E., Hettner, F., von Sarwey, O., Eds.; Verlag Otto Petters: Heidelberg, Germany, 1905. [Google Scholar]
  35. Czysz, W.; Dietz, K.; Fischer, T.; Kellner, H.-J. Die Römer in Bayern; Konrad Theiss Verlag: Stuttgart, Germany, 1995; pp. 522–523. [Google Scholar]
  36. Linck, R.; Fassbinder, J.W.E. Proving a Roman technical masterstroke: GIS-based viewshed and intervisibility analysis of the Bavarian part of the Rhaetian Limes. Archaeol. Anthropol. Sci. 2022, 14, 25. [Google Scholar] [CrossRef]
  37. Hüssen, C.M. Theilenhofen. In Landkreis Weißenburg-Gunzenhausen: Denkmäler und Fundstätten.—Führer zu Archäologischen Denkmälern in Deutschland Bd. 15; Spindler, K., Ed.; Konrad Theiss Verlag: Stuttgart, Germany, 1987; pp. 175–181. [Google Scholar]
  38. Kießling, G. Landkreis Weißenburg-Gunzenhausen: Ensembles, Baudenkmäler, Archäologische Denkmäler; Denkmäler in Bayern Bd. V.70/1; Karl M. Lipp Verlag: München, Germany, 2000; pp. 586–587. [Google Scholar]
  39. Reuter, M. Das Ende des raetischen Limes im Jahr 254 n. Chr. Bayer. Vorgeschichtsblätter 2007, 27, 105–108. [Google Scholar]
  40. Fischer, V. Die mittelkaiserzeitliche Donaugrenze in Raetien—Die Ripa Danuvii provinciae Raetiae. Der Limes 2000, 2, 20–25. [Google Scholar]
  41. Flügel, C.; Obmann, J. Römische Wehrbauten: Befund und Rekonstruktion; Volk Verlag: München, Germany, 2013. [Google Scholar]
  42. Fassbinder, J.W.E. Geophysical prospection of the frontiers of the Roman Empire in southern Germany, UNESCO World Heritage Site. Archaeol. Prospect. 2010, 17, 129–139. [Google Scholar] [CrossRef]
  43. Fassbinder, J.W.E. Neue Ergebnisse der geophysikalischen Prospektion am Obergermanisch-Raetischen Limes. In Neue Forschungen am Limes. Beiträge zum Welterbe Limes Bd. 3; Thiel, A., Ed.; Konrad Theiss Verlag: Stuttgart, Germany, 2008; pp. 154–171. [Google Scholar]
  44. Johnson, A. Römische Kastelle des 1. und 2. Jahrhunderts n. Chr. In Britannien und in den Germanischen Provinzen des Römerreiches; Kulturgeschichte der Antiken Welt Bd. 37; Philipp von Zabern: Mainz, Germany, 1990; pp. 123–152. [Google Scholar]
  45. Hoops, J. Reallexikon der Germanischen Altertumskunde, Bd. 23: Pfalzel—Quaden; Walter de Gruyter: Berlin, Germany, 2003; pp. 458–462. [Google Scholar]
  46. von Petrikovits, H. Beiträge zur Römischen Geschichte und Archäologie; Rudolf Habelt Verlag: Bonn, Germany, 1976; pp. 519–545. [Google Scholar]
  47. Reynolds, J.M. An Introduction to Applied and Environmental Geophysics, 1st ed.; John Wiley & Sons Ltd.: Chichester, UK, 1997; pp. 681–749. [Google Scholar]
  48. Conyers, L.B. Ground-Penetrating Radar for Archaeology; AltaMira Press: Walnut Creek, CA, USA, 2004. [Google Scholar]
  49. Milsom, J. Field Geophysics; John Wiley & Sons Ltd.: Chichester, UK, 2011; pp. 185–209. [Google Scholar] [CrossRef]
  50. Annan, A.P. Ground Penetrating Radar Principles, Procedures & Applications; Sensors & Software: Mississsauga, ON, Canada, 2003. [Google Scholar]
  51. Jol, H.M. Ground Penetrating Radar: Theory and Applications, 1st ed.; Elsevier Science: Amsterdam, The Netherlands, 2008. [Google Scholar]
  52. Von der Osten, H. Geophysikalische Prospektion Archäologischer Denkmale unter Besonderer Berücksichtigung der Kombinierten Anwendung Geoelektrischer und Geomagnetischer Kartierung, Sowie der Verfahren der Elektromagnetischen Induktion und des Bodenradars; Shaker Verlag: Aachen, Germany, 2003. [Google Scholar]
  53. García-Fernández, M.; López, Y.Á.; De Mitri, A.; Martínez, D.C.; Álvarez-Narciandi, G.; Andrés, F.L.-H. Portable and Easily-Deployable Air-Launched GPR Scanner. Remote Sens. 2020, 12, 1833. [Google Scholar] [CrossRef]
  54. Linck, R.; Fassbinder, J.W.E. Determination of the influence of soil parameters and sample density on ground-penetrating radar: A case study of a Roman picket in Lower Bavaria. Archaeol. Anthropol. Sci. 2013, 6, 93–106. [Google Scholar] [CrossRef]
  55. Damiata, B.N.; Steinberg, J.M.; Bolender, D.J.; Zoëga, G.; Schoenfelder, J.W. Subsurface imaging a Viking-Age churchyard using GPR with TDR: Direct comparison to the archaeological record from an excavated site in northern Iceland. J. Archaeol. Sci. Rep. 2017, 12, 244–256. [Google Scholar] [CrossRef]
  56. Topp, G.C.; Davis, J.L.; Annan, A.P. Electromagnetic determination of soil water content: Measurement in coaxial transmission lines. Water Resour. Res. 1980, 16, 574–582. [Google Scholar] [CrossRef]
  57. Forkmann, B. DGG-Kolloquium Georadar: Geschichte, Grundlagen und Zukunft des GPR. In 66. Jahrestagung der Deutschen Geophysikalischen Gesellschaft; Deutsche Geophysikalische Gesellschaft e.V.: Leipzig, Germany, 2006; Volume II/2006, pp. 3–22. [Google Scholar]
  58. Everett, M.E. Near-Surface Applied Geophysics; Cambridge University Press: Cambridge, UK, 2013; pp. 239–278. [Google Scholar]
  59. Balanis, C.A. Antenna Theory: Analysis and Design, 3rd ed; Wiley: Hoboken, NJ, USA, 2005. [Google Scholar]
  60. Antennas Manual MN30-903 Rev G. Available online: https://www.geophysical.com/wp-content/uploads/2017/10/GSSI-Antenna-Manual.pdf (accessed on 16 January 2025).
  61. Radar Systems Zond Aero 500 GPR System: Data Sheet. Available online: https://www.sphengineering.com/integrated-systems (accessed on 21 July 2023).
  62. Booth, A.D.; Koylass, T.M. Drone-mounted ground-penetrating radar surveying: Flight-height considerations for diffraction-based velocity analysis. Geophysics 2022, 87, WB69–WB79. [Google Scholar] [CrossRef]
  63. Reflexw—GPR and Seismic Processing Software. Available online: https://www.sandmeier-geo.de/reflexw.html (accessed on 22 October 2024).
  64. Kim, J.-H.; Cho, S.-J.; Yi, M.-J. Removal of ringing noise in GPR data by signal processing. Geosci. J. 2007, 11, 75–81. [Google Scholar] [CrossRef]
  65. Daniels, D.J. Surface-Penetrating Radar; Radar, Sonar, Navigation and Avionics Series 6; The Institution of Electrical Engineers: London, UK, 1996. [Google Scholar]
  66. TIPS: How High Can My GPR Be Off the Ground? Available online: https://www.sensoft.ca/blog/tips-how-high-can-my-gpr-be-off-the-ground/ (accessed on 12 February 2025).
Figure 1. Topographical map of Bavaria showing the location of the test site Theilenhofen (black–red triangle) (© Bayerische Vermessungsverwaltung—https://www.ldbv.bayern.de/ (accessed on 24 February 2023). The map of Germany in the top left corner shows the position of the zoomed topographic map as a red rectangle (© Bundesamt für Kartographie und Geodäsie, Frankfurt am Main, 2011).
Remotesensing 17 01498 g001
Figure 2. Viewshed analysis to visualise the line-of-sight from the fortress Theilenhofen towards the Limes watchtowers. Legend: yellow circles = position of the watchtowers, red line = route of the Rhaetian Limes, blue arrow = location of fortress Theilenhofen, green areas = regions that were visible from the top of the fort. The viewshed analysis is based on the DGM50 (digital topographical model with 50 × 50 m pixel resolution) of the Bayerische Vermessungsverwaltung and the following parameters were set: height of fort towers = 12 m [41], search radius = 20 km. Software: QGIS v.2.18.23.
Remotesensing 17 01498 g002
Figure 3. Virtual reconstruction of a typical Roman principia in the province Rhaetia at the example of the fortress at Ruffenhofen based on magnetometry results (Reconstruction in 3D-Max R.3.1 software by H. Becker, BLfD).
Remotesensing 17 01498 g003
Figure 4. (a) Photo of the ground-based GPR system GSSI SIR-4000 with a 400 MHz antenna at Theilenhofen; (b) photo of the drone-based GPR system Zond Aero500 with 500 MHz antenna mounted to an Acecore NOA 6 hexacopter (both photos: Roland Linck, BLfD).
Remotesensing 17 01498 g004
Figure 5. Effect of ‘subtracting average’ processing step to reduce the reverberations of the air–ground interface reflection in the drone-GPR data shown at a sample profile. The red square marks the removal of the ringing noise from the data, and the purple ellipse indicates the unmasking of a hyperbola.
Remotesensing 17 01498 g005
Figure 6. Selection of depth slices of ground-based data between 60 cm and 140 cm depth. GSSI SIR-4000 with 400 MHz antenna, sample interval 2 × 50 cm. Project-No. Tlh22rad.
Remotesensing 17 01498 g006
Figure 7. Digital interpretation map of the remains of the Roman principia. The colours refer to the different structure types that can be identified. GIS-Plan-No. 6930/006.
Remotesensing 17 01498 g007
Figure 8. Drone-based GPR depth slice of 20–40 cm. (a) North–south direction illustrating the strong reflection anomaly of the shallow former field boundary still present in the orthophoto of 2009 (shown in the background). (b) East–west direction with less influence of the field boundary. The orange dots represent the flight trajectories of the drone-GPR system. Zond 500Aero with 500 MHz antenna, sample interval 5 × 100 cm. Project-No. Tlh23rad (Orthophoto: Courtesy of the Bayerische Vermessungsverwaltung—https://www.ldbv.bayern.de/ (accessed on 12 February 2025)).
Remotesensing 17 01498 g008
Figure 9. Depth slice of the combined drone-based GPR data in 40–60 depth (right) showing evidence of the Roman pavement. Comparison with the corresponding depth slice of the ground-based data set (left). The two rectangles mark the corresponding anomalies of one room in the west (red) and of the flag sanctuary (blue).
Remotesensing 17 01498 g009
Figure 10. Selection of drone-based GPR depth slices between 100 cm and 160 cm depth. Combination of both survey directions. The overlay in ReflexW is executed by merging and averaging the two data sets. Zond 500Aero with 500 MHz antenna, sample interval 5 × 100 cm. Project-No. Tlh23rad.
Remotesensing 17 01498 g010
Figure 11. Superimposition of drone depth slices on the corresponding ground-based GPR data to visualise that remains fit together. As an example, the slice in 120–140 cm below the modern surface is chosen. Transparency of drone data: 30%.
Remotesensing 17 01498 g011
Figure 12. Comparison of drone-based GPR depth slices (left column) with the corresponding ones of the ground-based GPR data reprocessed with 1 m profile spacing (right column). Selected depth range: between 100 cm and 140 cm.
Remotesensing 17 01498 g012
Figure 13. Sample profile of an unknown test site collected with a Sensors & Software Noggin® 250 MHz antenna along the same profile in contact with the ground surface (left image) and raised above the ground at heights of 7.5, 15, 22.5, and 30 cm (towards right) (after [66]).
Remotesensing 17 01498 g013
Table 1. Dielectric values of common materials (after [47]).
MaterialDielectric Value εrMaterialDielectric Value εr
Air1Granite5–8
Water (fresh)81Limestone7–9
Clay (dry)3Clay (wet)8–15
Sand (dry)3–6Sand (wet)25–30
Table 2. Specifications of the utilised GPR antennas (after [60,61]).
Ground-BasedDrone-Based
ModelGSSI Model 5103Zond Aero 500
Centre Frequency [MHz]400500
Operating Bandwidth [MHz]100–800200–900
Set Time Range [ns]53100
Scan Rate [Scans/second]12050
Dimensions [cm]30 × 30 × 1741 × 31 × 16
Table 3. ReflexW processing chain for ground- and drone-based GPR data in Theilenhofen.
Step NumberGround-BasedDrone-Based
0Import dataImport data
1Dewow/bandpass filterRemove range
2Correct max. phaseBandpass filtering
3Move start timeCorrect max. phase
4Gain functionBackground removal
5Background removalMove start time
6StackingGain function
7Velocity analysisSubtracting average
81D-Kirchhoff migrationStacking
9Time-depth conversionVelocity analysis
103D data interpretation1D-Kirchhoff migration
11 Time-depth conversion
12 3D data interpretation
Table 4. Maximum recommended antenna height for different frequencies [66].
Centre FrequencyWavelength in AirWavelength/10 HeightRecommended Maximum Antenna Height
100 MHz300 cm30 cm10 cm
250 MHz120 cm12 cm3 cm
500 MHz60 cm6 cm1.5 cm
1000 MHz30 cm3 cm<1 cm
Disclaimer/Publisher’s Note: The statements, opinions and data contained in all publications are solely those of the individual author(s) and contributor(s) and not of MDPI and/or the editor(s). MDPI and/or the editor(s) disclaim responsibility for any injury to people or property resulting from any ideas, methods, instructions or products referred to in the content.

