Article

Synergistic Impacts of Land Deformation and Rapid Socio-Ecological Changes on Disaster Risk in Indonesian Alluvial Plains Using Multiple Satellite Datasets

1
National Research Institute for Earth Science and Disaster Resilience, Ibaraki 305-0006, Japan
2
Graduate School of Science and Technology for Innovation, Yamaguchi University, Ube 755-8611, Japan
3
Center for Research and Application of Satellite Remote Sensing, Yamaguchi University, Ube 755-8611, Japan
4
Japan Aerospace Exploration Agency, Tsukuba Space Center, Ibaraki 305-8505, Japan
5
Agrarian Resource Center, Bandung 40293, Indonesia
*
Author to whom correspondence should be addressed.
Remote Sens. 2025, 17(9), 1514; https://doi.org/10.3390/rs17091514
Submission received: 27 February 2025 / Revised: 18 April 2025 / Accepted: 18 April 2025 / Published: 24 April 2025
(This article belongs to the Special Issue Remote Sensing in Hazards Monitoring and Risk Assessment)

Abstract

:
Unique, small-scale tectonic and geological systems are occasionally vulnerable to natural hazards. Although the combination of such systems with rapid socio-ecological change can enhance the risk of disasters, such synergistic impacts have not been well studied. The primary goal of this study was to investigate the potential synergistic impact of land deformation and rapid socio-ecological changes on disaster risk in lowland alluvial regions of a collision zone in the Gorontalo Regency of Gorontalo Province, Indonesia. In this region, socio-ecological changes such as urbanization and rapid lake shrinkage are significant. Frequent occurrence of flood hazards threatens local livelihood. Differential interferometric synthetic aperture radar analysis of Sentinel-1 C-band data from April 2020 to April 2023 was applied to assess land deformation. Thereafter, supervised classification of moderate and high spatiotemporal resolution optical satellite time series was used to assess the relationship between land deformation and built-up area. The findings revealed both significant land deformation and rapid socio-ecological changes. Vertical deformation rates were as high as ~6 cm/year and were primarily attributable to tectonic activity; they were particularly apparent in rapidly developing and highly populated residential areas. Rapid shrinkage of a lake resulted from the local geological system and socioeconomic changes in the region, which together possibly exacerbated the hazard risk because of their effects on land deformation. These results indicate the potential danger to both infrastructure and human inhabitants at a regional level due to the synergistic effects of natural processes and socio-ecological changes. The study design and data that were used facilitated a comprehensive assessment of the potential impacts on disaster risk. These findings are expected to be integrated into locally specific hazard (e.g., flood inundation and ground fissuring) risk mitigation and management strategies.

1. Introduction

Unique, small-scale tectonic and geological systems are occasionally vulnerable to natural hazards. The combination of such systems with rapid socio-ecological change can enhance hazard risks. Soft deposits in lowland regions are vulnerable to land deformation, defined as the gradual or sudden transformation of the Earth’s surface because of tectonic activity and land subsidence [1,2]. Such land deformation, categorized as subsidence and uplifting, can be caused by natural (e.g., movement of the lithosphere and compaction of sedimentary deposits) or anthropogenic activities (e.g., extraction of natural resources and urbanization) as well as by a combination of these at various timescales [1,2,3,4]. Land deformation combined with natural events magnifies risks of flood inundation and ground fissuring, which cost human lives, damage infrastructure, and interrupt services [1,2,5,6]. Quantifying the spatiotemporal dynamics of land deformation is therefore critical for preventing damage to infrastructure and human lives, informing plans for urban development, and managing and minimizing the likelihood of disasters.
The unique characteristics of small-scale systems have impacted land deformation in various ways, and the combination of effects has sometimes exacerbated deformation phenomena in critical ways in alluvial and deltaic regions characterized by fine-grained sediments (e.g., organic soils or soft clay) [1,2,5,7,8]. Considerable land deformation in such regions has been reported in several countries, including China, Egypt, France, Italy, the United States of America, and Vietnam [1,7,9,10]. These deformations have been caused by a combination of groundwater depletion and natural compaction of the subsoil layers [9], expansion of urbanization [10], and large volumes of fluids [5,11] and gases [1,5] extracted from poorly compacted subsurface layers.
In alluvial and deltaic regions experiencing rapid ecological changes, land deformation is expected to further accelerate. Indonesia is the country most affected globally by land deformation [1,11,12,13,14,15,16]. The province of North Sulawesi, Indonesia, lies on the line of contact between the Eurasian and Australian plates, and it is still experiencing uplift that results in a variety of unusual geological phenomena [17,18]. For example, Limboto Lake on Sulawesi Island, which was formed by pre-Pleistocene uplift during the collision of the plates, is rapidly shrinking [18,19,20,21] as a result of rapid erosion of the inner bay sediments, which consist of fine- and medium-grained sand [18]. In such regions, where small-scale geological systems are unique and ecological changes are rapid (e.g., rapid lake shrinkage) [18,21,22], multiple socioeconomic factors may further aggravate land deformation and thereby critically exacerbate vulnerability to flooding and ground fissuring. However, the synergistic impacts of land deformation and rapid socio-ecological changes on disaster risk have not been well studied.
Remote sensing technology has emerged as an essential tool for swiftly and efficiently making land deformation measurements as well as monitoring, forecasting [23], and assessing land deformation-induced disasters [21,24,25] at various scales. Quantifying land deformation has traditionally relied on a global positioning system (GPS) network, geodetic leveling data, ground-based field observations, and ground and water sensors [2,3,5]. Although such measurements are precise, they are costly and time-consuming to obtain, and they provide few data [2,3,5]. Mapping land deformation over extensive areas with millimeter-level accuracy, high-frequency observations, and a lower cost/benefit ratio than ground-based surveys has rapidly evolved in recent years with the use of interferometric synthetic aperture radar (InSAR) techniques. This technology helps detect and continuously monitor land deformation caused by both geological and anthropogenic factors without the weather-related limitations of passive sensors [2,3,5,26].
The primary goal of this study was to investigate the potential synergistic impact of land deformation and rapid socio-ecological changes on disaster risk in the Gorontalo Regency of Gorontalo Province, Indonesia. Our specific objectives were to (1) make a detailed assessment of land deformation from 2020 to 2023 using the Sentinel-1 (S-1) series, (2) investigate time series landcover transformations (LCTs) using the Landsat series (1981–2022) and the Planet series (2020–2023), and (3) assess the relationship between the results obtained from achieving objectives 1–2 (2020–2023). The results of this study are expected to contribute to the understanding of potential synergistic impacts on disaster risk in lowland alluvial regions of collision zones and strengthen hazard risk mitigation and management strategies on small spatial scales.

2. Materials and Methods

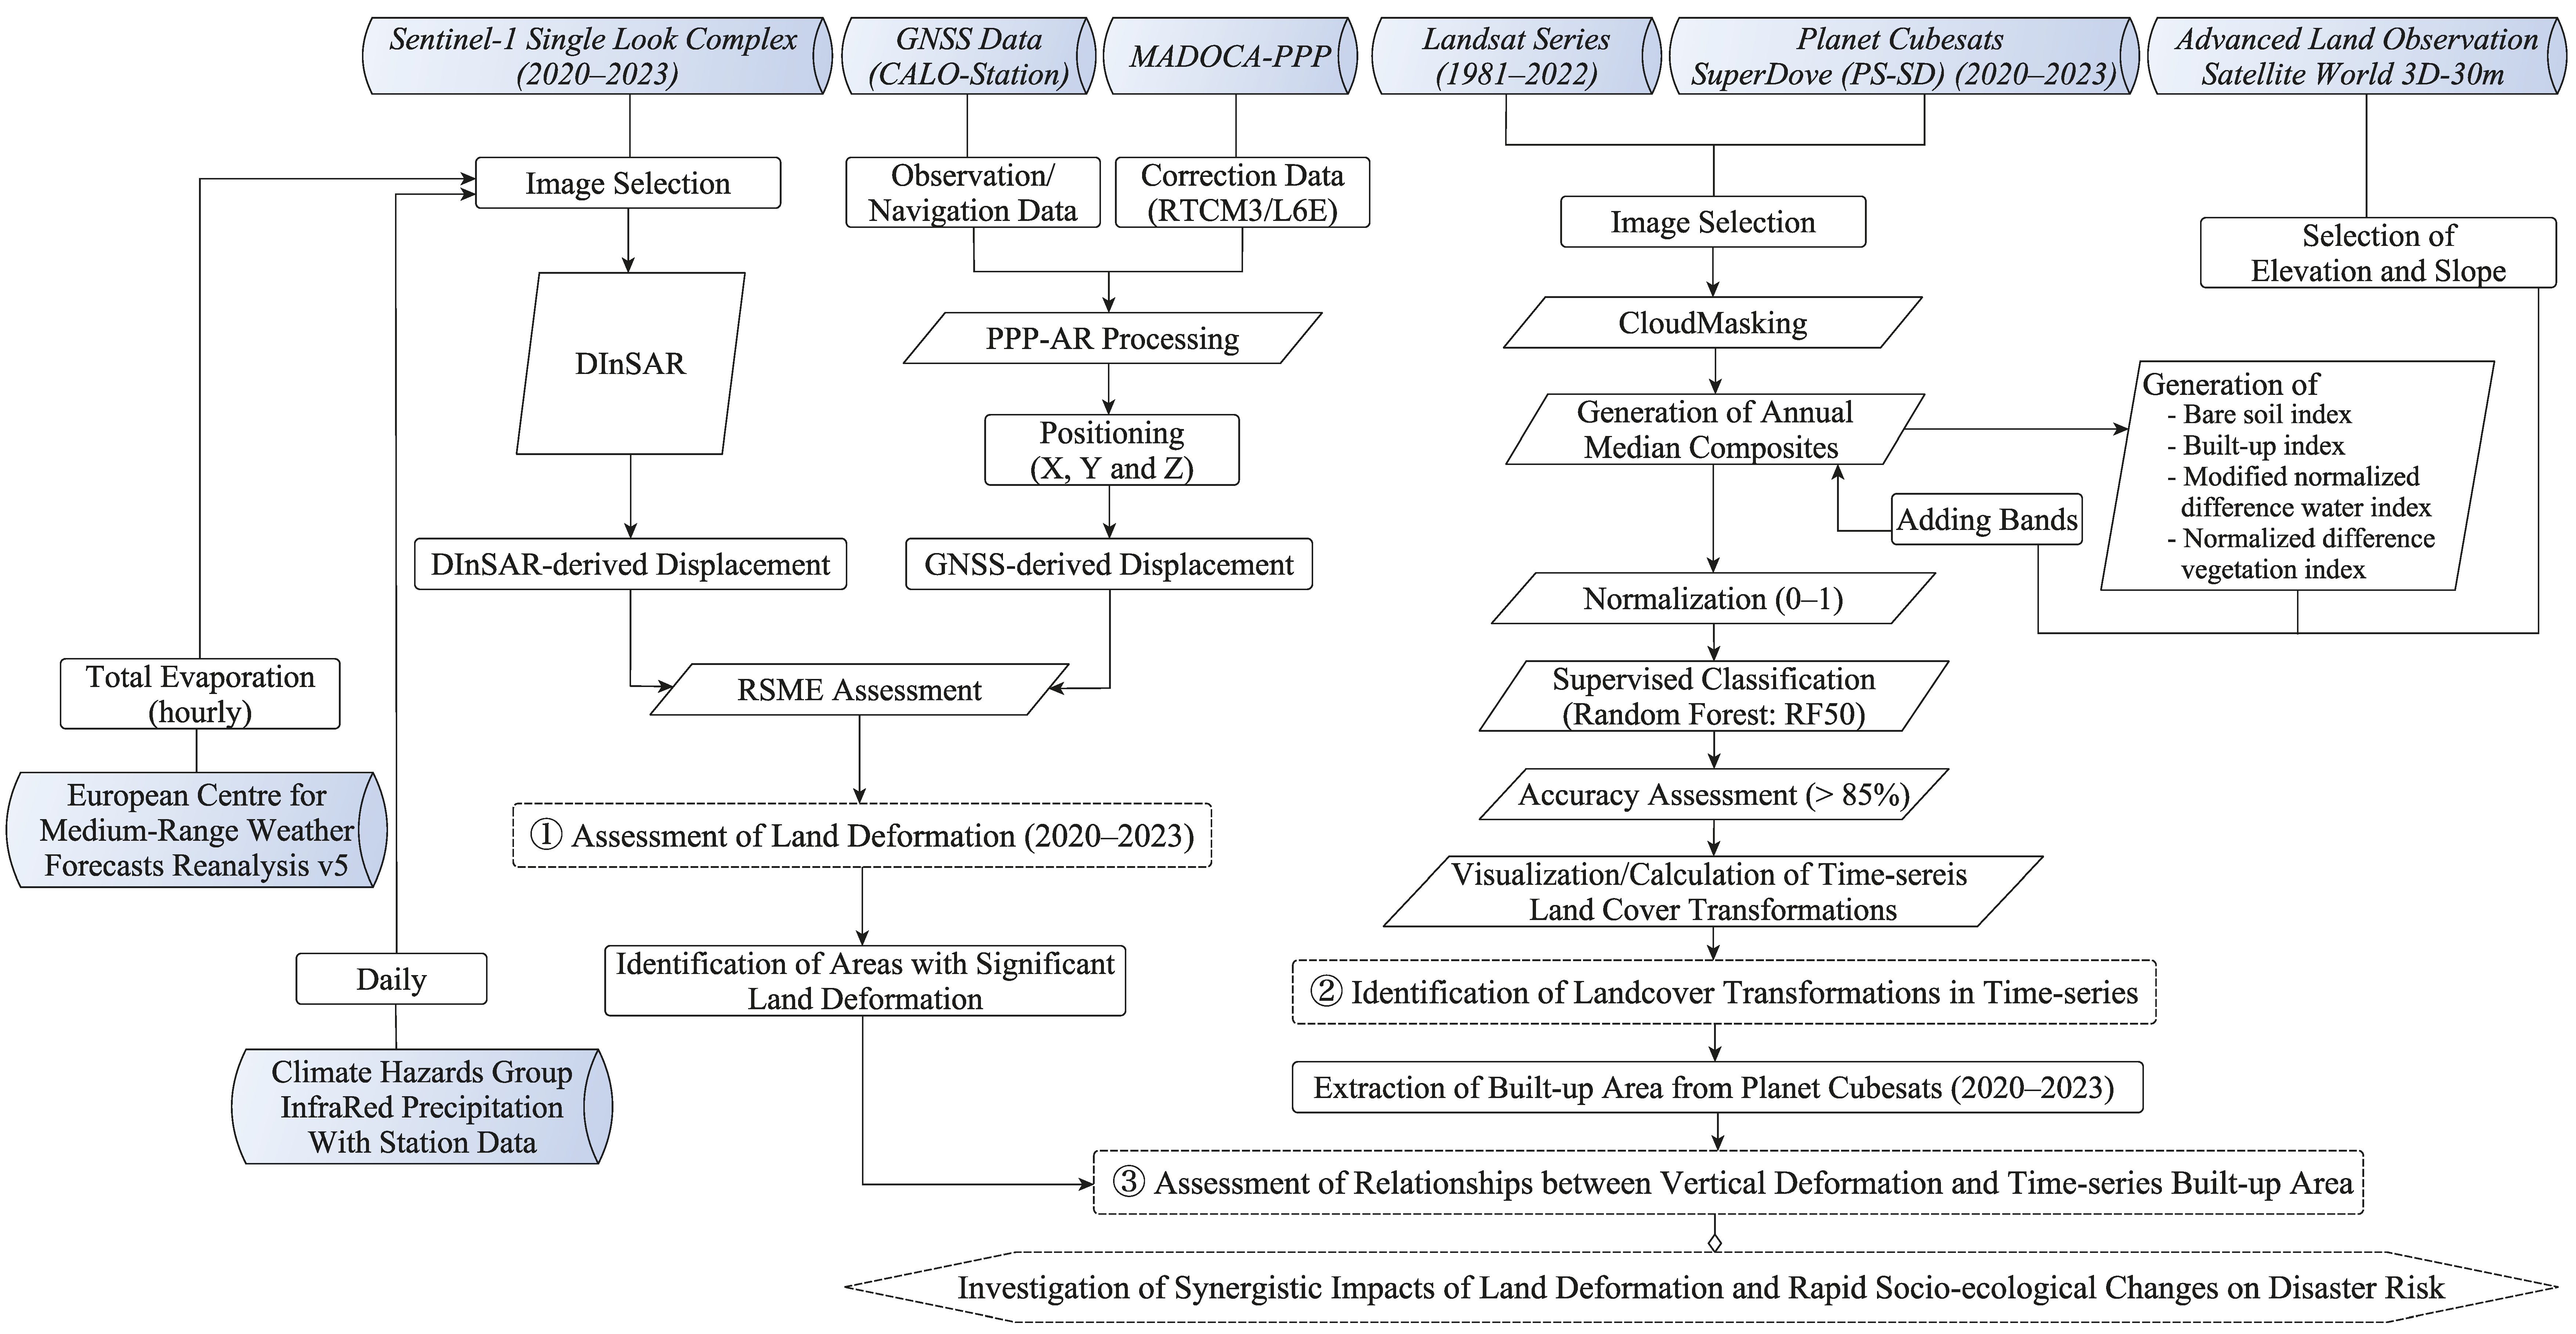
2.1. Overall Methodological Workflow
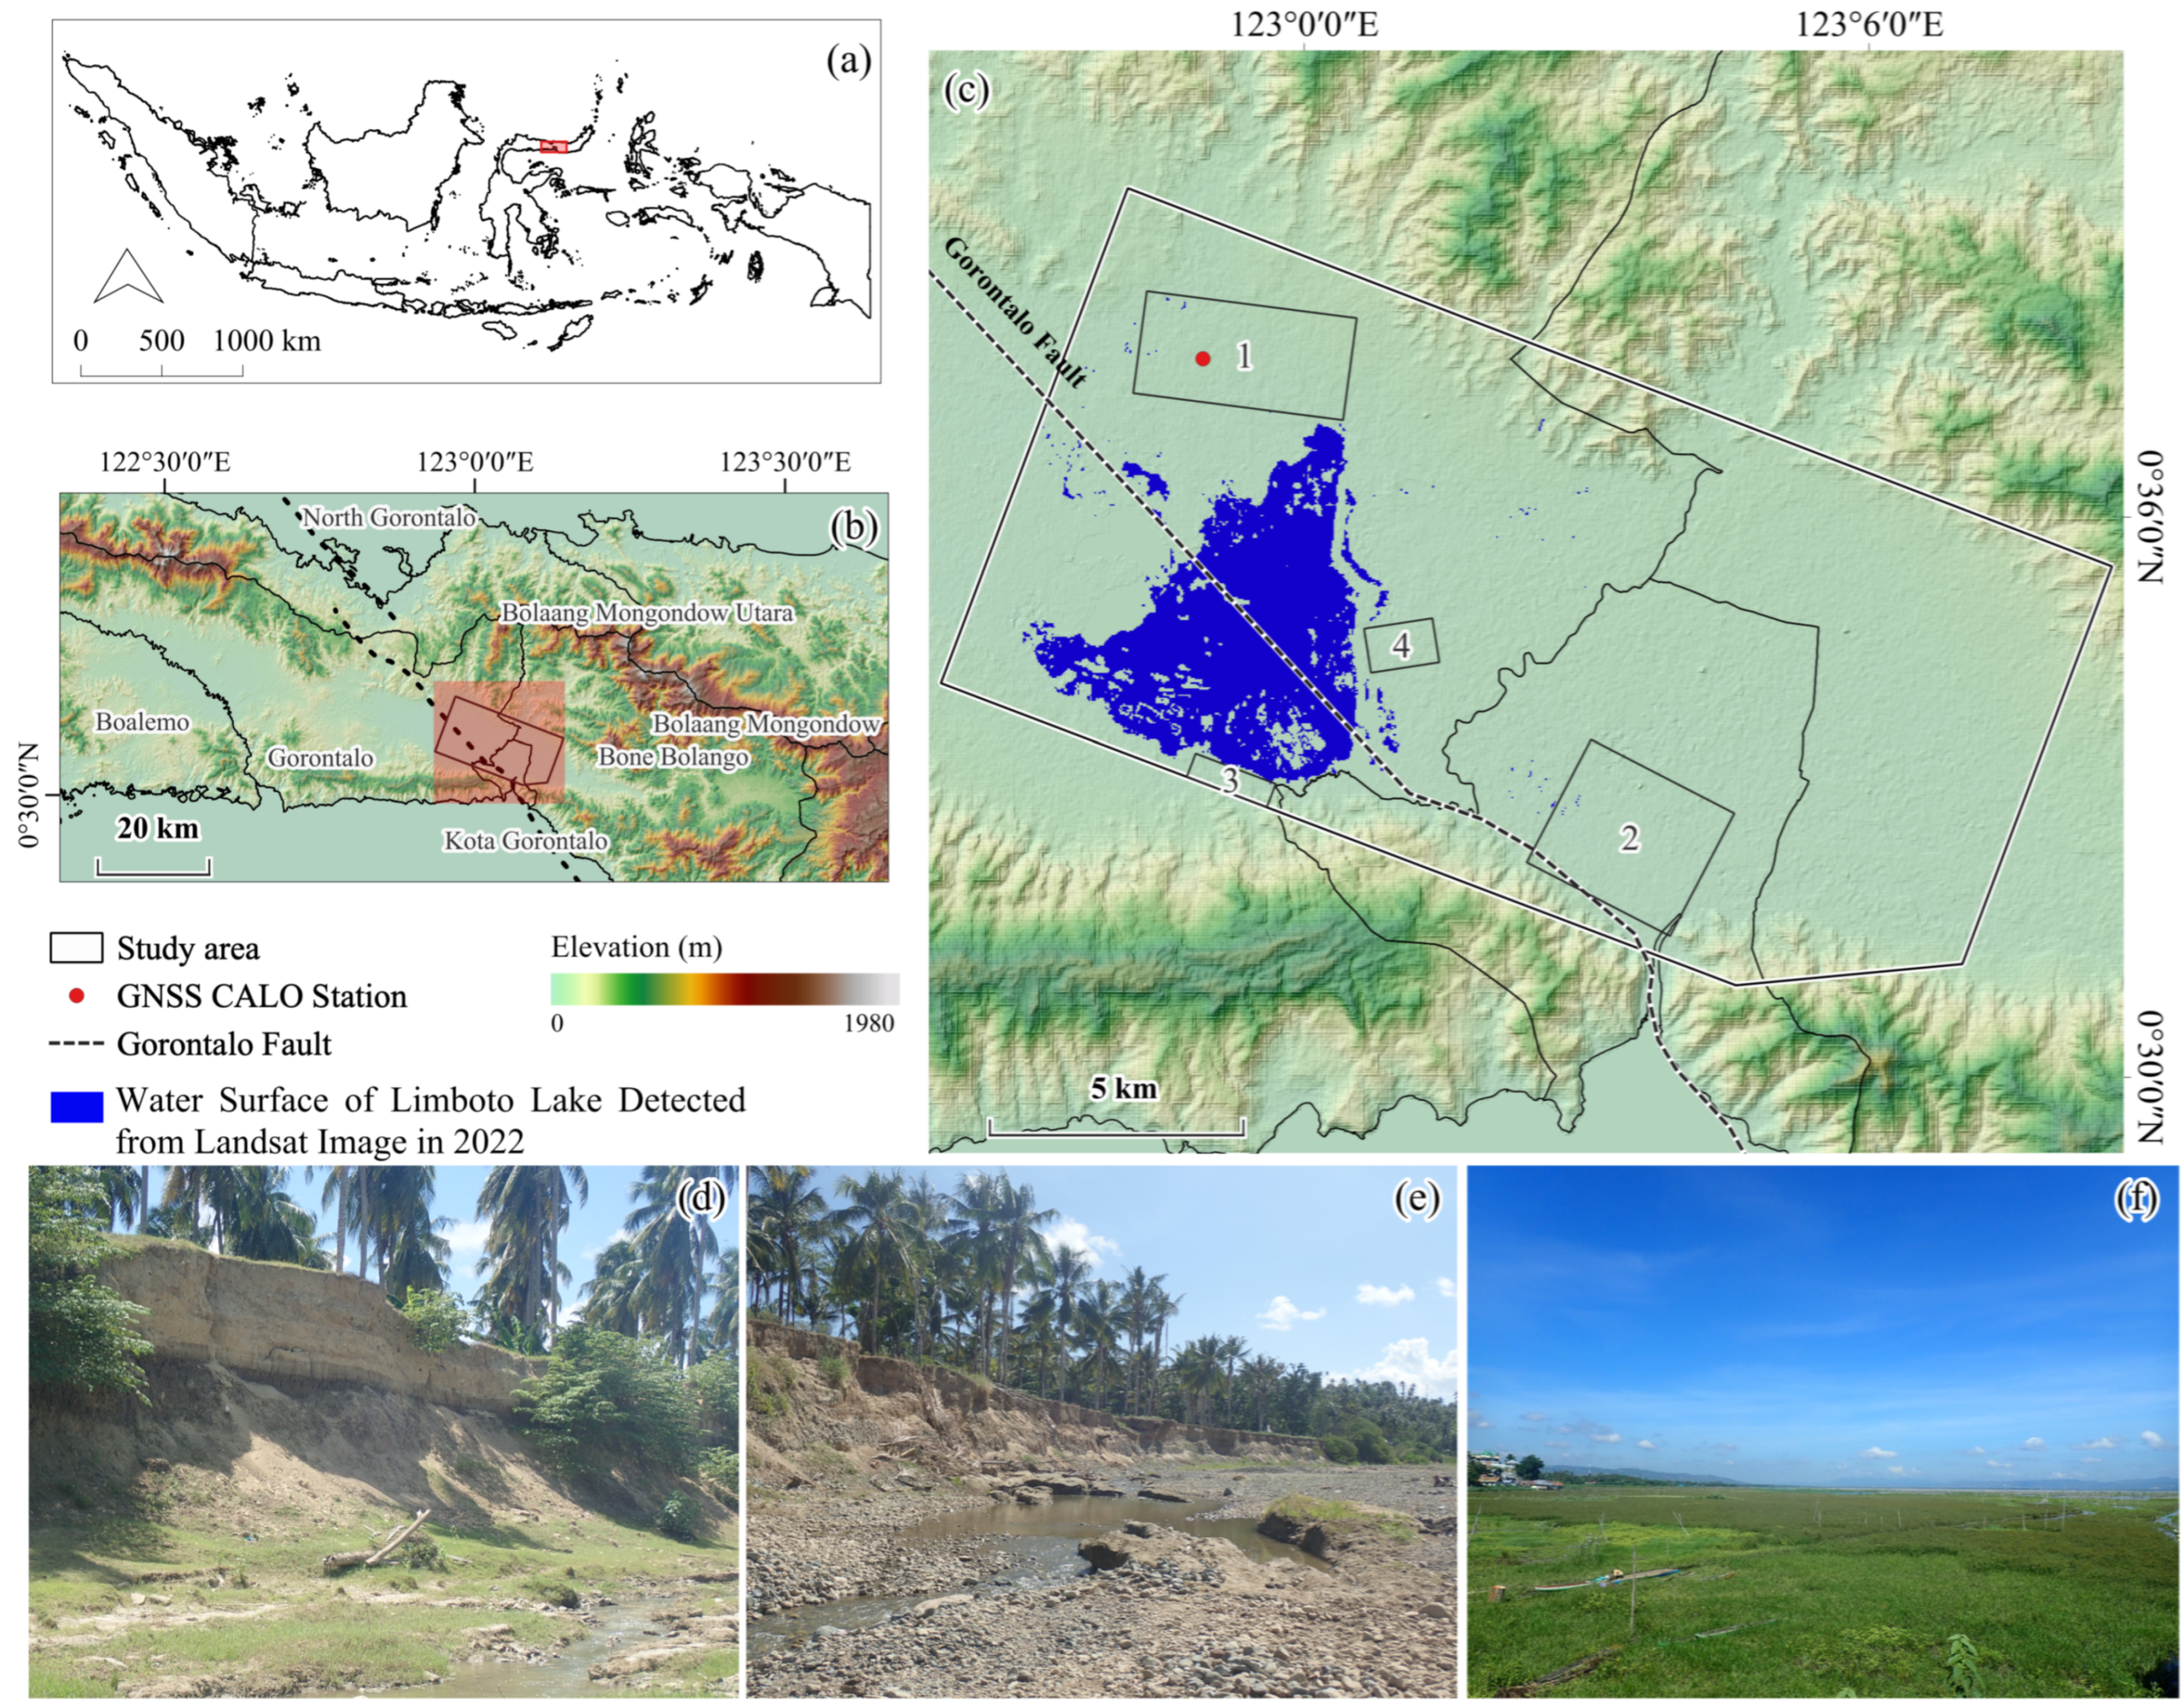
Figure 1 shows the methodological workflow used in this study. The workflow was organized into three main steps to achieve our primary objective of investigating the potential synergistic impacts of land deformation and rapid socio-ecological changes on disaster risk in the alluvial plains of a collision zone. First, vertical land deformation was identified by using the S-1 Differential InSAR (DInSAR) methodology (2020–2023). Second, LCTs were identified by using the Landsat (1981–2022) and Planet (2020–2023) series to assess rapid socio-ecological changes. Supervised classification was applied to the datasets. The extent of built-up area extracted from the Landsat and Planet series was used as a metric of urbanization. Third, the relationship between the results generated from Steps 1 and 2 was assessed to investigate the potential synergistic impacts. We then discuss our findings.

2.2. Study Area

Our study area was located on a flat, lowland plain in the province of Gorontalo, Indonesia (Figure 2). The present-day topography of the area is the result of volcanic activities in the early Quaternary [17]. The basement rocks (e.g., predominantly igneous, sedimentary, and volcanic) were generated between the middle Tertiary and early Quaternary periods [17].
Limboto Lake, which was formed during the pre-Pleistocene uplift of the inner bay [27], has played remarkable ecological, hydrological, and socioeconomic roles [28,29,30]. Unfortunately, it is one of the 10 critically endangered lakes in the country [31] because of various geological [18], socioeconomic [32], and meteorological phenomena or combinations thereof. By 2019, 40% of the surface extent of the lake in 1978 had been largely transformed into land. The result was a decrease in the lake’s water-storing capacity [18]. Flooding is one of the severe hazards that affect many people in the study area [21,33].
The livelihood of most people in the region is either lowland agriculture (e.g., paddy aquaculture and cultivation of corn) or freshwater fisheries. The area under cultivation has increased rapidly since 2001 as a result of a province-level agricultural development strategy [32]. Rapid urbanization with population growth has also been reported [21,32,34].

2.3. Satellite Imagery

2.3.1. Sentinel-1 Series

The S-1A C-band SAR level-1 single look complex (SLC) datasets (interferometric wide-swath mode [IW] operated with the Terrain Observation with Progressive Scan [TOPS] technique, descending track 61, vertical–vertical polarization, and a central incidence angle of 36.7°) were downloaded from the Copernicus Open Access Hub [35]. A SAR signal contains amplitude and phase information, and the IW mode acquires data within a 250 km swath at a spatial resolution of 5 m by 20 m (range by azimuth) [36,37]. We acquired four S-1 SLC images captured from 2020 to 2023 (April).

2.3.2. Landsat Series

Landsat surface reflectance products [38] from 1981 to 2022 were used to investigate the landcover. The imagery was chosen based on seasons (March to May) and cloud coverage (<20%) to minimize the potential impacts of meteorological events and agricultural activities. Images covering the study area were limited to only the years 1981, 2002, 2015, and 2022.

2.3.3. PlanetScope Series

PlanetScope’s Dove-C(PS2), Dove-R(PS2.SD), and SuperDove (PSB-SD) surface reflectance products (Ortho Scene–Analytic Level 3B) [39] captured from 2020 to 2023 (April) were used to explore types of landcover in areas where the land was being deformed.

2.3.4. Auxiliary Data

The time series of precipitation and hourly evaporation in the study area for selection of the S-1 image were obtained from the Climate Hazards Group InfraRed Precipitation with Station (CHIRPS) [40] and European Centre for Medium-Range Weather Forecasts Reanalysis v5 (ERA5) [41] data to minimize possible atmospheric noise. The Shuttle Radar Topography Mission (SRTM) 1 arc-second height (1Sec HGT) data, a joint endeavor of the National Aeronautics and Space Administration, the National Imagery and Mapping Agency, and the German and Italian Space Agencies [42], were used as the Digital Elevation Model (DEM) data. We used Precise Orbit Determination Precise Orbit Ephemerides data with a third-order polynomial to correct the orbit information in the S-1 datasets. Global Navigation Satellite System (GNSS) data from the CALO Continuously Operating Reference Station (CORS) (hereafter referred to as the CALO station) [43], located at 0°37′41.8″N, 122°58′55.4″E, and an elevation of 83.065 m, were obtained as a stable reference point from Badan Informasi Geospasial (BIG) [44].

2.4. Data Processing

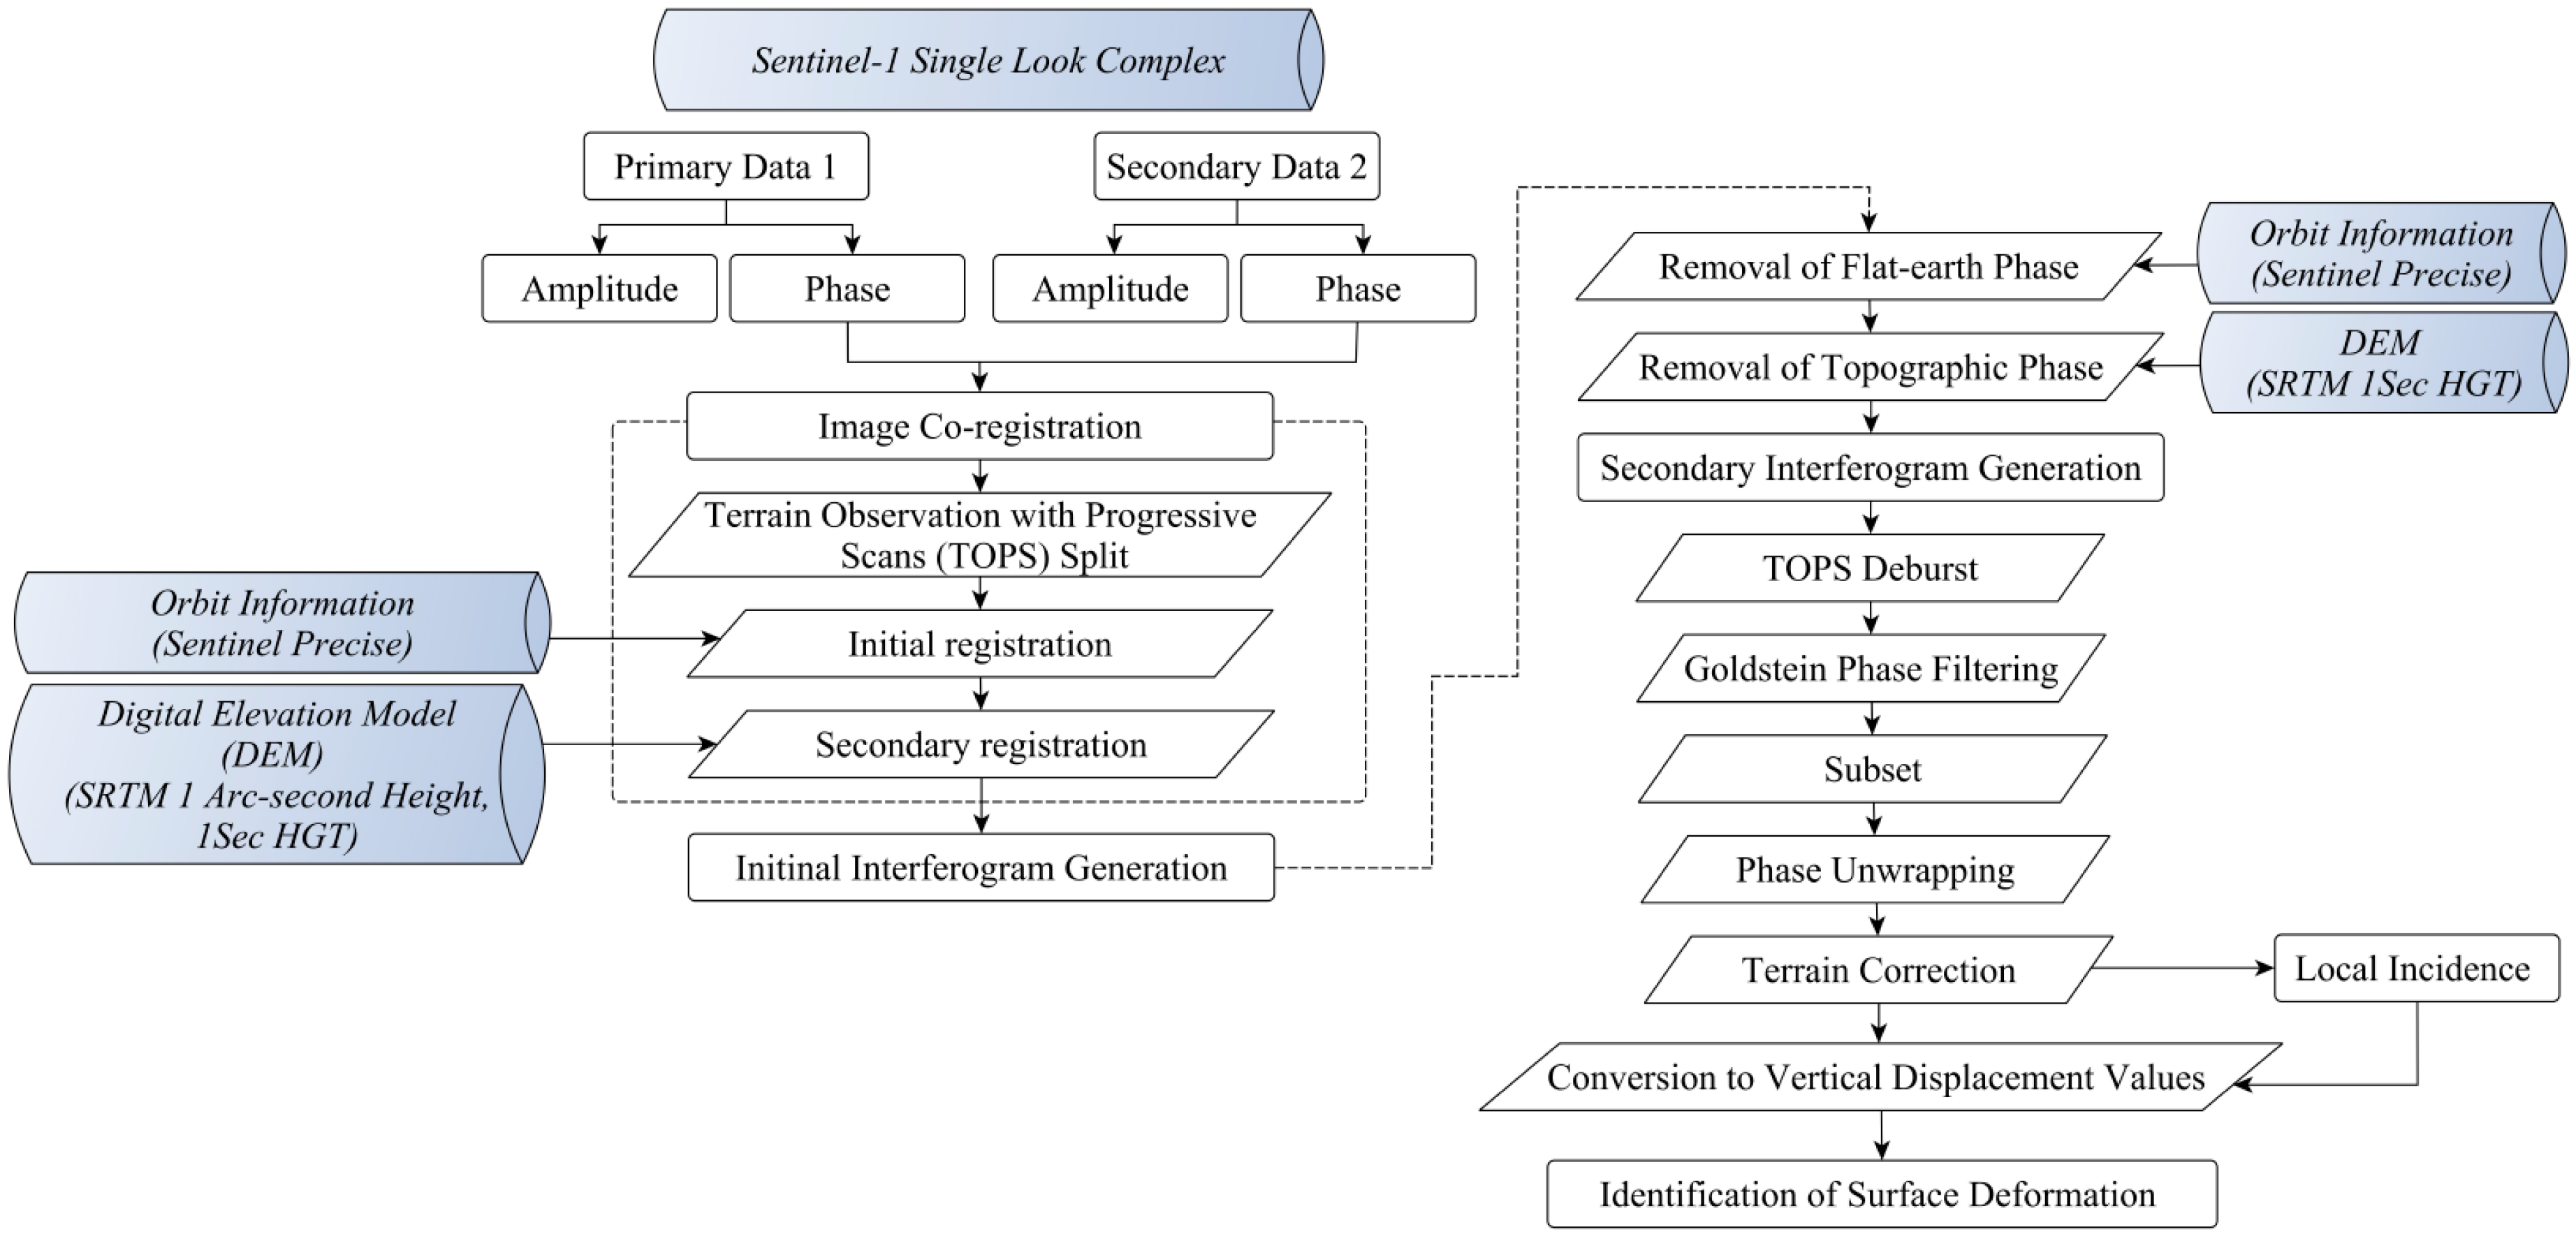
2.4.1. Differential Interferometry Using Sentinel-1 Datasets

Differential interferometry analyzes phase information and obtains the corresponding phase difference of two or more images. Co-registration is a process by which image statistics are used to align primary and secondary images during processing of SAR images to assess the accuracy of sub-pixel matching [36]. S-1 co-registration was performed using Sentinel precise data, and the quality was further enhanced by using SRTM 1Sec HGT data [45]. The computed interference phase, ϕint, was the sum of five contributing factors, as indicated by Equation (1) [36].
ϕint= ϕflat+ ϕDEM+ ϕdisp+ ϕatm+ ϕnoise
where ϕint is the interferometric phase, ϕflat is the flat-Earth phase, ϕDEM is the topographic phase, ϕdisp is the surface deformation phase, ϕatm is the atmospheric delay phase, and ϕnoise is the residual noise phase. The value of ϕflat can be obtained by removing the flat-Earth, topographic, atmospheric delay, and residual noise phases. First, the flat-Earth effects were eliminated using orbital metadata information. Second, SRTM 1Sec HGT data were used to remove the topographic phase. The resultant products contained the interferogram and coherence bands separately, which were displayed in a rainbow color scale ranging from −π to +π [36]. Third, the noise phase was reduced by applying a Goldstein filter [46], which uses a fast Fourier transformation on images to enhance the signal-to-noise ratio [36]. Any unwanted atmospheric phase can be ignored; however, we minimized any possible contributing factors during the process of image selection by referring to the CHIRPS datasets. Next, we performed phase unwrapping to convert phases to line-of-sight (LOS) displacements. Then, the conversion of unwrapped phases to vertical displacements was carried out by using Equation (2) [47].
vert_displ = (ϕunw·λ)/(−4π(cos θinc))
where ϕunw is the unwrapped phase, λ is the radar wavelength, and θinc is the incidence angle. Pixels of low coherence (>0.6) [48,49,50] were masked out.
We used an open-toolbox SAR image processor, ESA’s Sentinel Application Platform (SNAP) [51], to process the S-1 images. We carried out phase unwrapping using the statistical-cost network flow algorithm for phase unwrapping (SNAPHU) plugin [52,53]. Figure 3 shows the methodological workflow of DInSAR. Results were mapped using an open-source Quantum Geographic Information System.

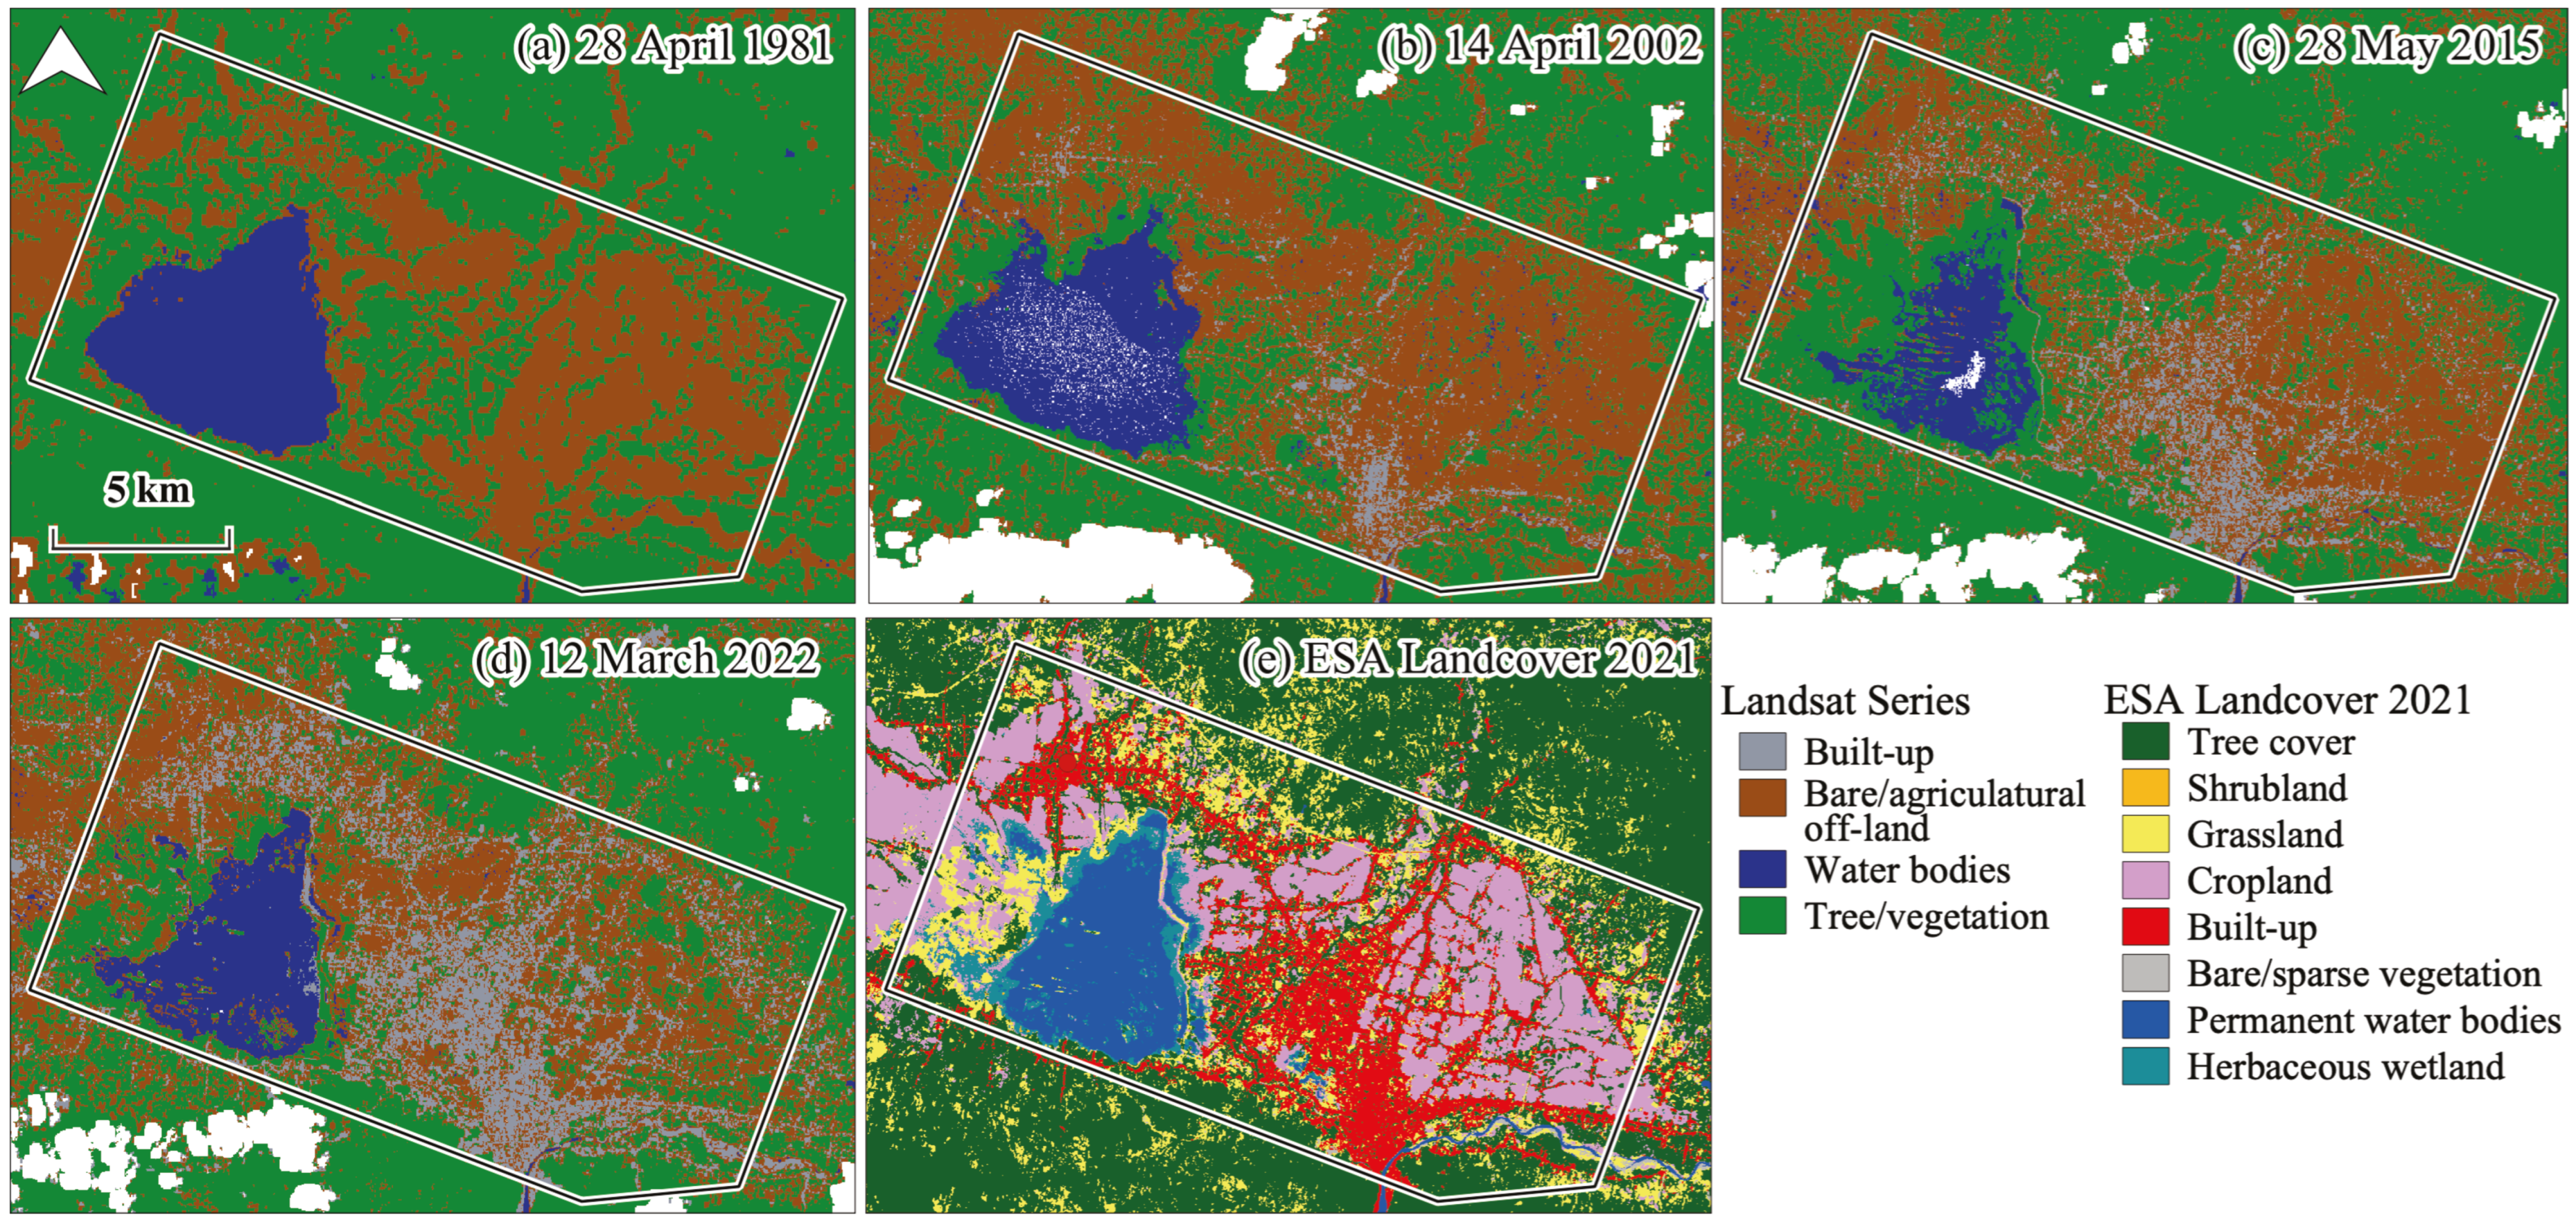
2.4.2. Assessment of Urban Growth, Lake Shrinkage, and Agricultural Development Using Landsat and PlanetScope Series

We applied cloud-masking functions to the acquired Landsat and PlanetScope imageries. Indices such as the bare soil index (BSI), modified normalized difference water index (MNDW), normalized difference built-up index (NDBI), and normalized difference vegetation index (NDVI) were then generated using Equations (3)–(6). The elevation and slope data acquired from the Advanced Land Observation Satellite World 3D-30 m were added to each median composite and the above-generated indices to increase the classification quality. Subsequently, the data were normalized to the range 0–1.
BSI = ((Red + SWIR) − (NIR + Blue))/((Red + SWIR) + (NIR + Blue))
MNDWI = (GreenSWIR)/(Green + SWIR)
NDBI = (SWIRNIR)/(SWIR + NIR)
NDVI = (NIRRed)/(NIR + Red)
The landcover classes in the Landsat and PlanetScope series were categorized into agricultural off-land/barren, built-up, vegetation, and water. We applied a supervised classification for the time series LCT analysis, and we determined the ground control points at the pixel level. In addition, high-resolution imagery obtained via Google Earth Pro on 10 April 2020, 5 April 2022, and 13 April 2023 was utilized during the image classification stage to enhance classification accuracy. We used a simple random forest classification, a method of classification based on machine learning decision trees, with 50 decision trees. The Landsat and PlanetScope datasets were processed via Google Earth Engine. Table 1 summarizes the main specifications of the imagery and sensors used in this work.

2.5. Data Validation

2.5.1. Validation of Land Deformation Results with Global Navigation Satellite System Data

To quantify the DInSAR-derived displacements, we compared them with the GNSS measurements from the CALO station. The GNSS dataset spans the years 2020–2023. We processed 24 h GNSS data over three consecutive days to ensure coverage of the dates of InSAR observations with a margin of ±1 day. The following conditions were set to process the GNSS data: elevation mask > 15°, signal strength = 2.5, and ambiguity ratio = 2.5.
We used MALIB software [54] to process the GNSS data. MALIB is an open-source program package developed by the Japan Aerospace Exploration Agency that is designed for Precise Point Positioning (PPP) using correction services provided by the Quasi-Zenith Satellite System, specifically the Multi-GNSS Advanced Orbit and Clock Augmentation (MADOCA). MALIB is an extension of RTKLIB and was released in October 2024.
Ten points near the CALO station in the study area were selected to make a statistical comparison between the extent of vertical land deformation measured by DInSAR and GNSS. These ten points included the CALO station and were chosen to examine the trends of the vertical deformation of DInSAR compared to the GNSS measurements, especially since only one GNSS CORS station was available in the study area.

2.5.2. Landcover Classification and Accuracy Assessment

The classification accuracy of the landcover maps was assessed using the overall accuracy obtained from confusion matrices, which compare actual and predicted values. We aimed for greater than 85% accuracy per image. The ground control point, classifier, and accuracy assessment were implemented in Google Earth Engine. We calculated the total areas characterized as agricultural off-land/barren, built-up, vegetation, and water, and we visualized the results.

2.6. Correlation Analysis Between Land Deformation and Landcover

We used the Pearson correlation coefficient to statistically assess the relationship between DInSAR-derived land deformation and landcover change extracted from the PlanetScope series from 2020 to 2023. Although the images selected for this analysis were acquired during the same month, noticeable variations in vegetative conditions were observed. Therefore, the analysis focused on areas exhibiting significant vertical land deformation in relation to the extent of built-up area.

3. Results

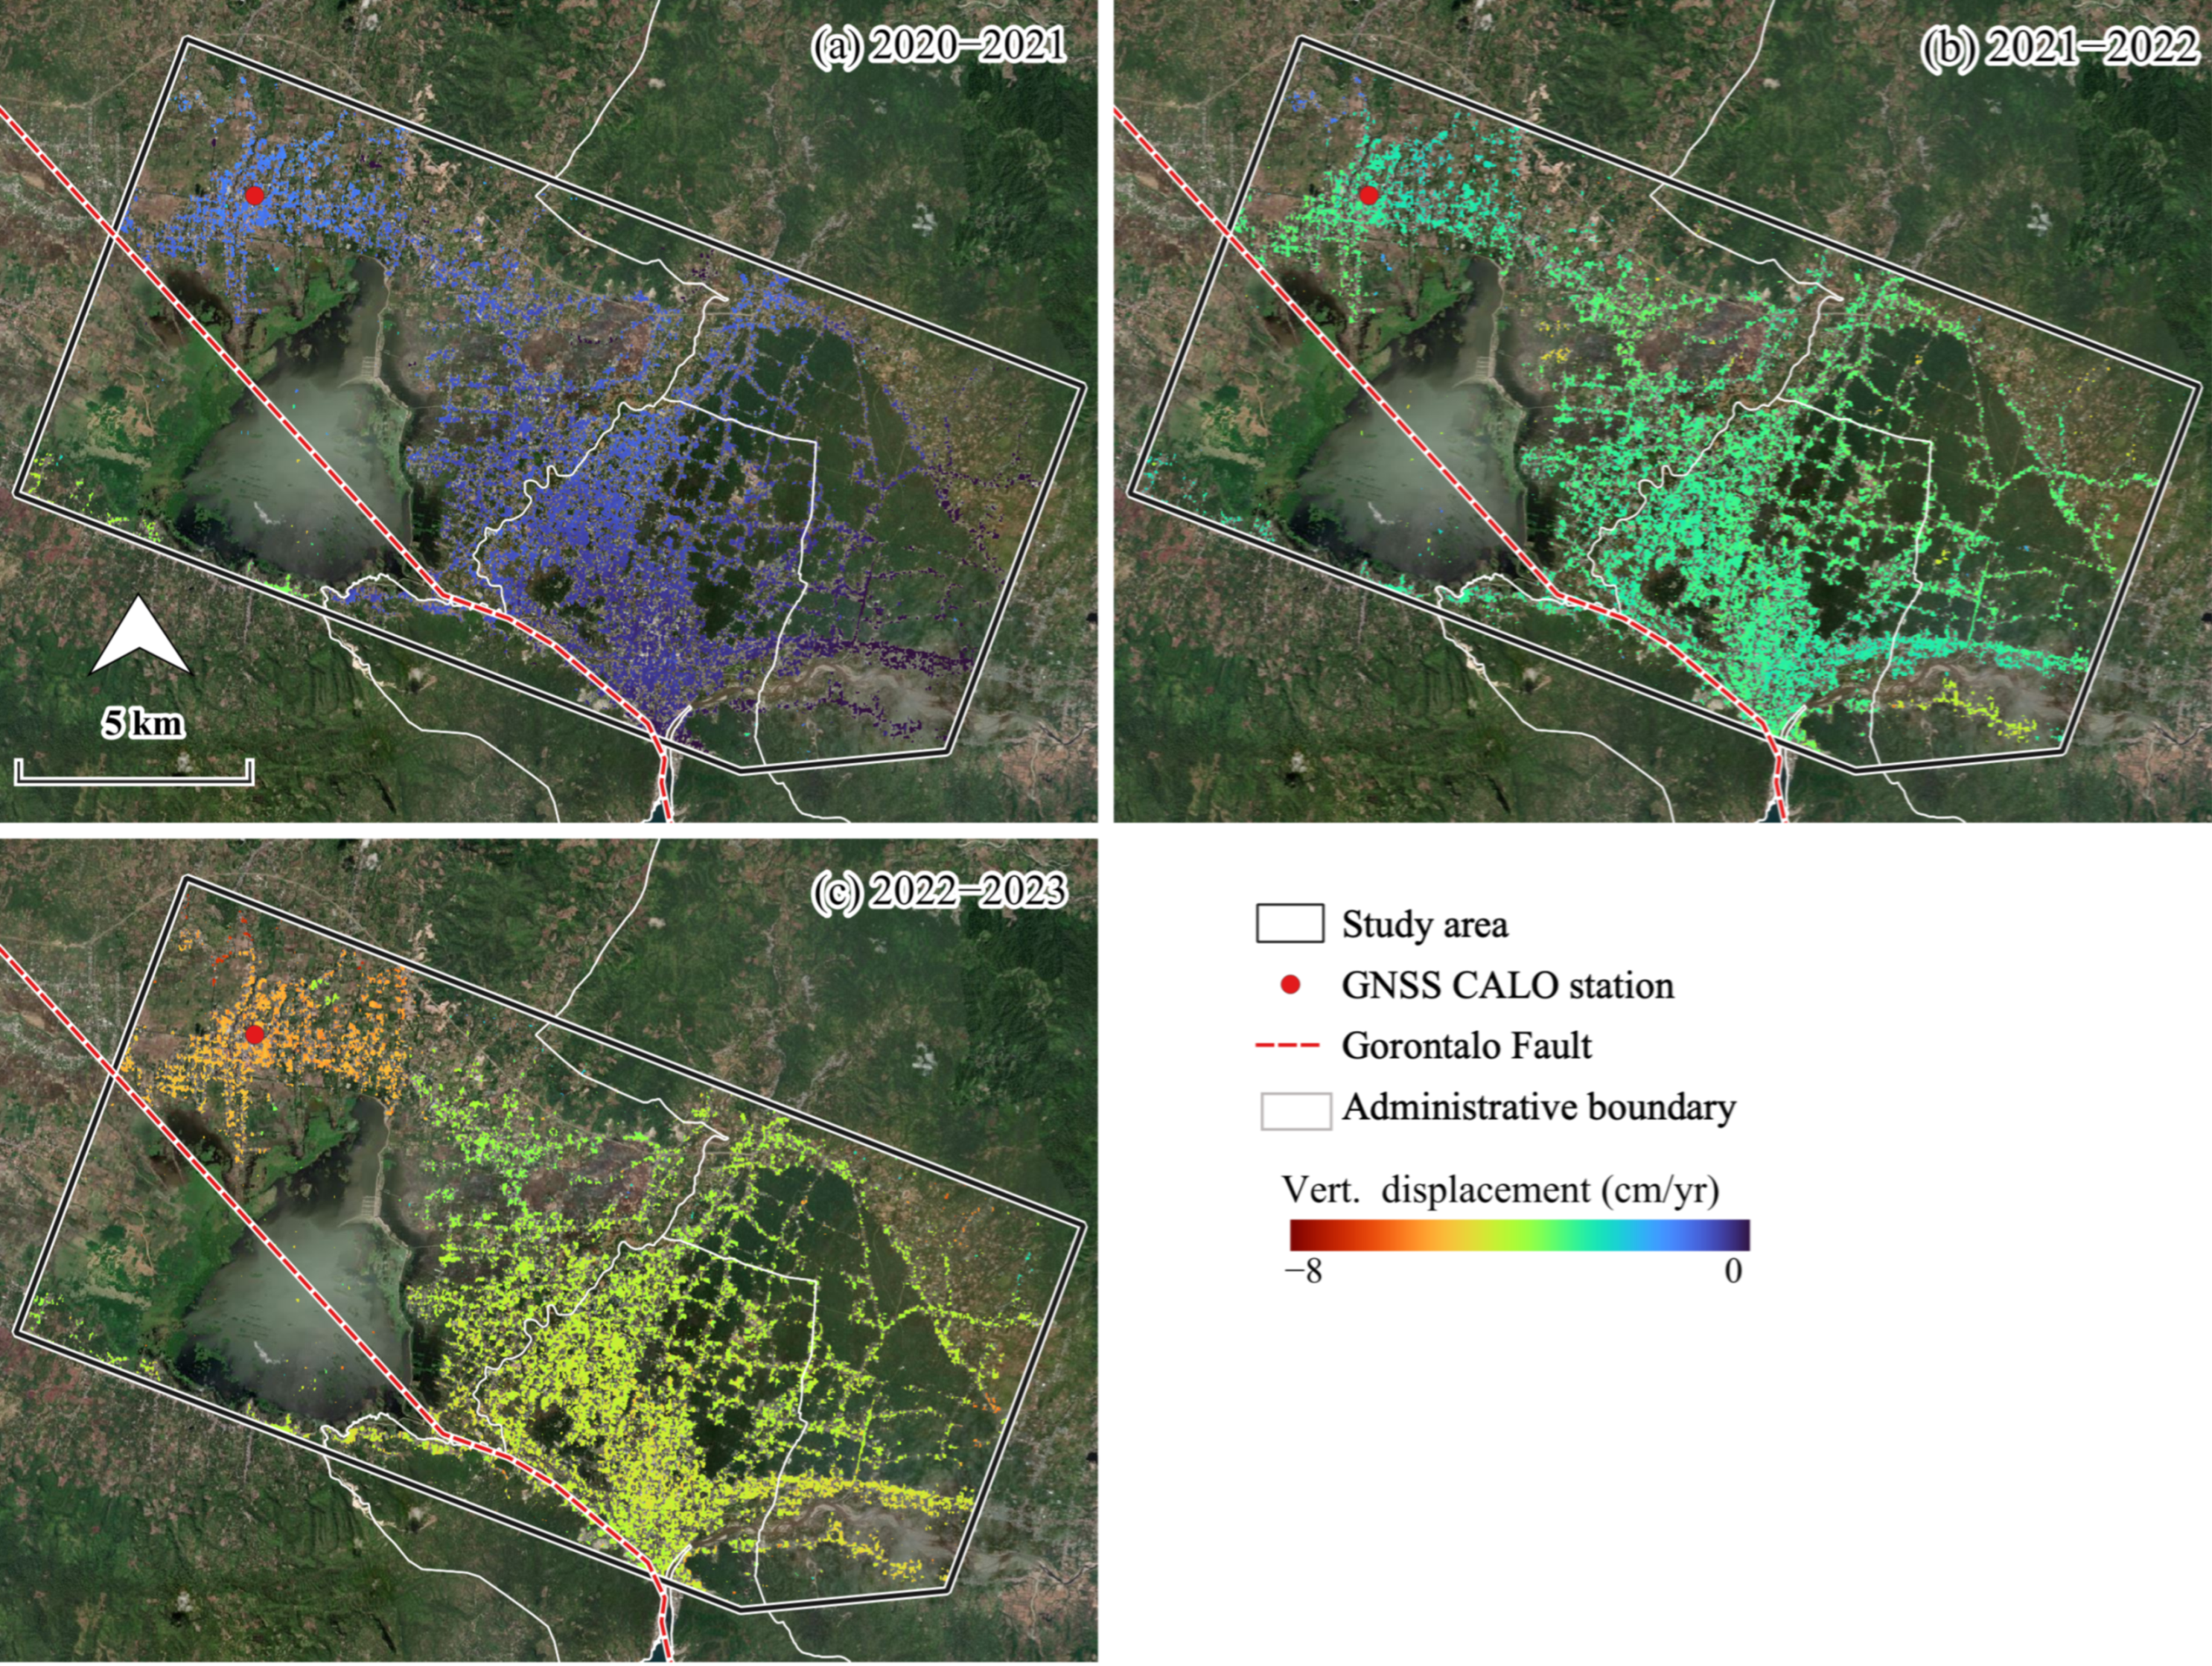
3.1. Spatial Distribution of Sentinel-1 DInSAR Derived Land Deformatin Results

We performed DInSAR analysis of the Gorontalo lowland area from 2020 to 2023 using the descending tracks of S-1. The DInSAR-derived results used an active-land-deformation scale in centimeters to show the LOS displacement of primary and secondary images. The map of land deformation identified changes of fringes throughout the interferograms (Figure 4). Positive LOS velocities represent an upward movement of land towards the satellite, whereas negative LOS velocities represent land subsidence away from the satellite.
Figure 5 shows maps that illustrate the LOS rate of vertical land deformation derived using the DInSAR method based on three time intervals: (a) 4 April 2020 to 11 April 2021; (b) 11 April 2021 to 18 April 2022; and (c) 18 April 2022 to 13 April 2023. The percentages of the area of land deformation extracted from the DInSAR process in our study area were 11.3% (2020–2021), 12.1% (2021–2022), and 12.2% (2022–2023). The areas of land deformation were 24.1 km2 in 2020–2021, 26.0 km2 in 2021–2022, and 25.9 km2 in 2022–2023. The DInSAR scale revealed maximum and minimum deformation rates of −6.2 and −0.9 cm/year, respectively. A sharp transition was apparent in the residential areas located on the northern and southeastern sides of the lake throughout the study period.

3.2. Comparison Between DInSAR Results and GNSS Data

Table 2 compares the time series of DInSAR and GNSS displacements from 2020 to 2023. The Pearson correlation coefficients between the GNSS and DInSAR vertical displacements during the years 2020–2023 ranged from 0.94 to 0.98 with a mean of 0.96. The bias for all points was minimal and ranged from −0.0069 to −0.0039 m, with a mean of −0.0049. The indication was that systematic errors were insignificant. The Root Mean Squared Error (RMSE) values were low (0.010–0.012) and averaged 0.011. The DInSAR data therefore closely matched the GNSS measurements. The standard deviation (SD) of the residuals was consistent across points, with a mean value of 0.0099 m and a range of 0.0087–0.0108 m. Figure 6 provides a comparison of the vertical displacement time series obtained from the GNSS and DinSAR measurements at 10 places between April 2020 and April 2023.

3.3. Time Series Landcover Transformations

The four landcover maps had overall accuracies of 94.1% (1981), 100.0% (2002), 92.0% (2015), and 95.0% (2022) (Figure 7a–d). The observed LCTs from 1981 to 2022 were agricultural off-land/barren (−7.2%), built-up (+461.9%, 2002–2022), vegetation (−28.4%), and water (−28.7%). The increases in the extent of built-up land were particularly remarkable: 0.0 km2 (1981), 8.9 km2 (2002), 21.2 km2 (2015), and 41.9 km2 (2022). However, we also observed the following notable decreases in the extents of water and agricultural off-land/barren land: 30.7 km2 (1981), 29.1 km2 (2002), 15.9 km2 (2015), and 21.9 km2 (2022) of water surface and 93.3 km2 (1981), 109.5 km2 (2002), 96.1 km2 (2015), and 86.9 km2 (2022) of agricultural off-land/barren area. The areas covered by vegetation were 99.9 km2 (1981), 72.9 km2 (2002), 98.6 km2 (2015), and 71.7 km2 (2022).
We detected continuous land subsidence throughout the study period on the northern side of the lake and in the southern part of the city of Gorontalo, mainly in residential areas. The four landcover maps generated from the PlanetScope series had overall accuracies of 86.2% (2020), 87.0% (2021), 88.9% (2022), and 89.3% (2023). The areas exhibiting remarkable vertical land deformation were associated with the extent of built-up area in the time series shown in Figure 8, Figure 9, Figure 10 and Figure 11, but the negative correlations between the extent of vertical land deformation and the built-up area were significant only in the case of area 2: r(1) = −0.87, p = 0.328 (area 1); r(1) = −1.0, p < 0.05 (area 2); r(1) = −0.63, p = 0.569 (area 3); and r(1) = −0.75, p = 0.460 (area 4).

4. Discussion

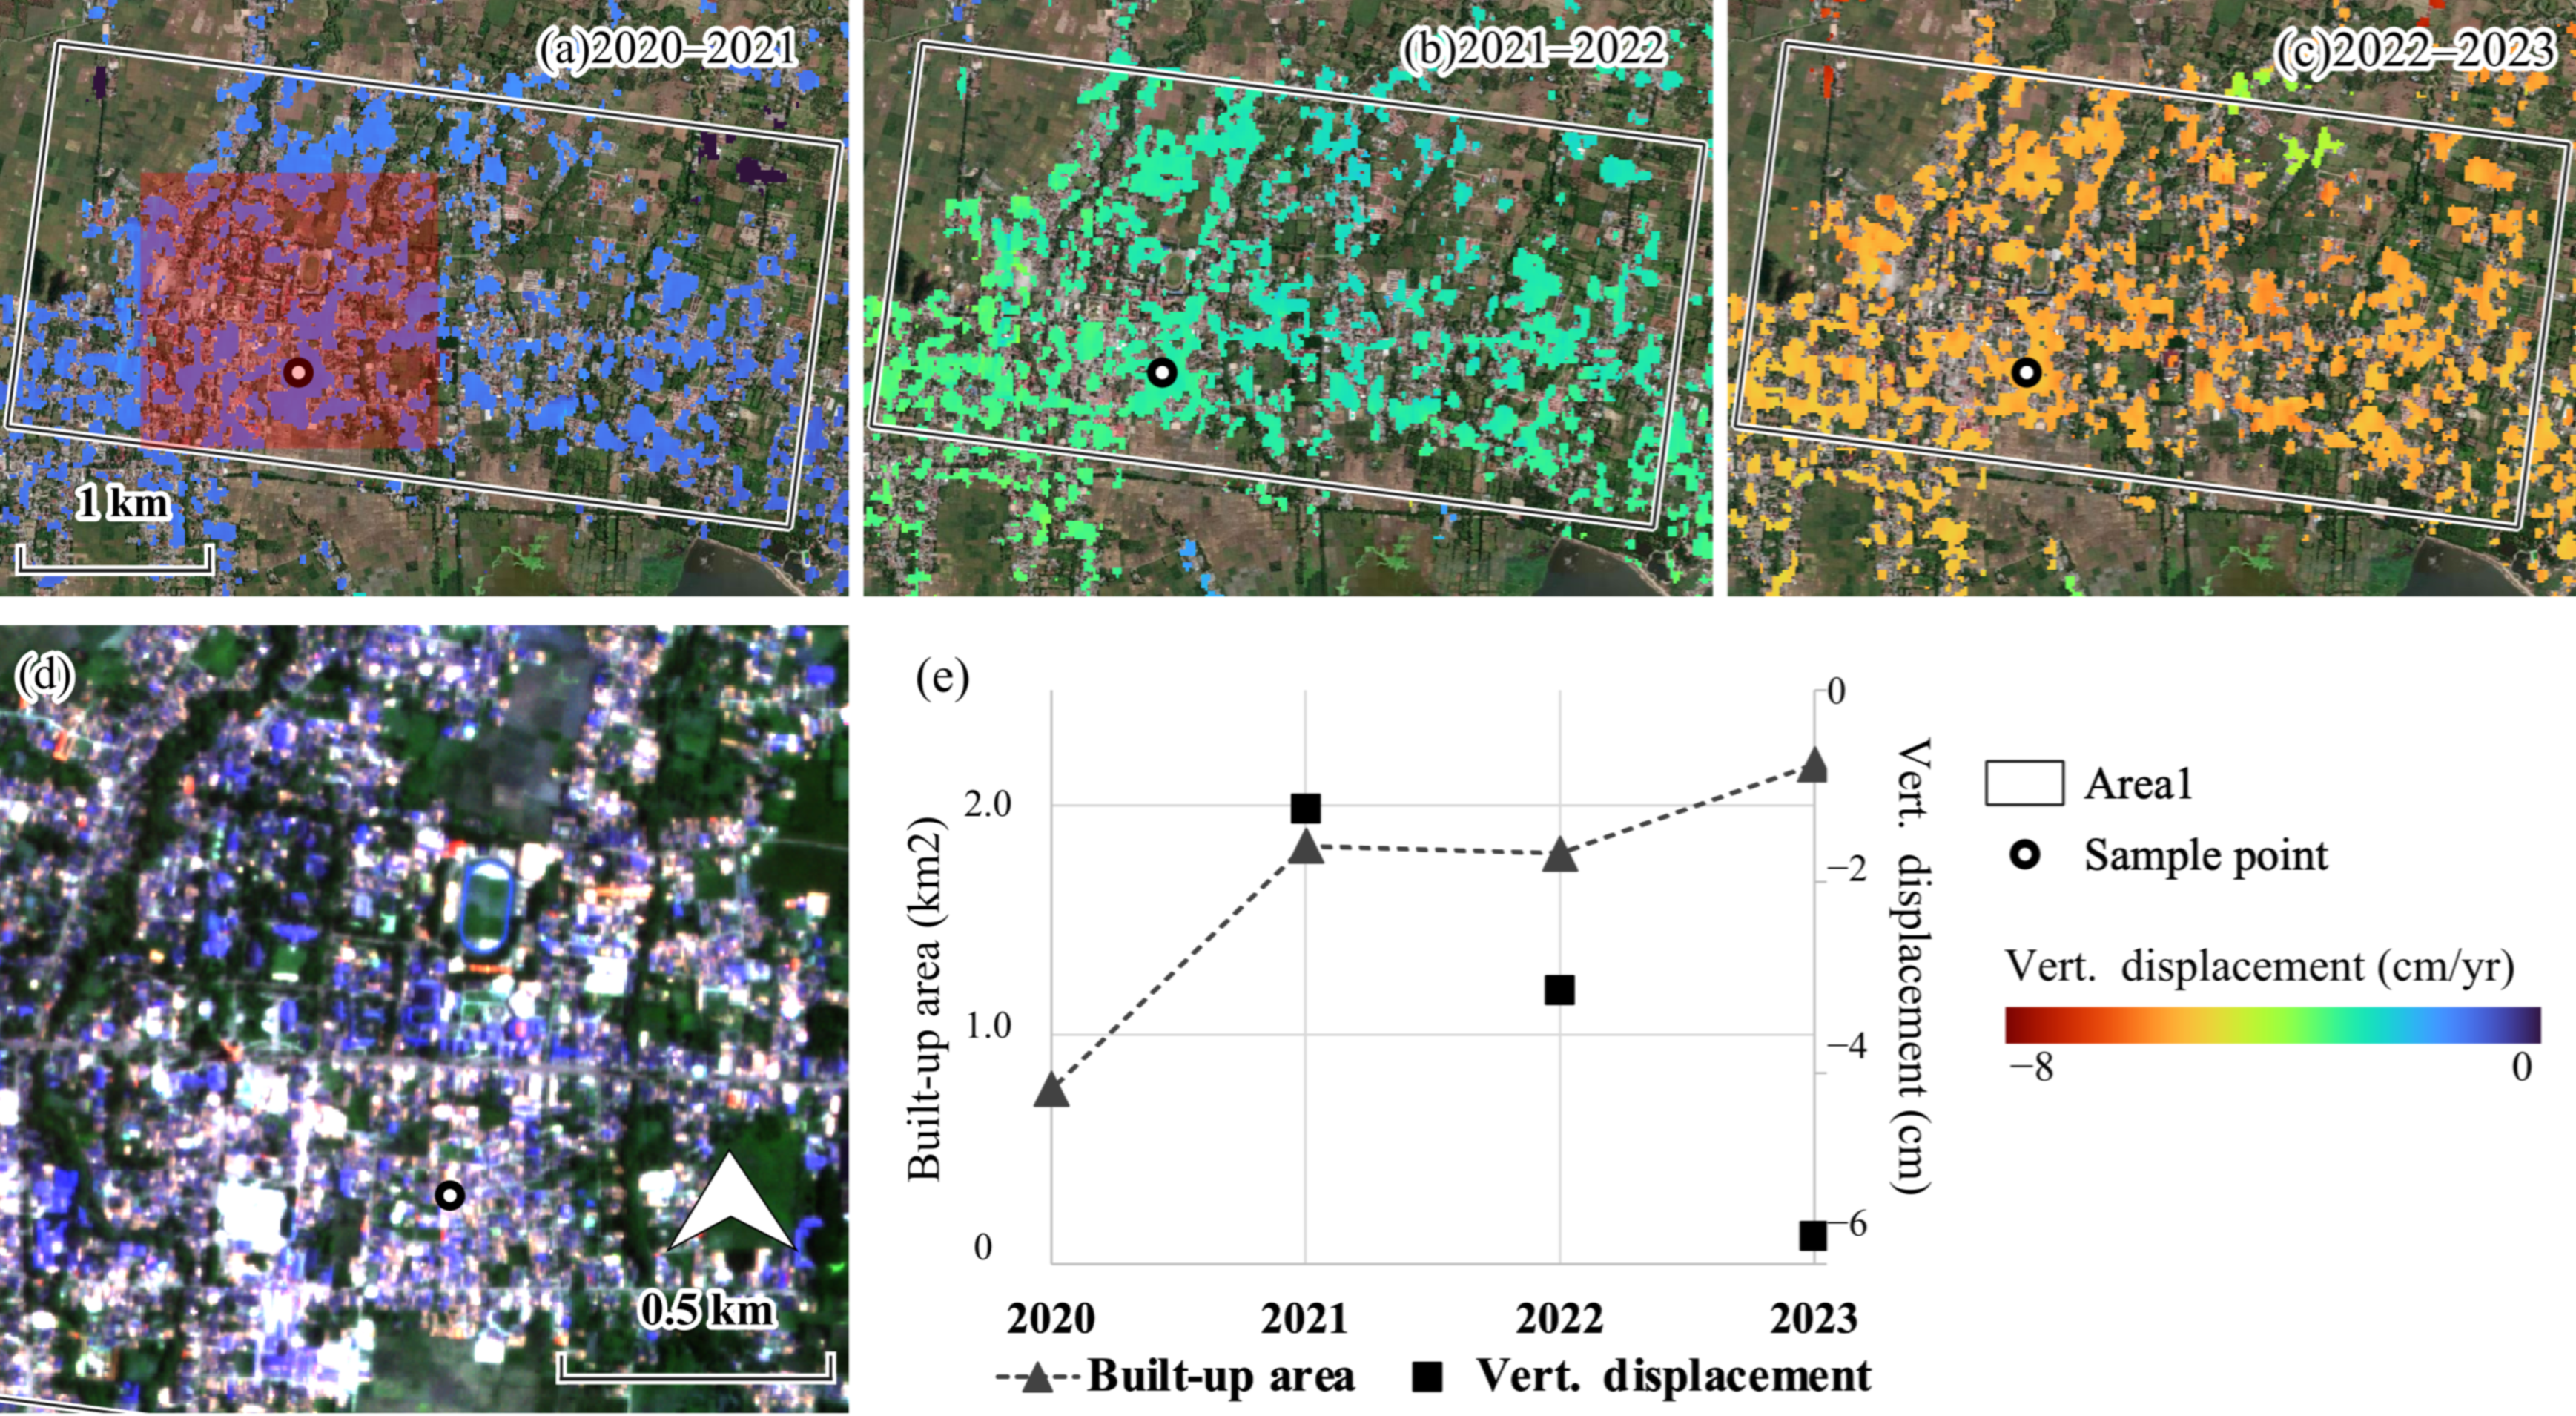
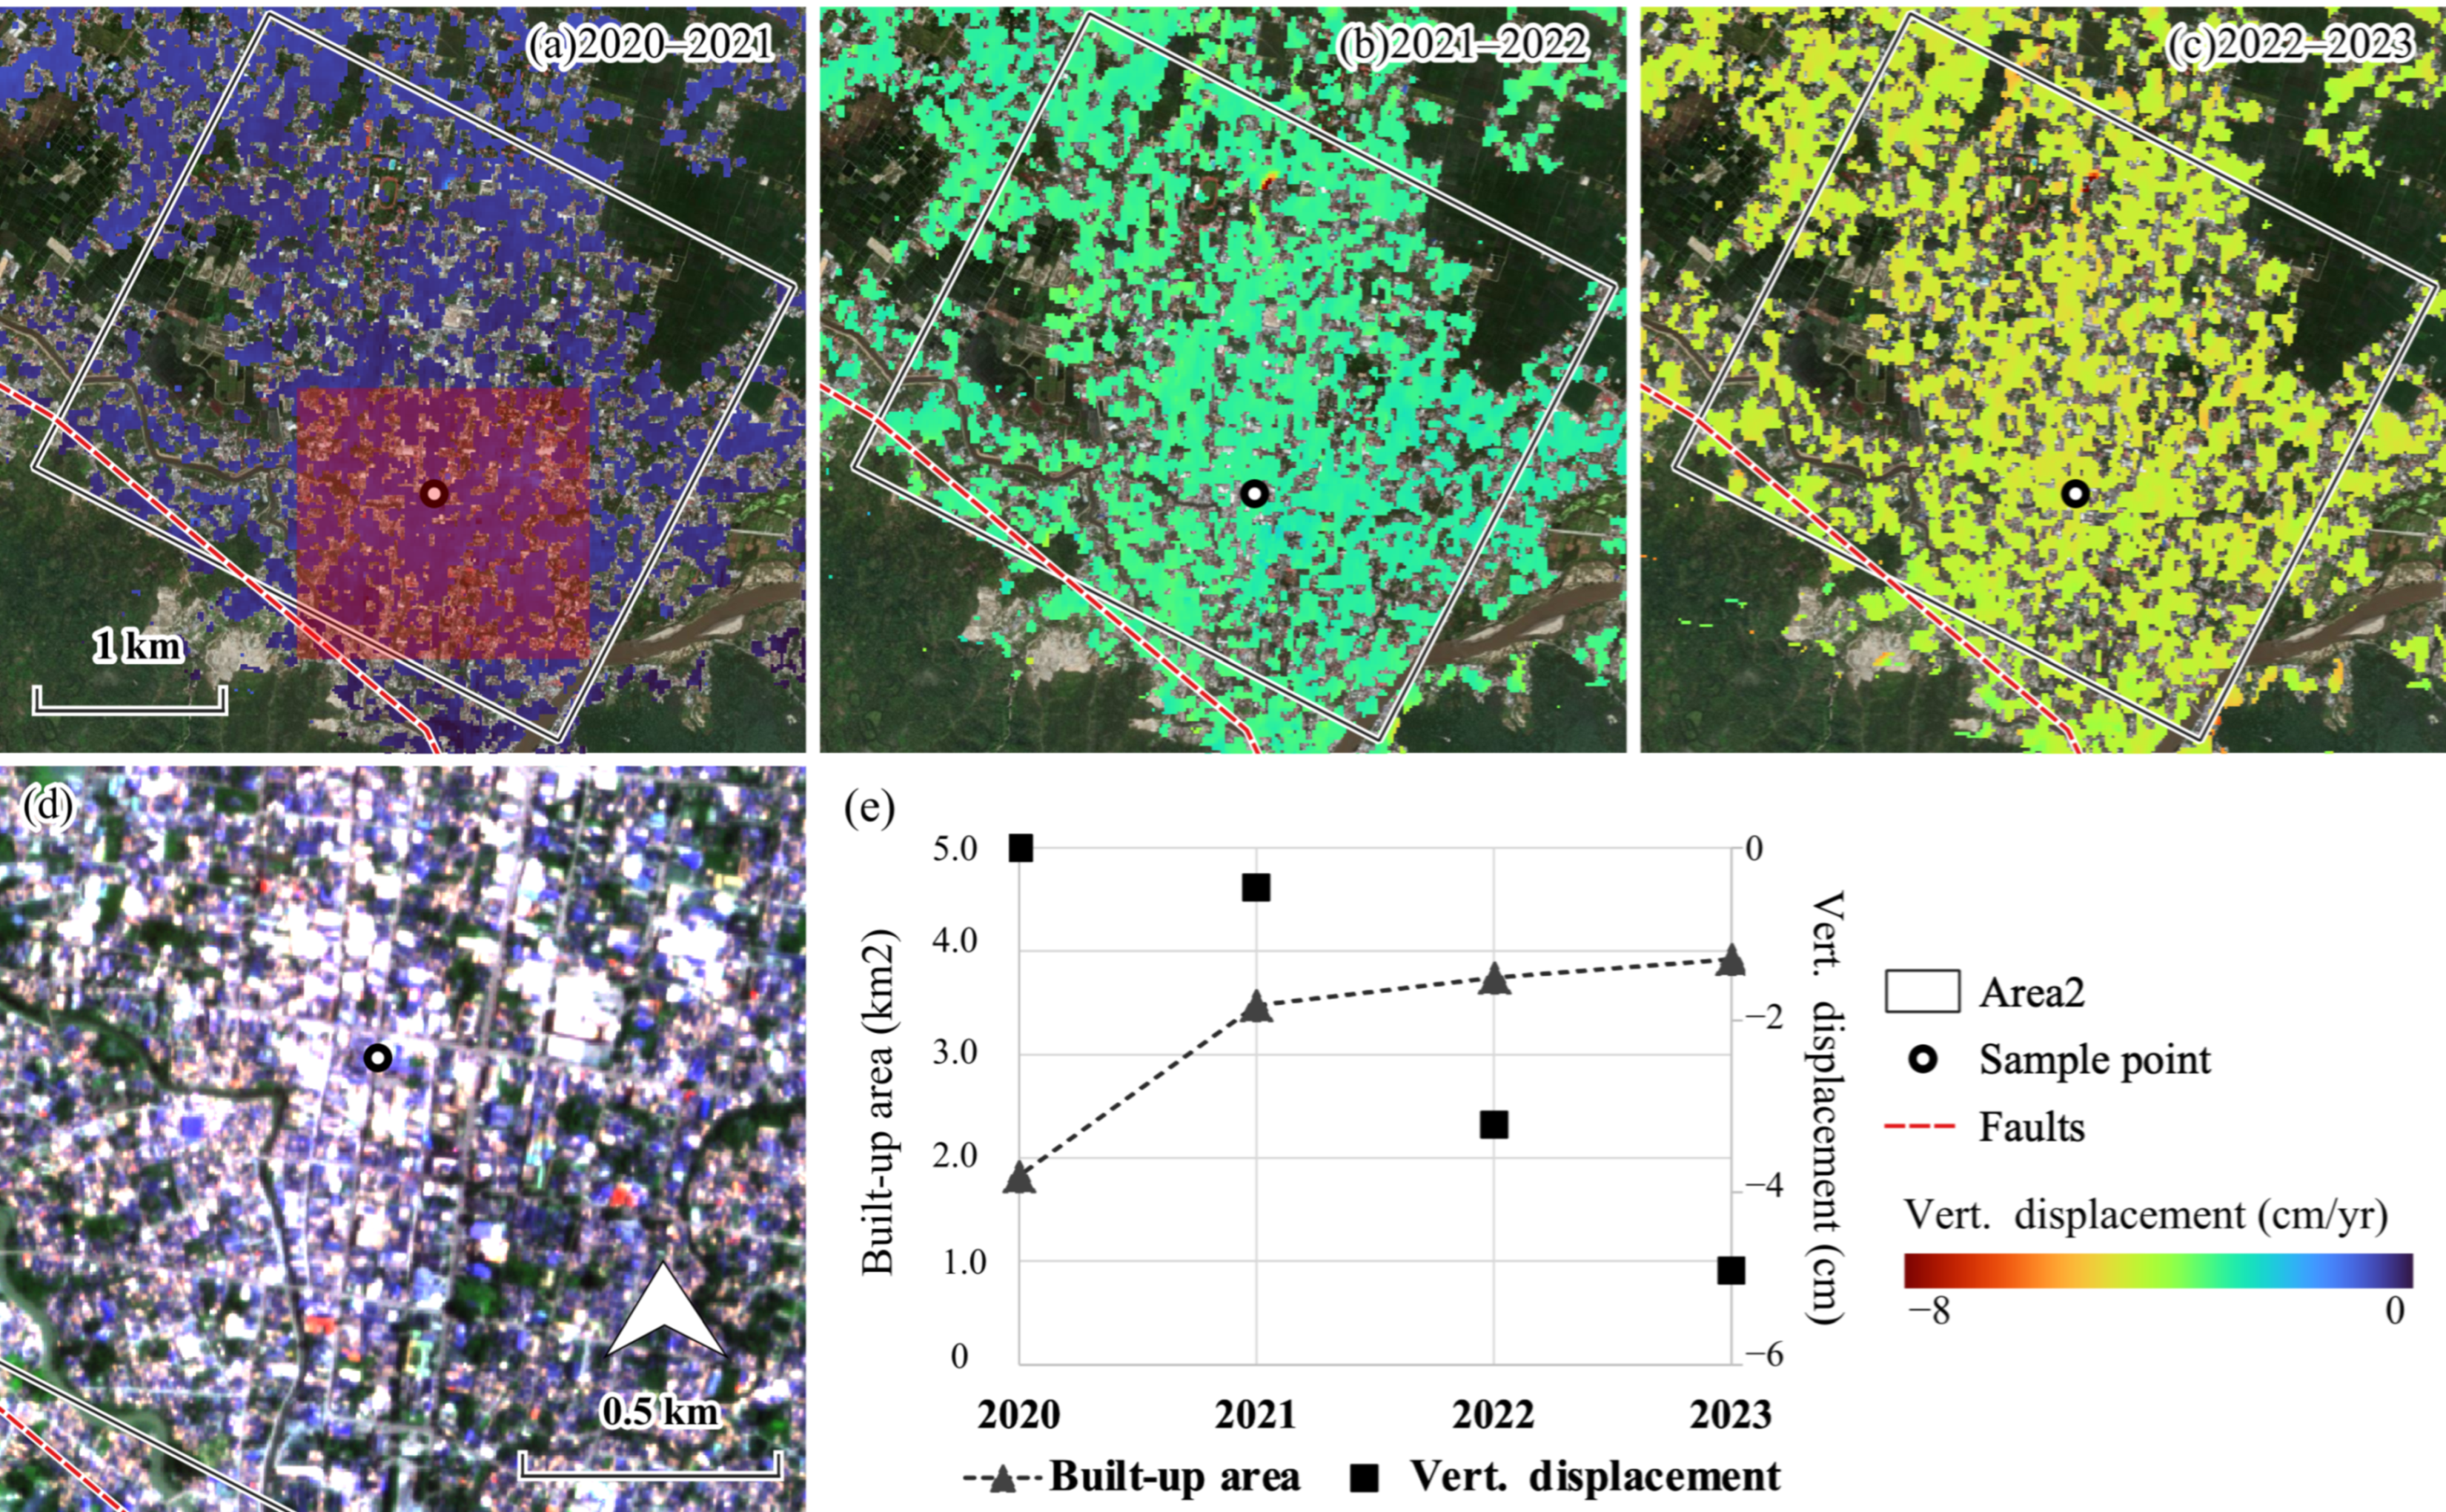
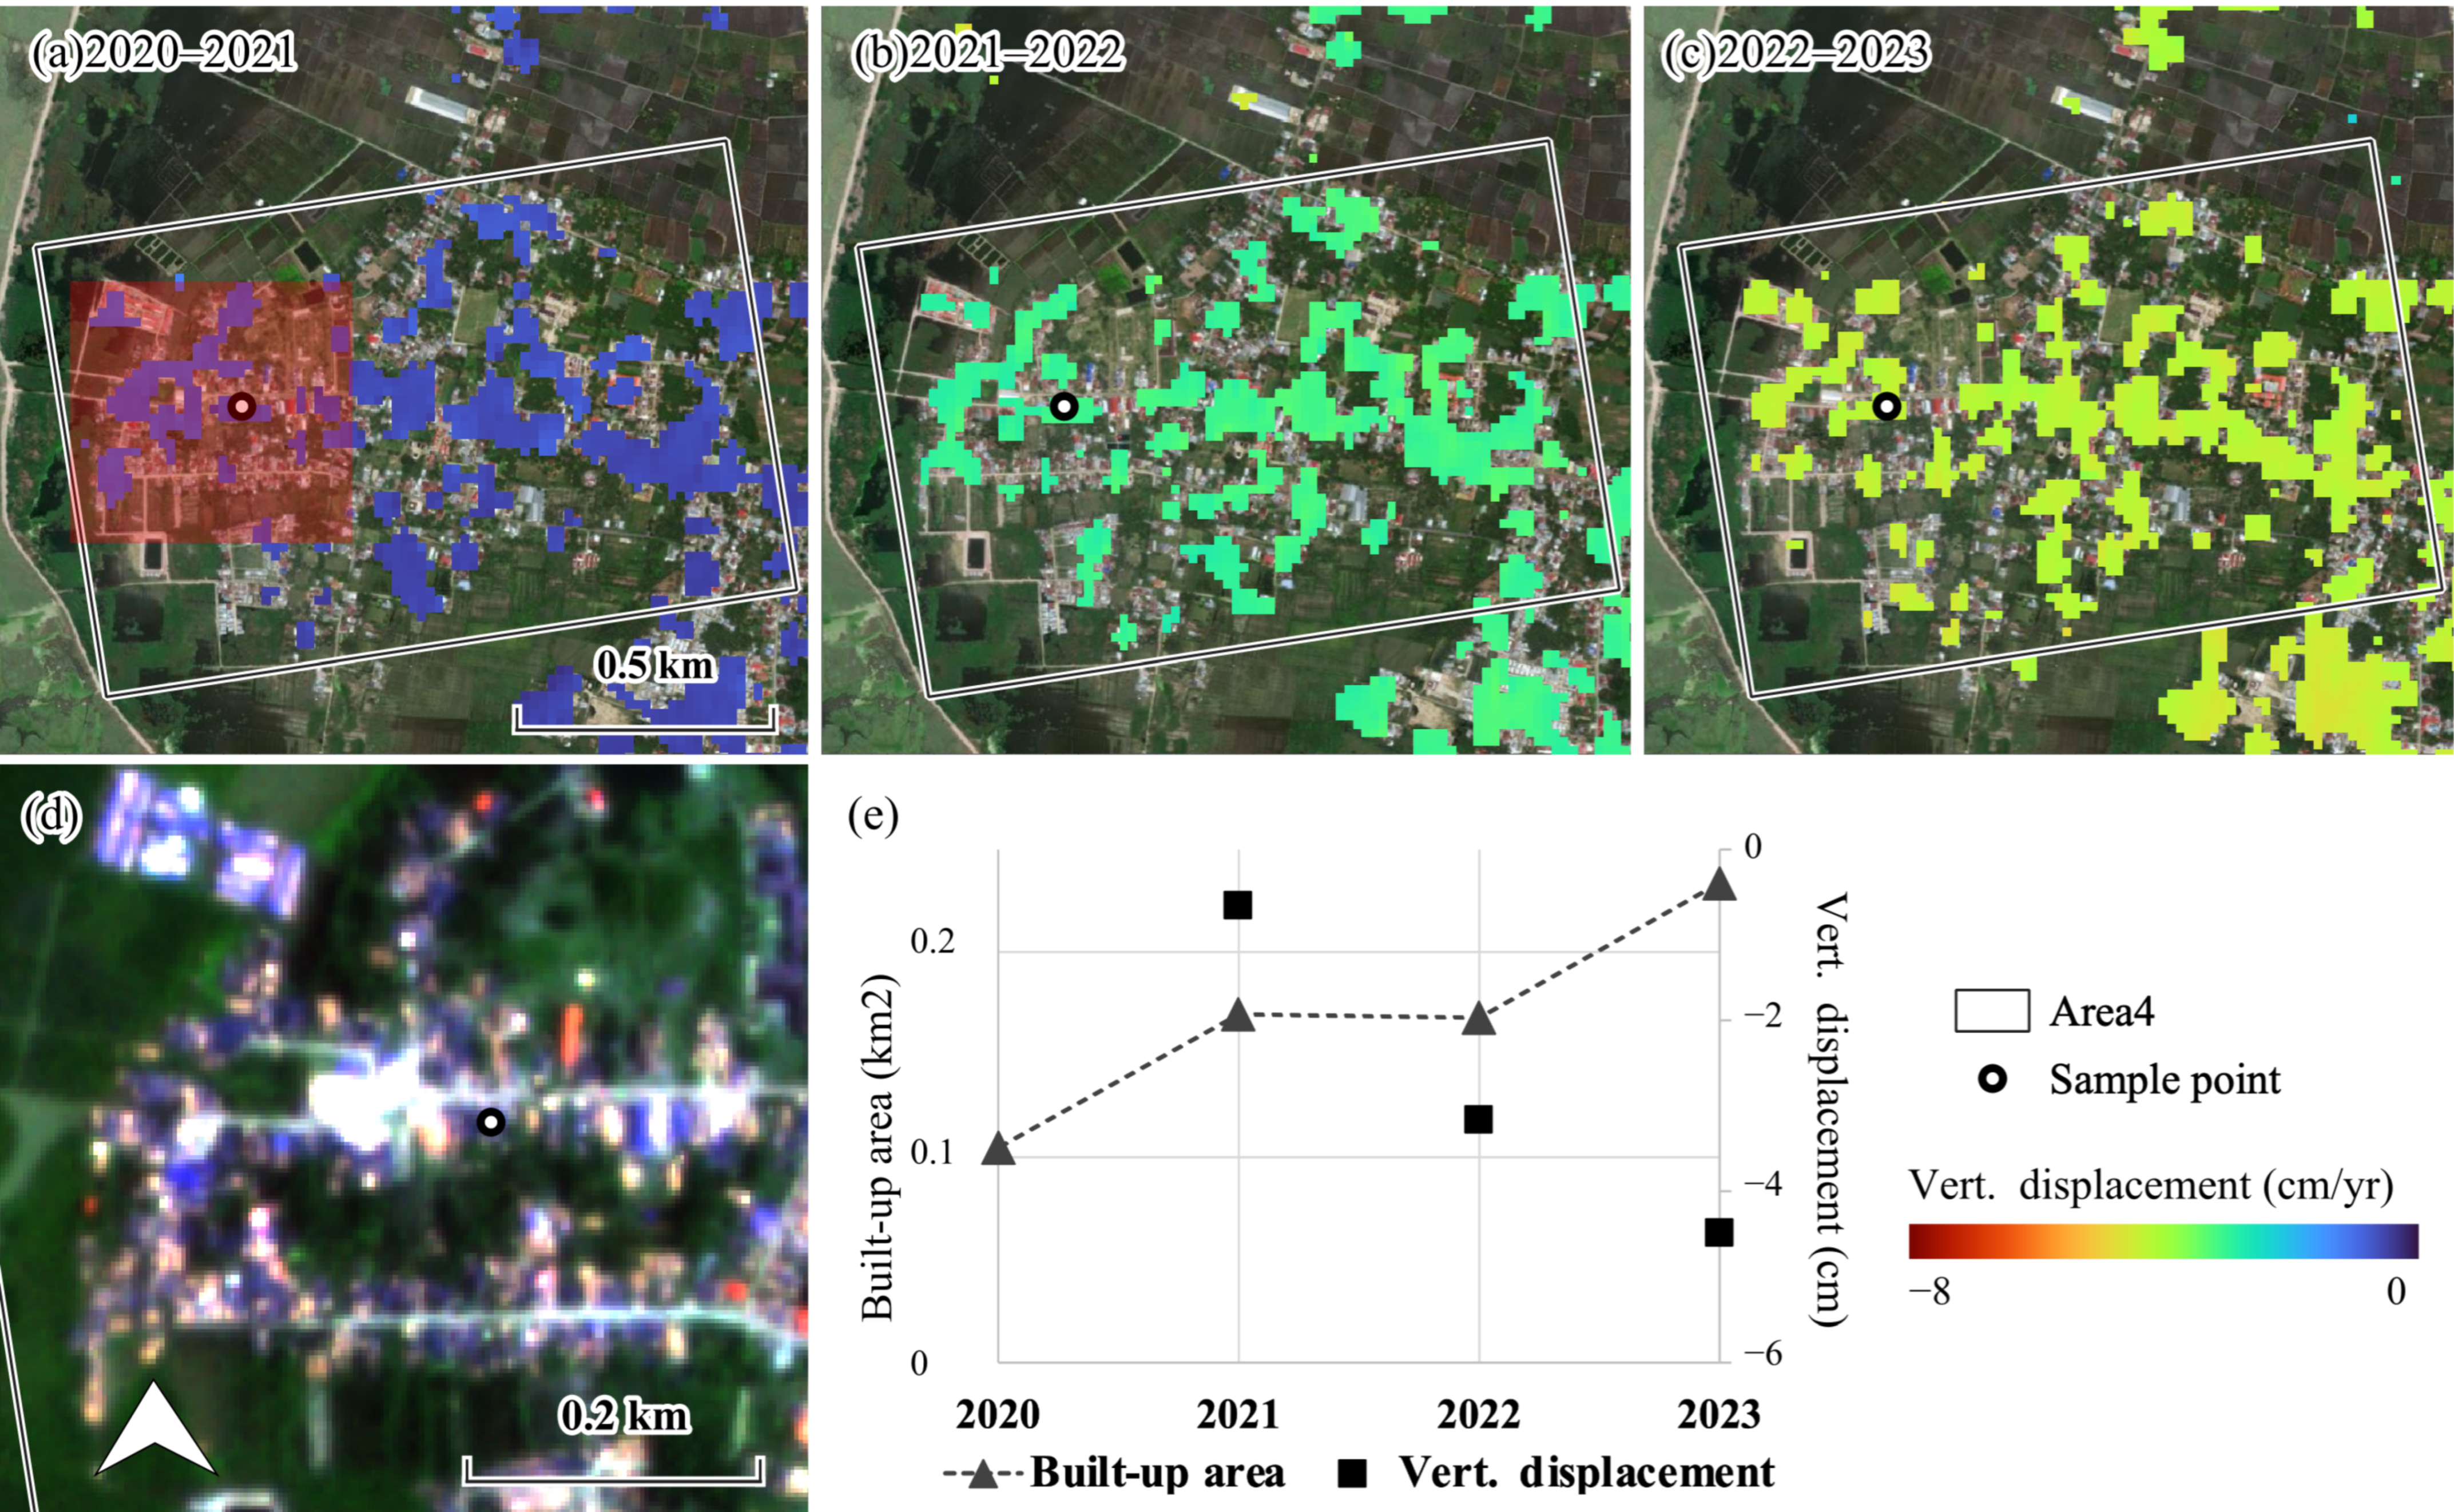
4.1. Time Series Analysis of Vertical Land Deformation and Rapid Socio-Ecological Changes

Soft deposits in geologically unique lowland alluvial regions are vulnerable to land deformation caused by natural processes and anthropogenic activities, meteorological events, or a combination of these [1,2]. Rapid socio-ecological changes in such lowland alluvial regions further exacerbate vulnerability to hazards such as flooding and ground fissuring. Few studies have focused on the potential synergistic impacts of land deformation and rapid socio-ecological changes on disaster risk in a geologically and tectonically unique collision zone. Integrating local, site-specific perspectives into risk assessments will enable better characterization of typical phenomena and the development of location-specific infrastructure-management strategies, plans for urban development, and disaster risk mitigation in such unique regions. In this study, we quantified the temporal changes of the extent of land deformation, socio-ecological changes, and the relationships between them by using a combination of the SAR and moderate-to-high spatiotemporal resolution multispectral datasets.
Previous studies [55,56] have detected the direction and rate of tectonic motions in Sulawesi, Indonesia, using GPS and GNSS observations from 1997 to 2015. However, those studies were limited to horizontal displacements. Estimates of surface deformation derived from leveling measurements are highly reliable and precise; the excellent accuracy of InSAR-based approaches has also been verified [10,11,16,57]. We used an InSAR-based approach in our study to quantify the extent of vertical land deformation and its pace and pattern (Figure 5, Figure 8, Figure 9, Figure 10 and Figure 11).
Another recent geological investigation [18] has focused on the Limboto region, which is comparable to the region we studied. That study explored the mechanisms responsible for rapid lake shrinkage through Landsat time series analysis of LCTs and an investigation of river outcrops. However, the geological investigation of the mechanism of rapid lake shrinkage was qualitative, and the study did not address the considerable effect of rapid socio-ecological change in combination with land deformation. However, the relationship between the amount of vertical land deformation and LCTs in sensitive areas was assessed statistically via time series analysis.
Human activities have frequently been considered to be among the most significant causes of land deformation [1,5,7,9,10]. A previous study conducted in western Indonesia has revealed significant relationships between land deformation and land use [5]. Although our work demonstrated the extent, distribution, pace, and pattern of land deformation, the relationships of these metrics with landcover were not significant (Section 3.3). This result may be explained by the limited sample size, which could have constrained the statistical power of the analysis. The results suggest that active tectonic activity [12,13,14,15,17,18,55,56] was also a fundamental cause of the deformation, particularly in lowland regions with fine-grained sediments in the collision zone. Regions where significant tectonic activity may cause sedimentological and geomorphologic modification of the landscape are influenced by the complex interrelationships between nature and human-induced phenomena [58]. However, GNSS data at the CALO station are available only from 2020. To better understand the above-mentioned relationships, continuous data acquisition should therefore be carried out in the future.

4.2. Consequences of Land Deformation in Combination of Rapid Socio-Ecological Changes

In Indonesia, land deformation significantly increases the risk of disasters, which are exacerbated by tectonic processes and geological events. Consideration of rapid socio-ecological changes enables a more systematic analysis and understanding of vulnerability to disasters.
Substantial shrinkage of a lake decreases the lake’s water-storing capacity. This problem has been apparent in the case of Limboto Lake, and because of that shrinkage, the region around the lake is more vulnerable to natural hazards such as flooding. A decrease in the volume of lake water can result in the extraction of massive volumes of groundwater for agricultural purposes, daily use, and socioeconomic development (e.g., strategic agricultural development [32], urbanization, and population growth [21,34]). Reported volumes of extracted groundwater can be misleading because in developing countries, including Indonesia, a large number of wells are unregistered [5]. However, the parameters of the LCTs that we used in this study can serve as metrics of the volumes of groundwater likely to have been extracted. Such rapid development further accelerates the processes of ecological change and increases the risk of disasters.
The results shown in the previous sections imply that the risk of hazards such as flooding and ground fissuring in areas experiencing land deformation is likely enhanced when there are rapid socio-ecological transformations. This greater risk was evidenced by the rapid erosion of fine-grained sediments from the riverbank. Those sediments readily flowed into the lake and accelerated the sedimentation process [18]. The decreased capacity of the lake to store water resulted in both direct and indirect overflows of floodwater from different sources that affected the surrounding areas [21,33,59,60,61,62] where land deformation has occurred. Knowledge of such effects will enable further development of adequate, location-specific infrastructure and disaster-related risk management strategies in the future. Our work expanded upon a previous study [18,21] to reveal the flooding risks associated with tectonically induced land deformation and rapid socio-ecological transformation.

4.3. Limitations

The limitations of this study are associated with the characteristics of the datasets used. First, because only descending S-1A acquisitions were available, we could not retrieve data on land deformation from an ascending angle (S-1B). Second, although the SAR data provided weather-independent, active observations, signals of C-band SAR will typically not penetrate through a cover of vegetation. The application of C-band SAR for ground deformation is thus limited in areas covered by vegetation. Third, only one GNSS CORS station (located at the CALO station) was available in the study area, and its data were available only from 2020 [43]. As a result, our assessment of land deformation was limited after 2020. Fourth, the differences in the spatial resolutions of the datasets we used could cause mixing of pixels at different levels and possibly result in an overestimation or a miscalculation of the landcover. In particular, the most frequent misclassification in our study was classification of barren areas as built-up areas. A highly reflective bare soil surface can also be represented as a built-up area [30]. Fifth, the correlation analysis was limited to the correlation between land deformation and the extent of built-up area because of differences in the variations of vegetation, even though the images in this study were acquired in the same month.

5. Conclusions

In this study, we investigated the potential synergistic impact of land deformation and rapid socio-ecological changes on disaster risk in lowland alluvial regions of a collision zone in Gorontalo, Indonesia, using Sentinel-1, Landsat, and PlanetScope data. Rates of vertical land deformation were as high as ~6 cm/year. We found negative high correlations between the extent of vertical land deformation and built-up area, but the relationships were significant only in the case of area 2. This result may be attributed to the limited sample size. Quantifying this level of detail enabled us to identify the relationships between these metrics and to warn of the potential hazards caused by synergistic effects, including flood inundation and ground fissuring, on a broader scale. These findings are expected to be integrated into site-specific hazard (e.g., flood inundation and ground fissuring) risk mitigation and management strategies (e.g., the development of disaster monitoring systems, enforcement of zoning regulations, retrofitting of existing infrastructure, and the construction of cost-effective flood control measures utilizing locally available resources). This study focused on quantifying the potential synergistic impacts of land deformation and rapid socio-ecological changes on the risks of disasters on an annual basis from 2020 to 2023. Future studies should focus on the application of this knowledge using open-source datasets and the assessment of more detailed and dynamic relationships using L-band SAR imagery with a high spatiotemporal resolution. Applying the L-band SAR imagery would overcome the limitations of the penetration capabilities of C-band SAR and allow assessment of relationships at a regional level. Furthermore, the integration of additional GNSS stations is recommended to more effectively capture spatial heterogeneity and to minimize the risk of overgeneralization.

Author Contributions

S.K. contributed to conceptualization of the research, methodology, data analysis, data visualization, writing—original draft preparation, and writing—review and editing; M.N. provided PS datasets and technical advice; Z.M.W. conducted data analysis and validation; D.B. conducted data analysis. All authors have read and agreed to the published version of the manuscript.

Funding

This research was financially supported by the JSPS KAKENHI Grant Number JP 24K17376.

Institutional Review Board Statement

Not applicable.

Informed Consent Statement

Not applicable.

Data Availability Statement

The original contributions presented in this study are included in the article. Further inquiries can be directed to the corresponding author.

Acknowledgments

We thank Center for Research and Application of Satellite Remote Sensing, Yamaguchi University, Japan, for providing PlanetScope datasets for this research. We also thank Badan Informasi Geospasial, Indonesia, for providing us GNSS CALO station data.

Conflicts of Interest

The authors declare no conflicts of interest.

References

  1. Buffardi, C.; Ruberti, D. The Issue of Land Subsidence in Coastal and Alluvial Plains: A Bibliometric Review. Remote Sens. 2023, 15, 2409. [Google Scholar] [CrossRef]
  2. Raspini, F.; Caleca, F.; Del Soldato, M.; Festa, D.; Confuorto, P.; Bianchini, S. Review of satellite radar interferometry for subsidence analysis. Earth-Sci. Rev. 2022, 235, 104239. [Google Scholar] [CrossRef]
  3. Bokhari, R.; Shu, H.; Tariq, A.; Al-Ansari, N.; Guluzade, R.; Chen, T.; Jamil, A.; Aslam, M. Land subsidence analysis using synthetic aperture radar data. Heliyon 2023, 9, e14690. [Google Scholar] [CrossRef] [PubMed]
  4. Fabris, M.; Cenni, N.; Fiaschi, S. Editorial for Special Issue “Monitoring Land Subsidence Using Remote Sensing”. Remote Sens. 2021, 13, 1771. [Google Scholar] [CrossRef]
  5. Chaussard, E.; Amelung, F.; Abidin, H.; Hong, S.H. Sinking cities in Indonesia: ALOS PALSAR detects rapid subsidence due to groundwater and gas extraction. Remote Sens. Environ. 2013, 128, 150–161. [Google Scholar] [CrossRef]
  6. U.S. Geological Survey. Measuring Land Subsidence from Space. Available online: https://pubs.usgs.gov/fs/fs-051-00/pdf/fs-051-00.pdf (accessed on 17 April 2025).
  7. Bagheri-Gavkosh, M.; Hosseini, S.M.; Ataie-Ashtiani, B.; Sohani, Y.; Ebrahimian, H.; Morovat, F.; Ashra, S. Land subsidence: A global challenge. Sci. Total Environ. 2021, 778, 146193. [Google Scholar] [CrossRef]
  8. Solari, L.; Ciampalini, A.; Raspini, F.; Bianchini, S.; Moretti, S. PSInSAR Analysis in the Pisa Urban Area (Italy): A Case Study of Subsidence Related to Stratigraphical Factors and Urbanization. Remote Sens. 2016, 8, 120. [Google Scholar] [CrossRef]
  9. Jones, C.E.; An, K.; Blom, R.G.; Kent, J.D.; Ivins, E.R.; Bekaert, D. Anthropogenic and geologic influences on subsidence in the vicinity of New Orleans, Louisiana. J. Geophys. Res.: Solid Earth 2016, 121, 3867–3887. [Google Scholar] [CrossRef]
  10. Li, B.; Wang, Z.M.; An, J.C.; Zhou, C.X.; Ma, Y.Y. Time-Series Analysis of Subsidence in Nanning, China, Based on Sentinel-1A Data by the SBAS InSAR Method. J. Photogramm. Remote Sens. Geoinf. Sci. 2020, 88, 291–304. [Google Scholar] [CrossRef]
  11. Abidin, H.Z.; Andreas, H.; Gumilar, I.; Sidiq, T.P.; Fukuda, Y. Land subsidence in coastal city of Semarang (Indonesia): Characteristics, impacts and causes. Geomat. Nat. Haz. Risk 2013, 4, 226–240. [Google Scholar] [CrossRef]
  12. Serhalawan, Y.; Chen, P.F. Seismotectonics of Sulawesi, Indonesia. Tectonophysics 2024, 883, 230366. [Google Scholar] [CrossRef]
  13. Hall, R. Late Jurassic-Cenozoic reconstructions of the Indonesian region and the Indian Ocean. Tectonophysics 2012, 570, 1–41. [Google Scholar] [CrossRef]
  14. Walpersdorf, A.; Rangin, C.; Vigny, C. GPS compared to long-term geologic motion of the north arm of Sulawesi. Earth Planet. Sci. Lett. 1998, 159, 47–55. [Google Scholar] [CrossRef]
  15. Walpersdorf, A.; Vigny, C.; Manurung, P.; Subarya, C.; Sutisna, S. Determining the Sula block kinematics in the triple junction area in Indonesia by GPS. Geophys. J. Int. 1998, 135, 351–361. [Google Scholar] [CrossRef]
  16. Susilo, S.; Salman, R.; Hermawan, W.; Widyaningrum, R.; Wibowo, S.T.; Lumban-Gaol, Y.A.; Meilano, I.; Yun, S.H. GNSS land subsidence observations along the northern coastline of Java, Indonesia. Sci. Data 2023, 10, 421. [Google Scholar] [CrossRef]
  17. Japan International Cooperation Agency. Summary: The Study on Flood Control and Water Management in Limboto-Bolango-Bone Basin; Final Report Volume-II Main Report; Japan International Cooperation Agency: Tokyo, Japan, 2002. [Google Scholar]
  18. Kimijima, S.; Sakakibara, M.; Amin, A.M.A.; Nagai, M.; Arifin, Y.I. Mechanism of the Rapid Shrinkage of Limboto Lake in Gorontalo, Indonesia. Sustainability 2020, 12, 9598. [Google Scholar] [CrossRef]
  19. Druce, S.C. The Lands West of the Lakes; KITLV Press: Leiden, The Netherlands, 2009. [Google Scholar]
  20. Katili, J.A. Past Anr Present Getectonic Indonesia Position of Sulawesi, Indonesia. Tectonophysic 1978, 45, 289–322. [Google Scholar] [CrossRef]
  21. Kimijima, S.; Nagai, M. High Spatiotemporal Flood Monitoring Associated with Rapid Lake Shrinkage Using Planet Smallsat and Sentinel-1 Data. Remote Sens. 2023, 15, 1099. [Google Scholar] [CrossRef]
  22. Du, Y.; Xue, H.P.; Wu, S.J.; Ling, F.; Xiao, F.; Wei, X.H. Lake area changes in the middle Yangtze region of China over the 20th century. J. Environ. Manag. 2011, 92, 1248–1255. [Google Scholar] [CrossRef]
  23. Casagli, N.; Intrieri, E.; Tofani, V.; Gigli, G.; Raspini, F. Landslide detection, monitoring and prediction with remote-sensing techniques. Nat. Rev. Earth Environ. 2023, 4, 51–64. [Google Scholar] [CrossRef]
  24. Kimijima, S.; Nagai, M. Monitoring Mining-Induced Geo-Hazards in a Contaminated Mountainous Region of Indonesia Using Satellite Imagery. Remote Sens. 2023, 15, 3436. [Google Scholar] [CrossRef]
  25. Kimijima, S.; Nagai, M.; Sakakibara, M. Distribution of Enhanced Potentially Toxic Element Contaminations Due to Natural and Coexisting Gold Mining Activities Using Planet Smallsat Constellations. Remote Sens. 2023, 15, 861. [Google Scholar] [CrossRef]
  26. The National Aeronautics and Space Administration. Synthetic Aperture Radar (SAR). Available online: https://www.earthdata.nasa.gov/learn/earth-observation-data-basics/sar (accessed on 17 April 2025).
  27. Yunginger, R.; Bijaksana, S.; Dahrin, D.; Zulaikah, S.; Hafidz, A.; Kirana, K.H.; Sudarningsih, S.; Mariyanto, M.; Fajar, S.J. Lithogenic and Anthropogenic Components in Surface Sediments from Lake Limboto as Shown by Magnetic Mineral Characteristics, Trace Metals, and REE Geochemistry. Geosciences 2018, 8, 116. [Google Scholar] [CrossRef]
  28. Noor, S.Y. Trophic status of Limboto lake in Gorontalo Province. IOP Conf. Ser. Mater. Sci. Eng. 2019, 567, 012029. [Google Scholar] [CrossRef]
  29. Subehi, L.; Wibowo, H.; Jung, K.; Wibowo, H.; Jung, K. Characteristics of Rainfall-Discharge and Water Quality at Limboto Lake, Gorontalo, Indonesia. J. Eng. Technol. Sci. 2016, 48, 288–300. [Google Scholar] [CrossRef]
  30. Kimijima, S.; Nagai, M.; Sakakibara, M.; Jahja, M. Investigation of Cultural-Environmental Relationships for an Alternative Environmental Management Approach Using Planet Smallsat Constellations and Questionnaire Datasets. Remote Sens. 2022, 14, 4249. [Google Scholar] [CrossRef]
  31. Lamangida, T.; Akib, H.; Malago, J. Management of Public Assets Study Management of Lake Limboto Gorontalo District. Humanit. Soc. Sci. 2018, 23, 92–99. [Google Scholar]
  32. BPS—Statistics Indonesia. Provider of Quality Statistical Data for Advanced Indonesia. Available online: https://www.bps.go.id/ (accessed on 17 April 2025).
  33. The ASEAN Disaster Information Network. Search. Available online: https://adinet.ahacentre.org/ (accessed on 17 April 2025).
  34. United Nations Office for Disaster Risk Reduction. Kota Gorontalo—Indonesia. Available online: https://www.unisdr.org/campaign/resilientcities/cities/indonesia/gorontalo/kota-gorontalo.html (accessed on 17 April 2025).
  35. The European Space Agency. Copernicus Open Access Hub. Available online: https://browser.dataspace.copernicus.eu/ (accessed on 17 April 2025).
  36. Braun, A. Sentinel-1 Toolbox TOPS Interferometry Tutorial; SkyWatch: Waterloo, ON, USA, 2021. [Google Scholar]
  37. European Space Agency. Level-1 Single Look Complex; European Space Agency: Paris, France, 2018. [Google Scholar]
  38. U.S. Geological Survey. Landsat Collection 2 Surface Reflectance. Available online: https://www.usgs.gov/landsat-missions/landsat-collection-2-surface-reflectance (accessed on 17 April 2025).
  39. Planet Labs. PlanetScope Overview; Planet Labs: San Francisco, CA, USA, 2025. [Google Scholar]
  40. Climate Hazards Center. CHIRPS: Rainfall Estimates from Rain Gauge and Satellite Observations. Available online: https://www.chc.ucsb.edu/data/chirps (accessed on 22 January 2025).
  41. Copernicus Climate Change Service. ERA5-Land Monthly Averaged Data from 1950 to Present. Available online: https://cds.climate.copernicus.eu/datasets/reanalysis-era5-land-monthly-means?tab=overview (accessed on 17 April 2025).
  42. Hennig, T.A.; Kretsch, J.L.; Pessagno, C.J.; Salamonowicz, P.H.; Stein, W.L. The shuttle radar topography mission. Rev. Geophys. 2007, 45, 65–77. [Google Scholar] [CrossRef]
  43. Badan Informasi Geospasial. Station Displacement CALO (Limboto). Available online: https://srgi.big.go.id/visual_gnss/detail/CALO/nr (accessed on 17 April 2025).
  44. Badan Informasi Geospasial. Real-Time GNSS Indonesia. Available online: https://srgi.big.go.id/visual_gnss?fbclid=IwAR0Umuxct2ppX0yG7NVxHNkWbxw08KRHqlxY1dMvQH8wHoNLeSj3ka4_6uk (accessed on 17 April 2025).
  45. Farr, T.G.; Kobrick, M. Shuttle radar topography mission produces a wealth of data. Eos Trans. Am. Geophys. Union 2000, 81, 583–585. [Google Scholar] [CrossRef]
  46. Goldstein, R.M.; Werner, C.L. Radar interferogram filtering for geophysical applications. Geophys. Res. Lett. 1998, 25, 4035–4038. [Google Scholar] [CrossRef]
  47. Walter, D. Surface Subsidence Monitoring with NEST: Tutorial—SAR Interferometry. Available online: https://eo-college.org/resource/insar_deformation/ (accessed on 17 April 2025).
  48. The European Space Agency. TOPS Interferometry Tutorial. Available online: https://step.esa.int/docs/tutorials/S1TBX%20TOPSAR%20Interferometry%20with%20Sentinel-1%20Tutorial_v2.pdf (accessed on 17 April 2025).
  49. Kakar, N.; Zhao, C.Y.; Li, G.R.; Zhao, H.L. GNSS and Sentinel-1 InSAR Integrated Long-Term Subsidence Monitoring in Quetta and Mastung Districts, Balochistan, Pakistan. Remote Sens. 2024, 16, 1521. [Google Scholar] [CrossRef]
  50. Kuehn, F.; Albiol, D.; Cooksley, G.; Duro, J.; Granda, J.; Haas, S.; Hoffmann-Rothe, A.; Murdohardono, D. Detection of land subsidence in Semarang, Indonesia, using stable points network (SPN) technique. Environ. Earth Sci. 2010, 60, 909–921. [Google Scholar] [CrossRef]
  51. The European Space Agency. Sentinel Application Platform (SNAP). Available online: https://step.esa.int/main/toolboxes/snap/ (accessed on 17 April 2025).
  52. Stanford Radar Interferometry Research Group. SNAPHU: Statistical-Cost, Network-Flow Algorithm for Phase Unwrapping. Available online: https://web.stanford.edu/group/radar/softwareandlinks/sw/snaphu/ (accessed on 17 April 2025).
  53. National Aeronautics and Space Administration. Unwrapped Interferograms: Creating a Deformation Map. Available online: https://www.earthdata.nasa.gov/learn/data-recipes/unwrapped-interferograms-creating-deformation-map (accessed on 18 February 2025).
  54. Japan Aerospace Exploration Agency. MADOCA Products. Available online: https://ssl.tksc.jaxa.jp/madoca/public/public_malib_en.html (accessed on 17 April 2025).
  55. Sarsito, D.A.; Susilo, S.; Simons, W.J.F.; Abidin, H.Z.; Sapiie, B.; Triyoso, W.; Andreas, H. Newly velocity field of Sulawesi Island from GPS observation. AIP Conf. Proc. 2017, 1857, 040005. [Google Scholar]
  56. Socquet, A.; Simons, W.; Vigny, C.; McCaffrey, R.; Subarya, C.; Sarsito, D.; Ambrosius, B.; Spakman, W. Microblock rotations and fault coupling in SE Asia triple junction (Sulawesi, Indonesia) from GPS and earthquake slip vector data. J. Geophys. Res.-Solid Earth 2006, 111, B08409. [Google Scholar] [CrossRef]
  57. Yastika, P.E.; Shimizu, N.; Abidin, H.Z. Monitoring of long-term land subsidence from 2003 to 2017 in coastal area of Semarang, Indonesia by SBAS DInSAR analyses using Envisat-ASAR, ALOS-PALSAR, and Sentinel-1A SAR data. Adv. Space Res. 2019, 63, 1719–1736. [Google Scholar] [CrossRef]
  58. Ariztegui, D.; Anselmetti, F.S.; Robbiani, J.M.; Bernasconi, S.M.; Brati, E.; Gilli, A.; Lehmann, M.F. Natural and human-induced environmental change in southern Albania for the last 300 years—Constraints from the Lake Butrint sedimentary record. Glob. Planet Change 2010, 71, 183–192. [Google Scholar] [CrossRef]
  59. The ASEAN Disaster Information Network. Indonesia, Flooding in Gorontalo City, Gorontalo Province. Available online: https://adinet.ahacentre.org/report/indonesia-flooding-in-gorontalo-city-gorontalo-province-20200802 (accessed on 17 April 2025).
  60. The ASEAN Disaster Information Network. Indonesia, Flooding in Gorontalo City, Gorontalo. Available online: https://adinet.ahacentre.org/report/indonesia-flooding-in-gorontalo-city-gorontalo-20200727 (accessed on 17 April 2025).
  61. The ASEAN Disaster Information Network. Indonesia, Flooding in Gorontalo City (Gorontalo). Available online: https://adinet.ahacentre.org/report/indonesia-flooding-in-gorontalo-city-gorontalo-20240710 (accessed on 17 April 2025).
  62. The ASEAN Disaster Information Network. Indonesia, Flooding in Gorntalo City (Gorontalo). Available online: https://adinet.ahacentre.org/report/indonesia-flooding-in-gorntalo-city-gorontalo-20240620 (accessed on 17 April 2025).
Figure 1. Overall methodological workflow. The numbers in the figure correspond to the specific objectives mentioned in the Introduction. The methods used in each step are described in the subsequent sections.
Remotesensing 17 01514 g001
Figure 2. Study area: (a,b) regional overview; (c) study area, Limboto Lake, Gorontalo fault, Global Navigation satellite System CALO station, and topographical setting overlaid with the data from the Shuttle Radar Topography Mission. Areas 1–4 in (c) correspond to the highlighted areas in Figures 7–11; (d,e) riverbank erosion that has contributed to infilling of the lake; and (f) land that was formerly part of the lake.
Remotesensing 17 01514 g002
Figure 3. Methodological workflow of differential interferogram.
Remotesensing 17 01514 g003
Figure 4. DInSAR yearly deformation in descending line-of-sight direction in the study area: (a) 4 April 2020 to 11 April 2021; (b) 11 April 2021 to 18 April 2022; and (c) 18 April 2022 to 13 April 2023.
Remotesensing 17 01514 g004
Figure 5. (ac) Vertical land deformation maps generated with the DInSAR method: (a) 4 April 2020 to 11 April 2021; (b) 11 April 2021 to 18 April 2022; and (c) 18 April 2022 to 13 April 2023. The results (ac) are superimposed on the optical image.
Remotesensing 17 01514 g005
Figure 6. Comparison of vertical displacement between DInSAR and GNSS from 2020 to 2023.
Remotesensing 17 01514 g006
Figure 7. Landcover transformations in the study area. (ad) Landcover transformations from 1981 to 2022. (e) ESA’s World Cover 2021.
Remotesensing 17 01514 g007
Figure 8. Potential vertical land displacement generated from S-1 DInSAR (area 1): (a) 4 April 2020 to 11 April 2021; (b) 11 April 2021 to 18 April 2022; and (c) 18 April 2022 to 13 April 2023; (d) PlanetScope SuperDove image of a remarkable land deformation site captured on 10 April 2023; (e) the built-up extent and vertical displacement of area in the time series.
Remotesensing 17 01514 g008
Figure 9. Potential vertical land displacement generated from S-1 DInSAR (area 2): (a) 4 April 2020 to 11 April 2021; (b) 11 April 2021 to 18 April 2022; and (c) 18 April 2022 to 13 April 2023; (d) PlanetScope SuperDove image of a remarkable land deformation site captured on 10 April 2023; (e) the built-up extent and vertical displacement of area in the time series.
Remotesensing 17 01514 g009
Figure 10. Potential vertical land displacement generated from S-1 DInSAR (area 3): (a) 4 April 2020 to 11 April 2021; (b) 11 April 2021 to 18 April 2022; and (c) 18 April 2022 to 13 April 2023; (d) PlanetScope SuperDove image of a remarkable land deformation site captured on 10 April 2023; (e) the built-up extent and vertical displacement of area in the time series.
Remotesensing 17 01514 g010
Figure 11. Potential vertical land displacement generated from S-1 DInSAR (area 4): (a) 4 April 2020 to 11 April 2021; (b) 11 April 2021 to 18 April 2022; and (c) 18 April 2022 to 13 April 2023; (d) PlanetScope SuperDove image of a remarkable land deformation site captured on 10 April 2023; (e) the built-up extent and vertical displacement of area in the time series.
Remotesensing 17 01514 g011
Table 1. Main specifications of the satellite imagery used in the study.
Instrument
(Sensor)
Acq. Date/
Time
Spatial Res.
(m)
Temporal Res.
(Days)
Operational Mode and Pass (Polarization)Agency
Sentinel-1A (C-SAR)4 April 2020
11 April 2021
18 April 2022
13 April 2023
1012 daysInterferometric Wide
swath mode
Descending
(vertical–vertical)
ESA [35]
Landsat2 (MSS)28 April 19816016 days USGS [38]
Landsat7 (ETM+)14 April 200230
Landsat8 (OLI)28 May 2015
12 March 2022
Planet Cubesat
(PS2, PS2.SD,
PSB.SD)
9 April 2020
16 April 2021
18 April 2022
10 April 2023
31 day Planet Scope [39]
CALO Station3–5 April 2020
10–12 April 2021
17–19 April 2022
12–14 April 2023
30 s BIG [43]
Table 2. Comparison between DInSAR- and GNSS-measured vertical displacements.
Vertical Displacement (m)
YearsGNSSDInSAR
CALO123456789
2020–2021−0.0163−0.0113−0.0104−0.0116−0.0126−0.0136−0.0095−0.0109−0.0116−0.0120−0.0124
2021–2022−0.0296−0.0289−0.0312−0.0304−0.0336−0.0323−0.0331−0.0297−0.0294−0.0304−0.0285
2022–2023−0.0440−0.0539−0.0525−0.0526−0.0533−0.0556−0.0527−0.0522−0.0526−0.0558−0.0551
Comparison metrics of statistical measures used to compare the GNSS with each point of DInSAR
Bias −0.0043−0.0039−0.0046−0.0063−0.0069−0.0046−0.0039−0.0043−0.0056−0.0049
RMSE 0.01120.01030.01050.01070.01210.01120.01010.01050.01220.0116
SD 0.01040.00960.00950.00870.00990.01020.00930.00960.01080.0106
Pearson correlation 0.94900.97440.95610.98040.95260.98480.96400.94760.94550.9403
Disclaimer/Publisher’s Note: The statements, opinions and data contained in all publications are solely those of the individual author(s) and contributor(s) and not of MDPI and/or the editor(s). MDPI and/or the editor(s) disclaim responsibility for any injury to people or property resulting from any ideas, methods, instructions or products referred to in the content.

