Abstract
Space is one of the UK’s fastest-growing industry sectors of the last decade. Recognising this, in 2021 the UK Government’s first National Space Strategy established a new vision to make the nation one of the most innovative and attractive worldwide space economies. As part of the strategic funding programme, in 2023, the UK Space Agency (UKSA) funded a scoping study to assess the potential of satellite data to address issues that the three North East England Local Resilience Forums face at all stages of implementing the UK’s Integrated Emergency Management Framework (IEMF). Through dedicated workshops convened by two North East England universities, regional stakeholders from the emergency domain and related industries identified three case studies ripe for applying satellite data in support of multi-agency IEMF activities. Master’s students in the UK’s Centre for Doctoral Training in Geospatial Systems then undertook a month-long integrated group project to assess the potential for satellite imagery to be applied in the identified application areas. The research reported in this paper demonstrates how satellite imagery may be adopted to help address challenges posed during power outages, for mitigating illegal waste site fires, and during periods of snow and extreme cold. While the maturity levels of satellite applications vary in the three case studies due to data availability and image resolution, all three cases demonstrate that space data, particularly when augmented with additional geospatial information, help to enhance IEMF analysis. It is anticipated that the findings from the study will help stakeholders involved in IEMF management appreciate the added value of integrating satellite data into their current processes and analyses. By empowering key stakeholders to use satellite applications more effectively, it is predicted that better decisions will be achieved, thereby improving emergency risk management. A prototype dashboard, an output of the research to demonstrate the potential of space data for emergency management, is available online.
1. Introduction
Over the last ten years, space has become one of the UK’s fastest-growing industrial sectors, worth over GBP 18.9 billion in income to the UK economy and employing over 52,000 people in 2021 [1]. In alignment with the UK’s first National Space Strategy [2], the UK Space Agency (UKSA) published a call in November 2022 for projects to research and develop new space technologies. The call invited projects using or demonstrating the potential of innovative technologies and feasibility studies in the space sector that established new academic–industrial research collaborations [3]. Thus, the call aimed to raise Technology Readiness Levels (TRLs) and help bring UK space activities closer to commercial or practical use.
Supported by the Satellite Applications Catapult, the North East Centre of Excellence in Satellite Applications (now Space North East England), Newcastle and Durham Universities were awarded a four-month scoping study to assess the use of satellite applications for emergency management in North East England. The study, entitled “R2-D2: Resilience to Recovery—Data for Disasters”, built a core stakeholder cluster comprising three North East Local Resilience Forums (LRFs), academia and the broader space community. The ambition of R2-D2 was to raise capabilities, skills and competencies to enable decision-makers to utilise space data to prioritise actions and deploy resources more efficiently and effectively, thereby improving public services and safety. Over three phases of the project, workshops helped to share analyses and findings with key stakeholders, exchange knowledge, and facilitate discussion regarding the challenges and opportunities for innovation involving space technologies within the emergency management domain.
This paper presents the key findings of the R2-D2 project in assessing the use of satellite data during incident management for three different risks, jointly identified by key stakeholders, faced by North East England’s LRFs: (1) snow and extreme cold; (2) illegal waste site fires; and (3) national electricity transmission faults. The research addresses three main research questions:
- What satellite data are available to support impact assessment of snow, fire and electricity transmission incidents?
- How can satellite data support emergency management of these incidents?
- What are the challenges and limitations in currently available satellite data for managing each incident type?
While the three case studies demonstrate that the current application of satellite imagery largely depends on data availability and resolution, initial analyses highlighted the added benefit of satellite data for integrated emergency management. This scoping study facilitated a better understanding of currently available satellite data, demonstrating examples of use and applications, and deriving lessons learned for future exploration. To complement current shortfalls in available satellite data for specific incident types, the scoping study identified additional geospatial datasets for a more holistic analysis in emergency management.
The findings of this study are expected to benefit key local authorities and stakeholders involved in emergency management, as well as the space research and innovation industry. This will likely lead to better anticipation, mitigation and management of identified risks that can impact local economies, as well as an opportunity for regions to develop improved emergency management solutions utilising satellite data.
2. Conceptual Foundations
2.1. Climate Change Impacts on the Environment and Society
Climate change is one of global society’s most significant challenges, with natural hazards anticipated to become more frequent and intense due to the rise in weather and climate extremes [4]. Extreme weather events, e.g., wind and rainstorms, can result in high excess mortality and morbidity [5,6] and lead to adverse impacts, such as cold homes [7]. Heavy snow and extremely low temperatures significantly impact critical systems and infrastructure [8,9], e.g., leading to adverse highway conditions [10]. With transport representing a crucial lifeline, compromised roads can be highly detrimental to society as movements between locations become hindered or prevented [11]. Extreme weather events may also result in increased road traffic accidents, leading to injury and death [12], thereby imposing significant financial and economic costs on society [13].
Severe weather can also cause power outages, as high wind speeds can make power lines unstable and increase the chances of trees falling onto overhead lines [14]. Floods can cause damage to power and utility services if flood water enters buildings, in addition to posing difficulties in repairs to electrical points. While the UK energy regulator, Ofgem, states that power outages must be restored within 12 hours of average weather or 24 hours of abnormal weather events [15], this is often exceeded and secondary impacts, such as rail service disruptions, can also persist.
North East England has experienced several severe winter storms in recent years, including Storm Desmond (December 2015), leading to record-breaking rainfall and severe flooding in parts of northern England, especially in Cumbria and parts of Scotland [16]; “the Beast from the East” (February to March 2018), associated with Storm Emma, bringing 50 cm of snow and blizzard conditions to the UK [17]; Storm Arwen (November 2021), bringing strong winds, heavy rain, snow and ice, causing widespread power outages, transportation disruptions, and damage to infrastructure across northern England and Scotland [18]. Storm Arwen in particular demonstrated that the existing UK energy network was not sufficiently resilient to severe weather, as falling trees caused extensive damage to power lines, leading to extended electricity disruption for over one million customers [19]. Research suggests that extreme weather events will likely become more frequent and intense [20]; therefore, supporting multi-agencies in managing emergencies through relevant data on critical infrastructure is pivotal to improving reliability and resilience.
2.2. Additional Anthropogenic Impacts on the Environment and Society
In addition to natural disasters, many locations in the UK are susceptible to anthropogenic risks. One particular activity that poses a risk to safety and the environment is the illegal dumping of waste. Illegal waste sites (IWSs), comprising both unlawful dumping sites and official sites that have exceeded their legal permit limits, are a global issue [21] as they can impact human health due to releases of highly toxic fumes [22] and pollute and degrade air, soil and water quality, resulting in long-term ground contamination [23]. The combustion of IWSs is also a regular issue that proves costly and endangers lives. Dealing with IWSs costs the English economy an estimated GBP 1 billion annually, a figure that has increased by 55% since 2015, and is recognised as a significant factor in preventing the UK from achieving its climate ambitions [24].
2.3. Integrated Emergency Management Framework in the UK
The UK Civil Contingencies Act 2004 describes an emergency as an “event or situation which threatens severe damage to the UK’s human welfare, environment, or security” [25]. Moreover, it outlines the UK’s framework for responding to and managing emergencies, ensuring public safety and the continuity of services. Figure 1 shows the Integrated Emergency Management Framework (IEMF) model, which consists of a six-stage cycle that supports the UK Government Cabinet Office’s resilience management and is used by the UK civil protection sector.
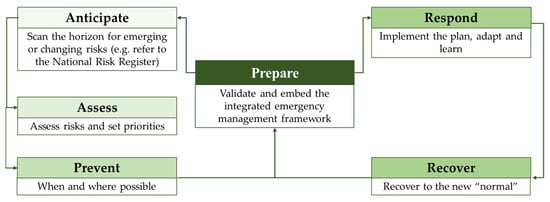
Figure 1.
The UK’s Integrated Emergency Management Framework (IEMF) [25].
The UK Civil Contingencies Act 2004 constitutes roles and responsibilities involved in emergency preparation and response. It classifies emergency responders as Category 1 (fire and ambulance services, police, local authorities, Environment Agency and National Health Service (NHS) bodies) and Category 2 (cooperating bodies responsible for their sector, e.g., utilities, telecommunications and transport companies) [25]. Key emergency responders and specific supporting agencies for a given region together form an LRF, a multi-agency partnership made up of Category 1 and 2 representatives from local public services, including the emergency services, local authorities, the NHS, Environment Agency, and others [25]. The LRF’s geographical coverage of jurisdiction is based on police areas. In the North East, these cover Northumbria, County Durham and Darlington, and Cleveland. Initial discussions with three of the North East LRFs indicated that responders are often made aware of potential applications of satellite data but might not have the knowledge, access, or capacity to make the best use of the data before (building resilience), during (responding to) and after (recovering from) emergency incidents.
2.4. Data Platforms and Providers of Satellite-Derived Information for Emergency Management
Numerous different data platforms today offer free or subscription-based access to satellite imagery that has potential value to emergency management. For example, the Copernicus Data Space Ecosystem, provided by the European Space Agency (ESA), facilitates access to Sentinel-2, a constellation of two optical imaging satellites, Sentinel-2A and Sentinel-2B [26]. Together, they provide multi-spectral images spanning 13 spectral bands with high-resolution images of up to 10 m within a 5-day revisit time. However, while Sentinel-2 data are valuable for various Earth observation applications, they have limitations for use during emergencies in terms of spatial (too coarse to map and analyse the impact of extreme weather events on critical infrastructure) and temporal resolution (revisit time of five days is insufficient to assess rapidly changing environments and support real-time response). Moreover, as an optical sensor, Sentinel-2 only collects usable data during daylight hours, and is even then susceptible to, e.g., cloud coverage that is associated with stormy weather, thereby not providing 24-h coverage.
As an example of a commercial provider, Airbus offers high-resolution optical imagery at 30 cm (Pleiades Neo, seven spectral bands) or 50 cm (Pleiades, five spectral bands), and SPOT imagery with a panchromatic resolution of 1.5 m and a multi-spectral resolution of 6 m through the Living Library on their OneAtlas platform [27]. Users can define a study area by drawing a polygon, uploading geospatial boundaries or specifying coordinates. However, costs compared to lower-resolution or freely available datasets can be a barrier to local authorities. Further, depending on the spatial area, daily imagery might not be available due to the revisit time, potentially a shortcoming for emergency management purposes.
Emergency management therefore necessitates a multi-modal approach to data collation. Further potential data sources include the Moderate Resolution Imaging Spectroradiometer (MODIS), an instrument aboard NASA’s Terra satellite collecting data at 250 m, 500 m and 1 km spatial resolutions [28], and Synthetic Aperture Radar (SAR), e.g., from ESA’s Sentinel-1 satellites, providing continuous all-weather, day and night imagery of the Earth’s surface. As Interferometric SAR can be used to detect changes in the Earth’s surface with millimetre precision [29], this method could potentially be used to, e.g., detect height changes in IWSs, fallen trees and collapsed power lines.
The value of satellite imagery can also be augmented and enhanced through further location-based data. For example, in the UK, the Met Office Hazard Manager provides emergency services with weather warnings, flood alerts and other hazard-related information. The European Centre for Medium-Range Weather Forecasts (ECMWF) provides the ERA5-Land dataset, which delivers hourly high-resolution information on atmospheric, land and oceanic climate variables [30]. This dataset is used for diverse applications such as climate monitoring, weather forecasting, emergency response and disaster management.
Several commercial providers actively use Artificial Intelligence (AI) and machine learning algorithms to recognise specific patterns and trends in satellite imagery that help identify sites impacted by storms and support various cross-disciplinary applications, including highway infrastructure, electricity, railway and forestry. For example, LiveEO uses 3 m resolution imagery (Planet), Sentinel-2 imagery (Copernicus), in situ data (e.g., gas composition and temperature), SAR, and commercial (e.g., airborne lidar) data on demand [31]. This is used to garner information about vegetation location, height, species and vitality to evaluate the risk posed to large infrastructure network assets by identifying trees that could fall into power lines. Sile [32], for example, used satellite imagery to monitor and analyse ground subsidence and the movement of objects over time to prevent substantial damage to buildings. Everbridge [33] used Planet Satellite imagery to identify power outages during critical events and notify emergency teams, and implemented AI to recommend remedial action based on historical data. Other similar providers focusing on emergency management include ICEEYE [34], which operates a radar imaging satellite constellation for natural catastrophe mapping; MAXAR [35], which provides radar imagery and optical imagery at 15 cm and 30 cm resolution for wildfire and disaster response; and Telespazio Vega [36], which performs similar operations for natural disaster management.
3. Methodology
3.1. Study Area
The region of interest for this scoping study is North East England, which borders Scotland to the North, the North Sea to the East, the Pennine Hills to the West, and the county of North Yorkshire to the South (see Figure 2).

Figure 2.
North East England study area.
Despite being one of the lowest-performing economic regions of the UK, North East England has a burgeoning space economy: In 2021, the region achieved an income of GBP 124 m and employed around 1300 people [1]. With a diverse landscape and a population of approximately 2.65 million [37], the region also poses unique challenges for disaster management. Due to its diverse geography (urban, rural, land and sea) within a small area footprint, it serves as an appropriate testbed for assessing the application of satellite data for emergency management purposes.
3.2. R2-D2 Project Structure
The R2-D2 project consisted of three distinct linear phases, each comprising a work package (WP) that concluded with a knowledge exchange workshop. Representatives from the following stakeholder groups attended the knowledge exchange workshops: police force, local city and county councils, fire and rescue services, utility providers, environmental agencies, LRFs, technology suppliers, Earth observation data providers and academics.
- WP 1: Working group establishment and stakeholder workshop
The first phase of R2-D2 aimed to build a working group of stakeholders comprising representatives of LRFs, Category 1 and Category 2 responders, academics and satellite application experts. A total of 23 participants took part in a Spark Exploration Workshop in Durham that was facilitated by the UK’s Satellite Applications Catapult (SAC). Prior to the workshop, discussions with an LRF representative helped identify 10 key emergency challenges that Category 1 and 2 responders have to deal with regularly in North East England. We used these identified key challenges in the first half of the workshop for an opportunity mapping exercise using Post-it notes. Stakeholder attendees could select which challenge was of most interest or concern to them, write the key problems associated with each challenge, and pose a “how might we...?” question that required a solution. From the initial list of 10 emergency challenges, the exercise narrowed the priorities down to 6: national electricity transmission faults, fire (major fire and IWS fire), low temperature and heavy snow, surface water flooding, heatwaves and wildfire, and maritime pollution.
During the second half of the workshop, participants split into groups to discuss the challenges stakeholders face in dealing with these six emergencies, and how satellite data might potentially help decision-makers address these risks. Attendees rotated around each challenge and prioritised the “how might we…?” questions to identify key potential areas for innovation, the core stakeholders involved, what information was required, and outline how satellite or other data sources may prove helpful in managing each emergency situation.
- WP 2: Capability audit and outline data
The outcomes of the first workshop acted as a catalyst for further research into best practices and the potential of satellite applications for emergency management, including knowledge gaps identified by the LRF that could potentially be filled via satellite data; user requirements (members of the LRF and whom they work with); how users access data for decision-making and prioritising actions; what resolution and frequency of data are needed; datasets available through government and commercial channels; advantages and disadvantages of different remote sensing technologies, including synergies of data from different satellites and sensors; and how satellite imagery fits with other existing and emerging data streams.
WP2 culminated in a half-day workshop facilitated by the National Innovation Centre for Data (NIC-D) in Newcastle upon Tyne. The second workshop involved 40 attendees, including Newcastle and Durham University project partners, Category 1 representatives (fire, police, and LRFs), Category 2 representatives (utilities), and 12 MRes students from the Centre for Doctoral Training (CDT) in Geospatial Systems from Newcastle and Nottingham Universities. The scoping outcomes from WP 2 were presented to the core cluster working group and the CDT students.
- WP 3: Local piloting and business case development
A CDT MRes Group Project was a key component of Phase 3, comprising a month-long 10 ECTS Master’s module where students from Newcastle and Nottingham Universities worked collaboratively on the R2-D2 project. The twelve participating students were split into three equal groups, and each was allocated one of three key challenges that the North East faces, as identified during the first Spark Workshop: snow/extreme cold, IWS fire, and electricity transmission. Each student group was tasked to investigate open prototype solutions using satellite and other geospatial data to address their identified core challenge. Groups received support from stakeholders, industry and academia throughout the month-long endeavour. Each group was assigned an industry mentor to discuss the challenge, thereby ensuring that the project was informed by stakeholder input. Individual groups met formally with their group mentors once per week during the month-long project and each group was required to provide regular progress reports to their mentors and CDT academics. After four weeks, students showcased their prototype solutions to stakeholders in a Newcastle workshop to foster further knowledge exchange. The outcomes provide recommendations to help emergency services develop an appropriate strategy for using satellite data technologies.
4. R2-D2 Case Study Results
This section presents example results of the capability analysis of satellite imagery for supporting emergency services during incident management for the three selected challenges of snow, IWS fire and electricity transmission.
4.1. Previous Use of Satellite Imagery for Managing Selected Emergency Management Situations
Snow and extreme cold: Snow data products are generated from various multi-spectral instruments and satellite missions, including MODIS, Visible Infrared Imaging Radiometer Suite (VIIRS), and Sentinel-1. The characteristic reflectance of snow cover is in the 0.3–1.0 μm visible and 1.6 μm infrared wavelengths [38]. Snow cover pixels are typically derived from the Normalised Difference Snow Index (NDSI), where snow is detected if the pixel value exceeds a threshold of 0.4 [39]. For example, Snapir et al. [40] combined optical data from MODIS fractional snow cover and radar data from Sentinel-1 wet snow masks to produce monthly dry and wet Snow Cover Extent (SCE) maps over a 55,000 km2 area in the Indian Himalayas. Lievens et al. [41] used Sentinel-1 data to measure snow depth in Northern Hemisphere mountains. Buchelt et al. [42] used an empirical approach to identify the start of run-off, end of snow cover, and SCE for dual-polarised Sentinel-1 SAR imagery of Greenland.
Space-borne passive microwave radiometers have been used to measure snow depth, snow water equivalent and snow cover area, but are limited due to the coarse spatial resolutions [43]. However, active SAR satellites have much finer spatial resolutions than passive radiometers, with, e.g., Sentinel-1 providing data at a 20 m resolution. While researchers have used SAR to measure SCE, depth and melt rate [44], these studies have primarily focused on high mountain regions where snow cover is prevalent for several months, and there is an opportunity to acquire multiple cloud-free snow cover images. Dry and wet snow cover have different effects on radar surface and volume backscatter as a function of snow water equivalent at varying snow depths [45]. The change in backscatter intensity can distinguish different stages in the snowpack cycle, including the moistening and melting of dry snow into liquid snow run-off and snow-free ground [42]. The change in backscatter intensity has been used in multiple studies to measure different characteristics of SCE and wet snow extent. There has been little research into using SAR data to measure sudden snow events in low-lying rural and urbanised areas, which could help extend snow cover products from optical satellites where extensive cloud cover is often an issue.
IWS: Gill et al. [46] and Zhao et al. [47] used thermal and multi-spectral imagery for the detection of waste dumping sites; however, as the methods did not provide information on vertical height, they could only be used as detection rather than quantification methods. Sentinel-1 supports multiple SAR polarisation modes (VV, VH, HH, HV), offering more detailed information about surface properties, which may potentially provide additional insight into the extent and severity of a fire incident. SAR processing can also detect changes in the Earth’s surface characteristics, such as changes in the height of waste sites, both illegal and legal. Comparing pre-fire and post-fire SAR images could help identify burn scars, as the backscatter coefficient decreases significantly in the burned area. For example, Hosseini and Lim [48] used SAR data from Sentinel-1 after the 2019–2020 Australian bushfires to identify burned areas. SAR data can complement the analysis of areas where optical imagery may be obscured by smoke and/or cloud cover.
Applying machine learning algorithms to satellite imagery presents another possible method for detecting IWSs. For example, Rajkumar et al. [49] used semantic segmentation models on a new custom dataset of high-resolution multi-spectral satellite images from WorldView and GeoEye with accurate semantic segmentation masks to detect landfill sites. They found that using pre-trained models based on the ImageNet and SpaceNet datasets with transfer learning meant a small dataset (240 images) could achieve an accuracy of 0.83 and a mean intersection over union (mIoU) of 0.401. Further work is required to distinguish between different landfill types, which presents problems with sites showing high variability in waste accumulation.
MOD11C3-V6 is a MODIS land surface temperature (LST) product with a spatial resolution of 0.05 degrees (approximately 5 km) with daily acquisitions. The biodegradation of organic waste causes the land surface temperature of waste sites to be higher than that of their surrounding area [50], making it a valuable metric for the location of IWS. The MOD13C2 product delivers the Enhanced Vegetation Index (EVI) at monthly epochs. The EVI was chosen instead of the Normalised Difference Vegetation Index (NDVI) due to the minimal error caused by atmospheric conditions and canopy background noise [51]. Lower vegetation indices are often reported near waste sites [52,53], indicative of IWS location.
Electricity transmission faults: Several case studies have demonstrated how optical, radar and nightlight satellite imagery can help to comprehensively monitor extensive power networks, detect outages, determine the extent of power grid damage, and create risk maps to indicate vegetation risks. Gazzea et al. [54], for example, used high-resolution Worldview-2 8-channel imagery to help monitor vegetation along power lines, which poses a risk to such infrastructure. Airborne LiDAR was used to validate the image segmentation approach for a power grid in western Norway. Hartling et al. [55] deployed a hybrid approach, combining airborne LiDAR with satellite data to identify vegetation risk to power lines. While LiDAR provides data at a granular level, in particular helping map tree heights, its cost and accessibility can impact its coverage and update frequency. However, commercial high-resolution multi-spectral or hyper-spectral satellite imagery can also be costly for coverage, e.g., at a city scale. Matikainen et al. [56] provided a detailed overview of case studies using various methods (including SAR and optical imagery) to map power lines and towers, monitor vegetation in power line corridors, and identify trees that grow within the minimum vegetation clearance distance. They demonstrated how other alternative options, such as airborne lidar, can improve data quality in areas where satellite visibility is poor at ground level.
Cole et al. [57] demonstrated the ability of VIIRS Day/Night Band (DNB) imagery from the Suomi National Polar-orbiting Partnership to monitor power outages following Hurricane Sandy in 2012. They deployed a combination of satellite imagery and locally relevant geospatial data for infrastructure and population to produce a power outage monitoring network for continental USA and quantitatively estimate power outages requiring repair. Shah et al. [58] also used VIIRS DNB imagery to detect power outages in conflict-affected areas, monitor population distribution changes, identify infrastructure damage and recovery, and assess economic impacts. Such studies often use satellite imagery together with other contextual geospatial information, such as infrastructure and population data, to improve situational awareness. The inclusion of other sensor data, such as lidar, allows improved analysis. Nonetheless, challenges remain in utilising nightlight data. These include the impact of lunar illuminance and cloud cover on nighttime lights, the temporal disparity between the event and its reflection in the data, and limited spatial coverage or spatial resolution, which might not be suitable for detecting small-scale events. Moreover, there are the associated costs involved in acquiring coverage at a city scale.
4.2. Available Data for Impact Assessment of Selected Incidents
The three R2-D2 stakeholder workshops helped create an overview of different data categories useful for various emergency management case studies (see Figure 3). Category 1 and 2 responders can make use of these datasets to respond, map resources, assess vulnerability and identify major risk areas. The appropriate dataset depends on the incident and end-user type (e.g., strategic, tactical or operational).
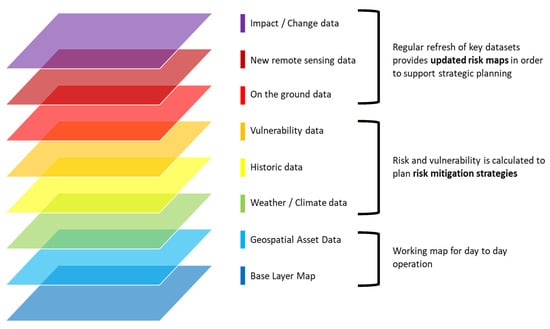
Figure 3.
Overview of datasets required in integrated emergency management.
The overview in Figure 3 highlights that, while there may be overlaps across the different case studies, some data layers will be applied for specific instances. In the case of low temperatures and heavy snow, stakeholders highlighted that an asset condition register would be beneficial to show where snow has previously covered key infrastructure. For major fires, a land use map would be beneficial to identify potential areas at risk. For electricity transmission, weather forecasts help predict future power outage events and map the temporal recovery. For all three incident types, in alignment with findings from the literature, stakeholders emphasised the importance of change detection for the following:
- Visualising where snow is covering key infrastructure;
- Identifying potentially illegal dumping sites and legal dumping sites acting outside of their specifications;
- Identifying fallen trees and using light and dark nighttime images to show areas experiencing power outages.
In alignment with the stakeholder requirement to synthesise different analyses into a common framework easily accessible by various actors in different phases of emergency management, the R2-D2 scoping study developed an open-source dashboard solution using React. React is an open-source web-front library developed by Meta that provides additional libraries. The dashboard further supports the Open Data Kit input form, which aims to engage the public in data collection. Using the app, users can upload files or photos and add comments, georeferenced using a web browser or an ODK-compatible mobile phone.
Table 1 provides an overview of the different datasets used for the scoping project across the three case studies.

Table 1.
Datasets for case studies in R2-D2 scoping project.
4.3. Pilot Studies Investigating Satellite Imagery in Support of Emergency Management
4.3.1. Snow and Extreme Cold Incidents
This case study utilised archival Sentinel-1 imagery to identify snow cover arising from Storm Darcy, which brought strong winds, cold weather and persistent snow showers to parts of the UK between 7 February 2021 and 13 February 2021 [70]. Fifteen Sentinel-1 images were utilised, captured between 4 December 2020 and 28 February 2021 and evenly spaced six days apart.
To create a set of seasonal snow-free reference SAR images, we determined snow-free image dates using NDSI and cloud cover percentages in the MODIS snow data product, where the average NDSI was <10% and cloud-free pixels were >20%. Through this filtering, and accounting for missing MODIS reference data on five dates, the SAR reference stack contained three images (22 December 2020, 27 January 2021 and 26 February 2021), which were reduced to a single image by computing the average pixel values in each of the VV and VH channels.
In order to validate the wet snow pixel detection against the MODIS snow product, the Sentinel-1 data were resampled to match the MODIS pixel resolution of 500 m × 500 m by mean averaging across all pixels within the sample window. This process also applied speckle reduction to the Sentinel-1 images, to overcome problems that affect SAR backscattering snow cover detection algorithms [71], and improve performance in classification tasks [72].
The backscatter coefficients were converted to decibels (dB) using the 10 transformation and, similar to work by Snapir et al. [40] and Nagler et al. [44], we set a threshold of −2 dB to determine wet snow pixels with respect to are the backscatter coefficients for the snow and reference images, respectively. Finally, cloud masks from MODIS and water masks from Copernicus Global Land Cover [68] were applied to the scene to consider only cloud-free land pixels and compare them against the NDSI values in the MODIS imagery.
Figure 4 visualises the individual steps of the methodology used to transform the snow/extreme cold datasets described in Table 1.
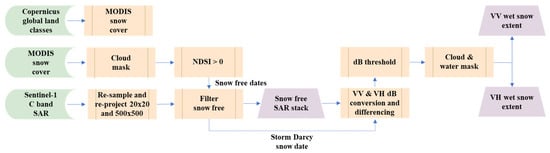
Figure 4.
High-level overview of snow and extreme cold processing pipeline.
The SAR change detection identified 8878 snow pixels in VV polarisation and 16,330 in VH, representing 28.8% and 52.9% of the total area, respectively. Figure 5 shows the extent of these pixels across the study area. VV and VH identified significant changes in the west and northwest of the region, located across the North Pennines and Northumberland National Park, particularly in the high-altitude areas surrounding Kielder Water and Kielder Forest. The analysis detected fewer change pixels in the metropolitan areas surrounding Newcastle upon Tyne.
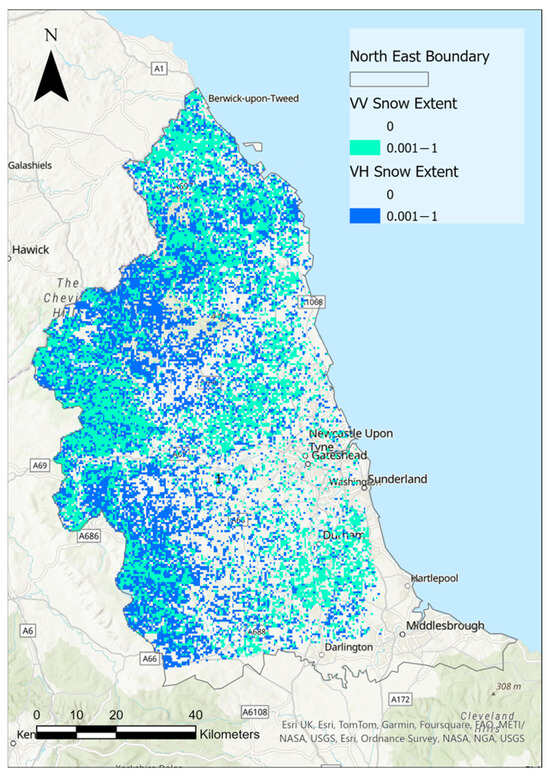
Figure 5.
VV and VH change detection on 8 February 2021 with a threshold of −2 dB.
Comparing the number of changed pixels in MODIS NDSI indicates the proportion of total snow pixels identified using the SAR snow detection analysis. Unfortunately, on the snow image date of 8 February 2021, cloud cover accounted for 67% of the total MODIS image, meaning less than a third of the data could be used to validate the snow detection. Figure 6 displays the VV and VH snow detection classification and accompanying cloud mask. For MODIS NDSI, all values greater than 0 were classified as snow pixels, which essentially included all areas in the unmasked data. Therefore, in both VV and VH data, the pixels classified as “No Snow” indicate areas not identified using the SAR analysis but are classified as snow pixels in the MODIS data (i.e., misclassified when using MODIS NDSI as a reference).
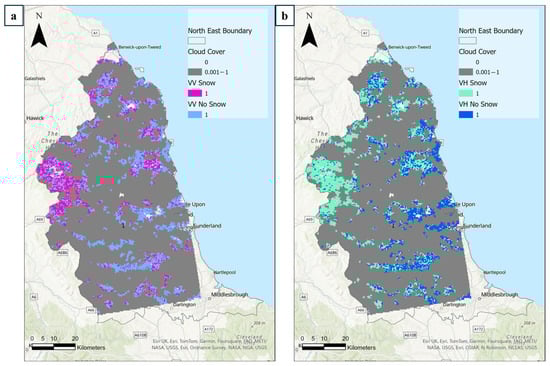
Figure 6.
Snow pixel change detection: (a) from VV polarisations; (b) from VH polarisations.
From this, MODIS NDSI identified 7407 pixels as cloud-free snow pixels, with 32% of these also being identified by the differences in the VV channel and 56% by the VH channel. Whilst VH had better performance of the two, the results as to which polarisation channel more effectively distinguishes the snow change are somewhat inconclusive, as the number of misclassified SAR–snow/MODIS–no-snow pixels cannot be adequately assessed due to the lack of any MODIS–no-snow pixels in the imagery. Validating change analysis is challenging due to the lack of cloud-free reference images. An alternative is using ground-based weather stations, but historical data are hard to acquire, and stations are sparse outside metropolitan areas. The snow extent decreased significantly between 14 February 2021 and 20 February 2021, as shown in VV and VH images presented in Figure 7. Although MODIS data could ultimately not validate these snow and ice cover maps, they demonstrate the potential of Sentinel-1 to indicate the areas of persistent snow cover and melt areas. Further work and validation of these results could be useful in determining the spatial patterns describing where snow cover builds and subsides over time.
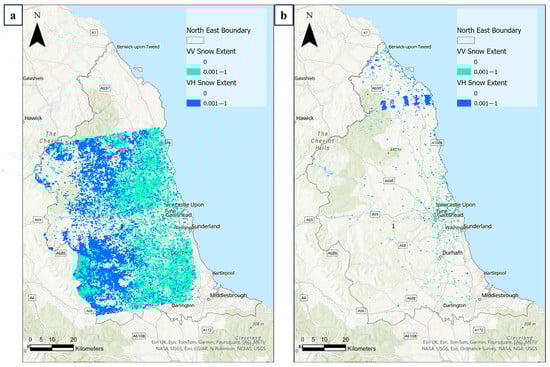
Figure 7.
Snow extent VV and VH polarisations: (a) 14 February 2021 (note limits of image scene) and (b) 20 February 2021.
4.3.2. IWS Fire
Based on the methods described by Canty et al. [73] and Gorelick [74], this case study utilised Google Earth Engine (GEE) and Sentinel-1 imagery to detect changes in the height of a known waste site. We used four Sentinel-1 images (dated 24 April 2015, 6 May 2015, 18 May 2015 and 30 May 2015) of the former Alex Smiles Limited recycling facility in Deptford Terrace, Sunderland, chosen as it was the location of rapidly changing waste site heights in the weeks before its eventual closure in May 2015.
The analysis is based upon a sequential omnibus change algorithm (Canty et al. [75]), comprising independent likelihood ratio tests that determine changes at each pixel location. For each pixel position, the quotient of the F probability distribution for the two images is used as a likelihood ratio test statistic [76] to decide whether a change has occurred between the two acquisition dates at that position [77]. The image pyramid level for calculations depends on the zoom factor, which is maintained at 10 m to ensure consistent output. In addition, the algorithm has a “median” variable, which is ignored as the changes the algorithm detects are small. If the variable were set to true, the p-values for each likelihood ratio statistic would be passed through a median filter before being compared to the significance threshold, reducing the ‘salt and pepper’ effect in no-change regions caused by the uniform distribution of p-values.
Figure 8 shows a map of the study area with changes in pixels relating to the height of the waste visualised. Epoch 1, changes between the first (24 April 2015) and second (6 May 2015) images, shows many definite positive changes located around different areas of the Deptford Terrace site. Epoch 2, changes between the second (6 May 2015) and third image (18 May 2015), shows many definite negative changes. The third epoch, changes between the third (18 May 2015) and fourth image (30 May 2015), shows both definite positive and negative changes. Though more rigorous validation of the results is necessary, the analysis demonstrates the potential for change detection using Sentinel-1 SAR images to monitor waste site heights over time. Such analysis could be extended to aid in the identification of IWSs, particularly if prior knowledge of potential sites exists.
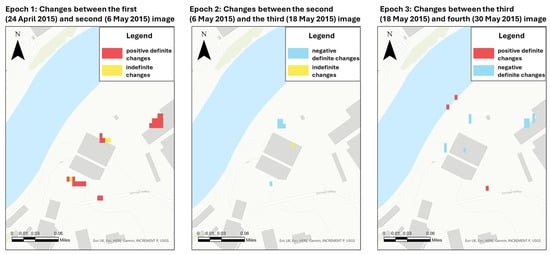
Figure 8.
Maps of Deptford Terrace, Sunderland, showing changes in the height of the IWS for three epochs in May 2015. Red pixels are positive definite changes, blue pixels are negative definite changes, and yellow pixels are indefinite changes.
4.3.3. Electricity Transmission Faults
Following Storm Arwen in November 2021, a considerable number of rural villages in the counties of Northumberland and Durham (both in North East England) suffered several days without electricity [78]. NASA’s Black Marble Nighttime Lights product VNP46A2, a VIIRS supporting a Day/Night Band (DNB) sensor, provides global daily nighttime light data at a 500 m resolution. VNP46A2 is corrected based on clouds, atmospheric conditions and lunar illumination [66] and can help detect the nighttime impact of low light and indicate potential power outages resulting from storms. Including corrections for bidirectional reflectance distribution function (BRDF) and considering noise reduction, VNP46A2 can produce cleaner images than VNP46A1, a daily uncorrected product of the nighttime radiance at the top of atmosphere (TOA).
For example purposes, we demonstrated the applicability of the VNP46A2 datasets available through the GEE data catalogue for four sites in North East England that suffered reported power cuts resulting from Storm Arwen: two rural areas (Wooler and Rothbury) and one market town (Alnwick) in Northumberland, and the city of Newcastle upon Tyne. Figure 9 shows the radiance level for all four areas. As the VNP46A2 product contains quality flags to identify and mask pixels affected by clouds, the affected areas are excluded in the output graphic, leaving blank values in the time-series graph.
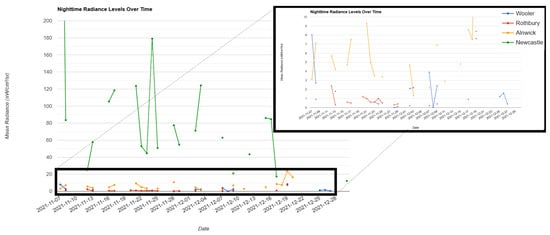
Figure 9.
Time series of nighttime light radiance levels for four locations in North East England.
As reported by the local operator, Northern Powergrid, numerous households suffered from power cuts on the night of Storm Arwen (26–27 November 2021): Alnwick (c. 260 households), Wooler (c. 70) and Newcastle (c. 250) [78]. Following the night of the storm, different households in these areas also reported power cuts. Unfortunately, the night of Storm Arwen had cloud coverage of 100% over both Alnwick and Newcastle, obscuring nighttime data. The nights of 27 November through to 08 December also all presented a high level of cloud coverage (92–100%) for the Alnwick area, with the exceptions of 1–2 December and 6–7 December. Little nighttime light is recorded in the mean radiance data for the nights of 28–30 November and 3–4 December. On 4 December, Northumberland areas (such as Wooler) and Newcastle reported further power cuts, leading to missing recorded nighttime data from 4 to 7 December. From the night of 7–8 December, we see the activity of nighttime radiance for the rural areas, indicating that power was restored, which also correlates with the date Northern Powergrid estimated for power restoration.
Figure 10 presents map outputs for two different nights upon which data were acquired, and which are relatively important to the storm and its associated impacts for the study areas. VNP46A2 quality flags are used to mask pixels affected by clouds, excluding them from the output graphic. Figure 10a visualises Northumberland two nights after the storm (28–29 November 2021) displaying restored power in the county, and (b) represents the same night in Newcastle; (c) visualises the night following further reported power cuts (4–5 December 2021) in Northumberland, and (d) the corresponding night in Newcastle. As the households affected were estimated from available online sources, we suggest obtaining historical data from Northern Powergrid during Storm Arwen and overlaying the nighttime imagery to understand the correlation between definitively known power cuts and remotely sensed irradiance patterns as future work.
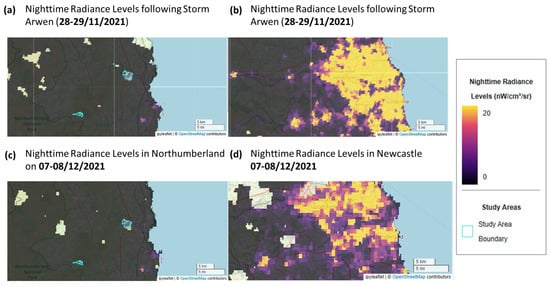
Figure 10.
Nighttime imagery during Storm Arwen, following the storm, power cut and power restoration.
4.4. Synthesis
Figure 11 illustrates the developed geospatial dashboard solution for monitoring IWS fire locations. The dashboard can be viewed online at https://r2d2.systems/ (accessed on 23 April 2025). The numbers in the figure correspond to the descriptions of the following features:
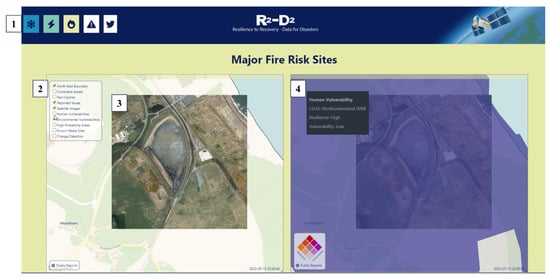
Figure 11.
Geospatial dashboard solution for managing IWS fires with the following features: (1) Menu with dashboard views for the different risks; (2) list of different datasets; (3) satellite image view and (4) human vulnerability layer.
- (1)
- Menu with dashboard views for the different risks: Snow and extreme cold, electricity transmission faults and IWS fires. Further potential work includes integrating a public reporting tool and social media integration using public channels from authorities, such as Northern PowerGrid reporting to customers on current incidents using the platform X (formerly Twitter).
- (2)
- List of different datasets for location-based analyses. Examples of layers include raw data acquired directly from the source and post-processed analysis results.
- (3)
- Satellite image view of the former Alex Smiles Limited recycling facility in Deptford Terrace, Sunderland.
- (4)
- View of the human vulnerability layer visualises resilience and vulnerability scores using datasets defined in Table 1.
While existing commercial dashboard solutions are available for various applications, discussions with the stakeholders of the three case studies reported in this paper highlighted funding as a significant barrier preventing the widespread use of such platforms. As a result, a custom prototype geospatial dashboard solution was developed primarily using open-source technologies, thereby minimising potential operating costs to the (primarily publicly funded) agency stakeholders involved. The user-facing front-end of the dashboard was built on the React framework, which allows for elements to be rendered in real time by the server and reused throughout the dashboard, providing a consistent interface across the entire system. Where appropriate, existing open-source components, such as Deck.GL, were utilised to visualise map data. However, custom components were developed as required. The React framework is widely used in modern web development, with almost 40% of web developers opting to integrate it into their development stack, as reported by users of a 2024 developer survey of over 48,000 people [79].
The dashboard is openly available at https://r2d2.systems (accessed on 23 April 2025) as a static technology prototype demonstration, showing several possible use cases of the dashboard with data incorporated from various sources. This was performed to showcase the dashboard’s capabilities to the stakeholders of the three case studies analysed and highlight the key features that would benefit them should the dashboard be deployed as part of a wider roll-out for real-world use. However, from its conception, the dashboard was designed and developed to be easily scaled to a live-updating system for real-time use. All the systems behind the dashboard, both the front-end interface and the back-end processes for data handling, can be hosted on cloud services, taking full advantage of their capabilities. Focus was placed on a possible deployment via Amazon Web Services (AWS), although other comparable cloud providers could also host such a system. Due to the distributed nature of AWS, this infrastructure can be automatically scaled to meet the demand, ensuring high reliability and availability of the system even under high load or in disaster scenarios in which other infrastructure may be unavailable, such as power loss or physical damage to one or more data centres. If used appropriately, AWS can be an extremely cost-effective solution for hosting applications of this nature, with running costs averaging approximately USD 0.20 per day during peak development and testing of the current prototype dashboard.
The process for updating the dashboard focuses on pre-processing any new data to be incorporated and providing key results in a common format for display on the user interface. Testing and preliminary development were performed locally, with only the visual outputs published online. However, the development chain was built in such a way that the process could be automated. In particular, as illustrated in Figure 12, when new data become available from providers, they are processed by a series of Python tools to first convert them to a common data format before performing geospatial analytics. Such data can then be made available to the front-end via an API, providing access to static and dynamic data in near-real time, rendering end-user access to the most up-to-date information possible. Using cloud features such as S3 storage buckets and distributed APIs, the dashboard can provide access to a vast data collection, including historical archives, with minimal load on the client to ensure fast access. Building the dashboard from smaller components and pre-processing steps allows quick and easy expansion of the system to other case studies, as required. Supplementary data, such as satellite imagery, are already integrated into the dashboard and show selected tiles on the prototype dashboard available online. It is possible to expand this to show full satellite image archives, including historical imagery, to highlight changes in environmental data over time.
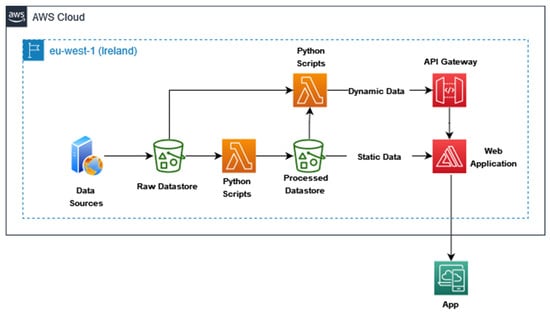
Figure 12.
Architecture of the R2-D2 dashboard platform, including data storage, processing steps and distribution to the dashboard.
Moving forward, a fully deployed operational version of the dashboard would incorporate additional functionality for the live reporting of critical issues, with a WebSocket system trialled to alert dashboard users of new or updated data as they become available and highlight any major issues that may require further analysis. Where severe issues are identified, cloud services such as AWS’s Simple Notification Service could be used to directly alert key parties of actions that need to be taken via specific email or SMS updates. This can be directly integrated into the rest of the dashboard to act on data immediately as they are processed, ensuring these critical issues are addressed with minimal delay.
5. Discussion on Recommendations for Utilising Satellite Data for Integrated Emergency Management
While the literature consists of various works applying satellite imagery to assess land cover changes, urban development and environmental impacts, this study aims to explore the use of satellite imagery to consider the dynamic nature of risks identified by regional stakeholders. Although current satellite data were not found capable of independently supporting integrated emergency management in any of the three regional case studies, the scoping study identified that combining satellite imagery with additional geospatial datasets can help stakeholders, including LRFs, and manage and analyse the impact of different risks. The strength of this study lies in its effort to explore several different avenues of data collection and analysis, although not all case studies yielded equal results. Despite the short-term duration of the scoping study, this research strengthened collaborations across multiple agencies and, through a series of workshops, helped build and disseminate knowledge in the North East England region. The following discussion suggests a list of recommendations for future research and innovation in using satellite data to support the IEMF.
- Implement change detection analysis for emergency incidents:
We suggest implementing change detection functionality for all three case studies. Using such an approach, we can measure the change in snow build-up on critical infrastructure to respond to snow incidents. Determining the methodological accuracy for the fire case study proved difficult due to unavailable ground-truth data from real response sites and confidentiality issues around sites that have been, or are currently, under criminal investigation. We recommend fine-tuning the approach to estimate the magnitude of the height change (in addition to the direction of change). Magnitudes would allow for the automatic ranking of suspected sites, which is particularly important for response to fire incidents because the legal restrictions imposed by exceeded permits increase the fire risk. In future work to respond to power outages, change detection can assist in monitoring flooding events, the growth of vegetation near power lines, and the loss of electricity pylons. Risk-prone or affected sites can be highlighted by comparing time series and overlaying a change polygon onto the electricity network.
- Integrate social data for enhanced risk analysis:
The snow and power outage case studies would benefit from other social vulnerability factors, such as data on “distance to nearest supermarket”. Due to its higher temporal and spatial resolution of precise power outages and vulnerability data, we suggest acquiring data from the Smart Energy Research Lab (SERL) to analyse the causes of power outages in the future. The fire case study suggests integrating the proximity to the nearest fire station and the incident site as further data layers. In accordance with Hirpa et al. [80], who utilised ERA5 data as input to the Global Flood Awareness System (GloFAS) for flood forecasting and early warning, ERA5 can aid stakeholders in incident management and provide important variables for vulnerability assessment. As extreme weather adversely affects disaster response times, we suggest integrating road network data to better understand traffic conditions and improve emergency response.
- Conduct vulnerability analysis:
The three case studies illuminated how different response types require more nuanced data to complement current satellite imagery analysis. Health and well-being data can help assess a community’s sensitivity to the hazard and capacity to adapt to it [81]. To identify areas with the most vulnerable populations during extreme weather events, Jones and Mays [82] suggest including people aged 65 years and above, young children, people with severe illnesses, homeless people and people with adequate heating or insulation, and critical infrastructure, such as hospitals, elderly homes and community centres. Local authorities, including health workers and social care personnel, can use vulnerability analysis to implement policies and take mitigation actions to reduce the risks of cold weather. The analysis results revealed some synergies across the snow and power outage case studies, i.e., areas most vulnerable to electricity transmission failures were also likely to suffer from low temperatures and snow events from winter storms.
- Data fusion:
To overcome the spectral limitations of high-spatial-resolution data, disaster management organisations often employ data fusion techniques, combining data from multiple satellite sensors with complementary spatial and spectral resolutions. For example, we can combine data from Pleiades with sensors that provide TIR and SWIR bands, such as Landsat or Sentinel-2, to create a more comprehensive dataset for effective disaster management. This approach allows practitioners to leverage the high spatial resolution of, e.g., Pleiades data while benefiting from the broader spectral information provided by other satellite systems.
- Develop geospatial dashboard solution with advanced analyses:
While R2-D2 started building the spatial data infrastructure through a prototype to demonstrate capability, work on this initial prototype could continue. The initial dashboard prototype on the three identified hazards can serve as a basis for stakeholder discussions by providing a holistic overview, visualisation and analysis examples of the three specific investigated incident types. Future work can enhance the dashboard’s utility and flexibility by incorporating additional interactive features, allowing users to explore and analyse the data more effectively. For example, for change detection analysis, we suggest a manual analysis option for all three response types on the dashboard, allowing users to select an area and period to investigate change. The GEE Python API enables users to fetch the relevant number of open-access Sentinel-1 images (or Airbus Pleiades) and generate the change detection polygons, which stakeholders can query, as demonstrated in the fire case study.
- Collaborate with emergency agencies for improved data availability:
High-resolution satellite imagery can involve significant costs. We suggest establishing partnerships and collaborations between public and private organisations, cost-sharing agreements, data access grants or subsidies, in-kind contributions, or joint research and development initiatives to facilitate and standardise data sharing and ensure that multi-agencies can access relevant data for disaster management. Collaborations can help balance costs and maximise the use of high-resolution satellite data in disaster management dashboards. If multiple stakeholders need access to the same data, synergies can be achieved and saving opportunities can be leveraged.
Although this study has illustrated how geospatial data analysis may be improved using satellite imagery, there are several existing challenges facing its use and application for emergency management.
- Data availability:
Due to a lack of data, this scoping study could not train and validate a machine learning algorithm to detect the location of fire sites automatically, as these models rely on high-quality training data. Previous studies, such as [49], used training data for computer vision models from waste sites in Hungary, Serbia, India and Brazil. However, the existing dataset is still relatively small, with approximately 200 images from 13 sites. Semantic segmentation is the preferred method for addressing computer vision issues, such as landfill detection, but creating accurate training masks demands significant manual effort. Despite methods such as random rotation, flipping and Gaussian blur, it is challenging to detect whether the model is overfitting the data or how well it would work on illegal landfill sites, which vary in size significantly. Moreover, object classification has been tested only for the fire case study and lacks cross-domain transferability. To test its validity, we suggest creating a set of fire site rasters to validate the model. When deploying such a machine learning algorithm for the snow and power outage case studies, we must create a training dataset to identify blocked roads due to snow events. To maximise research investment, we suggest implementing simple rule-based systems rather than machine learning to address the challenges faced by LRFs.
- Spectral resolution:
Pleiades data are limited to five bands (panchromatic, red (R), green (G), blue (B) and near-infrared (NIR)) and may not be suitable for specific disaster management applications. In scenarios where thermal detection is crucial, such as monitoring fire sites, the lack of thermal infrared (TIR) bands can be a limitation. TIR bands are essential for capturing the Earth’s surface temperature, which can provide critical information about the progression of a fire or the structural integrity of infrastructure. Similarly, the absence of SWIR bands can hinder effective monitoring and response when managing snow incidents. SWIR bands can differentiate between snow and clouds, which appear similar in visible and NIR bands. This differentiation is vital for accurately assessing snow cover and potential risks associated with snow-related disasters. In 2023, SatVu launched HotSat, a satellite equipped with a high-resolution thermal sensor able to capture surface temperatures with a resolution of 3.5 m [83]. Despite its short-lived cycle due to technical challenges, it demonstrated the potential of new satellite technology in this domain.
- Temporal resolution:
Satellite data with high spatial resolution often have a lower temporal resolution, resulting in less frequent updates on ground conditions. This trade-off can pose challenges, for example, in monitoring power outages, as damage or issues may not be identified quickly enough to allow for an effective response. Changes in infrastructure, such as the construction of new transmission lines or the decommissioning of old equipment, may not be captured promptly, potentially affecting the accuracy of risk assessments and management strategies.
- Data fragmentation:
Relevant requisite information for disaster management can be scattered across various organisations and systems. Different agencies are responsible for providing these services and maintaining their data, which may or may not be publicly available. For example, a centralised dataset of emergency service facilities or highway gritting routes is currently lacking in the UK. This fragmentation further complicates gathering comprehensive and up-to-date information for analysis and decision-making, rendering it challenging to create cohesive outputs and analyse large multifactorial areas. This limitation can impede the effectiveness of disaster management efforts by hindering the development of a comprehensive understanding of the risks and resources available for response.
- Data volume and processing:
Users need significant computational resources and storage capacity to store, process, and analyse large file sizes, which can be a constraint for users with limited IT infrastructure such as the LRFs.
- Dependency on external software for advanced processing:
Before users can use Earth observation satellite data, they often require external processing software, for which they may also need help to use. Using satellite imagery for analysis also requires niche skills and knowledge of data access, integration and transformation before insights can be integrated into further decision-making during emergency management.
- Nighttime light satellite data:
The case study on electricity transmission faults proved the complexity and challenges of using currently available nighttime data. Analysing current satellite imagery in isolation is not as potent as it would be with further contextual and background information. Thus, we recommend combining further geospatial-enabled datasets, such as reported power outages, to better understand the impacts of a storm, such as power cuts and power restoration. To verify visible “empty” values in rendered nighttime light data indicating a possible power outage in the area, we suggest using the nighttime radiation values of the same VNP46A2 dataset for a known location with a working power supply.
6. Conclusions
Satellite applications for use in public services are a key target market that the space sector has found challenging to address in the UK. In mitigation and preparedness, access to satellite imagery covering wide areas affected by incidents can help build resilience that prioritises relief efforts and avoids or minimises future repair costs. Many of the risks identified by the North East England LRFs, particularly those arising from extreme weather (e.g., power loss, flooding, heavy snowfall, fire arising from heatwaves), occur with increasing frequency, less predictably, and rising fiscal and societal costs. This scoping study has helped to address the knowledge and data gaps of the end-users, who are potentially the commissioners of future satellite data and services. Understanding or validating the gaps and barriers further supports the information required by the industry for future innovation and commercial opportunities, promoting the importance of investment in the space sector.
Via a series of three workshops, we engaged with academic and industry stakeholders and identified different high-risk incident types that the LRFs face in North East England. The first workshop sought to gather insight into potential use cases and the value of satellite data in the disaster preparedness response and recovery pipeline of the North East England region of the UK. The second workshop presented a capability audit and different available data sources. MRes student projects subsequently implemented three case studies to assess the current state of satellite data and its applicability in integrated emergency management: snow and extreme cold, IWS fire, and electricity transmission incidents. The MRes students presented their results during the third and final stakeholder meeting. While the application of satellite data is not equally advanced for direct deployment in all cases, this scoping study has helped to draw important lessons learned and recommendations for future research, including challenges related to data availability, quality of satellite data, and time constraints. Addressing these challenges is crucial to enhancing the common operating picture and situational awareness effectiveness during the management of emergencies in the North East of England. We anticipate that a better understanding of the value of satellite data and how they may be integrated into public service operations will enable future collaborative research and development, and lead to the creation of Earth and geospatial data analysts, supporting disaster management efforts and contributing to the safety and prosperity of the region.
Author Contributions
Conceptualisation, J.P.M., D.D., R.J.D., E.L., S.M.R., E.S., K.W. and E.R.; data curation, L.C., R.D., O.F., A.F., S.G., O.J., C.M.-W., E.M., F.S.-C., Y.S., L.T. and K.W.; formal analysis, L.C., R.D., O.F., A.F., S.G., O.J., C.M.-W., E.M., F.S.-C., Y.S., L.T. and K.W.; funding acquisition, J.P.M., D.D., R.J.D., E.L., S.M.R., E.S. and J.F.; investigation, L.C., R.D., O.F., A.F., S.G., O.J., C.M.-W., E.M., F.S.-C., Y.S., L.T. and K.W.; methodology, J.P.M., K.W., L.C., R.D., O.F., A.F., S.G., O.J., C.M.-W., E.M., F.S.-C., Y.S., L.T., E.R., D.D., R.J.D., E.L., S.M.R., E.S., J.F., S.M., P.W. and H.H.; project administration, J.P.M., K.W., E.R., D.D., R.J.D., E.L., S.M.R. and E.S.; software, L.C. and S.G.; supervision, J.P.M., D.D., S.M., P.W. and H.H.; visualisation, L.C., R.D., O.F., A.F., S.G., O.J., C.M.-W., E.M., F.S.-C., Y.S., L.T. and K.W.; writing—original draft, K.W., L.C., R.D., O.F., A.F., S.G., O.J., C.M.-W., E.M., F.S.-C., Y.S. and L.T.; writing—review and editing, J.P.M., K.W., S.M.R., L.C., R.D., S.G., E.M. and F.S.-C. All authors have read and agreed to the published version of the manuscript.
Funding
The UK Space Agency funded the project “R2-D2: Resilience to Recovery—Data for Disasters; a scoping study to assess satellite applications for emergency management in North East England”. The research was supported by the United Kingdom’s Engineering and Physical Sciences Research Council (EPSRC) Centre for Doctoral Training in Geospatial Systems under grant number EP/S023577/1. KW acknowledges the support of the Research Hub for Decarbonised Adaptable and Resilient Transport Infrastructures (DARe) funded by the UK Engineering and Physical Sciences Research Council (EPSRC) and the UK Department for Transport (EP/Y024257/1).
Data Availability Statement
All data are available in a publicly accessible repository that can be found here: https://github.com/Geospatial-Systems-CDT/r2d2-datastore (accessed on 23 April 2025).
Acknowledgments
The authors would like to acknowledge the support given by Chris Dixon from the Environment Agency, Laura Dobson from Durham County Council, and Andrew Tewkesbury from Airbus. The many participants in R2-D2 workshops are also thanked for their time and input to the project.
Conflicts of Interest
The authors declare no conflicts of interest.
References
- UK Space Agency. Size and Health of the UK Space Industry 2023. 2024. Available online: https://assets.publishing.service.gov.uk/media/66a366e2a3c2a28abb50d7aa/Size_and_Health_of_the_UK_Space_Industry_2023.pdf (accessed on 30 January 2025).
- UK Government. National Space Strategy. 2022. Available online: https://www.gov.uk/government/publications/national-space-strategy/national-space-strategy (accessed on 30 January 2025).
- UK Space Agency. Announcement of Opportunity: Enabling Technologies Programme—Call One. 2022. Available online: https://www.gov.uk/government/publications/announcement-of-opportunity-enabling-technologies-programme-call-one/announcement-of-opportunity-enabling-technologies-programme-call-one (accessed on 30 January 2025).
- IPCC. Climate Change 2022: Impacts, Adaptation, and Vulnerability; Contribution of Working Group II to the Sixth Assessment Report of the Intergovernmental Panel on Climate Change; Pörtner, H.-O., Roberts, D.C., Tignor, M., Poloczanska, E.S., Mintenbeck, K., Alegría, A., Craig, M., Langsdorf, S., Löschke, S., Möller, V., et al., Eds.; Cambridge University Press: Cambridge, UK; New York, NY, USA, 2022. [Google Scholar] [CrossRef]
- Hajat, S.; Chalabi, Z.; Wilkinson, P.; Erens, B.; Jones, L.; Mays, N. Public health vulnerability to wintertime weather: Time-series regression and episode analyses of national mortality and morbidity databases to inform the Cold Weather Plan for England. Public Health 2016, 137, 26–34. [Google Scholar] [CrossRef]
- Gasparrini, A.; Masselot, P.; Scortichini, M.; Schneider, R.; Mistry, M.N.; Sera, F.; Macintyre, H.L.; Phalkey, R.; Vicedo-Cabrera, A.M. Small-area assessment of temperature-related mortality risks in England and Wales: A case time series analysis. Lancet Planet. Health 2022, 6, e557–e564. [Google Scholar] [CrossRef]
- Guertler, P.; Smith, P. Cold Homes and Excess Winter Deaths: A Preventable Public Health Epidemic that Can no Longer be Tolerated. JSTOR. 2018, p. E3G. Available online: https://www.jstor.org/tc/accept?origin=%2Fstable%2Fpdf%2Fresrep17843.pdf&is_image=False (accessed on 30 January 2025).
- Zhang, W.; Wang, N. Resilience-based risk mitigation for road networks. Struct. Saf. 2016, 62, 57–65. [Google Scholar] [CrossRef]
- Karlsson, C.S.; Kalantari, Z.; Mörtberg, U.; Olofsson, B.; Lyon, S.W. Natural hazard susceptibility assessment for road planning using spatial multi-criteria analysis. Environ. Manag. 2017, 60, 823–851. [Google Scholar] [CrossRef]
- Kelsall, D.; Redelmeier, D.A. Winter road safety is no accident. Cmaj 2016, 188, 241. [Google Scholar] [CrossRef] [PubMed]
- Jacobsen, J.K.S.; Leiren, M.D.; Saarinen, J. Natural hazard experiences and adaptations: A study of winter climate-induced road closures in Norway. Nor. Geogr. Tidsskr.-Nor. J. Geogr. 2016, 70, 292–305. [Google Scholar] [CrossRef]
- Akour, M.; Al Qasem, O.; Hanandeh, F. Traffic Accident Severity Prediction: A comparison Study. Int. J. Transp. Syst. 2022, 7, 24–28. [Google Scholar]
- Bougna, T.; Hundal, G.; Taniform, P. Quantitative analysis of the social costs of road traffic crashes literature. Accid. Anal. Prev. 2022, 165, 106282. [Google Scholar] [CrossRef]
- Panteli, M.; Mancarella, P. Influence of extreme weather and climate change on the resilience of power systems: Impacts and possible mitigation strategies. Electr. Power Syst. Res. 2015, 127, 259–270. [Google Scholar] [CrossRef]
- National Grid. Standards of Performance. 2025. Available online: https://www.nationalgrid.co.uk/customers-and-community/standards-of-performance#:~:text=During%20lightning%20events%2C%20where%20the,failure%20payment%20to%20the%20customer (accessed on 30 January 2025).
- Met Office. Storm Desmond. 2015. Available online: https://www.metoffice.gov.uk/weather/warnings-and-advice/uk-storm-centre/storm-desmond (accessed on 30 January 2025).
- Met Office. Beast from the East. 2018. Available online: https://www.metoffice.gov.uk/weather/learn-about/weather/atmosphere/air-masses/beast-from-the-east (accessed on 30 January 2025).
- Met Office. Storm Arwen Named. 2021. Available online: https://www.metoffice.gov.uk/about-us/news-and-media/media-centre/weather-and-climate-news/2021/storm-arwen-named (accessed on 30 January 2025).
- Ofgem. Final Report on the Review into Network’ Response to Storm Arwen. 2022. Available online: https://www.ofgem.gov.uk/sites/default/files/2022-06/Final%20report%20on%20the%20review%20into%20the%20networks%27%20response%20to%20Storm%20Arwen.pdf (accessed on 30 January 2025).
- Met Office. Recent Trends and Future Projections of UK Storm Activity. 2021. Available online: https://www.metoffice.gov.uk/research/news/2021/recent-trends-and-future-projections-of-uk-storm-activity (accessed on 30 January 2025).
- Ichinose, D.; Yamamoto, M. On the relationship between the provision of waste management service and illegal dumping. Resour. Energy Econ. 2011, 33, 79–93. [Google Scholar] [CrossRef]
- Ibrahim, M.F.; Hod, R.; Toha, H.R.; Mohammed Nawi, A.; Idris, I.B.; Mohd Yusoff, H.; Sahani, M. The impacts of illegal toxic waste dumping on children’s health: A review and case study from Pasir Gudang, Malaysia. Int. J. Environ. Res. Public Health 2021, 18, 2221. [Google Scholar] [CrossRef] [PubMed]
- Limoli, A.; Garzia, E.; De Pretto, A.; De Muri, C. Illegal landfill in Italy (EU)—A multidisciplinary approach. Environ. Forensics 2019, 20, 26–38. [Google Scholar] [CrossRef]
- Morrissey, D.; Hess, M.; Watson, H. National Waste Crime Survey Report 2021—Findings and Analysis; Environment Agency. 2021. Available online: https://assets.publishing.service.gov.uk/media/615b39358fa8f529834947ab/National_waste_crime_survey_report_2021_-_report.pdf (accessed on 30 January 2025).
- Cabinet Office. Emergency Response and Recovery. Non Statutory Guidance Accompanying the Civil Contingencies Act 2004. 2013. Available online: https://assets.publishing.service.gov.uk/government/uploads/system/uploads/attachment_data/file/253488/Emergency_Response_and_Recovery_5th_edition_October_2013.pdf (accessed on 30 January 2025).
- European Space Agency. Sentinel-2. 2025. Available online: https://sentiwiki.copernicus.eu/web/sentinel-2 (accessed on 30 January 2025).
- Airbus. Our Optical and Radar High-Resolution Satellite Imagery, the most comprehensive Constellation of commercial optical and radar Earth Observation Satellites. 2025. Available online: https://space-solutions.airbus.com/imagery/optical-radar-satellite-imagery/ (accessed on 30 January 2025).
- NASA. Terra & Aqua Moderate Resolution Imaging Spectroradiometer (MODIS). 2024. Available online: https://ladsweb.modaps.eosdis.nasa.gov/missions-and-measurements/modis/#:~:text=MODIS%20data%20products%2C%20in%20three,and%20in%20the%20lower%20atmosphere (accessed on 30 January 2025).
- European Space Agency. Sentinel-1. 2025. Available online: https://sentiwiki.copernicus.eu/web/sentinel-1 (accessed on 15 March 2023).
- European Centre for Medium-Range Weather Forecasts (ECMWF). ERA5-Land. 2025. Available online: https://www.ecmwf.int/en/era5-land (accessed on 30 January 2025).
- LiveEO. Unlock the potential of Earth Observation. 2025. Available online: https://www.live-eo.com/ (accessed on 30 January 2025).
- Sile. Space Based Infrastructure Monitoring. 2025. Available online: https://www.sille.space/en/ (accessed on 30 January 2025).
- Everbridge. Everbridge Keeps Your People Safe and Your Organization Running. 2025. Available online: https://www.everbridge.com/ (accessed on 30 January 2025).
- ICEEYE. Accurate, Near Real-Time Earth Monitoring with SAR Data. 2025. Available online: https://www.iceye.com/sar-data (accessed on 30 January 2025).
- MAXAR. Satellite Imagery and Multi-INT Collection. 2025. Available online: https://www.maxar.com/maxar-intelligence/products/satellite-imagery (accessed on 30 January 2025).
- Telespazio Vega. Disaster Management. 2025. Available online: https://telespazio.co.uk/en/markets/disaster-management (accessed on 30 January 2025).
- Office for National Statistics. Estimates of the Population for England and Wales. 2023. Available online: https://www.ons.gov.uk/peoplepopulationandcommunity/populationandmigration/populationestimates/datasets/estimatesofthepopulationforenglandandwales (accessed on 10 March 2023).
- Hall, D.K.; Riggs, G.; Román, M.O. VIIRS Snow Cover Algorithm Theoretical Basis Document. 2015. Available online: http://modis-snow-ice.gsfc.nasa.gov/uploads/VIIRS_snow_cover_ATBD_2015.pdf?_ga=2.113947655.1257306268.1679576062-2442.218691736.1678710481 (accessed on 30 January 2025).
- Hall, D.K.; Riggs, G.A.; Salomonson, V.V. Development of methods for mapping global snow cover using moderate resolution imaging spectroradiometer data. Remote Sens. Environ. 1995, 54, 127–140. [Google Scholar] [CrossRef]
- Snapir, B.; Momblanch, A.; Jain, S.K.; Waine, T.W.; Holman, I.P. A method for monthly mapping of wet and dry snow using Sentinel-1 and MODIS: Application to a Himalayan river basin. Int. J. Appl. Earth Obs. Geoinf. 2019, 74, 222–230. [Google Scholar] [CrossRef]
- Lievens, H.; Demuzere, M.; Marshall, H.P.; Reichle, R.H.; Brucker, L.; Brangers, I.; de Rosnay, P.; Dumont, M.; Girotto, M.; Immerzeel, W.W.; et al. Snow depth variability in the Northern Hemisphere mountains observed from space. Nat. Commun. 2019, 10, 4629. [Google Scholar] [CrossRef] [PubMed]
- Buchelt, S.; Skov, K.; Rasmussen, K.K.; Ullmann, T. Sentinel-1 time series for mapping snow cover depletion and timing of snowmelt in Arctic periglacial environments: Case study from Zackenberg and Kobbefjord, Greenland. Cryosphere 2022, 16, 625–646. [Google Scholar] [CrossRef]
- Foster, J.L.; Hall, D.K.; Chang, A.T.C.; Rango, A. An overview of passive microwave snow research and results. Rev. Geophys. 1984, 22, 195–208. [Google Scholar] [CrossRef]
- Nagler, T.; Rott, H.; Ripper, E.; Bippus, G.; Hetzenecker, M. Advancements for snowmelt monitoring by means of Sentinel-1 SAR. Remote Sens. 2016, 8, 348. [Google Scholar] [CrossRef]
- Ulaby, F.T.; Stiles, W.H.; Abdelrazik, M. Snowcover influence on backscattering from terrain. IEEE Trans. Geosci. Remote Sens. 1984, 2, 126–133. [Google Scholar] [CrossRef]
- Gill, J.; Faisal, K.; Shaker, A.; Yan, W.Y. Detection of waste dumping locations in landfill using multi-temporal Landsat thermal images. Waste Manag. Res. 2019, 37, 386–393. [Google Scholar] [CrossRef]
- Zhao, X.; Yang, Y.; Duan, F.; Zhang, M.; Jiang, G.; Yan, X.; Cao, S.; Zhao, W. Identification of construction and demolition waste based on change detection and deep learning. Int. J. Remote Sens. 2022, 43, 2012–2028. [Google Scholar] [CrossRef]
- Hosseini, M.; Lim, S. Burned area detection using Sentinel-1 SAR data: A case study of Kangaroo Island, South Australia. Appl. Geogr. 2023, 151, 102854. [Google Scholar] [CrossRef]
- Rajkumar, A.; Kft, C.A.; Sziranyi, T.; Majdik, A. Detecting Landfills Using Multi-Spectral Satellite Images and Deep Learning Methods. Proc. ICLR. 2022. Available online: https://pml4dc.github.io/iclr2022/pdf/PML4DC_ICLR2022_9.pdf (accessed on 30 January 2025).
- Yan, W.Y.; Mahendrarajah, P.; Shaker, A.; Faisal, K.; Luong, R.; Al-Ahmad, M. Analysis of multi-temporal landsat satellite images 2036 for monitoring land surface temperature of municipal solid waste disposal sites. Environ. Monit. Assess. 2014, 186, 8161–8173. [Google Scholar] [CrossRef]
- NASA. MODIS Vegetation Index Products (NDVI and EVI). 2025. Available online: https://modis.gsfc.nasa.gov/data/dataprod/mod13.php (accessed on 30 January 2025).
- Mahmood, K.; Ul-Haq, Z.; Faizi, F.; Tariq, S.; Naeem, M.A.; Rana, A.D. Monitoring open dumping of municipal waste in Gujranwala, Pakistan using a combination of satellite based bio-thermal indicators and GIS analysis. Ecol. Indic. 2019, 107, 105613. [Google Scholar] [CrossRef]
- Mahmood, K.; Ul-Haq, Z.; Faizi, F.; Batol, S.A. A comparison of satellite-based indices for hazard assessment of MSW open dumps using spatial analysis. Waste Manag. Res. 2019, 37, 219–236. [Google Scholar] [CrossRef] [PubMed]
- Gazzea, M.; Pacevicius, M.; Dammann, D.O.; Sapronova, A.; Lunde, T.M.; Arghandeh, R. Automated power lines vegetation monitoring using high-resolution satellite imagery. IEEE Trans. Power Deliv. 2021, 37, 308–316. [Google Scholar] [CrossRef]
- Hartling, S.; Sagan, V.; Maimaitijiang, M.; Dannevik, W.; Pasken, R. Estimating tree-related power outages for regional utility network using airborne LiDAR data and spatial statistics. Int. J. Appl. Earth Obs. Geoinf. 2021, 100, 102330. [Google Scholar] [CrossRef]
- Matikainen, L.; Lehtomäki, M.; Ahokas, E.; Hyyppä, J.; Karjalainen, M.; Jaakkola, A.; Kukko, A.; Heinonen, T. Remote sensing methods for power line corridor surveys. ISPRS J. Photogramm. Remote Sens. 2016, 119, 10–31. [Google Scholar] [CrossRef]
- Cole, T.A.; Wanik, D.W.; Molthan, A.L.; Román, M.O.; Griffin, R.E. Synergistic use of nighttime satellite data, electric utility infrastructure, and ambient population to improve power outage detections in urban areas. Remote Sens. 2017, 9, 286. [Google Scholar] [CrossRef]
- Shah, Z.; Hsu, F.C.; Elvidge, C.D.; Taneja, J. Mapping Disasters & Tracking Recovery in Conflict Zones Using Nighttime Lights. In Proceedings of the 2020 IEEE Global Humanitarian Technology Conference (GHTC), Seattle, WA, USA, 29 October–1 November 2020; pp. 1–8. [Google Scholar] [CrossRef]
- Hall, D.K.; Riggs, G.A. MODIS/Terra Snow Cover Daily L3 Global 500m SIN Grid; (MOD10A1, Version 6). [Data Set]; NASA National Snow and Ice Data Center Distributed Active Archive Center: Boulder, CO, USA, 2016. [Google Scholar] [CrossRef]
- European Space Agency. Sentinel-1 SAR GRD: C-Band Synthetic Aperture Radar Ground Range Detected, Log Scaling. 2023. Available online: https://developers.google.com/earth-engine/datasets/catalog/COPERNICUS_S1_GRD (accessed on 26 March 2023).
- Office for National Statistics. Lower layer Super Output Areas (December 2021) Boundaries EW BFE (V10). 2023. Available online: https://geoportal.statistics.gov.uk/datasets/ons::lower-layer-super-output-areas-december-2021-boundaries-ew-bfe-v10-2/about (accessed on 30 January 2025).
- Care Homes. Find a Care Home. 2023. Available online: https://www.cqc.org.uk/care-services/find-care-home (accessed on 15 March 2023).
- Northern Powergrid. Power Cuts. 2023. Available online: https://www.northernpowergrid.com/power-cuts-map (accessed on 15 March 2023).
- Met Office Warnings. Weather and Advice. 2023. Available online: https://weather.metoffice.gov.uk/warnings-and-advice (accessed on 31 March 2025).
- Visual Crossing. Weather Data & API. 2023. Available online: https://www3.visualcrossing.com/ (accessed on 30 January 2025).
- NASA. VNP46A2: VIIRS Lunar Gap-Filled BRDF Nighttime Lights Daily L3 Global 500m. 2025. Available online: https://developers.google.com/earth-engine/datasets/catalog/NOAA_VIIRS_001_VNP46A2 (accessed on 30 January 2025).
- European Centre for Medium-Range Weather Forecasts. ECMWF Reanalysis v5. 2025. Available online: https://www.ecmwf.int/en/forecasts/dataset/ecmwf-reanalysis-v5 (accessed on 30 January 2025).
- Buchhorn, M.; Smets, B.; Bertels, L.; Roo, B.D.; Lesiv, M.; Tsendbazar, N.E.; Herold, M.; Fritz, S. Copernicus Global Land Service: 2131 Land Cover 100m: Collection 3: Epoch 2019: Globe, 2020. 2020. Available online: https://zenodo.org/records/3939050 (accessed on 30 January 2025).
- Ordnance Survey. OS MasterMap Highways Network. 2022. Available online: https://digimap.edina.ac.uk/ (accessed on 10 February 2023).
- Met Office. Severe Winter Weather and Storm Darcy, February 2021. 2021. Available online: https://www.metoffice.gov.uk/binaries/content/assets/metofficegovuk/pdf/weather/learn-about/uk-past-events/interesting/2021/2021_02_low_temperatures.pdf (accessed on 30 January 2025).
- Tsai, Y.L.S.; Dietz, A.; Oppelt, N.; Kuenzer, C. Remote Sensing of Snow Cover Using Spaceborne SAR: A Review. Remote Sens. 2019, 11, 1456. [Google Scholar] [CrossRef]
- Dasari, K.; Anjaneyulu, L.; Jayasri, P.; Prasad, A. Importance of Speckle Filtering in Image Classification of SAR Data. In Proceedings of the 2015 International Conference on Microwave, Optical and Communication Engineering (ICMOCE), Bhubaneswar, India, 18–20 December 2015; pp. 349–352. [Google Scholar] [CrossRef]
- Canty, M.J.; Nielsen, A.A.; Conradsen, K.; Skriver, H. Statistical Analysis of Changes in Sentinel-1 Time Series on the Google Earth Engine. Remote Sens. 2020, 12, 46. [Google Scholar] [CrossRef]
- Gorelick, N.; Hancher, M.; Dixon, M.; Ilyushchenko, S.; Thau, D.; Moore, R. Google Earth Engine: Planetary-scale geospatial 2084 analysis for everyone. Remote Sens. Environ. 2017, 202, 18–27. [Google Scholar] [CrossRef]
- Canty, M.J. Image Analysis, Classification and Change Detection in Remote Sensing: With Algorithms for Python, 4th ed.; CRC Press: Boca Raton, FL, USA, 2019. [Google Scholar]
- Conradsen, K.; Nielsen, A.; Schou, J.; Skriver, H. A test statistic in the complex Wishart distribution and its application to change detection in polarimetric SAR data. IEEE Trans. Geosci. Remote Sens. 2003, 41, 4–19. [Google Scholar] [CrossRef]
- Conradsen, K.; Nielsen, A.A.; Skriver, H. Determining the Points of Change in Time Series of Polarimetric SAR Data. IEEE Trans. Geosci. Remote Sens. 2016, 54, 3007–3024. [Google Scholar] [CrossRef]
- Northern Powergrid. Northern Powergrid Map Shows North East Areas Still Without Power on Day 11. 2021. Available online: https://www.thenorthernecho.co.uk/news/19764492.northern-powergrid-map-shows-north-east-areas-still-without-power-day-11/ (accessed on 30 January 2025).
- Stack Overflow. Most Used Web Frameworks Among Developers Worldwide, as of 2024. Statista Inc.: Hamburg, Germany, 2024. Available online: https://www.statista.com/statistics/1124699/worldwide-developer-survey-most-used-frameworks-web/ (accessed on 27 March 2025).
- Hirpa, F.A.; Salamon, P.; Beck, H.E.; Lorini, V.; Alfieri, L.; Zsoter, E.; Dadson, S.J. Calibration of the Global Flood Awareness 2021 System (GloFAS) using daily streamflow data. J. Hydrol. 2018, 566, 595–606. [Google Scholar] [CrossRef] [PubMed]
- Tod, A.M.; Lusambili, A.; Homer, C.; Abbott, J.; Cooke, J.M.; Stocks, A.J.; McDaid, K.A. Understanding factors influencing vulnerable older people keeping warm and well in winter: A qualitative study using social marketing techniques. BMJ Open 2012, 2, e000922. [Google Scholar] [CrossRef]
- Jones, L.; Mays, N. The experience of potentially vulnerable people during cold weather: Implications for policy and practice. Public Health 2016, 137, 20–25. [Google Scholar] [CrossRef]
- SatVu. High Resolution Thermal Data from Space for a Safer and More Sustainable Earth. 2025. Available online: https://www.satellitevu.com/ (accessed on 31 March 2023).
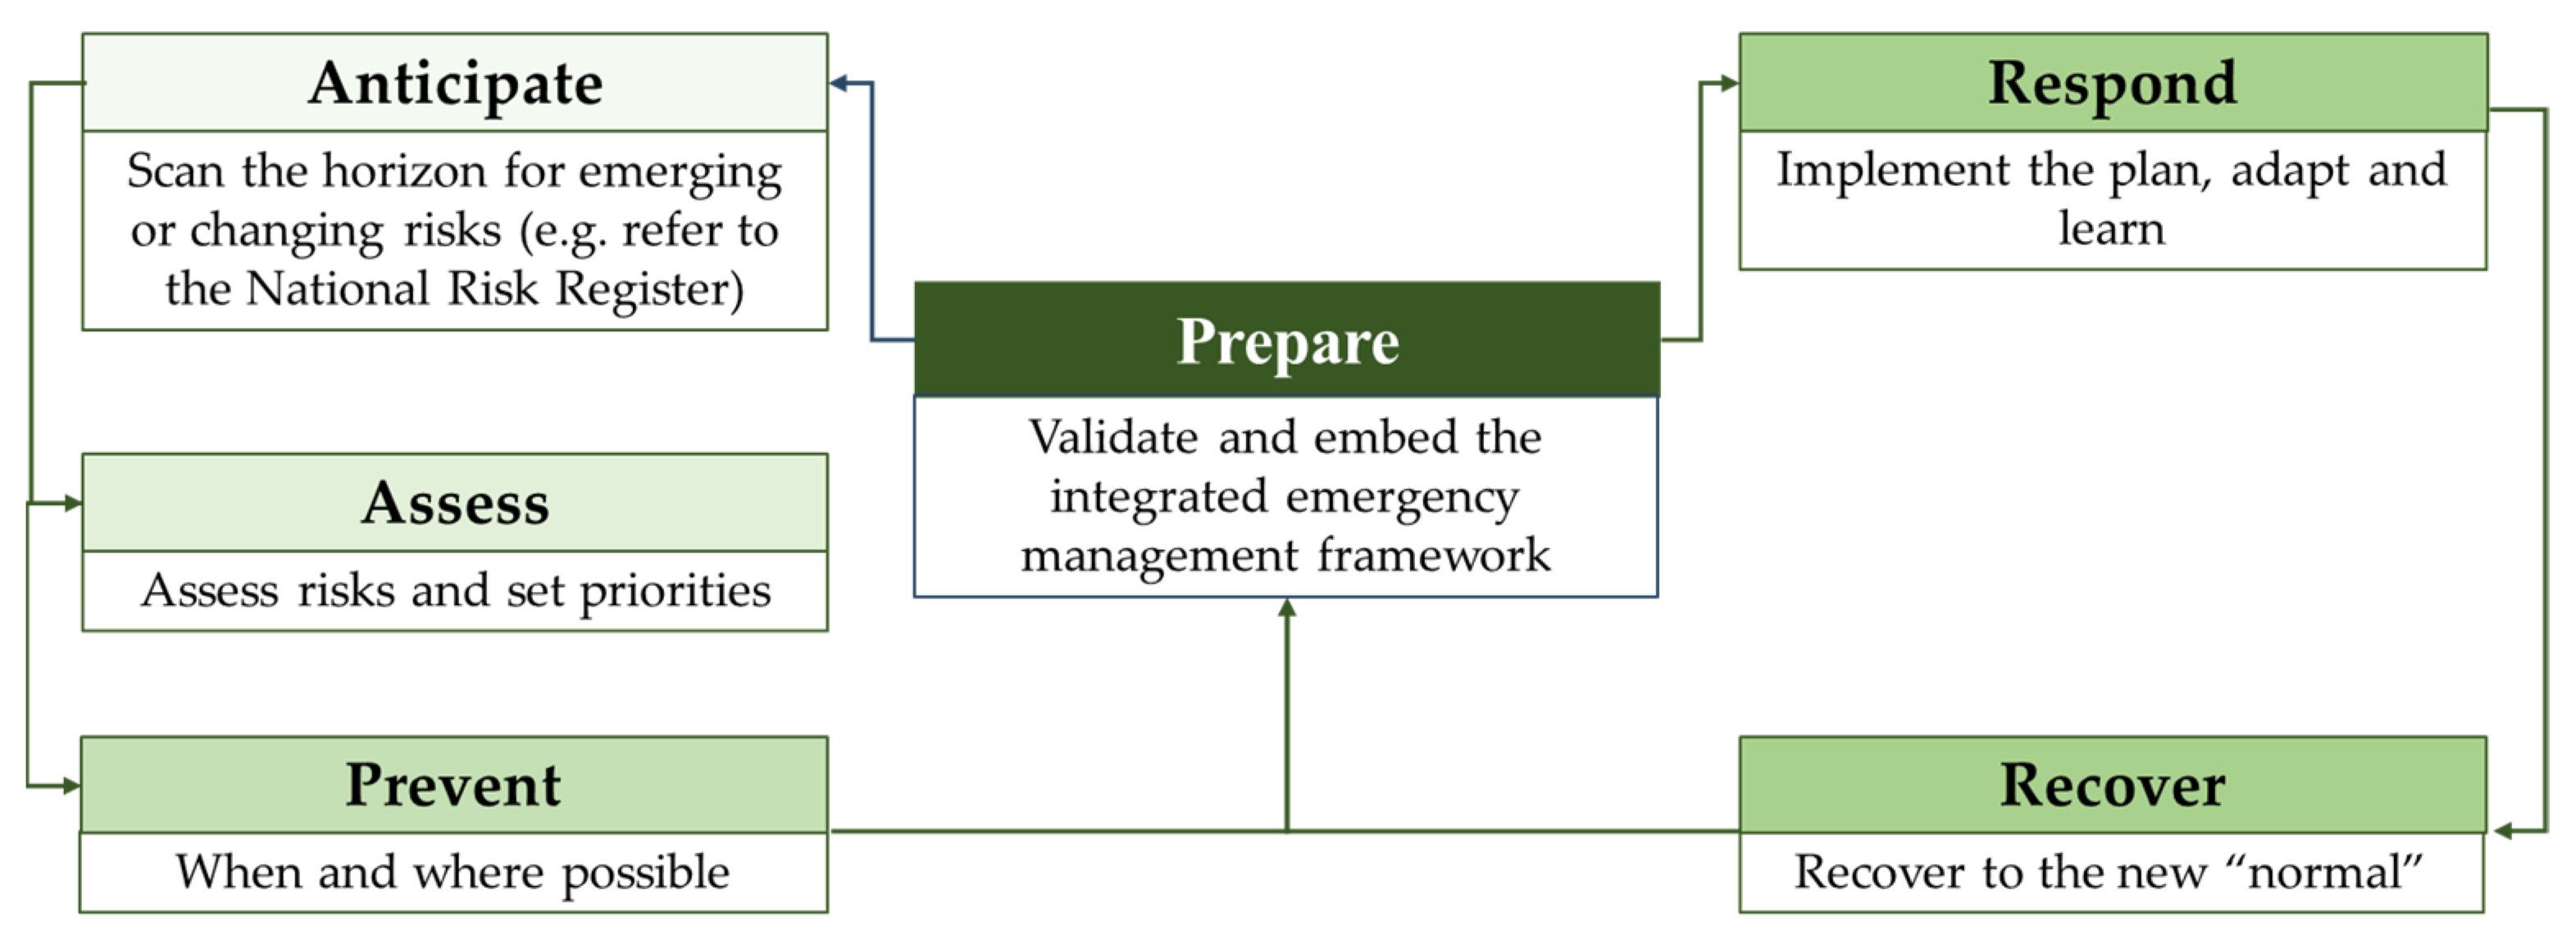
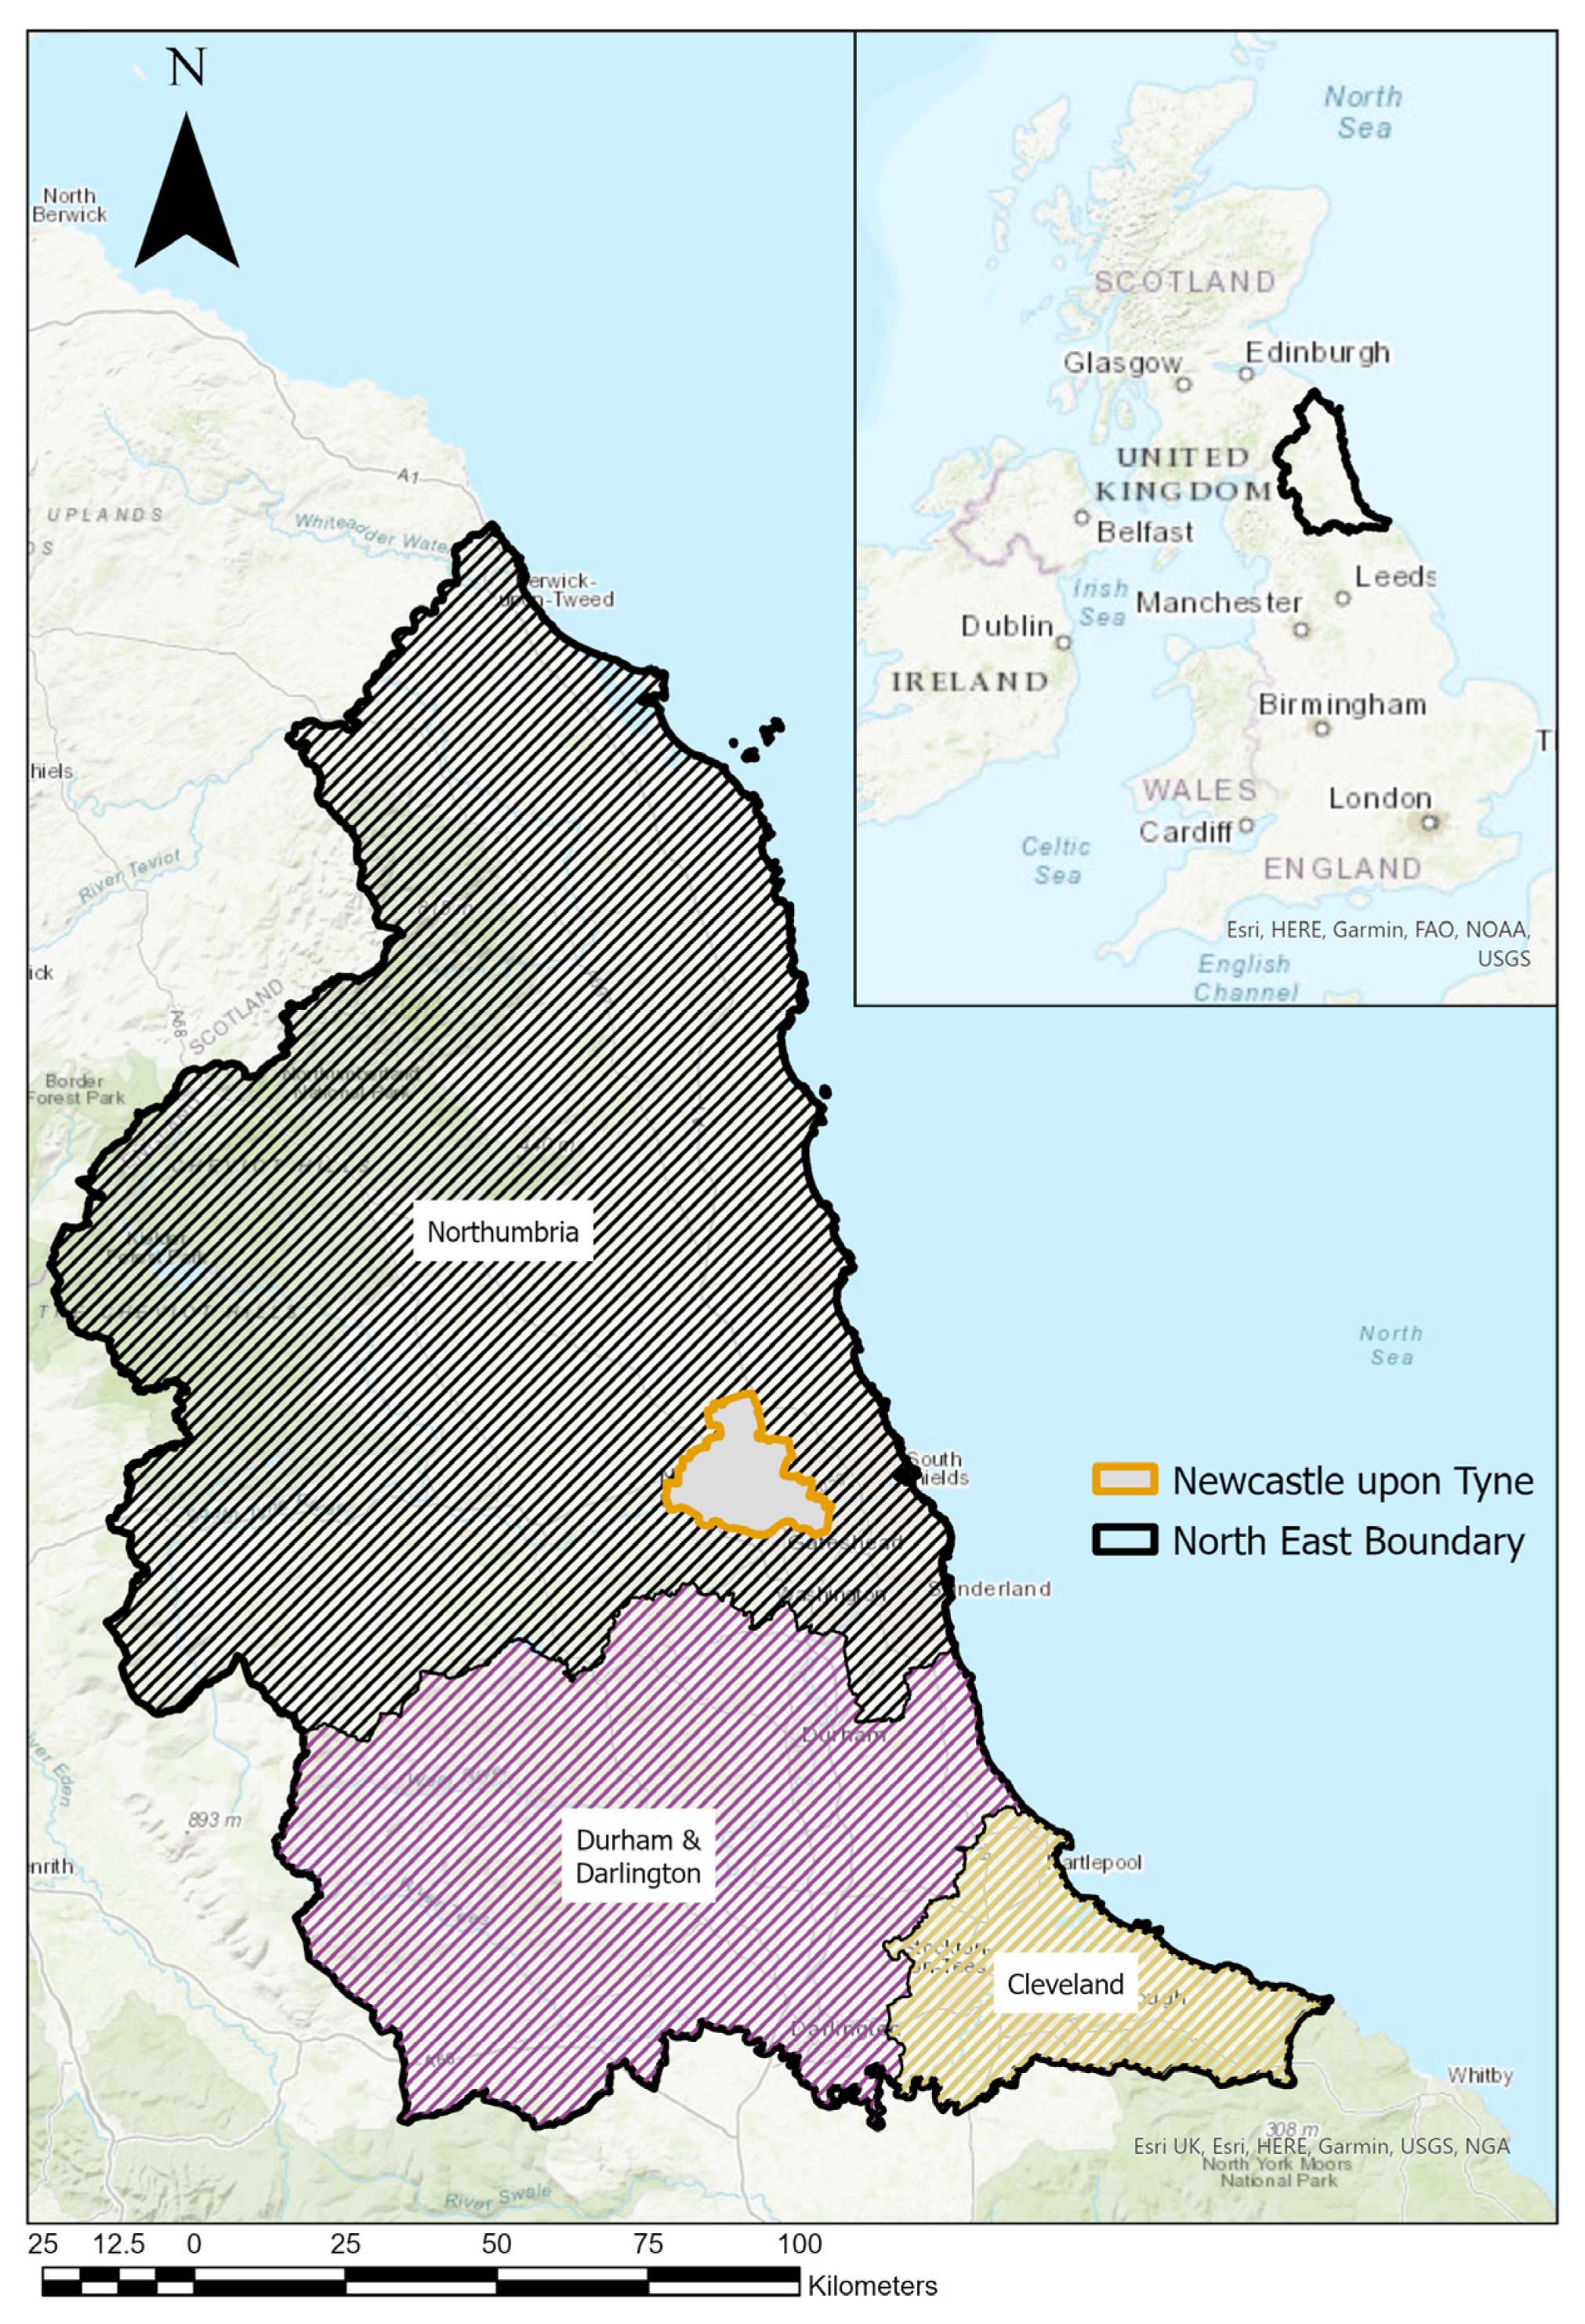
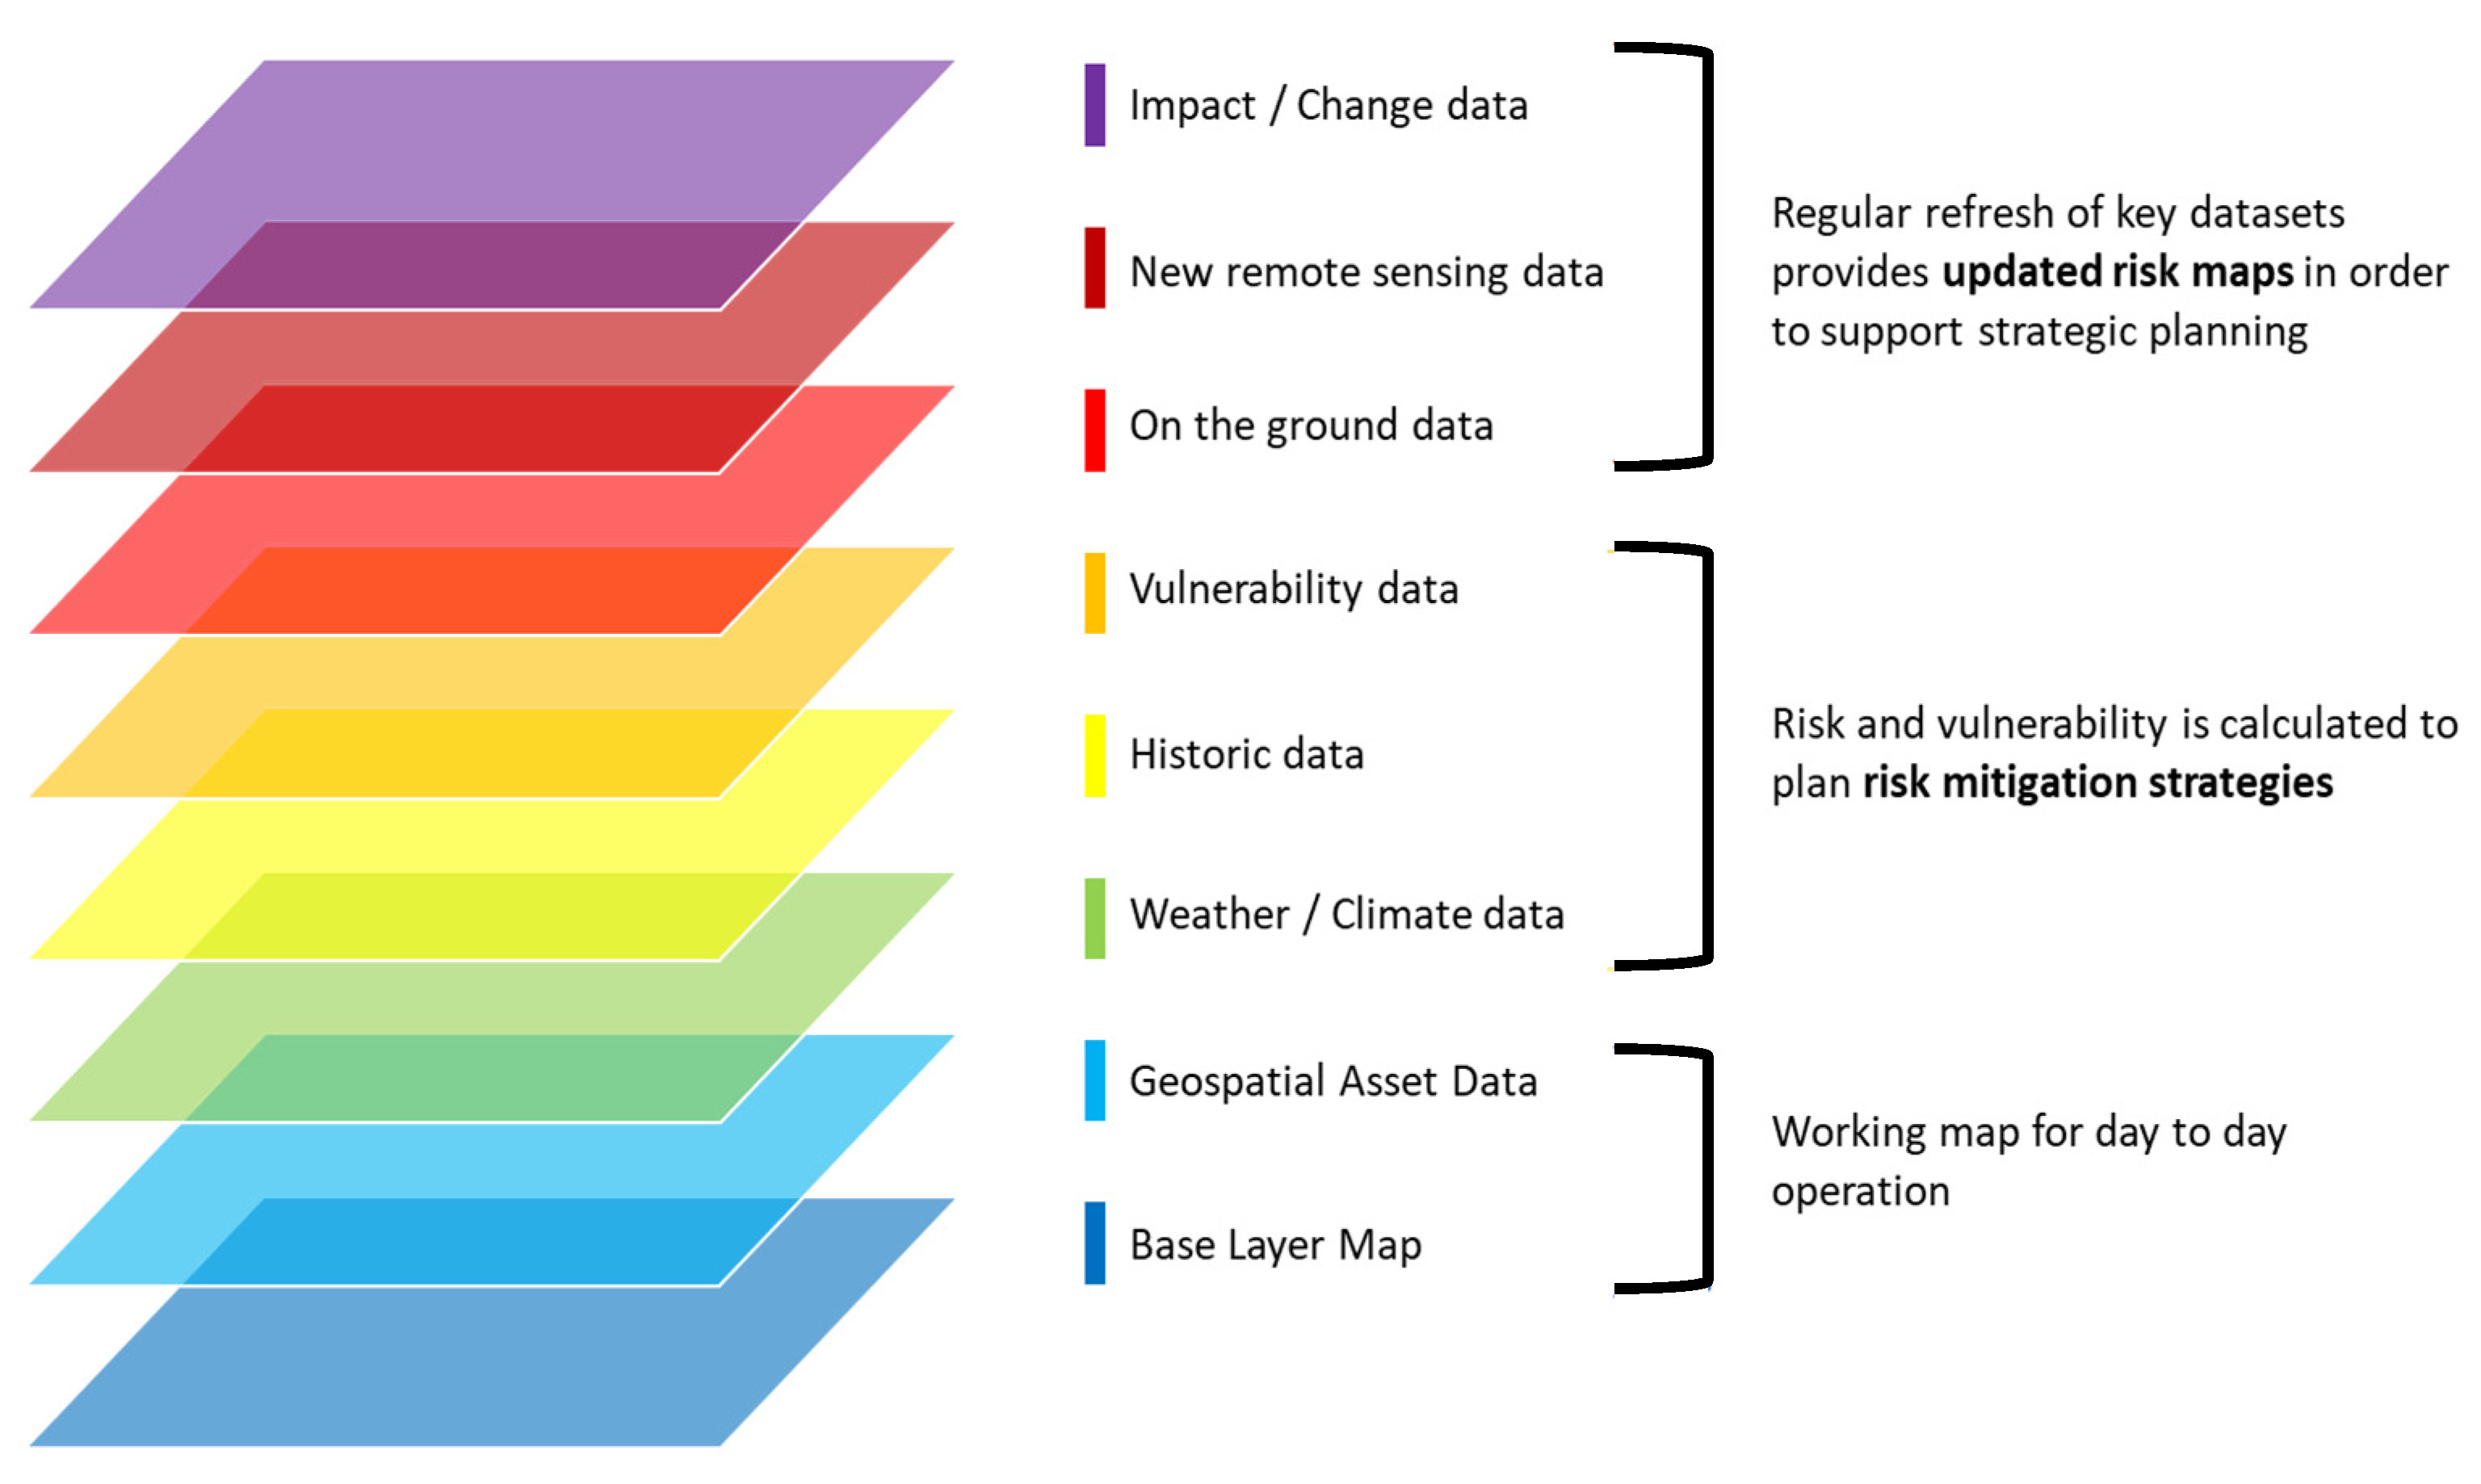


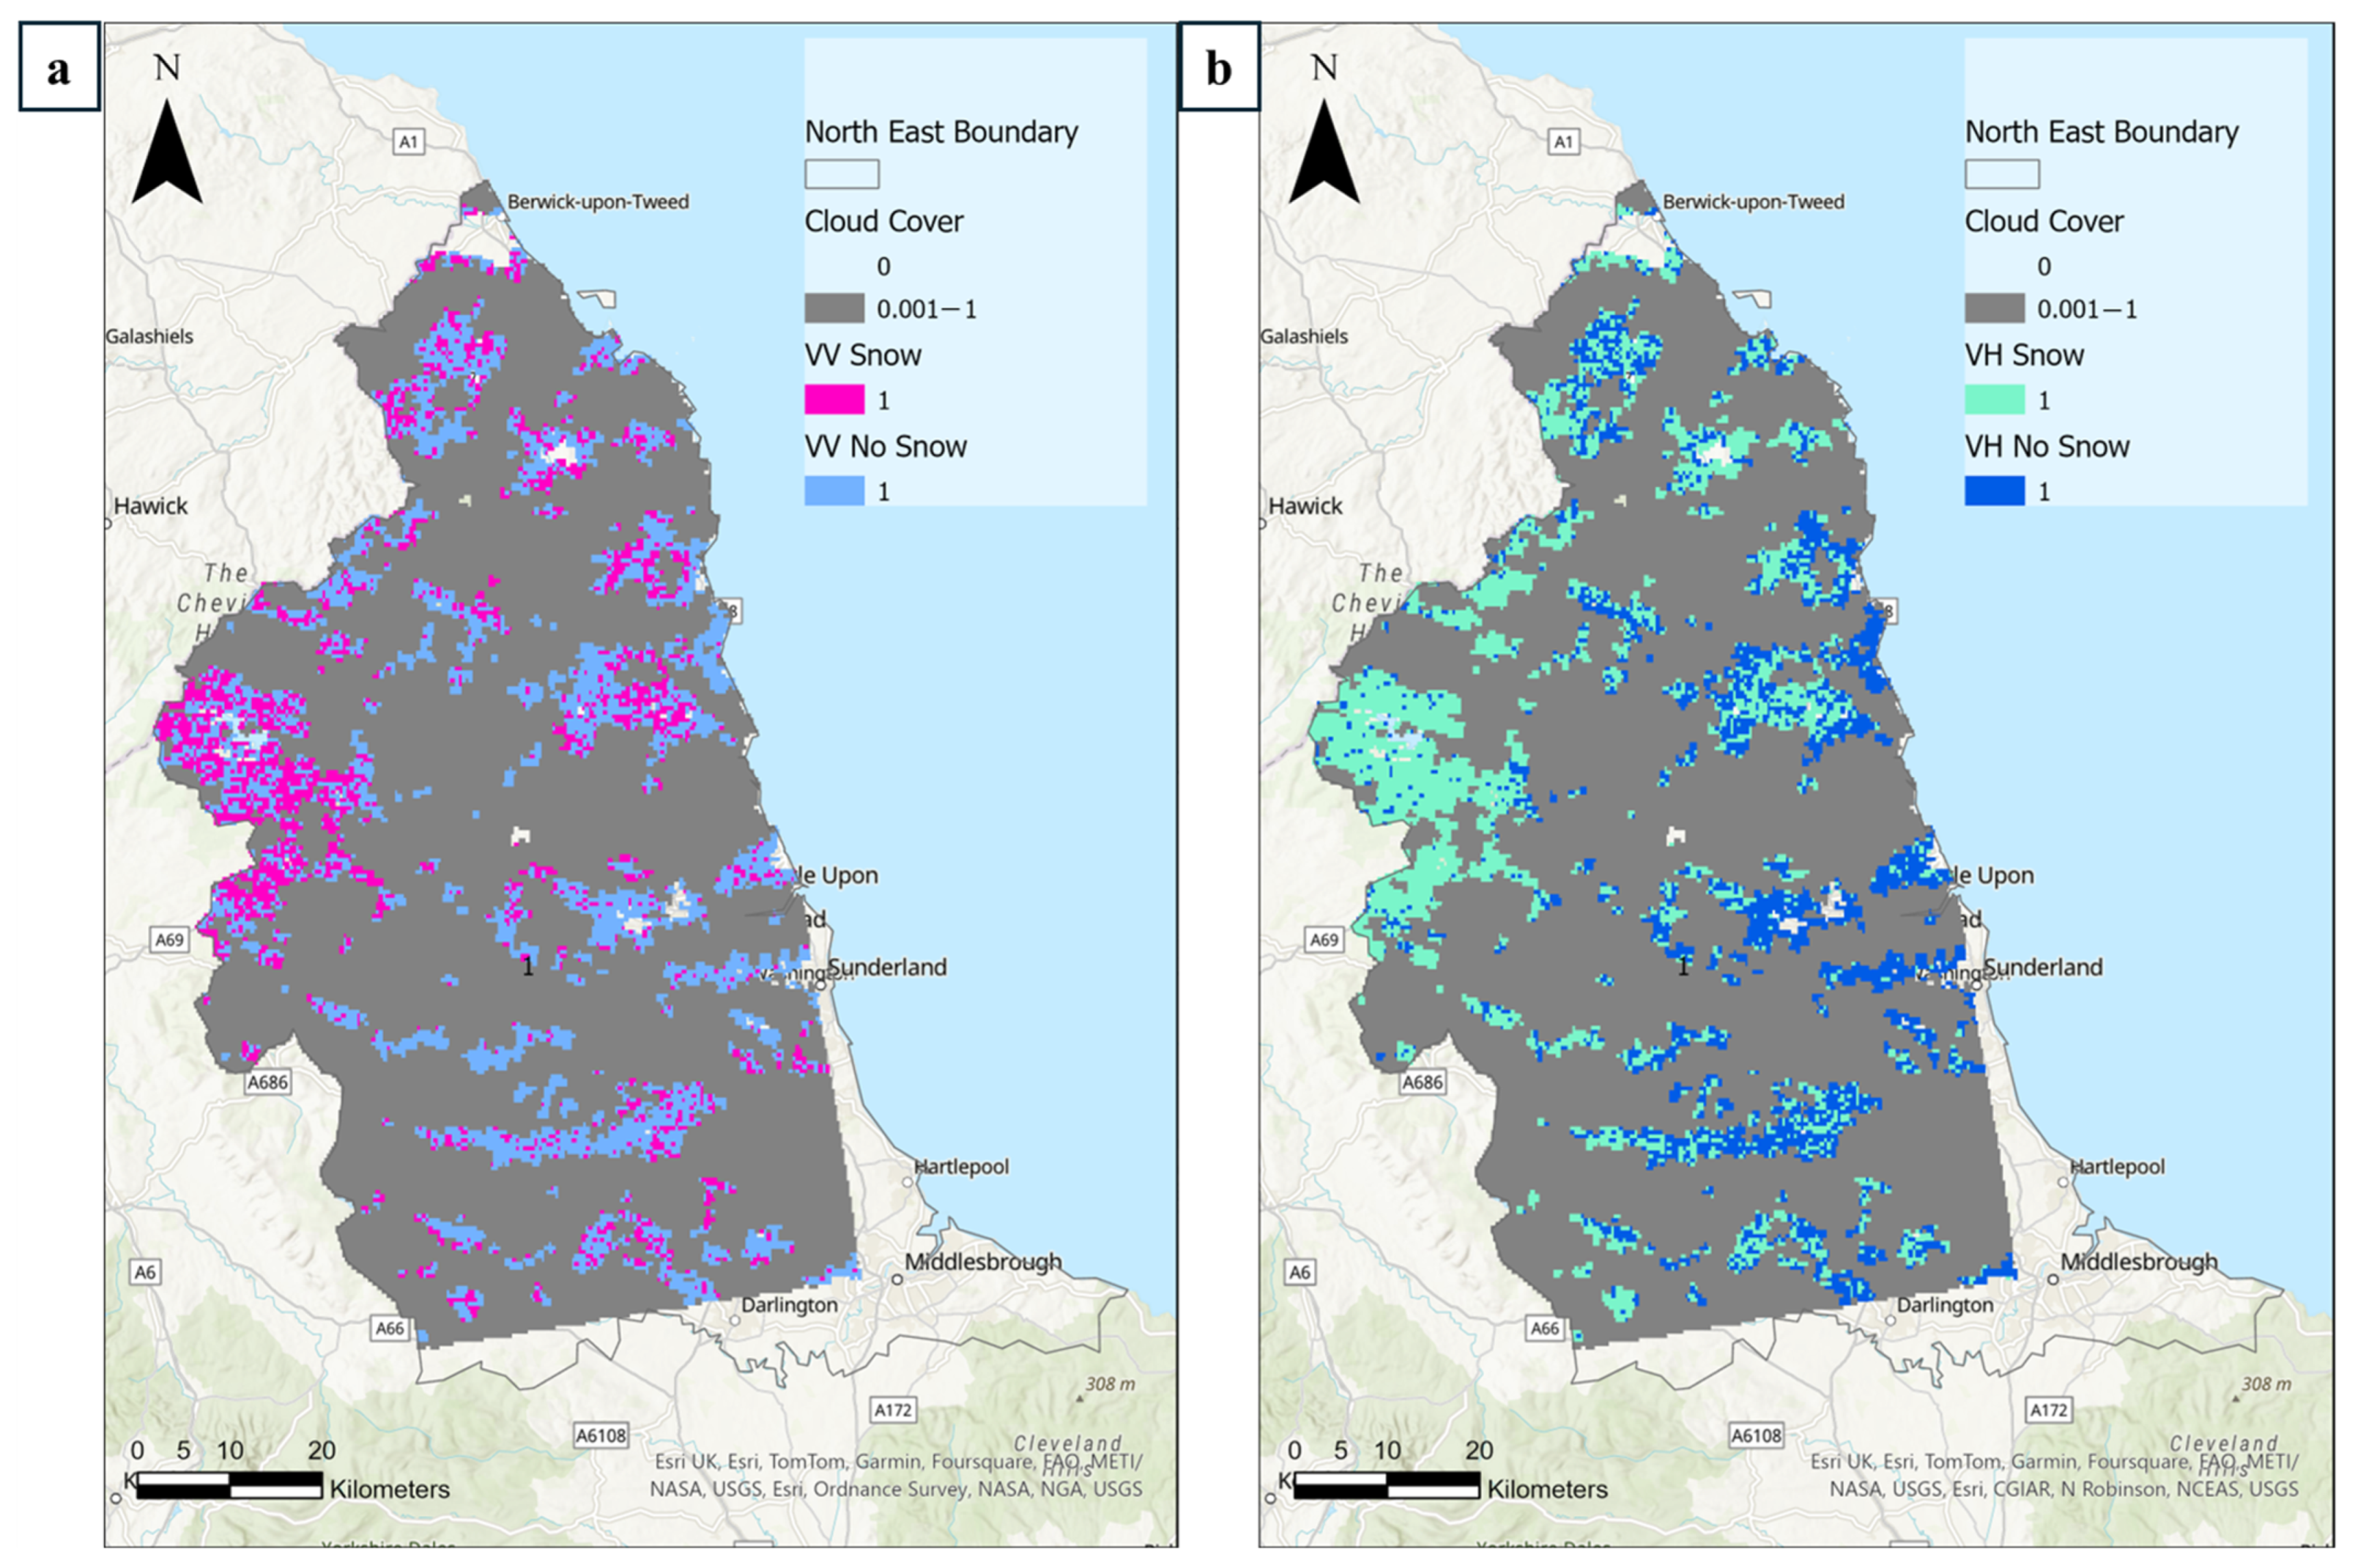


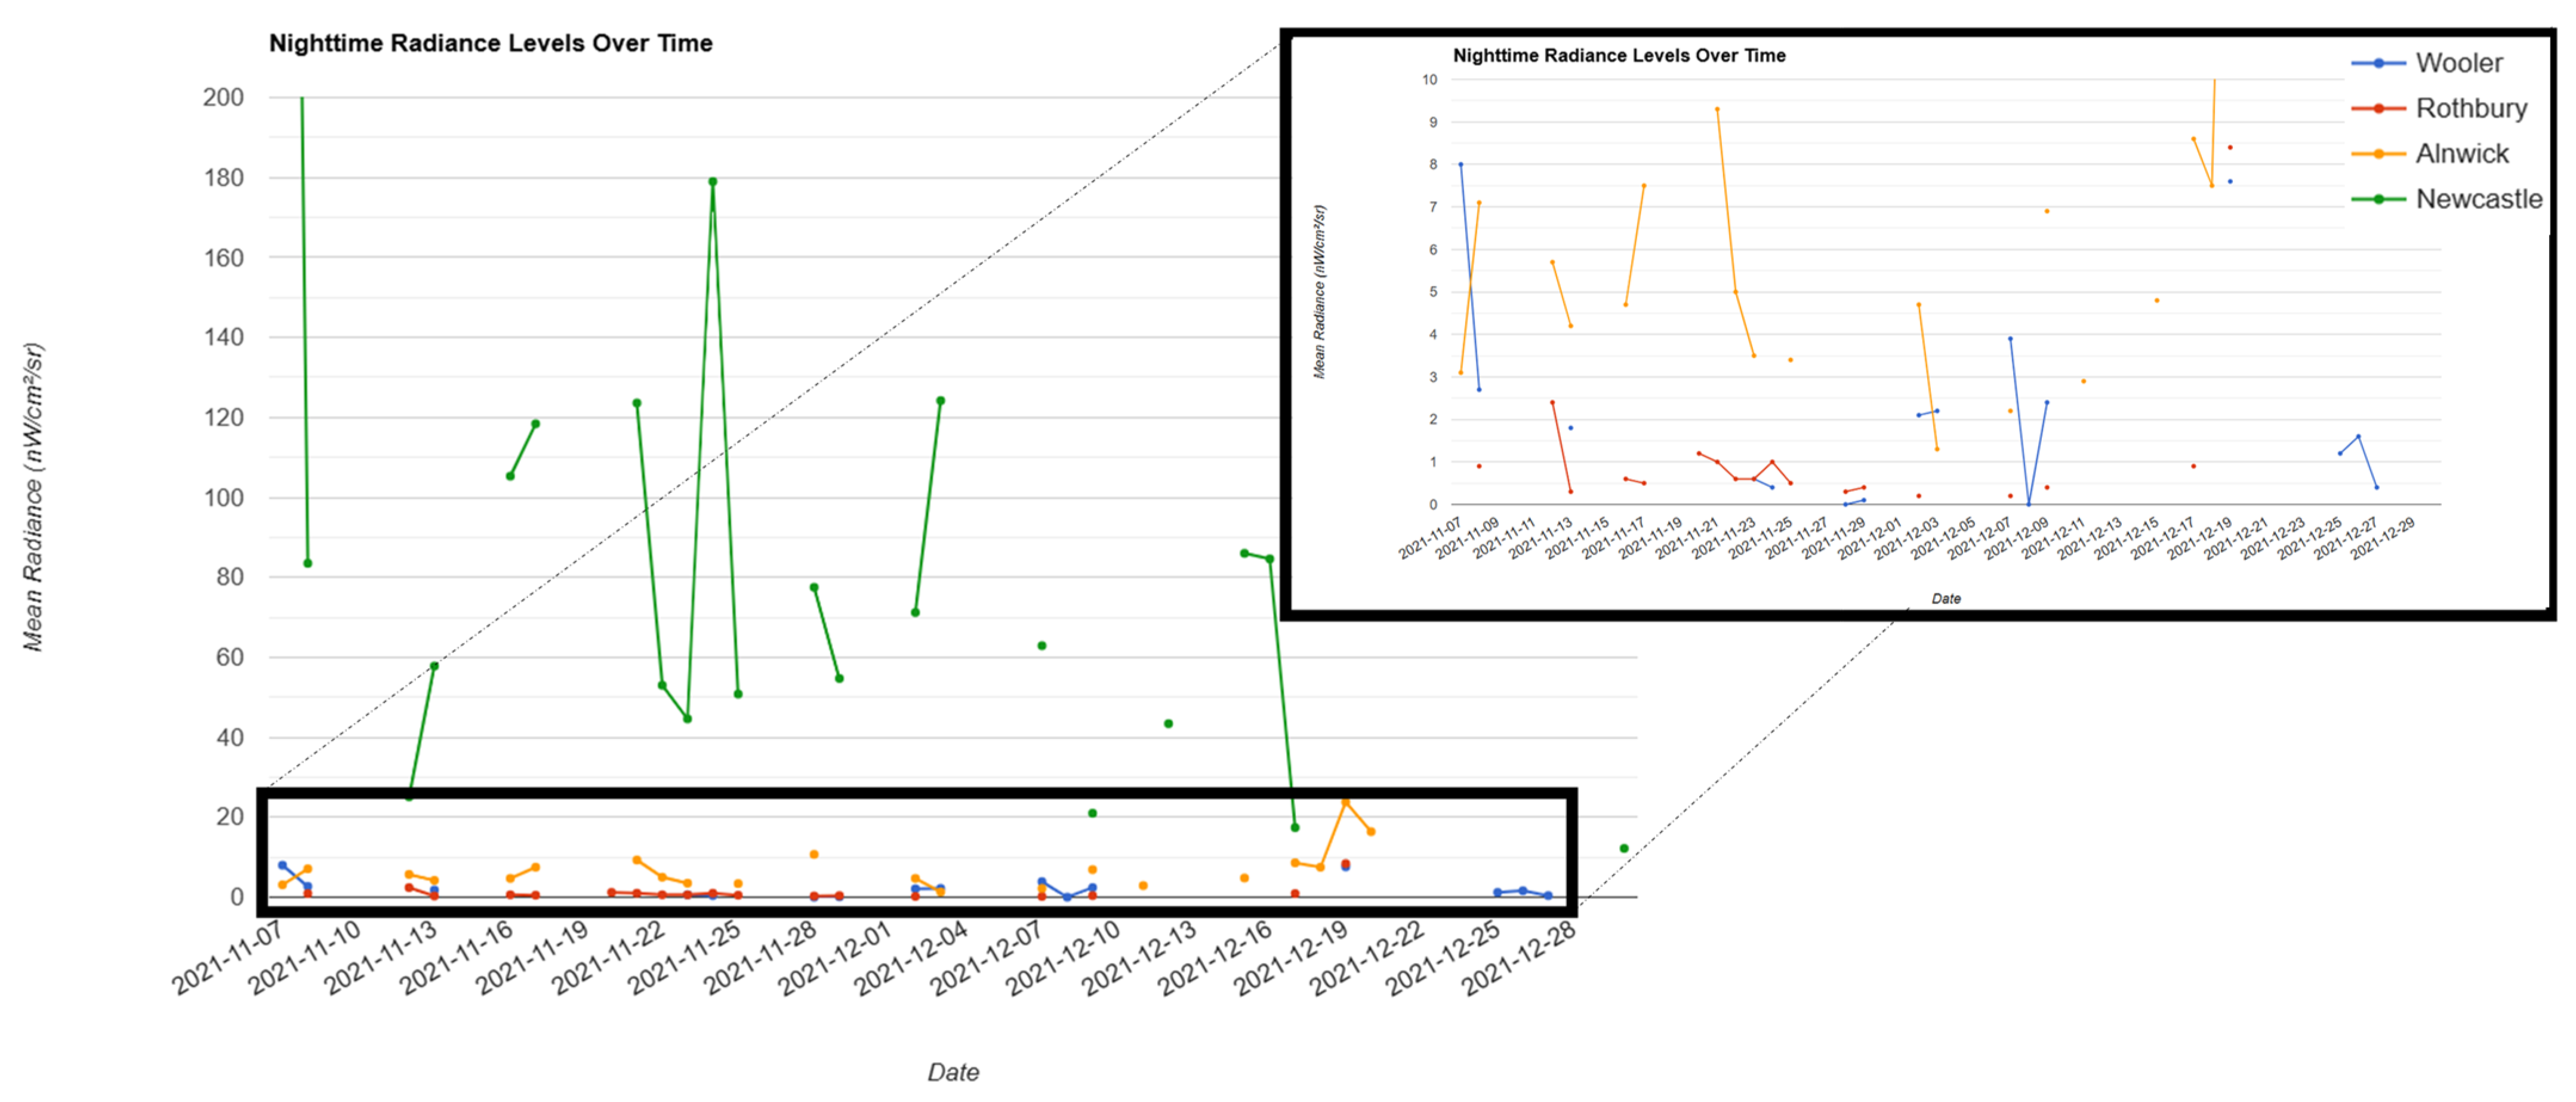
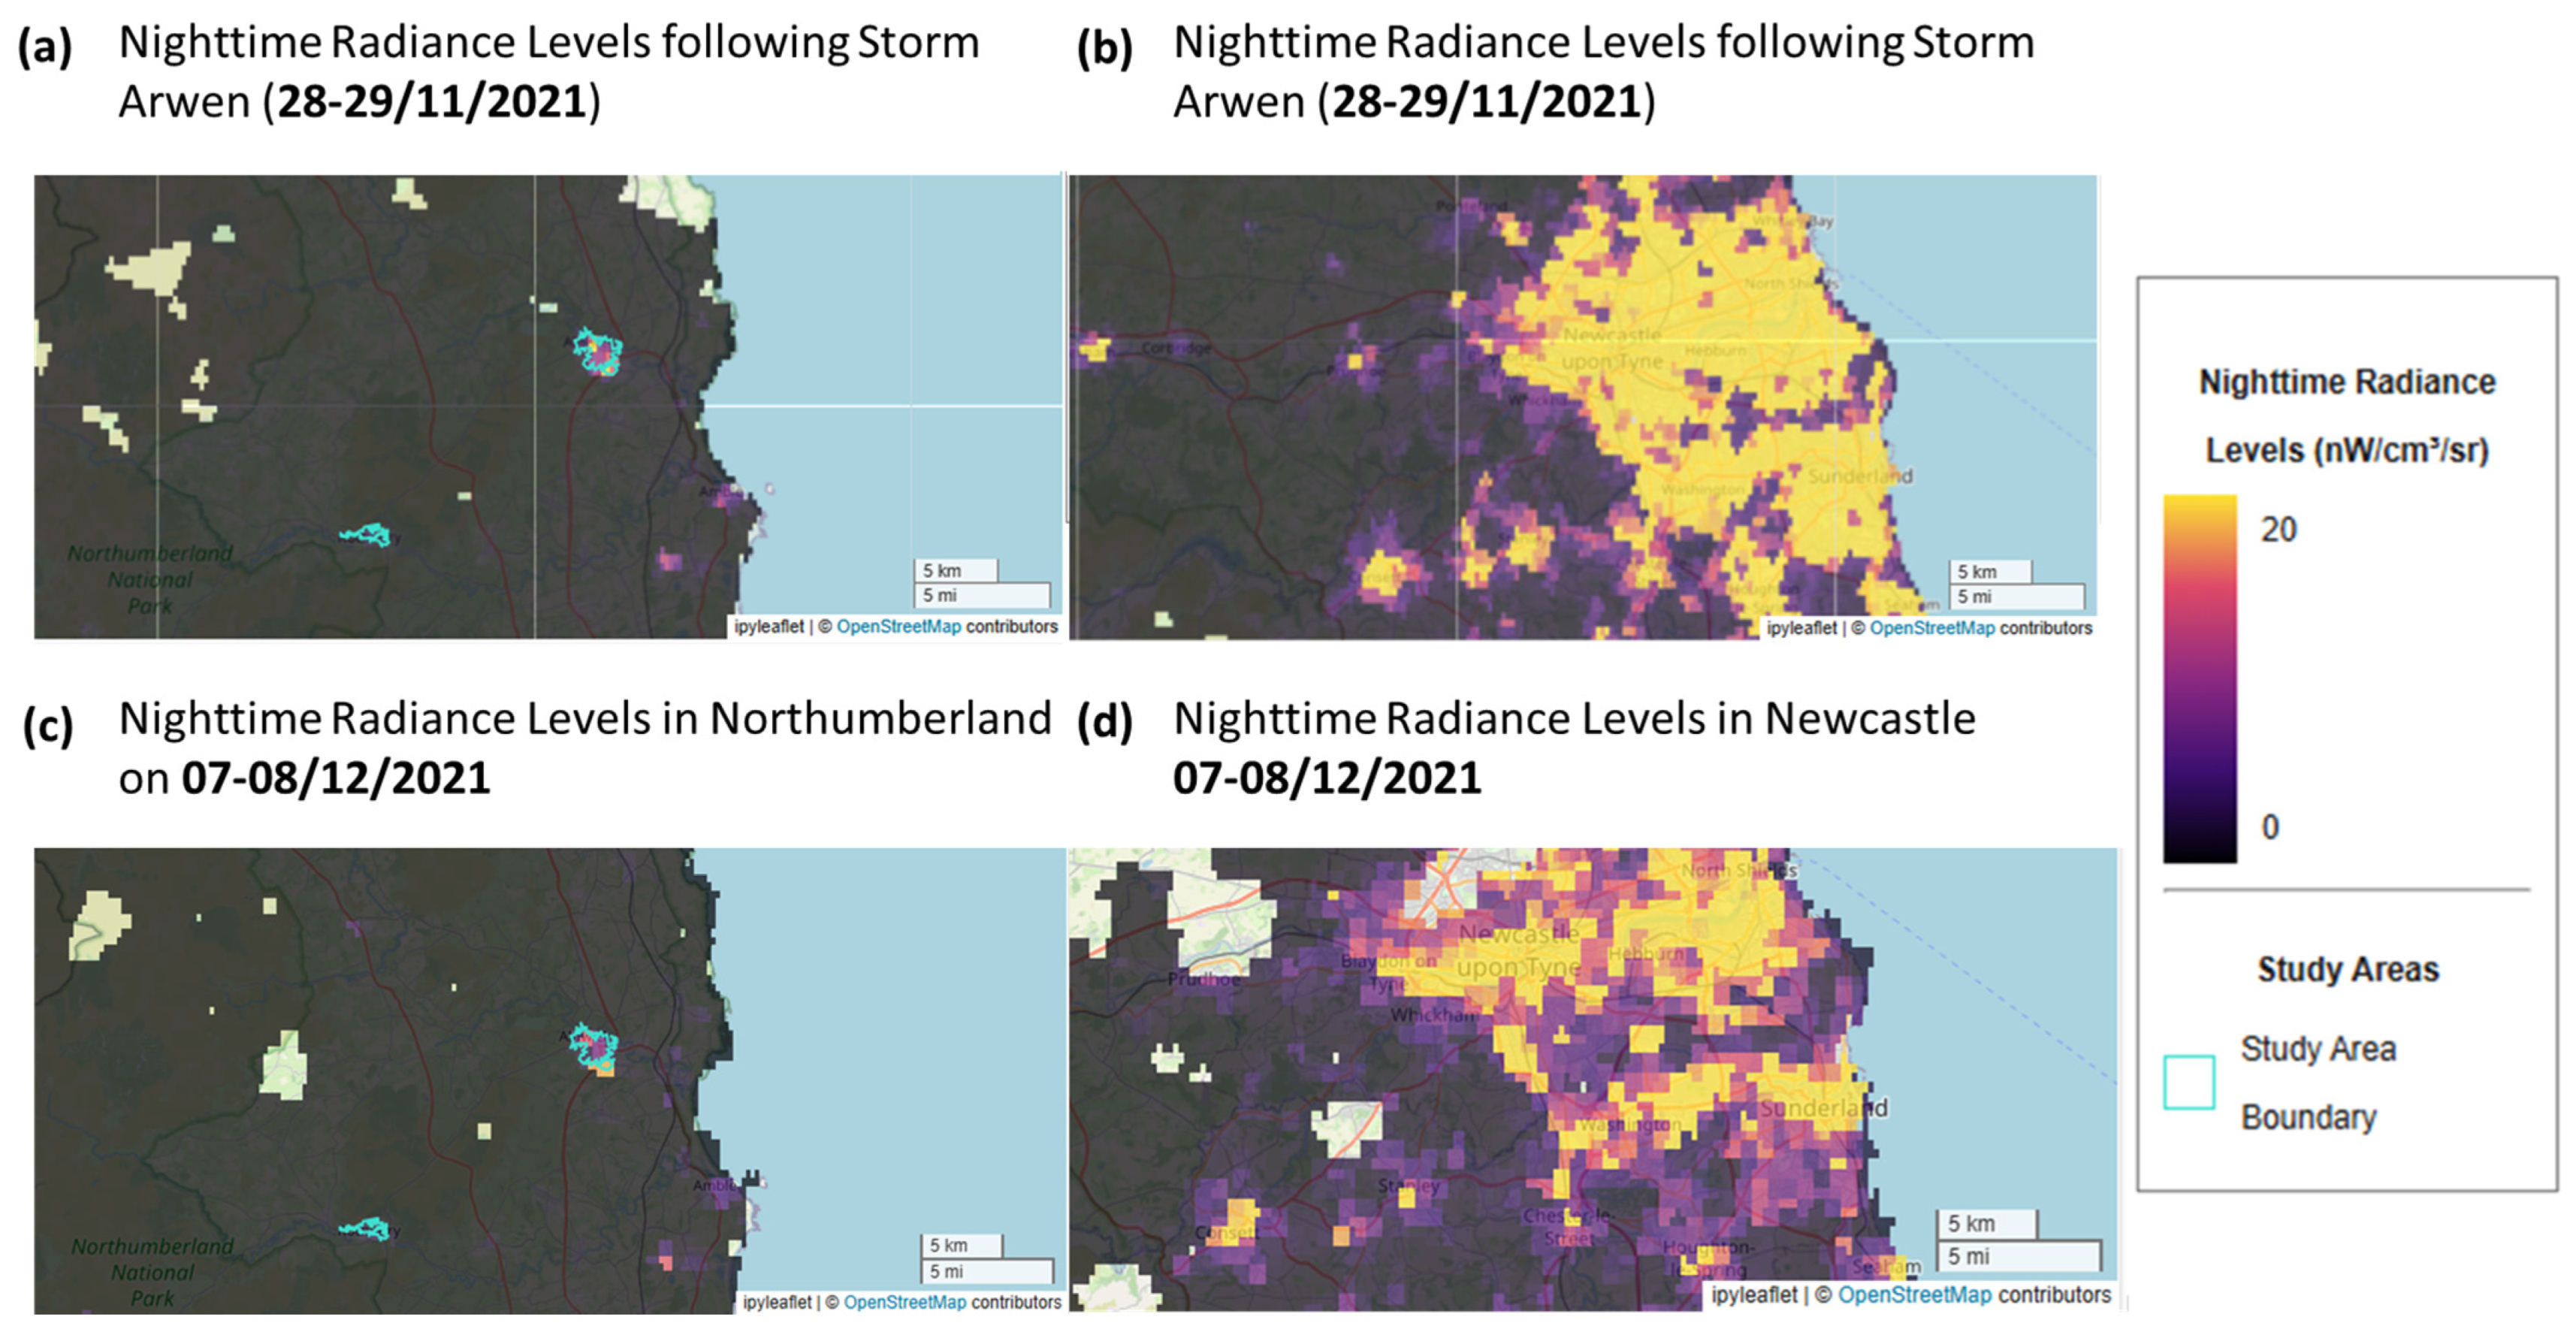

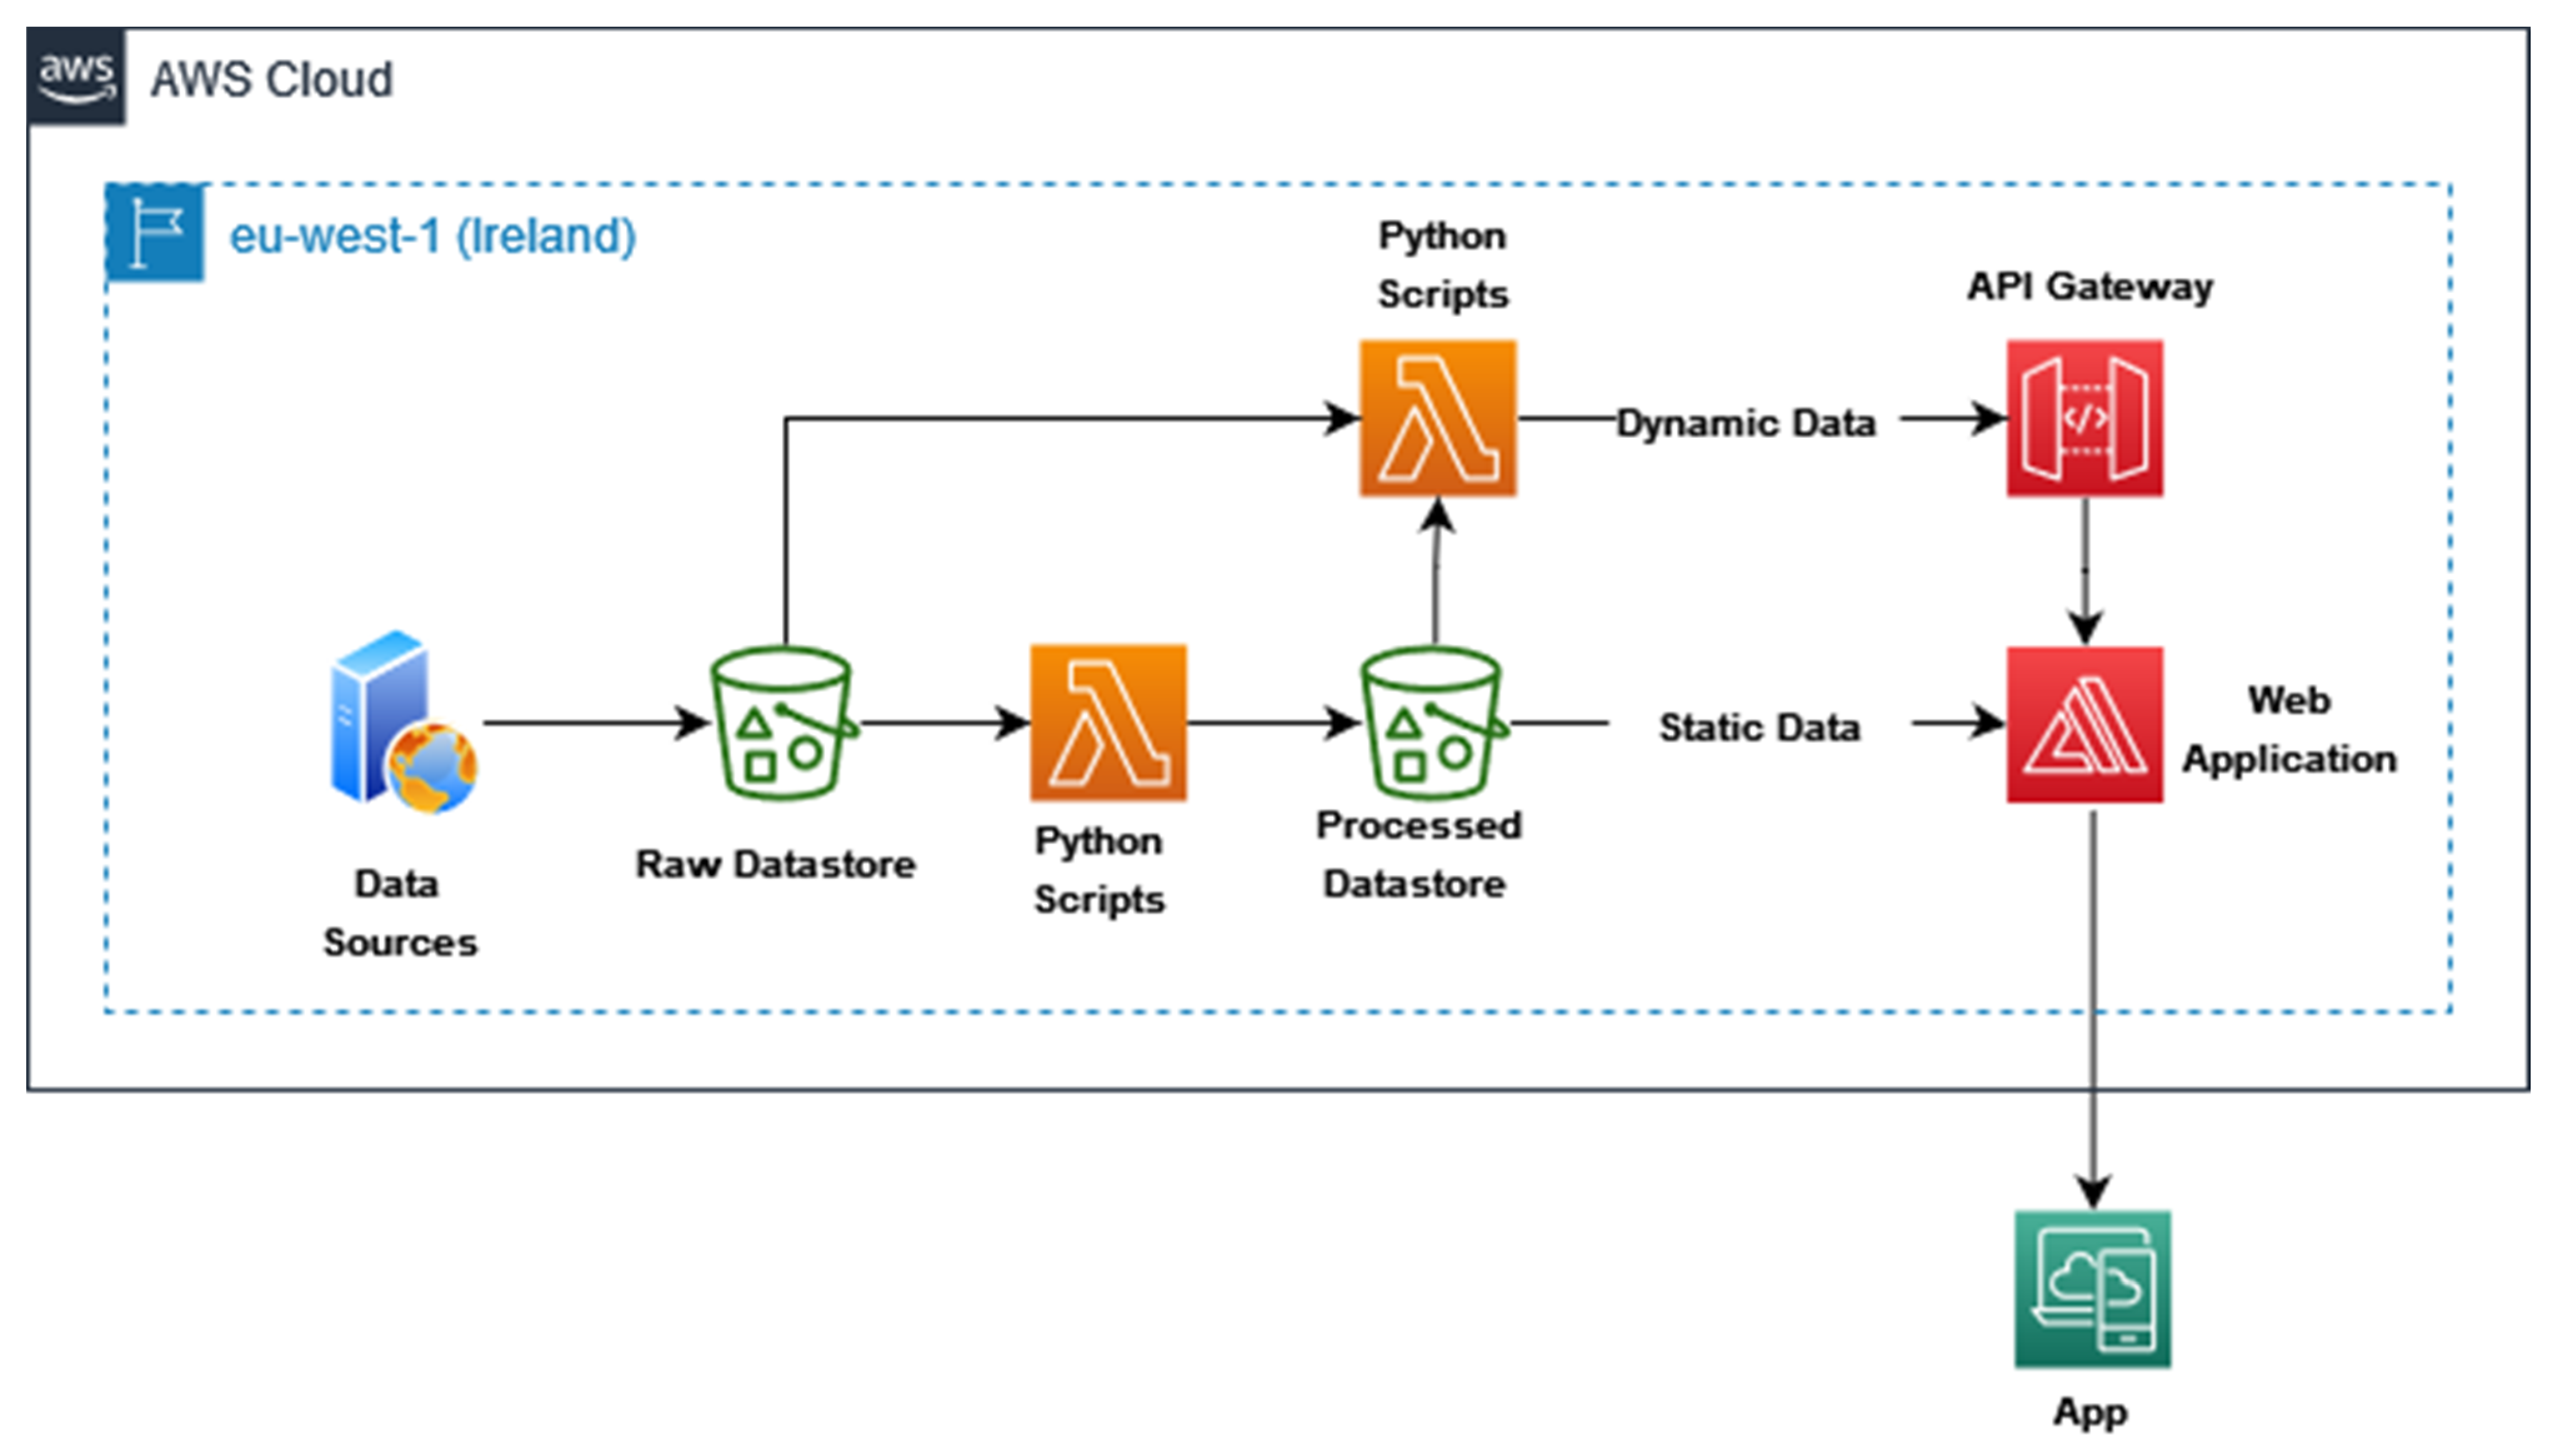
Disclaimer/Publisher’s Note: The statements, opinions and data contained in all publications are solely those of the individual author(s) and contributor(s) and not of MDPI and/or the editor(s). MDPI and/or the editor(s) disclaim responsibility for any injury to people or property resulting from any ideas, methods, instructions or products referred to in the content. |
© 2025 by the authors. Licensee MDPI, Basel, Switzerland. This article is an open access article distributed under the terms and conditions of the Creative Commons Attribution (CC BY) license (https://creativecommons.org/licenses/by/4.0/).