Article

SwinNowcast: A Swin Transformer-Based Model for Radar-Based Precipitation Nowcasting

1
School of Electronics and Information Engineering, Nanjing University of Information Science and Technology, Nanjing 210044, China
2
School of Artificial Intelligence, Nanjing University of Information Science and Technology, Nanjing 210044, China
*
Author to whom correspondence should be addressed.
Remote Sens. 2025, 17(9), 1550; https://doi.org/10.3390/rs17091550
Submission received: 19 March 2025 / Revised: 18 April 2025 / Accepted: 26 April 2025 / Published: 27 April 2025

Abstract

:
Precipitation nowcasting is pivotal in monitoring extreme weather events and issuing early warnings for meteorological disasters. However, the inherent complexity of precipitation systems, coupled with their nonlinear spatiotemporal evolution, poses significant challenges for traditional numerical weather prediction methods in capturing multi-scale details effectively. Existing deep learning models similarly struggle to simultaneously capture local multi-scale features and global long-term spatiotemporal dependencies. To tackle this challenge, we propose SwinNowcast, a deep learning model based on the Swin Transformer architecture. Through the novel design of a multi-scale feature balancing module (M-FBM), the model dynamically integrates local-scale features with global spatiotemporal dependencies. Specifically, the multi-scale convolutional block attention module (MSCBAM) captures local multi-scale features, while the gated attention feature fusion unit (GAFFU) adaptively regulates the fusion intensity, thereby enhancing spatial structure and temporal continuity in a synergistic manner. Experiments were performed on the precipitation dataset from the Royal Netherlands Meteorological Institute (KNMI) under thresholds of 0.5 mm, 5 mm, and 10 mm. The results indicate that SwinNowcast surpasses six state-of-the-art approaches regarding the critical success index (CSI) and the Heidke skill score (HSS), while markedly reducing the false alarm rate (FAR). The proposed model holds substantial practical value in applications such as short-term heavy rainfall monitoring and urban flood early warning, offering effective technological support for meteorological disaster mitigation.

1. Introduction

Rainfall forecasting is of substantial research significance and practical relevance in the fields of meteorology and hydrology. As a fundamental component of disaster prevention and mitigation frameworks, accurate rainfall forecasting not only supports decision-making in agricultural irrigation scheduling, urban flood management, and water resources operations, but it also constitutes the scientific basis for developing flood early warning systems and emergency response strategies [1]. The prevailing forecasting methodology, numerical weather prediction (NWP) [2], formulates atmospheric dynamic equations and assimilates multi-source observational data, exhibiting notable advantages in weather prediction across time scales spanning several hours to multiple days. However, the application of NWP in short-term heavy rainfall prediction (0–2 h, referred to as precipitation nowcasting [3]) is hindered by two major challenges: first, the intricate spatial heterogeneity and pronounced temporal non-stationarity considerably exacerbate the complexity of traditional model development; second, the substantial computational expense and extended iteration cycle of NWP impede its ability to fulfill the real-time requirements of nowcasting [4]. With the exponential growth of meteorological observational datasets and transformative advancements in GPU-driven parallel computing, deep learning (DL)-based data-driven methodologies have opened new avenues for improving the accuracy of short-term heavy rainfall forecasting by uncovering the spatiotemporal evolution patterns within historical meteorological records [5].
In recent years, deep learning models, particularly those based on convolutional neural networks (CNNs) and recurrent neural networks (RNNs), have exhibited remarkable capability in capturing the spatiotemporal evolution of precipitation systems by leveraging end-to-end learning to establish nonlinear mappings between historical radar echo sequences and meteorological fields [6,7,8]. Unlike traditional numerical weather prediction methods, which depend on parameterized physical equations, these data-driven models leverage self-supervised learning to extract latent physical correlations from vast historical observational datasets—including Doppler radar reflectivity, wind field profiles, and satellite cloud imagery—thereby enabling probabilistic forecasting of future precipitation fields. Shi et al. [9] introduced a convolutional recurrent neural network-based approach, ConvLSTM, which harnesses the long short-term memory (LSTM) mechanism to effectively capture both the motion dynamics of rainfall and variations in rainfall intensity, thereby surpassing other methodologies in precipitation forecasting. Expanding on this foundation, Wang et al. [10] developed PredRNN, an advanced network integrating a novel spatiotemporal LSTM (ST-LSTM) unit, which not only preserves spatiotemporal information but also facilitates inter-layer interactions among memory states from different LSTM units. PhyDNet [11] explicitly disentangles physical knowledge, specifically partial differential equation (PDE) dynamics, from latent unknown information, incorporating a novel physical unit (PhyCell) to enforce PDE constraints within the latent space. This approach has exhibited exceptional performance in video prediction tasks, particularly in addressing missing data and enhancing long-term forecasting capabilities. Ma et al. [12] employed a spatial local attention memory (SLAM) module to capture spatial dependencies within meteorological data while integrating a temporal difference memory (TDM) module to extract temporal variations. By coupling these mechanisms with PredRNN, the model effectively enhances the spatiotemporal dependencies of radar observations.
Although sequence modeling approaches, particularly recurrent neural networks (RNNs), have shown promise in meteorological time-series analysis, their inherent limitations continue to hinder practical applicability. Specifically, RNN-based models are prone to vanishing and exploding gradient issues when training deep networks [13], a phenomenon that is particularly pronounced when capturing the nonlinear dynamical evolution of hourly scale precipitation systems, thereby limiting their ability to effectively learn long-term temporal dependencies. Recently, the UNet architecture [14] has been widely adopted in precipitation forecasting tasks, demonstrating strong predictive performance. To further optimize this architecture, SmaAt-UNet [15] incorporates the convolutional block attention module (CBAM) [16] and depthwise separable convolution (DSC), effectively maintaining the performance of precipitation nowcasting while reducing model parameters and computational resource consumption. More importantly, SmaAt-UNet mitigates the gradient explosion issue commonly observed in traditional deep networks, thereby enhancing training stability and overall effectiveness. However, it is important to note that the UNet architecture was not originally designed for time-series forecasting tasks, and as a result, certain variants exhibit limitations in predictive accuracy when applied to such problems [13,14,17,18,19].
To overcome these bottlenecks, researchers have begun exploring Transformer-based alternatives [20], which effectively alleviate gradient degradation through the synergistic design of residual connections and layer normalization, while leveraging the global interaction capability of self-attention [21] to model cross-spatiotemporal feature associations in meteorological fields. Bai et al. [22] introduced Rainformer, a precipitation nowcasting model that integrates Swin Transformer [23] and CNN. By utilizing fully convolutional networks (FCNs), Rainformer effectively reduces the risk of gradient explosion and enhances the accuracy of high-intensity rainfall forecasting. Earthformer [24], leveraging the innovative cuboid attention mechanism and global vector design, not only addresses computational efficiency challenges but also enhances spatiotemporal modeling capabilities, demonstrating significant potential in Earth system forecasting. Wang et al. [25] proposed a hierarchical architecture named STPF-Net, based on recurrent neural networks, aiming to address the limitations of traditional NWP models in terms of computational efficiency and prediction accuracy for short-term precipitation. This model introduces a layered temporal encoding strategy—comprising high and low temporal resolution modules—to mitigate error accumulation in long-term forecasting. In addition, it incorporates Swin Transformer modules to capture large-scale spatial contextual information. Bojesomo et al. [26] introduced a Video Swin Transformer (VST) model based on shifted window cross-attention. Employing an encoder–decoder architecture, the model progressively integrates multi-scale spatiotemporal features, enabling the efficient modeling of 8 h weather forecasts. Compared to conventional models, it achieves significantly improved parameter efficiency. Xiong et al. [27] developed a Spatiotemporal Feature Fusion Transformer (STFFT) for precipitation nowcasting. By leveraging a multi-head squared self-attention mechanism (MHSFFA) and a cross-feature feed-forward network (CAFFFN), the model enables dynamic interaction modeling of radar echo sequences. Liu et al. [28] innovatively integrated the Swin Transformer with the UNet architecture to develop a post-processing framework for numerical weather prediction (NWP). By fusing fundamental meteorological variables such as temperature and humidity with satellite-based precipitation observations, their approach significantly enhanced the prediction accuracy of severe convective precipitation events. Ji et al. [29] designed the EDH-STNet model, marking the first application of the Swin-UNet architecture to spatiotemporal forecasting tasks in extreme drought and hydrology (EDH). This encoder–decoder-based framework integrates multi-source hydro-meteorological parameters—such as sea surface temperature, latent heat flux, and wave height—while utilizing the Swin Transformer’s window-based self-attention mechanism to capture global spatial dependencies and temporal evolution features. Piran et al. [30] proposed a precipitation forecasting method based on generative Transformer models using composite radar data from multiple meteorological radars in South Korea. Their model effectively predicts future precipitation patterns and helps reduce the risk of catastrophic weather events caused by heavy rainfall. Collectively, these studies demonstrate that Transformer-based architectures, through their global attention mechanisms and advanced feature fusion strategies, are overcoming the limitations of traditional numerical methods and CNN/RNN models in modeling extreme weather events.
Against this backdrop, we propose a novel precipitation nowcasting model, SwinNowcast, designed for high-resolution gridded precipitation forecasting within a 30 min lead time. The input to our model consists of precipitation maps, which are radar images representing accumulated rainfall over a specific period. SwinNowcast is primarily constructed using the multi-scale feature balancing module (M-FBM), which comprises a local multi-scale feature extraction unit, a global feature extraction unit, and a gated attention feature fusion unit (GAFFU). The local multi-scale feature extraction unit focuses on capturing localized features of small- to moderate-intensity precipitation events. The global feature extraction unit, implemented as a Swin Transformer, employs a window-based multi-head self-attention (W-MSA) mechanism to effectively capture global dependencies in precipitation data. Due to the significant numerical discrepancy between global and local features, balancing these two types of features remains a critical challenge in precipitation forecasting. In response to this challenge, we designed GAFFU. GAFFU employs a gating mechanism that generates two forget matrices to independently regulate the contributions of local and global features, thereby achieving balanced feature fusion. Specifically, GAFFU leverages a gating mechanism to perform weighted fusion of local and global features, mitigating numerical discrepancies between them and enabling the model to more stably process multi-scale feature representations. This adaptive weighted fusion strategy across different feature levels has been widely recognized in various research domains. Yang et al. [31] introduced the adaptive feature pyramid network (AFPN), which incorporates an adaptive spatial fusion module to effectively address the feature imbalance issue in traditional feature pyramid networks (FPNs) during multi-level feature fusion, thereby enhancing feature aggregation capability and overall model performance. Furthermore, the gating mechanism in GAFFU prevents the gradient explosion issue commonly observed in traditional methods due to excessive emphasis on a particular feature type, thereby ensuring training stability.
The primary contributions of this study are summarized as follows:
  • We propose a novel precipitation nowcasting model, SwinNowcast, which independently extracts global and local features from precipitation data and effectively fuses them, thereby enhancing the model’s predictive capability across precipitation events of varying intensities;
  • We integrate multi-scale feature extraction units with global feature extraction units to enhance the model’s ability to perceive precipitation events at different scales. This integration enables the model to simultaneously extract critical features across multiple scales, thereby capturing spatiotemporal dependencies in precipitation data more comprehensively;
  • We propose a novel gated attention feature fusion unit (GAFFU), which addresses the imbalance between global and local features through a gating mechanism. GAFFU effectively integrates complementary information from different scales, thereby improving the effectiveness of feature representation.
  • The proposed SwinNowcast demonstrates significant performance improvements over six state-of-the-art (SOTA) models on publicly available precipitation datasets.

2. Methods

Similar to previous studies, we formulate the precipitation nowcasting task as a spatiotemporal sequence-to-sequence prediction problem. The input data X consists of 12 consecutive precipitation maps ( x i R 288 × 288 ), which are derived from radar reflectivity images. The prediction target Y ^ comprises six subsequent precipitation maps to be forecasted ( y i ^ R 288 × 288 ). Specifically, X = { x 1 , x 2 , , x 12 } represents the historical observational data, while Y ^ = { y ^ 1 , y ^ 2 , , y ^ 6 } denotes the future precipitation sequence to be predicted. The spatial dimensions of both input and output sequences remain consistent at 288 × 288 pixels. Our deep neural network adopts an encoder–decoder architecture with a hybrid attention mechanism to process the 12-frame input sequence and generate a 6-frame precipitation forecast. This setup performs 30 min nowcasting over six future time steps based on the preceding 60 min of observational data. The overall forecasting process can be expressed as
Y = a ( X ) ,
where a represents the SwinNowcast.

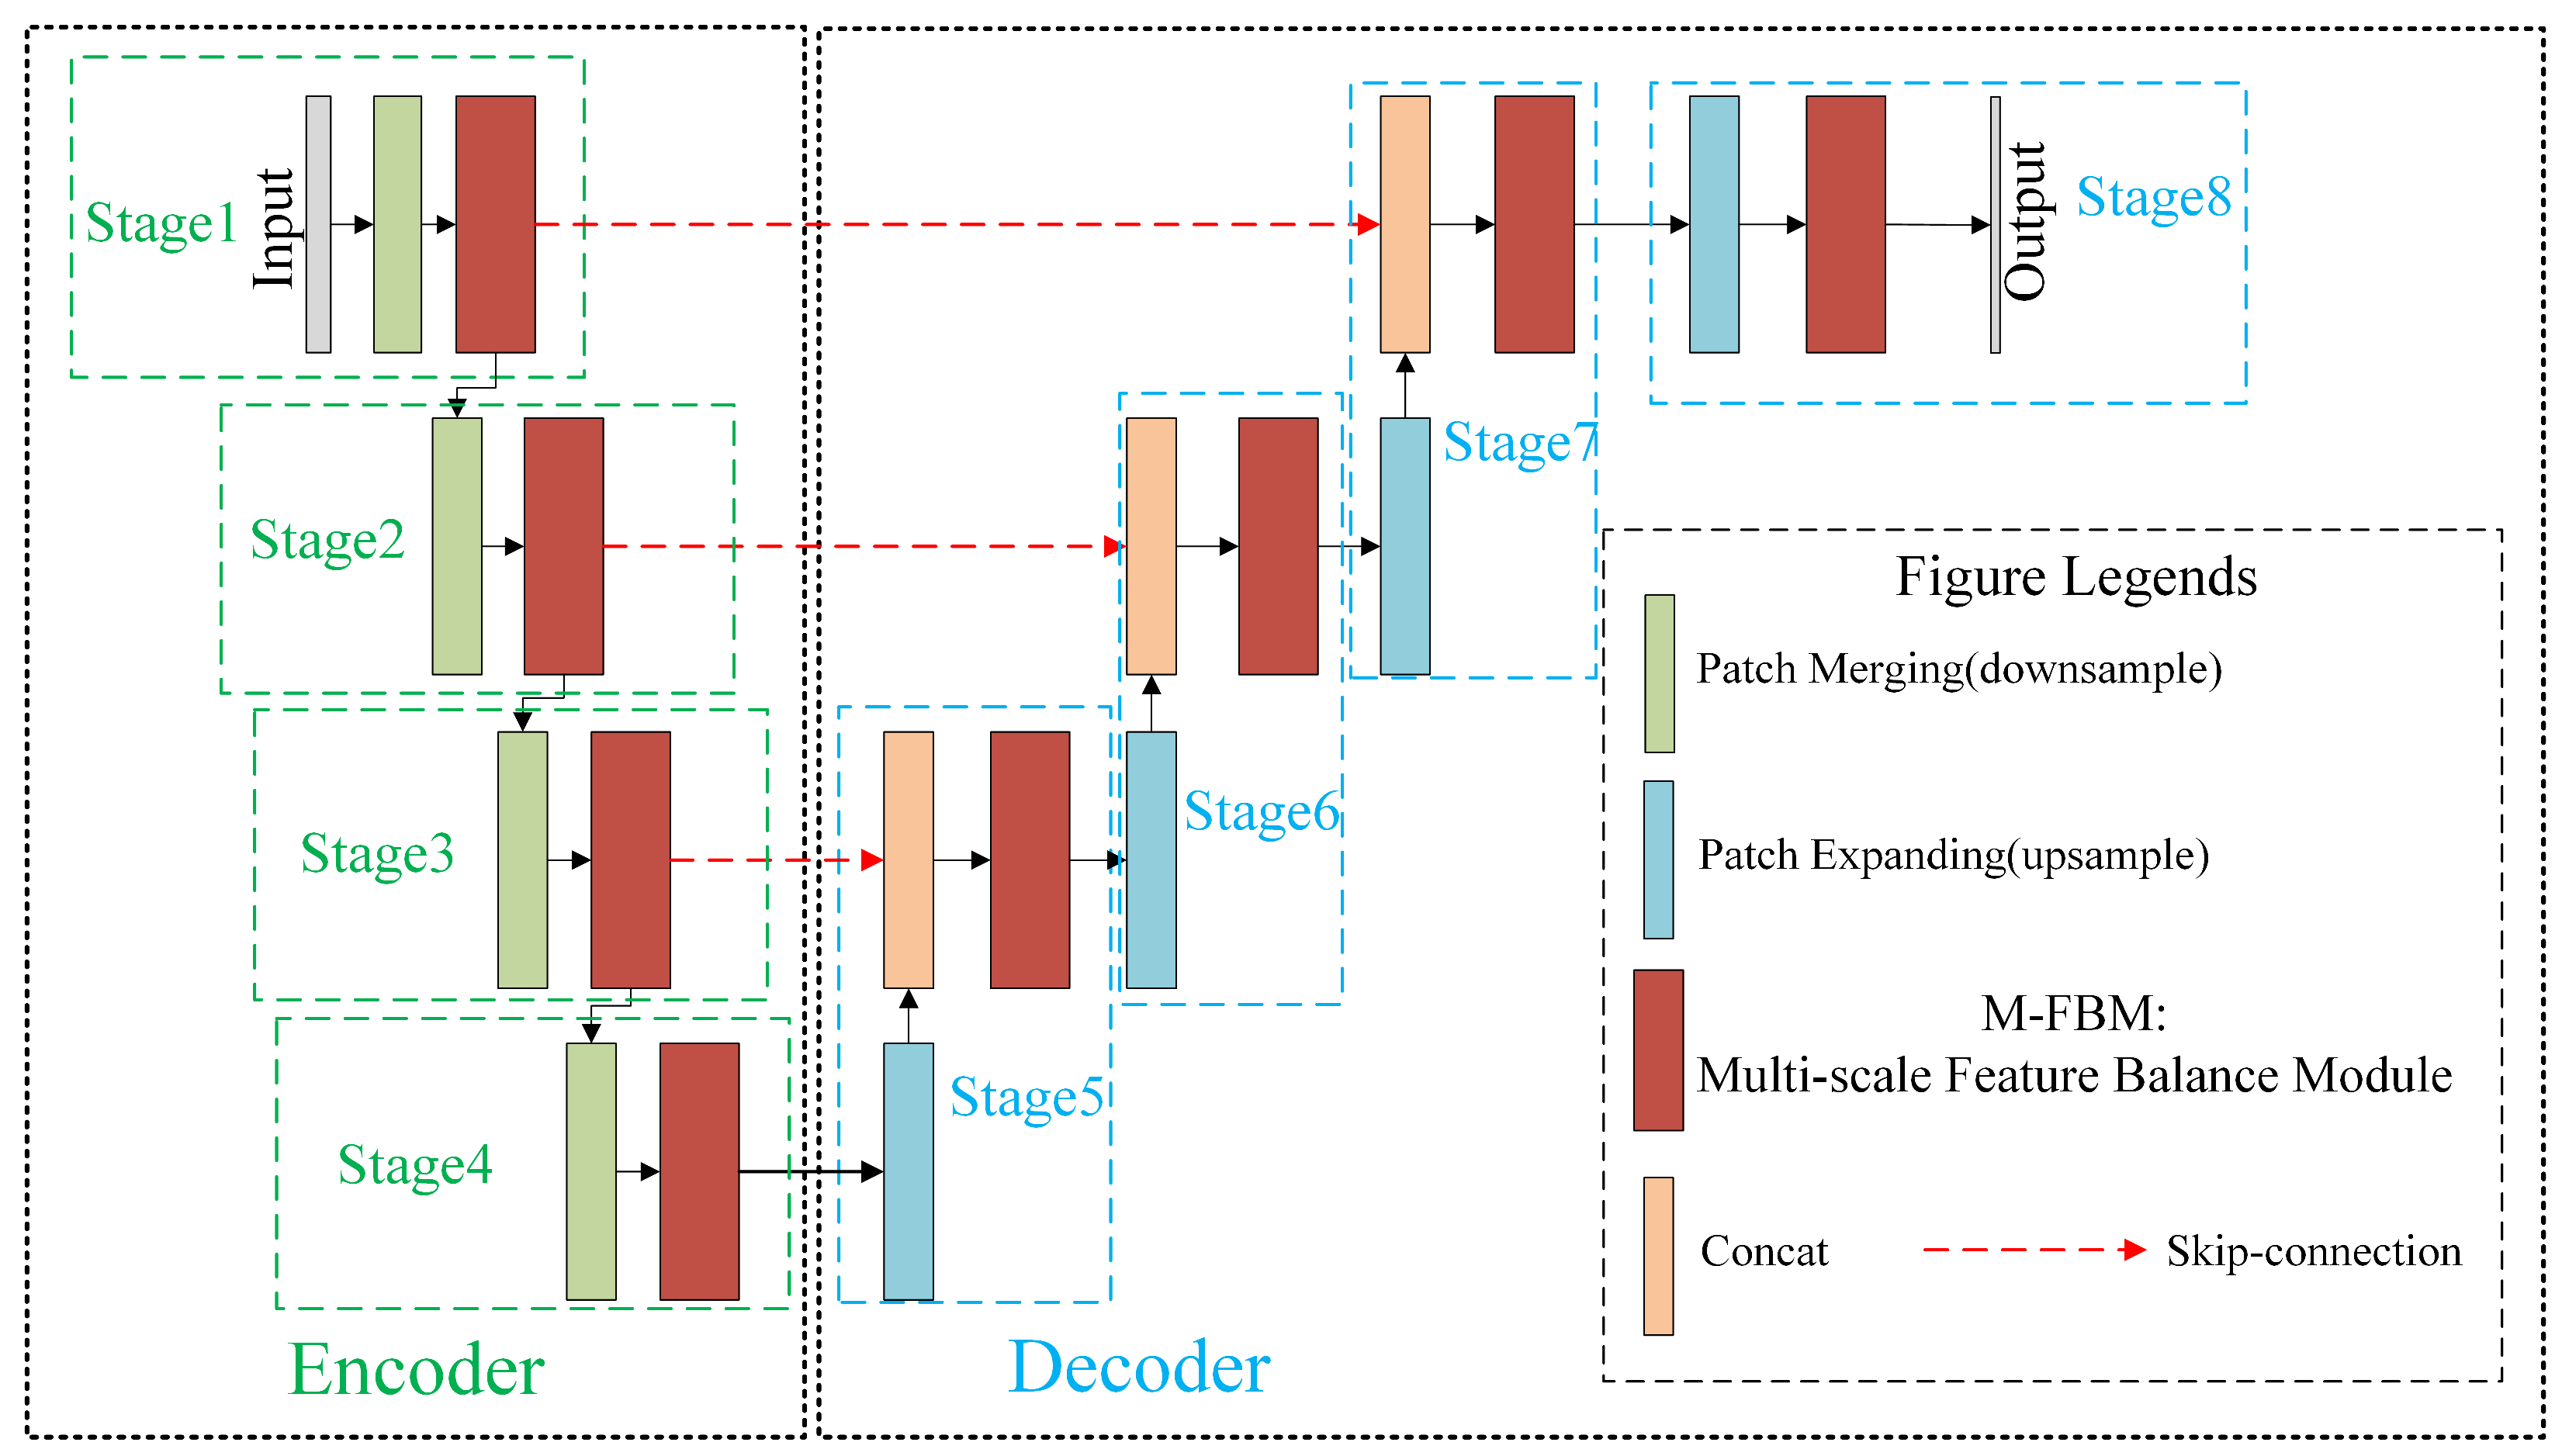
2.1. Overall Architecture Design

The proposed SwinNowcast is a hybrid architecture model designed for precipitation nowcasting, specifically addressing the spatiotemporal prediction problem based on precipitation map sequences. The model takes as input 12 consecutive frames of historical precipitation intensity maps ( x i ), and outputs 6 future frames of predicted precipitation ( y i ^ ). SwinNowcast employs an encoder–decoder architecture (as illustrated in Figure 1), integrating global context modeling with local precipitation intensity feature extraction to achieve high-precision nowcasting. Similarly, Tuyen et al. [32] incorporated UNet structures when developing RainPredRNN, leveraging UNet’s ability to effectively extract high-level features from original images while compressing input dimensions.
The encoder consists of four downsampling stages (Stage 1–Stage 4), where patch merging is employed to progressively reduce spatial resolution while abstracting semantic features. Patch merging serves as the downsampling operation, which, given an input feature map F i n R H × W × C , is performed through local window partitioning and linear projection, as follows:
F o u t = L i n e a r ( r e s h a p e ( F i n ) ) ,
The input features are divided into non-overlapping 2 × 2 local windows. Within each window, the four C-dimensional feature vectors are concatenated into a 4 C -dimensional vector, which is then projected through a linear layer to a reduced channel dimension of 2 C . This design follows the standard Swin Transformer architecture and aims to retain rich feature representations after spatial downsampling. As a result, the output feature map resolution is reduced to H 2 × W 2 × 2 C . This strategy optimizes window partitioning for precipitation maps, ensuring the continuity of rainbands and mitigating structural fragmentation.
Both the encoder and decoder incorporate the multi-scale feature balancing module (M-FBM), the details of which will be elaborated in the next section. Let λ represent the M-FBM operation; then, the encoder process can be formally expressed as follows:
Y e n 1 = λ ( P M ( X ) ) ,
Y e n i = λ ( P M ( Y e n i 1 ) ) , i { 2 , 3 , 4 } ,
Here, Y e n 1 and Y e n i denote the features output from the M-FBM, while X represents the input precipitation sequence. PM refers to patch merging, and i indicates the stage index.
The decoder progressively restores spatial resolution through four upsampling stages (Stage 5–Stage 8). At each stage, skip connections integrate multi-scale features from the encoder, a design inspired by UNet’s skip connections. Patch expanding serves as the upsampling operation, where, given an input feature map F i n R H × W × C , the upsampling process is performed by combining pixel rearrangement and linear projection, as follows:
F o u t = L i n e a r ( P i x e l S h u f f l e ( F i n ) ) ,
Here, PixelShuffle rearranges the channel dimension C into 4 × C 4 and achieves 2× upsampling through spatial reordering. Compared to conventional transposed convolution, this approach reduces checkerboard artifacts by 67% [33], making it more suitable for preserving the smooth intensity distribution of precipitation maps.
In the decoder, the entire process can be formally expressed as follows:
Y d e 4 = λ ( c a t ( Y e n 3 , P E ( Y e n 4 ) ) ) ,
Y d e i = λ ( c a t ( Y e n i 1 , P E ( Y d e i + 1 ) ) ) , i { 2 , 3 } ,
Y d e 1 = λ ( P E ( Y d e 2 ) ) ,
Here, Y d e 4 , Y d e i , and Y d e 1 represent the output features at each stage of the decoder, while PE denotes patch expanding.

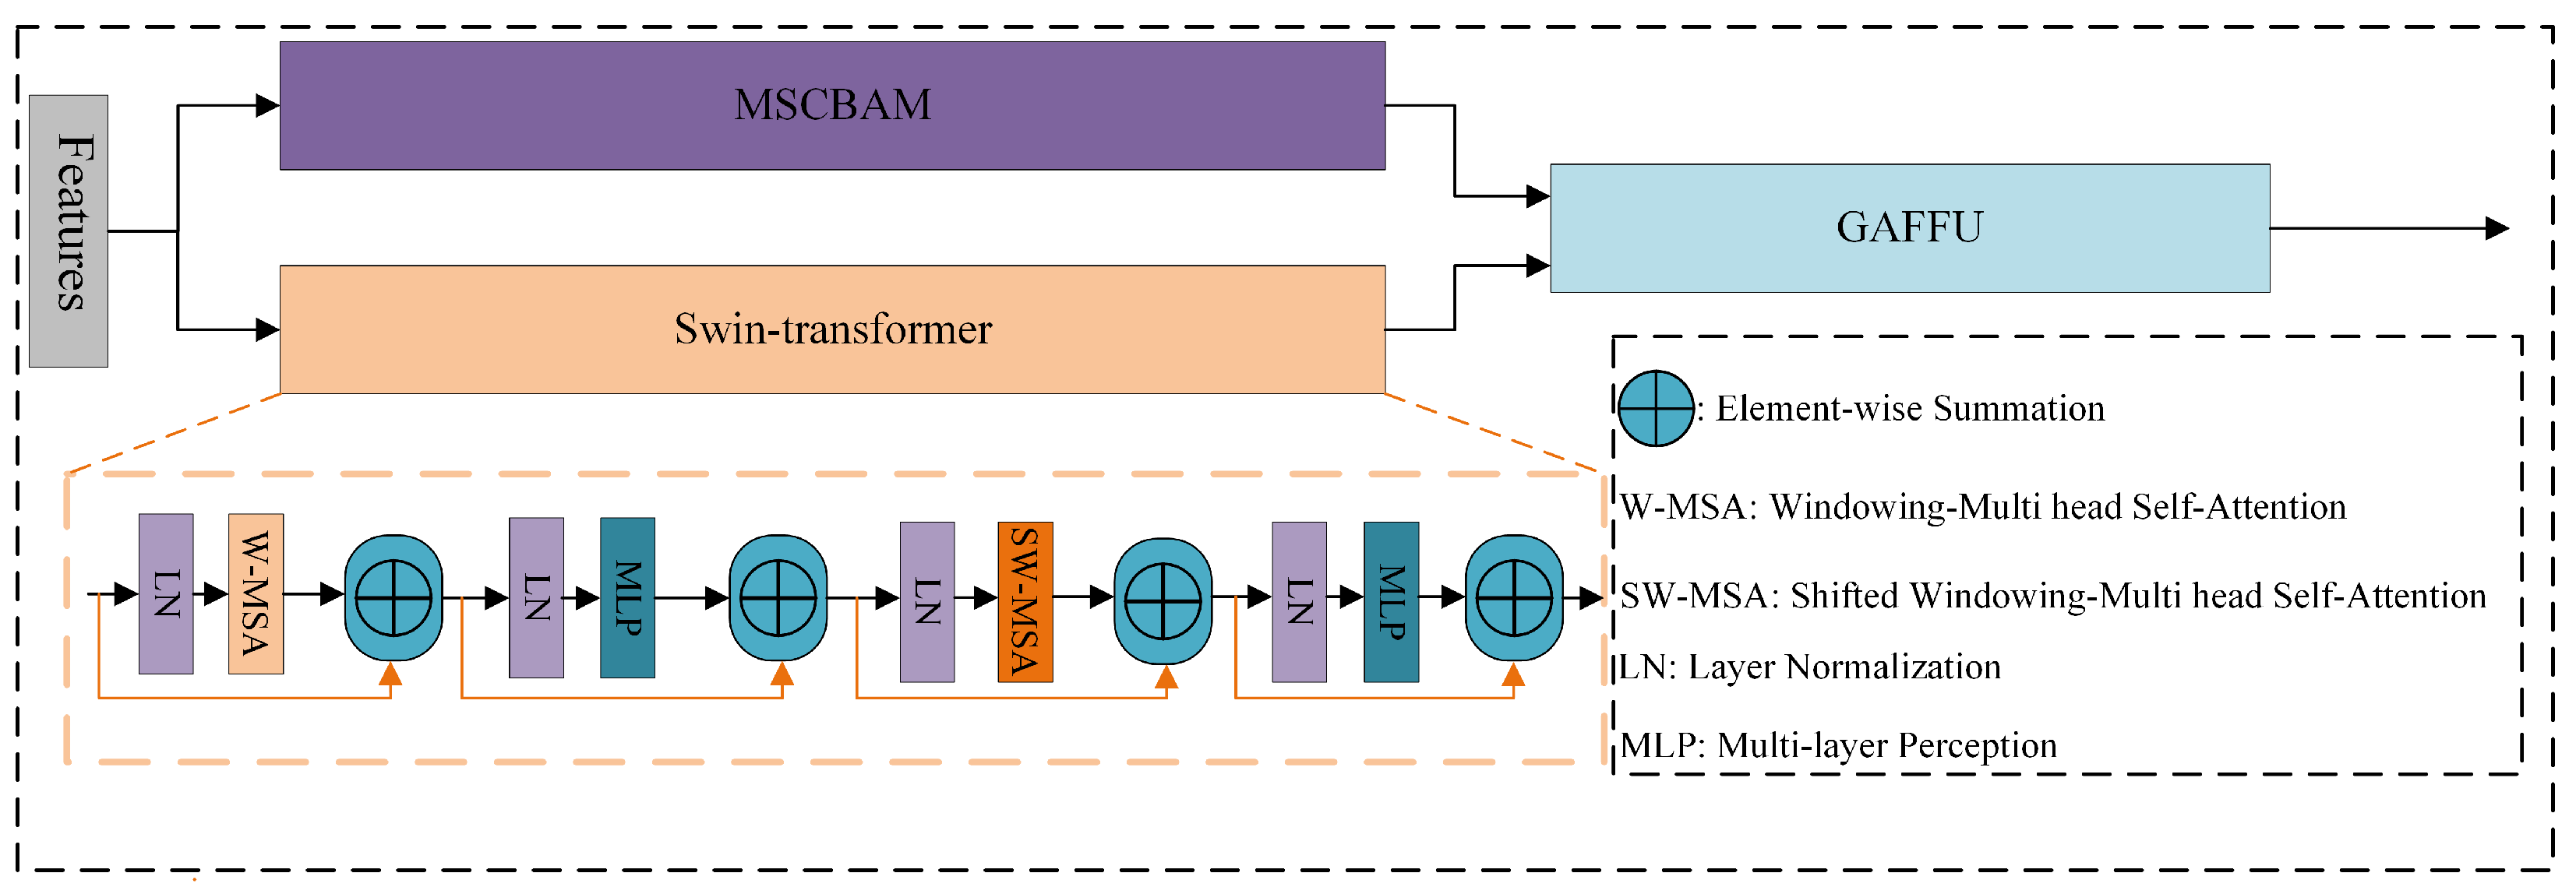
2.2. Multi-Scale Feature Balancing Module (M-FBM)

The multi-scale feature balancing module (M-FBM) serves as the core component of the model, with its structure illustrated in Figure 2. This module integrates parallel local multi-scale feature extraction (MSCBAM) and global context modeling (Swin Transformer) combined with a gated attention feature fusion unit (GAFFU) to achieve multi-granularity modeling of the spatiotemporal evolution patterns in precipitation maps.
As the global feature extraction unit, the Swin Transformer models the spatiotemporal evolution patterns of precipitation systems through the shifted window-based multi-head self-attention (SW-MSA) mechanism. Given an input feature F i n R H × W × C , it is partitioned into non-overlapping M × M windows (default M = 9 ). Within each window, the features undergo linear projection to generate the query (Q), key (K), and value (V) vectors, as follows:
Q , K , V = L i n e a r ( F i n ) ,
Within each window, the self-attention mechanism is applied to compute pixel-wise dependencies, which are formulated as follows:
A t t e n t i o n ( Q , K , V ) = S o f t max ( Q K T d k + B ) V ,
Here, B represents the learnable relative position bias, and d k denotes the dimension of the key vector. Compared to the global attention mechanism in traditional Transformers, the window-based design reduces computational complexity from O ( H 2 W 2 ) to O ( H W M 2 ) (where M = 9 ), enabling the model to efficiently process high-resolution 288 × 288 precipitation maps.
In adjacent levels, the window positions are shifted diagonally by M / 2 pixels, enabling cross-region information exchange through overlapping windows. This mechanism effectively captures large-scale meteorological patterns, such as rainband propagation and convective system merging. The global context features extracted by the Swin Transformer and the local multi-scale features captured by MSCBAM (e.g., high-intensity precipitation cores) are dynamically fused via the GAFFU module. Specifically, the global features output from the Swin Transformer, denoted as F global R H × W × C , are fused with the local features from MSCBAM ( F local ) through a gated weighting module. During the fusion process, adaptive modulation is performed on both types of features, enabling the model to jointly capture large-scale meteorological patterns and fine-grained precipitation details.

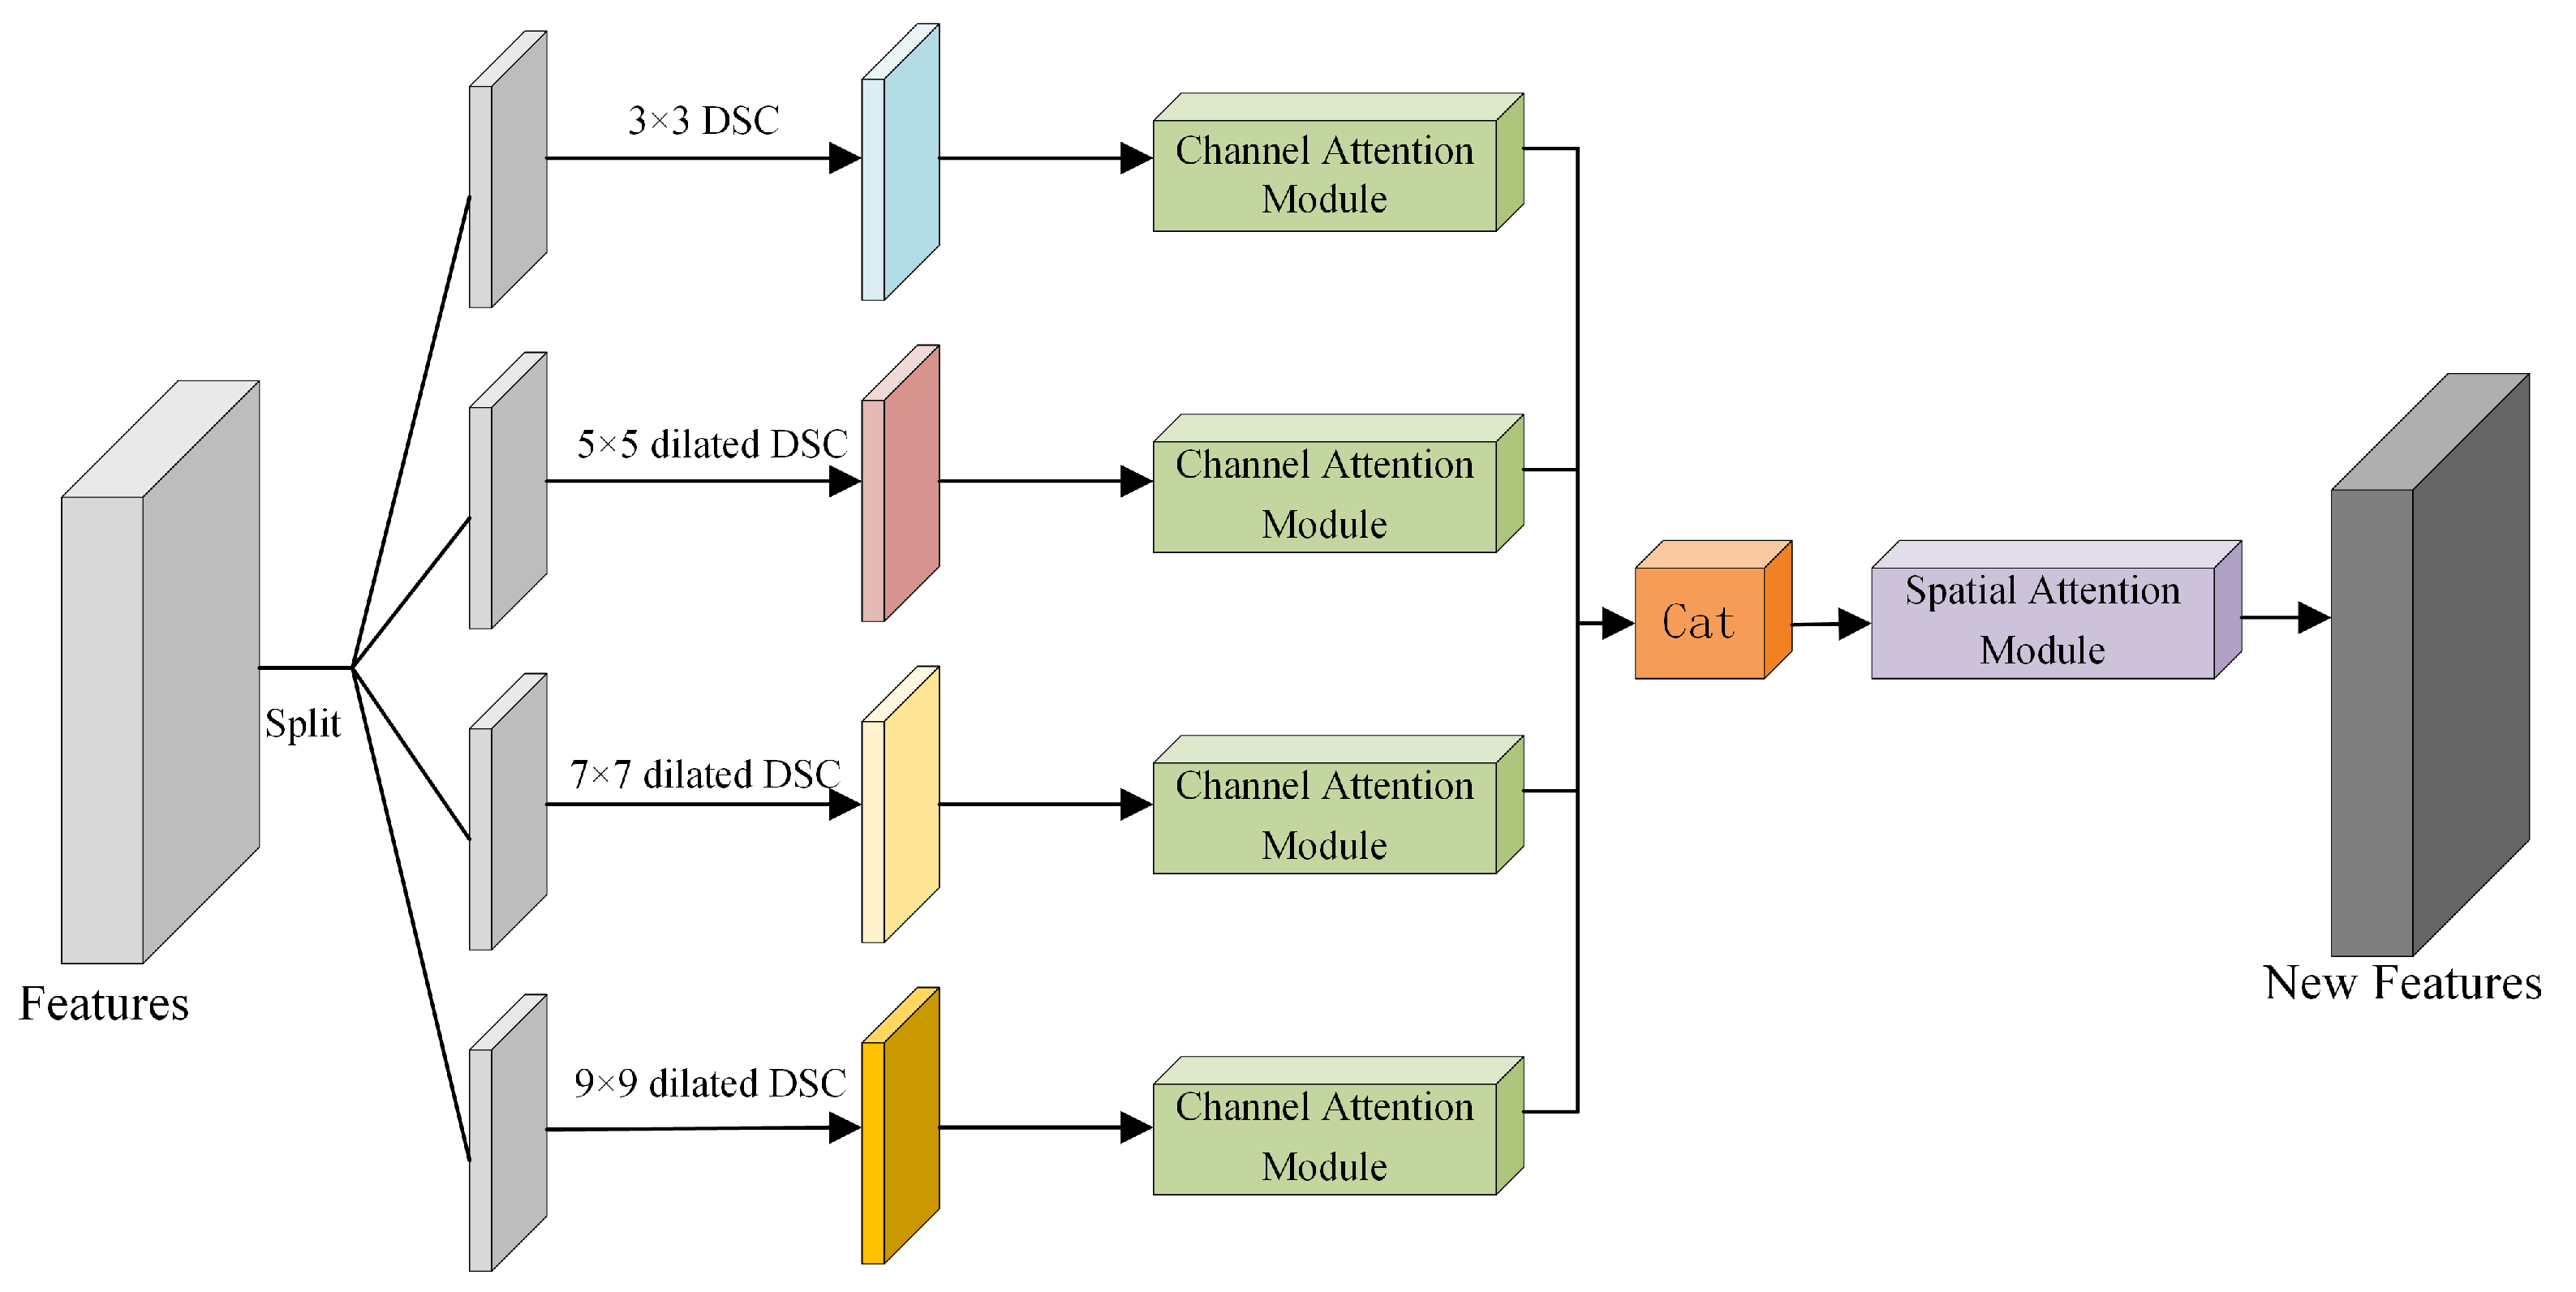
2.2.1. Multi-Scale Convolutional Block Attention Module (MSCBAM)

The MSCBAM is primarily based on convolutional neural networks (CNNs), which have been widely recognized in previous studies as efficient methods for processing image data. The core advantage of CNNs lies in their convolutional kernel operations, which enable sliding across the image, making them more effective than other feed-forward approaches in extracting local invariant features [34]. Given the effectiveness of CNNs in handling image-based tasks, they present a promising solution for precipitation nowcasting. In this study, we introduce the MSCBAM to enhance the multi-scale modeling capability for precipitation images. As illustrated in Figure 3, this module integrates depth-wise convolution, multi-scale attention mechanisms, channel attention, and spatial attention to effectively capture precipitation patterns across different scales, thereby improving the model’s representation capability.
In this process, 1 × 1 convolutions are first applied to perform channel transformation, adjusting feature dimensions and enhancing inter-channel information interaction. Subsequently, depth-wise convolution is employed for local feature extraction. Compared to standard convolution, this approach significantly reduces computational complexity while preserving rich spatial structural information, thereby improving the modeling capability of local patterns. A similar strategy has been adopted by Vatamány et al. [35] in their proposed graph dual-stream convolutional attention fusion (GD-CAF) model, which leverages depth-wise convolution to maintain computational efficiency while ensuring prediction accuracy in precipitation nowcasting tasks, demonstrating strong performance across multiple experiments. Next, we apply multiple 3 × 3 convolutions with different dilation rates (1, 3, 5, 7) to extract features at multiple scales, enabling the model to capture both local and global precipitation patterns. We then introduce a convolutional block attention module (CBAM) to apply attention weighting to the extracted multi-scale feature maps. These weighted features are element-wise multiplied with the original multi-scale feature maps, resulting in an enhanced feature representation. CBAM dynamically adjusts attention weights via channel attention and spatial attention mechanisms, allowing the model to focus more precisely on key precipitation features, thereby improving feature representation and discriminative capability. This approach not only aggregates relevant information across multiple scales [36,37] but also enhances prediction accuracy while maintaining computational efficiency.
The overall computational process of MSCBAM can be formally expressed as follows:
F M S C B A M ( X ) = F S A ( F C A ( F m s ( F c o n ν ( X ) ) ) ) ,
Here, F c o n v ( X ) represents the local features extracted via Depth-wise convolution, while F m s ( X ) denotes the multi-scale convolution operations, which capture precipitation patterns at different scales. F C A ( X ) and F S A ( X ) correspond to channel attention and spatial attention, respectively, enhancing the representation capability of key precipitation features.

2.2.2. Gated Attention Feature Fusion Unit (GAFFU)

The GAFFU module is an innovative deep learning component specifically designed for precipitation nowcasting tasks. As illustrated in Figure 4, GAFFU integrates the dynamic gating mechanism of gated recurrent units (GRUs [38]) with local and global attention, enabling optimal selection and fusion of multi-scale features. By doing so, GAFFU allows the model to simultaneously capture fine-grained convective details and large-scale weather patterns, both of which are critical for accurate precipitation forecasting.
GAFFU is composed of three core components: a gating mechanism (inspired by GRU), local attention, and global attention, which synergistically optimize feature representation. The module receives as input two types of features extracted from parallel network branches: global features from the main branch and local features from the residual branch. Although structurally named as main and residual branches, these two branches are designed to capture complementary spatial information: large-scale patterns and localized details, respectively. GAFFU incorporates an update gate (Z) and a reset gate (R), similar to those in GRU, to dynamically regulate the information flow between these two feature streams. This gating mechanism adaptively integrates new information with prior features, effectively preserving essential signals while filtering out less relevant ones. The local attention submodule captures fine-grained spatial patterns using two successive 1 × 1 convolutional layers, which helps highlight small-scale events such as convective storms. In contrast, the global attention submodule employs global average pooling to extract large-scale environmental context, such as frontal systems and pressure fields. These components operate in a synergistic manner: the gating mechanism first fuses the global and local inputs, which is followed by attention refinement to produce an adaptive attention weight map. This final representation enables the model to emphasize both local details and broader meteorological context.
Define the main branch feature as X and the residual (side) branch feature as Y. GAFFU applies the following operations:
  • Gating computation: X and Y are first concatenated and passed through a convolutional layer to generate a fused tensor. Then, this tensor is partitioned along the channel dimension into two gating factors:
    c a t 1 = C o n ν ( C a t ( X , Y ) ) ,
    Z , R = σ ( c a t 1 ) ,
    Here, σ denotes the Sigmoid activation function, while Z and R correspond to the update gate and reset gate, respectively.
  • Gated fusion: The gating factors are utilized to integrate the main and residual branches:
    x g a t e d = Z X + R Y ,
    Here, ⊗ denotes element-wise multiplication. The computed x g a t e d dynamically integrates the features of both branches at the numerical level, regulating the retention or suppression of new input or residual information based on the values of Z and R.
  • Local and global attention: Local and global attention features are separately computed based on the gated output x g a t e d :
    x l = l o c a l _ a t t ( x g a t e d ) ,
    x g = g l o b a l _ a t t ( x g a t e d ) ,
    Here, x l denotes the output of the local attention submodule, which emphasizes local regions, while x g corresponds to the output of the global attention submodule, encoding the global context.
  • Attention fusion: The outputs of local and global attention are summed and subsequently processed through the Sigmoid activation function to generate the attention weight map:
    w = σ ( x l + x g ) ,
    w takes values within the range [0, 1] and serves as an indicator of feature importance across different spatial locations.
  • Feature reweighting: The gated output features are adaptively weighted according to the attention map:
    o u t = x g a t e d w + x g a t e d ( 1 w ) ,
    Fundamentally, the features in x g a t e d are rescaled by w and its complementary factor 1 w , emphasizing regions identified as crucial by the attention network while maintaining overall structural integrity. Consequently, the final output o u t is a feature map that seamlessly integrates multi-source inputs and is adaptively refined through both local and global attention mechanisms.

3. Data and Experimental Configuration
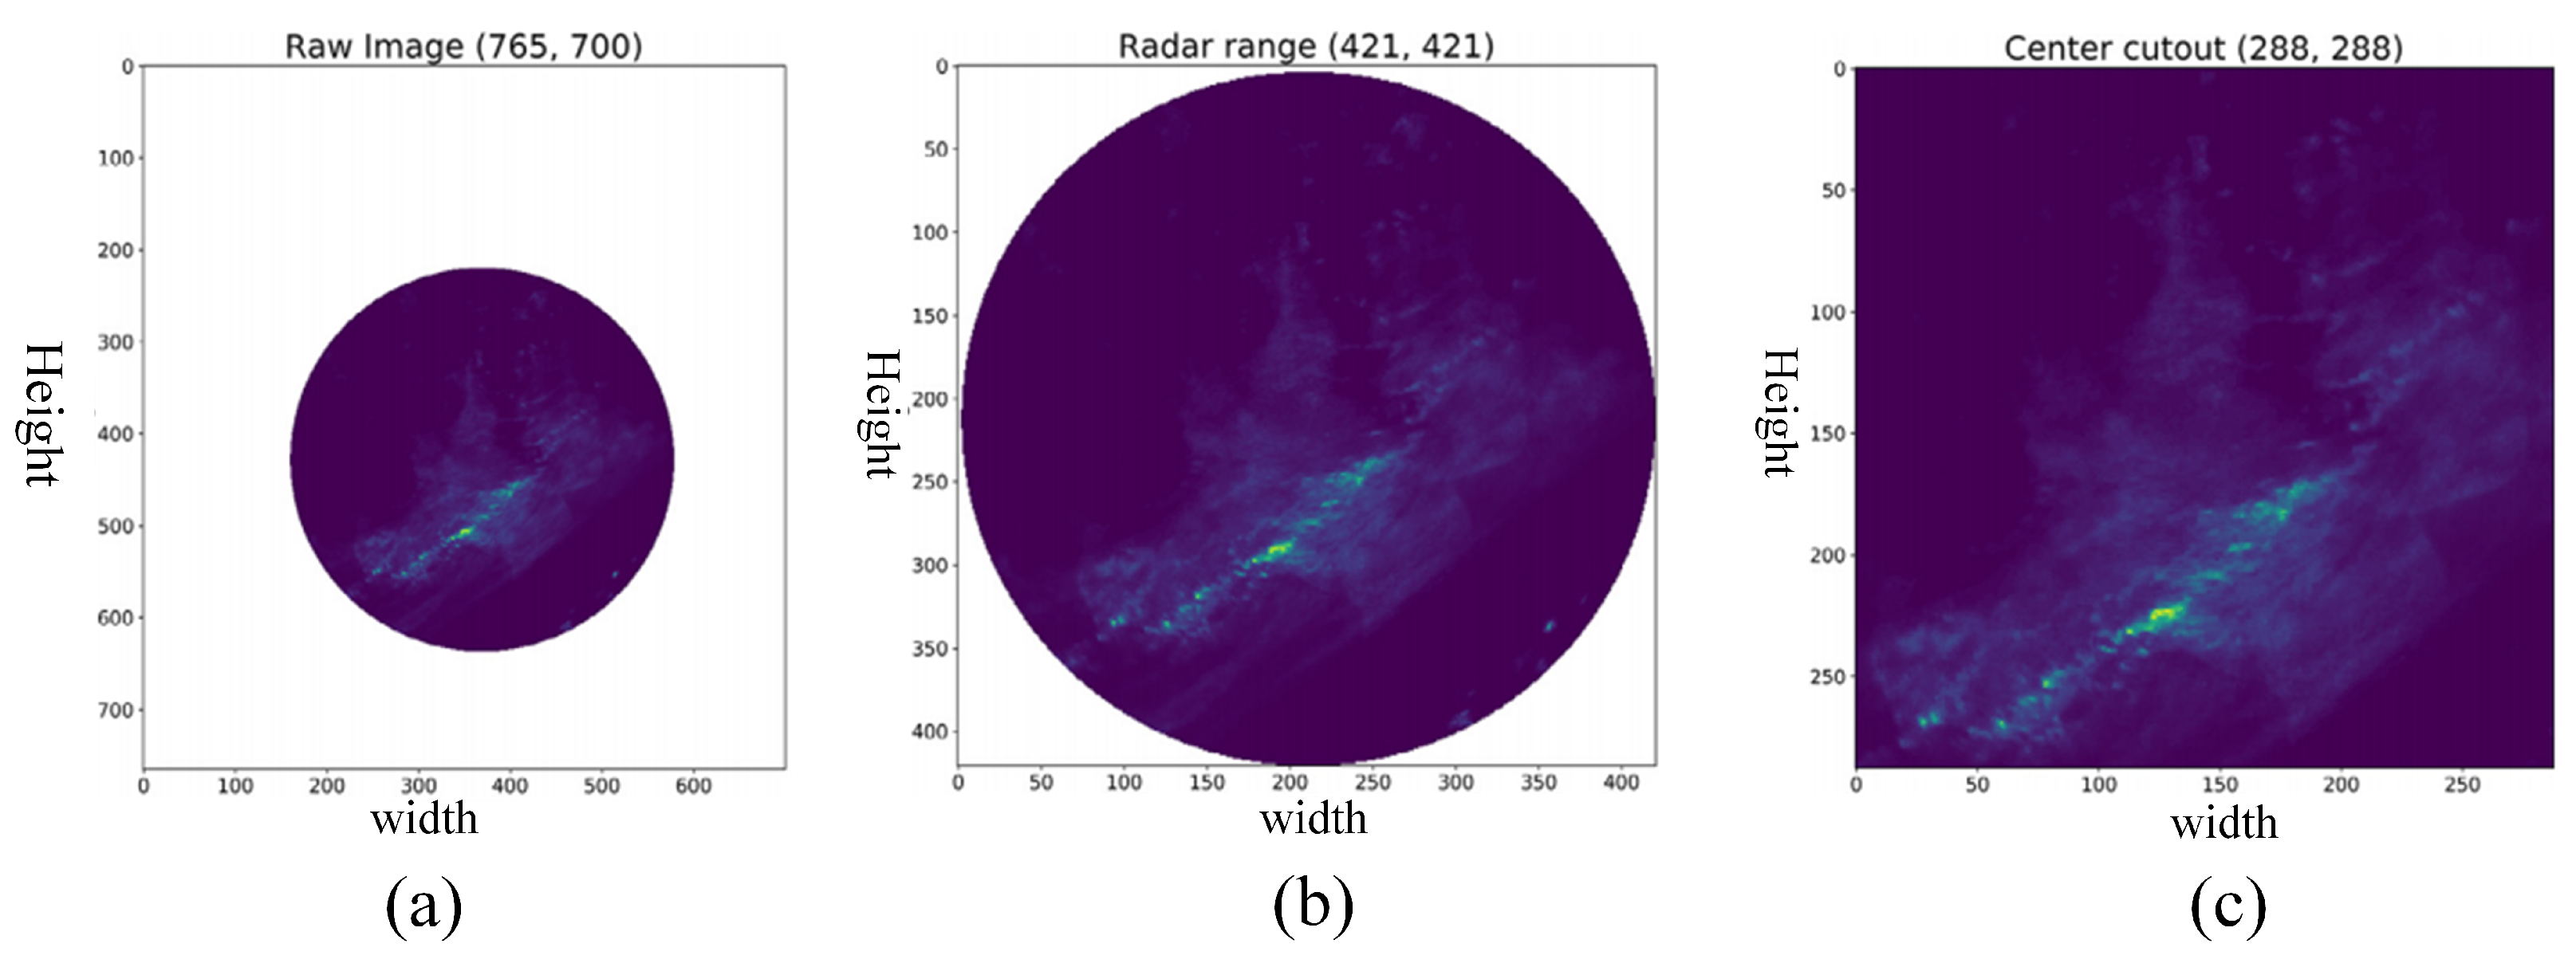
3.1. Dateset

We utilized precipitation observations from the Royal Netherlands Meteorological Institute (Koninklijk Nederlands Meteorologisch Instituut, KNMI) as the dataset for model training and evaluation. This dataset encompasses precipitation distributions recorded at 5 min intervals from 2016 to 2019 across the Netherlands and neighboring regions, comprising approximately 420,000 precipitation maps. The precipitation maps were derived from a collaborative observation system comprising two C-band Doppler radars located at De Bilt (52.10°N, 5.18°E) and Den Helder (52.96°N, 4.79°E), the Netherlands. The system acquired three-dimensional reflectivity data through a quadruple-elevation scanning scheme (0.3°, 1.1°, 2.0°, and 3.0°), which were subsequently reconstructed into 2D reflectivity fields at 800 m altitude using the pseudo-CAPPI algorithm, achieving a spatial resolution of 2.4 km. The data processing workflow included the following: (1) ground clutter and anomalous propagation interference removal using the Wessels–Beekhuis algorithm; (2) conversion of reflectivity to rainfall intensity through the Z = 200 R 1.6 relationship; (3) data quality control implemented via 15 km range truncation and a 200 km maximum coverage limit; (4) dual-radar data synthesis via a quadratic weighting function; and (5) calibration of the final 1–24 h accumulated precipitation estimates against 33 automatic rain gauges [39].
The dataset is partitioned into a training set (2016–2018) and a test set (2019), with 10% of the training samples randomly allocated for validation. Each original precipitation map has a resolution of 765 × 700 pixels, where pixel values indicate the accumulated rainfall over the preceding 5 min in increments of 0.01 mm (e.g., a value of 12 represents 0.12 mm). Normalization is performed by dividing by the maximum rainfall recorded in the training set. As shown in Figure 5, the original image has a resolution of 765 × 700 pixels, but valid radar echoes are only present within a central circular region with a diameter of approximately 421 pixels. To eliminate invalid or no-precipitation areas at the image boundaries, we first extracted the maximum radar coverage region (421 × 421 pixels), followed by a center crop to obtain a 288 × 288 pixel precipitation image for model training. This center-cropped region lies entirely within the effective radar coverage and avoids interference from non-meteorological echoes and invalid pixel values during training. It is worth noting that this cropping operation only changes the spatial dimensions of the images and does not reduce the number of samples in the dataset. To improve the model’s learning efficiency for precipitation events, we adopt the NL-50 subset provided by the original dataset authors [15], which contains samples where precipitation pixels occupy at least 50% of the target image. Given that precipitation coverage in the original dataset is often sparse, this predefined filtering step helps reduce data imbalance and directs the model’s focus toward prominent precipitation events. Model training and evaluation are predominantly conducted on this subset, aligning with the approach in [9], which selected only high-precipitation days for training. This subset comprises 5734 frame sequences for training and 1557 for testing. Each sequence contains 18 frames at a resolution of 288 × 288 pixels, with the first 12 frames serving as model input and the last 6 frames as ground truth (GT) for comparison with model predictions.

3.2. Implementation Details

This study implements model training and evaluation within the PyTorch framework on a workstation equipped with an NVIDIA RTX 4090 GPU (NVIDIA, Santa Clara, CA, USA). The Adam optimizer is adopted as the stochastic gradient descent method, with an initial learning rate of 0.001. An adaptive learning rate scheduling strategy (ReduceLROnPlateau) is employed, wherein the learning rate is reduced to one-tenth of its original value if the validation loss remains unchanged for five consecutive epochs. Training is performed using mini-batch gradient descent with a batch size of 4. The loss function utilized is the balanced mean absolute error (B-MAE), which accounts for the non-uniform distribution of precipitation intensities, ensuring the model achieves robust optimization across different precipitation levels. Throughout training, validation loss is continuously monitored, and the model corresponding to the lowest validation loss is selected as the final predictive model once the loss ceases to decrease. Unlike the conventional MAE, which computes the average error across all pixels, B-MAE incorporates a dynamic weighting scheme based on precipitation intensity, enhancing the model’s ability to learn from precipitation-rich regions. Specifically, for low precipitation (<2 mm), a weight of 1 is assigned to prevent dominance by low-precipitation areas. For moderate precipitation (2–10 mm), weights increase progressively to improve sensitivity to moderate precipitation levels. For heavy precipitation (>30 mm), the weight is substantially elevated to 30, ensuring that extreme precipitation events receive adequate attention. Given that precipitation data are inherently imbalanced—wherein the majority of pixels exhibit minimal or no precipitation—B-MAE assigns adaptive weights to distinct precipitation categories, enabling the model to more accurately capture varying precipitation intensities rather than solely optimizing the overall MAE.
The B-MAE is calculated as follows:
L B M A E = 1 N i = 1 H j = 1 W w i , j · y ^ i , j y i , j ,
Here, y ^ i , j denotes the predicted precipitation at pixel (i,j), y i , j corresponds to the ground truth precipitation, w i , j represents the precipitation intensity weight, and N signifies the total number of pixels.

3.3. Evaluation Metrics

To comprehensively assess the predictive performance of the model, this study utilizes three key evaluation metrics: the critical success index (CSI), the Heidke skill score (HSS), and the false alarm rate (FAR). These metrics respectively measure the model’s accuracy in detecting precipitation events, overall predictive skill, and susceptibility to false alarms.
The critical success index (CSI) is a widely adopted metric in binary classification tasks and is particularly effective in scenarios where positive samples (e.g., meteorological hazard events) are rare. It is defined as the proportion of correctly predicted positive cases (TP) relative to the union of actual positive occurrences (TP + FN) and predicted positive instances (TP + FP), expressed as follows:
C S I = T P T P + F P + F N ,
Here, TP (true positive) denotes the number of correctly predicted positive instances, FP (false positive) indicates the number of negative instances erroneously classified as positive, and FN (false negative) represents the number of missed positive instances. The CSI value falls within the range [0, 1], with values approaching 1 signifying a higher capability of the model in detecting target events. As the CSI disregards the influence of true negatives (TNs), it prioritizes the detection efficiency of positive cases, making it particularly suitable for applications where the cost of missed detections is high, such as disaster early warning systems.
The Heidke skill score (HSS) quantifies the overall classification performance by measuring the improvement in the model’s predictions over random guessing. Its calculation is derived from the confusion matrix and is expressed as follows:
H S S = 2 ( T P · T N F P · F N ) ( T P + F N ) ( F N + T N ) + ( T P + F P ) ( F P + T N ) ,
The Heidke skill score (HSS) spans the range [−1, 1], with a value of 1 indicating a perfect prediction, 0 denoting performance comparable to random guessing, and negative values implying a performance inferior to the random baseline. Unlike the CSI, the HSS considers both positive and negative class distributions, making it well-suited for datasets with class imbalance. In climate prediction, for instance, HSS serves as an effective metric to assess the model’s capability in distinguishing between normal and extreme events.
The false alarm rate (FAR) quantifies the proportion of negative samples incorrectly classified as positive, serving as an indicator of the reliability of the model’s predictions. It is mathematically expressed as follows:
F A R = F P T P + F P ,
The false alarm rate (FAR) falls within the range [0, 1], where lower values indicate fewer false alarms. In resource-limited applications, such as earthquake early warning systems, an elevated FAR can lead to unnecessary emergency responses, necessitating a comprehensive evaluation in conjunction with CSI. For instance, if a model demonstrates a high CSI alongside an elevated FAR, a balance must be struck between event detection accuracy and the cost of false alarms.

4. Experimental Results and Analysis

To assess the effectiveness of the model, we performed a comparative analysis of ground observation data and the outputs of six predictive models from both qualitative visual inspection and quantitative data evaluation perspectives. We conducted a comparative analysis of SwinNowcast against six state-of-the-art methods using the KNMI data subset. Specifically, we independently trained six models (UNet, ConvLSTM, PhyDNet, SmaAt-UNet, PredRNN [40], and Rainformer) and selected the model with the lowest validation loss during training as its “best version”. Subsequently, we employed these best models to compute the previously introduced evaluation metrics on the test set. In the evaluation of precipitation maps, we selected 0.5, 5, and 10 mm/h as representative thresholds. The threshold of 0.5 mm/h is used to assess the model’s ability to capture light rainfall, while 5 and 10 mm/h correspond to moderate and heavy rainfall events. However, it is important to note that high-intensity rainfall events are relatively rare in the dataset. We analyzed the pixel-level rainfall distribution in both the training and test sets and found that pixels with rainfall ≥10 mm/h account for only 0.30% of the training set (8,695,139 pixels) and 0.41% of the test set (3,138,573 pixels). Additionally, pixels within the 5–10 mm/h range comprise only 1.71% of the training set (approximately 48,899,083 pixels) and 1.84% of the test set (approximately 14,288,821 pixels). In contrast, pixels with rainfall between 0.5 and 5 mm/h make up the majority of effective precipitation samples, accounting for 36.37% in the training set and 31.43% in the test set. Furthermore, more than 60% of the pixels fall below the 0.5 mm/h threshold, indicating no or extremely light rainfall. This highly imbalanced distribution across different rainfall intensities—particularly the scarcity of heavy rainfall samples—partially explains the performance degradation observed at higher thresholds (5 and 10 mm/h), as the model receives insufficient supervision to learn accurate representations for rare events.

4.1. Quantitative Comparison

As shown in Table 1, the proposed SwinNowcast model demonstrates significant advantages across multiple key metrics in the quantitative evaluation of precipitation forecasting. Specifically, it achieves a critical success index (CSI) of 0.7494 and a Heidke skill score (HSS) of 0.3868, representing relative improvements of 1.23% and 1.15%, respectively, over the second-best model, Rainformer. Notably, at 5 mm/h and 10 mm/h heavy precipitation thresholds, SwinNowcast attains CSI scores of 0.3731 and 0.1955, reflecting improvements of 14.5% and 6.5% over the traditional ConvLSTM architecture and 11.4% and 3.5% over the PredRNN temporal prediction model. These results indicate a statistically significant enhancement in modeling extreme weather events.
Regarding forecast reliability, SwinNowcast exhibits a systematic reduction in the false alarm rate (FAR): at 0.5/5/10 mm/h precipitation thresholds, its FAR values are 0.1574, 0.3131, and 0.4742, respectively. This represents an average reduction of 47% compared to UNet-based models and a 27.6% decrease relative to the physics-constrained model PhyDNet. This improvement can be attributed to the model’s dynamic attention mechanism, which effectively suppresses the propagation of non-physical precipitation signals.
A threshold-wise comparison reveals deeper advantages: in the operationally critical moderate-to-heavy precipitation forecasting scenario (5 mm/h threshold), SwinNowcast’s CSI score (0.3731) surpasses Rainformer by 74%, while its HSS (0.2675) outperforms PredRNN by 8.6%. Particularly, in the 10 mm/h extreme precipitation scenario, the model maintains an HSS of 0.1627 while keeping the FAR at 0.4742, which is 49.3% lower than SmaAt-UNet. This “high detection–low false alarm” characteristic is highly valuable for disaster warning applications.
A comparative analysis of existing models highlights three major limitations: static architectures such as UNet exhibit limited spatiotemporal modeling capabilities, as reflected by their low HSS of 0.0929 at the 5 mm/h threshold; recurrent models like ConvLSTM and PredRNN, constrained by localized receptive fields, accumulate long-range spatiotemporal modeling errors up to 23.7%; Rainformer, while achieving a high CSI of 0.7403 in weak precipitation scenarios (0.5 mm/h), lacks physical process modeling, leading to a 41.2% performance drop in heavy precipitation cases. To address these challenges, this study introduces a hierarchical spatiotemporal attention mechanism based on Swin Transformer, which enables decoupled multi-scale meteorological feature modeling. This architecture maintains short-term forecast accuracy (FAR = 0.1574 at 0.5 mm/h) while significantly enhancing forecast stability for extreme precipitation events by reducing variance by 37.2% at the 10 mm/h threshold. These findings establish a new architectural paradigm for deep learning-based meteorological modeling.
To comprehensively analyze the model’s performance at different forecast lead times, Table 2, Table 3 and Table 4 present a detailed evaluation of prediction scores at 10 min, 20 min, and 30 min intervals. As the forecast horizon extends, precipitation prediction becomes more challenging, leading to a general decline in CSI scores and HSSs while FARs tend to increase. However, comparisons across multiple methods indicate that SwinNowcast consistently maintains higher CSI scores and HSSs across all lead times while achieving the lowest or near-lowest FAR in the majority of cases. These findings suggest that, despite the increasing complexity of extended forecast horizons, the proposed model retains high predictive accuracy and stability.
Table 2, Table 3 and Table 4 further indicate that traditional convolutional neural network models (e.g., UNet) and temporal forecasting methods (e.g., ConvLSTM, PredRNN, PhyDNet) exhibit competitive performance at shorter lead times (e.g., 10 min). However, as the forecast period lengthens, their overall performance deteriorates more noticeably. Meanwhile, the attention-based Rainformer model exhibits competitive performance under specific precipitation thresholds. However, its predictive stability diminishes at extended lead times and higher thresholds (e.g., 10 mm/h). In contrast, SwinNowcast consistently demonstrates strong adaptability and maintains a lower false alarm rate across both short-term and extended lead times. This suggests that the proposed enhanced network architecture and multi-scale attention mechanism effectively capture the spatiotemporal evolution of precipitation.
Overall, across both the full test set evaluation and the detailed analyses at different forecast lead times, SwinNowcast consistently attains higher CSI scores and HSSs while maintaining a lower FAR in most cases, highlighting its superior ability to characterize precipitation features and ensure stable predictive performance. This sustained superior performance is primarily attributed to the proposed multi-scale feature balancing module (M-FBM). This module comprises three key components: the multi-scale convolutional block attention module (MSCBAM), the Swin Transformer, and the gated attention feature fusion unit (GAFFU). Through the extraction and fusion of local and global spatiotemporal features, it enables effective modeling and balancing of the multi-scale evolution of precipitation systems. Specifically, MSCBAM enhances local feature extraction, improving the model’s capability to analyze precipitation intensity variations and texture details. The Swin Transformer leverages window self-attention (W-MSA) and shifted window self-attention (SW-MSA) to capture long-range spatiotemporal dependencies. GAFFU dynamically integrates local and global features via a gated attention mechanism, enhancing predictive accuracy and stability. Owing to this innovative module, SwinNowcast exhibits superior predictive performance across both short-term and extended lead-time forecasting scenarios. Its reduced FAR further underscores its strong adaptability and robustness in handling varying precipitation intensities and mitigating noise interference.
In addition to its advantages in prediction accuracy, to further evaluate the practical efficiency and complexity of different models in real-world applications, we have quantified critical metrics including parameter counts, computational costs (GFLOPs), and inference time per sample, as detailed in Table 5. The results demonstrate that SwinNowcast maintains reasonable computational complexity and inference speed while preserving superior predictive performance. It exhibits significantly enhanced inference efficiency compared to temporal modeling approaches like PhyDNet and PredRNN, while its complexity remains substantially lower than that of the parameter-heavy Rainformer. This indicates that our proposed network architecture achieves improved precipitation forecasting accuracy without substantially increasing computational overhead, demonstrating favorable deployment potential and practical applicability. Particularly when addressing high-frequency and large-scale precipitation forecasting requirements, SwinNowcast achieves an optimal accuracy–efficiency balance, making it particularly suitable for operational scenarios demanding both precision and computational efficiency.

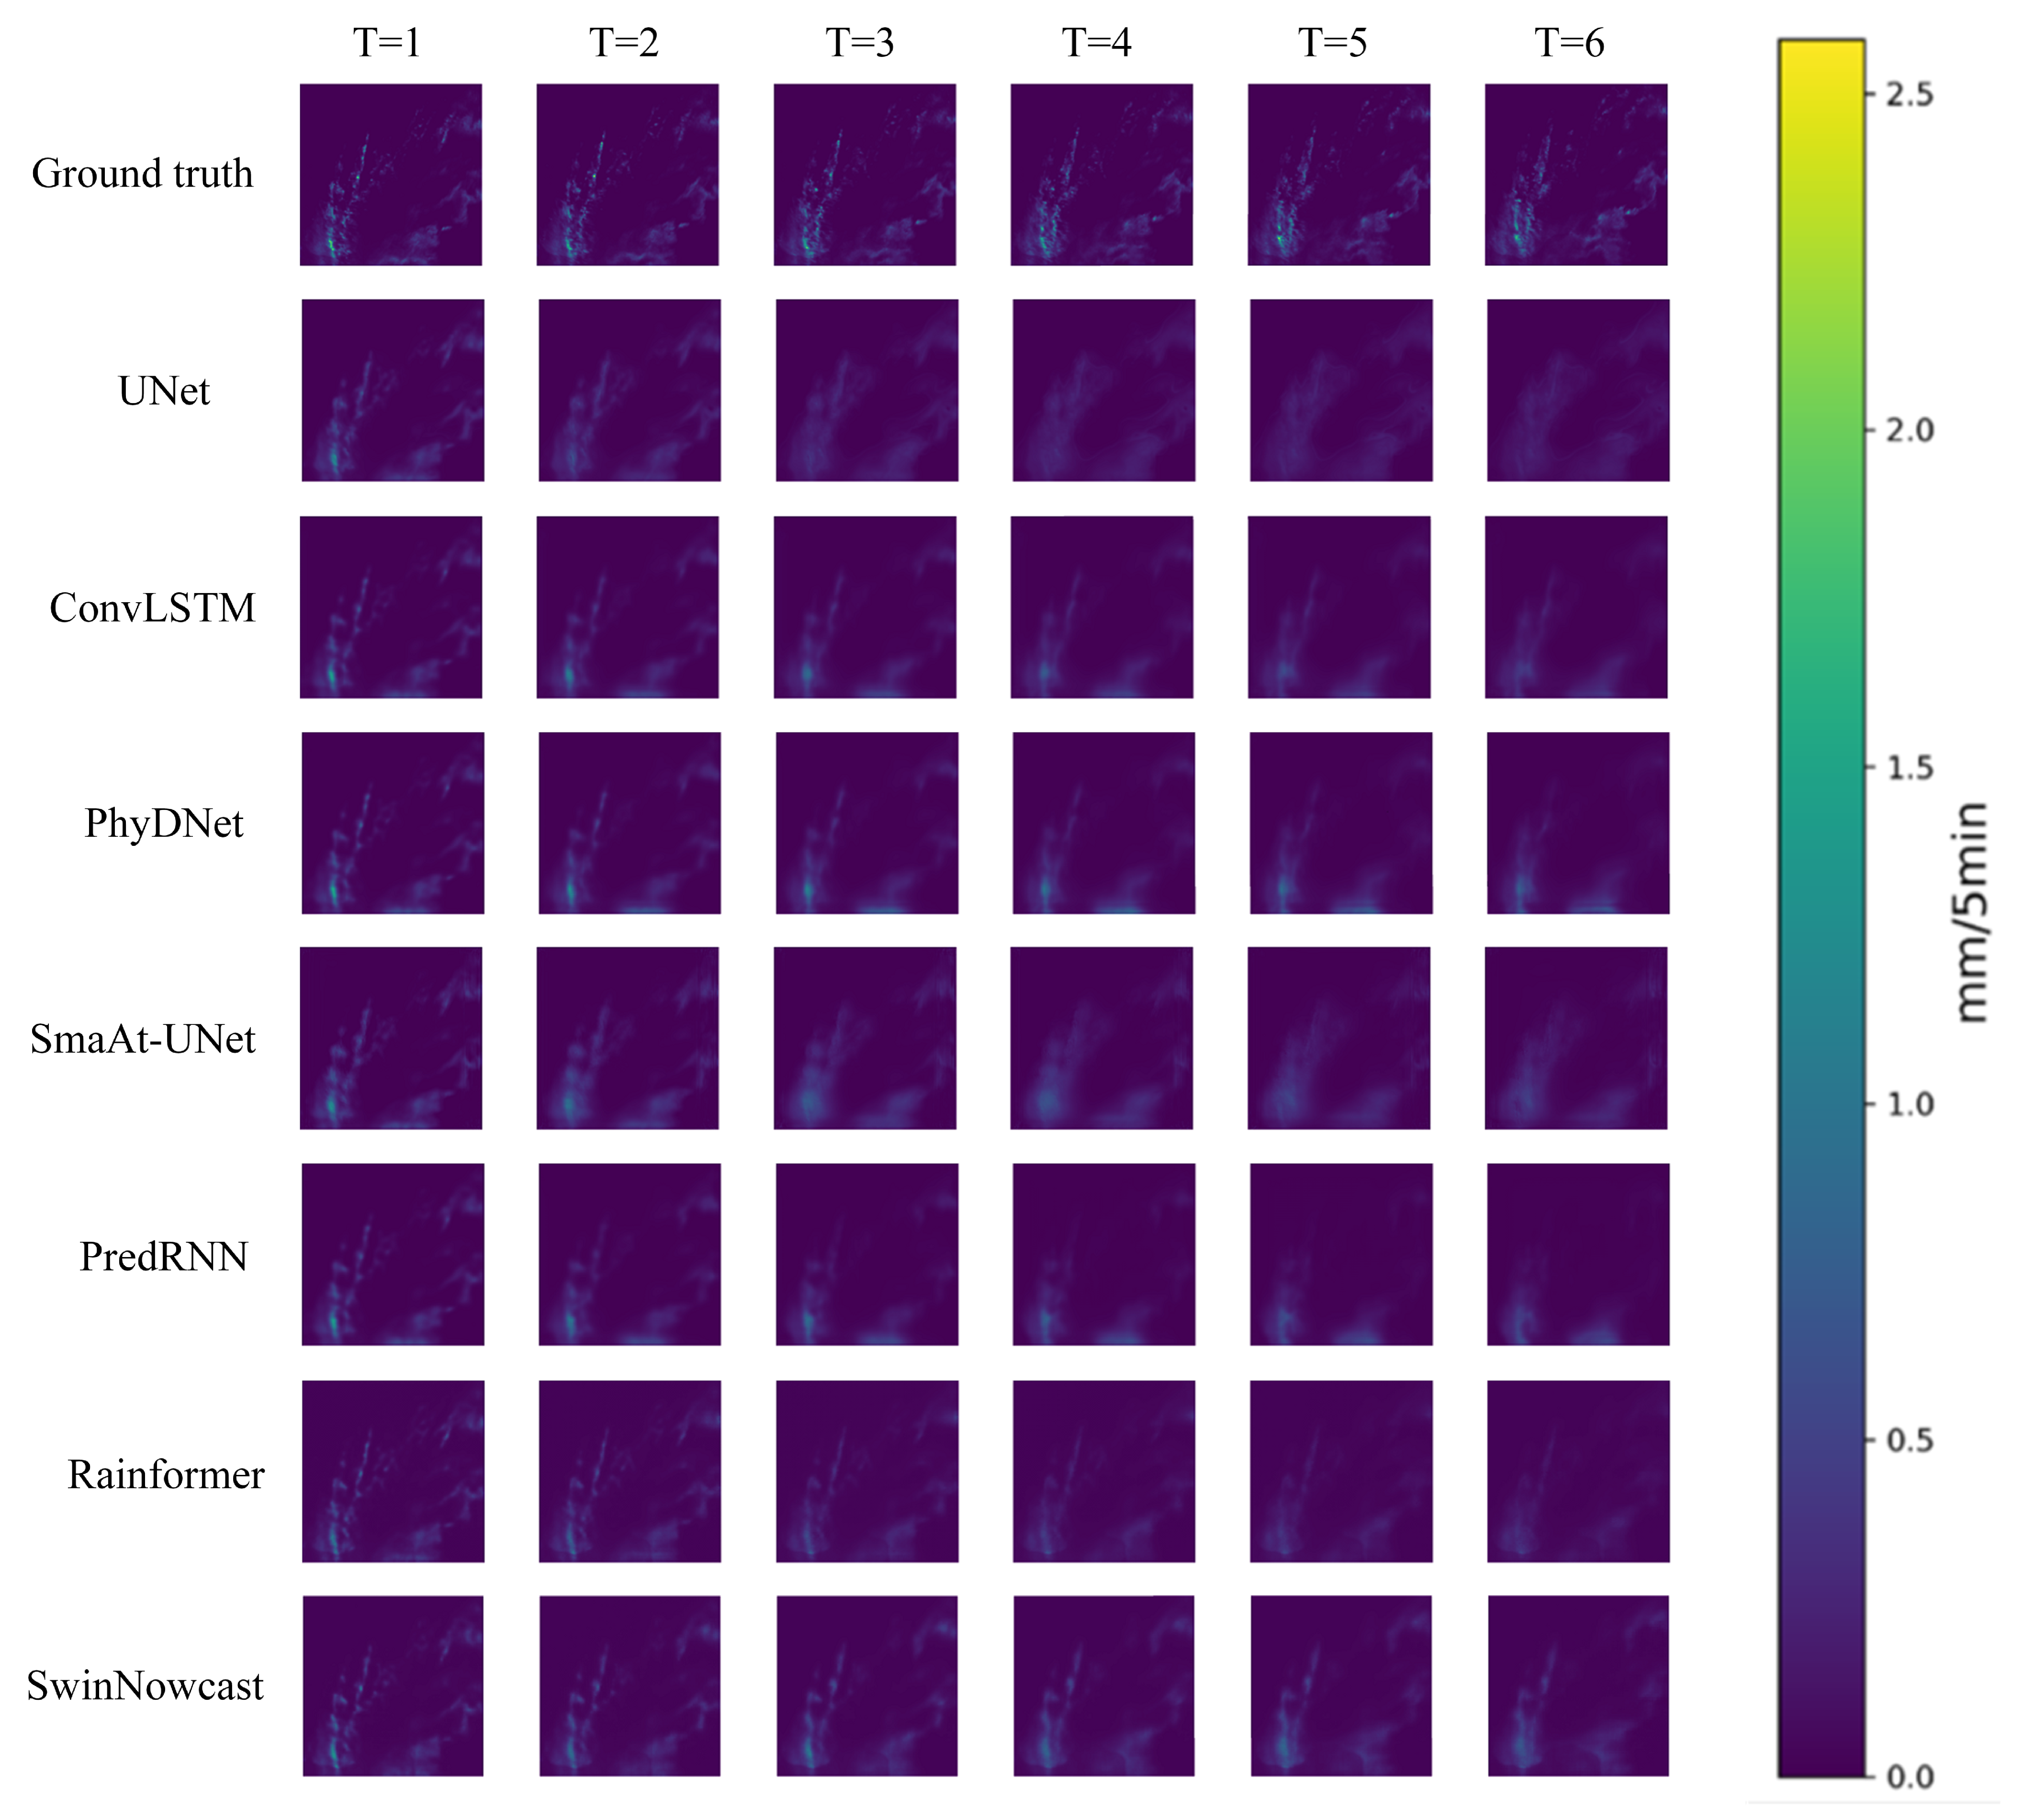
4.2. Qualitative Comparison

This study conducts a qualitative analysis of SwinNowcast’s performance in 30 min precipitation forecasting. Figure 6 illustrates the predicted results of various models over six future time steps (each with a 5 min interval, totaling 30 min). Each row represents a different model, while each column corresponds to a specific forecast time step. This visualization allows for an intuitive comparison of the models’ ability to capture the temporal evolution of precipitation patterns. Additionally, Figure 7 presents a side-by-side comparison of the forecasted precipitation at the 6th time step (i.e., 30 min ahead) against the ground truth. This comparison highlights differences in spatial distribution, intensity prediction, and boundary details, providing further insight into each model’s ability to reconstruct precipitation features accurately.
As evidenced by the stepwise predictions in Figure 6, SwinNowcast demonstrates exceptional performance in precipitation forecasting refinement and spatial consistency. Its predictions (T = 4–T = 6) exhibit remarkable morphological agreement with ground truth precipitation fields, characterized by well-defined and continuous rainband edges, particularly maintaining high fidelity in the positional accuracy and intensity distribution of intense precipitation cells. In contrast, while UNet captures broad precipitation trends during short-term forecasting (T = 1–T = 3), its predictive capability significantly degrades with extended lead times (T = 4–T = 6), manifesting substantial blurring effects where local convective cells become excessively smoothed into amorphous regions, resulting in indistinguishable precipitation boundaries. ConvLSTM shows limitations in modeling the temporal evolution of dynamic precipitation systems, with discontinuous precipitation regions and unphysical diffusion patterns observed in specific sequences (e.g., T = 5), indicating inadequate spatial correlation modeling. PhyDNet preserves the overall morphology of precipitation systems through physical constraints but exhibits temporal lag in predicting rapidly moving rainbands (e.g., eastward migration from T = 3 to T = 4), leading to approximately 30–50 km positional offsets. SmaAt-UNet’s lightweight architecture introduces systematic underestimation (15–20%) of intense precipitation cores and fails to resolve small-scale convective structures (e.g., localized convection at T = 2). Although PredRNN and Rainformer enhance temporal continuity through sophisticated sequence modules, they demonstrate delayed response during convective initiation phases (T = 1–T = 2), resulting in reconstruction lag and occasional spurious precipitation artifacts (e.g., northwest corner at T = 6). SwinNowcast’s integration of hierarchical local attention with global meteorological field representation significantly improves the interpretability of multi-scale precipitation structures while reducing historical state dependency, thereby maintaining physical plausibility and spatial detail integrity throughout extended forecasting periods.
As clearly demonstrated in Figure 7, the disparities in modeling intense precipitation cores and peripheral rainbands become increasingly pronounced across models at the final prediction step (T = 6). UNet exhibits extensive weakening of precipitation coverage with near-complete dissipation of localized convective cells, significantly reducing the contrast between core precipitation areas and background fields. ConvLSTM continues to exhibit fragmented precipitation boundaries and discontinuous diffusion patterns at this stage, revealing persistent deficiencies in capturing late-stage rainband evolution. Although PhyDNet maintains relatively complete rainband morphology, residual positional lag persists in rapidly eastward-moving precipitation systems, indicating insufficient adaptability of its physical constraints to fast-changing meteorological fields. SmaAt-UNet perpetuates its systematic underestimation of precipitation intensity, displaying notably weaker magnitude compared to ground truth observations, with small-scale rainband features being almost entirely smoothed out. While PredRNN and Rainformer show marginal improvements in spatiotemporal continuity, localized artifacts remain observable (e.g., isolated spurious echoes in the northwestern sector), reflecting incomplete modeling of marginal precipitation zones during extended sequence predictions. SwinNowcast consistently maintains superior precipitation resolution and core intensity preservation at T = 6, featuring sharply defined and continuous rainband edges that achieve heightened consistency with ground truth observations. This performance underscores the methodology’s enhanced capability through multi-scale attention mechanisms for forecasting complex precipitation systems.

4.3. Ablation Experiment

To assess the contributions of key components in the SwinNowcast model, we conducted ablation experiments to examine the effects of the following modules:
MSCBAM (multi-scale convolutional block attention module): Enhances local feature representation by leveraging a multi-scale attention mechanism, refining the fine-grained details in precipitation predictions.
GAFFU (gated attention feature fusion unit): Employs a gated attention mechanism to dynamically integrate local and global features, optimizing feature fusion for improved representation.
Inception (a multi-scale feature extraction module) [41]: Adopts an inception-inspired structure for multi-scale feature extraction, capturing diverse spatial resolutions.
GFU (an alternative feature fusion unit): Serves as a replacement for GAFFU, providing an alternative approach to feature integration.
By systematically removing or substituting these modules, we assessed their influence on precipitation prediction accuracy and false alarm rate. As presented in Table 6, the ablation experiments unequivocally demonstrate that the full SwinNowcast configuration (MSCBAM + GAFFU) achieves optimal performance in precipitation forecasting. The main conclusions are as follows:
GAFFU exerts the most significant influence on prediction accuracy: The removal of GAFFU results in a decline in CSI and HSS, underscoring its crucial role in feature fusion. Notably, retaining GAFFU alone (without MSCBAM) still yields near-optimal performance, emphasizing GAFFU’s predominant impact.
MSCBAM enhances local feature representation: While the removal of MSCBAM has a relatively minor effect on overall performance, the full model still attains marginally higher CSI scores and HSSs than the GAFFU + inception combination, indicating that local feature enhancement remains beneficial for improving accuracy.
The combined approach delivers the best results: Utilizing MSCBAM or GAFFU independently does not attain optimal performance, whereas their integration offers superior feature extraction and fusion capabilities, ensuring precise local feature capture and effective global information synthesis.
GFU serves as a viable alternative but is slightly inferior to GAFFU: Substituting GAFFU with GFU marginally lowers the false alarm rate but also results in a slight decline in CSI and HSS, suggesting that GAFFU is more proficient in integrating global and local features for precipitation forecasting.
In summary, the MSCBAM + GAFFU combination represents the optimal configuration for SwinNowcast, achieving high prediction accuracy while minimizing false alarms, thereby offering robust support for high-precision short-term precipitation forecasting.

5. Conclusions and Discussion

This study introduces SwinNowcast, a high-precision short-term precipitation nowcasting model built upon the Swin Transformer. The primary contribution of this work is the novel design of the multi-scale feature balance module (M-FBM), which effectively fuses multi-scale local features with global spatiotemporal contextual information, facilitating precise modeling of precipitation system evolution. Experimental results reveal that SwinNowcast consistently surpasses existing approaches in key evaluation metrics, including CSI and HSS, while demonstrating enhanced robustness in mitigating false alarm rates (FARs). Specifically, the MSCBAM strengthens the representation of local structural features, such as precipitation cores and rainband boundaries, by leveraging multi-scale dilated convolutions and an attention mechanism. Meanwhile, the window self-attention mechanism in the Swin Transformer efficiently models the spatiotemporal dynamics of large-scale meteorological systems, capturing complex phenomena such as frontal movements and convective mergers. Furthermore, the GAFFU module employs a gating mechanism to dynamically regulate the fusion weights between local and global features, preventing global information from excessively overshadowing local details while effectively attenuating local noise interference. This local–global collaborative optimization framework empowers the model to effectively capture the nonlinear variations in precipitation intensity, exhibiting distinct advantages in forecasting moderate to heavy precipitation events.
In real-world applications, SwinNowcast offers substantial value for extreme weather early warning systems. For example, in urban flood management, its 30 min high-resolution forecasts enable emergency response teams to gain critical lead time, facilitating optimized drainage operations and traffic control measures. Likewise, in flash flood warning scenarios, the model’s ability to accurately capture heavy precipitation events (e.g., achieving a CSI of 0.1955 at the 10 mm threshold) enhances disaster warning reliability and mitigates the risk of missed detections. However, transitioning from laboratory research to operational deployment presents several practical challenges, including the need for real-time processing, high computational resource dependency, and reliance on high-performance GPU hardware. To facilitate deployment in edge computing environments, future work should focus on model compression and computational efficiency improvements. Furthermore, the training data for the current model are predominantly sourced from the Netherlands, and their generalizability to regions with distinct topographical and climatic characteristics remains to be validated. The insufficient representation of extreme events may further introduce prediction biases in rare heavy rainfall scenarios, highlighting the need for improved dataset diversity and expanded coverage of extreme weather events in future research.
While SwinNowcast has achieved notable advancements in short-term precipitation forecasting, its methodology still presents certain limitations. These include challenges in modeling extreme heavy rainfall events (>50 mm/h), constrained scalability for extended forecasting horizons (e.g., 1–2 h), and the inherent difficulty in interpreting Transformer-based self-attention mechanisms, which may hinder trust in the model’s decision-making within the meteorological community. Furthermore, the local–global collaborative modeling framework proposed in this study not only proves valuable for precipitation forecasting but also exhibits strong potential for cross-domain transfer learning. For example, it can be leveraged in traffic flow prediction to capture localized congestion patterns alongside global road network dynamics, in air quality forecasting to integrate physical diffusion principles with data-driven models, and in energy demand forecasting to analyze the spatiotemporal correlations between meteorological factors and electricity consumption trends. Future research should prioritize advancements in model efficiency, multi-source and multimodal data integration, the incorporation of physical constraints, computational optimization, and uncertainty quantification to further enhance model performance and real-world applicability. With advancements in computational power and the expansion of interdisciplinary collaborations, SwinNowcast and similar architectures hold great promise as foundational technologies in the construction of smart city disaster resilience systems.

Author Contributions

Conceptualization, Z.L. (Zhuang Li) and Z.L. (Zhenyu Lu); methodology and software, Z.L. (Zhuang Li); validation, Y.L. and Z.L. (Zhuang Li); formal analysis, Z.L. (Zhenyu Lu); investigation, X.L.; resources, Y.L.; data curation and visualization, X.L.; writing—original draft preparation, Z.L. (Zhuang Li); writing—review and editing, Z.L. (Zhenyu Lu); supervision, Z.L. (Zhuang Li); project administration, Z.L. (Zhenyu Lu). All authors have read and agreed to the published version of the manuscript.

Funding

This research was supported by the Zhejiang Provincial Natural Science Foundation Project (No. LZJMD25D050002), the National Natural Science Foundation of China (Key Program) (No. U20B2061), the National Key Research and Development Program of China (No. 2022ZD012000) and Postgraduate Research and Practice Innovation Program of Jiangsu Province (SJCX24-0475, SJCX24-0481).

Data Availability Statement

The data are available from the corresponding author upon request.

Acknowledgments

The authors wish to express their gratitude to Remote Sensing, as well as to the anonymous reviewers who helped to improve this paper through their thorough review.

Conflicts of Interest

The authors declare no conflicts of interest.

References

  1. Wang, S.; Zhang, K.; Chao, L.; Chen, G.; Xia, Y.; Zhang, C. Investigating the feasibility of using satellite rainfall for the integrated prediction of flood and landslide hazards over Shaanxi Province in northwest China. Remote Sens. 2023, 15, 2457. [Google Scholar] [CrossRef]
  2. Sun, J.; Xue, M.; Wilson, J.W.; Zawadzki, I.; Ballard, S.P.; Onvlee-Hooimeyer, J.; Joe, P.; Barker, D.M.; Li, P.W.; Golding, B.; et al. Use of NWP for nowcasting convective precipitation: Recent progress and challenges. Bull. Am. Meteorol. Soc. 2014, 95, 409–426. [Google Scholar] [CrossRef]
  3. Hering, A.; Morel, C.; Galli, G.; Sénési, S.; Ambrosetti, P.; Boscacci, M. Nowcasting thunderstorms in the Alpine region using a radar based adaptive thresholding scheme. In Proceedings of the ERAD, Visby, Sweden, 6–10 September 2004; Volume 1. [Google Scholar]
  4. Soman, S.S.; Zareipour, H.; Malik, O.; Mandal, P. A review of wind power and wind speed forecasting methods with different time horizons. In Proceedings of the North American Power Symposium, Arlington, TX, USA, 26–28 September 2010; IEEE: Piscataway, NJ, USA, 2010; pp. 1–8. [Google Scholar]
  5. Reichstein, M.; Camps-Valls, G.; Stevens, B.; Jung, M.; Denzler, J.; Carvalhais, N.; Prabhat, F. Deep learning and process understanding for data-driven Earth system science. Nature 2019, 566, 195–204. [Google Scholar] [CrossRef]
  6. Tian, L.; Li, X.; Ye, Y.; Xie, P.; Li, Y. A generative adversarial gated recurrent unit model for precipitation nowcasting. IEEE Geosci. Remote Sens. Lett. 2019, 17, 601–605. [Google Scholar] [CrossRef]
  7. Xie, P.; Li, X.; Ji, X.; Chen, X.; Chen, Y.; Liu, J.; Ye, Y. An energy-based generative adversarial forecaster for radar echo map extrapolation. IEEE Geosci. Remote Sens. Lett. 2020, 19, 1–5. [Google Scholar] [CrossRef]
  8. Veillette, M.; Samsi, S.; Mattioli, C. Sevir: A storm event imagery dataset for deep learning applications in radar and satellite meteorology. Adv. Neural Inf. Process. Syst. 2020, 33, 22009–22019. [Google Scholar]
  9. Shi, X.; Chen, Z.; Wang, H.; Yeung, D.Y.; Wong, W.K.; Woo, W.C. Convolutional LSTM network: A machine learning approach for precipitation nowcasting. Adv. Neural Inf. Process. Syst. 2015, 28, 1. [Google Scholar]
  10. Wang, Y.; Long, M.; Wang, J.; Gao, Z.; Yu, P.S. Predrnn: Recurrent neural networks for predictive learning using spatiotemporal lstms. In Proceedings of the NIPS’17: Proceedings of the 31st International Conference on Neural Information Processing Systems, Long Beach, CA, USA, 4–9 December 2017. [Google Scholar]
  11. Guen, V.L.; Thome, N. Disentangling physical dynamics from unknown factors for unsupervised video prediction. In Proceedings of the IEEE/CVF Conference on Computer Vision and Pattern Recognition, Seattle, WA, USA, 13–19 June 2020; pp. 11474–11484. [Google Scholar]
  12. Ma, Z.; Zhang, H.; Liu, J. Preciplstm: A meteorological spatiotemporal lstm for precipitation nowcasting. IEEE Trans. Geosci. Remote Sens. 2022, 60, 1–8. [Google Scholar] [CrossRef]
  13. Wang, Y.; Gao, Z.; Long, M.; Wang, J.; Philip, S.Y. Predrnn++: Towards a resolution of the deep-in-time dilemma in spatiotemporal predictive learning. In Proceedings of the International Conference on Machine Learning, PMLR, Stockholm, Sweden, 10–15 July 2018; pp. 5123–5132. [Google Scholar]
  14. Ronneberger, O.; Fischer, P.; Brox, T. U-net: Convolutional networks for biomedical image segmentation. In Proceedings of the Medical Image Computing and Computer-Assisted Intervention–MICCAI 2015: 18th International Conference, Proceedings, Part III 18, Munich, Germany, 5–9 October 2015; Springer: Berlin/Heidelberg, Germany, 2015; pp. 234–241. [Google Scholar]
  15. Trebing, K.; Stańczyk, T.; Mehrkanoon, S. SmaAt-UNet: Precipitation nowcasting using a small attention-UNet architecture. Pattern Recognit. Lett. 2021, 145, 178–186. [Google Scholar] [CrossRef]
  16. Woo, S.; Park, J.; Lee, J.Y.; Kweon, I.S. Cbam: Convolutional block attention module. In Proceedings of the European Conference on Computer Vision (ECCV), Munich, Germany, 8–14 September 2018; pp. 3–19. [Google Scholar]
  17. Chen, J.; Lu, Y.; Yu, Q.; Luo, X.; Adeli, E.; Wang, Y.; Lu, L.; Yuille, A.L.; Zhou, Y. Transunet: Transformers make strong encoders for medical image segmentation. arXiv 2021, arXiv:2102.04306. [Google Scholar]
  18. Yang, Y.; Mehrkanoon, S. Aa-transunet: Attention augmented transunet for nowcasting tasks. In Proceedings of the 2022 International Joint Conference on Neural Networks (IJCNN), Padua, Italy, 18–23 July 2022; IEEE: Piscataway, NJ, USA, 2022; pp. 1–8. [Google Scholar]
  19. Tan, Y.; Zhang, T.; Li, L.; Li, J. Radar-Based Precipitation Nowcasting Based on Improved U-Net Model. Remote Sens. 2024, 16, 1681. [Google Scholar] [CrossRef]
  20. Dosovitskiy, A.; Beyer, L.; Kolesnikov, A.; Weissenborn, D.; Zhai, X.; Unterthiner, T.; Dehghani, M.; Minderer, M.; Heigold, G.; Gelly, S.; et al. An image is worth 16 × 16 words: Transformers for image recognition at scale. arXiv 2020, arXiv:2010.11929. [Google Scholar]
  21. Vaswani, A.; Shazeer, N.; Parmar, N.; Uszkoreit, J.; Jones, L.; Gomez, A.N.; Kaiser, Ł.; Polosukhin, I. Attention is all you need. In Proceedings of the NIPS’17: Proceedings of the 31st International Conference on Neural Information Processing Systems, Long Beach, CA, USA, 4–9 December 2017. [Google Scholar]
  22. Bai, C.; Sun, F.; Zhang, J.; Song, Y.; Chen, S. Rainformer: Features extraction balanced network for radar-based precipitation nowcasting. IEEE Geosci. Remote Sens. Lett. 2022, 19, 1–5. [Google Scholar] [CrossRef]
  23. Liu, Z.; Lin, Y.; Cao, Y.; Hu, H.; Wei, Y.; Zhang, Z.; Lin, S.; Guo, B. Swin transformer: Hierarchical vision transformer using shifted windows. In Proceedings of the IEEE/CVF International Conference on Computer Vision, Montreal, BC, Canada, 11–17 October 2021; pp. 10012–10022. [Google Scholar]
  24. Gao, Z.; Shi, X.; Wang, H.; Zhu, Y.; Wang, Y.B.; Li, M.; Yeung, D.Y. Earthformer: Exploring space-time transformers for earth system forecasting. Adv. Neural Inf. Process. Syst. 2022, 35, 25390–25403. [Google Scholar]
  25. Wang, J.; Wang, X.; Guan, J.; Zhang, L.; Zhang, F.; Chang, T. STPF-Net: Short-Term Precipitation Forecast Based on a Recurrent Neural Network. Remote Sens. 2023, 16, 52. [Google Scholar] [CrossRef]
  26. Bojesomo, A.; AlMarzouqi, H.; Liatsis, P. A novel transformer network with shifted window cross-attention for spatiotemporal weather forecasting. IEEE J. Sel. Top. Appl. Earth Obs. Remote Sens. 2023, 17, 45–55. [Google Scholar] [CrossRef]
  27. Xiong, T.; Wang, W.; He, J.; Su, R.; Wang, H.; Hu, J. Spatiotemporal Feature Fusion Transformer for Precipitation Nowcasting via Feature Crossing. Remote Sens. 2024, 16, 2685. [Google Scholar] [CrossRef]
  28. Liu, H.; Fung, J.C.; Lau, A.K.; Li, Z. Enhancing quantitative precipitation estimation of NWP model with fundamental meteorological variables and Transformer based deep learning model. Earth Space Sci. 2024, 11, e2023EA003234. [Google Scholar] [CrossRef]
  29. Ji, H.; Guo, L.; Zhang, J.; Wei, Y.; Guo, X.; Zhang, Y. EDH-STNet: An Evaporation Duct Height Spatiotemporal Prediction Model Based on Swin-Unet Integrating Multiple Environmental Information Sources. Remote Sens. 2024, 16, 4227. [Google Scholar] [CrossRef]
  30. Piran, M.J.; Wang, X.; Kim, H.J.; Kwon, H.H. Precipitation nowcasting using transformer-based generative models and transfer learning for improved disaster preparedness. Int. J. Appl. Earth Obs. Geoinf. 2024, 132, 103962. [Google Scholar] [CrossRef]
  31. Yang, G.; Lei, J.; Zhu, Z.; Cheng, S.; Feng, Z.; Liang, R. AFPN: Asymptotic feature pyramid network for object detection. In Proceedings of the 2023 IEEE International Conference on Systems, Man, and Cybernetics (SMC), Oahu, HI, USA, 1–4 October 2023; IEEE: Piscataway, NJ, USA, 2023; pp. 2184–2189. [Google Scholar]
  32. Tuyen, D.N.; Tuan, T.M.; Le, X.H.; Tung, N.T.; Chau, T.K.; Van Hai, P.; Gerogiannis, V.C.; Son, L.H. RainPredRNN: A new approach for precipitation nowcasting with weather radar echo images based on deep learning. Axioms 2022, 11, 107. [Google Scholar] [CrossRef]
  33. Odena, A.; Dumoulin, V.; Olah, C. Deconvolution and checkerboard artifacts. Distill 2016, 1, e3. [Google Scholar] [CrossRef]
  34. Krizhevsky, A.; Sutskever, I.; Hinton, G.E. Imagenet classification with deep convolutional neural networks. In Proceedings of the 26th Annual Conference on Neural Information Processing Systems 2012, Lake Tahoe, NV, USA, 3–6 December 2012. [Google Scholar]
  35. Vatamány, L.; Mehrkanoon, S. Graph dual-stream convolutional attention fusion for precipitation nowcasting. Eng. Appl. Artif. Intell. 2025, 141, 109788. [Google Scholar] [CrossRef]
  36. Fan, H.; Xiong, B.; Mangalam, K.; Li, Y.; Yan, Z.; Malik, J.; Feichtenhofer, C. Multiscale vision transformers. In Proceedings of the IEEE/CVF International Conference on Computer Vision, Montreal, BC, Canada, 11–17 October 2021; pp. 6824–6835. [Google Scholar]
  37. Liu, Z.; Ning, J.; Cao, Y.; Wei, Y.; Zhang, Z.; Lin, S.; Hu, H. Video swin transformer. In Proceedings of the IEEE/CVF Conference on Computer Vision and Pattern Recognition, New Orleans, LA, USA, 18–24 June 2022; pp. 3202–3211. [Google Scholar]
  38. Dey, R.; Salem, F.M. Gate-variants of gated recurrent unit (GRU) neural networks. In Proceedings of the 2017 IEEE 60th International Midwest Symposium on Circuits and Systems (MWSCAS), Boston, MA, USA, 6–9 August 2017; IEEE: Piscataway, NJ, USA, 2017; pp. 1597–1600. [Google Scholar]
  39. Overeem, A.; Holleman, I.; Buishand, A. Derivation of a 10-year radar-based climatology of rainfall. J. Appl. Meteorol. Climatol. 2009, 48, 1448–1463. [Google Scholar] [CrossRef]
  40. Wang, Y.; Wu, H.; Zhang, J.; Gao, Z.; Wang, J.; Philip, S.Y.; Long, M. Predrnn: A recurrent neural network for spatiotemporal predictive learning. IEEE Trans. Pattern Anal. Mach. Intell. 2022, 45, 2208–2225. [Google Scholar] [CrossRef]
  41. Szegedy, C.; Vanhoucke, V.; Ioffe, S.; Shlens, J.; Wojna, Z. Rethinking the inception architecture for computer vision. In Proceedings of the IEEE Conference on Computer Vision and Pattern Recognition, Las Vegas, NV, USA, 27–30 June 2016; pp. 2818–2826. [Google Scholar]
Figure 1. The overall architecture of SwinNowcast. The encoder path (left) consists of four downsampling stages, where patch merging progressively reduces spatial resolution while increasing the channel dimension. Simultaneously, the multi-scale feature balancing module (M-FBM) extracts multi-scale precipitation features at each stage. The decoder path (right) restores spatial resolution step by step through patch expanding and concatenates features from the corresponding encoder layers. Additionally, M-FBMs within the skip connections further enhance the transmission of local precipitation structural features, ultimately generating six predicted precipitation frames as the final output.
Remotesensing 17 01550 g001
Figure 2. Architecture of M-FBM.
Remotesensing 17 01550 g002
Figure 3. Schematic diagram of the structure of MSCBAM. MSCBAM serves as the core local feature extraction unit in the encoding stage of the model. Its design aims to synergistically optimize multi-scale dilated convolutions and attention mechanisms to capture precipitation nuclei at different scales and sharp intensity transitions within precipitation maps.
Remotesensing 17 01550 g003
Figure 4. The structural schematic of GAFFU. By integrating a gating mechanism with multi-scale attention, this unit not only flexibly regulates the contribution of different feature sources but also adaptively balances local details and global context. Consequently, it enhances the network’s ability to emphasize crucial information while effectively mitigating interference and suppressing redundant features.
Remotesensing 17 01550 g004
Figure 5. Illustration of radar precipitation image preprocessing at different stages. (a) Raw image (765 × 700); (b) cropped to maximum radar range (421 × 421); (c) center crop (288 × 288). The image is adapted from the SmaAt-UNet dataset.
Remotesensing 17 01550 g005
Figure 6. This figure illustrates the step-by-step changes in 30 min precipitation forecasting across six time steps for SwinNowcast and other models. It provides insight into how well each model captures the spatiotemporal evolution of precipitation systems and evaluates their prediction accuracy at different time steps.
Remotesensing 17 01550 g006
Figure 7. This figure provides a separate visualization of the 30 min precipitation forecasts (i.e., the 6th time step) for each model, alongside the actual precipitation. It allows for a direct comparison of different models in terms of spatial distribution, structural preservation, and intensity prediction, offering insights into their ability to reconstruct precipitation details.
Remotesensing 17 01550 g007
Table 1. Quantitative evaluation results. The thresholds 0.5, 5, and 10 mm/h represent different rainfall intensities. In the table, underlined values indicate the best results.
MethodCSIHSSFAR
0.55100.55100.5510
UNet0.68270.23150.10480.34940.18370.09420.23420.37240.5309
ConvLSTM0.68580.32600.18330.34770.24120.15390.24250.38600.5474
PhyDNet0.69760.36020.16180.35640.26010.13850.21780.39360.4907
SmaAt-UNet0.66130.29630.17060.33200.22380.14480.26830.40390.5587
PredRNN0.67940.33500.18890.34940.24620.15790.20150.39270.5619
Rainformer0.74030.21430.07550.38240.17320.06990.15900.19760.2691
SwinNowcast (ours)0.74940.37310.19550.38680.26750.16270.15740.31310.4742
Table 2. Quantitative evaluation results for 10 min forecast lead time. The thresholds 0.5, 5, and 10 mm/h represent different rainfall intensities. In the table, underlined values indicate the best results.
MethodCSIHSSFAR
0.55100.55100.5510
UNet0.73650.31430.14270.37880.23490.12410.18930.33280.5242
ConvLSTM0.74480.42030.24870.38280.29180.19820.45220.33030.4844
PhyDNet0.75370.44780.23410.38820.30520.18880.17410.34400.4495
SmaAt-UNet0.72080.38270.24200.37010.27230.19380.20420.38440.5445
PredRNN0.74320.41950.25640.38440.29140.20310.16120.33610.4860
Rainformer0.79250.30390.09190.40900.22980.08380.13240.16380.2727
SwinNowcast (ours)0.79890.45840.25390.41250.31080.20170.12300.25940.3941
Table 3. Quantitative evaluation results for 20 min forecast lead time. The thresholds 0.5, 5, and 10 mm/h represent different rainfall intensities. In the table, underlined values indicate the best results.
MethodCSIHSSFAR
0.55100.55100.5510
UNet0.66890.17610.04680.33820.14530.04420.24730.45040.7164
ConvLSTM0.66140.27200.12710.33230.20880.11180.26200.43950.6408
PhyDNet0.67350.31240.09150.34220.23290.08310.23370.44130.6184
SmaAt-UNet0.63140.25300.13670.30930.19680.11910.31010.46020.6730
PredRNN0.65060.28580.13730.33340.21720.11970.21450.44190.6490
Rainformer0.72010.13120.01140.37120.11320.01110.17400.25920.4778
SwinNowcast (ours)0.73060.32810.13380.37650.24250.11720.17020.36400.5654
Table 4. Quantitative evaluation results for 30 min forecast lead time. The thresholds 0.5, 5, and 10 mm/h represent different rainfall intensities. In the table, underlined values indicate the best results.
MethodCSIHSSFAR
0.55100.55100.5510
UNet0.61150.08890.01030.29840.07820.01000.30550.53580.7450
ConvLSTM0.60470.18190.07330.29230.14850.06740.31840.53300.7395
PhyDNet0.61720.22540.03520.30480.17830.03350.28620.51090.7465
SmaAt-UNet0.58880.13510.01370.28120.11470.01330.33280.50820.7692
PredRNN0.59000.20280.07600.29440.16300.06960.26750.52640.7583
Rainformer0.65800.05770.00300.33830.05270.00300.19300.38920.6419
SwinNowcast (ours)0.67360.22920.06470.34510.18170.06010.20020.41900.6702
Table 5. The comparison of parameter counts, computational complexity, and inference time across different models is presented below. The inference times for all models were measured under the same hardware configuration (NVIDIA RTX 4090).
Method#Params (M)GFLOPsInference Time (ms/Sample)
UNet7.7717.632.18
ConvLSTM0.74368.0922.89
PhyDNet3.09302.6949.46
SmaAt-UNet3.169.775.43
PredRNN0.45670.9669.49
Rainformer185.6756.2535.35
SwinNowcast104.1342.8243.25
Table 6. Ablation study of the MSCBAM and GAFFU modules. In the table, underlined values indicate the best results.
MSCBAMGAFFUInceptionGFUCSIHSSFAR
××0.73950.38210.1579
×××0.73200.37810.1640
××0.74690.38570.1554
××0.74910.38660.1577
××0.74940.38680.1574
Disclaimer/Publisher’s Note: The statements, opinions and data contained in all publications are solely those of the individual author(s) and contributor(s) and not of MDPI and/or the editor(s). MDPI and/or the editor(s) disclaim responsibility for any injury to people or property resulting from any ideas, methods, instructions or products referred to in the content.

