Article

Impact of Observation Density of Next-Generation GeoHIS on Global Numerical Model Performance: A KIM-OSSE Study


1
Numerical Weather Prediction Center, Korea Meteorological Administration, Daejeon 35208, Republic of Korea
2
Korea Institute of Atmospheric Prediction System (KIAPS), Seoul 07071, Republic of Korea
3
Department of Atmospheric Sciences, Yonsei University, Seoul 03722, Republic of Korea
*
Author to whom correspondence should be addressed.
Remote Sens. 2026, 18(16), 2685; https://doi.org/10.3390/rs18162685
Submission received: 10 June 2026 / Revised: 25 July 2026 / Accepted: 7 August 2026 / Published: 10 August 2026
(This article belongs to the Section Atmospheric Remote Sensing)

Highlights

What are the main findings?
  • GeoHIS assimilation significantly improves mid- and upper-tropospheric geopotential height forecasts, especially over Asia and East Asia.
  • Hourly GeoHIS observations provide greater forecast benefits than 3-hourly observations, yielding larger and longer-lasting forecast improvements.
What are the implications of the main findings?
  • High-temporal-resolution GeoHIS observations can enhance the accuracy of medium- and long-range numerical weather prediction.
  • Maximizing GeoHIS observation frequency should be a key consideration for future Global Ring observation and satellite operation strategies.

Abstract

The geostationary hyperspectral infrared sounder (GeoHIS) provides atmospheric variables at high spatiotemporal resolution. Consequently, GeoHIS can provide valuable information for improving real-time forecasting and enhancing the performance of numerical weather prediction (NWP). GeoHIS provides higher temporal resolution than that of a polar-orbiting platform, observing the same region 2~3 times daily. Therefore, we assess the forecast impact of a next-generation GeoHIS on a numerical model according to observation density using KIM-OSSE (Korean Integrated Model–Observing System Simulation Experiment) in this study. Simulated observations are generated from the nature run dataset (ECO 1280) provided by Cooperative Institute for Research in the Atmosphere at Colorado State University (CIRA/CSU). These simulated observations are then assimilated into KIM, after which KIM generates forecast fields. Using this framework, we evaluated the impact of GeoHIS on a global numerical model. The results showed noticeable improvements in geopotential height, particularly in the mid- and upper troposphere, while wind, temperature, and humidity remain largely unchanged in EXP-1 and EXP-2. An analysis of the sensitivity to GeoHIS temporal resolution, by comparing hourly data and 3-hourly data, revealed that higher temporal resolution leads to greater forecast improvements.

1. Introduction

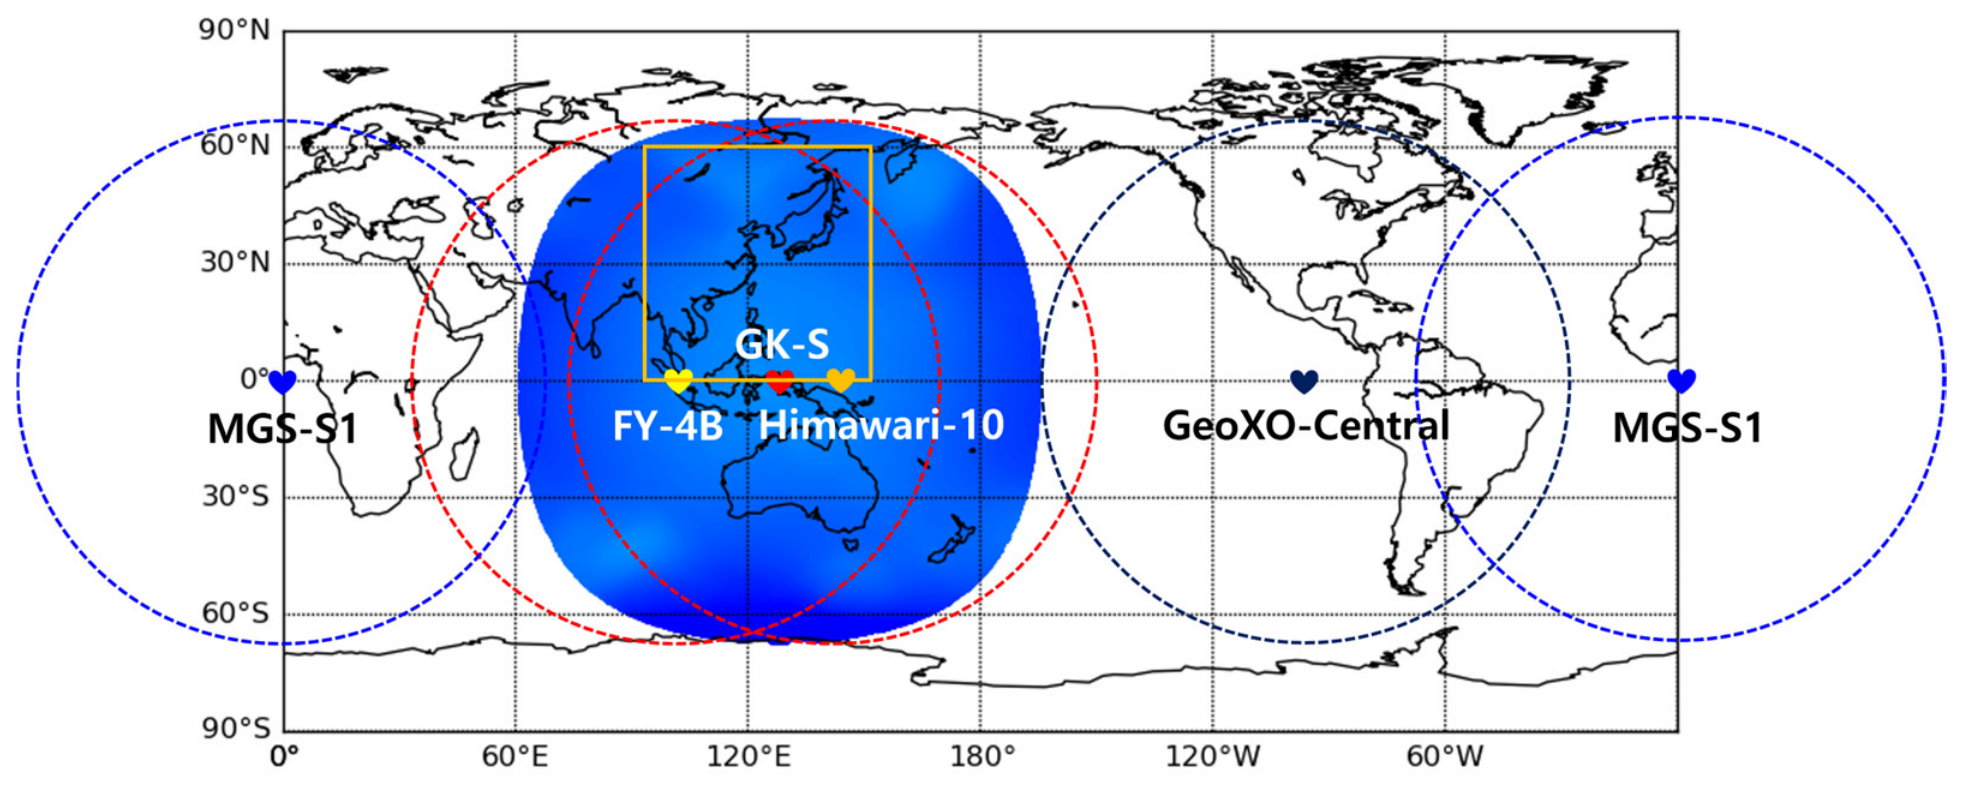
The Korea Meteorological Administration (KMA) plans to operate a hyperspectral infrared sounder (HIS) onboard a geostationary satellite by 2036. This instrument will provide high-temporal- and high-spatial-resolution temperature and humidity profiles, as well as vertical atmospheric motion vectors (AMVs) [1,2]. This initiative is consistent with the World Meteorological Organization’s (WMO) Global Ring vision, which has been proposed as a long-term framework for enhancing global GeoHIS capabilities. The envisioned constellation of GeoHIS is expected to improve the temporal continuity and global coverage of atmospheric observations [3]. Global Ring represents a globally cooperative effort involving several countries, including China, Europe, Japan, the United States, and South Korea. The MTG-S (Metosat Third-Generation Sounder), FY-4B (FengYun-4B), GK-S (GEO-KOMPSAT-Sounder, Geostationary Korea Multi-Purpose Satellite), Himawari-10, and GeoXO-central (Geostationary Extended Observations) satellites are positioned to provide global coverage at 0°E, 105°E, 128.2°E, 140.7°E, and 105°W, respectively (Figure 1) [1,4,5,6,7,8,9].
Operation of GeoHIS is expected to improve nowcasting (real-time forecasting) and enhance numerical weather prediction (NWP) performance by providing high spectral, spatial, and temporal resolution for data assimilation. The Korean Peninsula, located in East Asia, frequently experiences various extreme weather phenomena, including strong winds, yellow dust events, typhoons, heavy rainfall, and snowfall [10,11]. To monitor severe weather events, GeoHIS provides high-frequency, high-resolution observations of three-dimensional dynamic and thermodynamic variables, including temperature (instability indices), humidity (total precipitable water, TPW), and AMVs.
Severe weather observations from meteorological satellites rely on various sensors, such as imagers, sounders, and radars, among others. Imagers and radars, in particular, can detect cloud-top temperatures and precipitation amounts, providing insight into the evolution of weather systems within cloud-covered regions. However, GeoHIS can measure temperature, humidity, and wind profiles over clear-sky regions in pre-convective environments. This capacity allows GeoHIS to provide valuable early information on extreme weather phenomena, offering an advantage over traditional imager and radar observations [1].
Using atmospheric variables derived from HIS observation has been studied in nowcasting applications [12,13,14]. Li et al. [13] report that instability indices, such as convective available potential energy (CAPE) and the lifted index (LI), derived from HIS observations can provide warming information in pre-convection environments up to 1~6 h in advance. To monitor severe weather events, Schmit et al. [12], Li et al. [13], and Khan et al. [14] highlight the critical role of GeoHIS, which offers higher spectral, spatial, and temporal resolution than polar-orbiting satellite observations.
In this study, we focus on the perspective of improving NWP performance [4,15,16]. HIS observations have contributed to improving the accuracy of operational NWP since the 21st century [17,18,19,20,21]. Various studies report that satellite sounding observations are an essential component of NWP systems [22,23,24,25]. Weather-advanced countries, including the United States, Europe, Japan, China, and South Korea, have studied the forecast impact of the next-generation GeoHIS on NWP using Observing System Simulation Experiment (OSSE) [1,24,26,27,28,29,30].
Coopmann et al. [28] and Lindsey et al. [29] investigated the impact of simulated hyperspectral radiance from MTG-S and GeoXO on NWP using OSSEs, reporting a positive effect of GeoHIS on forecast performance. Cho et al. [1] evaluated the forecast impact of simulated GeoHIS radiance using the Korean Integrated Model (KIM), reporting noticeable improvements in geopotential height, particularly in the mid- and upper troposphere, with statistically significant results at the 95% confidence level. Recently, several studies have investigated the effective usage of GeoHIS via OSSE [31,32]. Zhou et al. [31], in particular, studied optimal channel selection for GeoHIS to maximize the efficiency of satellite data usage. McGrath-Spangler et al. [32] assessed the potential effectiveness of GeoXO, a follow-on to the GOES (Geostationary Operational Environmental Satellite) series, and assessed the impact of multi-satellite observations regarding international coordination, including MTG, Himawari, and GeoXO observation coverage.
Cho et al. [1] evaluated the impact of GeoHIS on a global model using Korean Integrated Model–Observing System Simulation Experiment (KIM-OSSE), demonstrating the importance of geostationary satellite observations, which provide higher temporal resolution than polar-orbiting satellites, which observe the same region only twice per day. Additionally, the observation coverage of polar-orbiting platforms, such as AIRS (Atmospheric Infrared Sounder), IASI (Infrared Atmospheric Sounder Interferometer), and CrIS (Cross-track Infrared Sounder), is approximately 1600~2200 km, whereas a geostationary satellite provides a coverage of about 12,000 km. Therefore, GeoHIS has an excellent impact on nowcasting and data assimilation. However, as the number of observation channels increases, the capacity of land-based satellite data processing systems must also be expanded to handle the larger data volumes. Therefore, assessing the impact of observation frequency on numerical models to ensure the cost-effective operation of meteorological satellites is necessary. Despite this need, studies on the potential impact of GeoHIS observation density on numerical models remain limited. In this study, we focus on how the effect of GeoHIS observation density affects NWP accuracy.
Previous OSSE studies have demonstrated the overall forecast benefits of assimilating simulated GeoHIS observations. While these studies established the value of GeoHIS observations, the specific contribution of increased temporal sampling frequency has not been examined separately. Accordingly, this study aims to isolate and quantify the incremental forecast improvement attributable to increased temporal observation density while maintaining an otherwise identical observing system and data assimilation framework. The KIM, operated by KMA, has been the operational global NWP model since 18 April 2020, and is planned to incorporate GeoHIS observations by 2036 [1,33]. Therefore, proactively integrating next-generation GeoHIS into the KIM data assimilation system is necessary. In this study, we investigate the impact of the next-generation GeoHIS observations on KIM forecast performance. Section 2 describes the data and methods, and Section 3 presents the results and discussion of the forecast impact of different GeoHIS observation frequencies. Section 4 provides a summary and conclusion. The findings will inform strategies for next-generation satellite development.

2. Data and Methods

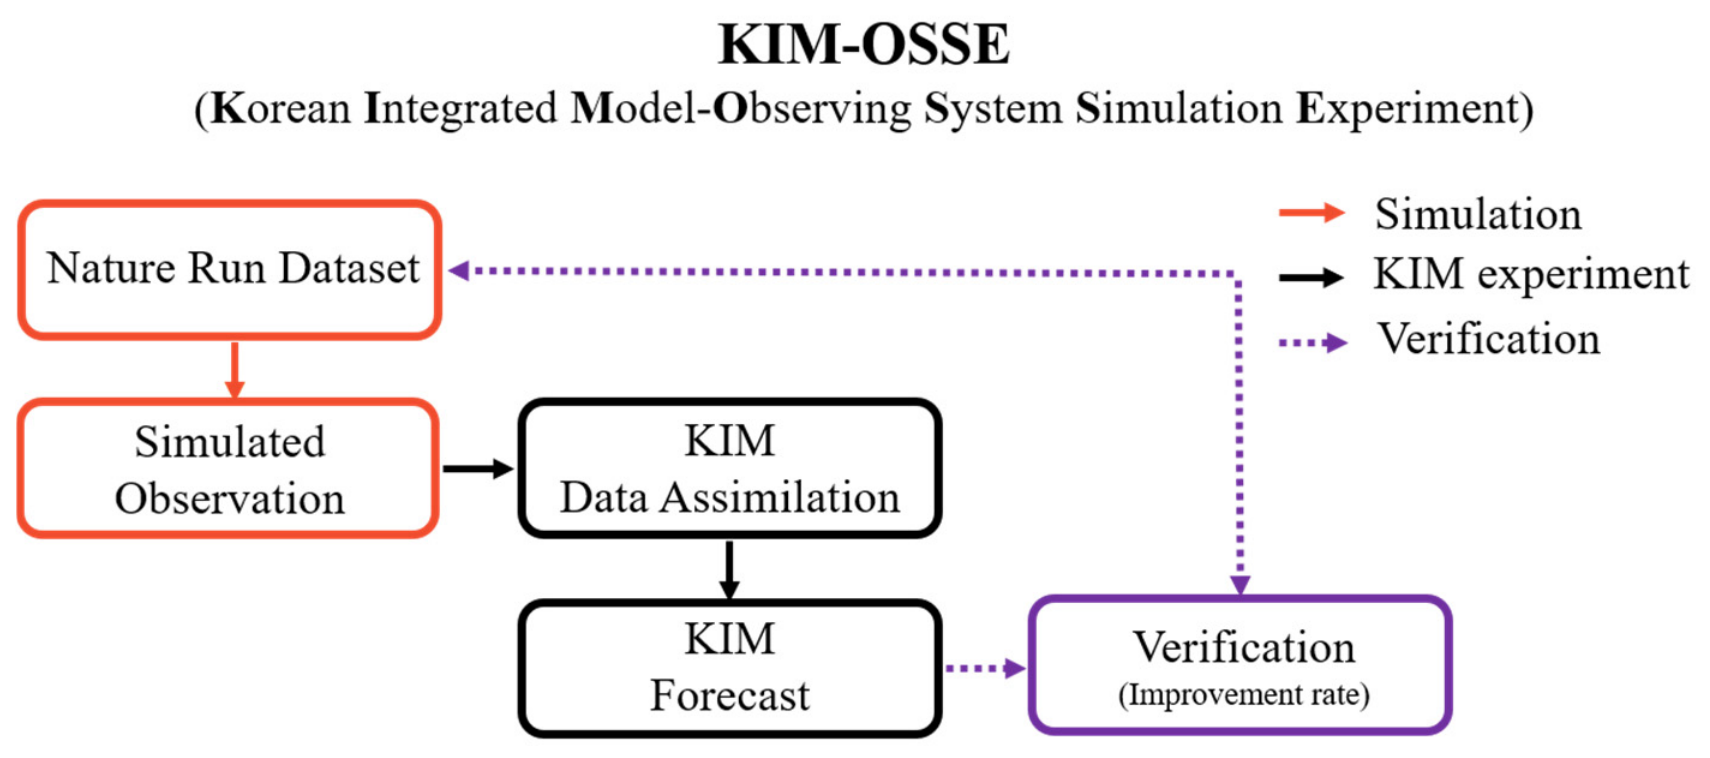
To assess the impact of GeoHIS observation frequency on global NWP, we used KIM-OSSE, developed by the Korea Institute of Atmospheric Prediction (KIAPS). Figure 2 illustrates the experimental flowchart used in this study, referred to as KIM-OSSE. This process involves several steps. First, KIM generates simulated observations based on the nature run (NR) dataset, which is provided by the Cooperative Institute for Research in the Atmosphere at Colorado State University (CIRA/CSU) at a horizontal resolution of 9 km. These simulated observations are then assimilated, and KIM subsequently produces forecasts. We evaluated the forecast fields using the NR dataset, which serves as the reference “true state” in this experimental setup [1,34,35,36].
To simulate GeoHIS radiances, we used the NR dataset provided by CIRA/CSU. The NR dataset, named ECO1280 (ECMWF Cubic Octahedral 1280), spans 14 months, from 30 September 2015 to 30 November 2016, and provides atmospheric fields at temporal resolutions of 1 or 3 h. The ECO1280 NR provides hourly atmospheric fields only for October 2015, whereas outputs for the remaining simulation period are archived at three-hourly intervals (Table 1). Because the objective of this study is to evaluate the forecast impact of increasing the temporal sampling frequency of GeoHIS observations from three-hourly to hourly, hourly NR fields are required both for generating temporally consistent synthetic observations and for forecast verification. Consequently, the OSSEs were limited to October 2015, the only period for which hourly NR fields are available. The atmospheric fields used in this study were derived from the October 2015 ECO1280 NR and reprocessed onto the KIM grid while preserving the original atmospheric evolution. To generate realistic simulated observations, only the observation geometry (e.g., geolocation, viewing geometry, and scan geometry) from October 2023 was adopted to represent the planned observing configuration.
Table 2 summarizes the specifications of the simulated GeoHIS radiances. Simulated GeoHIS radiances were generated using RTTOV (Radiative Transfer for TIROS Operational Vertical Sounder) version 13 [36]. The observational coverage, based on the GK-2A position, spans much of Asia and Oceania, with a primary focus on the Korean Peninsula. The sensor specifications for the next-generation GeoHIS are based on those of the Geostationary Interferometric Infrared Sounder (GIIRS)/FY-4A, including parameters such as channels, wavenumber, spectral width, and spectral resolution. The simulated GeoHIS has a spatial and temporal resolution of 16 km and 1 h, respectively. In this study, GeoHIS radiances were simulated for 69 selected channels distributed across the 700~1130 cm−1 (8.85~14.29 μm) spectral range in the long-wave infrared region for atmospheric temperature sounding, with a spectral resolution of 0.625 cm−1. These spectral regions are used to retrieve temperature profiles in CO2, H2O, and O3 absorption bands.
For data assimilation, channels primarily sensitive to the lower troposphere were excluded because their radiances are strongly affected by surface emissivity (εsfc) and skin temperature (Tsfc). Consequently, only 42 temperature-sounding channels selected from channel numbers 1~93 within the CO2 absorption band, covering the spectral range of 700~757.5 cm−1 (13.2~14.3 μm), with weighting-function peak heights above approximately 1.5 km, were assimilated into the KIM data assimilation system. Satellite data assimilation pre-processing was conducted following the procedure outlined by Cho et al. [1], Kim and Kang [37,38], and McNally and Watts [39]. The major pre-processing procedures included cloud detection, bias correction, and spatial thinning. Bias correction was applied to account for spatial discontinuities in the observations and the effects of airmass-dependent biases, and spatial thinning was performed using a 3° × 3° grid. To avoid uncertainties in the simulated radiances influenced by cloud contamination, only clear-sky radiances were considered for assimilation, with a constant observation error of 3.0 K assigned to each channel. Additionally, to minimize slant-path effects, observations with satellite zenith angles (SZA) ≥ 55° were excluded (Table 3).
Forecast skill was evaluated using the root mean square error (RMSE). For each forecast lead time, the RMSE was calculated at each model grid point for an individual pressure level by comparing the forecast with the corresponding NR field. The resulting RMSE fields were then spatially averaged over each verification region (Global, Asia, and East Asia) to obtain a single regional mean RMSE for each verification day. Differences in forecast skill between the experiments were evaluated using a paired Student’s t-test applied to the 21 paired daily regional mean RMSE samples. Statistical significance at the 95% and 99% confidence levels is indicated in the scorecards. As the analysis is based on a one-month OSSE dataset, the effects of temporal and spatial autocorrelation were not explicitly accounted for, and no correction for multiple comparisons was applied.
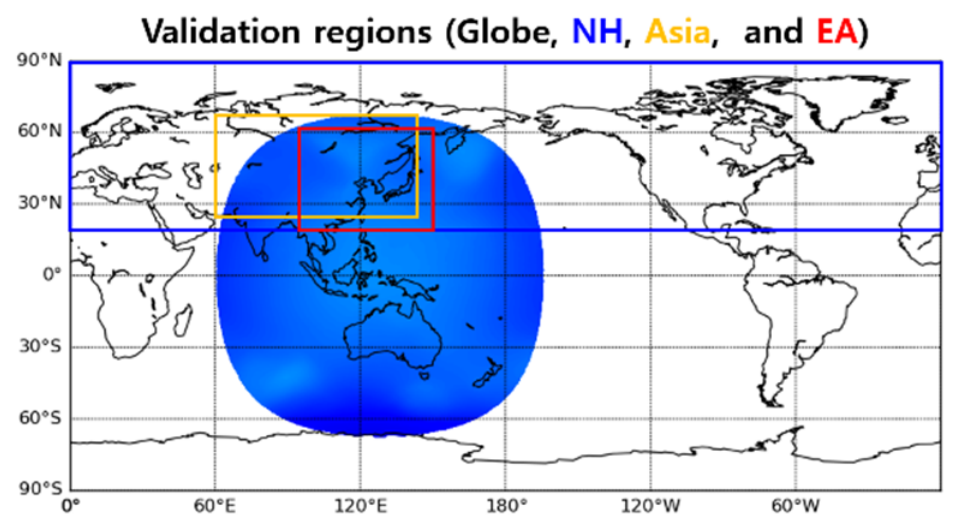
For quantitative analysis, the model improvement rate (%) was calculated using the root mean square error (RMSE) of the CTL (control) and EXP (experiment), with the NR data serving as a reference in Equation (1). Therefore, we examined the impact of simulated GeoHIS observation density on KIM predictions by evaluating data assimilation effect on synoptic scale predictability, using geopotential height, temperature, relative humidity, and wind speed throughout the troposphere. The validation regions were divided as follows: the globe, the Northern Hemisphere (latitude: 20~90°N; longitude: 0~360°E), Asia (25~65°N, 60~145°E), and East Asia (20~55°N, 100~150°E) (Figure 3). The next-generation GeoHIS is positioned at 128.2°E on the equator. Owing to the increased horizontal and vertical observation density in this region, improvements in NWP performance are expected, particularly in the middle and upper troposphere. Consequently, a detailed analysis was performed for these levels.
Improvement rate (%) = (RMSECTL − RMSEEXP)/RMSECTL

3. Results and Discussion

We assessed the impact of the next-generation GeoHIS, which South Korea plans to operate as part of WMO’s Global Ring initiative. For comparison, the GIIRSs onboard the FY-4A and B in China were launched in 2016 and 2021, respectively [3,4]. GIIRS provides observations with a spatial resolution of 12~16 km and a temporal resolution of 45 min to 1 h, over the spectral range of 700~2250 cm−1. This range includes CO2, H2O, O3, N2O, CH4, and CO absorption bands, with a spectral resolution of 0.625 cm−1. Europe, Japan, and the United States plan to operate the Infrared Sounder (IRS), Geostationary Himawari Sounder (GHMS), and GeoXO Sounder (GXS) during the period from 2025 to 2035, respectively [5]. These sensors have specifications similar to those of GIIRS, observing the mid- and long-wave infrared spectral ranges. For full-disk observations, the spatial and temporal resolutions are expected to improve to 4 km and 30 min, respectively (Table 4). Therefore, as GeoHIS technology advances, it is important to evaluate the impact of increased temporal observation density on numerical weather prediction performance.
In the global KIM, observations are assimilated within a 6 h time window. Table 5 lists the simulated observations used in the KIM-OSSE. The observations include satellite-based measurements from microwave (MW)/infrared (IR) imager and sounder, global navigation satellite system (GNSS), and AMV, as well as conventional observations from surface stations, radiosondes, and aircraft. The amount of assimilated GeoHIS data varies depending on the observation frequency. In this study, the forecast impact of GeoHIS observations on KIM was assessed by varying only the temporal sampling frequency while keeping all other observation characteristics unchanged.
The control experiment assimilates observations from the operational global observing system, including hyperspectral infrared sounders carried by polar-orbiting satellites (e.g., IASI and CrIS). Although these instruments provide high-quality atmospheric temperature and moisture soundings, their sun-synchronous orbits result in relatively infrequent revisits over a given location. In contrast, GeoHIS can repeatedly observe the same region with a much higher temporal sampling frequency. The present study therefore focuses on quantifying the additional forecast value associated with increasing the temporal sampling frequency of GeoHIS observations within an otherwise identical observing system and data assimilation framework.
To assess the impact of GeoHIS observation density on numerical model performance, KIM, a global NWP model, was used. Table 6 summarizes the experiment setup for the different observation densities. The model was run globally at a horizontal resolution of 25 km for 1 month, and data from 21 days, from 5th to 25th October, were evaluated to account for spin-up time and the 5-day forecast period. We designed three simulations: CTL, EXP-1, and EXP-2. The CTL simulation was run using only simulated 17 observation types, while EXP-1 and -2 incorporated GeoHIS data assimilated at 1 h and 3 h intervals, respectively. Except for the temporal sampling frequency of the GeoHIS observations, all observation pre-processing, quality-control procedures, radiative-transfer configurations, and data assimilation settings were kept identical between EXP-1 and EXP-2. The two experiments differed only in the temporal sampling frequency of the GeoHIS observations, with EXP-1 assimilating GeoHIS observations approximately 2.3 times more frequently than EXP-2. This study focuses on temperature-sounding channels to directly analyze the impact of satellite data on NWP performance. For satellite data assimilation, 42 channels (1~93) located in the longwave infrared region at 700~757.5 cm−1 (13.2~14.3 μm) were used for the temperature sounding.
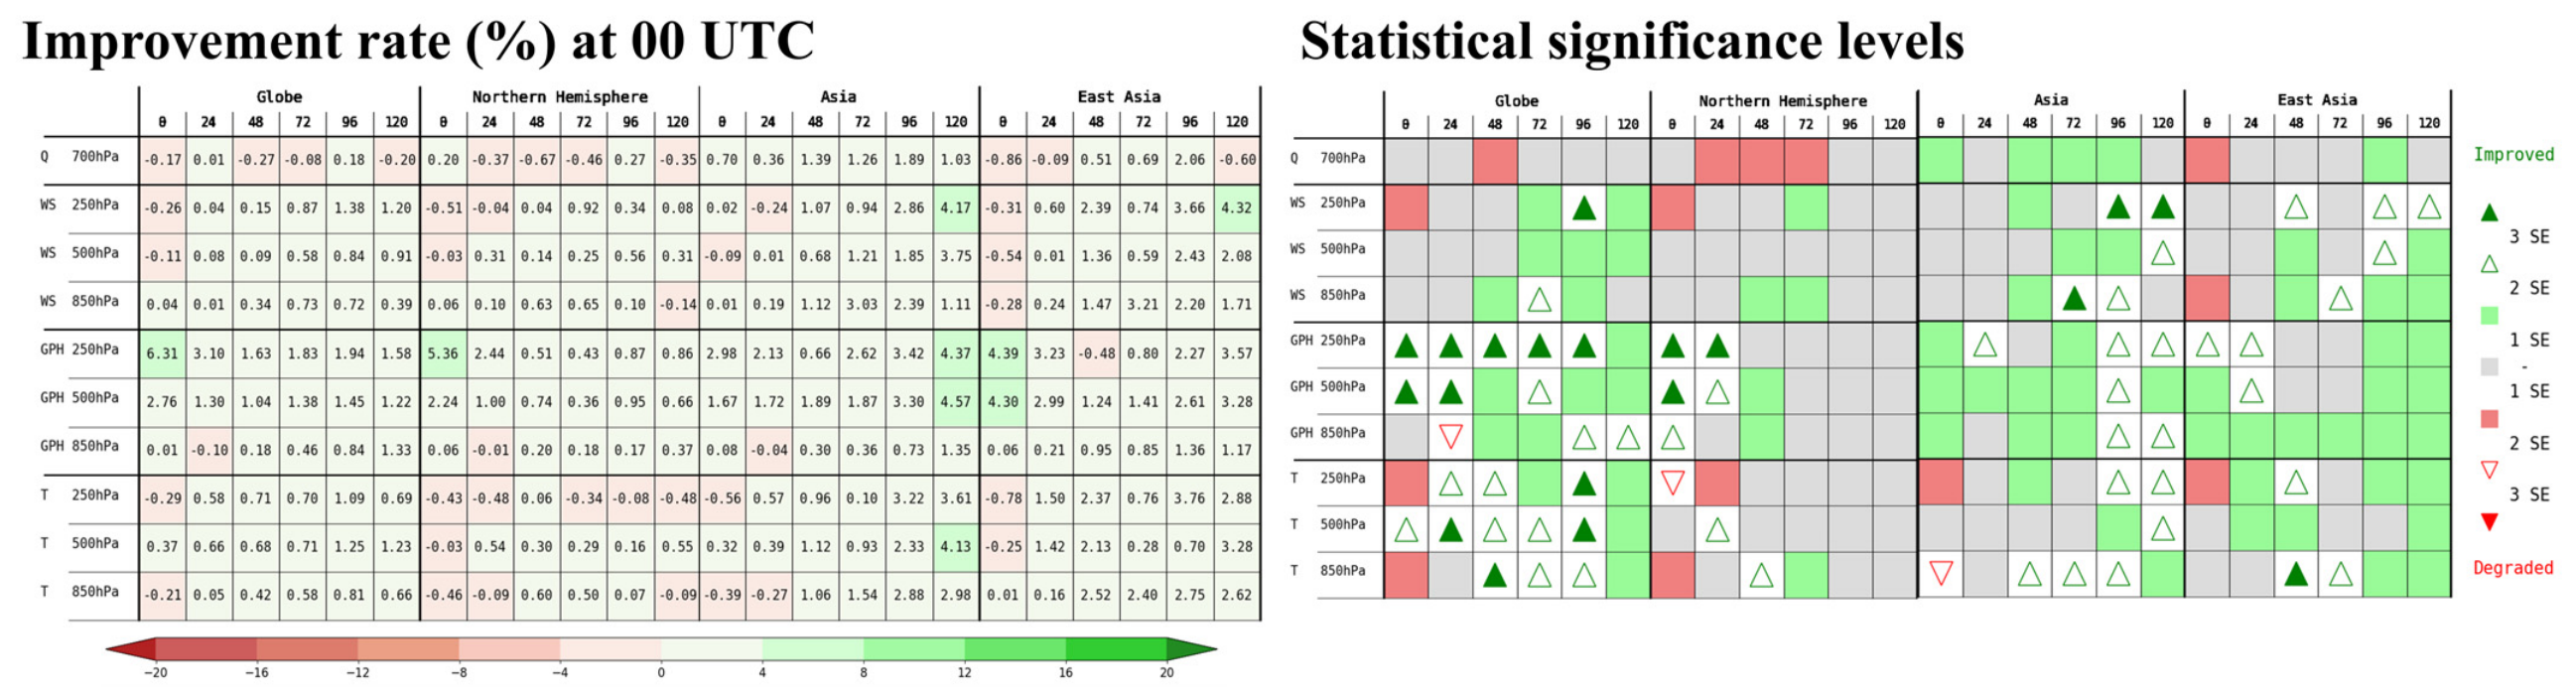
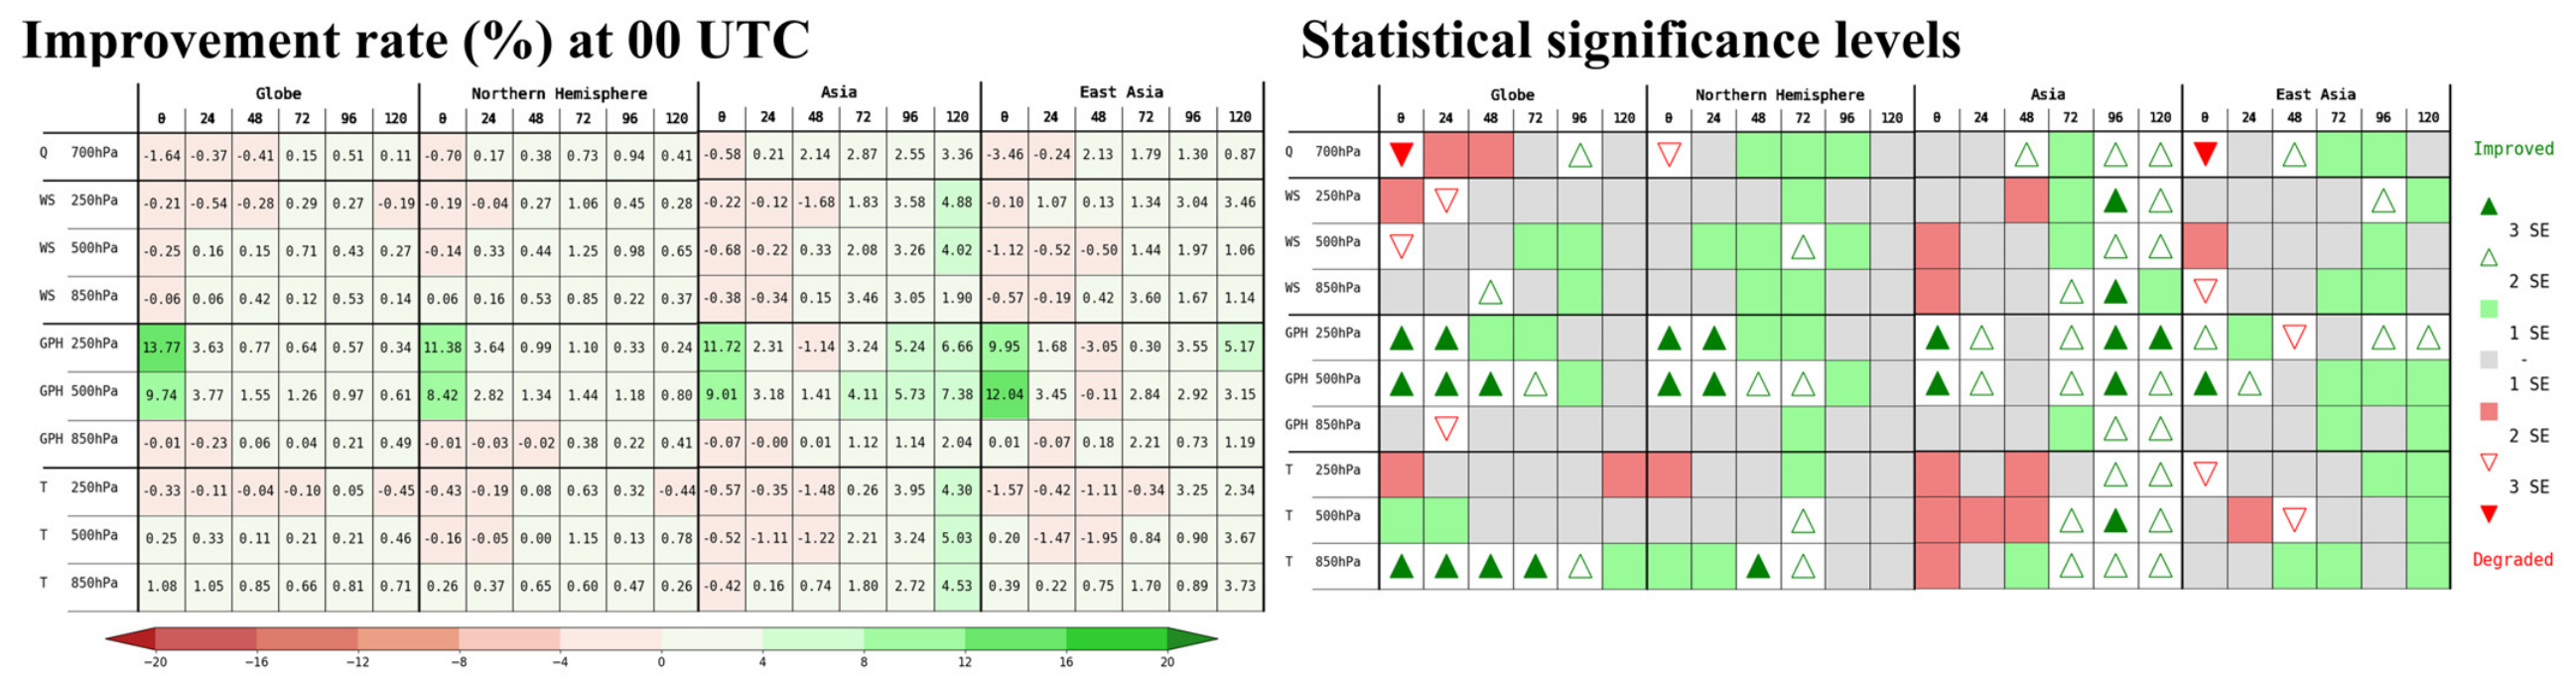
Figure 4 and Figure 5 show the improvement rates on the left and the corresponding statistical significance levels on the right across different spatial domains. The domains are defined as the globe, the Northern Hemisphere (latitude: 20~90°N; longitude: 0~360°E), Asia (25~65°N, 60~145°E), and East Asia (20~55°N, 100~150°E). Figure 4 shows the examined multiple variables at various vertical levels. All values represent the improvement rate of EXP-1 (hourly assimilation) relative to the NR dataset. Higher positive values, indicated in green, reflect improved performance in EXP-1. Noticeable improvements are observed in geopotential height (GPH), particularly in the mid- and upper troposphere (500~250 hPa), while wind (WS), temperature (T), and humidity (Q) remain largely unchanged. Statistically significant improvements were observed at several forecast lead times, particularly for 500 hPa geopotential height over Asia and East Asia. Although improvement rates at the remaining lead times were generally positive, they were not statistically significant and should therefore be interpreted with appropriate caution.
Additionally, we assessed the effect of assimilation temporal resolution by comparing EXP-1 and EXP-2. Figure 5 presents the performance metrics for experiments using 3-hourly temporal resolution data. The findings indicate that using hourly data yields higher forecast improvement rates than those of the 3-hourly data. Noticeable improvements in geopotential height at the 500 hPa level were observed across the globe, the Northern Hemisphere, Asia, and East Asia. Using the 3-hourly dataset, the improvement rates range from 1.0 to 1.5% globally and from 0.4 to 1.0% over the Northern Hemisphere. In the Asia region, the improvement rates for GPH at the mid-troposphere range from 1.7 to 4.6% for 3-hourly assimilation in the 24~120 h forecast period.
The larger improvements in geopotential height than in temperature, humidity, and wind may be attributed to the fact that the assimilated CO2-band infrared radiances primarily constrain the atmospheric temperature structure. Through hydrostatic adjustment, these temperature corrections may be reflected in geopotential height increments, whereas their direct influence on humidity and wind is comparatively weaker.
However, the present study focused on evaluating the forecast sensitivity to the temporal sampling frequency of GeoHIS observations rather than diagnosing the physical mechanisms underlying the data assimilation process. Consequently, assimilation increments, O–B (observation–background) and O–A (observation–analysis) statistics, Jacobian analyses, and diagnostics of the background-error covariance and associated balance constraints were not investigated. These diagnostics would provide valuable insights into the mechanisms through which temperature-sensitive infrared radiances influence the analyzed mass, thermal, and dynamical fields and should therefore be investigated in future studies.
Table 7 summarizes the quantitative impact of GeoHIS data assimilation according to temporal resolutions. The results indicate that hourly assimilation significantly outperforms 3-hourly assimilation in both analysis and forecast fields. Specifically, for the 500 hPa geopotential height, hourly assimilation achieves a substantial improvement of 9.0% in the Asia analysis field, which is statistically significant at the 99% confidence level. This positive impact extends into the forecast period, reaching a maximum improvement of 7.4% at the 120 h forecast time in the Asia region. In contrast, the 3-hourly experiment shows a more limited improvement, peaking at 3.3% during the same period. While the initial impact in the Asia analysis field concerning 850 hPa temperature is negligible, the forecast performance improves over time, with the hourly experiment showing a 4.5% improvement at 120 h forecast time. These findings underscore the importance of high-frequency (hourly) GeoHIS observations in enhancing the accuracy of mid-to-long-range forecasts, especially for GPH and lower-tropospheric temperature over Asia. Forecast improvement for 850 hPa temperature tends to increase with forecast lead time. However, the underlying physical mechanisms responsible for this behavior were not examined in the present study and warrant further investigation.

4. Summary and Conclusions

The KMA plans to operate the GeoHIS satellite as a part of WMO’s Global Ring initiative. The KIM used by the KMA has been the operational global NWP model since 18 April 2020. To assess the impact of GeoHIS on NWP, the KIM-OSSE system was employed based on the global NWP model for simulating observations and running forecast cycles. In this study, we assessed the forecast impact of simulated GeoHIS radiance in KIM based on observation density to inform the effective operation of next-generation satellites. We designed the three experiments—CTL, EXP-1, and EXP-2—to assess the influence of simulated GeoHIS and its assimilation on extended-range forecasts using KIM.
The findings indicate that assimilating simulated GeoHIS observations improves GPH in the mid- to upper troposphere, while temperature (T), humidity (Q), and wind (WS) show relatively neutral impacts. Improvement in GPH is particularly pronounced over the Asia and East Asia regions at analysis time, with average increases of 9% and 12%, respectively. We also examined the sensitivity of the temporal resolution of GeoHIS by comparing hourly data (EXP-1) with 3-hourly data (EXP-2). The results show that higher temporal resolution leads to greater forecast improvements. The improvement rate over the Asia region using hourly (3-hourly) GeoHIS data ranges from 1.4 to 7.4% (1.7 to 4.6%) for geopotential height in the mid-troposphere over the 24–120 h forecast period.
This initial enhancement in the analysis field is associated with sustained forecast improvements throughout the forecast period. As shown in the scorecard, the positive impact on GPH is not only maintained but remains statistically significant (95~99% confidence level) across the entire 120 h forecast period. Notably, the improvement rate for GPH at 500 hPa in Asia reaches its peak of 7.4% at 120 h. This study confirms the positive impact of assimilating simulated GeoHIS observations on forecasts produced by KIM, a global numerical weather prediction model. The present OSSE indicates that increasing the temporal sampling frequency of simulated GeoHIS observations is generally associated with greater forecast improvements, particularly for mid- and upper-tropospheric geopotential height. These results provide quantitative evidence for the additional forecast benefits of increased temporal observation density under the current experimental configuration. Because the analysis is based on a one-month OSSE using a single simulated GeoHIS observing system, the findings should be interpreted within the scope of the present experimental design. Future studies should investigate the physical mechanisms underlying the observed forecast improvements through additional assimilation diagnostics and evaluate the robustness of these findings across multiple seasons, meteorological regimes, and observation configurations. Future work should also focus on improving GeoHIS data assimilation and exploring applications involving double- and multi-GeoHIS satellite configurations, including the optimization of observation schedules and satellite operation strategies. Overall, these findings support the potential value of next-generation GeoHIS observations for improving global numerical weather prediction through enhanced temporal sampling.

Author Contributions

Conceptualization, Y.-J.C.; methodology, Y.-J.C.; software; J.-H.K. and H.-J.H.; validation, Y.-J.C., D.-B.S. and H.-J.H.; formal analysis, Y.-J.C.; investigation, Y.-J.C.; data curation, Y.-J.C., C.-H.K., H.-J.H. and J.-H.K.; writing—original draft preparation, Y.-J.C.; writing—review and editing, Y.-J.C.; visualization, Y.-J.C. and H.-J.H.; supervision, Y.-J.C. and D.-B.S.; project administration, H.-W.C.; funding acquisition, Y.H.L. All authors have read and agreed to the published version of the manuscript.

Funding

This research is supported by the Development of Numerical Weather Prediction and Data Application Techniques (Grant No.: KMA2018-00721) from the Numerical Weather Prediction Center of the Korea Meteorological Administration (KMA).

Data Availability Statement

The ECO1280 nature run data were provided by the Cooperative institute for Research in the Atmosphere/Colorado State University (CIRA/CSU) at https://www.cira.colostate.edu/imagery-data/ecmwf-nature-run/ (accessed on 5 September 2022).

Acknowledgments

The authors acknowledge support from the Development of Numerical Weather Prediction and Data Application Techniques (Grant No.: KMA2018-00721). We thank ECMWF for producing and CIRA/CSU for distributing the ECO1280 nature run.

Conflicts of Interest

The authors declare no conflicts of interest.

References

  1. Cho, Y.-J.; Han, H.-J.; Kim, C.-H.; Chun, H.-W.; Kang, J.-H.; Son, J.-Y.; Lee, Y.H. Forecast Impact of the Geostationary Hyperspectral Infrared Sounder (GeoHIS) using the Korean Integrated Model-Observing System Simulation Experiment (KIM-OSSE). Atmosphere 2025, 35, 39–49, (In Korean with English abstract). [Google Scholar] [CrossRef]
  2. National Meteorological Satellite Center (NMSC). Medium and Long-Term Development Plan of National Meteorological Satellite Center; National Meteorological Satellite Center: Jincheon, Republic of Korea, 2023; p. 74. [Google Scholar]
  3. WMO. Vision for the WMO Integrated Global Observing System in 2040; WMO Document No. 1243; World Meteorological Organization: Geneva, Switzerland, 2019; p. 47. [Google Scholar]
  4. Li, J.; Menzel, W.P.; Schmit, T.J.; Schmetz, J. Applications of Geostationary Hyperspectral Infrared Sounder Observations: Progress, Challenges, and Future Perspectives. Bull. Am. Meteorol. Soc. 2022, 103, E2733–E2755. [Google Scholar] [CrossRef]
  5. Yang, J.; Zhang, Z.; Wei, C.; Lu, F.; Guo, Q. Introducing the New Generation of Chinese Geostationary Weather Satellites, Fengyun-4. Bull. Am. Meteorol. Soc. 2017, 98, 1637–1658. [Google Scholar] [CrossRef]
  6. Holmlund, K.; Grandell, J.; Schmetz, J.; Stuhlmann, R.; Bojkov, B.; Munro, R.; Lekouara, M.; Coppens, D.; Viticchie, B.; August, T.; et al. Meteosat Third Generation (MTG): Continuation and Innovation of Observations from Geostationary Orbit. Bull. Am. Meteorol. Soc. 2021, 102, E990–E1015. [Google Scholar] [CrossRef]
  7. Bessho, K.; Owada, H.; Okamoto, K.; Fujita, T. Himawari-8/9 Follow-On Satellite Program and Impacts of Potential Usage of Hyperspectral IR Sounder. In Proceedings of the 2021 IEEE International Geoscience and Remote Sensing Symposium (IGARSS), Brussels, Belgium, 11–16 July 2021; pp. 1507–1510. [Google Scholar] [CrossRef]
  8. Adkins, J.; Alsheimer, F.; Ardanuy, P.; Boukabara, S.; Casey, S.; Coakley, M.; Conran, J.; Cucurull, L.; Daniels, J.; Ditchek, S.D.; et al. Geostationary Extended Observations (GeoXO) Hyperspectral Infrared Sounder Value Assessment Report; NOAA Technical Report; National Oceanic and Atmospheric Administration: Silver Spring, MD, USA, 2021; p. 103.
  9. Iturbide-Sanchez, F.; Wang, Z.; Kalluri, S.; Chen, Y.; Lynch, E.; Divakarla, M.; Tan, C.; Zhu, T.; Cao, C. Exploration of a Future NOAA Infrared Sounder in Geostationary Earth Orbit. IEEE J. Sel. Top. Appl. Earth Obs. Remote Sens. 2022, 15, 1543–1561. [Google Scholar] [CrossRef]
  10. Cho, Y.-J.; Shin, D.-B.; Kwon, T.-Y.; Ha, J.-C.; Cho, C.-H. Retrieval of Thermal Tropopause Height Using Temperature Profile Derived from AMSU-A of Aqua Satellite and Its Application. Atmosphere 2014, 24, 523–532, (In Korean with English abstract). [Google Scholar] [CrossRef][Green Version]
  11. Cho, Y.-J.; Jang, H.-S.; Ha, J.-C.; Choi, R.K.Y.; Kim, K.-H.; Lim, E.; Yun, J.-H.; Lee, J.-I.; Seong, J.-I. Estimation of Oceanic Total Precipitable Water from HALE UAV. Atmosphere 2017, 27, 359–370, (In Korean with English abstract). [Google Scholar] [CrossRef]
  12. Schmit, T.J.; Li, J.; Ackerman, S.A.; Gurka, J.J. High-Spectral- and High-Temporal-Resolution Infrared Measurements from Geostationary Orbit. J. Atmos. Ocean. Technol. 2009, 26, 2273–2292. [Google Scholar] [CrossRef]
  13. Li, J.; Liu, C.-Y.; Zhang, P.; Schmit, T.J. Applications of Full Resolution Space-Based Advanced Infrared Sounding in the Preconvection Environment. Weather Forecast. 2012, 27, 515–524. [Google Scholar] [CrossRef]
  14. Kahn, B.H.; Berndt, E.B.; Case, J.L.; Kalmus, P.M.; Richardson, M.T. A Nowcasting Approach for Low-Earth-Orbiting Hyperspectral Infrared Soundings within the Convective Environment. Weather Forecast. 2023, 38, 1295–1312. [Google Scholar] [CrossRef]
  15. Menzel, W.P.; Schmit, T.J.; Zhang, P.; Li, J. Satellite-Based Atmospheric Infrared Sounder Development and Applications. Bull. Am. Meteorol. Soc. 2018, 99, 583–603. [Google Scholar] [CrossRef]
  16. Li, J.; Geer, A.J.; Okamoto, K.; Otkin, J.A.; Liu, Z.; Han, W.; Wang, P. Satellite All-Sky Infrared Radiance Assimilation: Recent Progress and Future Perspectives. Adv. Atmos. Sci. 2021, 39, 9–21. [Google Scholar] [CrossRef]
  17. Eresmaa, R.; Letertre-Danczak, J.; Lupu, C.; Bormann, N.; McNally, A. The Assimilation of Cross-Track Infrared Sounder Radiances at ECMWF. Q. J. R. Meteorol. Soc. 2017, 143, 3177–3188. [Google Scholar] [CrossRef]
  18. Hilton, F.; Atkinson, N.C.; English, S.J.; Eyre, J.R. Assimilation of IASI at the Met Office and Assessment of Its Impact through Observing System Experiments. Q. J. R. Meteorol. Soc. 2009, 135, 495–505. [Google Scholar] [CrossRef]
  19. Chahine, M.T.; Pagano, T.S.; Aumann, H.H.; Atlas, R.; Barnet, C.; Blaisdell, J.; Chen, L.; Divakarla, M.; Fetzer, E.J.; Goldberg, M.; et al. AIRS: Improving Weather Forecasting and Providing New Data on Greenhouse Gases. Bull. Am. Meteorol. Soc. 2006, 87, 911–926. [Google Scholar] [CrossRef]
  20. Eyre, J.R.; English, S.J.; Forsythe, M. Assimilation of Satellite Data in Numerical Weather Prediction. Part I: The Early Years. Q. J. R. Meteorol. Soc. 2020, 146, 49–68. [Google Scholar] [CrossRef]
  21. Eyre, J.R.; Bell, W.; Cotton, J.; English, S.J.; Forsythe, M.; Healy, S.B.; Pavelin, E.G. Assimilation of Satellite Data in Numerical Weather Prediction. Part II: Recent Years. Q. J. R. Meteorol. Soc. 2022, 148, 521–556. [Google Scholar] [CrossRef]
  22. Joo, S.; Eyre, J.; Marriott, R. The Impact of MetOp and Other Satellite Data within the Met Office Global NWP System Using an Adjoint-Based Sensitivity Method. Mon. Weather Rev. 2013, 141, 3331–3342. [Google Scholar] [CrossRef]
  23. Eresmaa, R. Imager-Assisted Cloud Detection for Assimilation of Infrared Atmospheric Sounding Interferometer Radiances. Q. J. R. Meteorol. Soc. 2014, 140, 2342–2352. [Google Scholar] [CrossRef]
  24. Okamoto, K.; Owada, H.; Fujita, T.; Kazumori, M.; Otsuka, M.; Seko, H.; Ota, Y.; Uekiyo, N.; Ishimoto, H.; Hayashi, M.; et al. Assessment of the Potential Impact of a Hyperspectral Infrared Sounder on the Himawari Follow-On Geostationary Satellite. SOLA 2020, 16, 162–168. [Google Scholar] [CrossRef]
  25. Noh, Y.-C.; Huang, H.-L.; Goldberg, M.D. Refinement of CrIS Channel Selection for Global Data Assimilation and Its Impact on the Global Weather Forecast. Weather Forecast. 2021, 36, 1405–1429. [Google Scholar] [CrossRef]
  26. Hoffman, R.N.; Atlas, R. Future Observing System Simulation Experiments. Bull. Am. Meteorol. Soc. 2016, 97, 1601–1616. [Google Scholar] [CrossRef]
  27. Yin, R.; Han, W.; Gao, Z.; Di, D. The Evaluation of FY4A’s Geostationary Interferometric Infrared Sounder (GIIRS) Long-Wave Temperature Sounding Channels Using the GRAPES Global 4D-Var. Q. J. R. Meteorol. Soc. 2020, 146, 1459–1476. [Google Scholar] [CrossRef]
  28. Coopmann, O.; Fourrie, N.; Chambon, P.; Vidot, J.; Brousseau, P.; Marter, M.; Birman, C. Preparing the Assimilation of the Future MTG-IRS Sounder into the Mesoscale Numerical Weather Prediction AROME Model. Q. J. R. Meteorol. Soc. 2023, 149, 3110–3134. [Google Scholar] [CrossRef]
  29. Lindsey, D.T.; Heidinger, A.K.; Sullivan, P.C.; McCorkel, J.; Schmit, T.J.; Tomlinson, M.; Vandermeulen, R.; Frost, G.J.; Kondragunta, S.; Rudlosky, S. GeoXO: NOAA’s Future Geostationary Satellite System. Bull. Am. Meteorol. Soc. 2024, 105, E660–E679. [Google Scholar] [CrossRef]
  30. McGrath-Spangler, E.L.; McCarty, W.; Privé, N.C.; Moradi, I.; Karpowicz, B.M.; McCorkel, J. Using OSSEs to Evaluate the Impacts of Geostationary Infrared Sounders. J. Atmos. Ocean. Technol. 2022, 39, 1903–1918. [Google Scholar] [CrossRef]
  31. Zhou, L.; Lei, L.; Whitaker, J.S.; Tan, Z.-M. An Adaptive Channel Selection Method for Assimilating Hyperspectral Infrared Radiances. Mon. Weather Rev. 2024, 152, 793–810. [Google Scholar] [CrossRef]
  32. McGrath-Spangler, E.L.; Prive, N.C.; Karpowicz, B.M.; Moradi, I.; Heidinger, A.K. Using OSSEs to Evaluate GXS Impact in the Context of International Coordination. J. Atmos. Ocean. Technol. 2024, 41, 261–278. [Google Scholar] [CrossRef]
  33. Hong, S.-Y.; Kwon, Y.C.; Kim, T.-H.; Kim, J.-E.E.; Choi, S.-J.; Kwon, I.-H.; Kim, J.; Lee, E.-H.; Park, R.-S.; Kim, D.-I. The Korean Integrated Model (KIM) System for Global Weather Forecasting. Asia-Pac. J. Atmos. Sci. 2018, 54, 267–292. [Google Scholar] [CrossRef]
  34. Han, H.-J.; Kang, J.-H.; Kwon, I.-H. Development of Global Observing System Simulation Experiment (OSSE) System Using Korea Integrated Model (KIM): Description and Preliminary Result. In Proceedings of the AOGS 2023 20th Annual Meeting, Singapore, 30 July–4 August 2023. Abstract AS07–A027. [Google Scholar]
  35. Hoffman, R.N.; Malardel, S.; Peevey, T. New 14-Month Forecast Available for Research. ECMWF Newsl. 2019, 158, Winter 2019. [Google Scholar]
  36. Hocking, J.; Vidot, J.; Brunel, P.; Roquet, P.; Silveira, B.; Turner, E.; Lupu, C. A New Gas Absorption Optical Depth Parameterisation for RTTOV Version 13. Geosci. Model Dev. 2021, 14, 2899–2915. [Google Scholar] [CrossRef]
  37. Kim, H.-S.; Kang, J.-H. Development of Data Preprocessing System for GIIRS/FY-4A. In Proceedings of the 2022 EUMETSAT Conference, Brussels, Belgium, 19–23 September 2022. [Google Scholar]
  38. Kim, H.-S.; Kang, J.-H. Development of Assimilation Techniques for the First GEO Hyperspectral IR Sounder (GIIRS/FY-4A). In Proceedings of the 2022 KIAPS International Symposium on the Global NWP System Modeling, Seoul, Republic of Korea, 14–16 November 2022. [Google Scholar]
  39. McNally, A.P.; Watts, P.D. A Cloud Detection Algorithm for High-Spectral-Resolution Infrared Sounders. Q. J. R. Meteorol. Soc. 2003, 129, 3411–3423. [Google Scholar] [CrossRef]
Figure 1. Schematic diagram of GeoHIS observation coverage. GeoHIS observation density is high over the East Asia region (yellow box) owing to coverage by the GK-S (Korea; blue shaded), FY-4B (China; left red line), and Himawari-10 (Japan; right red line) satellites.
Remotesensing 18 02685 g001
Figure 2. Experimental flow chart using KIM-OSSE.
Remotesensing 18 02685 g002
Figure 3. Validation regions on the globe, the Northern Hemisphere (latitude: 20~90°N; longitude: 0~360°E), Asia (25~65°N, 60~145°E), and East Asia (20~55°N, 100~150°E).
Remotesensing 18 02685 g003
Figure 4. Scorecard showing improvement rates (%) of EXP-1 and statistical significance levels (1~3σ, approximately 68~99%) for atmospheric variables across regions at 0000 UTC during 5~25 October 2015. T, GPH, WS, and Q denote temperature (K), geopotential height (m), wind speed (m s−1), and relative humidity (%), respectively. Positive values and green shading indicate improvement.
Remotesensing 18 02685 g004
Figure 5. Same as Figure 4 except for the 3-hourly temporal resolution of GeoHIS (EXP-2).
Remotesensing 18 02685 g005
Table 1. ECO1280 NR dataset distributed by CIRA/CSU.
ModelResolutionPeriod
ECMWF
(IFS cycle 43r1)
Horizontal: 9 km
Vertical: 137 layers
14 months (30 September 2015~30 November 2016)
-
October 2015 (1 month): 1 h interval
-
Others: 3 h int.
Table 2. Specifications of the simulated GeoHIS radiances for the KIM data assimilation.
Satellite LocationSpatial and Temporal Res.Number of Channels
(Channel Number)
Lat.: 0°N, Lon.: 128.2°E (GK2A)16 km and
1 h
42 within the 700~757.5 cm−1
(Ch 1~8, 11~17, 19, 21, 25, 27, 29, 31, 33, 35~45, 53, 55, 57, 59, 61, 64, 67, 81, 93)
Table 3. Pre-processing and quality control procedures in the KIM experiments.
Cloud screeningIR-based detection scheme developed by ECMWF
Observation error3.0K
Bias correctionAirmass bias correction from geopotential height thickness of 300~500 hPa and 200~500 hPa
Quality controlO-B outlier, high land area
Thinning resolution3.0°
Satellite zenith angle (SZA)Observations with SZA ≥ 55° were excluded
Table 4. List of GeoHIS satellites related to the Global Ring vision.
EuropeChinaSouth KoreaJapanUSA
Location0°E105°E128.2°E140.7°E105°W
InstrumentIRSGIIRS-GHMSGXS
PlatformMTG-SFY-4BGK-SHimawari-10GeoXO-Central
Launch20252021203620282035
Table 5. List of simulated observation types used in the KIM experiments.
ExperimentsObservation Types
CTL
(17 observation types)
1–4. MW sounder: AMSU-A, ATMS, MHS, MWHS2
5. MW imager: AMSR2
6–7. IR sounder: IASI, CrIS
8. AMV (atmospheric motion vector)
9. Scatterometer: SCAT Wind
10–12. IR imager: CSR */GK-2A, CSR/Himawari, CSR/MSG
13–14. GNSS: GNSS RO, ground-based
15–17. Conventional observation: surface, radiosonde, aircraft
EXP
(18 observation types)
18. IR sounder (GeoHIS) + CTL
* CSR: clear-sky radiance.
Table 6. KIM experiment setup in this study.
CTLEXP-1EXP-2
Data17 observation types
Conventional + Satellites
18 observation types
CTL + GeoHIS (1 h interval)
18 observation types
CTL + GeoHIS (3 h interval)
ModelKIM-OSSE (NE180, horizontal and vertical resolution: 25 km and 91 layers)
Data assimilationH4DEV (Hybrid 4D Ensemble Variational Data Assimilation, NE090 50 km)
Experiment and
verification period
Experiment:30 September 2015~31 October 2015.
Verification: 5 October 2015~25 October 2015.
Table 7. The impact of GeoHIS in analysis and forecast fields at 00 UTC according to hourly and 3-hourly temporal resolutions over the globe and Asia region. The symbols ** and * indicate the level of significance corresponding to 99% and 95% confidence levels, respectively.
VariableRegionAnalysis FieldForecast Lead Time from 24 to 120 h
(Max. Forecast Lead Time with >95% Significance)
Hourly3-HourlyHourly3-Hourly
Geopotential height
(500 hPa)
Globe9.7% **2.8% **0.6~3.8%
(1.3% * @72 h)
1.0~1.5%
(1.4% * @72 h)
Asia9.0% **1.7%1.4~7.4%
(7.4% * @120 h)
1.7~4.6%
(3.3% * @96 h)
Temperature
(850 hPa)
Globe1.1% **−0.2%0.7~1.1%
(0.8% * @96 h)
0.1~0.8%
(0.8% * @96 h)
Asia−0.4% −0.4% *0.2~4.5%
(4.5% * @120 h)
−0.3~3.0%
(2.9% * @96 h)
Disclaimer/Publisher’s Note: The statements, opinions and data contained in all publications are solely those of the individual author(s) and contributor(s) and not of MDPI and/or the editor(s). MDPI and/or the editor(s) disclaim responsibility for any injury to people or property resulting from any ideas, methods, instructions or products referred to in the content.