Article

Urban Modulation of Cloud-to-Ground Lightning Activity in a Megacity Revealed by Multi-Source Observations

1
School of Big Data and Statistics, Tongling University, Tongling 244000, China
2
Key Laboratory of Urban Meteorology, China Meteorological Administration, Beijing 100089, China
3
School of Earth and Space Sciences, University of Science and Technology of China, Hefei 230026, China
*
Author to whom correspondence should be addressed.
Remote Sens. 2026, 18(16), 2705; https://doi.org/10.3390/rs18162705
Submission received: 10 June 2026 / Revised: 17 July 2026 / Accepted: 22 July 2026 / Published: 11 August 2026

Abstract

Urbanization can modify the near-surface environment for thunderstorm development, but how megacity surfaces affect the spatial distribution of cloud-to-ground (CG) lightning within urban areas remains unclear. Taking Beijing as a representative megacity, this study uses multi-source observations, including CG lightning flashes, automatic weather station (AWS) observations, radar data, reanalysis, urban land-use classification data, and DEM data, to examine the spatiotemporal characteristics of CG lightning and their relationships with the urban thermal–dynamic environment, synoptic background, and thunderstorm evolution. The results show that 304 thunderstorms passed over or affected the Beijing built-up area, producing 6.96 × 10⁴ CG flashes within the analysis domain. CG lightning exhibited clear interannual variability and reached its diurnal peak from late afternoon to early evening. However, high-density CG flash centers did not persistently occur over the urban core, but were more frequently located near the built-up edge and adjacent transition zones. Urban heat island intensity (UHII) partly corresponded to the diurnal variation in CG lightning, but its interannual and spatial relationships with CG activity were weak. Further analysis suggests that, under a weak background, higher pre-storm UHII and lower wind speed (WS) may help to maintain local convergence and upward motion, which may partly contribute to increased CG lightning within the urban core. In contrast, under the strong synoptic background, bifurcated thunderstorms were associated with lower pre-storm UHII, higher pre-storm WS, and CG lightning concentrated near the urban edge. These findings improve our understanding of how megacity surfaces may modulate thunderstorm-related CG lightning activity and provide observational context for spatially differentiated lightning monitoring within urban areas.

1. Introduction

Urbanization substantially modifies land-surface properties and the near-surface atmospheric environment. When natural surfaces are replaced by impervious materials and building complexes, surface energy balance, aerodynamic roughness, boundary layer structure, and local circulation can all be altered [1]. Population concentration, energy consumption, and anthropogenic heat release further enhance thermal and dynamical contrasts between urban and surrounding rural areas, leading to pronounced spatial heterogeneity in the urban thermal environment [2,3,4]. These urban-induced changes in the underlying surface and boundary layer not only affect the urban thermal environment, but may also modulate the initiation, development, and movement of thunderstorms passing over cities [5,6,7]. Cloud-to-ground (CG) lightning directly affects surface targets and poses risks to urban buildings, transportation systems, power facilities, and public safety. Therefore, understanding how megacity environments influence CG lightning activity is important for urban meteorological hazard assessment and disaster prevention.
Previous studies have shown that lightning activity in and around urban areas often differs from that in surrounding rural regions. Westcott [8] reported urban-related characteristics of summertime CG lightning around major cities in the Midwestern United States. Soriano & de Pablo [9] and Pinto et al. [10] also found that urban environments may affect CG lightning activity over small cities in central Spain and over Belo Horizonte, Brazil, respectively. For Beijing, Wang et al. [11] showed through a case study that urban effects could enhance CG lightning activity, while Shi et al. [12] further discussed how the urban barrier effect may alter the spatial pattern of CG lightning over the Beijing metropolis. The urban heat island (UHI) is commonly considered an important pathway through which cities affect convection and lightning. A stronger urban thermal perturbation can increase near-surface instability, promote low-level convergence and upward motion, and provide favorable thermal conditions for thunderstorm development under suitable synoptic backgrounds [5,6,13]. In addition to thermal effects, increased roughness caused by urban buildings, spatial heterogeneity of the underlying surface, and urban–rural dynamical contrasts may also modify near-surface wind fields, convergence locations, boundary layer height, and thunderstorm propagation paths [12,14,15]. Thus, the urban influence on lightning activity is unlikely to result from a single thermal factor, but rather reflects the combined effects of urban thermal conditions, near-surface dynamical perturbations, and background atmospheric environments.
However, several questions remain regarding how urban environments influence the spatial distribution of CG lightning. Many previous studies have examined urban effects from a city-scale perspective by comparing lightning activity between urban and non-urban areas or by evaluating the overall influence of cities on lightning frequency and spatial patterns [8,9,10,11]. These studies provide useful evidence that cities can act as underlying surface perturbations to convection and lightning, but they have paid relatively little attention to the role of the internal urban spatial structure, especially in megacities. For a megacity such as Beijing, the built-up area is not a homogeneous surface. Clear gradients exist among the urban core, built-up edge, and adjacent suburban areas in the impervious surface fraction, building density, aerodynamic roughness, near-surface WS, and thermal conditions [16,17]. This implies that the response of CG lightning to urban surfaces may not appear simply as an overall urban enhancement, but may depend on the thermal and dynamical environments encountered by thunderstorms as they pass different parts of the city. In addition, thunderstorm passage is affected by synoptic background, moisture supply, convective instability, wind shear, and cold pool outflows. Different thunderstorm systems may therefore exhibit different patterns of movement, development, weakening, splitting, and detouring [18,19,20]. These storm-scale processes can further reshape the final distribution of CG lightning within and around the urban area. It is therefore necessary to combine long-term statistical analysis with near-surface thermal–dynamic conditions and thunderstorm evolution to better understand how megacity environments modulate CG lightning activity.
Beijing is a typical megacity in North China, characterized by a dense built-up area, strong urban–suburban surface contrasts, and complex surrounding terrain. Previous studies have shown that summer thunderstorms occur frequently in Beijing, and their initiation and development are influenced by regional circulation, topography, environmental conditions, and urban boundary layer processes [7,15,21,22]. Beijing also has a relatively comprehensive multi-source observational database, including CG lightning location data, AWS observations, Doppler radar data, and reanalysis datasets, which provides an opportunity to examine the relationship between urban environments and thunderstorm-related CG lightning activity [23,24]. In this study, the Beijing built-up area and its surrounding regions are selected as the study domain. First, multiyear CG lightning location data are used to analyze the interannual variation, diurnal cycle, and spatial distribution of CG lightning activity, with reference to previous climatological studies of lightning over Beijing. Second, automatic weather station observations are used to compare the temporal evolution and spatial correspondence among UHII, near-surface WS, and CG lightning activity. Third, reanalysis data are used to characterize the synoptic and thermal–dynamic environments, while Doppler radar observations are used to identify storm organization and evolution during urban passage. Based on these analyses, this study examines the possible modulation of CG lightning activity by the megacity environment from three perspectives: long-term lightning statistics, near-surface thermal–dynamic conditions, and thunderstorm evolution.

2. Data and Methodology

2.1. Study Area

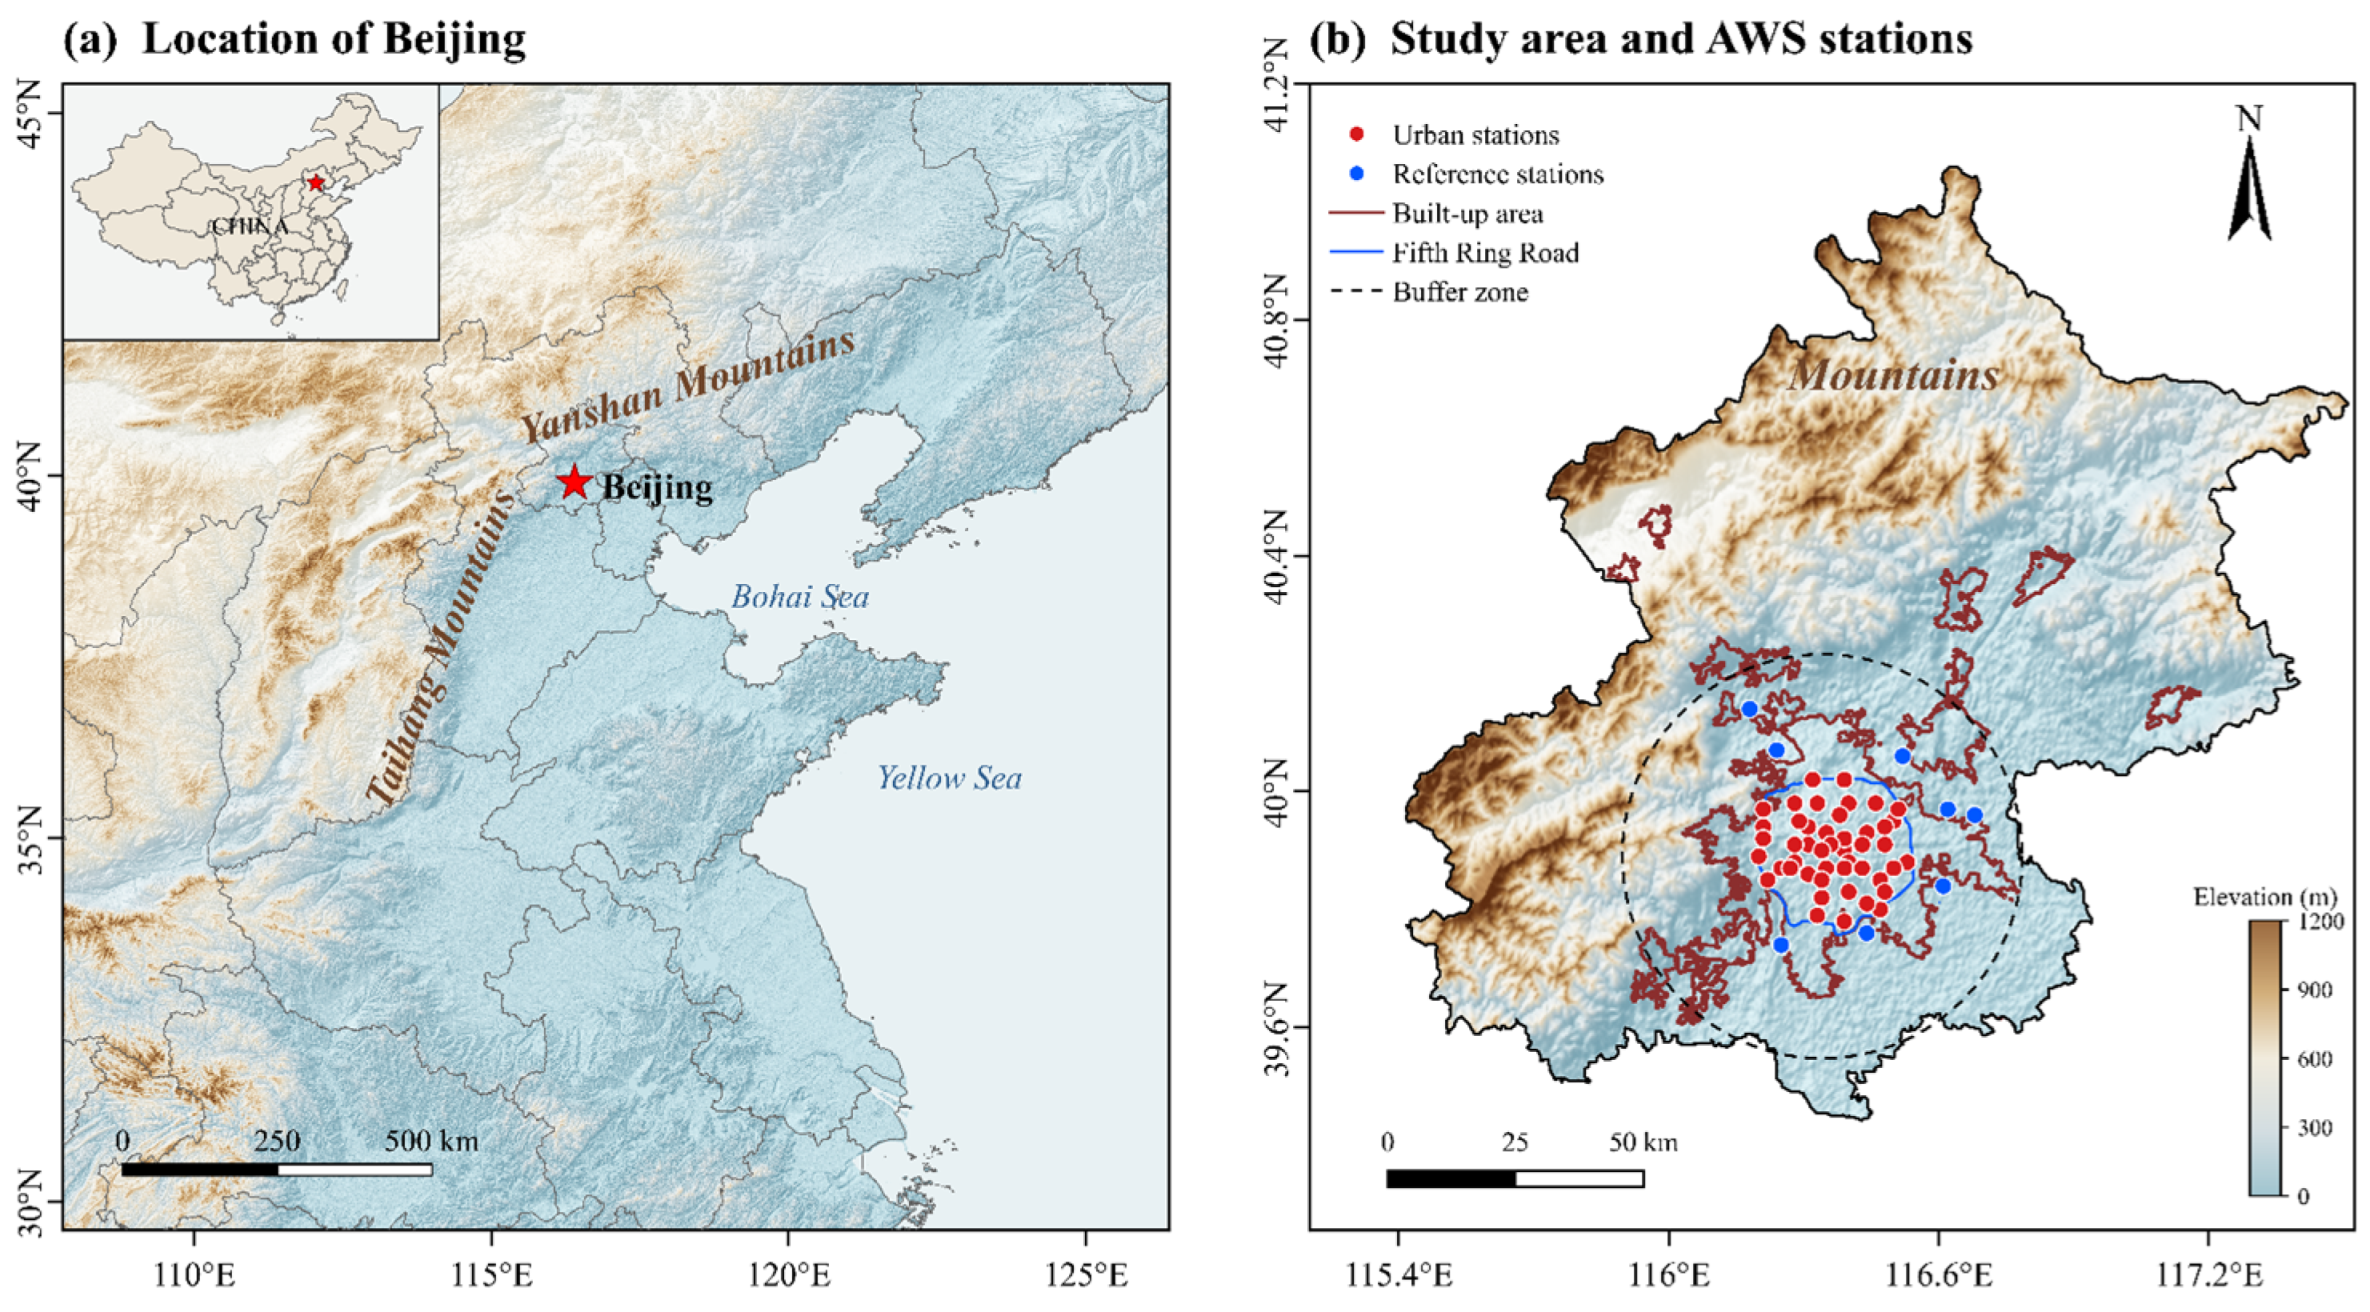
Beijing is a highly urbanized megacity in North China, with a population exceeding 20 million and a built-up area of more than 1400 km2 by 2022. The city has a warm temperate monsoon climate, with an annual mean temperature of about 10–12 °C and annual precipitation exceeding 600 mm. Thunderstorms are strongly seasonal, with most events occurring in summer. Beijing is surrounded by the Taihang and Yanshan Mountains on three sides, and this terrain can affect low-level airflow, convergence, and thunderstorm movement from mountain to plain [21]. The built-up area and its surrounding buffer zone were used as the main analysis domain (Figure 1). The buffer zone represents the urban fringe and nearby transition area, supporting comparisons of CG lightning activity and meteorological conditions between the urbanized surface and its surroundings.

2.2. Remote-Sensing Data

Remote-sensing-derived geospatial datasets were used to characterize the urban underlying surface and regional topographic background of Beijing. The built-up area was extracted from the China Land-Cover Dataset (CLCD), a 30 m annual land-cover product for China developed from Landsat imagery using long-term training samples and classification procedures [25]. In this study, the built-up area refers to all CLCD-derived built-up land, whereas the urban core refers to the main continuously built-up area broadly enclosed by the Fifth Ring Road. The Fifth Ring Road was used only as the operational boundary for selecting urban AWS stations. The CLCD-derived built-up boundary was used to analyze CG lightning over urbanized surfaces and to define the surrounding buffer zone.
Digital elevation model (DEM) data were used to describe the regional terrain surrounding Beijing. The DEM was resampled and projected to the same geographic coordinate system as the land-cover, lightning, and station datasets. It was mainly used for visualizing the terrain in Figure 1 and for interpreting the possible influence of the Taihang and Yanshan Mountains on thunderstorm movement from mountain to plain. Because Beijing is surrounded by mountains on three sides, the DEM provides the necessary topographic context for later analyses of thunderstorm passage, storm splitting, and the peripheral distribution of CG lightning.

2.3. Lightning and Radar Data

CG lightning data were obtained from the State Grid Lightning Network (SGLNET). SGLNET automatically records the occurrence time, location, peak current, and polarity of each detected CG flash. Only CG flashes identified by SGLNET were used. Positive and negative flashes were defined according to the sign of the reported peak current. By the end of 2015, SGLNET comprised 45 central stations and 776 detection stations, providing nationwide monitoring coverage. The CG density maps in this study were calculated directly from the geolocated flash records. In this study, SGLNET data from 2010 to 2021 were used to examine CG lightning activity over the Beijing metropolitan area. Following Wang et al. [11], the dataset was used to identify the temporal variation, spatial density, polarity, and intensity of CG flashes within and around the built-up area. Published evaluations of a comparable power sector lightning location system, based on artificially triggered lightning and natural lightning striking tall structures, reported a flash detection efficiency of approximately 94%, a stroke detection efficiency of approximately 60%, and mean and median location errors of approximately 710 and 489 m, respectively [26]. To reduce possible contamination from intra cloud discharges, CG flashes with peak currents between −10 and 10 kA were excluded, following common lightning screening practices [27,28].
Doppler radar observations were used to describe the evolution of thunderstorm systems passing over Beijing. The radar data were the composite reflectivity (CR) product from the operational CINRAD/SA S-band Doppler weather radar at Beijing Nanjiao Observatory, with a temporal resolution of 6 min and a horizontal spatial resolution of 1 km × 1 km. Thunderstorm events included in this study were those for which consecutive radar echoes and associated CG lightning activity were judged to have passed over the built-up area. A thunderstorm was classified as a bifurcated thunderstorm (BT) when an initially connected convective echo separated into two distinguishable branches during passage over or near the built-up area, the connecting echo bridge progressively narrowed or disappeared, and the two branches continued to move apart in consecutive radar scans. Events without such persistent separation were classified as ordinary thunderstorms (OTs). These radar data were mainly used in the event-scale analysis to examine whether storm splitting or detouring near the urban edge contributed to the peripheral enhancement of CG lightning. Thus, SGLNET provides the lightning occurrence information, while Doppler radar observations provide the storm structure context needed to interpret the spatial redistribution of CG lightning during urban passage.

2.4. Other Data

Hourly automatic weather station (AWS) observations were obtained from the China Meteorological Data Service Centre and used to characterize near-surface thermal and dynamical conditions over Beijing. The variables used in this study include 2 m air temperature, 10 m wind speed, and wind direction. Before analysis, the AWS observations were subjected to physical range, temporal consistency, and neighboring station consistency checks. Records outside physically reasonable ranges, or showing isolated temporal changes that were clearly inconsistent with synchronous observations from the five nearest stations, were treated as invalid. Large or rapidly varying values during thunderstorms were retained when they showed reasonable temporal continuity or were supported by nearby observations, rather than being removed solely because of their magnitude. Stations with less than 90% valid records were excluded. Continuous gaps of no more than 2 h were filled using the mean of synchronous observations from the five nearest available stations, following Xu et al. [29], whereas longer gaps were not interpolated. These AWS data were used to calculate UHII, near-surface WS, and spatial patterns of air temperature and WS. ERA5 reanalysis data were further used to describe the synoptic environment, including humidity, CAPE, low-level wind, vertical wind shear, geopotential height, and temperature advection. Together, AWS and ERA5 data provide local and background meteorological conditions for interpreting CG lightning variability.

2.5. UHII Calculation and Environmental Background Classification

To characterize the near-surface thermal and dynamical environment during thunderstorm influence, UHII and near-surface WS were calculated from AWS observations [30]. UHII was defined as the difference between the mean 2 m air temperature of 45 urban stations within the Fifth Ring Road and that of eight reference stations, while WS was defined as the mean 10 m WS of the urban stations. As shown in Figure 1b, the Fifth Ring Road covers the main continuously built-up part of central Beijing. The reference stations were selected outside the Fifth Ring Road in predominantly non-urban environments, with consideration of land cover, terrain, elevation, data completeness, and directional distribution around the city; sites strongly affected by mountaintops, steep slopes, or valley entrances were avoided. The mean elevations of the urban and reference stations were 48.4 and 39.6 m, respectively, and their spatial distribution is shown in Figure 1b. Pre-storm UHII and WS were calculated as the mean values over the 3 h preceding the arrival of the main convective echo at the built-up-area boundary. This lead time window was used to characterize the immediate pre-storm thermal–dynamic environment while reducing direct contamination from rainfall cooling and cold pool passage.
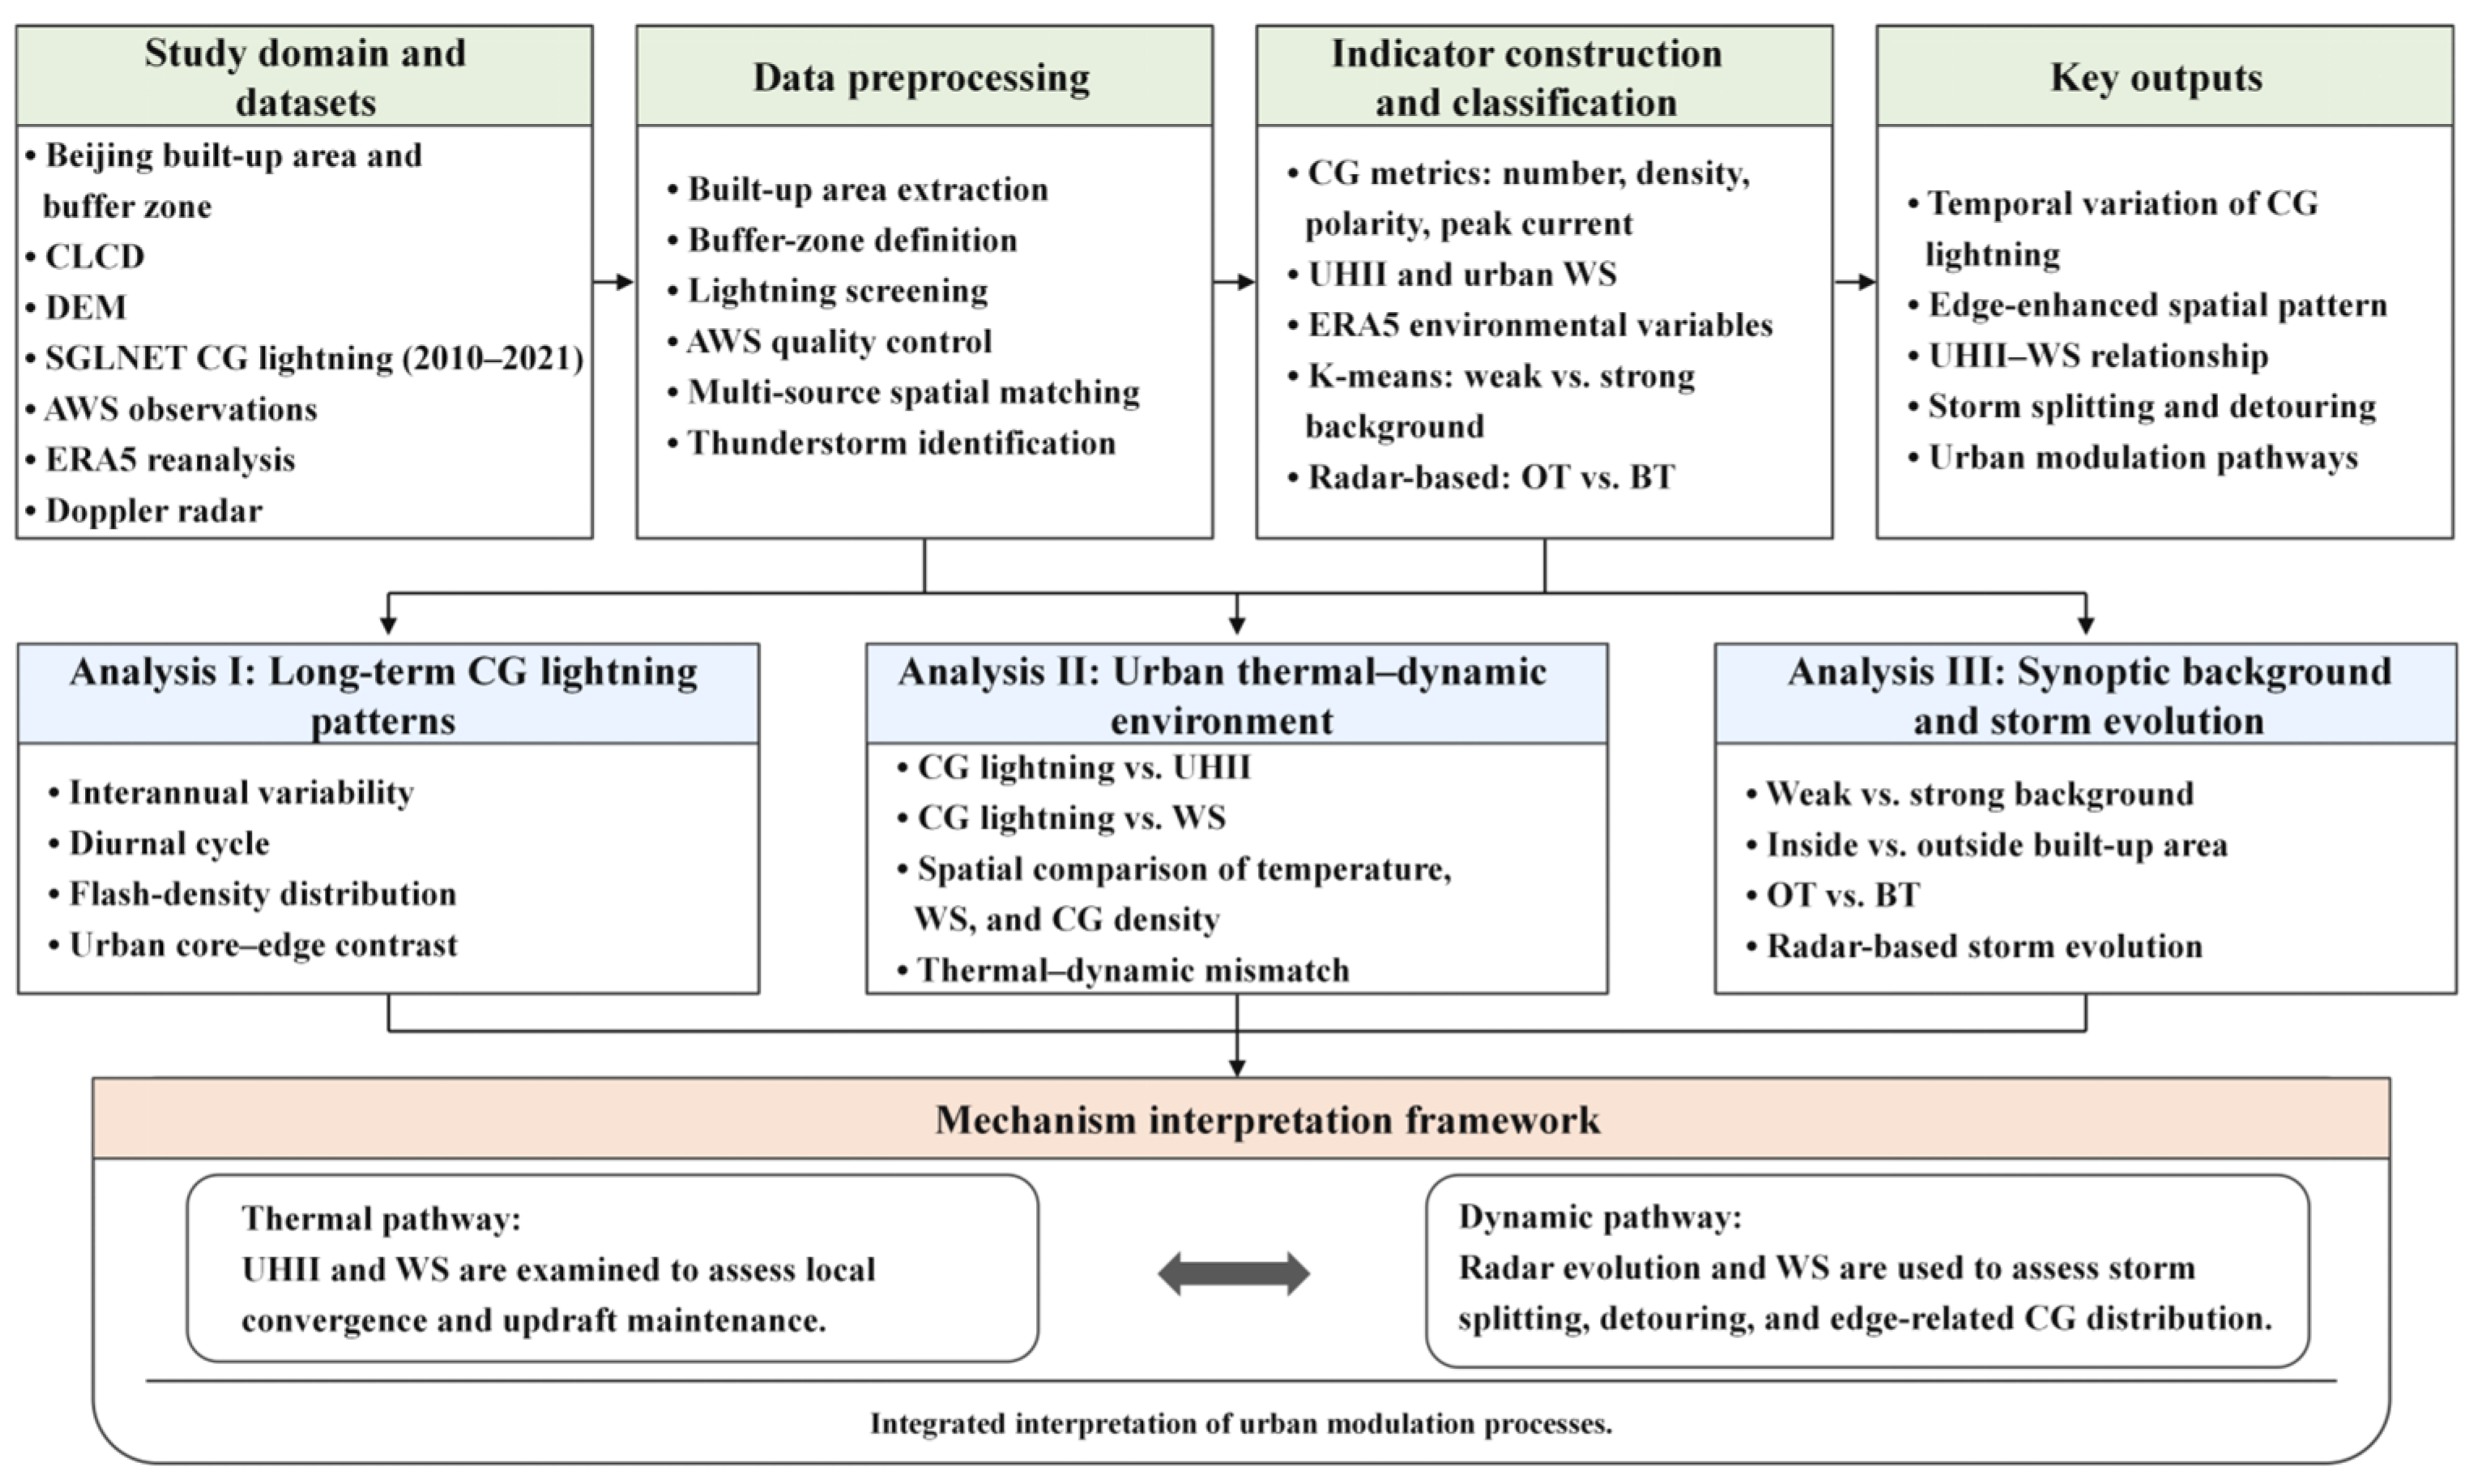
Synoptic background classification was conducted using hourly ERA5 reanalysis data. For each thunderstorm passing over the Beijing built-up area, four event-scale variables were used—850 hPa relative humidity, convective available potential energy (CAPE), 850 hPa wind speed, and 850–500 hPa bulk wind shear, representing moisture, instability, low-level airflow, and dynamical organization, respectively [31,32]. Before clustering, events dominated by pronounced synoptic scale circulation were identified and excluded when the area mean 850 hPa temperature advection was at or below the 10th percentile and the 850 hPa geopotential height gradient was at or above the 90th percentile of all candidate events. Geopotential height fields, horizontal temperature gradients, and wind field structure were further examined to confirm coherent troughs, low-pressure systems, or cold air intrusions. After screening, 304 events were retained. Geopotential height and temperature advection were used only for screening and composite circulation analysis, not for clustering. The four variables were standardized using z scores and classified by k means. Solutions with K = 2–6 were evaluated using within cluster sum of squares and silhouette coefficients. K = 2 produced the highest silhouette coefficient (0.294) and remained stable across 100 random initializations, with a median adjusted Rand index of 1.000 and a minimum of 0.972. Considering the statistical diagnostics, sample balance, inter-group differences, and physical interpretability [7,15,22], the two clusters were termed weak and strong synoptic backgrounds according to their relative multivariate characteristics rather than fixed single variable thresholds. The overall workflow of data processing and analysis is summarized in Figure 2.

3. Results

3.1. Spatiotemporal Patterns of CG Lightning in Beijing

Long-term lightning statistics provide the basis for understanding urban lightning characteristics and interpreting lightning risk. In this section, the temporal and spatial patterns of CG lightning over the Beijing built-up area were examined using SGLNET data from 2010 to 2021.
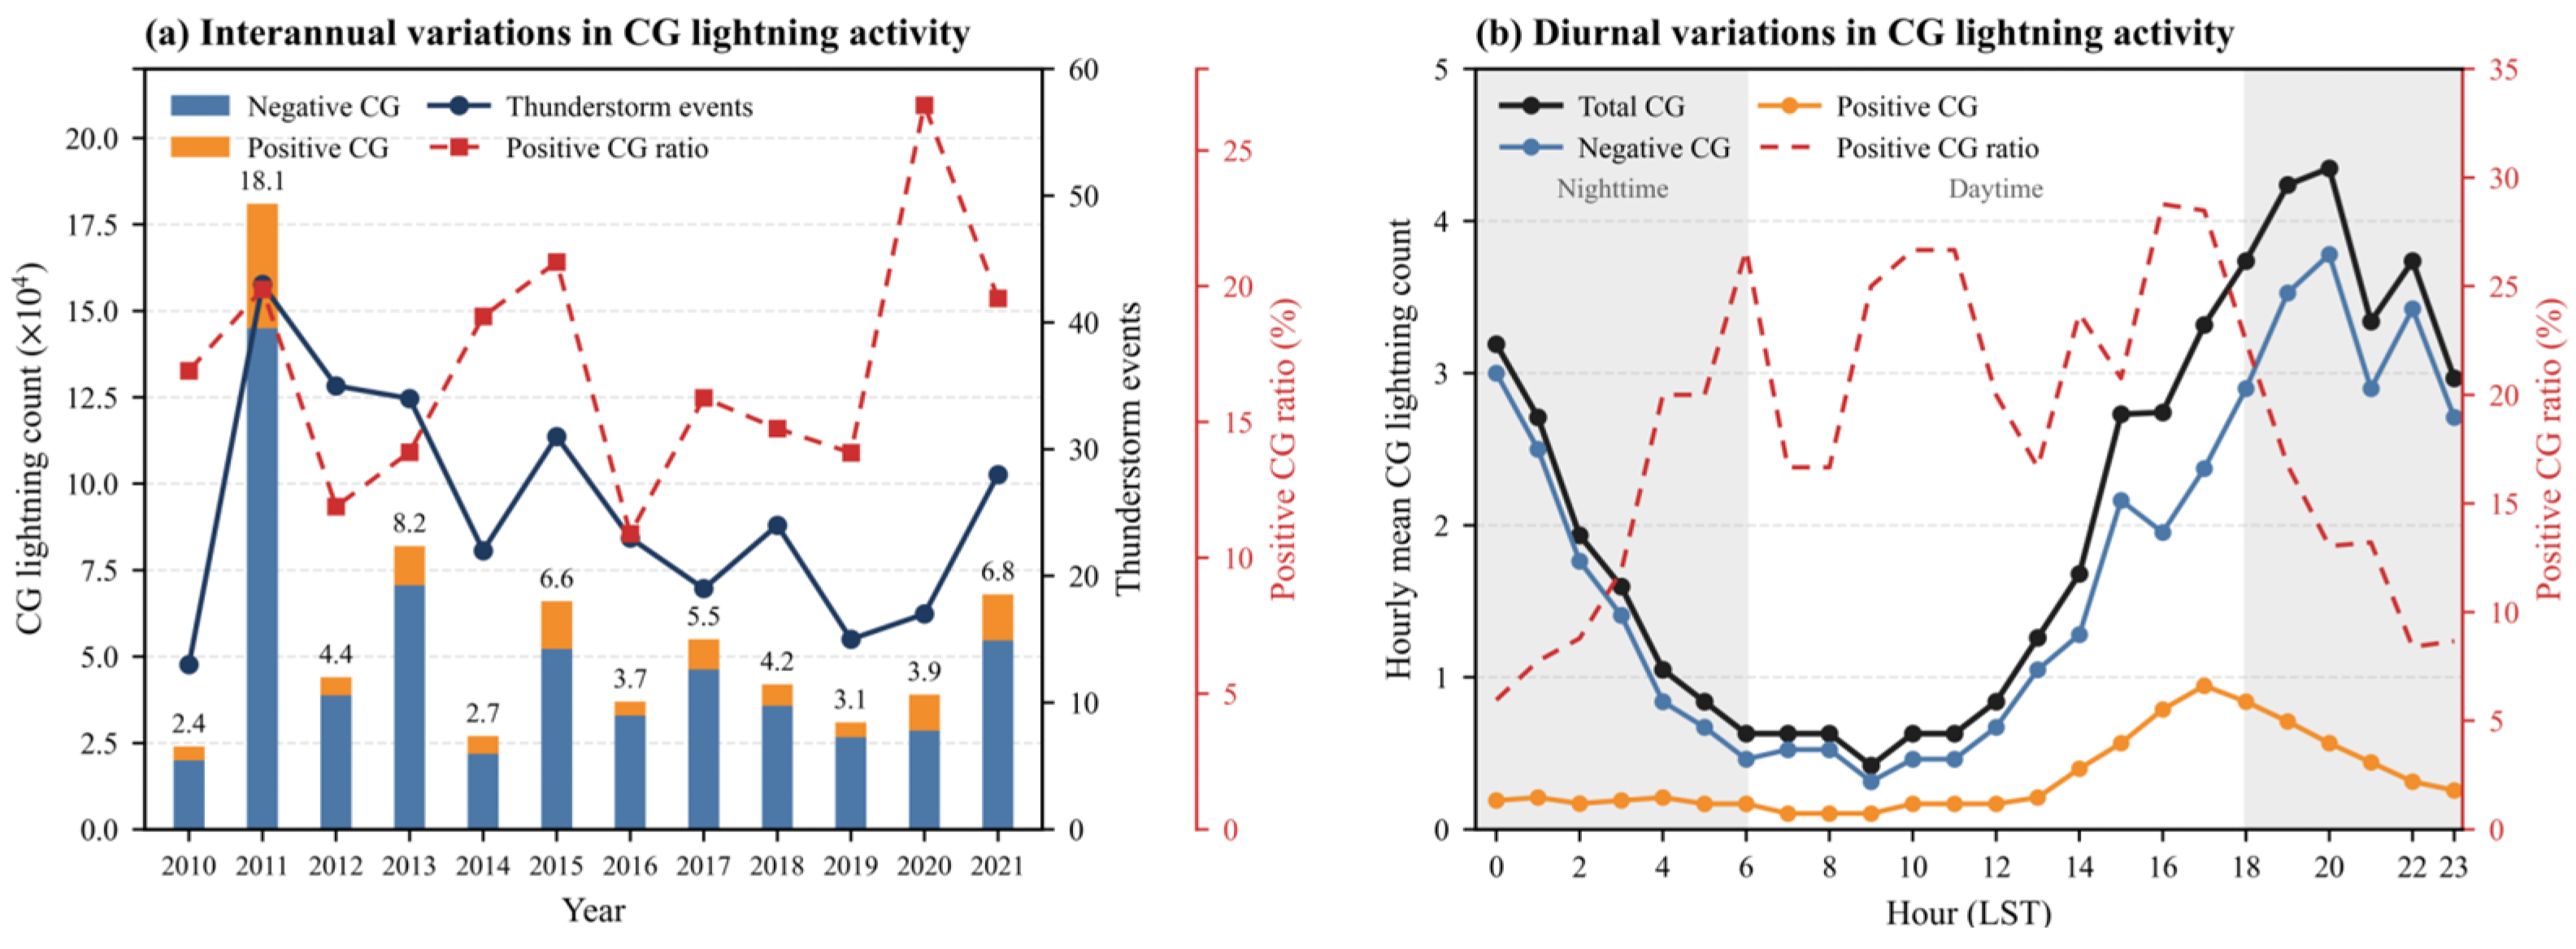
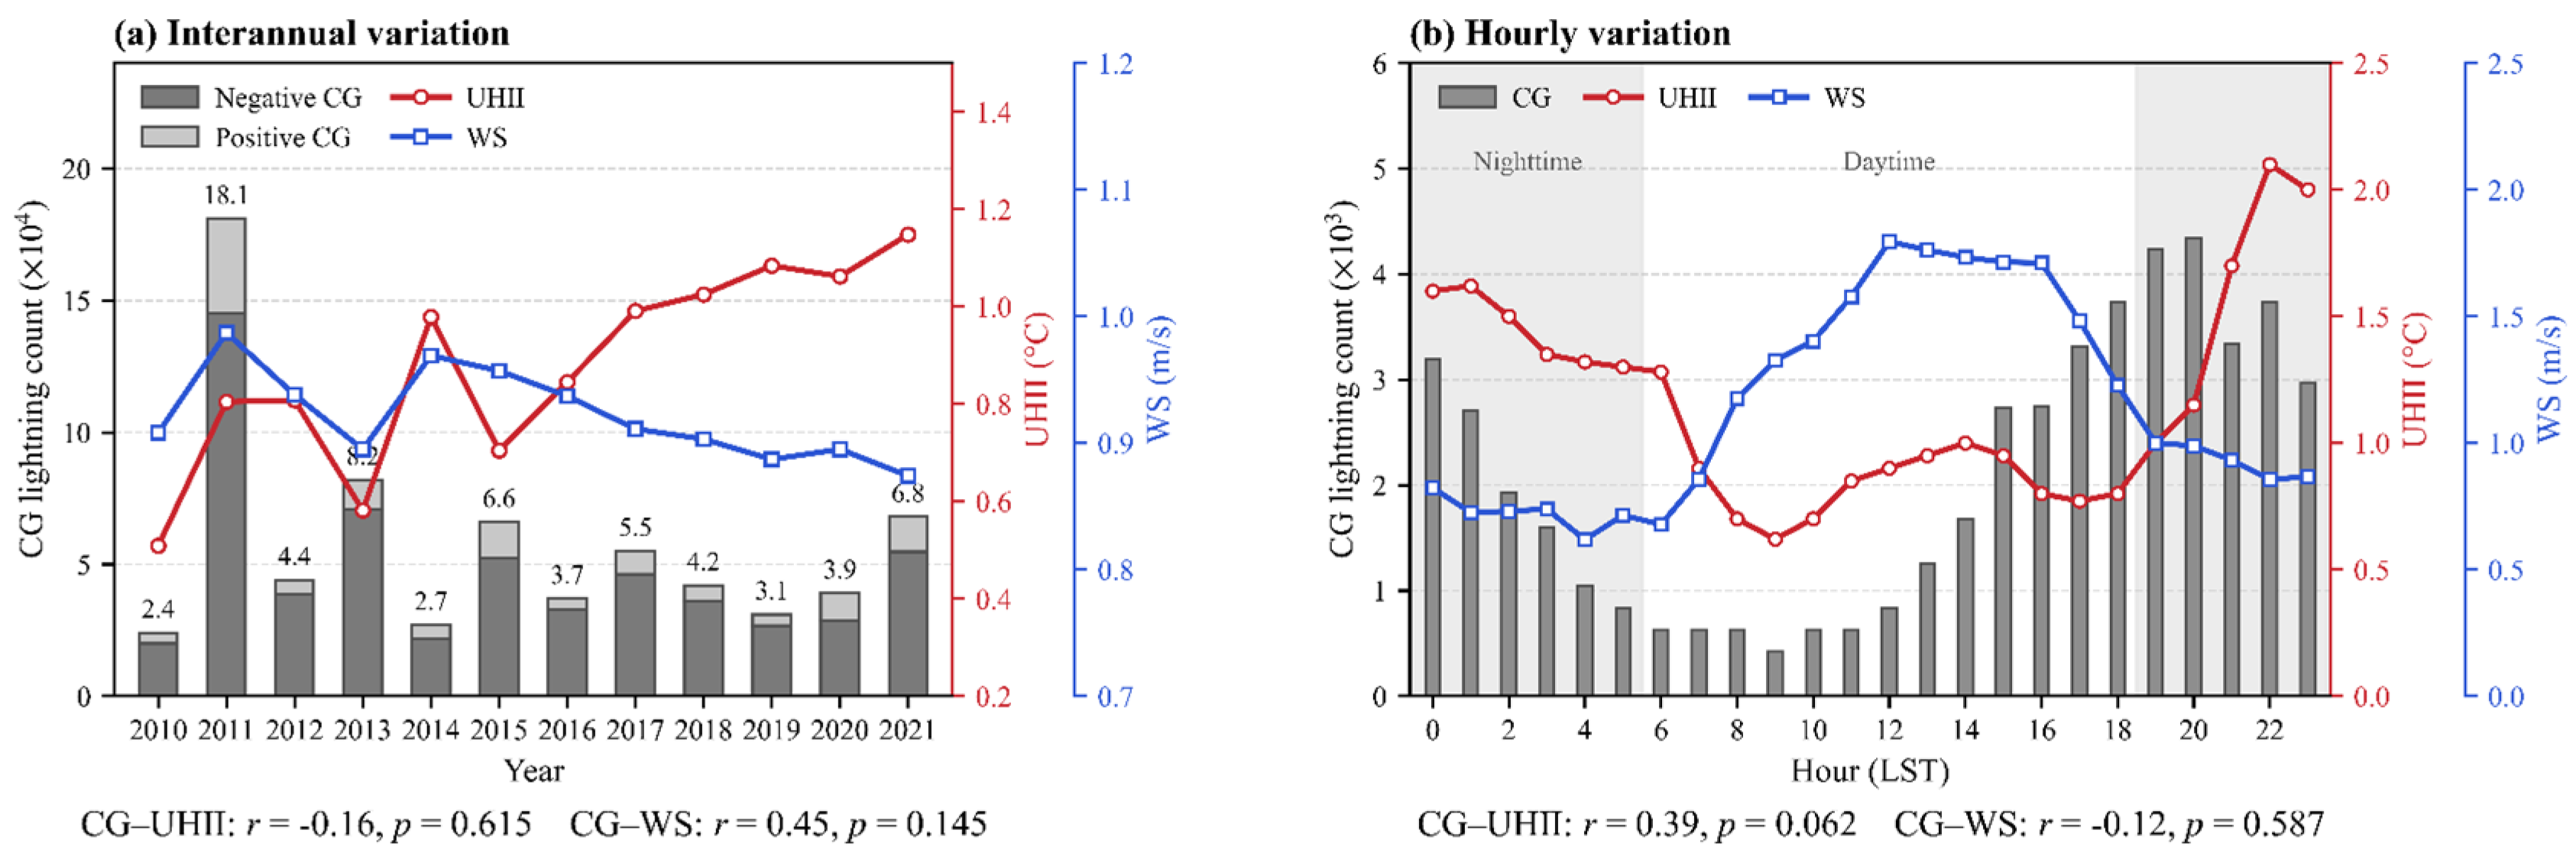
Over the study period, 304 thunderstorm events occurred over the Beijing built-up area, and about 6.96 × 10⁴ CG flashes were recorded by SGLNET. As shown in Figure 3a, negative CG flashes dominated the total CG activity in all years. The greatest lightning activity occurred in 2011, with about 43 thunderstorm events and 18.1 × 10³ CG flashes, whereas 2010 recorded the lowest activity, with about 13 events and 2.4 × 10³ flashes. Interannual changes in CG flashes were broadly consistent with thunderstorm frequency, but the relationship was not strictly proportional, indicating that storm intensity and organization also affected lightning production. The positive CG ratio varied from about 10% to more than 25%, suggesting that the polarity composition also changed between years.
Previous studies have reported clear temporal variations in CG lightning over the Beijing metropolitan region [23,24]. As shown in Figure 3b, the diurnal variation in total CG flashes was mainly controlled by negative CG flashes. Both total and negative CG flashes decreased from midnight to early morning, reached their lowest levels around 07:00–09:00 LST, and then increased rapidly after noon, with the main peak during 19:00–20:00 LST when the hourly mean total CG count exceeded 4.0. Positive CG flashes were fewer and peaked earlier, around 17:00–18:00 LST. These results indicate that the diurnal cycle of CG lightning over the built-up area is mainly shaped by negative flashes, while positive flashes show a distinct temporal behavior. The late-afternoon-to-evening increase provides the temporal background for examining how urban thermal–dynamic conditions may modulate CG lightning activity.
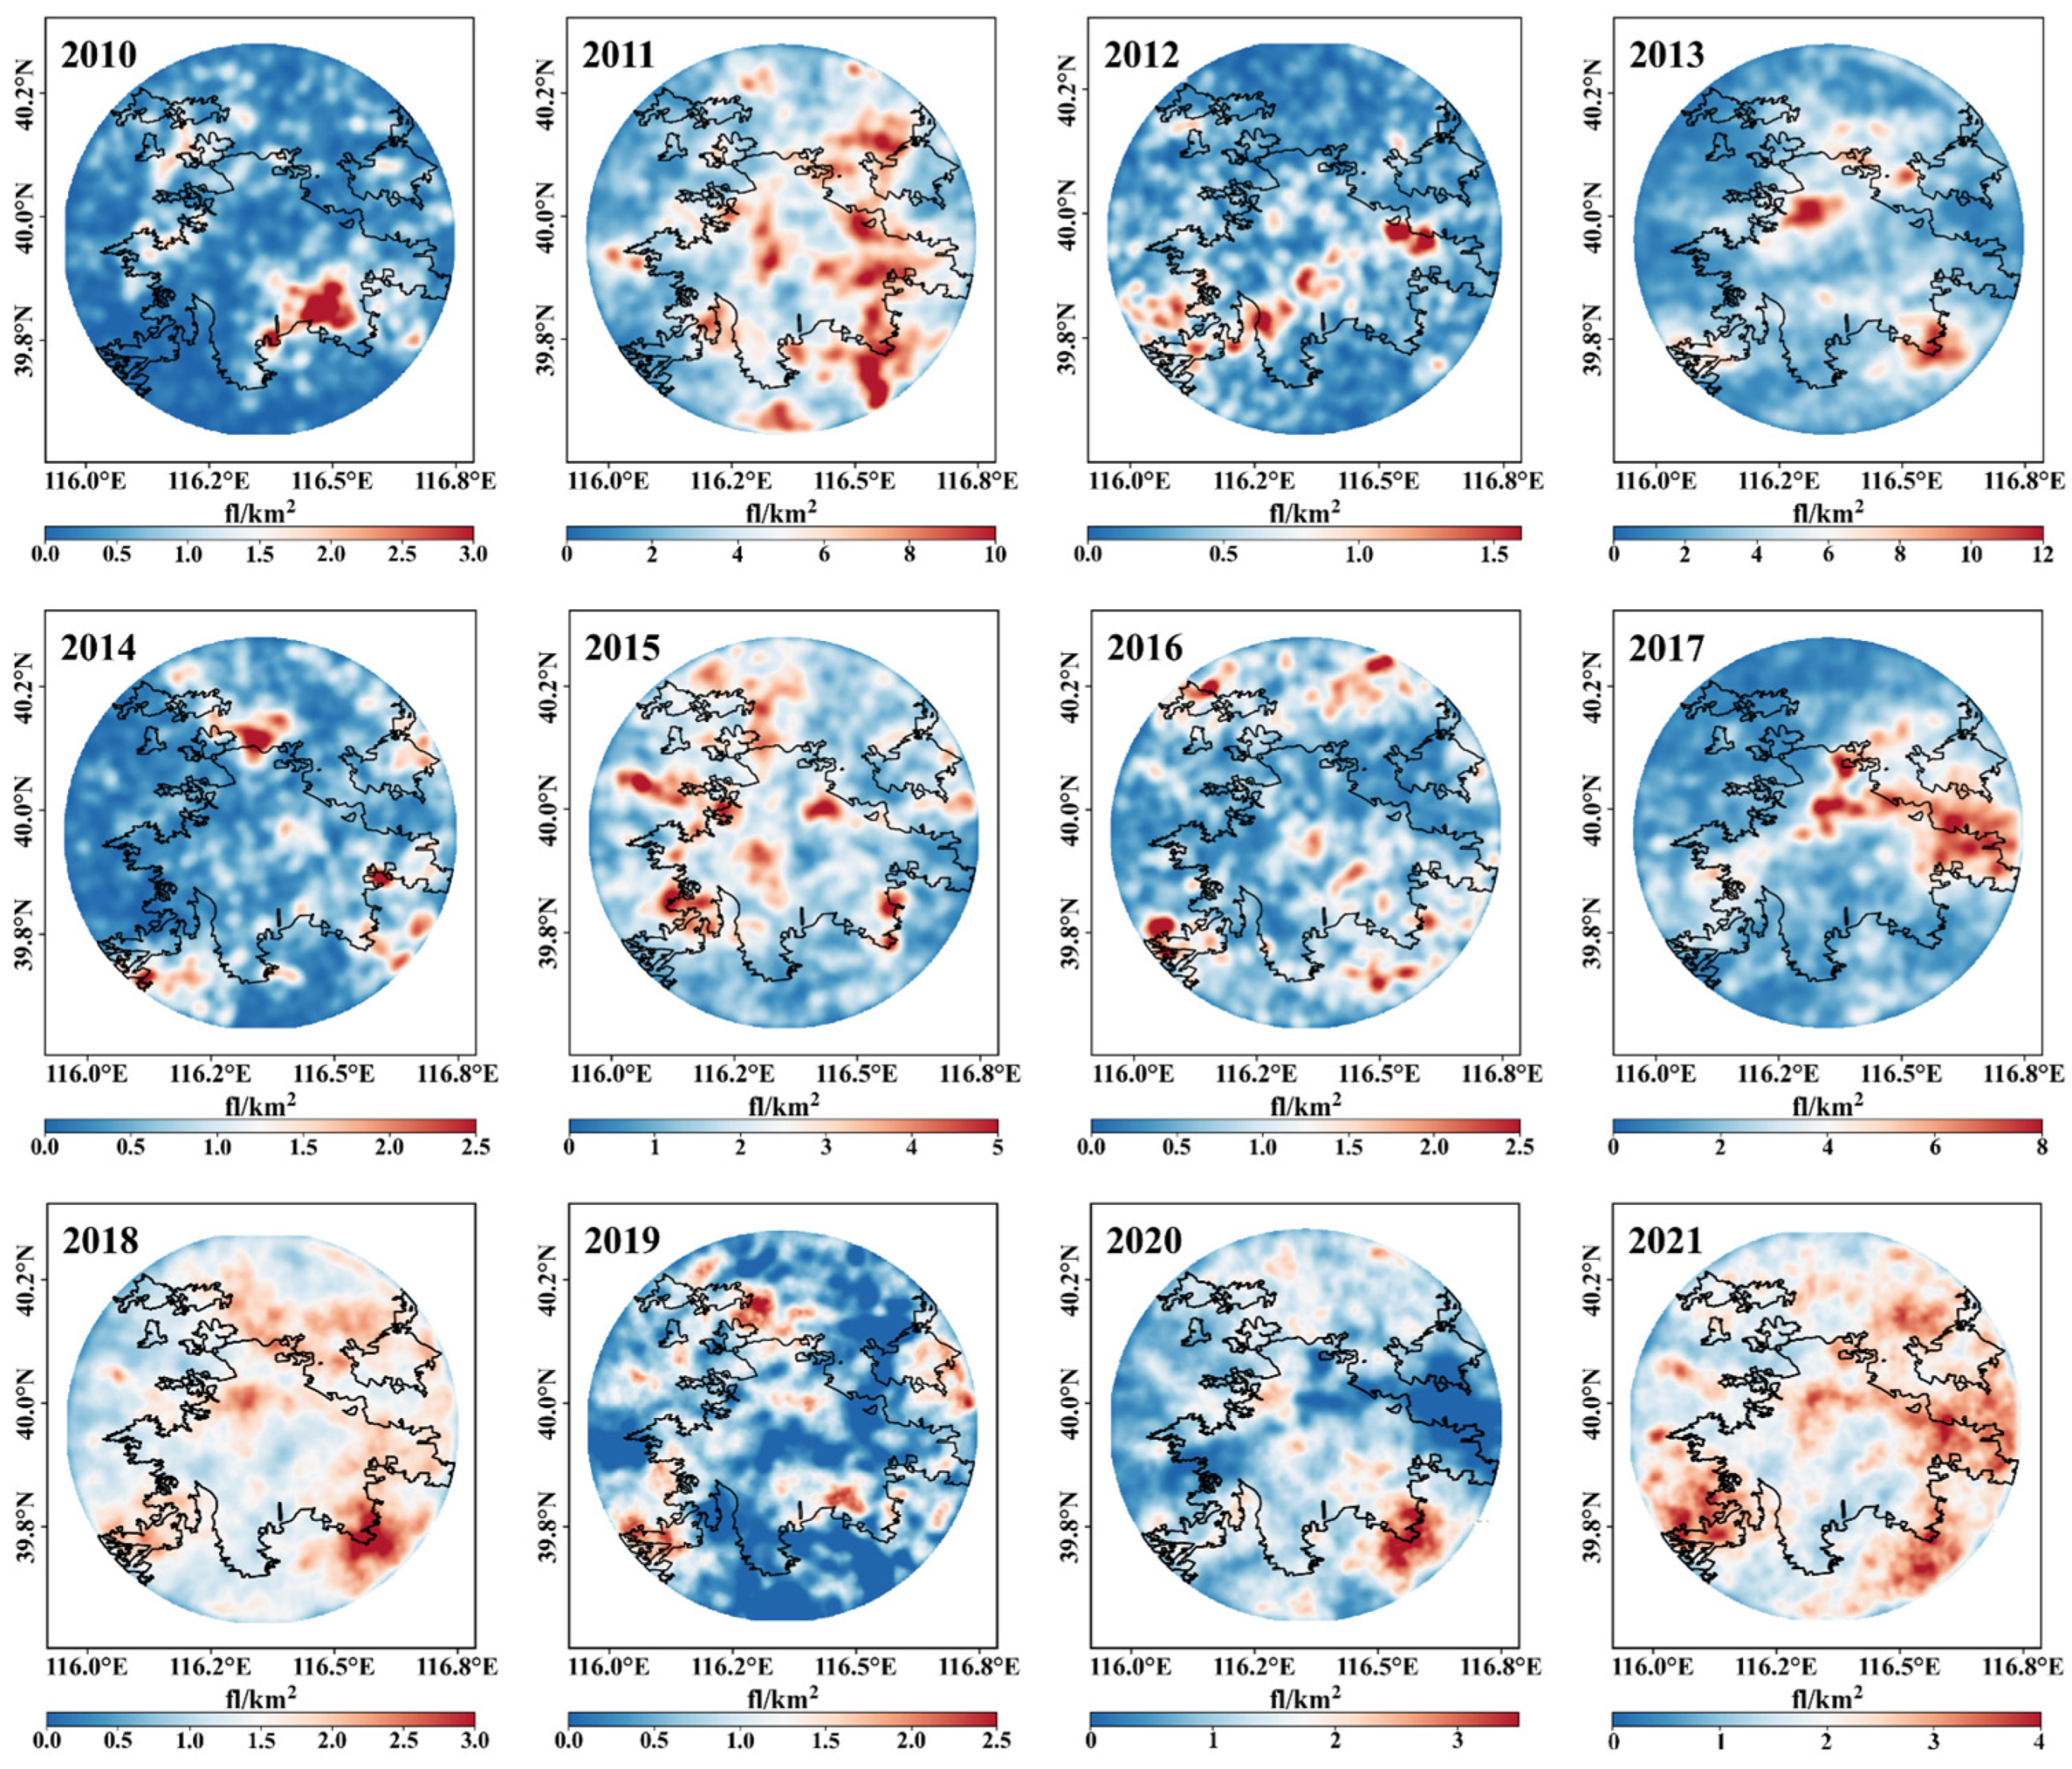
Figure 4 shows that CG density was unevenly distributed within the Beijing built-up area. Although annual CG totals varied markedly, high-density centers were more often located near the urban edge or in transition zones between the built-up area and surrounding regions, whereas persistent high-density centers were less frequently located over the inner urban area. This pattern was clearer in active lightning years. In 2011, about 18.1 × 10³ CG flashes were recorded, with high-density centers mainly along the eastern, southeastern, and local western edges. In 2017, although the total decreased to about 5.5 × 10³ flashes, the main high-density belt remained near the northeastern-to-eastern urban edge.
This pattern is consistent with previous studies showing that urban effects on CG lightning and convection are often displaced from the urban core to the urban edge or nearby downwind areas [8,11,12,24,33]. For Beijing, the repeated occurrence of flash density maxima near the built-up boundary suggests that CG lightning is not directly controlled by the strongest UHI center. Instead, the urban edge may represent a key transition zone where thermal contrast, roughness gradients, low-level convergence, and storm outflows jointly affect thunderstorm evolution. Building properties may also contribute to this pattern by modifying aerodynamic roughness and near-surface airflow [12,15], although their independent effects cannot be quantified from the present observations. Thus, Figure 4 provides a spatial basis for examining why persistent CG density maxima occurred more frequently near the built-up edge than over the inner urban area.

3.2. Influence of Thermal–Dynamic Environment on Summer CG Lightning

To examine links between the urban thermal–dynamic environment and CG lightning, we compared CG flashes with WS and UHII in time and space. UHII was estimated from urban–rural temperature differences, and station observations were interpolated to describe the near-surface thermal field.
As shown in Figure 5a, CG lightning, UHII, and WS show different interannual variations. CG activity peaked in 2011, with about 18.1 × 10³ flashes, and was lowest in 2010, with about 2.4 × 10³ flashes. UHII generally increased from about 0.5 °C in 2010 to more than 1.1 °C in 2021, whereas WS showed a slight overall decrease. However, annual CG flash number was not significantly correlated with either UHII (r = −0.16, p = 0.615) or WS (r = 0.45, p = 0.145). For example, 2011 had the highest CG activity but only moderate UHII, whereas 2021 had higher UHII but far fewer flashes. This indicates that interannual CG variability cannot be explained by UHII or mean near-surface WS alone, but may also reflect differences in thunderstorm frequency and organization, background circulation, storm-related airflow, and large-scale climate variability [18,19,20,34,35,36,37].
At the diurnal scale, Figure 5b shows a clearer correspondence between UHII and CG activity. CG flashes decreased from midnight to morning, reached a minimum around 08:00–10:00 LST, and then increased after noon, peaking during 19:00–20:00 LST. The correlation between hourly CG activity and UHII was positive but did not reach the 0.05 significance level (r = 0.39, p = 0.062), while the relationship between CG activity and WS was weak and nonsignificant (r = −0.12, p = 0.587). Nevertheless, the evening increase in CG activity broadly coincided with increasing UHII and decreasing WS. Lower WS may reflect reduced ventilation that helps to preserve the urban thermal contrast [17,30]. The boundary layer transition around sunset and concurrent storm-scale processes may also contribute to the observed evening increase in CG lightning [7,30].
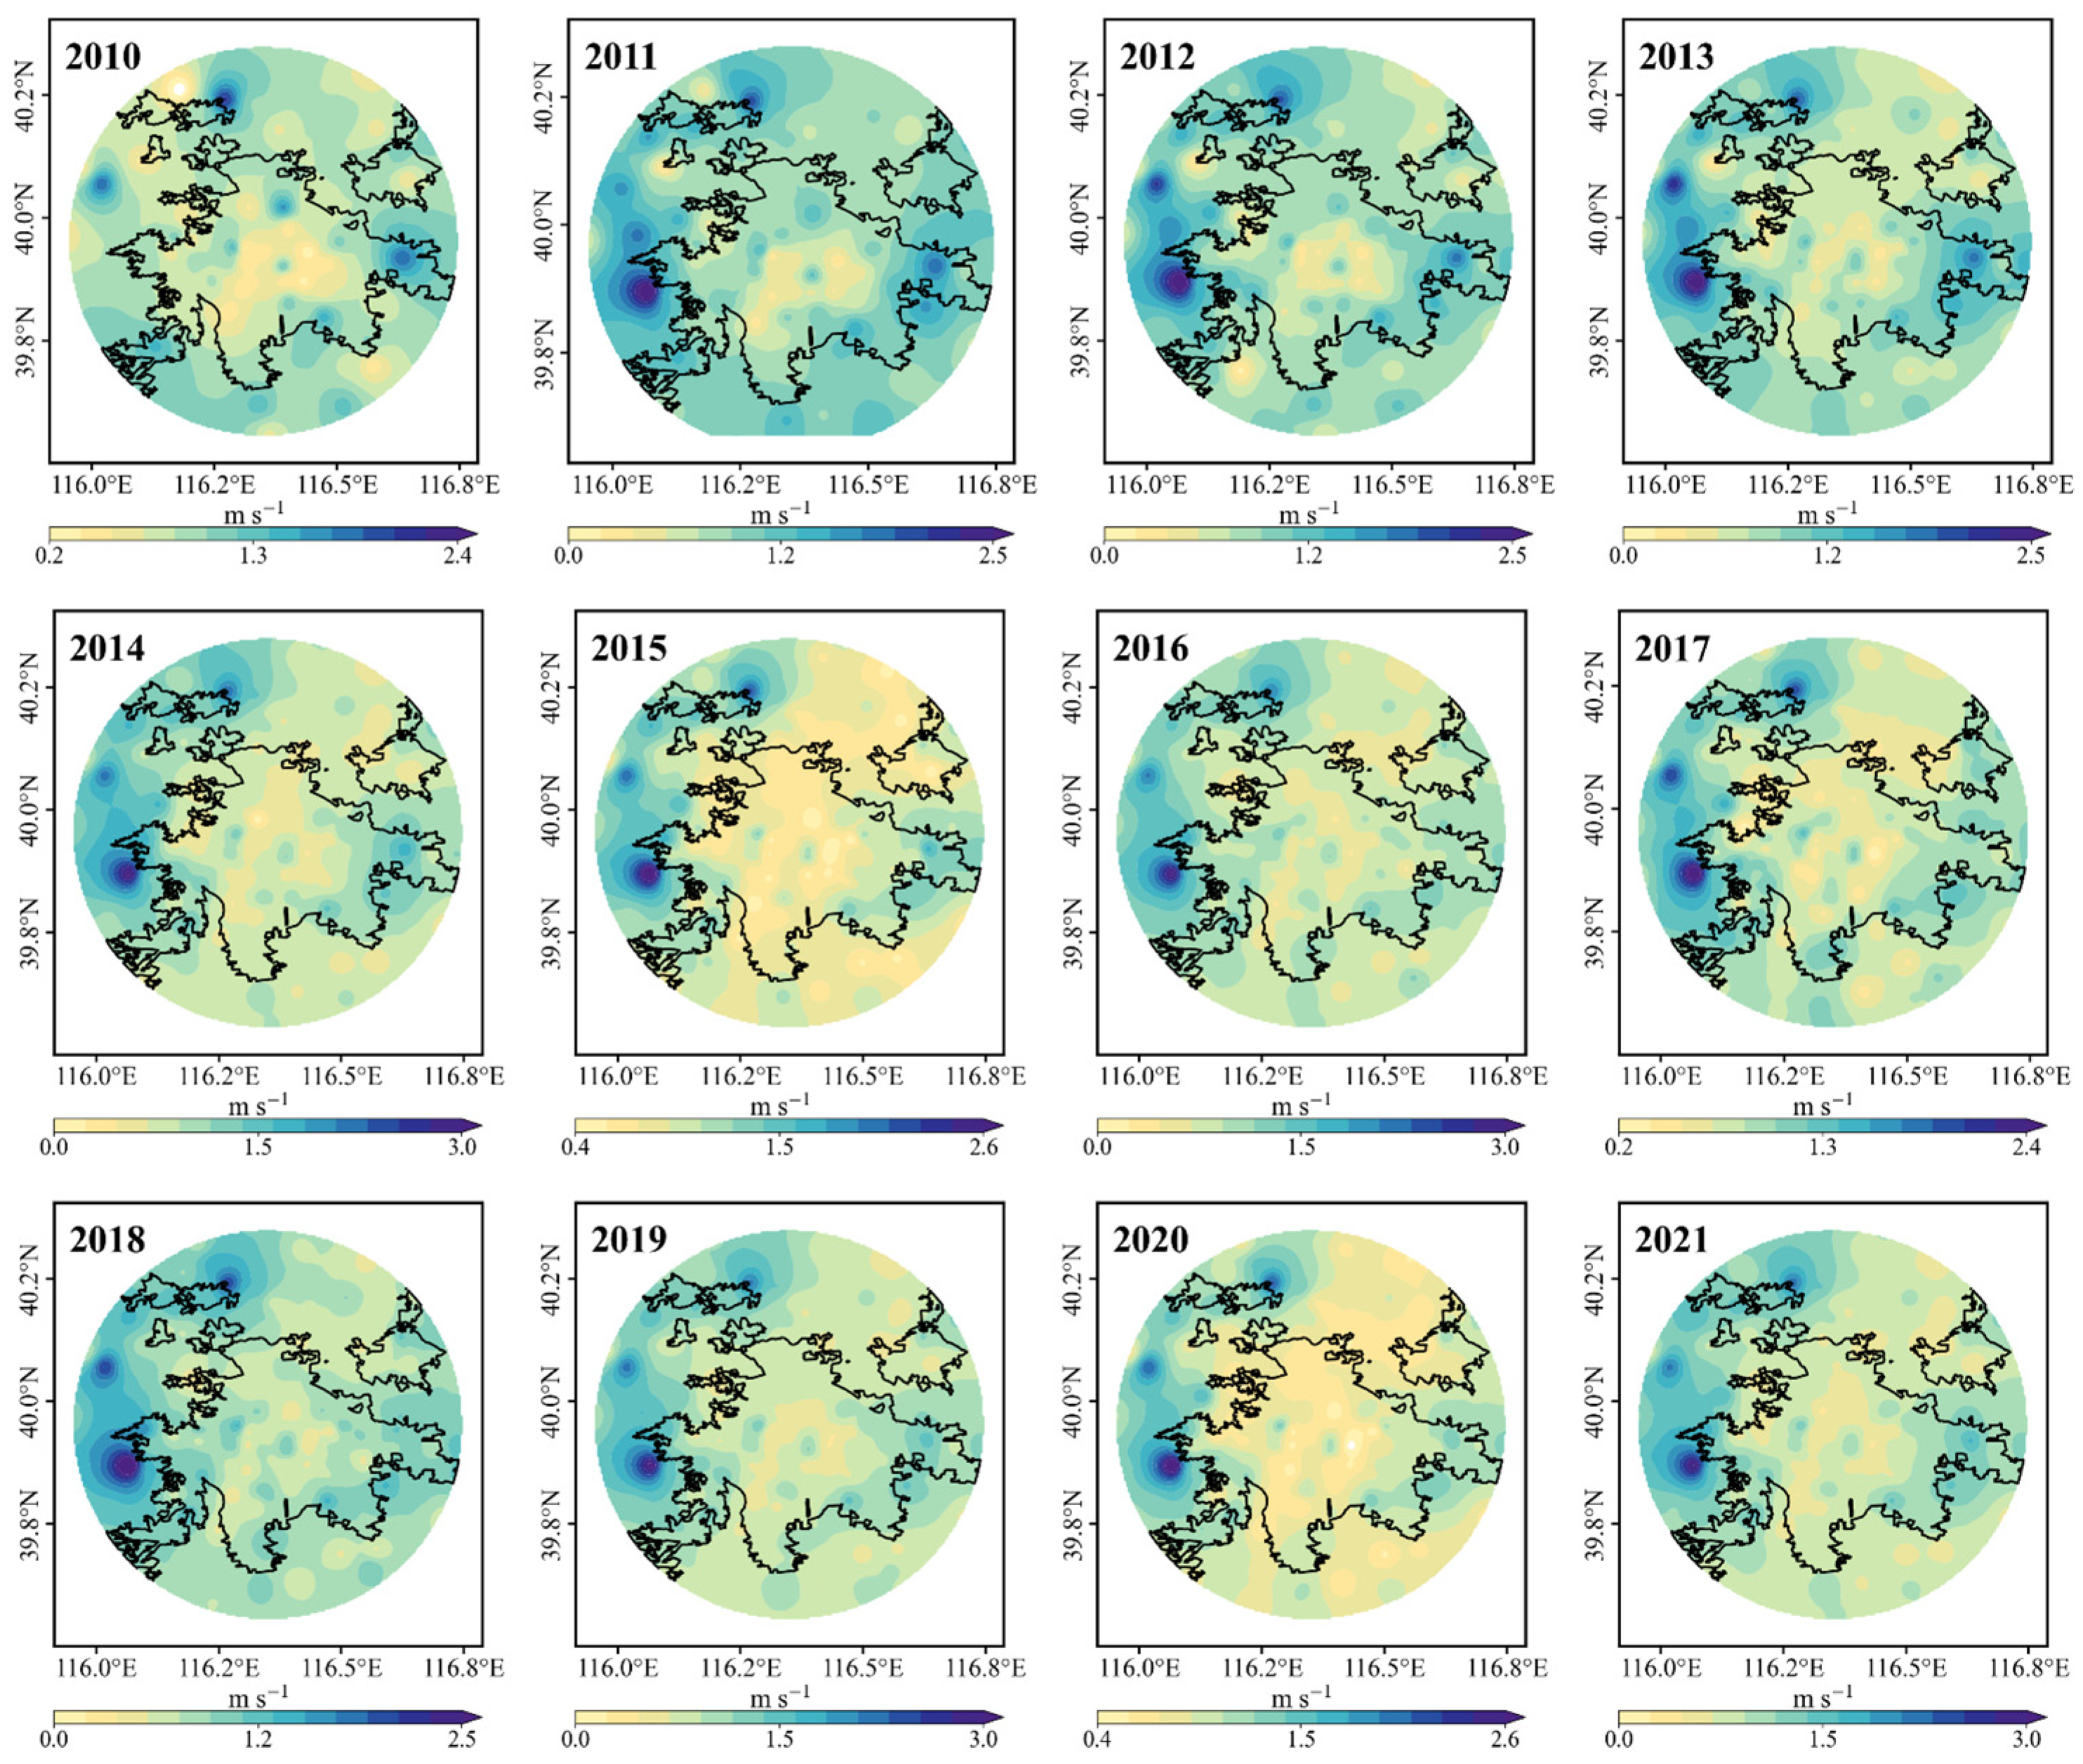
Figure 6 shows the spatial pattern of near-surface WS over the Beijing built-up area. Overall, WS was higher along the urban periphery, especially over the western and northwestern margins, while lower values were more common in the central and eastern built-up areas. This pattern was relatively stable across different years, although the intensity and local extent of high wind zones varied. The repeated low WS feature over the inner urban area may be partly related to stronger aerodynamic drag and reduced ventilation over densely built surfaces [12,15]. However, most of the selected thunderstorms moved from northwest to southeast, indicating that the CG lightning enhancement along the southeastern urban edge may also be influenced by the prevailing storm motion direction and background flow, rather than by urban roughness alone. Therefore, WS reflects the combined effects of building configuration, surface roughness, background circulation, terrain, and storm-generated outflows. Because these factors can jointly affect thunderstorm movement, low-level convergence, and convective development, near-surface WS provides a useful environmental indicator for analyzing the spatial variation in CG lightning activity.
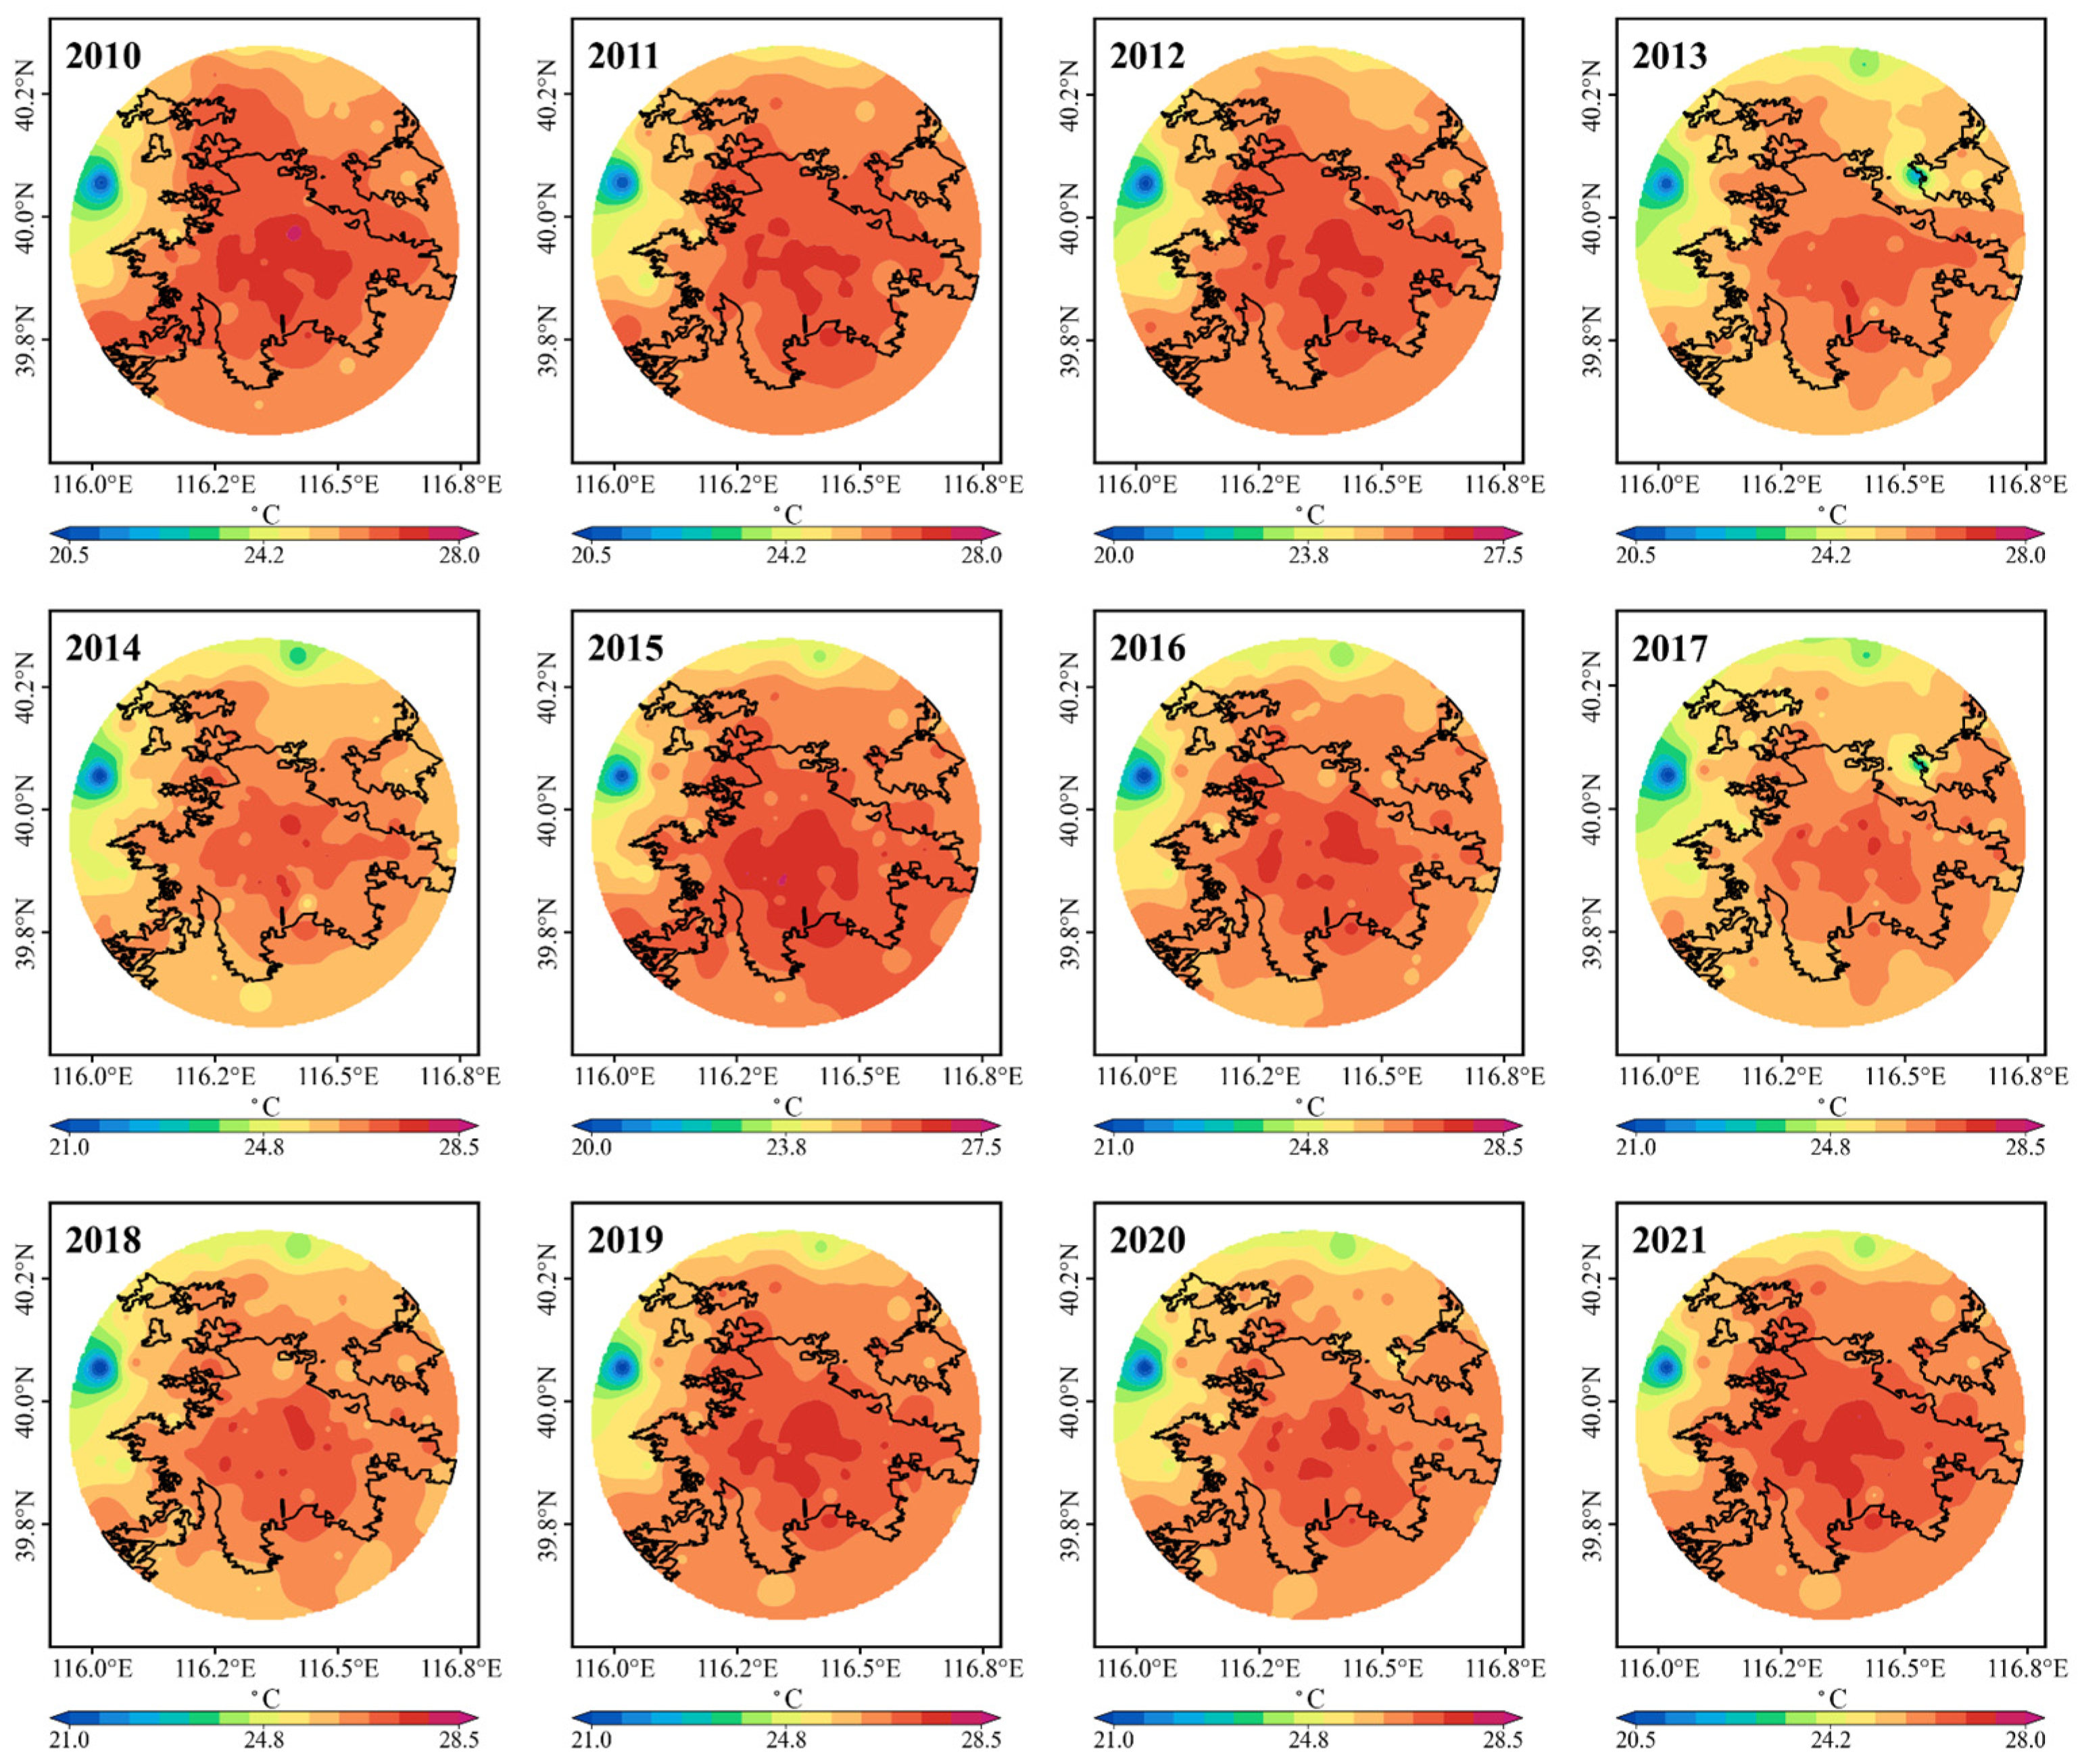
Figure 7 shows that the near-surface air temperature displayed a spatial pattern distinct from that of CG density. Over the study period, high-temperature areas were mainly located within the built-up area, especially over the central and southern parts of Beijing, consistent with previous observations of Beijing’s UHI structure [16,17]. In contrast, the western and northwestern margins generally showed lower temperatures, likely associated with higher terrain and lower urbanization intensity. The urban thermal signal was relatively clear in most years, although its intensity varied. For example, the warm center was more evident in 2011, 2015, 2019, and 2021, whereas the temperature contrast was lower in years such as 2013 and 2017. Comparison with Figure 4 and Figure 6 reveals a key spatial mismatch. The highest temperatures were concentrated mainly in the urban core or southern built-up area, while CG density maxima were more often located near the urban edge. Meanwhile, the central urban area also corresponded to lower near-surface WS, indicating reduced ventilation and higher heat accumulation, which is consistent with the known modulation of UHII by wind conditions [17,38]. These results suggest that UHII may help to shape the urban boundary layer environment but does not directly determine the location of CG enhancement. Instead, the effect of the urban thermal field is likely mediated by storm-scale processes, including low-level convergence, cold pool outflows, and thunderstorm splitting or detouring during urban passage.

3.3. Relationship Between CG Lightning Spatial Patterns and Thunderstorm Evolution

The spatial mismatch between UHII and CG density suggests that CG enhancement cannot be explained by the urban thermal field alone. Because thunderstorms over Beijing are also influenced by synoptic forcing, moisture, instability, wind shear, and cold pool evolution, the events were first classified into weak and strong background types based on their composite circulation and environmental conditions.
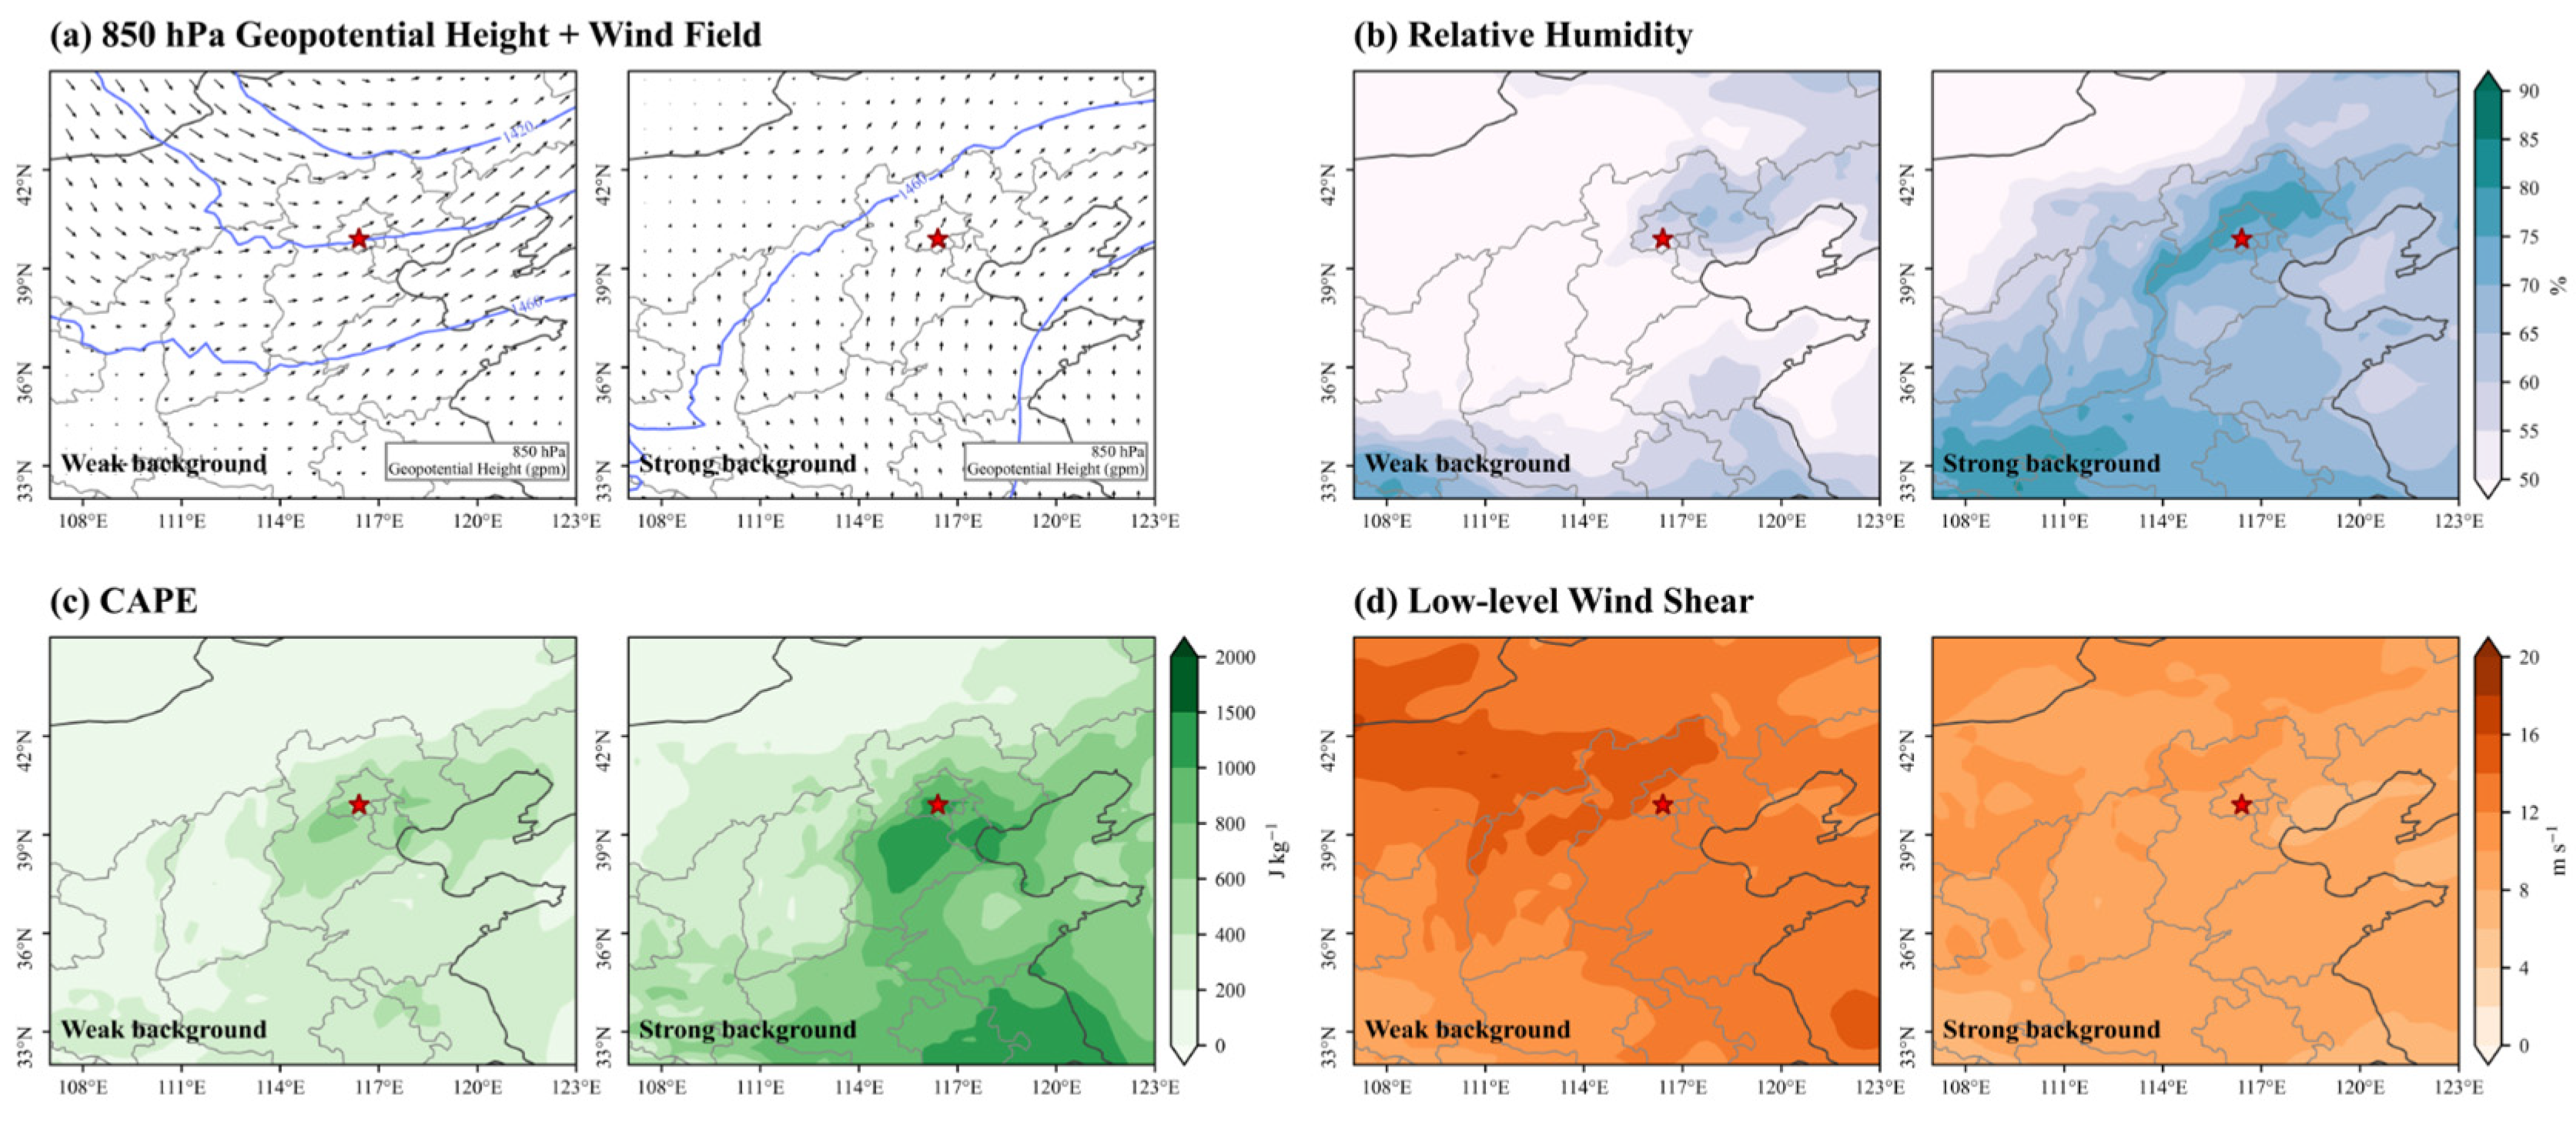
Figure 8 compares the composite circulation and thermodynamic environments of the two thunderstorm backgrounds. Under the weak background, the low-level circulation around Beijing is relatively weak and less organized, with limited moisture and instability. The relative humidity near Beijing is about 60–65%, CAPE mostly remains around 400–600 J kg−1, the 850 hPa wind speed is about 4.5 m s−1, and the 850–500 hPa bulk wind shear is about 10.0 m s−1, suggesting that thunderstorm development may be more sensitive to local boundary layer processes and urban thermal perturbations [7,15]. In contrast, the strong background is characterized by clearer low-level moisture transport toward Beijing, higher relative humidity, and broader CAPE enhancement to the south and southeast. The relative humidity near Beijing increases to about 75–80%, CAPE reaches 800–1200 J kg−1, the 850 hPa wind speed is about 6.7 m s−1, and the 850–500 hPa bulk wind shear is about 8.0 m s−1. CAPE also exceeds 1500 J kg−1 in parts of the southeastern sector, indicating more favorable moisture and instability conditions for organized convection [18,19]. It should be noted that this classification is not determined by a single dynamic variable, such as low-level wind shear. Instead, it reflects combined differences in moisture transport, instability, and low-level circulation organization. These environmental conditions may favor more organized thunderstorm evolution and clearer cold pool outflows [18,19]. Therefore, the following analysis examines whether these background differences correspond to different CG lightning spatial patterns. In particular, under the strong background, storm-scale processes, including outflow boundary deformation, storm splitting, and detouring near the built-up area, may play a larger role in redistributing CG lightning toward the urban periphery [14,15].
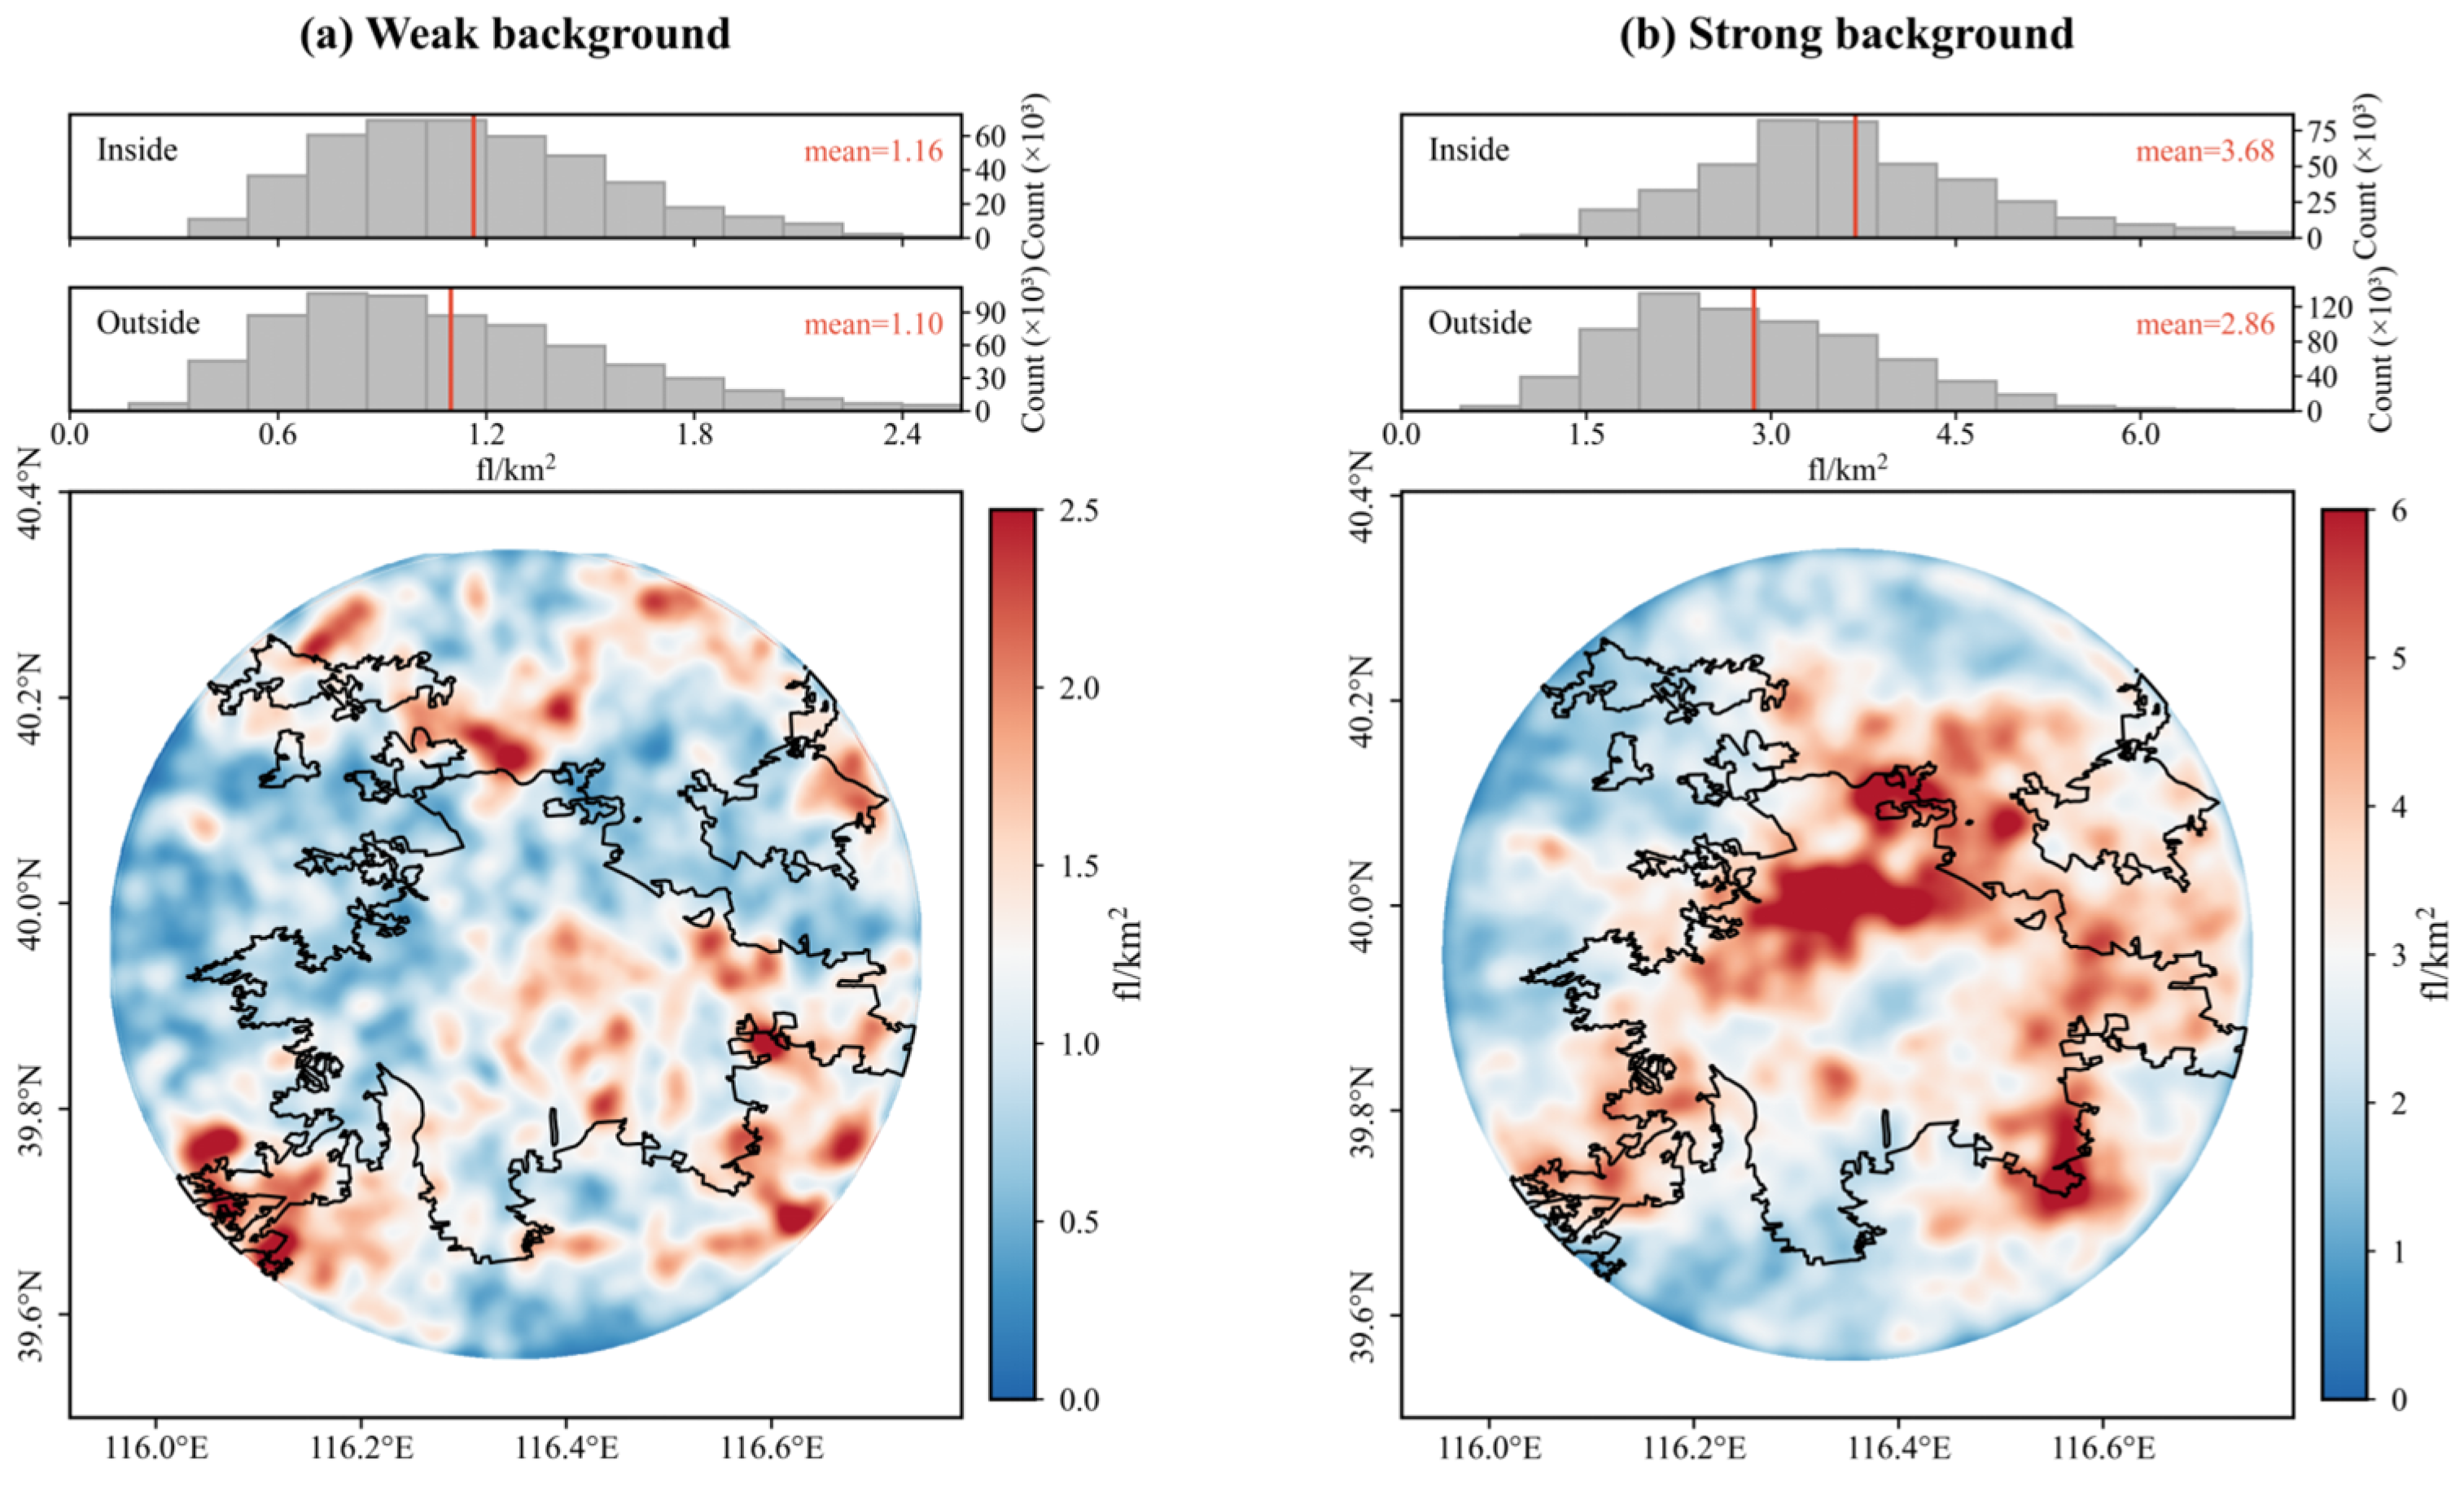
Figure 9 compares the spatial patterns of CG lightning under the two thunderstorm backgrounds. Under the weak background, the mean flash densities inside and outside the built-up area are similar, with values of 1.16 and 1.10 fl km−2, respectively. The spatial pattern is relatively dispersed, with local high-density areas appearing near the urban edge, within parts of the built-up area, and in surrounding regions. This suggests that CG lightning locations under weak background conditions are not strongly constrained by a single urban-related factor, but may be jointly affected by local thermal perturbations, boundary layer convergence, and the internal evolution of individual thunderstorms [15,18]. Under the strong background, CG density increases markedly, with mean values of 3.68 fl km−2 inside the built-up area and 2.86 fl km−2 outside it. However, this enhancement is not uniformly distributed over the urban core. Although the mean value inside the whole built-up area is higher, the enhancement is mainly contributed by the peripheral part of the built-up area, with high-density centers located along the urban edge and nearby transition zones. This indicates that thunderstorm-scale dynamics may play a larger role in shaping the lightning distribution under stronger environmental forcing [18,19]. Stronger cold pool outflows and more organized storm structures may interact with the rough urban surface, leading to outflow boundary deformation and enhanced low-level convergence near the urban edge [12,14,15]. To compare different storm evolution pathways, the 304 events were operationally grouped into 243 ordinary thunderstorms (OTs) and 61 bifurcated thunderstorms (BTs) according to the radar-based criteria described in Section 2.3.
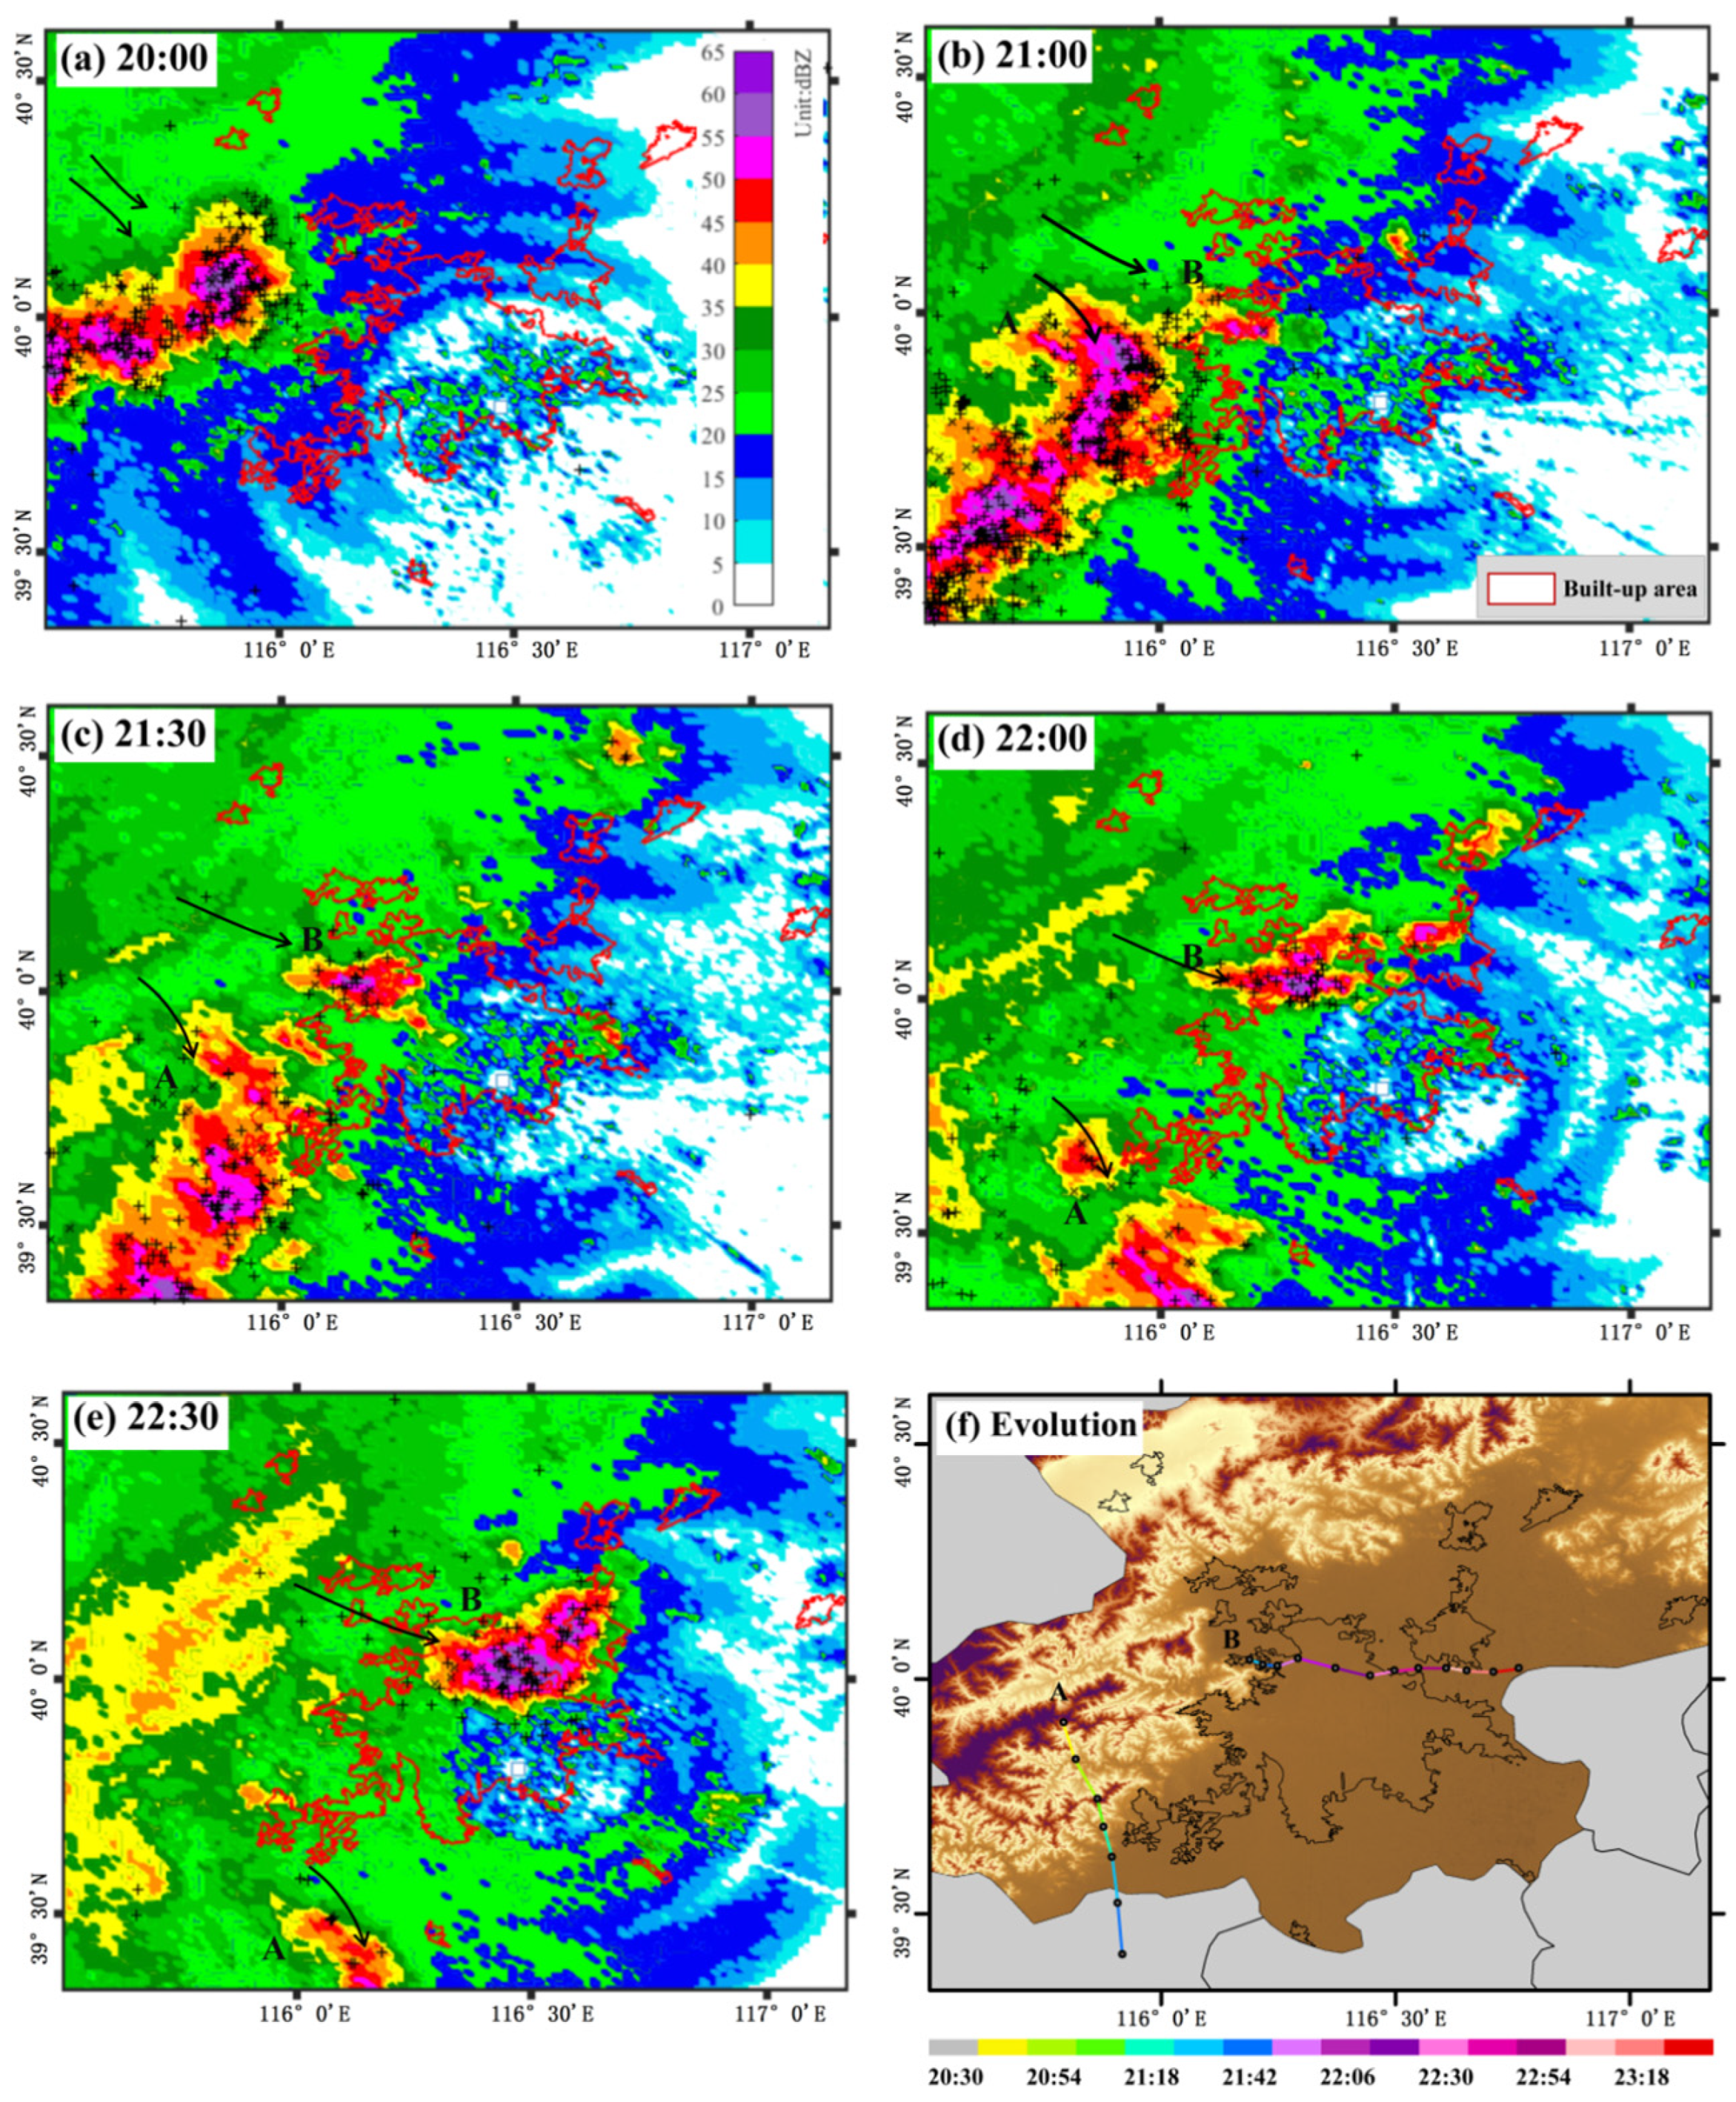
Figure 10 shows the evolution of a typical bifurcated thunderstorm approaching Beijing from the west to northwest. At 20:00, the main convective system was still outside the built-up area, with strong radar echoes and frequent CG flashes concentrated west of the city. By 21:00, the system began to split near the western urban edge. Branch A moved southeastward along the southwestern side of the city, while Branch B propagated eastward along the northern and central edge of the built-up area. CG flashes were mainly located near the storm cores and urban margin. From 21:30 to 22:30, the separation between the two branches became clearer. Branch B continued along the northern built-up edge and produced a concentrated CG flash zone near the urban margin, whereas the central urban area was less affected by strong echoes and frequent flashes. This event provides an observational example of persistent thunderstorm bifurcation during urban passage and the associated redistribution of CG lightning toward the peripheral storm branches.
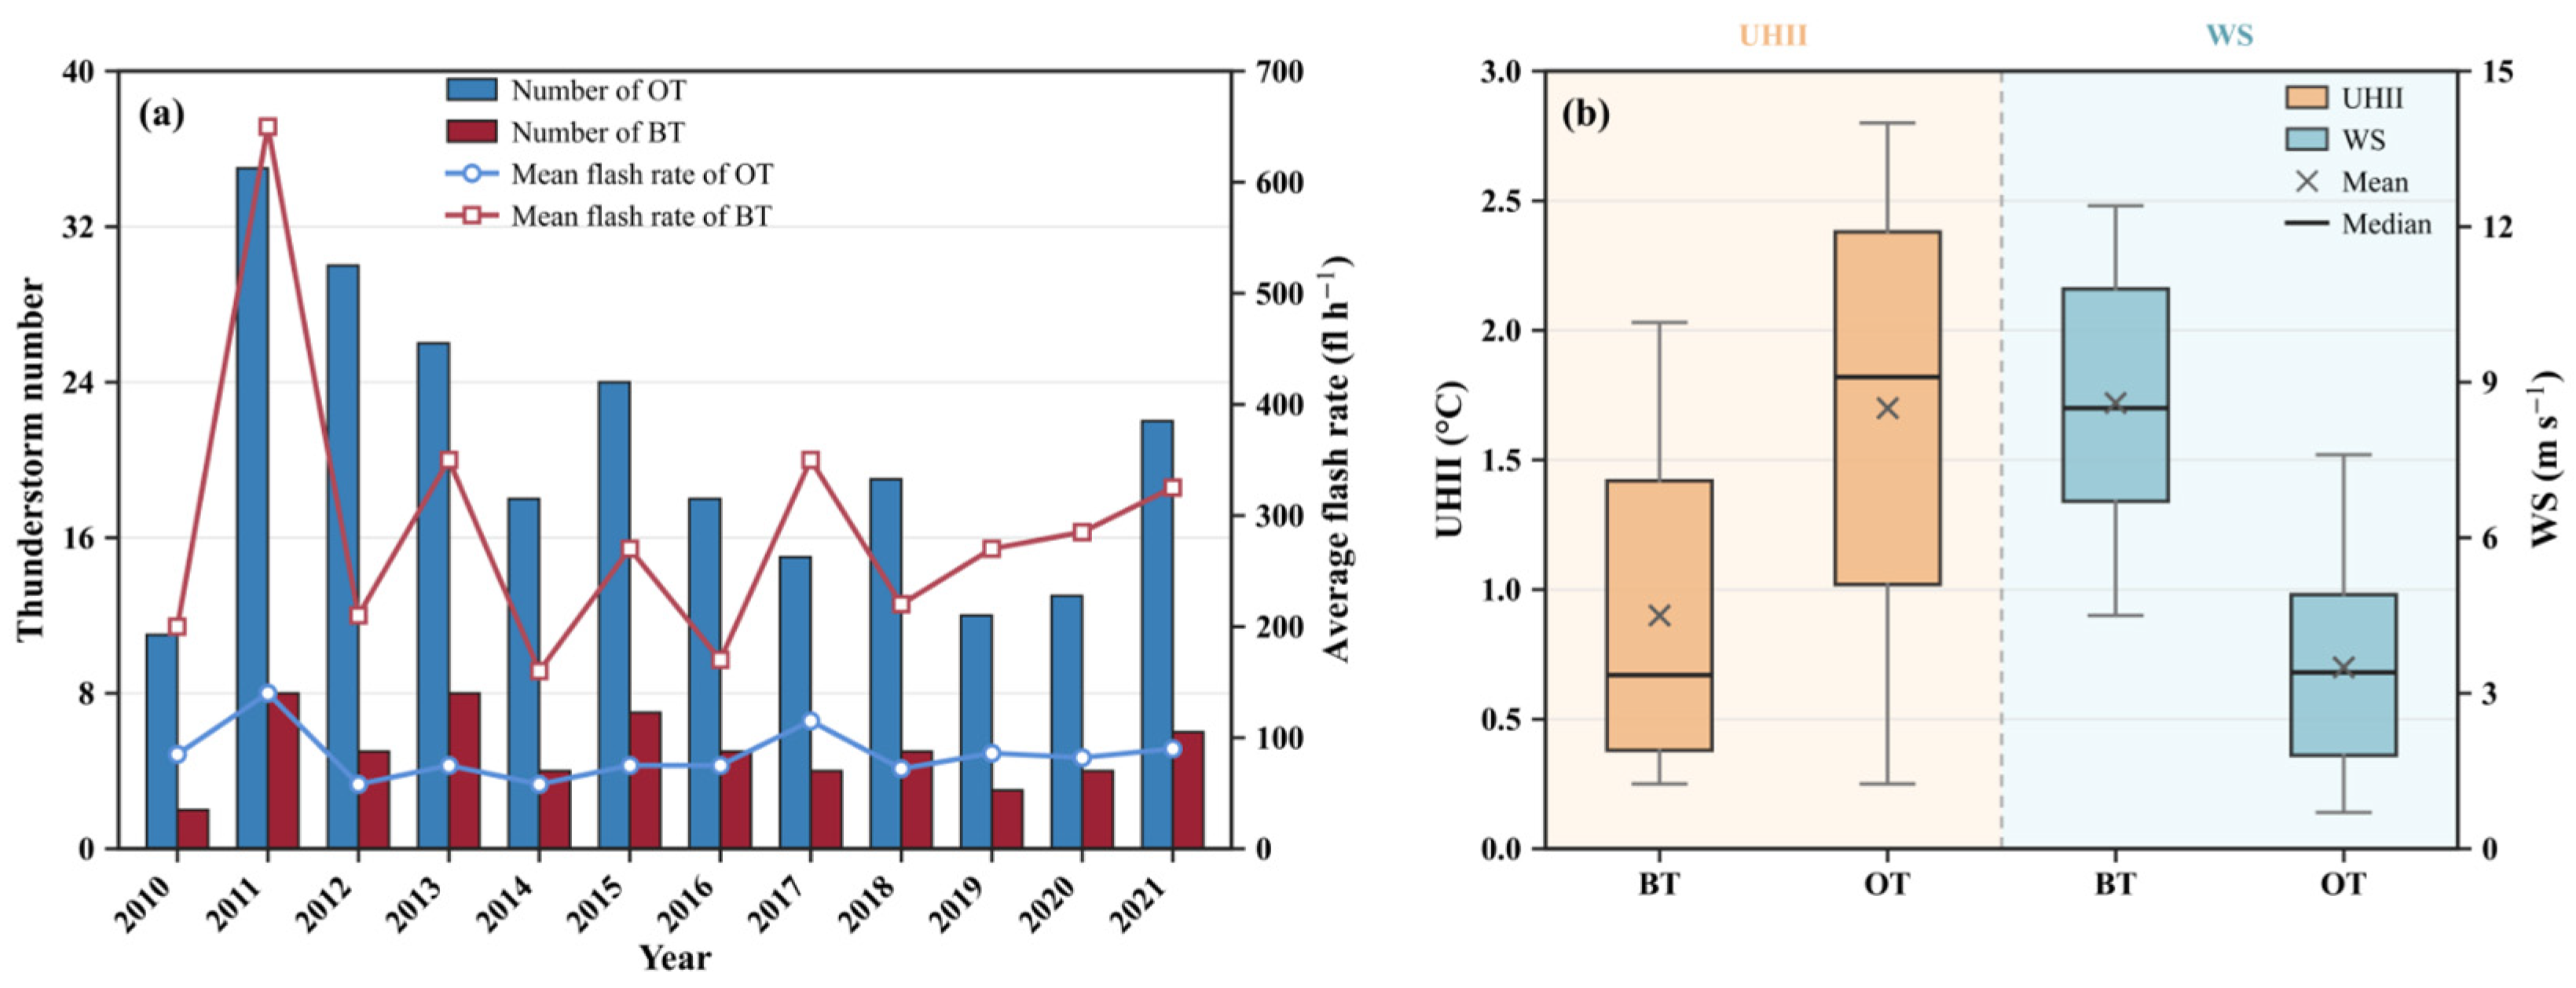
Based on the process analysis in Figure 10, Figure 11 further compares the statistical characteristics of OTs and BTs. Overall, OTs occurred more frequently than BTs, indicating that persistent bifurcation was not the dominant form of thunderstorm passage over Beijing. For example, OTs reached about 35 events in 2011, whereas only about 8 BT events occurred. However, BTs generally showed higher mean CG flash rates than OTs, especially in 2011, 2013, 2017, and 2021. In 2011, the mean CG flash rate of BTs exceeded 600 fl h−1, much higher than that of OTs, which was about 130 fl h−1. Thus, although BTs accounted for a smaller proportion of the selected events, it contributed disproportionately to CG lightning activity. The near-surface thermal–dynamic environments of OTs and BTs also differed. BTs were associated with lower UHII but higher near-surface WS than OTs. The median UHII before BTs was about 0.7 °C, compared with about 1.8 °C before OTs, whereas the median WS before BTs was about 8.5 m s−1, higher than the value of about 3.4 m s−1 before OTs. These results characterize the contrasting near-surface environments associated with the two operational event groups, and their possible mechanistic implications are discussed in Section 4.

4. Discussion

UHII is affected not only by the existing urban thermal contrast but also by storm-induced cooling, rainfall evaporation, and cold pool outflows, while near-surface WS reflects the combined effects of background flow, urban drag, terrain, and storm-generated outflows. Weisman and Klemp [18] showed that storm organization and splitting depend fundamentally on the interaction among environmental buoyancy, vertical wind shear, and storm-generated outflows. Environmental instability and moisture also regulate storm development [18,19], while vertical wind shear affects the interaction among inflow, cold pool outflow, and convective updrafts [20]. Accordingly, the urban surface is considered a possible local perturbation superimposed on storm structures controlled primarily by the background environment, cold pool evolution, terrain, and internal storm dynamics. The two cases are therefore used to illustrate possible thermal and dynamical pathways during urban passage.
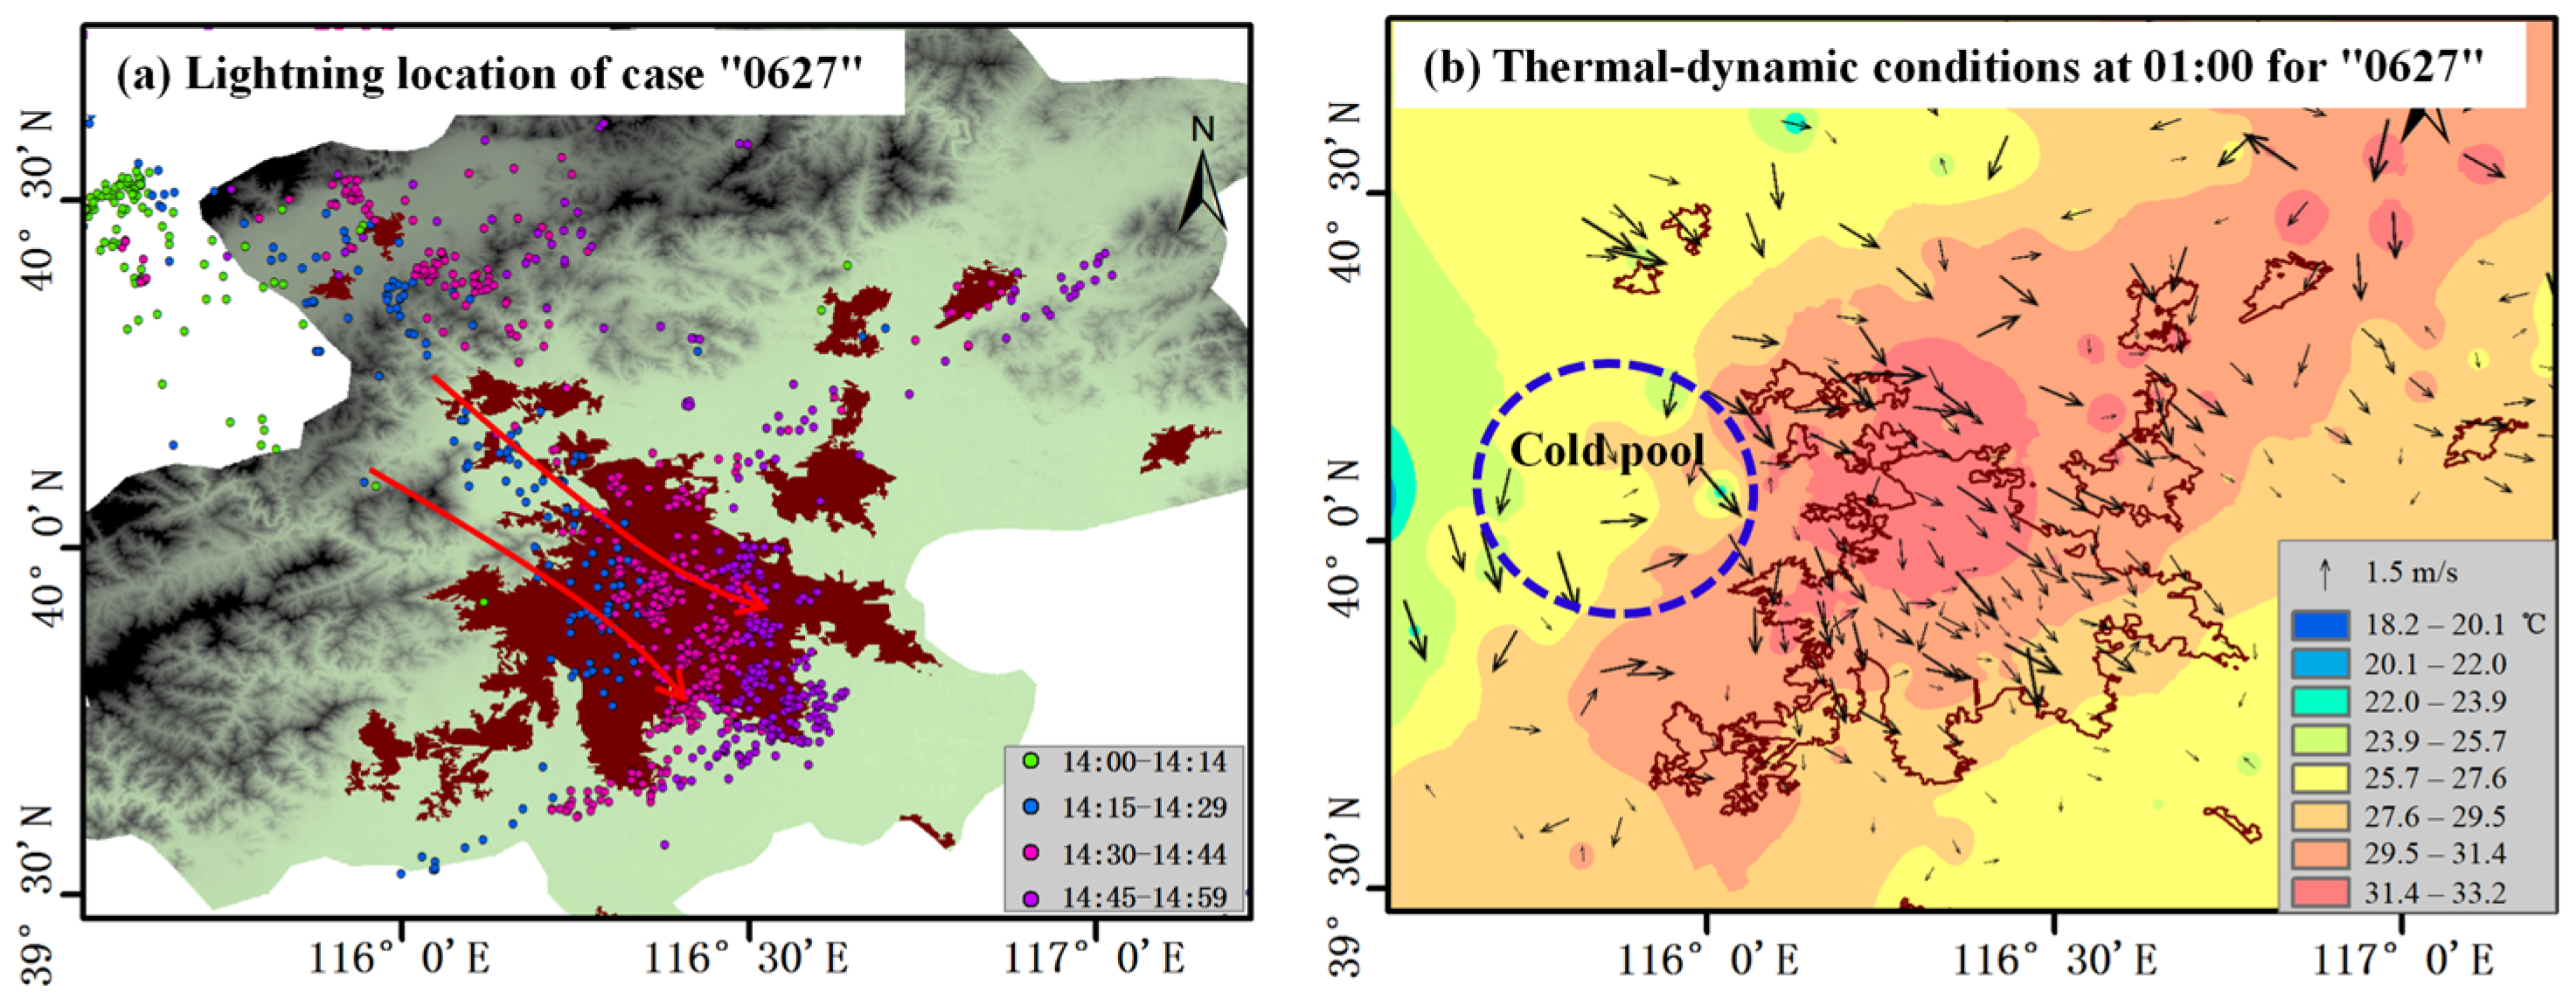
Figure 12 shows the “0627” OT case, which passed through the built-up area and produced 144 CG flashes. Before the thunderstorm passed over the city, UHII remained relatively high at 2.35 °C. Following the simplified Boussinesq framework of Sun and Yang [6], the perturbation pressure and potential temperature perturbation can be related as:
π z = λ θ
and the tendency of vertical wind shear can be expressed as
t u z λ θ x
where π is the perturbation pressure, θ is the potential temperature perturbation, λ is a proportional coefficient, and u is the horizontal wind component along the storm’s direction of movement. The horizontal thermal gradient between the cooler storm outflow and the warmer urban surface may therefore contribute to local changes in near-surface shear. The associated vertical motion can be interpreted using the two dimensional continuity equation,
u x + w z = 0
where w is vertical velocity. When near-surface convergence occurs, upward motion is favored. Thus, in this OT case, the retained urban thermal contrast may have contributed to local convergence and updraft maintenance during urban passage, consistent with previous studies emphasizing the roles of instability, wind shear, and urban thermal forcing in convective development [6,18,19,20]. However, the observations do not demonstrate that UHII directly determined the location or intensity of CG lightning; it represents only one component of the thermal–dynamic environment acting on an already developing thunderstorm.
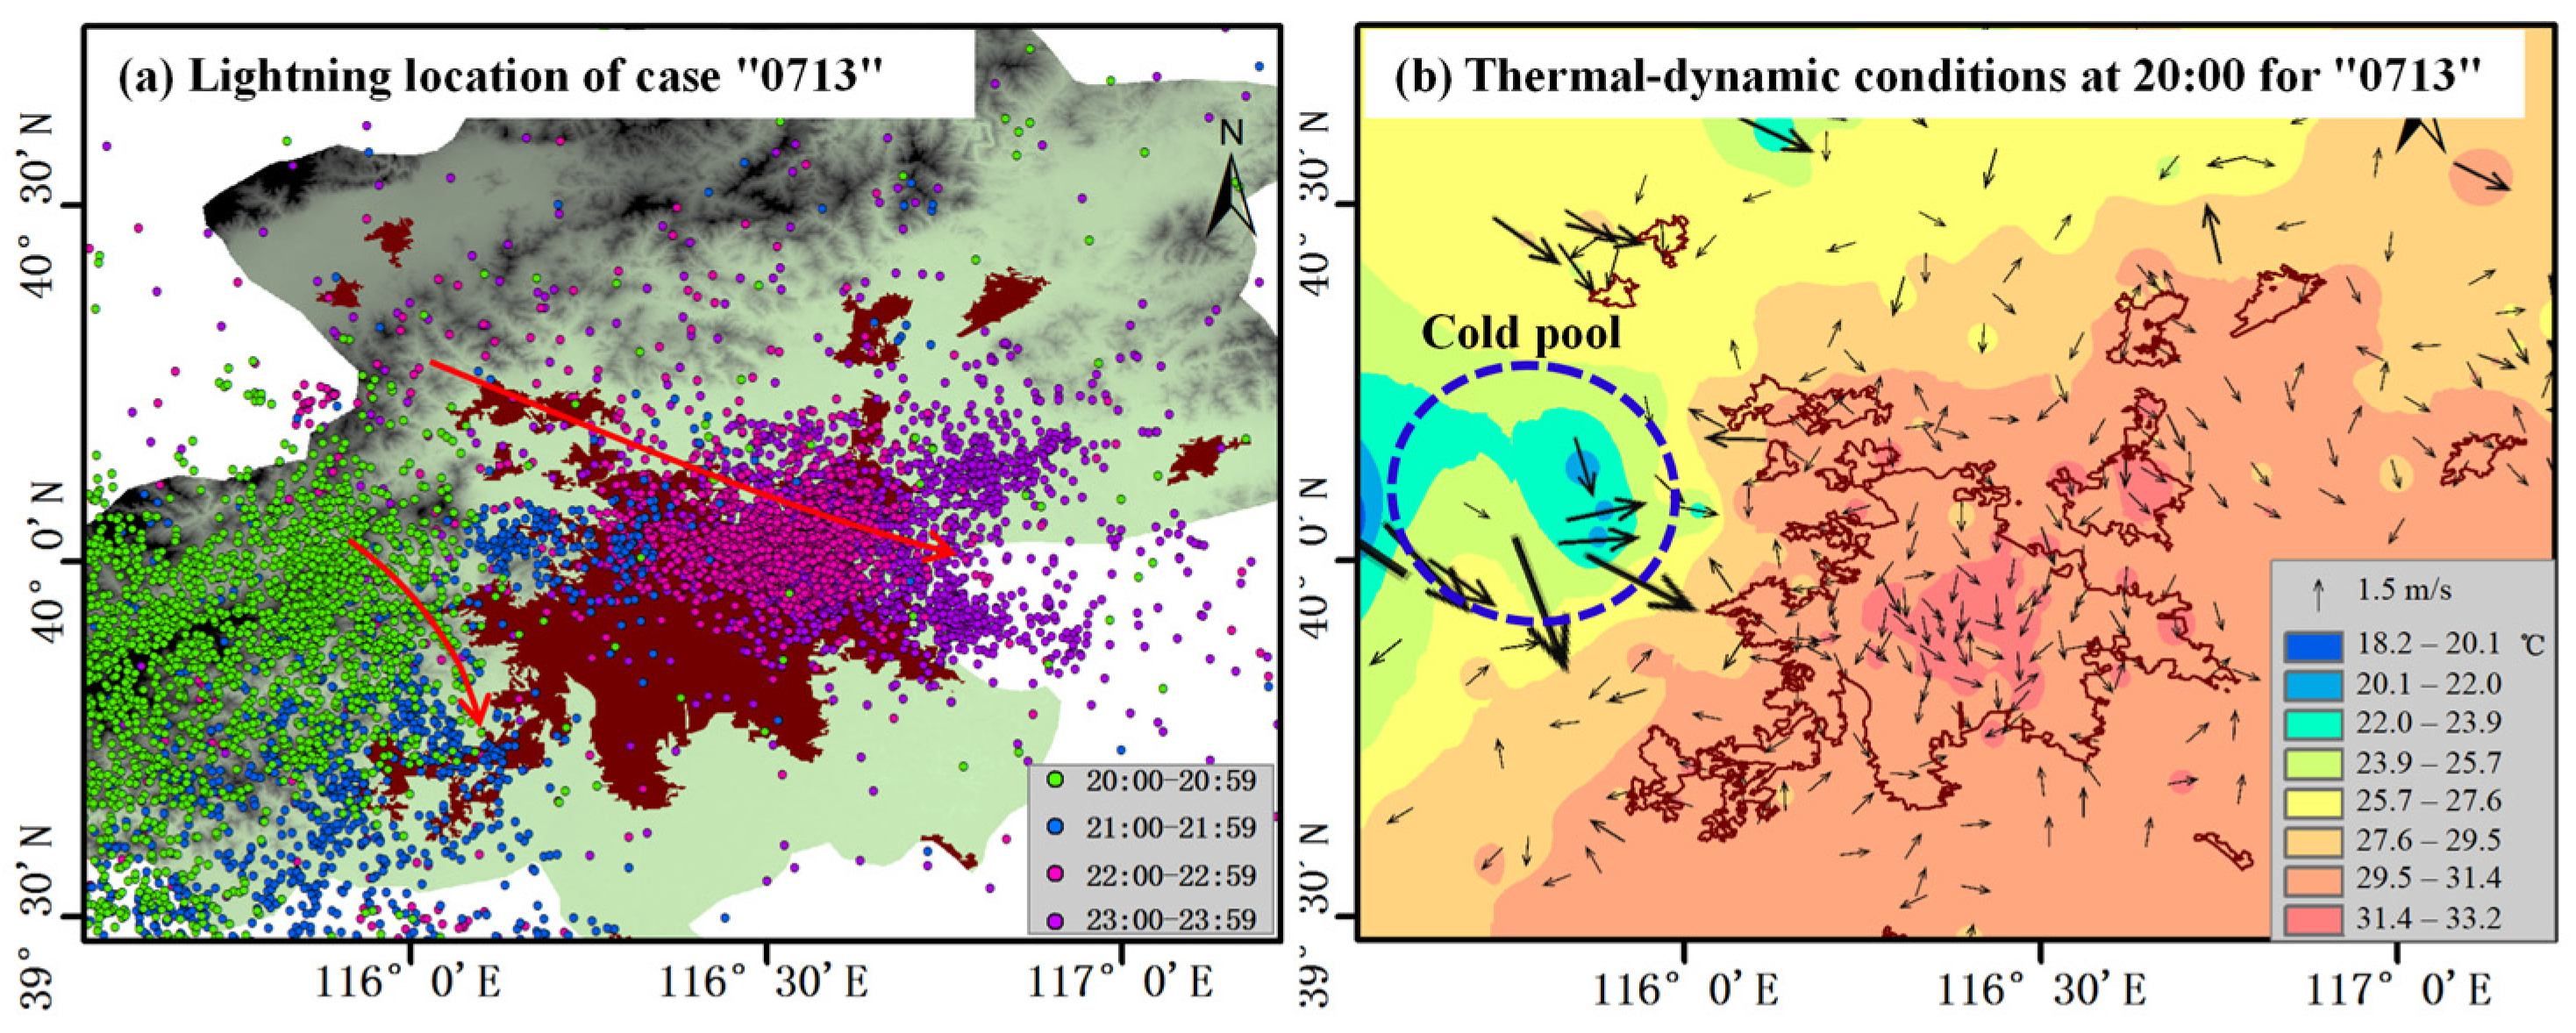
Figure 13 shows the “0713” BT case, which produced 2124 CG flashes and was associated with a UHII of 0.71 °C and higher near-surface WS. A cold pool developed as the storm moved from the eastern Taihang Mountains toward the northwestern edge of the built-up area, with a maximum WS of 7.1 m s−1 at the cold pool front. As the system moved eastward, the outflow boundary separated near the urban edge, and CG lightning became concentrated along the peripheral branches. Previous studies have reported that urban land use may modify thunderstorm propagation and contribute to storm detouring or bifurcation near urban boundaries [12,14,15,33]. To provide a qualitative interpretation, the three-dimensional perturbation momentum equation can be written as:
D V D t = π f k × V + b k F u + R
where V = ( u , v , w ) is the three-dimensional wind vector, π is the perturbation pressure, f is the Coriolis parameter, b is the buoyancy, F u represents the surface drag acceleration, and R includes turbulent mixing and other unresolved terms. The horizontal component of urban drag can be approximated as
F u , h C D V h V h h
where C D is an effective surface drag coefficient related to urban roughness and h is the depth over which surface drag acts on the cold pool outflow. Neither parameter was directly observed in this study. For order-of-magnitude interpretation, previous urban and cold pool studies generally suggest an h of approximately 0.5–2.0 km and C D on the order of 10−3–10−2 [12,14,15,33,39,40]. Projecting the horizontal momentum equation onto the storm moving direction gives
d U d t π x + f V C D U U h + R x
where U is the along-storm outflow speed, V is the cross-storm wind component, and R x represents turbulent mixing and other unresolved along-storm accelerations. Buoyancy does not appear directly in the horizontal projection but affects cold pool propagation through the pressure perturbation, density current structure, and outflow depth h . Over the relatively short urban crossing stage, the Coriolis contribution is expected to be smaller than the pressure gradient and drag terms, but it is retained here for completeness. Under otherwise comparable pressure gradient forcing and cold pool structure, a larger effective C D over the densely built urban core would produce stronger deceleration of the central outflow branch. The lateral branches may therefore appear relatively faster because they experience weaker deceleration, rather than active acceleration along the urban edge. The slowdown of the central branch may also redirect part of the outflow toward the sides and promote mass convergence where the deflected flow encounters ambient inflow or the urban transition zone. Thus, differential drag may mainly explain the deformation and bifurcation of the outflow boundary, whereas the associated edge convergence and mechanical lifting may contribute more directly to the peripheral enhancement of CG lightning [12,39,40]. This interpretation is consistent with the peripheral CG lightning distribution, but Equations (4)–(6) are only a qualitative framework. The available observations cannot quantify the relative contributions of surface drag, pressure gradient forcing, buoyancy, environmental wind shear, terrain, and internal storm evolution.
Overall, the two cases indicate that urban modulation depends on the existing storm structure and its environmental setting. In the OT case, the relatively strong UHII and lower WS suggest that the retained urban thermal contrast may help to maintain local convergence and upward motion. In the BT case, the weak or negative UHII and higher WS indicate that cold pool dynamics and outflow boundary deformation may play more important roles, while urban roughness may act only as a local modulating factor. Studies in other cities also show that urban effects do not necessarily appear as uniform enhancement over the urban center. In Atlanta, lightning exhibited pronounced spatial heterogeneity: under conditions dominated by local surface heating and air mass instability, its distribution was more closely associated with urban land use, whereas under frontal conditions, lightning maxima tended to occur near the periphery of the urban core [33]. In Belo Horizonte, both positive and negative CG lightning densities increased over the city and its downwind area, while peak current showed no clear urban effect [10]. Research over the Pearl River Delta further showed that urban influences on convection and precipitation vary with synoptic background and are jointly modulated by regional terrain, moisture transport, and storm organization [31]. These findings suggest that urban effects may be expressed as a spatial reorganization of lightning or convective activity, with their location and magnitude depending on background flow, storm structure, and urban surface characteristics. In Beijing, CG lightning maxima occurred more frequently near the built-up edge and adjacent transition zones than persistently over the inner urban area. This pattern may be related to the heterogeneous urban surface, the mountain plain setting, and the dominant northwest-to-southeast storm movement.
Several limitations should also be noted. OTs and BTs were identified mainly through manual interpretation of consecutive radar echoes, and complex echo structures or borderline cases may introduce classification uncertainty. The available observations and ERA5 data also cannot reliably separate the relative contributions of urban and topographic effects. In addition, possible changes in SGLNET performance during the study period, including the reported system improvement in 2018, may have affected absolute flash counts, the detection of weak events, and part of the apparent interannual variability. The present analysis distinguishes the urban core, built-up edge, and adjacent transition zones but does not resolve industrial, residential, commercial, or other functional land-use types. Moreover, the 3 h pre-storm UHII and WS window was used to characterize the environmental conditions rather than to evaluate warning performance and should not be interpreted as an operational warning lead time. Future work will combine finer urban land-use classification, object-based echo tracking, automated splitting identification, and warning verification at different lead times. Lightning data homogenization, when sufficient network metadata become available, and convection-permitting sensitivity experiments with modified urban land use, surface roughness, and terrain will also be needed to quantify the relative contributions of urban thermal effects, aerodynamic drag, topography, and storm-scale dynamics.

5. Conclusions

This study investigated the modulation of CG lightning activity by the urban environment of Beijing, a typical megacity in North China. Using multi-source observations, including CG lightning data from SGLNET, automatic weather station observations, Doppler radar data, remote-sensing-derived built-up area information, DEM data, and ERA5 reanalysis, we examined the temporal variation, spatial distribution, near-surface thermal–dynamic conditions, and thunderstorm evolution associated with CG lightning over the Beijing built-up area during 2010–2021.
The results indicate three main findings. First, CG lightning activity over the Beijing built-up area shows a clear edge-enhanced pattern. During 2010–2021, high-density CG flash centers did not persistently occur over the urban core but were more frequently located near the built-up edge and adjacent transition zones. This suggests that the urban influence on CG lightning is mainly expressed as a reorganization of lightning spatial patterns rather than a simple enhancement over the city center. Second, under relatively weak storm organization, urban thermal perturbations may be more directly involved in maintaining local convergence and upward motion. When pre-storm UHII is relatively strong and near-surface WS is weak, the thermal contrast between the warmer urban surface and cooler storm outflow or surrounding air may favor low-level convergence, local lifting, and updraft maintenance, thereby providing favorable near-surface thermal–dynamic conditions for CG lightning. Finally, under the strong synoptic background, urban thermal perturbations tend to weaken, whereas urban roughness and associated barrier effects may play a relatively larger role. Cold pool outflows, higher near-surface WS, urban roughness contrasts, and outflow-boundary deformation may promote storm splitting or detouring along the built-up edge. Higher surface drag over the urban core may weaken the central outflow branch, whereas lateral branches can propagate along less obstructed urban margins, causing CG lightning to concentrate near the urban periphery. The 0713 bifurcated thunderstorm case and the statistical comparison between ordinary and bifurcated thunderstorms are both consistent with this interpretation.
These findings suggest that the impact of a megacity on CG lightning should not be interpreted solely through the UHII. In Beijing, the urban surface acts as a complex thermal–dynamic perturbation, and its influence depends strongly on thunderstorm organization, near-surface WS conditions, cold pool evolution, and the spatial contrast between the urban core and built-up edge. The edge-enhanced lightning pattern indicates that operational monitoring should not focus only on the urban core. When organized thunderstorms approach the city, particularly when radar observations show outflow-boundary deformation or storm bifurcation near the built-up area, additional attention should be given to the built-up edge and adjacent transition zones. Because the present study did not distinguish detailed urban functional land-use types or evaluate warning performance at different lead times, no land-use-specific risk ranking or quantitative warning lead time is proposed. Future work should integrate finer urban land-use information, object-based storm tracking, and independent warning verification.

Author Contributions

Conceptualization, G.L.; methodology, T.S.; software, T.S.; validation, T.S.; formal analysis, T.S.; investigation, T.S.; resources, G.L.; data curation, T.S.; writing—original draft preparation, T.S.; writing—review and editing, T.S. All authors have read and agreed to the published version of the manuscript.

Funding

This research has been supported by the Anhui Provincial Natural Science Foundation (Grant No. 2508085MD088), Urban Meteorology and Artificial Intelligence Key Laboratory Open Fund (LUM-2026-09), the Nanjing Joint Institute for Atmospheric Sciences Open Research Fund (Grant No. BJG202506), the Anhui Provincial Department of Education Scientific Research Project (Grant No. 2025AHGXZK20078), the Open Project of Digital and Intelligent Manufacturing of Copper-Based Materials in Anhui Province (Grant No. 2024tlxyptZD05), the Research Start-up Fund for Talents of Tongling University (Grant No. 2024tlxyrc025), and the Open Grants of Key Laboratory of Radar Meteorology, China Meteorological Administration.

Data Availability Statement

The hourly AWS observation data and operational Doppler weather radar observations used in this study were obtained from the China Meteorological Data Service Center. The ERA5 hourly reanalysis data are publicly available from the Copernicus Climate Data Store. The CG lightning data used in this study were obtained from SGLNET and are not publicly available because of data-use restrictions; however, they may be obtained from SGLNET upon application and approval by the data provider.

Conflicts of Interest

The authors declare no conflicts of interest.

References

  1. Ulrickson, B.L. Effects of surface property variations on simulated daytime airflow over coastal southern California. Mon. Weather Rev. 1992, 120, 2264–2279. [Google Scholar] [CrossRef]
  2. Liu, X.; Hu, F.; Li, L.; Wang, Y. Summer urban climate trends and environmental effect in the Beijing area. Chin. J. Geophys. 2006, 49, 689–697. [Google Scholar] [CrossRef]
  3. Shi, T.; Huang, Y.; Shi, C.; Yang, Y. Influence of urbanization on the thermal environment of meteorological stations: Satellite-observational evidence. Adv. Clim. Change Res. 2015, 1, 7–15. [Google Scholar] [CrossRef]
  4. Yang, Y.; Guo, M.; Wang, L.; Zong, L.; Liu, D.; Zhang, W.; Wang, M.; Wan, B.; Guo, Y. Unevenly spatiotemporal distribution of urban excess warming in coastal Shanghai megacity, China: Roles of geophysical environment, ventilation and sea breezes. Build. Environ. 2023, 235, 110180. [Google Scholar] [CrossRef]
  5. Shepherd, J.M. A review of current investigations of urban-induced rainfall and recommendations for the future. Earth Interact. 2005, 9, 1–27. [Google Scholar] [CrossRef]
  6. Sun, J.; Yang, B. Meso-β scale torrential rain affected by topography and the urban circulation. Chin. J. Atmos. Sci. 2008, 32, 1352–1364. [Google Scholar]
  7. Qie, X.; Yuan, S.; Chen, Z.; Wang, D.; Liu, D.; Sun, M.; Sun, Z.; Srivastava, A.; Zhang, H.; Lu, J.; et al. Understanding the dynamical-microphysical-electrical processes associated with severe thunderstorms over the Beijing metropolitan region. Sci. China Earth Sci. 2021, 64, 10–26. [Google Scholar]
  8. Westcott, N.E. Summertime cloud-to-ground lightning activity around major midwestern urban areas. J. Appl. Meteorol. 1995, 34, 1633–1642. [Google Scholar] [CrossRef]
  9. Soriano, L.R.; de Pablo, F. Effect of small urban areas in central Spain on the enhancement of cloud-to-ground lightning activity. Atmos. Environ. 2002, 36, 2809–2816. [Google Scholar] [CrossRef]
  10. Pinto, I.R.C.A.; Pinto, O., Jr.; Gomes, M.A.S.S.; Ferreira, N.J. Urban effect on the characteristics of cloud-to-ground lightning over Belo Horizonte-Brazil. Ann. Geophys. 2004, 22, 697–700. [Google Scholar] [CrossRef]
  11. Wang, Y.; Lu, G.; Shi, T.; Ma, M.; Zhu, B.; Liu, D.; Peng, C.; Wang, Y. Enhancement of cloud-to-ground lightning activity caused by the urban effect: A case study in the Beijing metropolitan area. Remote Sens. 2021, 13, 1228. [Google Scholar] [CrossRef]
  12. Shi, T.; Yang, Y.; Zheng, Z.; Tian, Y.; Huang, Y.; Lu, Y.; Shi, C.; Liu, L.; Zi, Y.; Wang, Y.; et al. Potential urban barrier effect to alter patterns of cloud-to-ground lightning in Beijing metropolis. Geophys. Res. Lett. 2022, 49, e2022GL100081. [Google Scholar] [CrossRef]
  13. Sun, X.; Luo, Y.; Gao, X.; Wu, M.; Li, M.; Huang, L.; Zhang, D.-L.; Xu, H. On the localized extreme rainfall over the Great Bay Area in south China with complex topography and strong UHI effects. Mon. Weather Rev. 2021, 149, 2777–2801. [Google Scholar]
  14. Bornstein, R.; LeRoy, M. Urban barrier effects on convective and frontal thunderstorms. In Proceedings of the Fourth Conference on Mesoscale Processes, Boulder, CO, USA, 25–29 June 1990; American Meteorological Society: Boston, MA, USA, 1990; pp. 120–121. [Google Scholar]
  15. Dou, J.; Wang, Y.; Bornstein, R.; Miao, S. Observed spatial characteristics of Beijing urban climate impacts on summer thunderstorms. J. Appl. Meteorol. Sci. 2015, 54, 94–105. [Google Scholar] [CrossRef]
  16. Yang, P.; Ren, G.; Liu, W. Spatial and temporal characteristics of Beijing urban heat island intensity. J. Appl. Meteorol. Climatol. 2013, 52, 1803–1816. [Google Scholar] [CrossRef]
  17. Zong, L.; Liu, S.; Yang, Y.; Ren, G.; Yu, M.; Zhang, Y.; Li, Y. Synergistic influence of local climate zones and wind speeds on the urban heat island and heat waves in the megacity of Beijing, China. Front. Earth Sci. 2021, 9, 673786. [Google Scholar] [CrossRef]
  18. Weisman, M.L.; Klemp, J.B. The structure and classification of numerically simulated convective storms in directionally varying wind shears. Mon. Weather Rev. 1984, 112, 2479–2498. [Google Scholar] [CrossRef]
  19. Chen, M.; Wang, Y. Numerical simulation study of interactional effects of the low-level vertical wind shear with the cold pool on a squall line evolution in North China. Acta Meteorol. Sin. 2012, 70, 371–386. [Google Scholar]
  20. Sun, J.; He, N.; Guo, R.; Chen, M. The configuration change and train effect mechanism of multi-cell storms. Chin. J. Atmos. Sci. 2013, 37, 137–148. [Google Scholar]
  21. Chen, S.; Wang, Y.; Zhang, W.; Chen, M. Intensifying mechanism of the convective storm moving from the mountain to the plain over Beijing area. Meteorol. Mon. 2011, 37, 802–813. [Google Scholar]
  22. Xiao, X.; Sun, J.; Chen, M.; Qie, X.; Wang, Y.; Ying, Z. The characteristics of weakly forced mountain-to-plain precipitation systems based on radar observations and high-resolution reanalysis. J. Geophys. Res. Atmos. 2017, 122, 3193–3213. [Google Scholar] [CrossRef]
  23. Li, R.; Lu, X.; Zhang, H.; Li, J.; Zhang, Y. Temporal and spatial distribution characteristics of cloud-to-ground flash from 2008 to 2010 in Beijing. Meteorol. Environ. Sci. 2013, 36, 52–56. [Google Scholar]
  24. Wang, D.; Qie, X.; Yuan, S.; Sun, Z.; Chen, Z.; Li, J.; Zhang, H.; Liu, M.; Srivastava, A.; Liu, D. Spatial and temporal distribution of lightning activity and contribution of thunderstorms with different lightning-producing capabilities in Beijing metropolitan region. Chin. J. Atmos. Sci. 2020, 44, 225–238. [Google Scholar]
  25. Yang, J.; Huang, X. The 30 m annual land cover dataset and its dynamics in China from 1990 to 2019. Earth Syst. Sci. Data 2021, 13, 3907–3925. [Google Scholar] [CrossRef]
  26. Chen, L.; Zhang, Y.; Lu, W.; Zheng, D.; Zhang, Y.; Chen, S.; Huang, Z. Performance evaluation for a lightning location system based on observations of artificially triggered lightning and natural lightning. J. Atmos. Ocean. Technol. 2012, 29, 1835–1844. [Google Scholar] [CrossRef]
  27. Orville, R.E.; Huffines, G.R.; Burrows, W.R.; Holle, R.L.; Cummins, K.L. The North American Lightning Detection Network (NALDN)-first results: 1998–2000. Mon. Weather Rev. 2002, 130, 2098–2109. [Google Scholar] [CrossRef]
  28. Schulz, W.; Cummins, K.; Diendorfer, G.; Dorninger, M. Cloud-to-ground lightning in Austria: A 10-year study using data from a lightning location system. J. Geophys. Res. Atmos. 2005, 110, D09101. [Google Scholar] [CrossRef]
  29. Xu, W.; Li, Q.; Wang, X.L.; Yang, S.; Cao, L.; Feng, Y. Homogenization of Chinese daily surface air temperatures and analysis of trends in the extreme temperature indices. J. Geophys. Res. Atmos. 2013, 118, 9708–9720. [Google Scholar] [CrossRef]
  30. Shi, T.; Yang, Y.; Qi, P.; Lolli, S. Diurnal variation in an amplified canopy urban heat island during heat wave periods in the megacity of Beijing: Roles of mountain–valley breeze and urban morphology. Atmos. Chem. Phys. 2024, 24, 12807–12822. [Google Scholar] [CrossRef]
  31. Du, X.; Chen, H.; Luo, Y.; Li, Q.; Feng, Z.; Leung, L.R. Unveiling the urban impact on mesoscale convective system rainfall in the Pearl River Delta urban agglomeration under typical synoptic backgrounds. J. Geophys. Res. Atmos. 2024, 129, e2024JD042409. [Google Scholar] [CrossRef]
  32. Cao, Q.; Guo, J.; Xue, C.; Li, Z.; Xu, H.; Li, N.; Sun, Y.; Zhang, Z.; Wang, Y.; Chen, Y.; et al. Divergent sounding-derived precursor pathways enable discrimination of dry versus wet severe convective winds. Geophys. Res. Lett. 2025, 52, e2025GL117491. [Google Scholar] [CrossRef]
  33. Stallins, J.A.; Bentley, M.L. Urban lightning climatology and GIS: An analytical framework from the case study of Atlanta, Georgia. Appl. Geogr. 2006, 26, 242–259. [Google Scholar] [CrossRef]
  34. Chronis, T.G.; Goodman, S.J.; Cecil, D.; Buechler, D.; Robertson, F.J.; Pittman, J.; Blakeslee, R.J. Global lightning activity from the ENSO perspective. Geophys. Res. Lett. 2008, 35, L19804. [Google Scholar] [CrossRef]
  35. Wu, Y.J.; Chen, A.B.; Hsu, H.H.; Chou, J.K.; Chang, S.C.; Lee, L.J.; Lee, Y.J.; Su, H.T.; Kuo, C.L.; Hsu, R.R.; et al. Occurrence of elves and lightning during El Niño and La Niña. Geophys. Res. Lett. 2012, 39, L03106. [Google Scholar] [CrossRef]
  36. Yuan, T.; Di, Y.; Qie, K. Variability of lightning flash and thunderstorm over East/Southeast Asia on the ENSO time scales. Atmos. Res. 2016, 169, 377–390. [Google Scholar] [CrossRef]
  37. Xu, M.; Qie, X.; Zhao, C.; Yuan, S.; Li, J.; Tao, Y.; Shi, G.; Pang, W.; Shi, L. Distribution of lightning spatial modes and climatic causes in China. Atmos. Ocean. Sci. Lett. 2023, 16, 100338. [Google Scholar] [CrossRef]
  38. Kim, Y.H.; Baik, J.J. Spatial and temporal structure of the urban heat island in Seoul. J. Appl. Meteorol. Climatol. 2005, 44, 591–605. [Google Scholar] [CrossRef]
  39. Torri, G.; Kuang, Z.; Tian, Y. Mechanisms for convection triggering by cold pools. Geophys. Res. Lett. 2015, 42, 1943–1950. [Google Scholar] [CrossRef]
  40. Meyer, B.; Haerter, J.O. Mechanical forcing of convection by cold pools: Collisions and energy scaling. J. Adv. Model. Earth Syst. 2020, 12, 11. [Google Scholar] [CrossRef] [PubMed]
Figure 1. Location of Beijing and distribution of automatic weather stations. (a) Regional topography and location of Beijing in North China. (b) Spatial distribution of urban and reference stations, built-up areas, and buffer zone within Beijing.
Remotesensing 18 02705 g001
Figure 2. Flowchart of the data and methods.
Remotesensing 18 02705 g002
Figure 3. Interannual and hourly variations in thunderstorm frequency and CG lightning activity over the Beijing built-up area during 2010–2021.
Remotesensing 18 02705 g003
Figure 4. Spatial distribution of CG density over the Beijing built-up area from 2010 to 2021. Flash density was calculated directly from the CG flash records, and the black outlines denote the built-up area.
Remotesensing 18 02705 g004
Figure 5. Interannual (a) and hourly (b) variations in CG flash number, WS, and UHII within the built-up area of Beijing. The annotations below each panel report Pearson’s correlation coefficients (r) and corresponding significance levels (p) between CG flash number and UHII or WS.
Remotesensing 18 02705 g005
Figure 6. Spatial patterns of WS in the built-up area of Beijing from 2010 to 2021.
Remotesensing 18 02705 g006
Figure 7. Spatial patterns of air temperature in the built-up area of Beijing from 2010 to 2021.
Remotesensing 18 02705 g007
Figure 8. Composite circulation and environmental conditions for thunderstorms under weak and strong backgrounds. (a) 850 hPa geopotential height and wind field, (b) relative humidity, (c) convective available potential energy (CAPE), and (d) low-level wind shear. The left and right columns in each panel represent weak and strong backgrounds, respectively. The red star denotes the location of Beijing.
Remotesensing 18 02705 g008
Figure 9. Spatial distributions of CG density under different thunderstorm backgrounds. (a) Weak background thunderstorms and (b) strong background thunderstorms. Upper panels show CG density distributions inside and outside the built-up area, with red lines indicating mean values. Lower panels show the corresponding spatial patterns, and black outlines denote the built-up area.
Remotesensing 18 02705 g009
Figure 10. Evolution of a bifurcated thunderstorm over the Beijing built-up area. (ae) Radar reflectivity and CG flashes at 20:00, 21:00, 21:30, 22:00, and 22:30. Black crosses indicate CG flashes, red outlines denote the built-up area, and arrows show convective cell movement. A and B mark the two storm branches. (f) Tracks of the two branches over terrain and built-up areas.
Remotesensing 18 02705 g010
Figure 11. Interannual variations and conditions of OTs and BTs over the Beijing built-up area. (a) Annual OT and BT numbers and their mean CG flash rates from 2010 to 2021. (b) Boxplots of pre-storm UHII and near-surface WS averaged at 3, 2, and 1 h before OT and BT arrival. Crosses and black lines denote the mean and median values, respectively.
Remotesensing 18 02705 g011
Figure 12. CG lightning activity and near-surface thermal–dynamic conditions during Case 1, an ordinary thunderstorm that affected the Beijing built-up area on 27 June 2017.
Remotesensing 18 02705 g012
Figure 13. CG lightning activity and near-surface thermal–dynamic conditions during Case 2, a bifurcated thunderstorm that affected the Beijing built-up area on 13 July 2017.
Remotesensing 18 02705 g013
Disclaimer/Publisher’s Note: The statements, opinions and data contained in all publications are solely those of the individual author(s) and contributor(s) and not of MDPI and/or the editor(s). MDPI and/or the editor(s) disclaim responsibility for any injury to people or property resulting from any ideas, methods, instructions or products referred to in the content.