Altitude and Geographic Sensitivity Characteristics of the AIRS Satellite Spectrometer and Drift Correction Using Methane (CH4) Data
 ,
,  ,
,  ,
,  and
and
Highlights
- The vertical sensitivity of the AIRS satellite spectrometer was assessed for initial CH4 concentration data across diverse geographic regions.
- Heterogeneity in AIRS spectrometer drift was identified for methane concentration data at different pressure levels in the v6/v7 AIRS CH4 VMR Standard L3 product, and the pressure levels with maximum drift were determined.
- Based on drift coefficients calculated for multiple pressure levels, a correction method for the AIRS v6/v7 series was developed and successfully applied.
- When using AIRS v6/v7 CH4 data at all levels of the standard pressure grid, drift correction is required.
- The proposed averaged AIRS spectrometer drift correction factors for CH4 measurements are effective at all pressure levels.
- Corrected AIRS CH4 data show significantly improved agreement with high-precision ground-based measurements; the proposed correction methodology can improve the quality of atmospheric analyses, forecasts and parameter estimates.
Abstract
1. Introduction
2. Materials and Methods
2.1. NDACC Ground Measurements (Basic Information)
- Using the barometric formula [43], which requires additional temperature profile data;
- Applying the International Standard Atmosphere (ISA) table [44] with interpolation between tabulated values;
- Extracting pressure values from ERA5 reanalysis fields [45], https://climate.copernicus.eu/climate-reanalysis, accessed 17 June 2026;
- Using NDACC’s own pressure data, provided at the same altitude levels as the methane data and averaged over the study period, which captures local pressure variations.
2.2. AIRS CH4 Products
2.3. Drift Correction Technique
3. Results
3.1. AIRS L3 v7 Validation
3.1.1. Determination of the Maximum Sensitivity Zone of the Initial Satellite Measurement Series
3.1.2. Determination of Zones of Maximum Drift Localization
3.2. Trends at Different Pressure Levels and AIRS v7 Drift Correction
3.3. Validation of AIRS L3 v6
4. Discussion
- For v6 total methane content (CH4 TC), use SSD = 1.64 × 10¹⁴ molecules/cm2/day (7.62 × 10⁻⁶ ppm/day) from [24];
- For v7 column-average X[CH4], use SSD = 7.20 × 10⁻⁶ ppm/day (1.55 × 10¹⁴ molecules/cm2/day);
- For individual levels in v6 and v7, use the level-specific factors listed in Tables S1-1 and S1-2 (v7) and Tables S7-1 and S7-2 (v6).
5. Limitations and Future Objectives
6. Conclusions
- We performed a sensitivity analysis of the CH4 AIRS Standard L3 IR AIRS Only Daily satellite products, Versions 7 and 6, across pressure levels from 925 to 1 mbar and across different geographic regions.
- The results obtained for both products are similar. At high-latitude sites, the zone of maximum sensitivity lies at 700–400 mbar, with modest maximum correlations (R ≈ 0.5–0.6) between original satellite and ground-based series. In mid-latitudes, the greatest agreement occurs at 500–200 mbar, with R up to 0.85 at 300 mbar (Jungfraujoch). In tropical/subtropical regions, maximum sensitivity is at 400–200 mbar, with R up to 0.92 at 300 mbar (Izana).
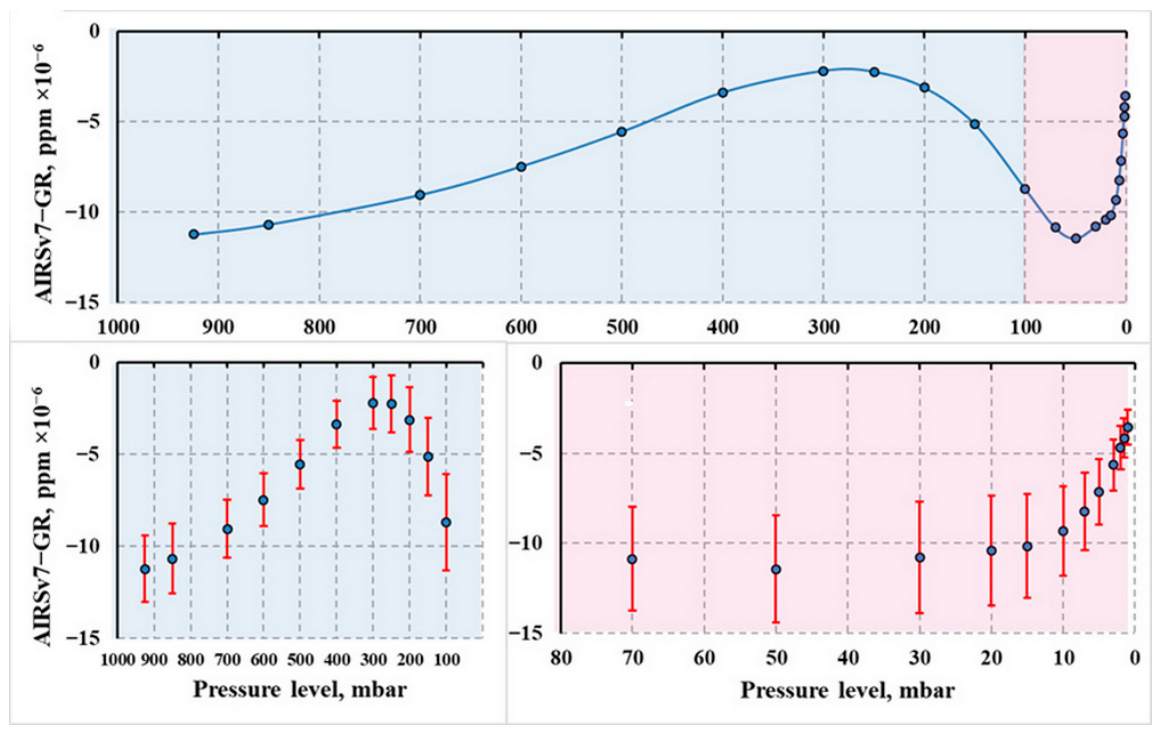
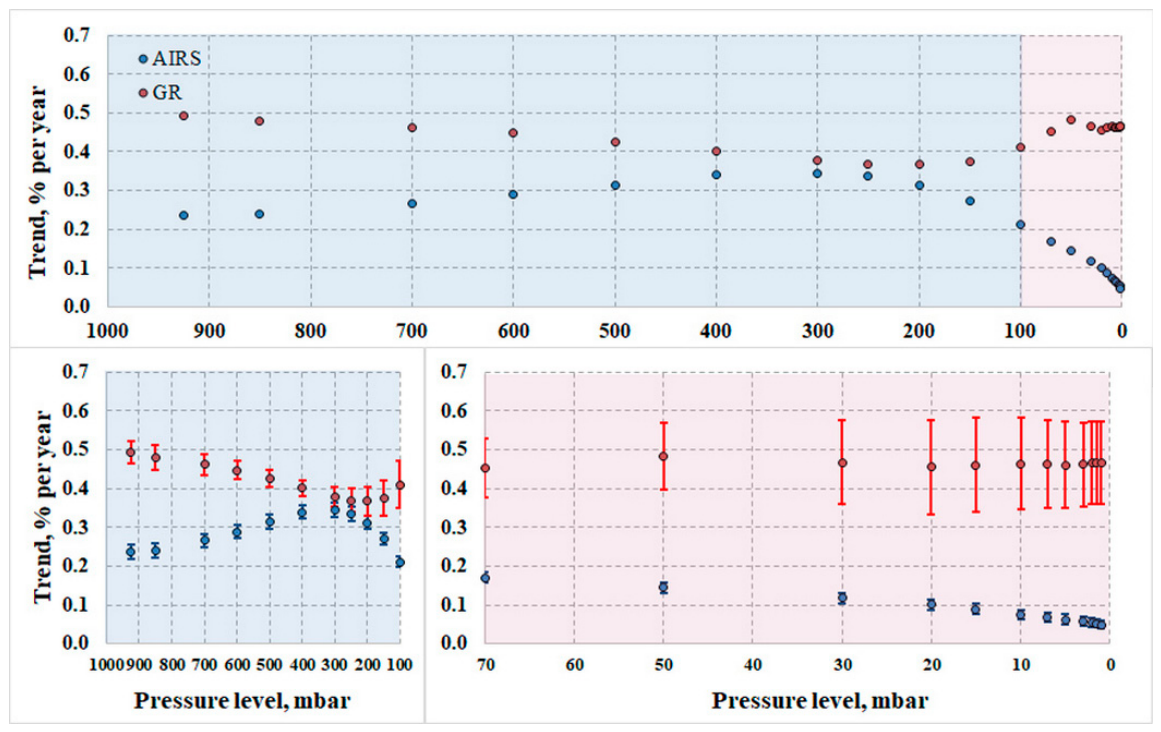
- Slope coefficients of the linear trend of the AIRS-GR difference were estimated for all statistically supported pressure levels from 925 to 1 mbar. We found a non-uniform but unidirectional negative trend whose magnitude varies by level, confirming drift in the AIRS CH4 VMR v6/v7 products across the full pressure grid.
- Zones of maximum drift were identified for the AIRS CH4 VMR v6/v7 products. The first lies at 925–850 mbar, where the drift coefficient reaches (1.12 ± 0.18) × 10−5 ppm/day. The second is near 50 mbar, with a slope of (1.15 ± 0.30) × 10−5 ppm/day. Accordingly, AIRS methane data should be adjusted at all pressure levels before use.
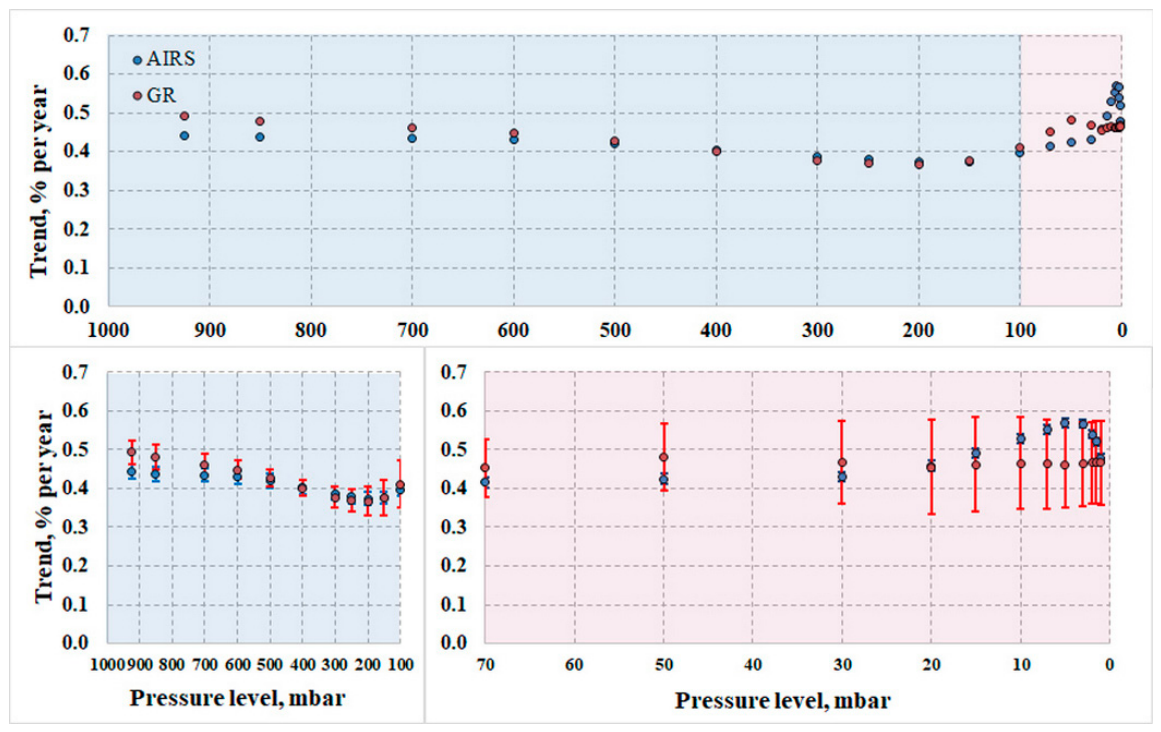
- Level-specific correction factors were computed and successfully applied for all pressure levels from 925 to 1 mbar. After correction, agreement between CH4 VMR trend estimates improved markedly. Prior to correction, trends derived from the original satellite and ground-based data differed by more than a factor of two, with the satellite underestimating the magnitude. After correction, discrepancies decreased at all levels, and station-averaged level trends overlapped within their confidence intervals, including for levels above 100 mbar.
- Application of correction factors increased correlations in all data series across all pressure levels.
Supplementary Materials
Author Contributions
Funding
Data Availability Statement
Acknowledgments
Conflicts of Interest
Abbreviations
| AIRS v6/v7 | Atmospheric InfraRed Sounder version 6/7 |
| CrIS | Cross-Track Infrared Sounder |
| IASI | Infrared Atmospheric Sounding Interferometer |
| CLIMCAPS | Community Long-Term Infrared Microwave Combined Atmospheric Product System |
| TROPOMI | TROPOspheric Monitoring Instrument |
| L3 | Level 3 (3rd data level) |
| NDACC | Network for the Detection of Atmospheric Composition Change |
| TCCON | Total Carbon Column Observing Network |
| SSD | Satellite spectrometer drift |
| SAT-GR/AIRS-GR | Satellite data minus ground-based data (the difference between satellite and ground-based data) |
| Ppm/Ppb | Parts per million/billion |
| NASA | National Aeronautics and Space Administration |
| TC | Total column |
| FTIR | Fourier-transform infrared spectrometer |
| X[GAS] | Thickness-averaged relative volume concentration of the detected gas in ppm/ppb |
| VMR | Volume mixing ratio |
| SC | Slope coefficient |
| asl | Above sea level |
| ND | No data |
References
- IIPCC: Summary for Policymakers. In Climate Change 2023: Synthesis Report. Contribution of Working Groups I, II and III to the Sixth Assessment Report of the Intergovernmental Panel on Climate Change; IPCC: Geneva, Switzerland, 2023; pp. 1–34.
- World Meteorological Organization. State of the Global Climate 2025. Update for COP30; WMO: Geneva, Switzerland, 2025; Available online: https://library.wmo.int/idurl/4/69674 (accessed on 20 May 2026).
- Myhre, G.; Shindell, D.; Bréon, F.-M.; Collins, W.; Fuglestvedt, J.; Huang, J.; Koch, D.; Lamarque, J.-F.; Lee, D.; Mendoza, B.; et al. Anthropogenic and natural radiative forcing. In Climate Change 2013: The Physical Science Basis; Contribution of Working Group I to the Fifth Assessment Report of the Intergovernmental Panel on Climate Change; Stocker, T.F., Ed.; Cambridge University Press: Cambridge, UK; New York, NY, USA, 2013; pp. 659–740. [Google Scholar]
- Etminan, M.; Myhre, G.; Highwood, E.J.; Shine, K.P. Radiative forcing of carbon dioxide, methane, and nitrous oxide: A significant revision of the methane radiative forcing. Geophys. Res. Lett. 2016, 43, 12614–12623. [Google Scholar] [CrossRef] [Scilit]
- Forster, P.; Storelvmo, T.; Armour, K.; Collins, W.; Dufresne, J.-L.; Frame, D.; Lunt, D.J.; Mauritsen, T.; Palmer, M.D.; Watanabe, M.; et al. The Earth’s Energy Budget, Climate Feedbacks, and Climate Sensitivity. In Climate Change 2021: The Physical Science Basis. Contribution of Working Group I to the Sixth Assessment Report of the Intergovernmental Panel on Climate Change; Masson-Delmotte, V., Zhai, P., Pirani, A., Connors, S.L., Péan, C., Berger, S., Caud, N., Chen, Y., Goldfarb, L., Gomis, M.I., et al., Eds.; Cambridge University Press: Cambridge, UK; New York, NY, USA, 2021; pp. 923–1054. [Google Scholar] [CrossRef] [Scilit]
- National Academies of Sciences, Engineering, and Medicine. The Future of Atmospheric Chemistry Research: Remembering Yesterday, Understanding Today, Anticipating Tomorrow; The National Academies Press: Washington, DC, USA, 2016. [Google Scholar] [CrossRef] [Scilit]
- Jacob, D.J. Introduction to Atmospheric Chemistry; Princeton University Press: Princeton, NJ, USA, 1999. [Google Scholar]
- Wunch, D.; Wennberg, P.O.; Toon, G.C.; Keppel-Aleks, G.; Yavin, Y.G. Emissions of greenhouse gases from a North American megacity. Geophys. Res. Lett. 2009, 36, L15810. [Google Scholar] [CrossRef] [Scilit]
- Zhou, L.; Warner, J.; Nalli, N.R.; Wei, Z.; Oh, Y.; Bruhwiler, L.; Liu, X.; Divakarla, M.; Pryor, K.; Kalluri, S.; et al. Spatiotemporal Variability of Global Atmospheric Methane Observed from Two Decades of Satellite Hyperspectral Infrared Sounders. Remote Sens. 2023, 15, 2992. [Google Scholar] [CrossRef] [Scilit]
- Wójcik-Gront, E.; Wnuk, A.; Gozdowski, D. Spatio-Temporal Patterns of Methane Emissions from 2019 Onwards: A Satellite-Based Comparison of High and Low Emission 3 Regions. Atmosphere 2025, 16, 670. [Google Scholar] [CrossRef] [Scilit]
- Rakitin, V.; Fedorova, E.; Skorokhod, A.; Kirillova, N.; Chernokulsky, A. Validation of Long-Term Methane (CH4) Satellite Measurements from the AIRS Spectrometer and Correction of Their Temporal Drift. Remote Sens. 2026, 18, 1162. [Google Scholar] [CrossRef] [Scilit]
- Aumann, H.H.; Chahine, M.T.; Gautier, C.; Goldberg, M.; Kalnay, E.; McMillin, L.; Revercomb, H.; Rosenkranz, P.W.; Smith, W.L.; Staelin, D.; et al. AIRS/AMSU/HSB on the Aqua mission: Design, science objectives, data products and processing systems. IEEE Trans. Geosci. Remote Sens. 2003, 41, 253–264. [Google Scholar] [CrossRef] [Scilit]
- Han, Y.; Revercomb, H.; Cromp, M.; Gu, D.; Johnson, D.; Mooney, D.; Scott, D.; Strow, L.; Bingham, G.; Borg, L.; et al. Suomi NPP CrIS measurements, sensor data record algorithm, calibration and validation activities, and record data quality. J. Geophys. Res. Atmos. 2013, 118, 12734–12748. [Google Scholar] [CrossRef] [Scilit]
- Han, Y.; Chen, Y. The Cross-track Infrared Sounder (CrIS) Overview and Validation. In Comprehensive Remote Sensing, 2nd ed.; Liang, S., Ed.; Elsevier: Amsterdam, The Netherlands, 2026; pp. 34–103. [Google Scholar] [CrossRef] [Scilit]
- Wang, T.; Payne, V.H.; Manning, E.; Pagano, T.S.; Lambrigtsen, B.; Monarrez, R. A Global, Multidecadal Carbon Monoxide (CO) Record from the Sounder AIRS/CrIS System. Remote Sens. 2026, 18, 5. [Google Scholar] [CrossRef] [Scilit]
- Clerbaux, C.; Boynard, A.; Clarisse, L.; George, M.; Hadji-Lazaro, J.; Herbin, H.; Hurtmans, D.; Pommier, M.; Razavi, A.; Turquety, S.; et al. Monitoring of atmospheric composition using the thermal infrared IASI/MetOp sounder. Atmos. Chem. Phys. 2009, 9, 6041–6054. [Google Scholar] [CrossRef] [Scilit]
- Clerbaux, C.; Coheur, P.-F.; Bauduin, S.; Boynard, A.; Clarisse, L.; Doniki, S.; George, M.; Hadji-Lazaro, J.; Hurtmans, D.; Lacour, J.-L.; et al. Tracking pollutants from space: 10 years of IASI satellite observation. In Proceedings of the IGAC 2016 Science Conference (International Global Atmospheric Chemistry), Breckenridge, CO, USA, 26–30 September 2016. [Google Scholar]
- Hu, H.; Landgraf, J.; Detmers, R.; Borsdorff, T.; Aan de Brugh, J.; Aben, I.; Butz, A.; Hasekamp, O. Toward global mapping of methane with TROPOMI: First results and intersatellite comparison to GOSAT. Geophys. Res. Lett. 2018, 45, 3682–3689. [Google Scholar] [CrossRef] [Scilit]
- Smith, N.; Barnet, C.D. Uncertainty characterization and propagation in the Community Long-term Infrared Microwave Combined Atmospheric Product System (CLIMCAPS). Remote Sens. 2019, 11, 1227. [Google Scholar] [CrossRef] [Scilit]
- Smith, N.; Barnet, C.D. CLIMCAPS observing capability for temperature, moisture, and trace gases from AIRS/AMSU and CrIS/ATMS. Atmos. Meas. Tech. 2020, 13, 4437–4459. [Google Scholar] [CrossRef] [Scilit]
- Thrastarson, H.T.; Fetzer, E.J.; Ray, S. Overview of the AIRS Mission: Instruments, Processing Algorithms, Products, and Documentation, 2nd Edition, The AIRS-Team and the CLIMCAPS Algorithms, Jet Propulsion Laboratory, California Institute of Technology, Thomas Hearty, NASA/GES DISC, Nadia Smith, Science and Technology Corporation, 6 May 2021, Document Edition 2.0. Available online: https://docserver.gesdisc.eosdis.nasa.gov/public/project/AIRS/Overview_of_the_AIRS_Mission.pdf (accessed on 8 July 2026).
- Yurganov, L.N.; Rakitin, V.; Dzhola, A.; August, T.; Fokeeva, E.; George, M.; Gorchakov, G.; Grechko, E.; Hannon, S.; Karpov, A.; et al. Satellite-and ground-based CO total column observations over 2010 Russian fires: Accuracy of top-down estimates based on thermal IR satellite data. Atmos. Chem. Phys. 2011, 11, 7925–7942. [Google Scholar] [CrossRef] [Scilit]
- Rakitin, V.S.; Shtabkin, Y.A.; Elansky, N.F.; Pankratova, N.V.; Skorokhod, A.I.; Grechko, E.I.; Safronov, A.N. Comparison Results of Satellite and Ground_Based Spectroscopic Measurements of CO, CH4, and CO2 Total Contents. Atmos. Ocean. Opt. 2015, 28, 533–542. [Google Scholar] [CrossRef] [Scilit]
- Rakitin, V.; Fedorova, E.; Skorokhod, A.; Kirillova, N.; Pankratova, N.; Elansky, N. Principles of Correction for Long-Term Orbital Observations of Atmospheric Composition, Applied to AIRS v.6 CH4 and CO Data. Remote Sens. 2025, 17, 2323. [Google Scholar] [CrossRef] [Scilit]
- Zou, M.; Xiong, X.; Saitoh, N.; Warner, J.; Zhang, Y.; Chen, L.; Weng, F.; Fan, M. Satellite observation of atmospheric methane: Intercomparison between AIRS and GOSAT TANSO-FTS retrievals. Atmos. Meas. Tech. 2016, 9, 3567–3576. [Google Scholar] [CrossRef] [Scilit]
- Wofsy, S.C.; Daube, B.C.; Jimenez, R.; Kort, E.; Pittman, J.V.; Park, S.; Commane, R.; Xiang, B.; Santoni, G.; Jacob, D.; et al. HIPPO Merged 10-Second Meteorology, Atmospheric Chemistry Aerosol Data (R_20121129); NSF NCAR Earth Observing Laboratory: Boulder, CO, USA, 2017. [Google Scholar] [CrossRef]
- Sweeney, C.; Karion, A.; Wolter, S.; Newberger, T.; Guenther, D.; Higgs, J.A.; Andrews, A.E.; Lang, P.M.; Neff, D.; Dlugokencky, E.; et al. Seasonal climatology of CO2 across North America from aircraft measurements in the NOAA/ESRL Global Greenhouse Gas Reference Network. J. Geophys. Res.-Atmos. 2015, 120, 5155–5190. [Google Scholar] [CrossRef] [Scilit]
- Wofsy, S.C.; Afshar, S.; Allen, H.M.; Apel, E.C.; Asher, E.C. ATom: Merged Atmospheric Chemistry, Trace Gases, and Aero-Sols; ORNL DAAC: Oak Ridge, TN, USA, 2018. [CrossRef]
- Kulawik, S.S.; Worden, J.R.; Payne, V.H.; Fu, D.; Wofsy, S.C.; McKain, K.; Sweeney, C.; Daube, B.C., Jr.; Lipton, A.; Polonsky, I.; et al. Evaluation of single-footprint AIRS CH4 profile retrieval uncertainties using aircraft profile measurements. Atmos. Meas. Tech. 2021, 14, 335–354. [Google Scholar] [CrossRef] [Scilit]
- Yurganov, L.N. The relationship between methane transport to the atmosphere and the decay of the Kara Sea ice cover: Satellite data for 2003–2019. Ice Snow 2020, 60, 423–430. [Google Scholar] [CrossRef] [Scilit]
- Yurganov, L.; Carroll, D.; Pnyushkov, A.; Polyakov, I.; Zhang, H. Ocean stratification and sea-ice cover in Barents and Kara seas modulate sea-air methane flux: Satellite data. Adv. Polar Sci. 2021, 32, 118–140. [Google Scholar] [CrossRef]
- Abed, F.G.; Halos, S.H. The Vertical variations of Atmospheric Methane (CH4) concentrations over selected cities in Iraq based on AIRS data. Baghdad Sci. J. 2021, 18, 3. [Google Scholar] [CrossRef] [Scilit]
- Abed, F.; Rajab, J.; Abdulfattah, I.; Lim, H.S. Influence of air temperature and interrelationship with greenhouse gases (CO2 and CH4) over Iraq using AIRS. Atmos. Pollut. Res. 2024, 15, 102293. [Google Scholar] [CrossRef] [Scilit]
- Ni, Q.; Zhou, M.; Wang, J.; Wang, T.; Wang, G.; Wang, P. Intercomparison of CH4 Products in China from GOSAT, TROPOMI, IASI, and AIRS Satellites. Remote Sens. 2023, 15, 4499. [Google Scholar] [CrossRef] [Scilit]
- Xu, Z.; Chen, Y.; Shan, W.; Deng, C.; Ma, M.; Wu, Y.; Mao, Y.; Ding, X.; Ji, J. Study of Methane Emission and Geological Sources in Northeast China Permafrost Area Related to Engineering Construction and Climate Disturbance Based on Ground Monitoring and AIRS. Atmosphere 2023, 14, 1298. [Google Scholar] [CrossRef] [Scilit]
- Shakirov, R.B.; Khazanova, E.S.; Stepochkin, I.E. New Data on the Patterns of Methane Distribution over the Arctic Shelf of Eurasia. Dokl. Earth Sc. 2023, 511, 623–626. [Google Scholar] [CrossRef] [Scilit]
- Zou, M.; Xiong, X.; Wu, Z.; Li, S.; Zhang, Y.; Chen, L. Increase of Atmospheric Methane Observed from Space-Borne and Ground-Based Measurements. Remote Sens. 2019, 11, 964. [Google Scholar] [CrossRef] [Scilit]
- Strow, L.L.; DeSouza-Machado, S. Establishment of AIRS climate-level radiometric stability using radiance anomaly retrievals of minor gases and sea surface temperature. Atmos. Meas. Tech. 2020, 13, 4619–4644. [Google Scholar] [CrossRef] [Scilit]
- DeSouza-Machado, S.; Strow, L.L.; Kramer, R.J. Geophysical trends inferred from 20 years of AIRS infrared global observations. J. Geophys. Res. Atmos. 2025, 130, e2025JD043501. [Google Scholar] [CrossRef] [Scilit]
- De Mazière, M.; Thompson, A.M.; Kurylo, M.J.; Wild, J.D.; Bernhard, G.; Blumenstock, T.; Braathen, G.O.; Hannigan, J.W.; Lambert, J.-C.; Leblanc, T.; et al. The Network for the Detection of Atmospheric Composition Change (NDACC): History, status and perspectives. Atmos. Chem. Phys. 2018, 18, 4935–4964. [Google Scholar] [CrossRef] [Scilit]
- Sussmann, R.; Forster, F.; Rettinger, M.; Jones, N. Strategy for high-accuracy-and-precisionretrieval of atmospheric methane from the mid-infrared FTIR network. Atmos. Meas. Tech. 2011, 4, 1943–1964. [Google Scholar] [CrossRef] [Scilit]
- Laughner, J.L.; Toon, G.C.; Mendonca, J.; Petri, C.; Roche, S.; Wunch, D.; Blavier, J.-F.; Griffith, D.W.T.; Heikkinen, P.; Keeling, R.F.; et al. The Total Carbon Column Observing Network’s GGG2020 data version. Earth Syst. Sci. Data 2024, 16, 2197–2260. [Google Scholar] [CrossRef] [Scilit]
- Hrgian, A.H. Fizika Atmosfery (Atmospheric Physics); Hydrometeorological Izdatelstvo: Saint-Petersburg, Russia, 1969; p. 644. (In Russian) [Google Scholar]
- Government Printing Office. U.S. Standard Atmosphere, 1976; U.S. Government Printing Office: Washington, DC, USA, 1976; p. 241.
- Hersbach, H.; Bell, B.; Berrisford, P.; Hirahara, S.; Horányi, A.; Muñoz-Sabater, J.; Nicolas, J.; Carole Peubey, C.; Radu, R.; Schepers, D.; et al. The ERA5 global reanalysis. Q. J. R. Meteorol. Soc. 2020, 146, 1999–2049. [Google Scholar] [CrossRef] [Scilit]
- Landgraf, J.; Butz, A.; Hasekamp, O.; Hu, H.; aan de Brugh, J. Sentinel 5 L2 Prototype Processors, Algorithm Theoretical Baseline Document: Methane Retrieval, SRON-ESA-S5L2PP-ATBD-001-v3.1-20190517-CH4; SRON Netherlands Institute for Space Research: Utrecht, The Netherlands, 2019; Available online: https://www.sron.nl/wp-content/uploads/2025/03/SRON-ESA-S5L2PP-ATBD-001.pdf?utm_source=chatgpt.com (accessed on 15 April 2026).
- De Wachter, E.; Kumps, N.; Vandaele, A.C.; Langerock, B.; De Mazière, M. Retrieval and validation of MetOp/IASI methane. Atmos. Meas. Tech. 2017, 10, 4623–4638. [Google Scholar] [CrossRef] [Scilit]
- Tian, B.; Manning, E.; Roman, J.; Thrastarson, H.; Fetzer, E.; Monarrez, R. AIRS Version 7 Level 3 Product User Guide; Jet Propulsion Laboratory, California Institute of Technology: Pasadena, CA, USA, 2020. Available online: https://docserver.gesdisc.eosdis.nasa.gov/public/project/AIRS/V7_L3_Product_User_Guide.pdf (accessed on 9 September 2025).
- Jet Propulsion Laboratory, California Institute of Technology. AIRS/AMSU/HSB. Version 6 Data Release User Guide; Olsen, E.T., Ed.; Jet Propulsion Laboratory, California Institute of Technology: Pasadena, CA, USA, 2017. Available online: https://docserver.gesdisc.eosdis.nasa.gov/repository/Mission/AIRS/3.3_ScienceDataProductDocumentation/3.3.4_ProductGenerationAlgorithms/V6_Data_Release_User_Guide.pdf (accessed on 21 February 2026).
- Susskind, J.; Blaisdell, J.M.; Iredell, L. Improved methodology for surface and atmospheric soundings, error estimates, and quality control procedures: The atmospheric infrared sounder science team version-6 retrieval algorithm. J. Appl. Remote Sens. 2014, 8, 084994. [Google Scholar] [CrossRef] [Scilit]
- Rakitin, V.S.; Kazakov, A.V.; Elansky, N.F. Multifunctional software of the OIAP RAS for processing and analysis of orbital data on the atmospheric composition: Tasks, possibilities, application results, and ways of development. In Proceedings of the 29th International Symposium on Atmospheric and Ocean Optics: Atmospheric Physics; SPIE: Bellingham, WA, USA, 2023; Volume 12780, p. 127805T. [Google Scholar] [CrossRef] [Scilit]
- Xiong, X.; Weng, F.; Liu, Q.; Olsen, E. Space-borne observation of methane from atmospheric infrared sounder version 6: Validation and implications for data analysis. Atmos. Meas. Tech. Discuss. 2015, 8, 8563–8597. [Google Scholar] [CrossRef] [Scilit]
- Thompson, C.R.; Wofsy, S.C.; Prather, M.J.; Newman, P.A.; Hanisco, T.F.; Ryerson, T.B.; Fahey, D.W.; Apel, E.C.; Brock, C.A.; Brune, W.H.; et al. The NASA atmospheric tomography (ATom) mission: Imaging the chemistry of the global atmosphere. Bull. Am. Meteorol. Soc. 2022, 103, 761–790. [Google Scholar] [CrossRef] [Scilit]
- Qian, S.-E.; Routhier, S.; Wu, T.; Dufour, D.; Lantagne, S.; Grandmont, F.; Degenstein, D.; Bourassa, A.; Bourassa, A.; Zawada, D.; et al. GHG measurements using an imaging FTS on a stratospheric balloon: A tech demo for the Arctic Observing Mission. In Proceedings of the SPIE Environmental Remote Sensing, 2024, Edinburgh, UK, 16–20 September 2024; Volume 13193. Remote Sensing of Clouds and the Atmosphere XXIX, 1319309. [Google Scholar] [CrossRef] [Scilit]
- Mélanie, G.-D.; Georges, D.; Emmanuel, R.; Nadir, A. 10—Balloon-borne and airborne measurements. In Advances in Spectroscopic Monitoring of the Atmosphere; Chen, W., Venables, D.S., Sigrist, M.W., Eds.; Elsevier: Amsterdam, The Netherlands, 2021; pp. 521–601. [Google Scholar] [CrossRef] [Scilit]



| Nº | Station | Latitude/Longitude, ° | Altitude Asl, m | Time Period | Number of Pairs | |
|---|---|---|---|---|---|---|
| v7 | v6 | |||||
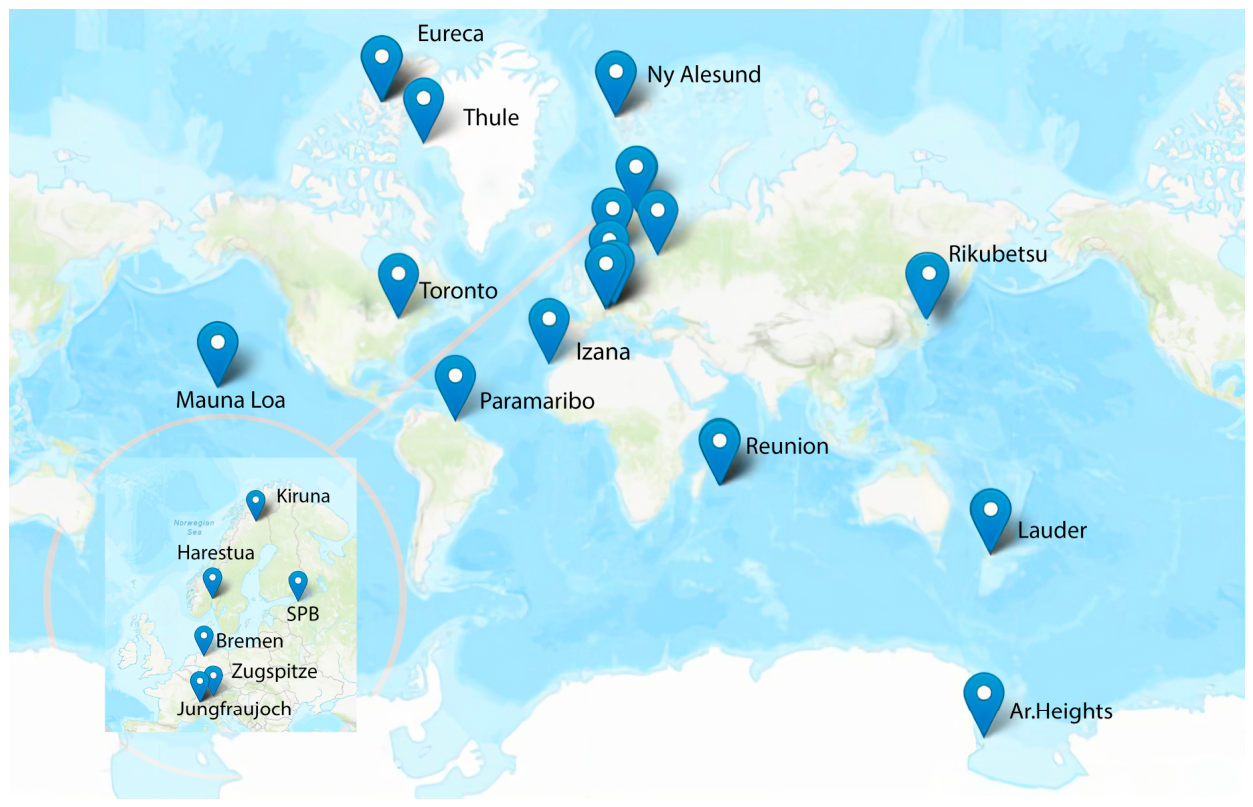
| 1 | Eureka, Canada | 80.0N/86.4W | 610 | 2006–2020 | 895 | 875 |
| 2 | Ny Alesund, Norway | 78.9N/11.9E | 15 | 2003–2022 | 597 | 610 |
| 3 | Thule, Greenland | 76.5N/68.7W | 220 | 2003–2022 | 1372 | 1419 |
| 4 | Kiruna, Sweden | 67.8N/20.4E | 419 | 2003–2022 | 1354 | 1403 |
| 5 | Harestua, Norway | 60.2N/10.8E | 596 | 2009–2020 | 482 | 484 |
| 6 | St. Petersburg, Russia | 59.9N/29.8E | 20 | 2009–2022 | 887 | 878 |
| 7 | Bremen, Germany | 53.1N/8.8E | 27 | 2004–2022 | 566 | 535 |
| 8 | Zugspitze, Germany | 47.4N/11.0E | 2964 | 2003–2022 | 1934 | 2009 |
| 9 | Jungfraujoch, Switzerland | 46.5N/8.0E | 3580 | 2003–2022 | 1750 | 1764 |
| 10 | Toronto—TAO, Canada | 43.7N/79.4W | 174 | 2003–2022 | 1617 | 1577 |
| 11 | Rikubetsu, Japan | 43.5N/143.8E | 380 | 2003–2022 | 481 | 523 |
| 12 | Izana, Tenerife, Spain | 28.3N/16.5W | 2367 | 2003–2022 | 1334 | 1335 |
| 13 | Mauna Loa, HI, United States. | 19.5N/155.9W | 3397 | 2007–2022 | 1260 | 1302 |
| 14 | Paramaribo, Suriname | 5.7N/55.2W | 23 | 2004–2022 | 179 | 179 |
| 15 | Reunion Island, Maido, France | 21.1S/55.4E | 2155 | 2013–2019 | 584 | 586 |
| 16 | Lauder, New Zealand | 45.0S/169.7E | 370 | 2003–2022 | 2432 | 2353 |
| 17 | Arrival Heights, Antarctica | 77.8S/166.7E | 184 | 2003–2022 | 912 | 942 |
| Product Name | Variable | Description |
|---|---|---|
| AIRS Standard L3 Version 6 IR AIRS Only Daily | CH4_VMR | CH4 volume mixing ratio (24 lvl), resolution 1° × 1°, ppbv |
| AIRS Standard L3 Version 7 IR AIRS Only Daily | CH4_VMR | CH4 volume mixing ratio (24 lvl), resolution 1° × 1°, ppbv |
| № | Pressure, mbar | 925 | 850 | 700 | 600 | 500 | 400 | 300 | 250 | 200 | 150 | 100 |
|---|---|---|---|---|---|---|---|---|---|---|---|---|
| Station | R AIRSv7/GR | |||||||||||
| 1 | Eureka | 0.24 | 0.36 | 0.47 | 0.56 | 0.50 | ||||||
| 2 | Ny Alesund | 0.49 | 0.53 | 0.55 | 0.54 | 0.46 | ||||||
| 3 | Thule | 0.50 | 0.56 | 0.59 | 0.59 | 0.53 | ||||||
| 4 | Kiruna | 0.72 | 0.78 | 0.83 | 0.80 | 0.76 | 0.70 | |||||
| 5 | Harestua | 0.28 | 0.30 | 0.34 | 0.39 | 0.42 | 0.44 | |||||
| 6 | St. Petersburg | 0.59 | 0.65 | 0.68 | 0.68 | 0.65 | 0.62 | |||||
| 7 | Bremen | 0.56 | 0.60 | 0.63 | 0.65 | 0.65 | 0.65 | |||||
| 8 | Zugspitze | - | 0.74 | 0.78 | 0.82 | 0.81 | 0.75 | |||||
| 9 | Jungfraujoch | - | 0.79 | 0.85 | 0.84 | 0.80 | ||||||
| 10 | Toronto | 0.36 | 0.39 | 0.40 | 0.35 | 0.30 | 0.26 | |||||
| 11 | Rikubetsu | 0.55 | 0.66 | 0.75 | 0.76 | 0.72 | 0.65 | |||||
| 12 | Izana | 0.85 | 0.90 | 0.92 | 0.90 | 0.86 | 0.78 | |||||
| 13 | MaunaLoa | - | 0.58 | 0.62 | 0.63 | 0.63 | 0.63 | |||||
| 14 | Reunion Island | 0.53 | 0.62 | 0.68 | 0.66 | 0.58 | ||||||
| 15 | Lauder | 0.72 | 0.74 | 0.75 | 0.74 | 0.72 | 0.69 | |||||
| 16 | Arrival Heights | 0.62 | 0.68 | 0.71 | 0.70 | 0.55 | ||||||
| Pressure, mbar | 925 | 850 | 700 | 600 | 500 | 400 | 300 | 250 | 200 | 150 | 100 | |
|---|---|---|---|---|---|---|---|---|---|---|---|---|
| № | Station | R AIRSv6/GR | ||||||||||
| 1 | Eureka | 0.08 | 0.24 | 0.40 | 0.55 | 0.54 | ||||||
| 2 | Ny Alesund | 0.56 | 0.60 | 0.61 | 0.60 | 0.52 | ||||||
| 3 | Thule | 0.54 | 0.60 | 0.62 | 0.60 | 0.51 | ||||||
| 4 | Kiruna | 0.69 | 0.75 | 0.79 | 0.73 | 0.67 | 0.59 | |||||
| 5 | Harestua | 0.26 | 0.26 | 0.27 | 0.30 | 0.31 | 0.33 | |||||
| 6 | St. Peters-burg | 0.52 | 0.59 | 0.63 | 0.60 | 0.56 | 0.49 | |||||
| 7 | Bremen | 0.55 | 0.59 | 0.61 | 0.63 | 0.63 | 0.61 | |||||
| 8 | Zugspitze | - | 0.72 | 0.77 | 0.80 | 0.77 | 0.71 | |||||
| 9 | Jungfraujoch | - | 0.81 | 0.83 | 0.81 | 0.75 | ||||||
| 10 | Toronto | 0.39 | 0.41 | 0.41 | 0.35 | 0.31 | 0.25 | |||||
| 11 | Rikubetsu | 0.71 | 0.77 | 0.79 | 0.72 | 0.64 | 0.53 | |||||
| 12 | Izana | - | 0.89 | 0.92 | 0.90 | 0.84 | 0.75 | |||||
| 13 | Mauna Loa | - | 0.65 | 0.66 | 0.65 | 0.64 | ||||||
| 14 | Reunion Island | - | 0.67 | 0.69 | 0.63 | 0.46 | 0.17 | |||||
| 15 | Lauder | 0.71 | 0.74 | 0.75 | 0.75 | 0.74 | 0.70 | |||||
| 16 | Arrival Heights | 0.62 | 0.68 | 0.70 | 0.68 | 0.53 | ||||||
Disclaimer/Publisher’s Note: The statements, opinions and data contained in all publications are solely those of the individual author(s) and contributor(s) and not of MDPI and/or the editor(s). MDPI and/or the editor(s) disclaim responsibility for any injury to people or property resulting from any ideas, methods, instructions or products referred to in the content. |
© 2026 by the authors. Licensee MDPI, Basel, Switzerland. This article is an open access article distributed under the terms and conditions of the Creative Commons Attribution (CC BY) license.
Share and Cite
Fedorova, E.; Rakitin, V.; Skorokhod, A.; Kirillova, N.; Belov, A.; Pankratova, N.; Shi, Y.; Wang, L.; Semenov, V. Altitude and Geographic Sensitivity Characteristics of the AIRS Satellite Spectrometer and Drift Correction Using Methane (CH4) Data. Remote Sens. 2026, 18, 2875. https://doi.org/10.3390/rs18172875
Fedorova E, Rakitin V, Skorokhod A, Kirillova N, Belov A, Pankratova N, Shi Y, Wang L, Semenov V. Altitude and Geographic Sensitivity Characteristics of the AIRS Satellite Spectrometer and Drift Correction Using Methane (CH4) Data. Remote Sensing. 2026; 18(17):2875. https://doi.org/10.3390/rs18172875
Chicago/Turabian StyleFedorova, Eugenia, Vadim Rakitin, Andrey Skorokhod, Natalia Kirillova, Andrey Belov, Natalia Pankratova, Yusheng Shi, Lin Wang, and Vladimir Semenov. 2026. "Altitude and Geographic Sensitivity Characteristics of the AIRS Satellite Spectrometer and Drift Correction Using Methane (CH4) Data" Remote Sensing 18, no. 17: 2875. https://doi.org/10.3390/rs18172875
APA StyleFedorova, E., Rakitin, V., Skorokhod, A., Kirillova, N., Belov, A., Pankratova, N., Shi, Y., Wang, L., & Semenov, V. (2026). Altitude and Geographic Sensitivity Characteristics of the AIRS Satellite Spectrometer and Drift Correction Using Methane (CH4) Data. Remote Sensing, 18(17), 2875. https://doi.org/10.3390/rs18172875