Article

Layout Optimization of Urban Emergency Shelter Sites Under Compound Disaster Scenarios Based on MOGWO


1
School of Geography and Information Engineering, China University of Geosciences, Wuhan 430078, China
2
Hubei Provincial Water Conservancy Project Immigration Affairs Center, Wuhan 430079, China
*
Author to whom correspondence should be addressed.
Remote Sens. 2026, 18(17), 2945; https://doi.org/10.3390/rs18172945
Submission received: 1 June 2026 / Revised: 17 August 2026 / Accepted: 19 August 2026 / Published: 1 September 2026

Highlights

What are the main findings?
  • A multi-hazard coupling excitation correction model is constructed to quantify disaster chain amplification effects, improving compound hazard assessment by incorporating mutual triggering relationships between geological and flood hazards.
  • The MOGWO multi-objective optimization framework integrates compound hazard risk into shelter suitability evaluation, realizing coordinated optimization of evacuation accessibility and disaster safety for emergency shelter layout.
What are the implications of the main findings?
  • The coupling strategy of hazard interaction correction provides a feasible technical reference for quantitative risk assessment of compound disasters in coastal cities with frequent disaster chains.
  • The integrated hazard assessment–shelter optimization paradigm can support rational urban spatial planning and emergency evacuation system construction under multi-hazard scenarios.

Abstract

To address the uncertainties in emergency shelter siting under compound disaster scenarios, based on the connotative characteristics and formation mechanisms of urban natural hazards, a hazard assessment system for geological and flood disasters was constructed using the Random Forest (RF) algorithm. On this basis, considering the triggering relationships between disasters, the hazard intensity of disaster chains was adjusted by using a multi-hazard coupling incentive model, and the comprehensive hazard index of geological-flood compound disasters was calculated. Then, from the perspectives of accessibility and safety, a comprehensive analysis of the suitability of candidate emergency shelter sites was conducted via the Gaussian Two-step Floating Catchment Area (G2SFCA) method, where the comprehensive hazard assessment coefficient of geological-flood compound disasters was incorporated as a weighting factor affecting the suitability evaluation. Furthermore, an urban emergency shelter siting model was established by using the Multi-Objective Gray Wolf Optimizer (MOGWO). Taking Sanya City as a case study, the results show that: (1) The estimation of area under the curve (AUC) of the single hazard assessment models for geological and flood disasters constructed by the RF were 0.904 and 0.899, respectively. The high-hazard zones of geological-flood compound disasters were mainly concentrated in the mountain-valley transition zones of Tianya District and Jiyang District, as well as the potential storm surge-affected zones along the southern coast. (2) The model constructed based on the MOGWO under the influence of compound disasters could effectively make up for the deficiencies in the spatial layout of current shelter siting schemes and achieve effective connection between hazard assessment and spatial planning. The methods mentioned provide a scientific basis for risk zoning control in urban territorial spatial planning and disaster prevention and mitigation in emergency management.

1. Introduction

Against the backdrop of intensifying global climate change and rapid urbanization, the coupling effect, complexity, and concealment of natural disasters have increased markedly [1,2,3]. The cascading effects triggered by compound disasters have become a core risk threatening urban security [4,5]. As special land–sea interaction zones, coastal cities are confronted with both the “internal threat” of geological disasters (such as collapses, debris flows, and landslides) and flood disasters induced by typhoons and heavy rainfall, and the “external threat” of storm surges and seawater intrusion [6]. This forms a geological-flood compound disaster chain with bidirectional triggering effects, posing dual challenges to territorial spatial planning and emergency management work [7,8]. As a core infrastructure for responding to natural disasters, the scientificity of the spatial layout of emergency shelter sites directly determines evacuation efficiency and risk avoidance effectiveness [9,10,11]. However, under compound disaster scenarios, the superposition effect and spatial differentiation characteristics of disaster hazards lead to obvious limitations in traditional siting methods that are based on single disaster risks or only focus on accessibility, making it difficult to achieve the multiple goals of “risk avoidance, spatial adaptation, and efficient service” [12,13,14].
Although existing research has made progress in single-hazard risk quantification and emergency shelter site planning, urban compound disaster modeling and risk-adaptive shelter layout optimization still have deficiencies to be further addressed. The core of compound disaster hazard assessment [15,16] lies in quantifying the interaction and superposition effects among multiple disasters. At present, relevant research has formed a development framework of “model optimization—dimension expansion—application implementation”. In terms of assessment models, machine learning algorithms [17,18] are widely adopted due to their robust nonlinear fitting capability. Some scholars [19,20] have proposed applying the coupling algorithm of the Random Forest (RF) and feature selection to flash flood hazard assessment, which can effectively improve the prediction accuracy of disaster hazards in small-scale areas. Compared with single algorithms such as the support vector machine, logistic regression and RF, the RF-backpropagation neural network coupling model [21,22] has increased the area under the curve (AUC) and accuracy by 3–40% in multi-hazard assessment, which further proves the advantages of hybrid machine learning models in this field. Regarding the exploration of multi-hazard interaction mechanisms, storm surges, geological and flood disasters [23,24,25] are frequent natural disasters in coastal cities. Existing studies [26,27] have coupled storm surge numerical models with land use change models to quantify the future storm surge flood hazards in coastal cities, but they have not incorporated the coupling effects of geological and flood disasters, making it difficult to fully reflect the characteristics of compound disasters featuring “internal floods and external threats” in coastal cities. A few studies focusing on compound disasters mostly adopt the mode of “independent assessment of single disasters plus spatial superposition”, ignoring the triggering amplification effects among disasters, which deviates from the actual disaster-forming mechanism of compound disasters in coastal cities.
In the study on the layout optimization of emergency shelter sites, a technical framework of “suitability assessment—multi-objective modeling—algorithm adaptation” has been formed [28,29,30]. In terms of suitability assessment, the integrated application of Geographic Information System (GIS) and multi-criteria decision-making methods [31,32,33] is currently the most widespread approach. The Analytic Hierarchy Process (AHP) combined with GIS [11,34] is adopted from multiple dimensions such as topography, transportation, and population density to clarify the spatial distribution of highly suitable areas for urban emergency shelter sites, which preliminarily realizes the accurate identification of deficient areas. However, the comprehensive hazard of compound disasters has not been incorporated into the assessment as a core weighting factor [35,36]. In the aspect of layout optimization, the multi-objective and stochastic programming [37,38] are the mainstream approaches at present. Aiming at hurricane-flood scenarios, a nonlinear mixed-integer programming model [39,40] targeting the minimization of total evacuation time has been proposed to address the single-objective problem of emergency shelter sites layout, yet it neglects the dual demands of decision-makers and evacuees. In addition, some studies [41,42] have transformed the shelter siting problem under flood scenarios into a bi-level programming problem and used genetic algorithms to balance the dual demands of both parties. At present, most studies [43,44] fail to incorporate disaster hazards as a weighting factor into the assessment, leading to a disconnect between the siting scheme and the spatial distribution of disaster risks, which makes it difficult to avoid potential threats in high-hazard areas. Meanwhile, algorithms such as genetic algorithms and particle swarm optimization [45] have the problem of insufficient convergence when dealing with multi-objective optimization schemes, and their pertinence in adapting to the spatial layout of urban emergency shelter sites under complex disaster-inducing environments is not strong.
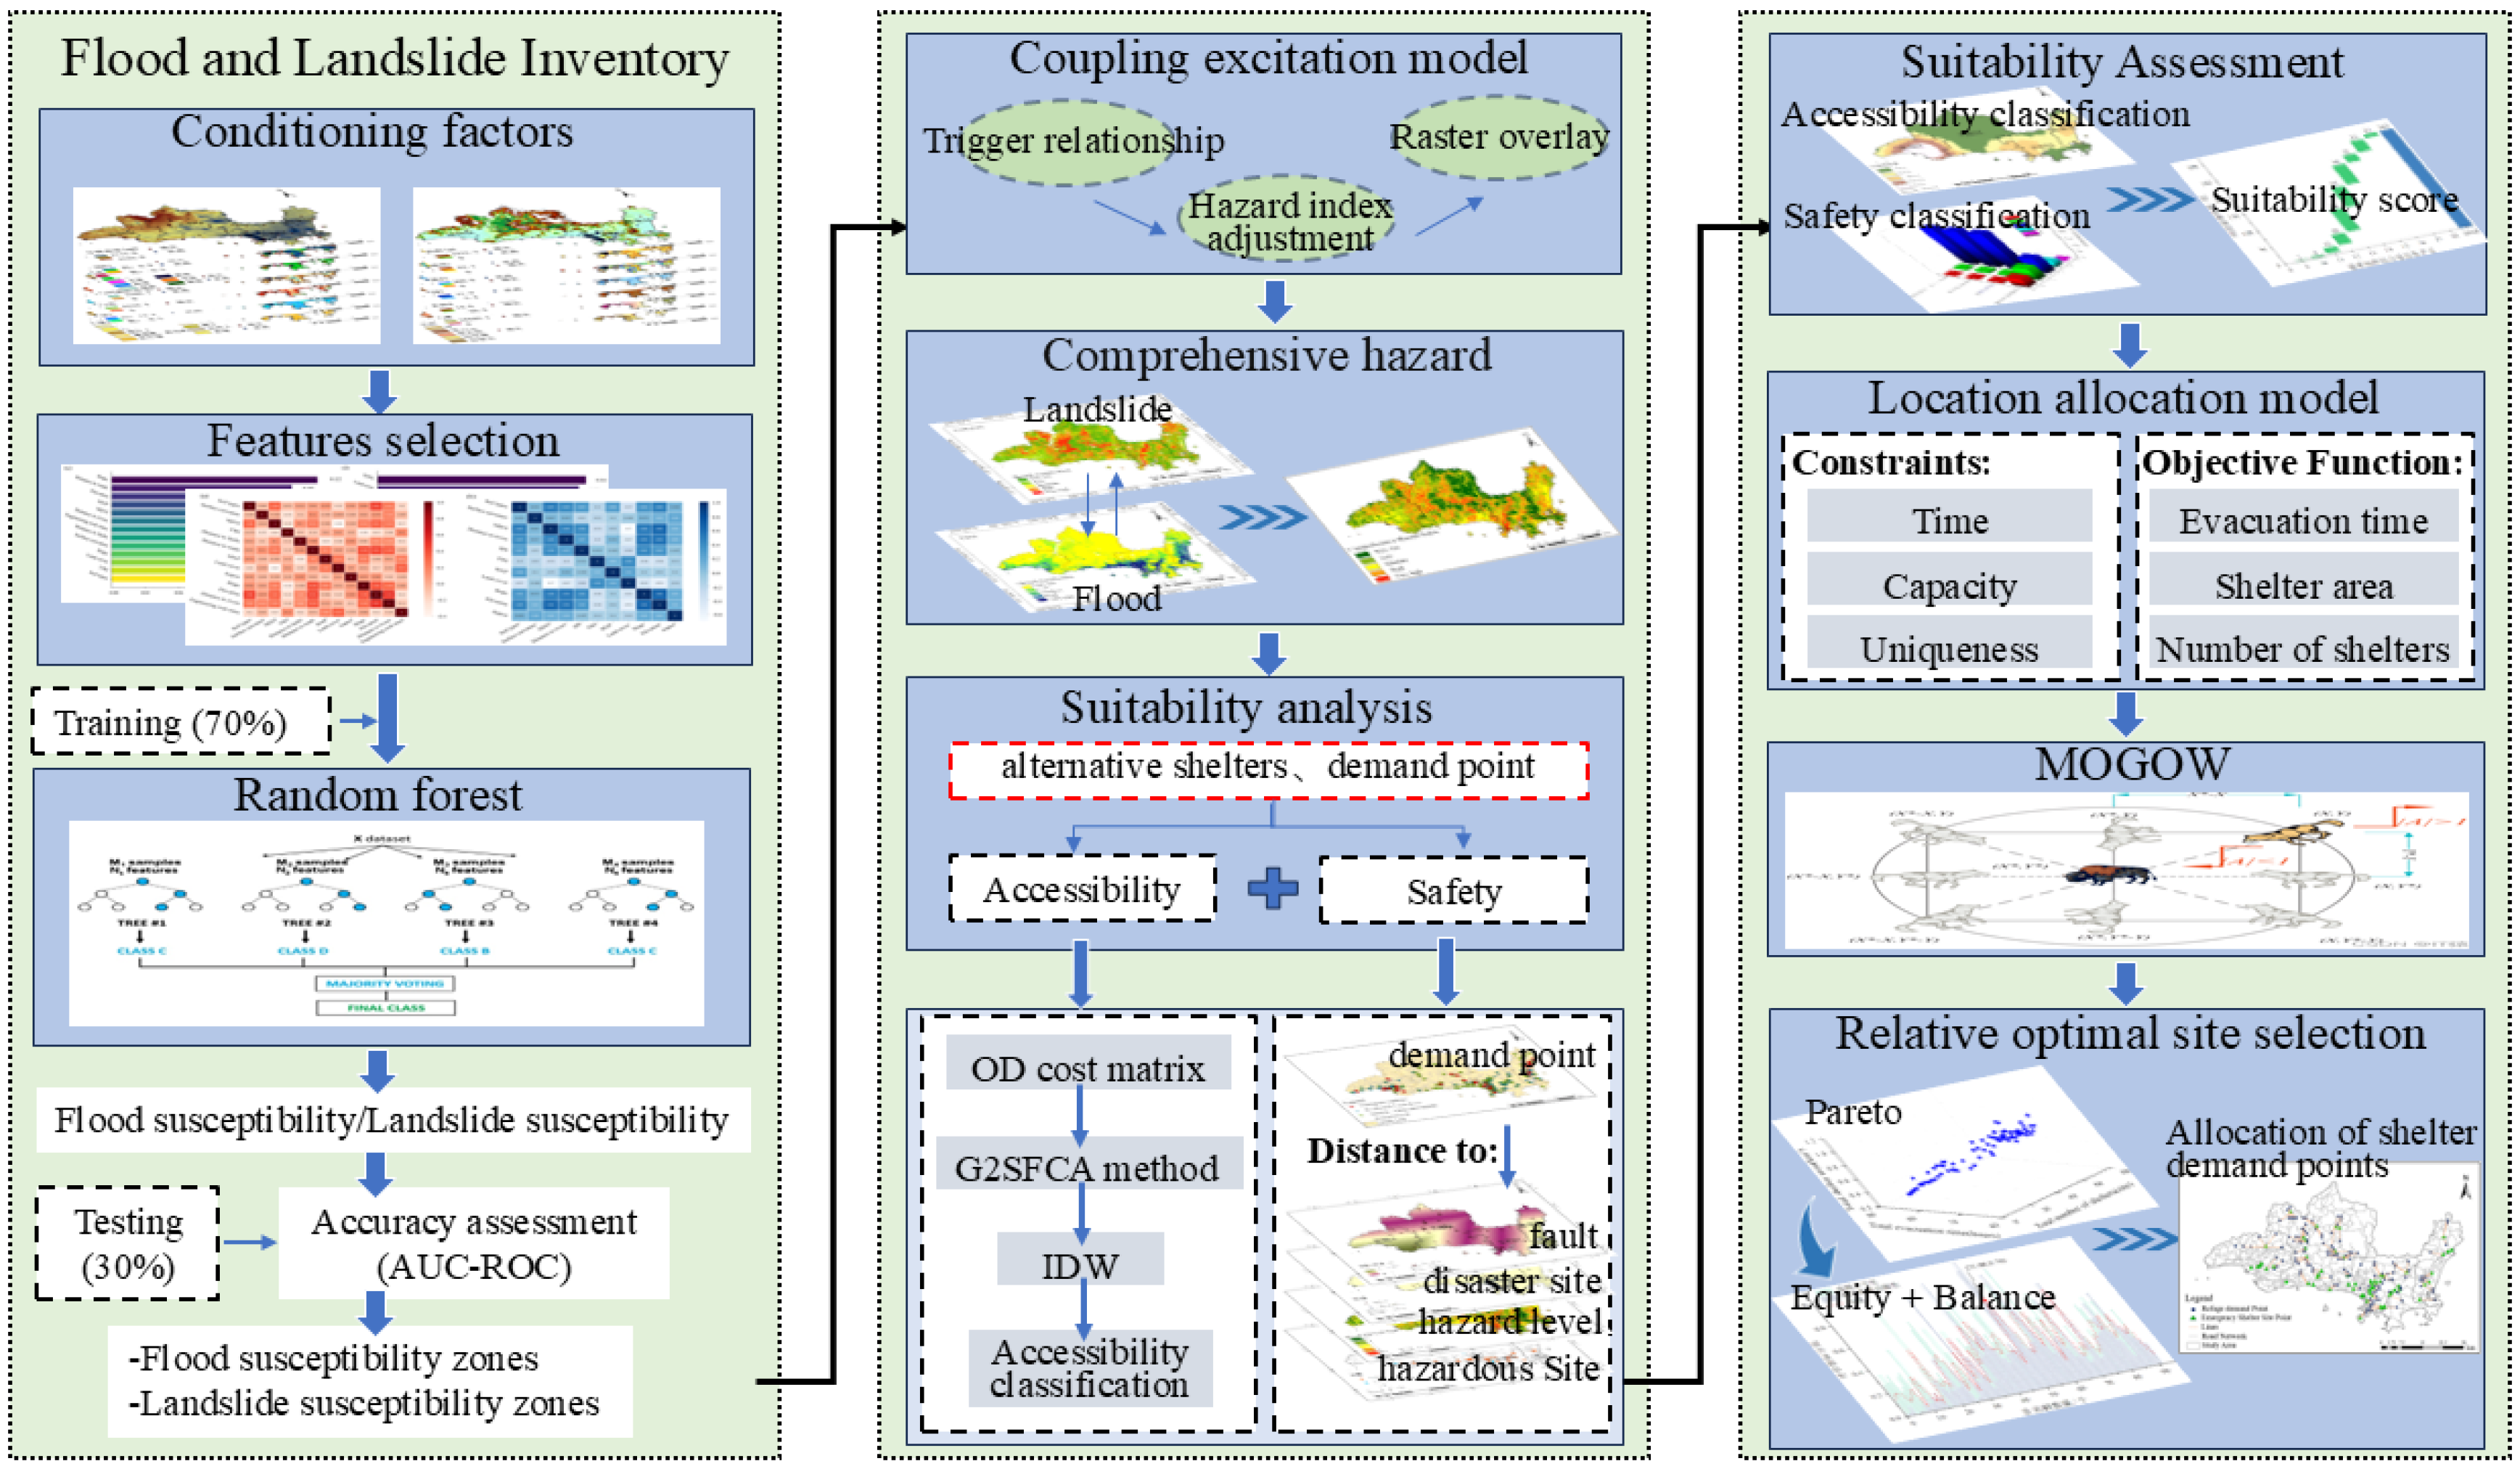
In response to the issues mentioned above, we take Sanya City as the research area, focus on the core objective of “effective integration of compound disaster hazard assessment and emergency shelter layout”, and construct a complete technical framework consisting of “single-hazard assessment—compound disaster coupling calculation—suitability analysis—multi-objective optimization”. The main contents are as follows: (1) Based on the RF, single-hazard assessment models for geological and flood disasters are established; combined with the multi-hazard coupling incentive model, the triggering relationships of disaster chains are quantified, and the comprehensive hazard index of compound disasters is calculated. (2) Taking the compound disaster hazard coefficient as the weight, the suitability of candidate emergency shelter sites is analyzed from the dimensions of accessibility and safety by using the Gaussian Two-step Floating Catchment Area (G2SFCA). (3) A siting model is constructed by using the Multi-Objective Gray Wolf Optimizer (MOGWO), and the feasibility of the model is verified based on evacuation equity and utilization balance. The complete technical flow of this research is displayed in the technical roadmap, which systematically illustrates the full research procedure from multi-source data processing, multi-hazard modeling, shelter suitability grading, multi-objective optimization solving, to result verification. The subsequent chapters are organized in strict accordance with this technical route for progressive elaboration.

2. Study Area and Data

2.1. Study Area

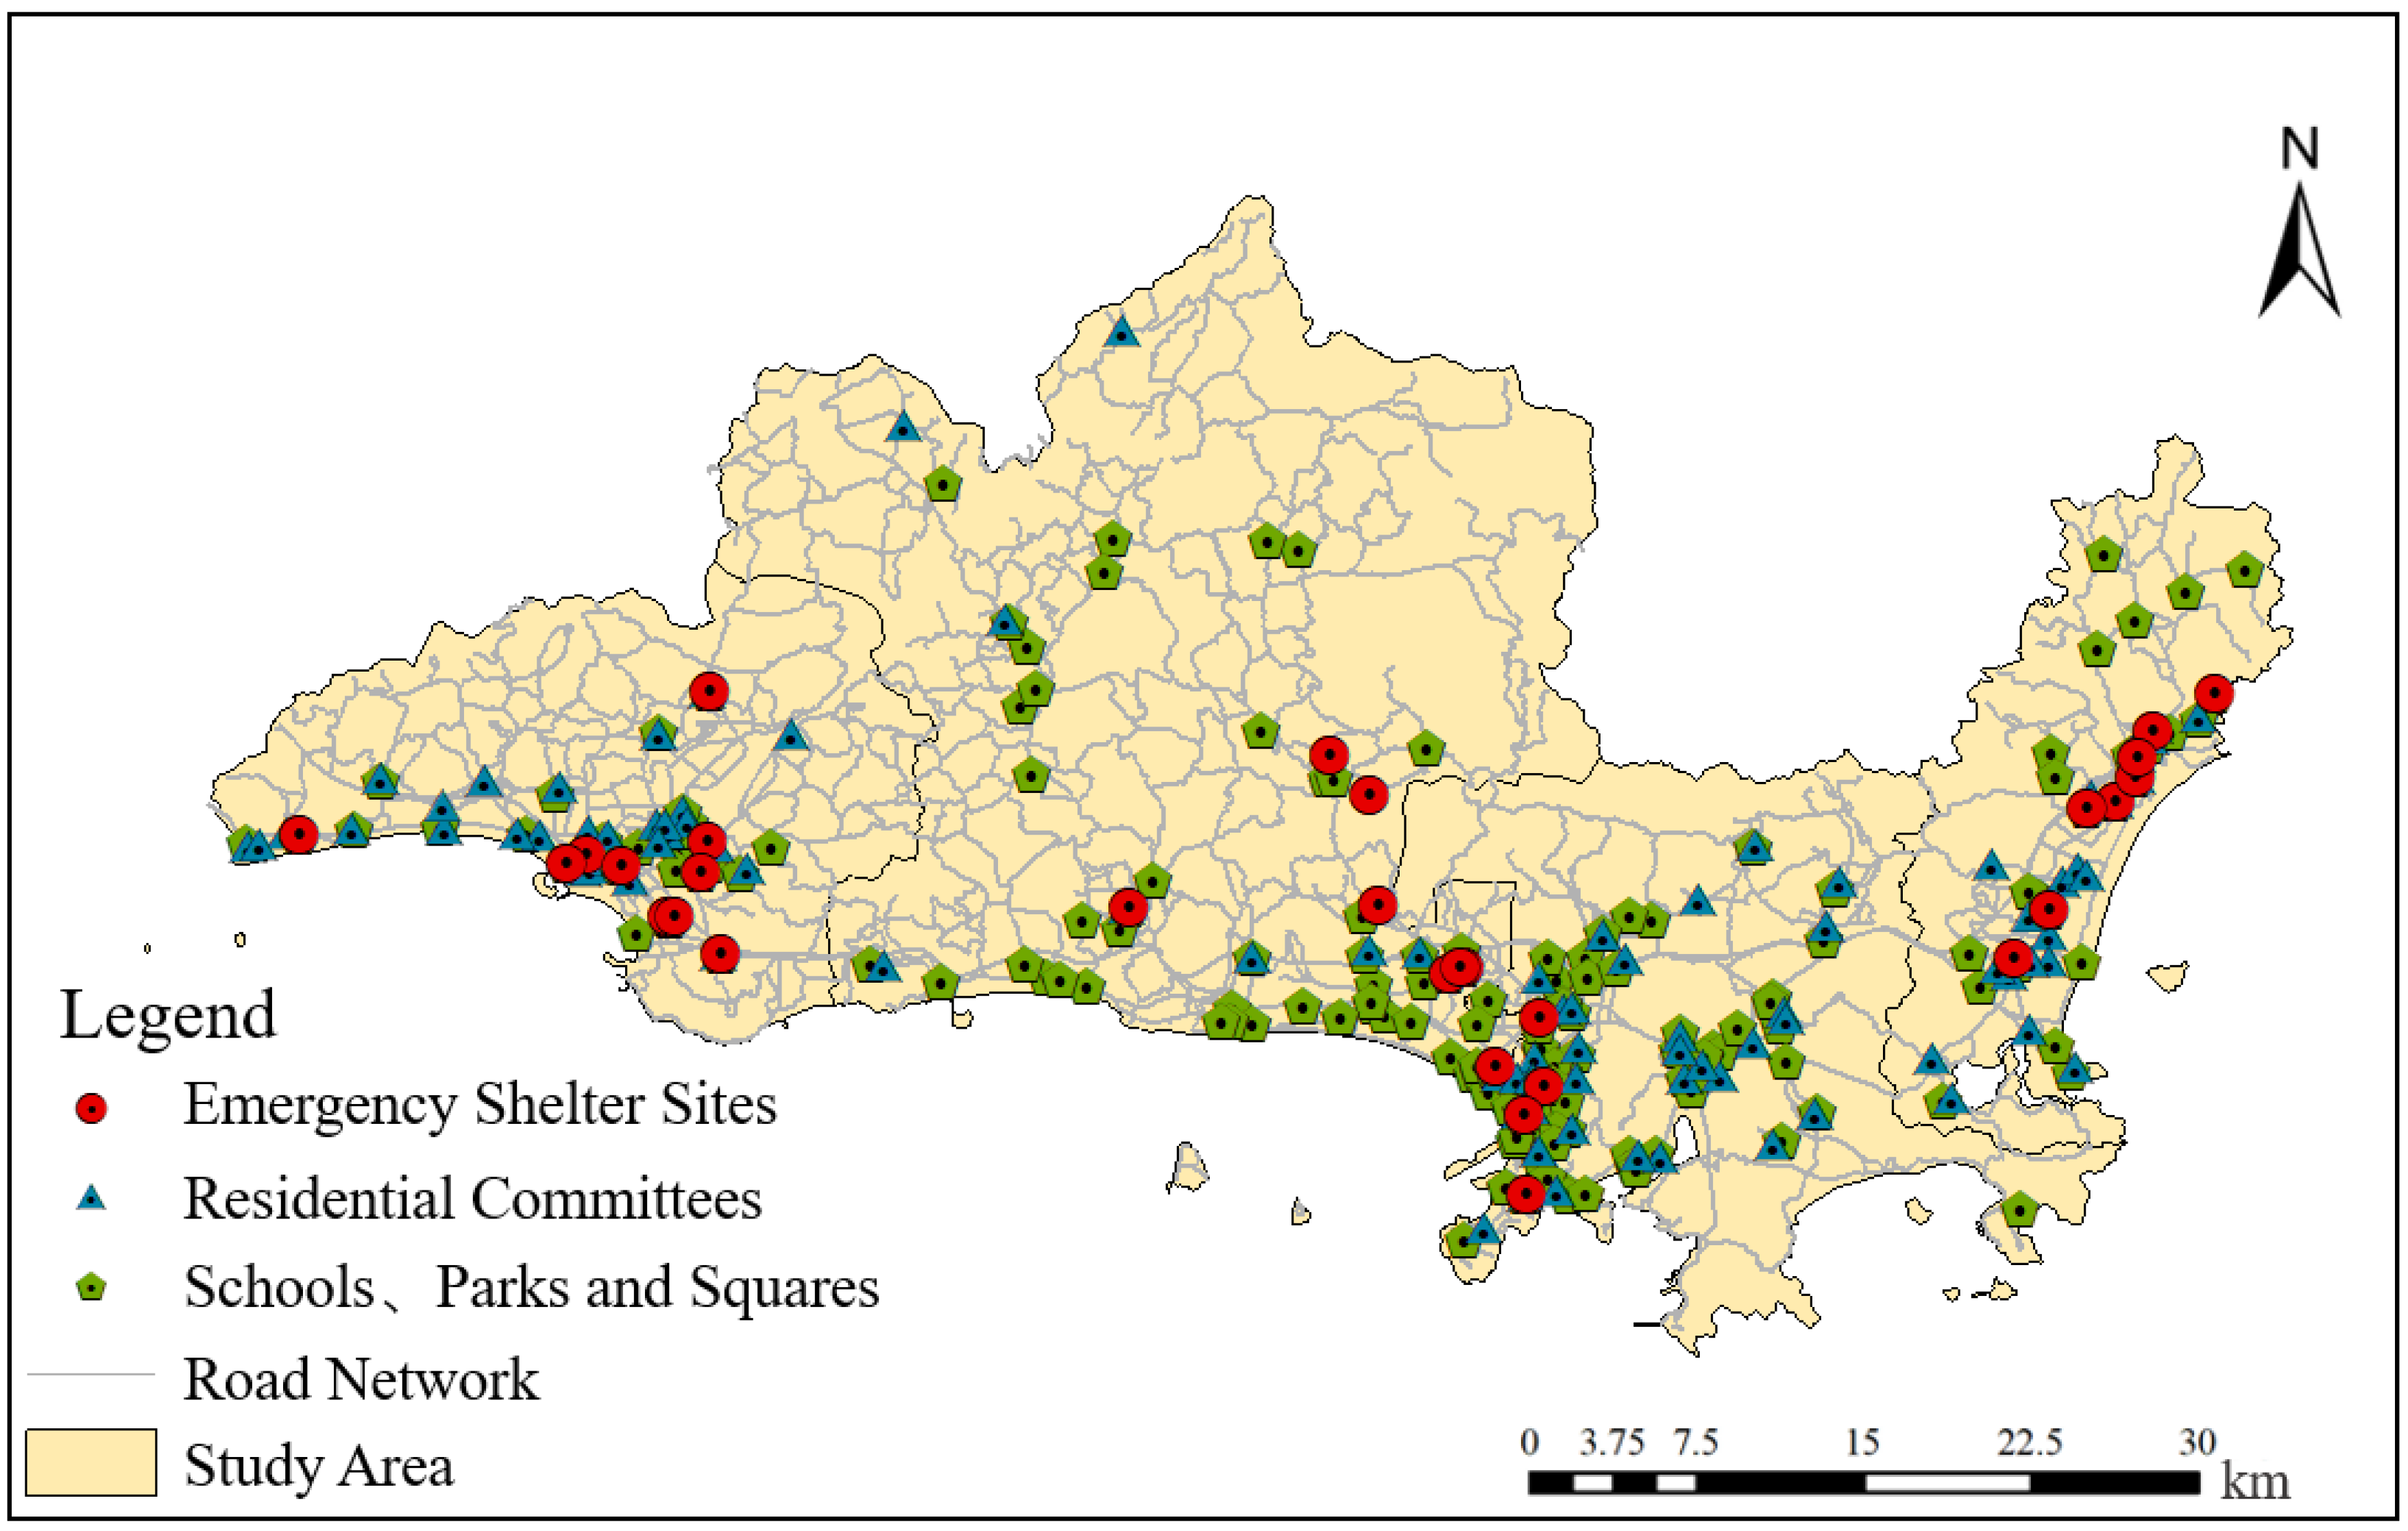
Sanya City is located in the southernmost area of Hainan Province, China. Its northern and western parts feature mountainous and hilly terrain, the central area forms river valley plains, and coastal plains are distributed in the southern area. Mountain-valley transition zones are widely distributed across the study area, where the rock and soil structure has poor stability. Affected by tropical cyclones, Sanya’s typhoon season runs from June to October each year. Severe typhoons are frequently accompanied by torrential rains and storm surges, with rainfall exceeding 300 mm in a single event. Such heavy downpours are prone to triggering geological disasters in mountainous areas and urban waterlogging, while storm surges exacerbate flooding in coastal regions. These two types of disasters exhibit significant coupling effects, posing severe challenges to urban disaster prevention, mitigation and emergency management. This study compiled data on 121 geological disaster points and 131 flood disaster events in Sanya City (Figure 1). Specifically, geological disasters are dominated by landslides and collapses, which originate from the complex geological structures and weathered, loose rock and soil masses in the region, coupled with human engineering activities [46,47] such as mountain excavation and coastline reconstruction during urban construction. Flood disasters are driven by the dual effects of “internal waterlogging and external threats” [48,49]: internal waterlogging is caused by short-duration intense rainfall and topographic runoff convergence; external threats denote typhoon-induced storm surges and wave erosion that threaten coastal zones. Sanya City currently has 30 built emergency shelter sites. Nevertheless, continuous urban sprawl and population growth make the current shelters inadequate for resident evacuation during sudden disaster outbreaks. Hence, developing new urban emergency shelter sites [50] is urgent, and scientific site selection for these shelters is vital. Based on the principle of combining daily operation and emergency disaster response, we screened 263 candidate emergency shelter plots in Sanya City, covering village committees, community service centers, schools, open squares and urban parks. These 263 sites do not include the 30 existing formal emergency shelters. After incorporating the built shelters into the candidate pool, the total number of initial candidate shelters reaches 293. These candidate plots serve as the basic dataset for follow-up emergency shelter site selection and spatial layout optimization (Figure 2).

2.2. Dataset

The data used in this study mainly include the following: Historical geological and flood disaster data were provided by the Department of Natural Resources and Planning of Hainan Province, including information such as type, location, scale grade, and triggering factors. Digital Elevation Model (DEM) raster data with a spatial resolution of 30 m was sourced from the Geospatial Data Cloud https://www.gscloud.cn/ (accessed on 10 June 2025). Lithology and the Mean Annual Precipitation (MAP) were obtained from the Geographic Remote Sensing Ecological Network https://gisrs.cn/ (accessed on 2 July 2025). Normalized Difference Vegetation Index (NDVI) was acquired from the National Tibetan Plateau Data Center https://data.tpdc.ac.cn/home (accessed on 3 July 2025). This 30 m annual maximum composite product is generated from Landsat 8/9 OLI imagery (16-day revisit), with standardized atmospheric correction, cloud masking and standard NDVI calculation implemented officially. We clipped the NDVI raster to Sanya’s administrative boundary and extracted annual mean values for modeling. Administrative boundaries, road networks, river systems and 30 m annual land cover data of Sanya were collected from the National Catalog Service for Geographic Information https://www.webmap.cn/ (accessed on 3 July 2025). The land cover product was classified via random forest based on multi-temporal Landsat reflectance and validated with field samples; we reclassified its original categories into eight unified land cover types matching the assessment framework. Euclidean distance rasters to roads, rivers and faults were further produced from vector layers, which are GIS auxiliary variables rather than native remote sensing products. Soil type was obtained from the Resource and Environmental Science and Data Center https://www.resdc.cn/ (accessed on 7 July 2025). Basic information on existing emergency shelter sites, rural and urban community committees, schools, and permanent population distribution in Sanya City was provided by the Emergency Management Department of Hainan Province, including details such as location, area, effective shelter area, and capacity. Park and square data were sourced from OpenStreetMap https://www.openstreetmap.org/ (accessed on 10 July 2025), and information including their location, effective shelter area, and capacity was extracted in accordance with emergency shelter design standards. Information on gas stations and chemical plants was obtained through the Baidu Maps API https://baidumap.apifox.cn/ (accessed on 10 July 2025).

3. Method

3.1. Optimization of Emergency Shelter Sites Layout

Geological and flood disasters induced by typhoons pose considerable threats to socioeconomic stability and human safety in Sanya City, and emergency shelter sites can effectively enhance the city’s capacity to defend against such disasters. Therefore, this study integrates the comprehensive hazard assessment of geological-flood compound disasters and the layout optimization of emergency shelter sites in Sanya City into a single research framework, and constructs a research framework for the emergency shelter siting model under compound disaster scenarios. The specific process is illustrated in Figure 3.

3.2. Compound Disaster Hazard

3.2.1. Single-Hazard Assessment

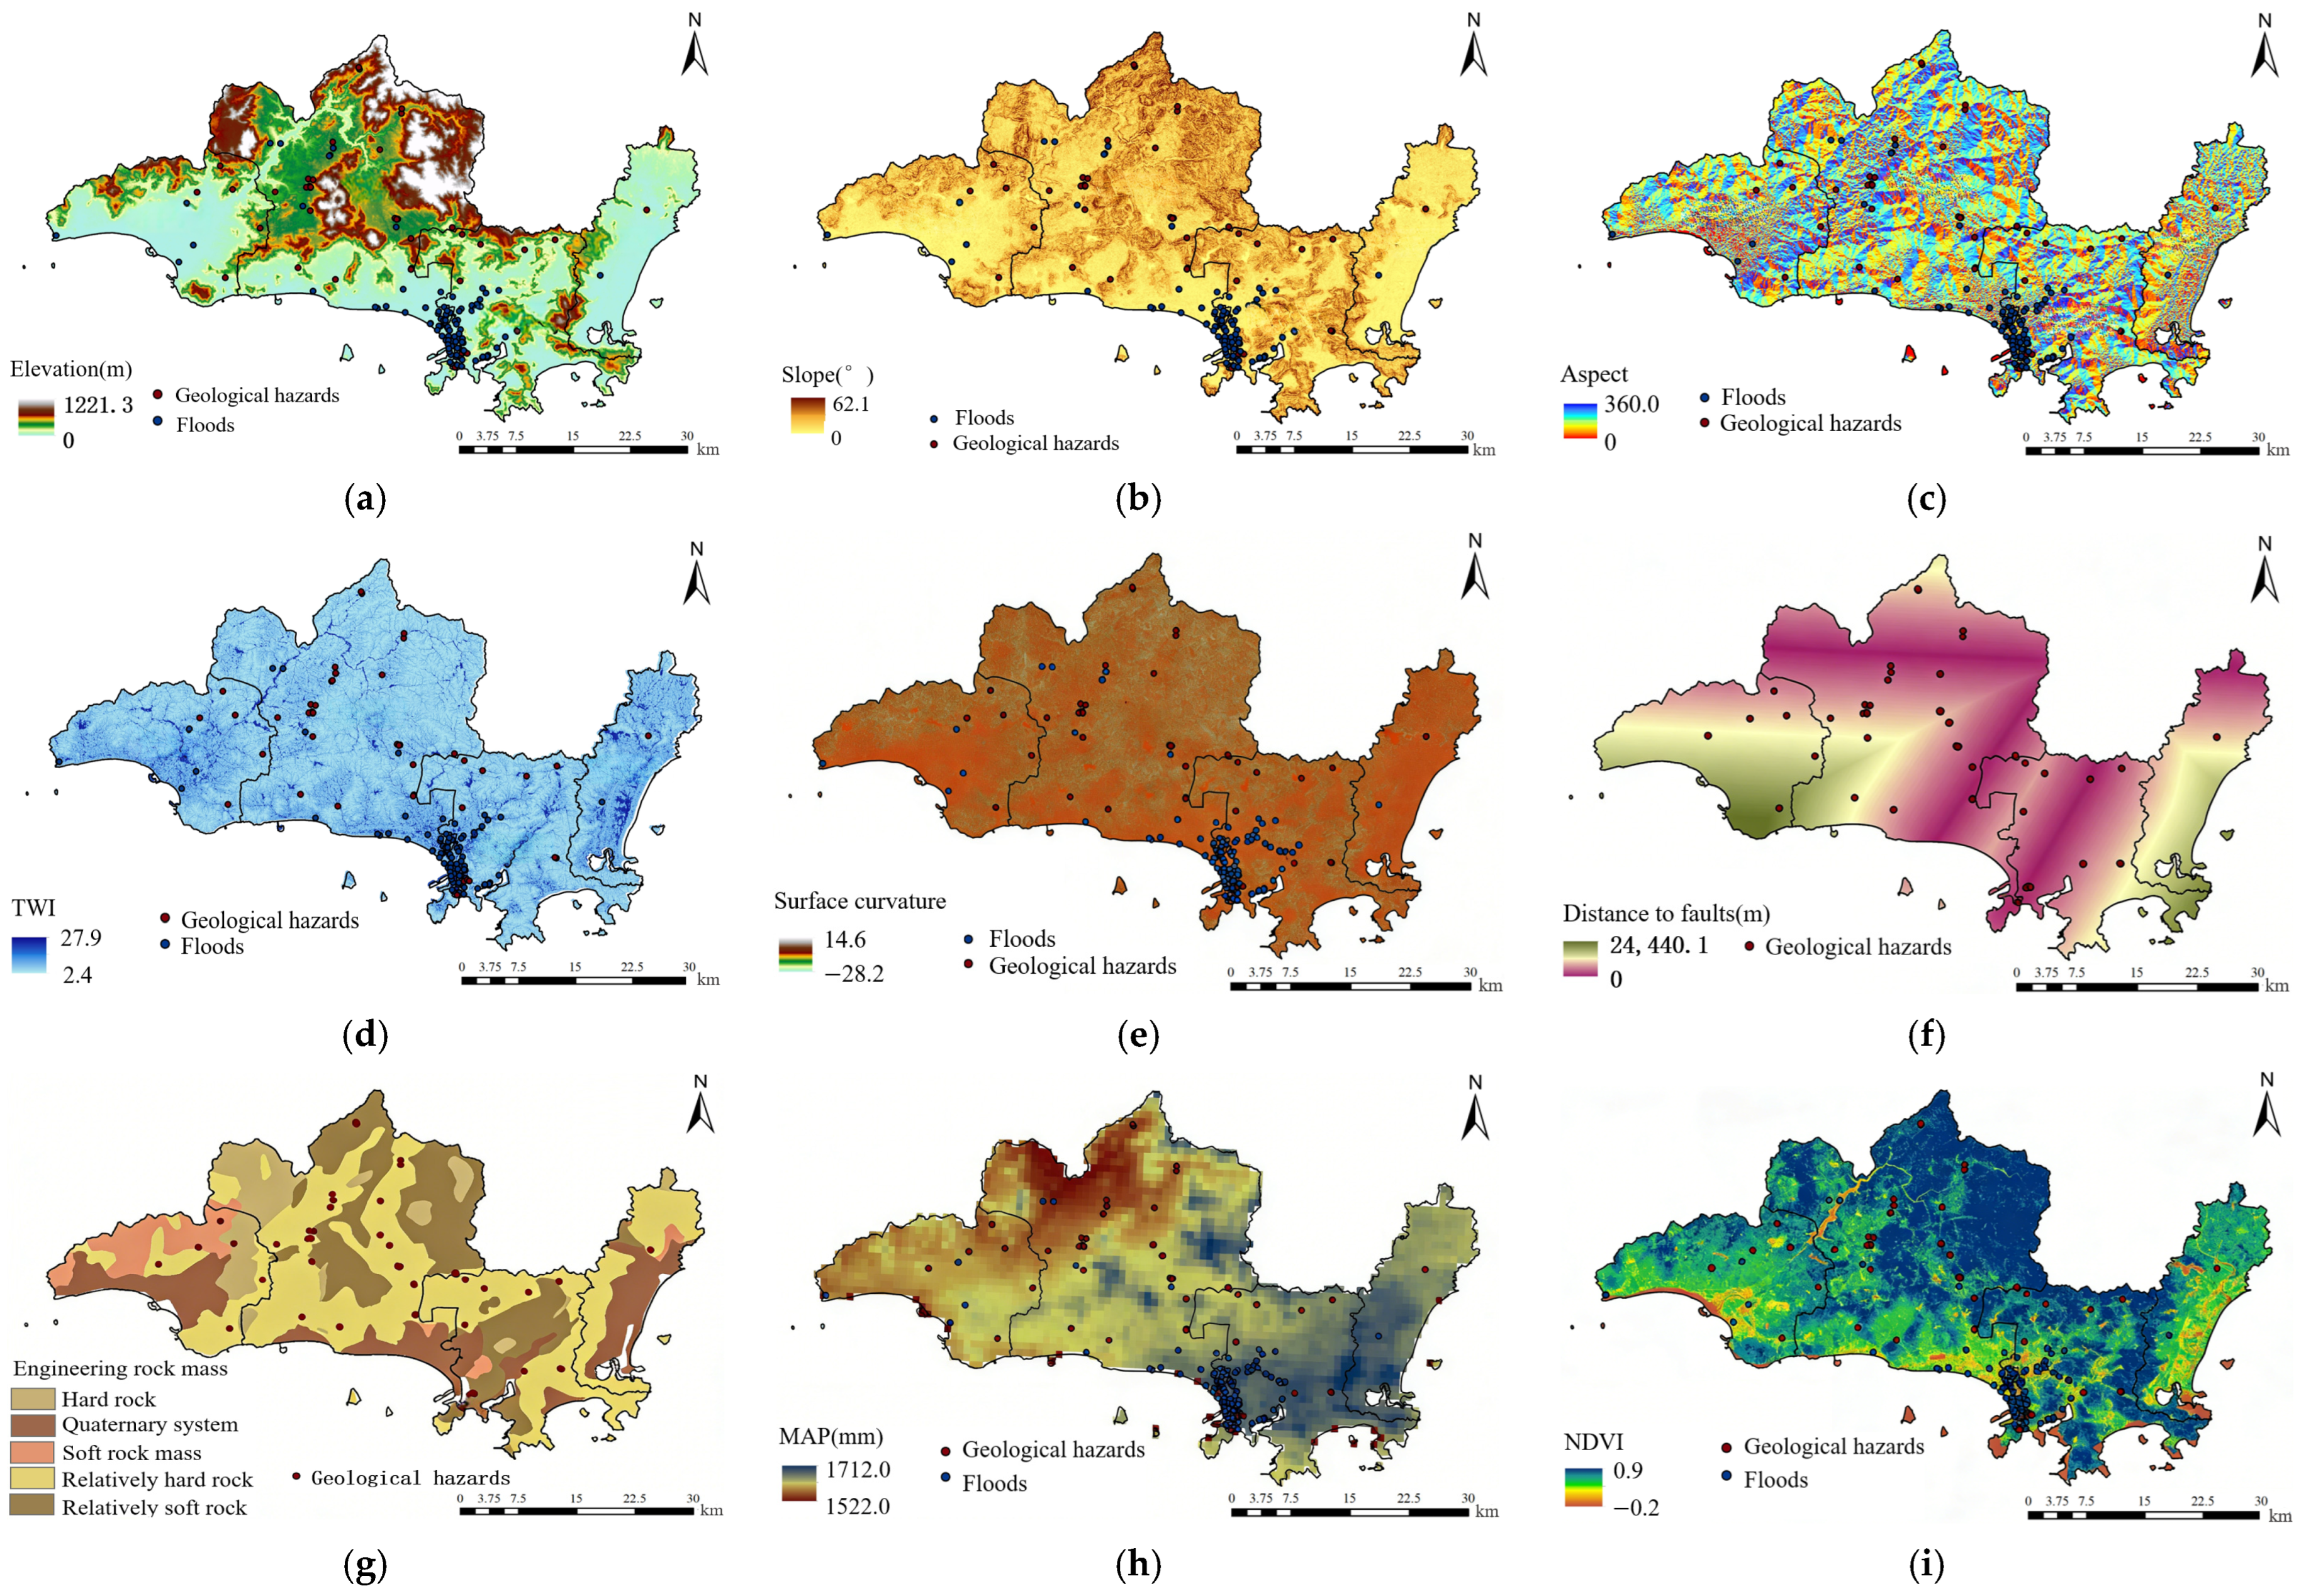
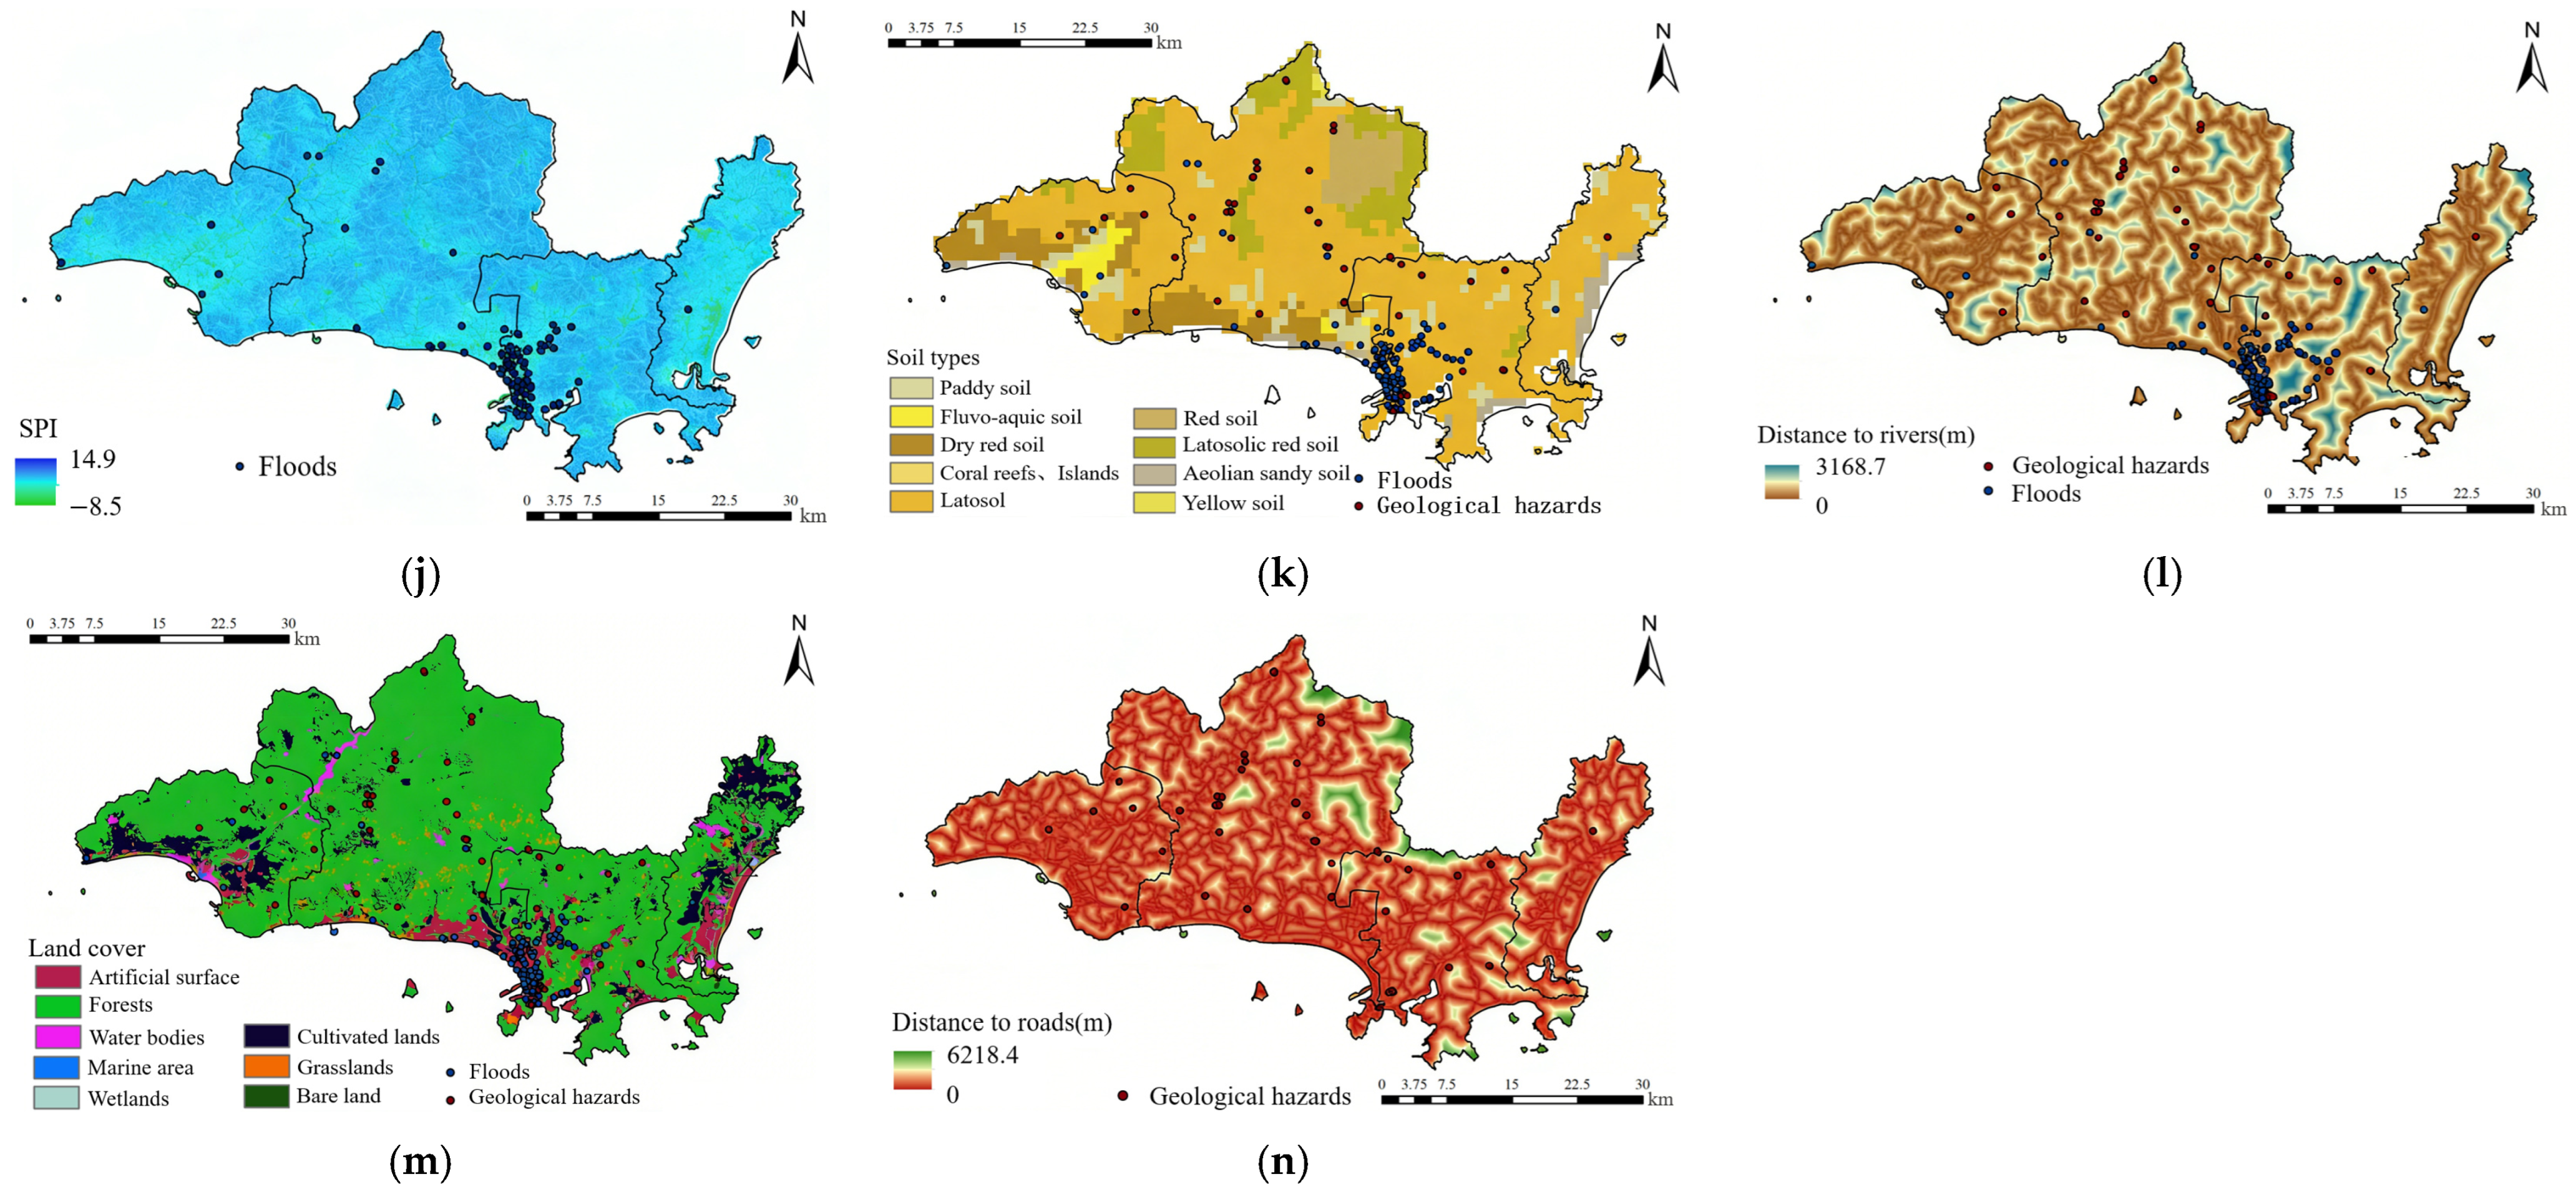
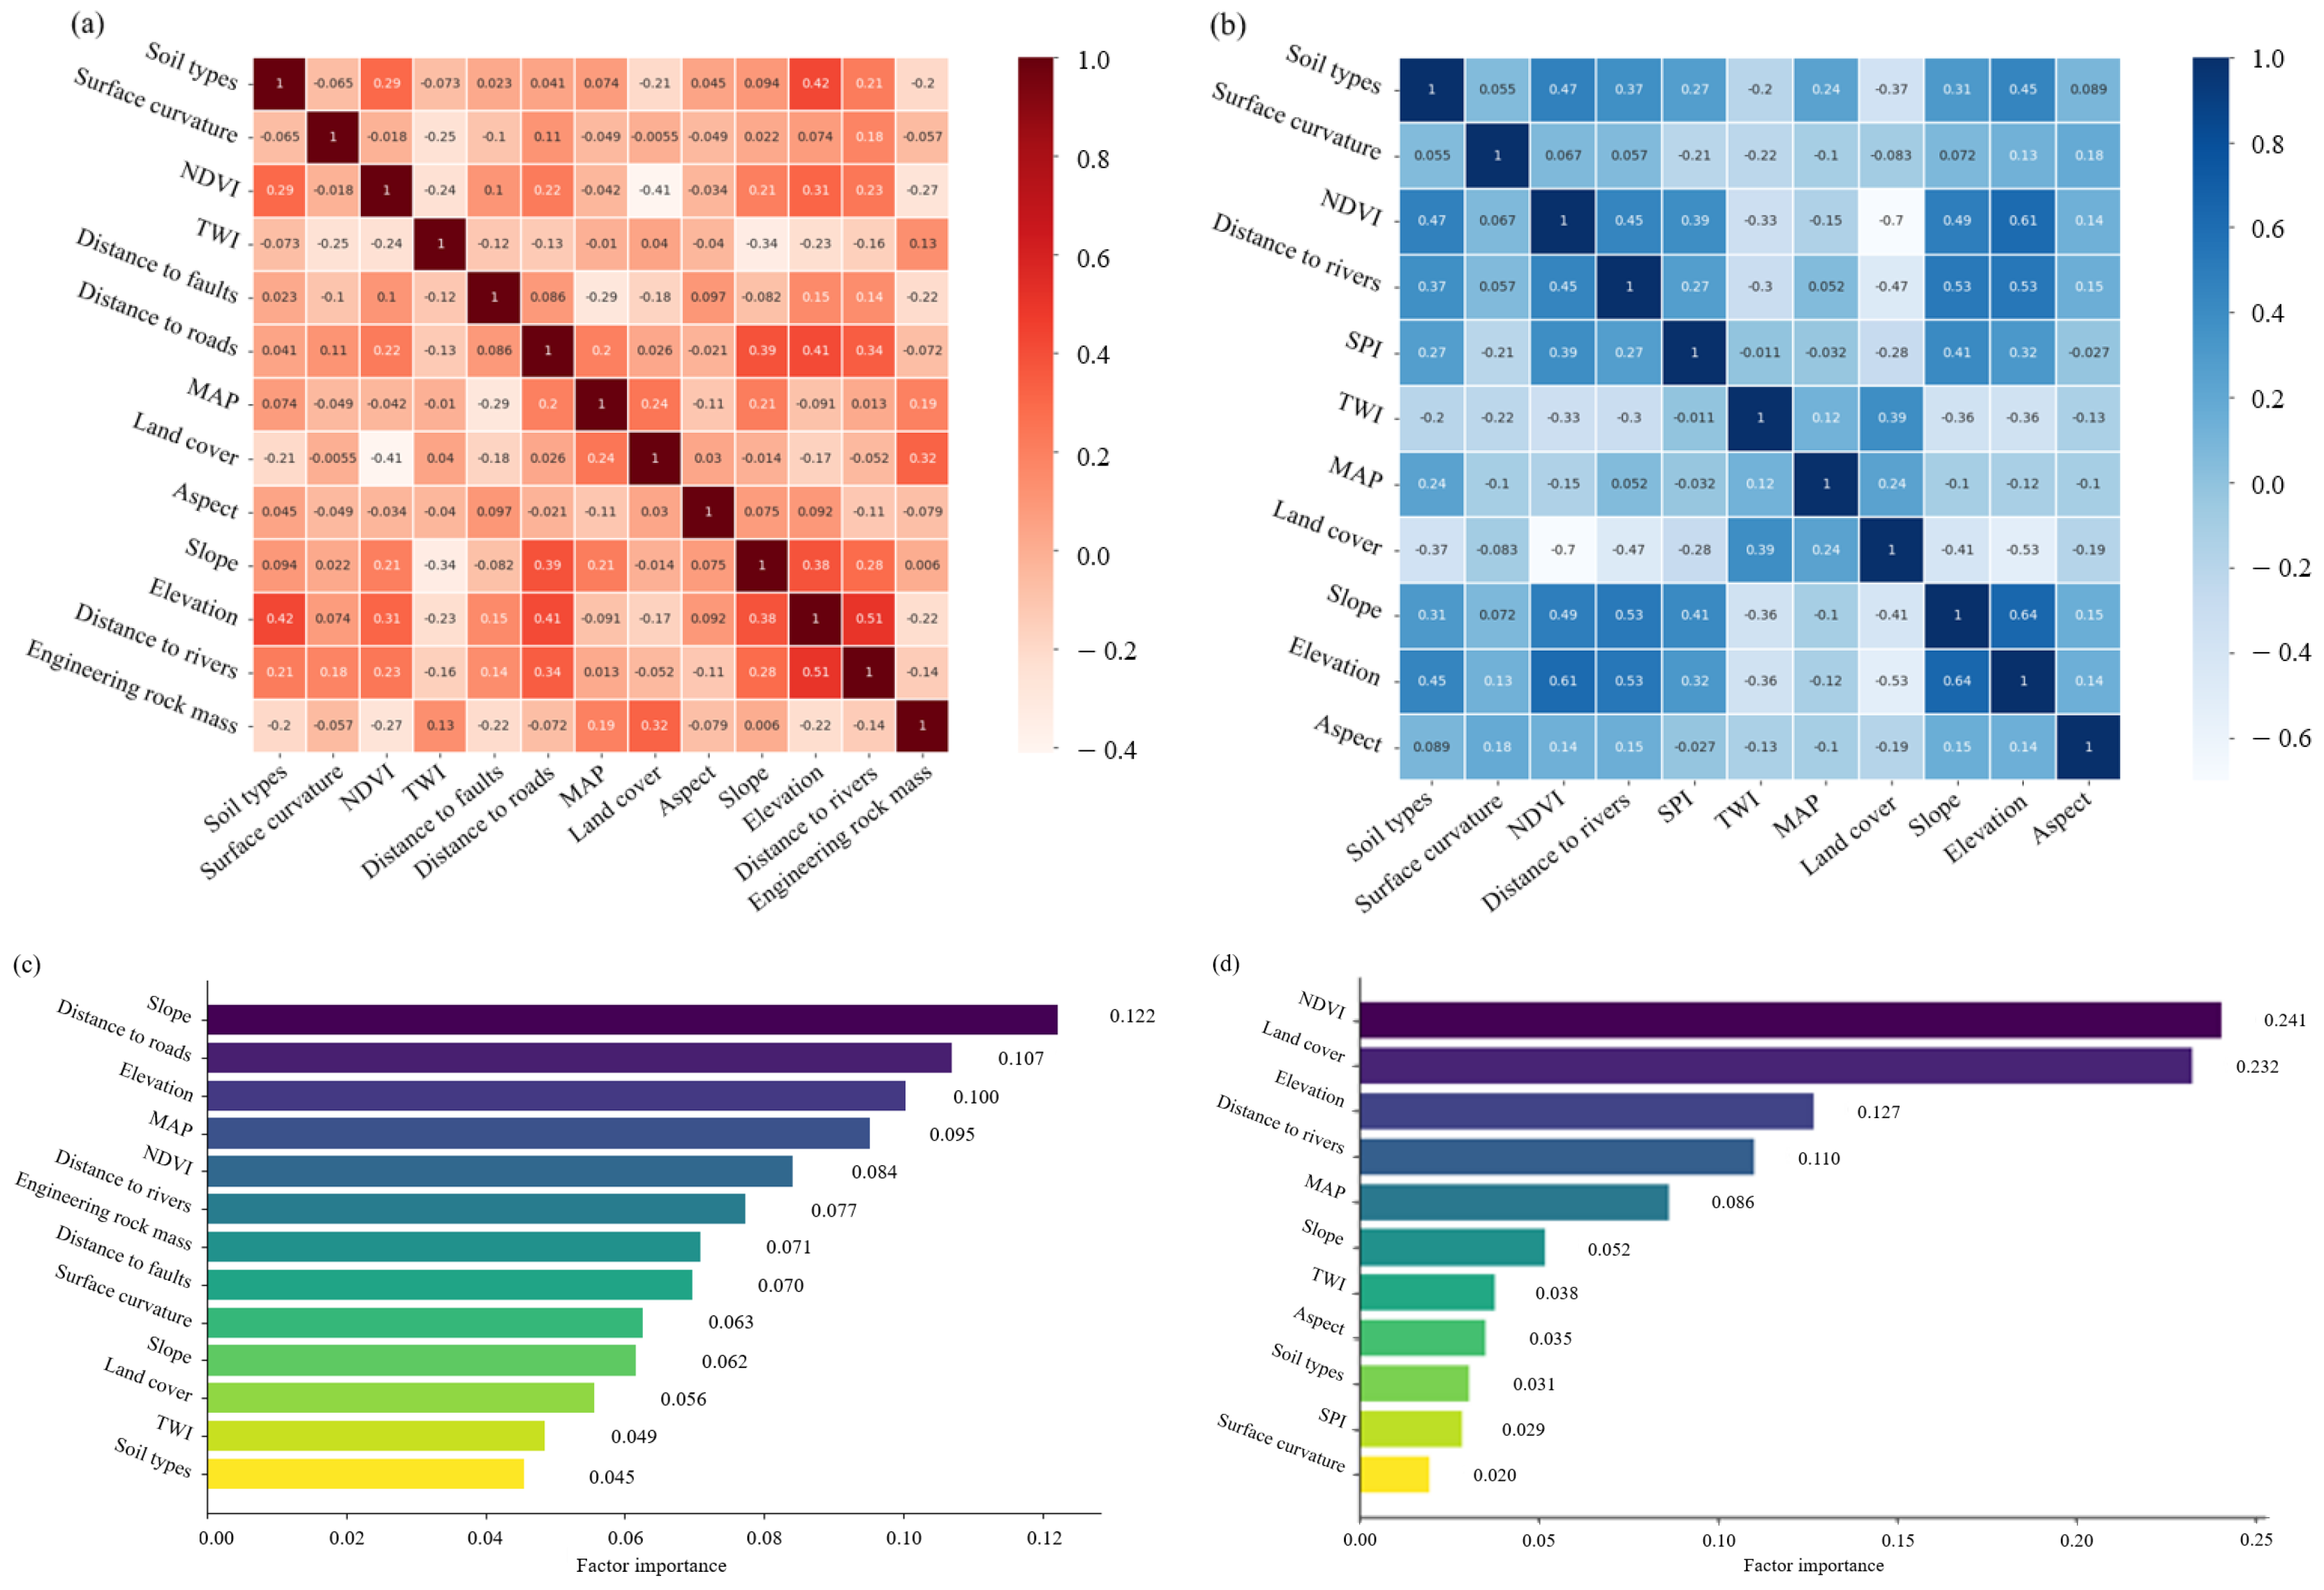
With reference to the current characteristics of Sanya City and existing research findings, topography and geological structure are the conditional factors for the occurrence of natural disasters such as geological and flood disasters in coastal cities, while the environment and human activities serve as their triggering factors [51,52]. In accordance with the hazard-causing factors and disaster-forming environment of the disaster system, a comprehensive hazard assessment index system for geological-flood compound disasters was constructed (Table 1). All covariates fall into three categories: DEM-derived terrain indices, GIS vector distance layers, and remote sensing products (NDVI, land cover), with unified preprocessing implemented in ArcGIS 10.5 (Esri, Redlands, CA, USA) as follows: First, slope, aspect, curvature, TWI and SPI were extracted from the 30 m DEM using surface analysis tools. Second, Euclidean distance layers to roads, rivers and faults were generated from corresponding vector datasets. Third, NDVI and land cover remote sensing products were clipped to Sanya’s administrative boundary and resampled to a consistent 30 m grid via the nearest-neighbor method. To obtain more refined results of disaster hazard assessment, regular grids with a resolution of 30 × 30 m were selected as the basic units. All factors were resampled into the grids, and the natural breaks method was used to reclassify all grid data, followed by recoding to obtain a new set of impact factors (Figure 4).
Drawing on the research experience of previous scholars [53,54], non-disaster sample points were randomly selected in a 1:1 ratio within the study area to construct a sample dataset. The actual attribute of sample points was assigned a value of “1”, indicating the occurrence of geological or flood disasters; negative samples were assigned a value of “0”, indicating no historical records of geological or flood disasters. The RF [55,56] was applied to calculate the Single Disaster Risk Index (SDRI) for geological and flood disasters. The underlying principles are as follows: The bootstrap resampling technique was used to randomly extract sample subsets from the training set. Decision trees were generated by recursively partitioning each sample subset into two parts using binary recursive splitting technology; The bagging method and feature subspace method were introduced to sample the training dataset. During the decision tree growth process, trees were allowed to develop unconstrained and to their maximum extent. Ultimately, multiple decision trees constituted the RF classifier, which performed classification and prediction on the training dataset, with the mean value of predictions output as the final result; The reliability of the geological and flood disaster hazard assessment model was verified using the Area Under the Curve (AUC) derived from the Receiver Operating Characteristic (ROC) curve; Based on the calculated hazard indices, the study area was divided into five hazard levels: extremely low, low, moderate, high, and extremely high.

3.2.2. Coupling Excitation Model of Compound Disasters

Compound disasters [57] can be defined as multiple disasters occurring simultaneously or consecutively under the combined action of various hazard-causing factors, with their impacts on cities exhibiting the characteristic of superposition effects. Referring to the standardized quantitative framework of multi-hazard coupling proposed by Liu et al. [58], this study develops a coupling excitation model for geological-flood compound hazards to quantify the triggering relationships of disaster chains. The initial hazard intensity coefficients are adjusted to derive the compound hazard index integrating geological and flood hazards. The disaster grading criteria and coupling hazard intensity correction multipliers adopted herein are obtained from the well-established multi-hazard coupling assessment system reported in Liu et al. [58]. The construction scheme of the coupling matrix and the detailed calibration procedures for intensity correction parameters are presented as follows:
(1) A disaster coupling excitation matrix is constructed to quantify the cascading interaction intensity between triggering hazards and induced secondary hazards. Triggering hazards are defined as primary hazards, while induced hazards refer to potential secondary hazards [59]. A three-level discrete classification system (0, 1, and 2) is adopted: 0 indicates no inductive coupling relationship, 1 denotes weak coupling excitation, and 2 represents strong coupling excitation (Table 2). This three-tier classification paradigm and the fundamental judgment logic for pairwise inductive relationships among various hazards are derived from the natural–anthropogenic technological disaster chain trigger matrix established by Liu et al. [58], which has been validated and applied in practical cases of urban multi-hazard coupling risk assessment.
(2) Primary hazards are classified into five hazard grades: extremely low, low, moderate, high and extremely high, which are denoted by 1, 2, 3, 4 and 5, respectively. For primary hazards that cannot induce any secondary hazards, the coupling excitation value is assigned as 0, and their hazard levels remain unchanged. For primary hazards with the potential to induce secondary hazards via weak or strong excitation (corresponding to coupling excitation values of 1 and 2), the hazard intensity correction multipliers are determined following the disaster intensity correction criteria proposed by Liu et al. [58]. These criteria define differentiated correction multipliers corresponding to varying induction probabilities and primary hazard grades, as detailed in Table 3.
(3) Against this backdrop, we calculated the comprehensive hazard index of compound disasters. Based on the sequential triggering logic of disaster chains, the hazard intensity of initial disasters (floods and geological disasters) was first derived using the RF. Second, the intensity of secondary disasters was adjusted according to the probability grades in the coupling excitation effect matrix (i.e., a high probability of triggering leads to intensity upgrading). Finally, the comprehensive hazard intensity of the disaster chain was derived through raster superposition, ensuring that the results can reflect the superposition effect of the “initial disaster-secondary disaster” process. The formula is as follows:
M H = i = 1 n H a i
where MH is the comprehensive multi-hazard intensity, and H a i represents the adjusted disaster intensity. The raster data of geological-flood compound disaster hazards in the study area were calculated using the Raster Calculator tool in ArcGIS 10.5 software, and a comprehensive hazard zoning map of geological-flood compound disasters was generated.

3.3. Methodology of Emergency Shelter Site Suitability Evaluation

Emergency shelter sites are essential guarantee facilities for urban disaster prevention and mitigation. They can provide residents with refuge spaces and effective shelter conditions when geological or flood disasters occur under the impact of typhoons. From the perspective of shelter suitability [60], this study conducted a preliminary screening of candidate emergency shelter sites in Sanya City. The screening mainly focuses on two core indicators: the accessibility [61] and safety [62] of emergency shelter sites. Scores were assigned to each of these two indicators separately, and the cumulative score was used to represent the comprehensive suitability score of the shelters. That is, the higher the comprehensive score, the more ideal the suitability of the emergency shelter site.

3.3.1. Accessibility Analysis

In this study, we adopted the G2SFCA [63], which was a spatial accessibility measurement approach based on the concept of opportunity accumulation to evaluate the spatial accessibility of emergency shelter sites. On the basis of the traditional Two-step Floating Catchment Area (2SFCA) method, it introduced a distance decay function and performed two rounds of searches within a predefined search radius. The accessibility was determined by the number of emergency shelter sites that could be reached by shelter demand points within the search scope—the greater the number, the better the accessibility. The specific process is as follows:
(1) The spatial search domain was obtained using the OD cost matrix [64,65], and the population within this domain was counted. The population of each demand point was weighted and summed via the Gaussian equation to derive the service population of the emergency shelter sites. Subsequently, the ratio of the shelter’s supply capacity to its current service population was calculated, yielding the supply-demand ratio of the emergency shelter sites within the search domain.
R j = S j / k d i j d 0 D i × G d i j , d 0
where j and i represent the emergency shelter sites and demand points in the study area. R j and S j are the supply-demand ratio and supply capacity of the emergency shelter sites, and D i and d 0 are the population of demand points within the spatial search domain and shelter search threshold. d i j and G d i j , d 0 represent the distance from demand points to emergency shelter sites and the distance decay function within the search radius, respectively.
G d i j = e 1 / 2 d i j / d 0 2 e 1 / 2 1 e 1 / 2 , d i j d 0 0 , d i j > d 0
(2) In the same manner as the above process, starting from the shelter demand points, another spatial search domain could be obtained with the same shelter search threshold. The supply-demand ratios of emergency shelter sites were weighted and summed via the Gaussian equation, thus deriving the accessibility of each shelter demand point to emergency shelter sites.
θ i = j d i j d 0 G d i j , d 0 × R j
where θ i represents the accessibility from demand points to emergency shelter sites within the study area.

3.3.2. Safety Analysis

The determination of safety indicators [66] in emergency shelter site planning is an important step. It requires comprehensive consideration of different disaster types and in-depth analysis of the potential impacts of disasters on emergency shelter sites. Therefore, the selection of safety indicators must take into account the differences in impacts caused by various disaster types. We mainly selected the geological-flood compound disaster hazard level, distance to faults, distance to hazard sites, and distance to gas stations and chemical plants as the safety evaluation indicators for emergency shelter site selection, and used their cumulative score as the comprehensive safety index of candidate emergency shelter sites (Table 4).

3.4. Emergency Shelter Sites Layout Optimization Model

Considering comprehensively the geological-flood compound disaster hazard of the study area and the suitability evaluation results of candidate emergency shelter sites, we took multi-objective optimization [67,68] as the problem orientation, and constructed an urban emergency shelter site selection model with shelter evacuation distance, shelter capacity, shelter utilization rate and uniqueness of shelter allocation as constraint conditions, while taking into account the efficiency of shelter evacuation and the construction cost of shelters in the site selection process. Specifically, the Tent chaotic sequence-based Gray Wolf Optimizer (GWO) [69] was introduced to solve the multi-objective optimization problem in emergency shelter site planning. Furthermore, the utilization balance of shelters and evacuation fairness were adopted as the evaluation indicators of site selection schemes, so as to select the relatively optimal emergency shelter site selection scheme for geological and flood disasters in Sanya City.

3.4.1. MOGWO

Traditional solutions to multi-objective problems usually convert multiple objectives into a single objective, which is suitable for linear problems but difficult to obtain accurate and effective optimal solutions. The determination of emergency shelter site selection schemes under compound disaster scenarios is a multi-objective optimization problem. Solving it via multi-objective evolutionary algorithms often fails to yield a unique optimal solution, which needs to be screened according to the decision-makers’ objective preferences [70]. The key step in the entire process is the solution of the Pareto optimal solution set, namely the corresponding Pareto optimal front PF’. At present, multi-objective intelligent optimization algorithms are effectively applied to solve such problems. Based on this, we choose to adopt the MOGWO [71,72] to construct the optimal layout model of emergency shelter sites in Sanya City. On the basis of the conventional GWO, we added the function of storing the non-dominated Pareto optimal solutions obtained so far and improved the selection strategy of leading wolves. Its main principles are as follows:
(1) Firstly, we needed to construct a gray wolf social hierarchy model and calculate the fitness of each individual in the population. In accordance with the hierarchical allocation principle of gray wolves in nature, we selected the three gray wolves with the best fitness and labeled them as α , β , and δ in sequence, with the remaining gray wolves designated as ω . During hunting, α , β , and δ were responsible for or assisted in making decisions regarding hunting, habitat selection, daily routines, and other activities, while ω must obey the gray wolves of other social hierarchies. The algorithm optimization process was mainly guided by the three best solutions ( α , β , δ ) in each generation of the population. The behavior of gray wolves encircling prey can be expressed as follows:
D p = C × X p t X t X i ( t + 1 ) = X p t A × D p A = 2 a × r 1 a C = 2 × r 2 a = 2 t / t max × 2
where D p represents the Euclidean distance between the gray wolf individual and the prey. X p t represents the position vector of the prey at iteration t . X t stands for the position vector of the current gray wolf individual at iteration t. X i ( t + 1 ) indicates the updated position of the i-th gray wolf at iteration t + 1 . A refers to the convergence control coefficient vector balancing global exploration and local exploitation. C is the random weight coefficient vector for prey position perturbation. t is the current iteration number; t max is the maximum iteration number of the algorithm. a is a linearly decreasing convergence factor that declines from 2 to 0 as iterations proceed, and it decays linearly from 2 to 0 over the whole iterative process to adjust the search range adaptively. r 1 and r 2 are uniformly distributed random numbers within the range [0, 1], which introduce random weights for prey searching to avoid premature convergence to local optima.
(2) Considering that the characteristics of the solution space are unknown for most problems, it was difficult for the leading wolves to determine the precise position of the prey (i.e., the optimal solution). During the iteration process, the position information of the three best gray wolves ( α , β , δ ) in the current population was retained, and the positions of other search members were updated based on their position information. The mathematical model of this process is as follows:
D α = C 1 X α X , D β = C 2 X β X , D δ = C 3 X δ X X 1 = X α A α D α , X 2 = X β A β D β , X 3 = X δ A δ D δ X t + 1 = X 1 + X 2 + X 3 / 3
in which X α , X β , and X δ are represented by the position vectors of α , β , and δ in the current population; and D α , D β , and D δ are the distances between the current candidate gray wolves and the three optimal gray wolves.
In general, α , β , and δ needed to first predict the approximate position of the prey (i.e., the potential optimal solution), and other candidate gray wolves randomly updated their positions around the prey under the guidance of the current optimal gray wolves. When ∣A∣ > 1, the wolf pack dispersed in various regions to search for prey, and the candidate gray wolves moved away from the prey, enabling GWO to enter the global search stage; when ∣A∣ < 1, the wolf pack conducted concentrated search in one or several regions and accomplished the encircling of the prey.
(3) To retrieve and store the obtained non-dominated Pareto optimal solutions, the MOGWO introduced an external population called Archive on the basis of the traditional GWO. After each iteration, the newly generated strategies were compared with the original ones stored in the Archive, and the strategies were updated with the optimal solutions recorded accordingly. In the search process, optimal solutions were selected from the Archive via roulette wheel selection, where the probability of each individual being selected is inversely proportional to the total number of individuals. The probability formula is as follows:
P i = c / N i
in Equation (7), c represents a constant value greater than 1; and N i represents the number of Pareto optimal solutions obtained in the i-th storage unit.
The population initialization of the traditional GWO was randomly generated, which has drawbacks such as insufficient population diversity and premature convergence. To address these issues, we introduced the chaotic mapping Tent to improve the population initialization strategy of the MOGWO. With the characteristics of ergodicity and non-repeatability, this method could effectively alleviate the problem of uneven distribution in population initialization. Its mathematical expression is as follows:
z i + 1 = 2 z i + r a n d 0 , 1 / N T , 0 z 0 . 5 2 1 z i + r a n d 0 , 1 / N T , 0 . 5 < z i 1
in which N T is the number of particles in the chaotic sequence; and r a n d 0 , 1 is a random number within the interval [0, 1].

3.4.2. Objective Problem Description and Modeling

When constructing a multi-objective site selection model for urban emergency shelter sites under the scenario of geological-flood compound disasters, we needed to fully consider factors such as the distance from demand points to shelters, maximum coverage, population weight, minimum quantity, and disaster characteristics [73]. The purpose was to rationally optimize the allocation of people in need of shelter and the layout of shelters in the city, ensuring that urban residents could evacuate to the optimal shelters via the shortest routes within the shortest time when disasters occur. Before constructing the multi-objective site selection model for shelters, we made the following assumptions for the model:
i.
The affected personnel at the same shelter demand point in Sanya City could only evacuate to the same emergency shelter sites as a group. To ensure the orderliness and efficiency of evacuation, the affected population of each shelter demand unit was regarded as an integral whole for evacuation.
ii.
The routes taken by affected personnel from their starting points to emergency shelter sites were all optimal evacuation routes.
iii.
The departure points of evacuees were set as the geometric centers of each shelter demand unit; similarly, the destination points were set as the geometric centers of each candidate emergency shelter site.
iv.
To facilitate the analysis of the accommodation capacity of shelter allocation schemes, it was specified that each demand point is assigned to a designated emergency shelter site.
v.
Based on the hazard assessment results of geological-flood disasters in the study area from previous research, only the personnel in high-hazard areas were considered to have shelter demand. The locations of evacuation demand points and population data were extracted based on the hazard zoning map and the vector map of permanent resident population distribution.
Based on the above descriptions of objectives and assumptions, we comprehensively evaluated the evacuation efficiency and construction cost of emergency shelter sites by considering three aspects: the total evacuation time, the total area of shelters, and the total number of shelters. The specific objective functions are as follows:
F 1 = min i = 1 I j = 1 J t i j Y i j F 2 = min j = 1 J s j X j F 3 = min j = 1 J X j
In Equations (9)–(11), I and J represents the set of shelter demand points and candidate shelters, respectively; F 1 , F 2 and F 3 represent the total evacuation time, total area, and total number of shelters in the objective functions. t i j is the evacuation time (hours) between demand point i and candidate shelter j ; Y i j takes a value of 1 when a shelter demand point i selects a candidate shelter j , and 0 otherwise. S j is the shelter area (m2) of a candidate shelter; X j takes a value of 1 when a candidate shelter j is selected, and 0 otherwise.
The constraints for the site selection of urban emergency shelter sites under the scenario of geological-flood compound disasters involved multiple aspects. In terms of spatial scope, the shelter demand points assigned to a corresponding shelter shall fall within the maximum service range of that shelter. In this study, time was used instead of distance, meaning that the evacuation time taken shall be less than the maximum time limit. The number of evacuees going to a shelter should not exceed the maximum capacity limit of that shelter. In terms of the allocation method, it was assumed that any shelter demand point can only be assigned to one emergency shelter site. Therefore, the constraints can be formulated as:
For the time constraint
t i j Y i j T max , i   I ,   j   J
For the capacity constraint
i = 1 I R × h i Y i j S j X j 0 , i   I ,   j   J
For the uniqueness constraint of shelter allocation
j = 1 J X j Y i j = 1 , i   I ,   j   J
X j = 1 ,   candidate   shelter   j   is   selected 0 ,   candidate   shelter   j   isn t   selected
Y i j = 1 ,   demand   point   i   selects   shelter   j 0 ,   demand   point   i   don t   select   shelter   j
In Equations (10) and (11), T max is the maximum evacuation time (hours); R and h i are the per capita effective shelter area (m2) and number of evacuees at the shelter demand point (person). In accordance with the setting principles for emergency shelter sites, we specified that the per capita effective shelter area shall not be less than 2 m2.
The MOGWO was adopted for the site selection of urban emergency shelter sites under the scenario of compound disasters, and the specific steps are as follows:
i.
Firstly, this study needed to initialize the parameters of the MOGWO, including setting the values of parameters such as the number of gray wolf populations, the size of the external archive population, and the maximum number of iterations; initialize the positions of gray wolves by means of Tent mapping.
ii.
Then, we could calculate the objective function values of individual gray wolves, perform non-dominated sorting, and construct and update the external archive.
iii.
It was necessary to update the convergence factor a and coefficient vectors A and C according to Equation (5).
iv.
Based on this, we screened out three alpha wolves (denoted as α , β , and δ ) from the external archive population by using Equation (7) and the roulette wheel selection method, and updated the positions of all gray wolves with Equations (5) and (6).
v.
Next, this study calculated the objective function values of individual gray wolves, determined their non-dominated Pareto optimal solutions, and updated the external archive population.
vi.
Finally, this study judged whether the number of iterations meets the maximum iteration condition: if yes, output the results; if not, repeat the process starting from step b.

4. Results Analysis

4.1. Single-Hazard Risk Assessment

4.1.1. Model Construction

In this study, a total of 14 preliminary evaluation factors were selected to construct the initial dataset for geological and flood hazard susceptibility modeling. Previous studies have demonstrated that strong multicollinearity among influencing factors can increase model training complexity, reduce computational efficiency, and ultimately degrade the accuracy and reliability of hazard assessment results. Accordingly, the Pearson correlation coefficient method and factor importance analysis were adopted to quantitatively explore the collinearity characteristics and contribution weights of each factor, providing a scientific basis for factor screening (Figure 5). The results indicated that, for geological hazard evaluation, only the correlation coefficient between elevation and river distance exceeded 0.5, while all other factor pairs presented lower correlation values; additionally, elevation exhibited a substantially higher importance value than river distance. For flood hazard evaluation, elevation, slope, and river distance showed pairwise correlation coefficients greater than 0.5, among which elevation and river distance contributed more significantly than slope. Based on the statistical analysis, 12 factors, including elevation, slope, aspect, TWI, curvature, fault distance, lithology, soil type, annual rainfall, NDVI, land cover type, and road distance, were finally selected as input variables for the geological hazard susceptibility model. Meanwhile, ten factors, namely elevation, aspect, TWI, curvature, river distance, soil type, annual rainfall, SPI, NDVI, and land cover type, were determined for the flood hazard susceptibility model.
A total of 121 geological hazard sites and 131 flood hazard sites surveyed in Sanya City were employed as positive samples and labeled with a value of 1. Following a 1:1 sample balancing strategy, an equal number of non-hazard points were randomly generated and assigned a value of 0 as negative samples to establish a complete dataset for hazard modeling. The entire dataset was randomly divided into a training set and a test set at a ratio of 7:3 for model training and accuracy verification, respectively. In this study, the RF was applied to construct susceptibility models for geological and flood hazards. Hyperparameter optimization is critical for improving the predictive performance of the RF model. To obtain the optimal parameter combination, grid search was utilized to tune the key hyperparameters systematically. With the ROC-AUC adopted as the evaluation metric, the optimal hyperparameter configuration was determined based on five-fold cross-validation (Table 5).

4.1.2. Geological Disasters

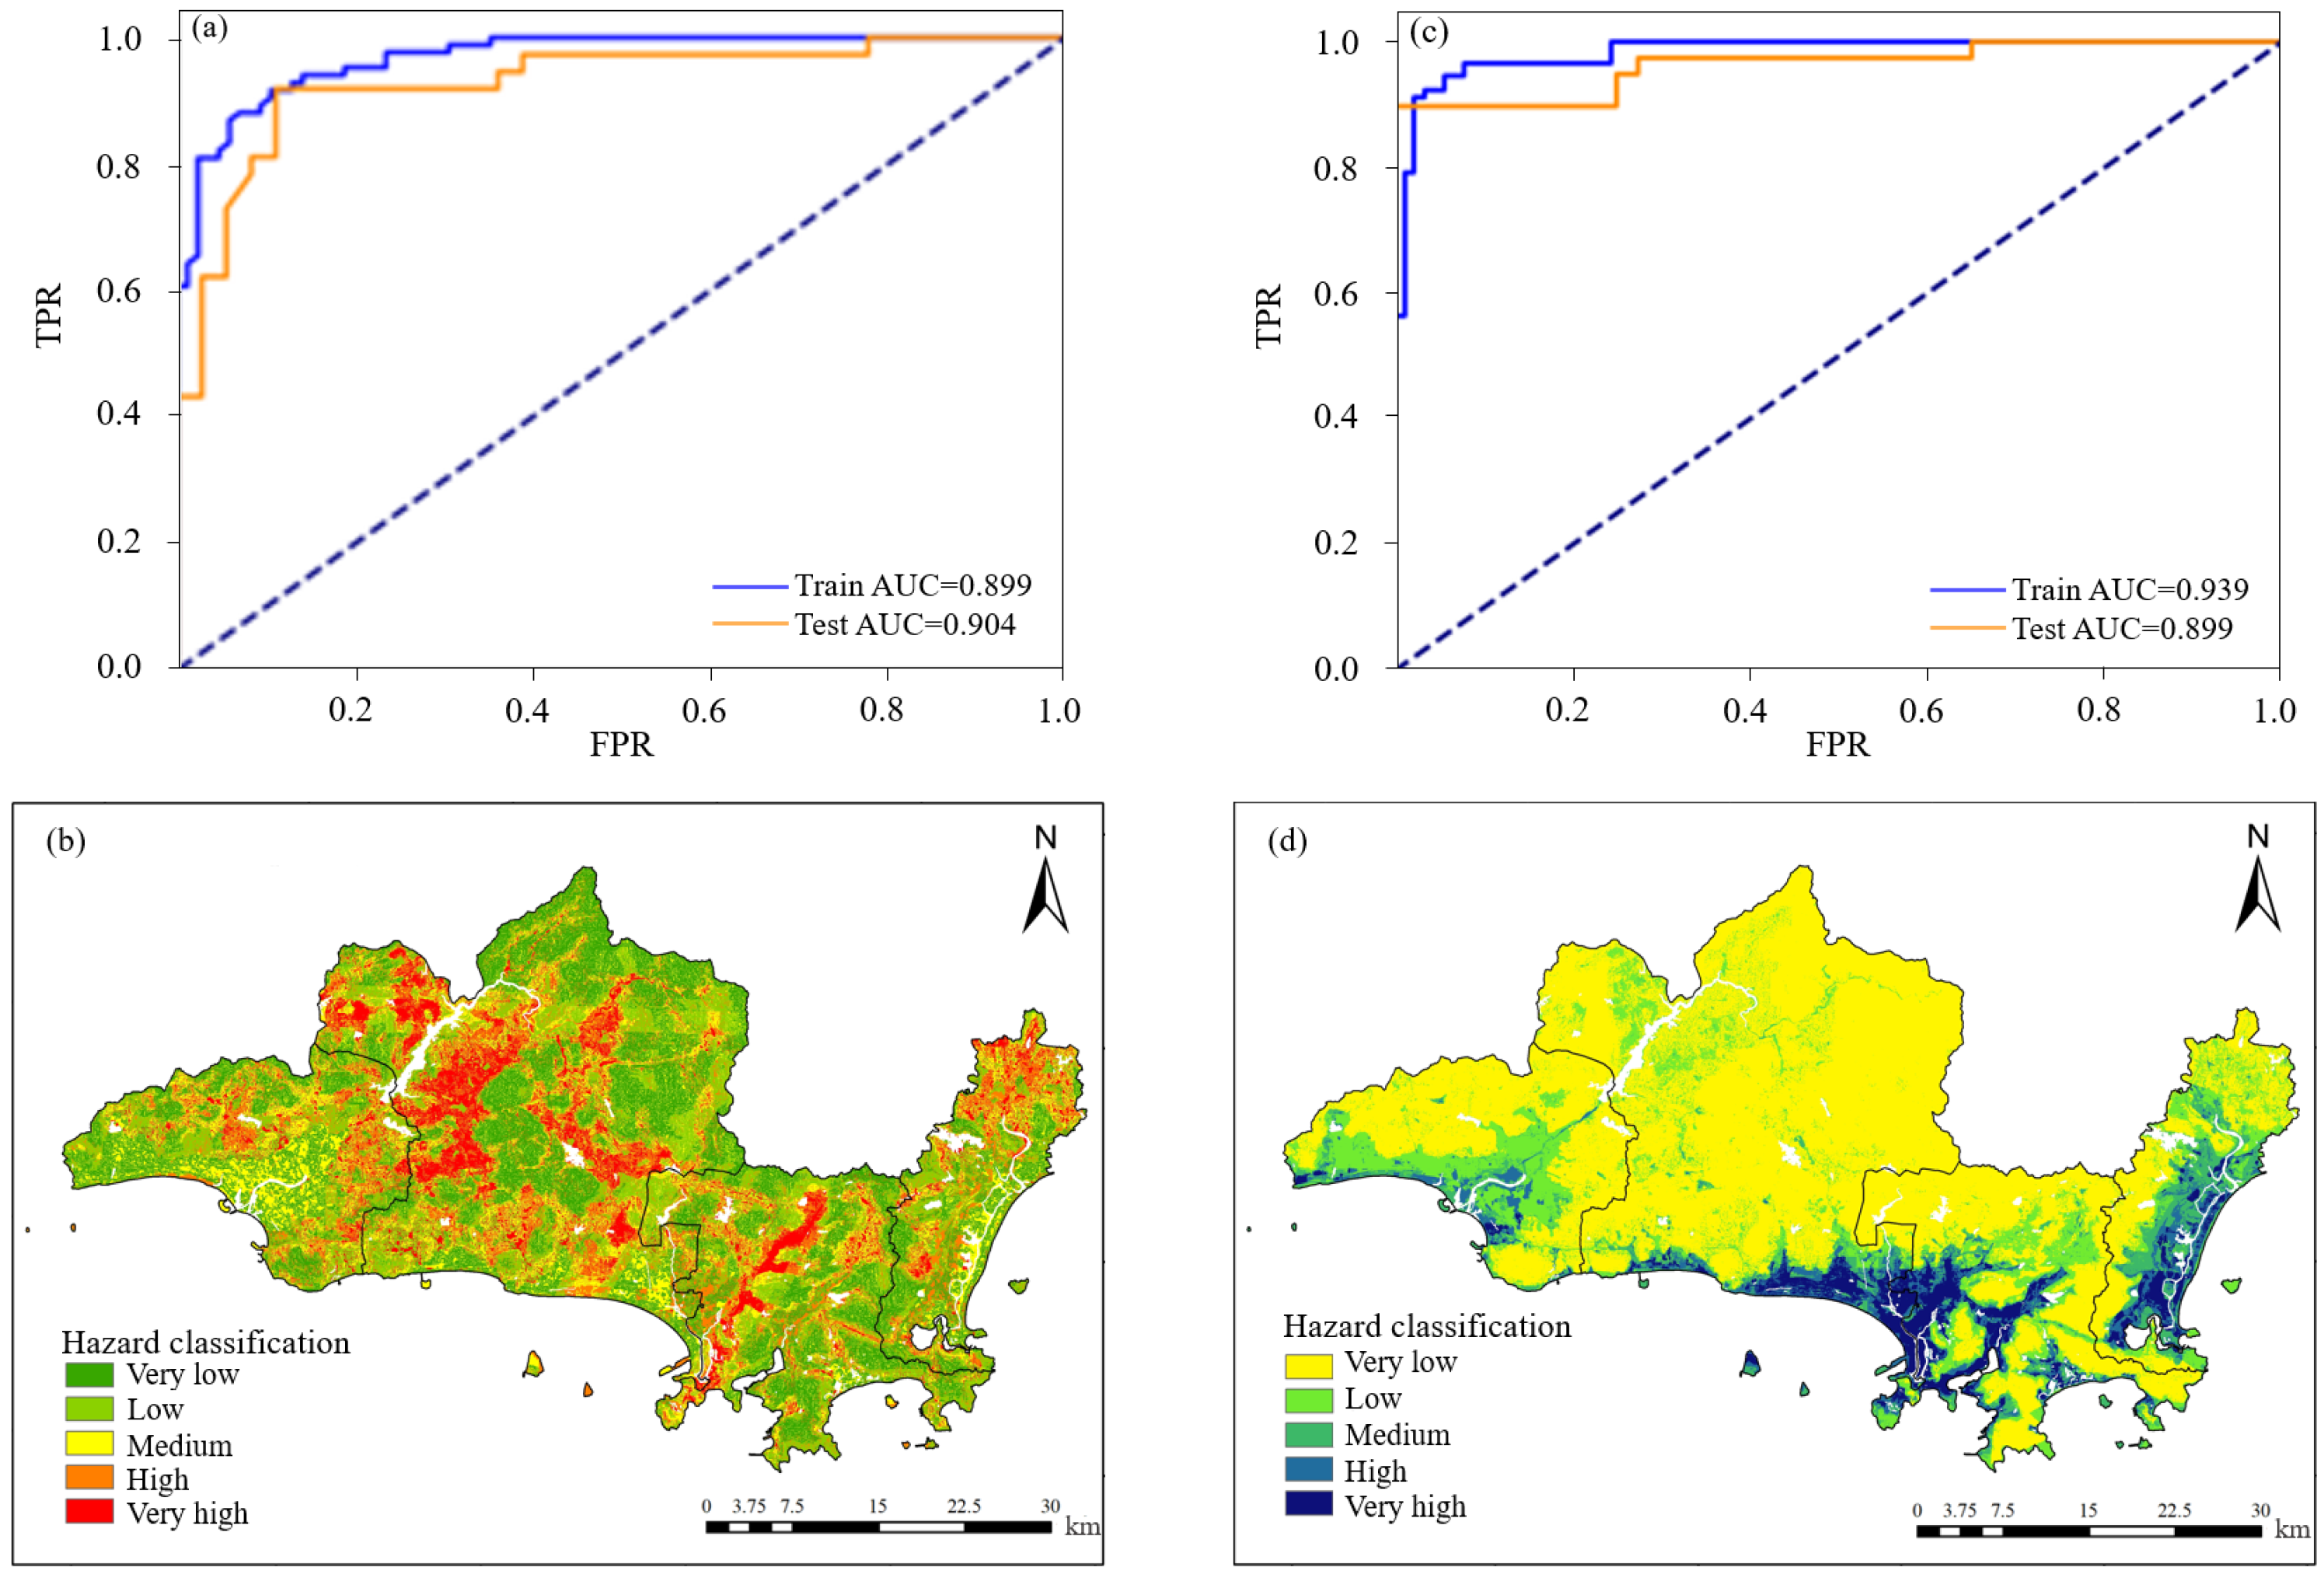
There are a total of 121 geological disaster sites caused by various natural and anthropogenic factors across the whole area of Sanya City, with collapses and landslides being the dominant types. The value of AUC of the geological disaster hazard assessment model constructed by us using the RF reached 0.904 (Figure 6a). The regions with high and extremely high geological disaster hazards are mainly distributed near the fault zones in Tianya District and Jiyang District, the northern hilly areas of Haitang District, and the junction of Yazhou District and Tianya District in Sanya City (Figure 6b). These areas account for approximately 12.63% of Sanya City’s total area and are mostly concentrated in the central part of Tianya District, where mountainous terrain is extensive, the density of geological disaster hidden danger points is high, and typhoons and rainstorms are likely to trigger geological disasters. The warning rainfall thresholds for collapses and landslides in these regions are relatively low, which makes the lives and property of local residents vulnerable to threats.

4.1.3. Flood Disasters

Sanya City is a region prone to frequent flood disasters, with an average annual rainfall of more than 1200 mm. The rainy season is concentrated from May to October, featuring distinct wet and dry seasons. Disturbed by tropical weather systems, sea–land breezes and other factors, short-duration and sudden heavy rainfall is the dominant trigger for flood disasters in Sanya City. According to statistics, 131 flood disaster events occurred in Sanya City from 2018 to 2022, most of which were distributed in the main urban area of the city. The AUC of the hazard assessment model constructed in the later stage reached 0.899 (Figure 6c). On the whole, the flood disaster hazard shows a gradual decreasing trend from the coastal areas to the inland regions. Areas with high and extremely high hazard are mainly distributed in the southern coastal zones of all districts in Sanya City, especially at the coastal junction of Jiyang District and Tianya District (Figure 6d). These areas account for approximately 6.24% of Sanya’s total area. As coastal regions with relatively low terrain, they have a high level of urbanization, a dense population, and concentrated commercial and residential buildings. The density of typhoon paths ranks at the first level among urban areas, and the precipitation during the flood season remains high for many years, resulting in severe impacts from typhoon disasters.

4.2. Geological-Flood Compound Disasters

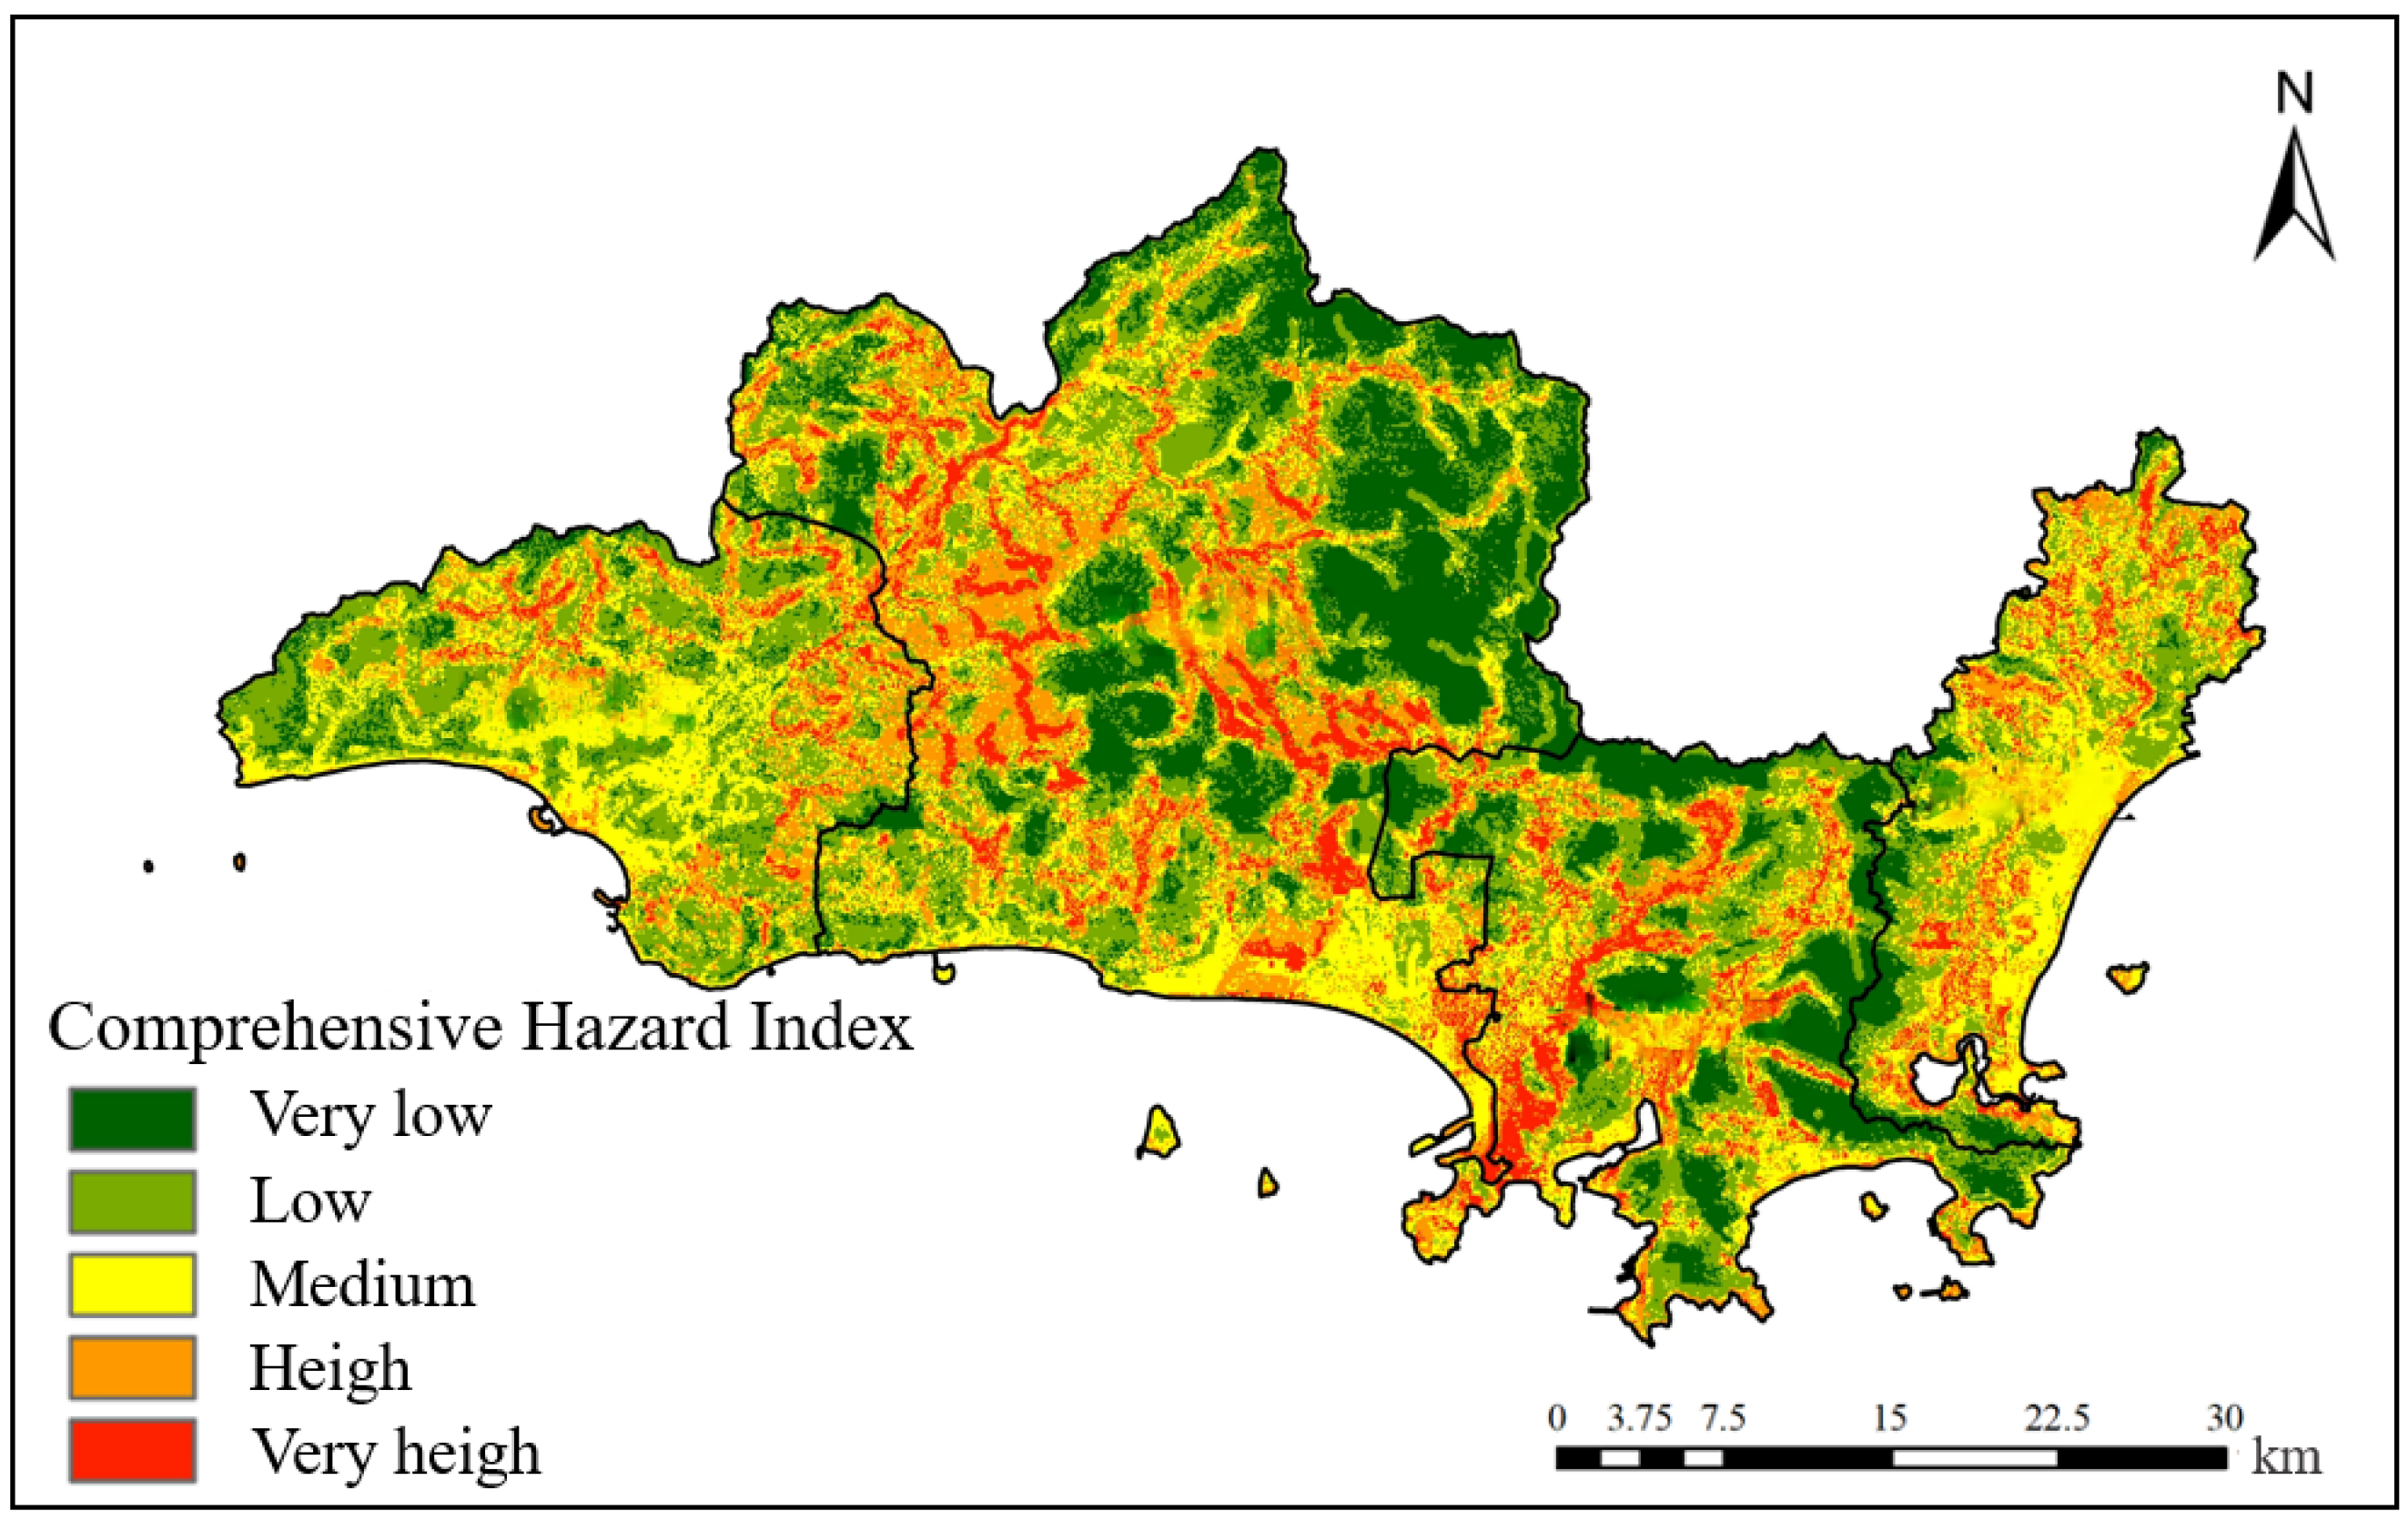
Based on the hazard assessment results of geological and flood disasters, we adjusted the disaster hazard intensity using a multi-hazard coupling incentive model and performed superposition analysis to generate the hazard zoning map of geological-flood compound disasters in Sanya City. The proportion of hazard levels as well as the characteristics of their spatial distribution are generally consistent with the actual situation. From the perspective of the proportion of hazard levels of individual hazards and the comprehensive hazard levels formed by their compounding, there exists a positive incentive relationship among various single hazards within the grid cells, which leads to an increase in the proportion of low, medium, and high comprehensive hazard levels, while the proportion of low-hazard levels decreases significantly. According to the proportion of area occupied by different hazard levels in Sanya City, the low, moderate and high hazard zones dominate the study area, occupying 30.64%, 22.29% and 20.44% of the total area, while very low and very high hazard zones account for 18.23% and 8.41%, respectively. The overall hazard grade distribution follows an olive-shaped normal pattern (Figure 7). After coupling, the hazard level in Jiyang District of Sanya City, especially in its southern coastal area, has increased. The main reason is that this area is a major concentration zone of construction land in Sanya City, with intensive human engineering activities and a high degree of surface modification.

4.3. Suitability Assessment of Emergency Shelter Sites

A total of 293 candidate emergency shelter sites were initially collected in the study area, providing an effective shelter area of 3.2615 million square meters. On this basis, we need to screen these candidate sites from the perspective of suitability to meet the shelter design specifications and refuge requirements. Combined with the data availability and actual conditions of the entire Sanya City, this study conducts a suitability assessment of these candidate sites using accessibility and safety of the shelters as the evaluation indicators.

4.3.1. Accessibility Assessment

Based on the population distribution data of Sanya City, we evaluated the accessibility of emergency shelter sites in the study area by adopting a multi-stage evacuation time approach. Taking the entrances and exits of emergency shelter sites as the starting points, we conducted network analysis of the OD cost matrix along evacuation routes. Starting from both the emergency shelter sites and residents’ demand points, respectively, we adopted the G2SFCA to obtain the accessibility values of emergency shelter sites. Spatial interpolation was performed on the standardized accessibility values by means of the inverse distance weighting (IDW) method [74] to generate the accessibility evaluation map of emergency shelter sites, which was applied to the accessibility analysis of emergency shelter sites in the study area.
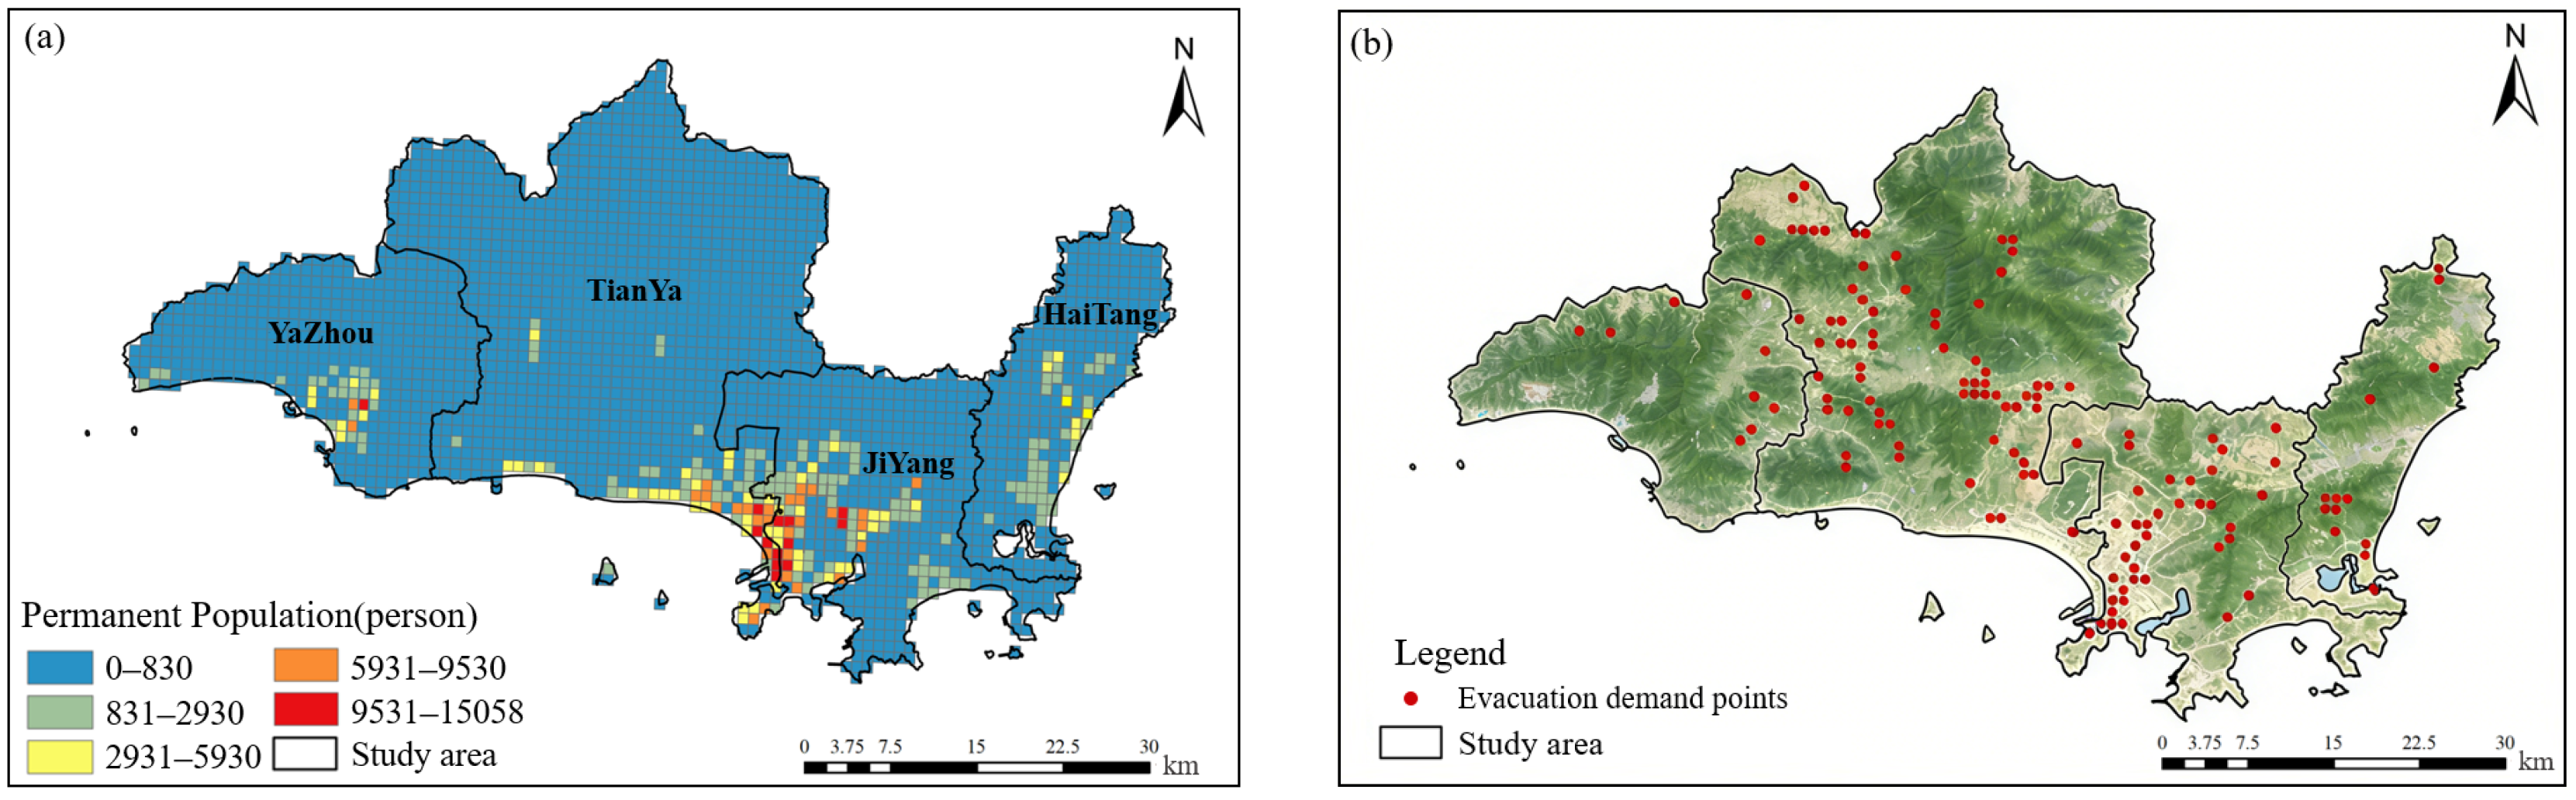
The evacuation of emergency shelter sites should fully consider timeliness and be located as close to densely populated areas as possible. The population distribution data of Sanya City collected in this study are 30-arcsecond geographic grid data. The point element data of population distribution were obtained by using the Feature to Point tool in ArcGIS 10.5 (Figure 8a). On this basis, considering the hazard degree of geological-flood compound disasters in the study area, this study identified residents living in areas with high and extremely high hazards as people with shelter needs. A total of 135 shelter demand points were delineated in the whole area, covering a population of 13.91 × 10⁴ (Figure 8b).
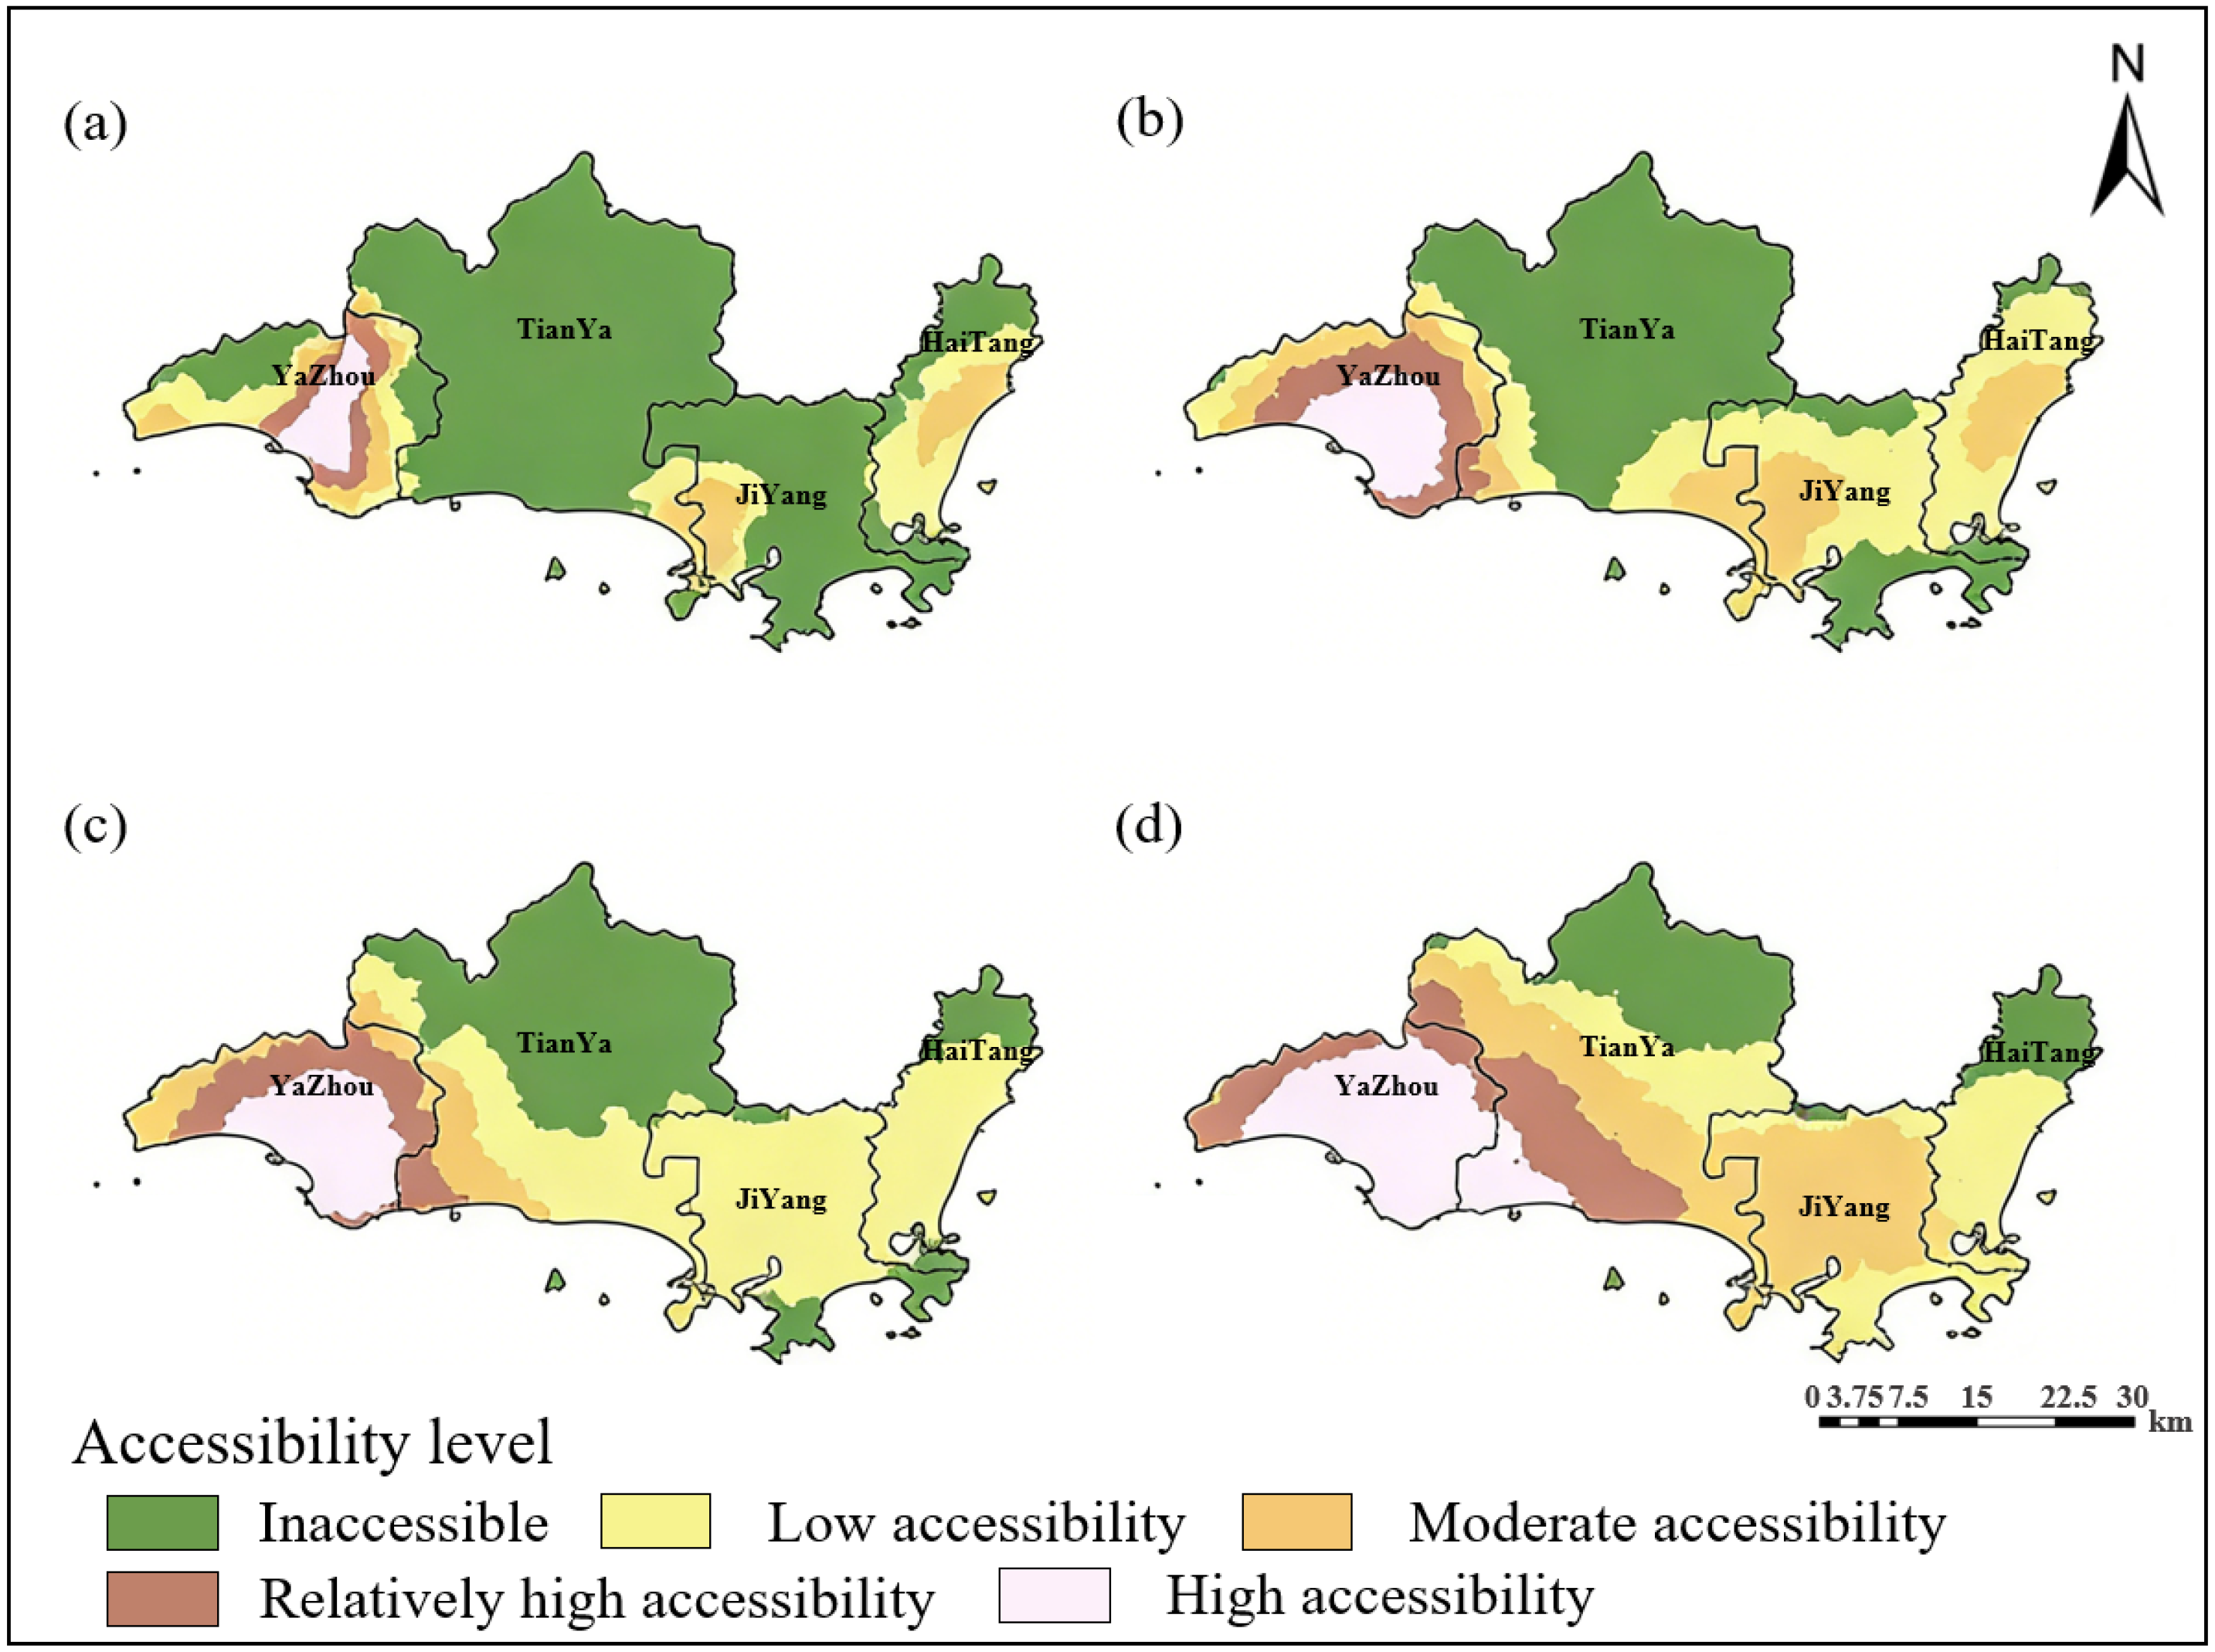
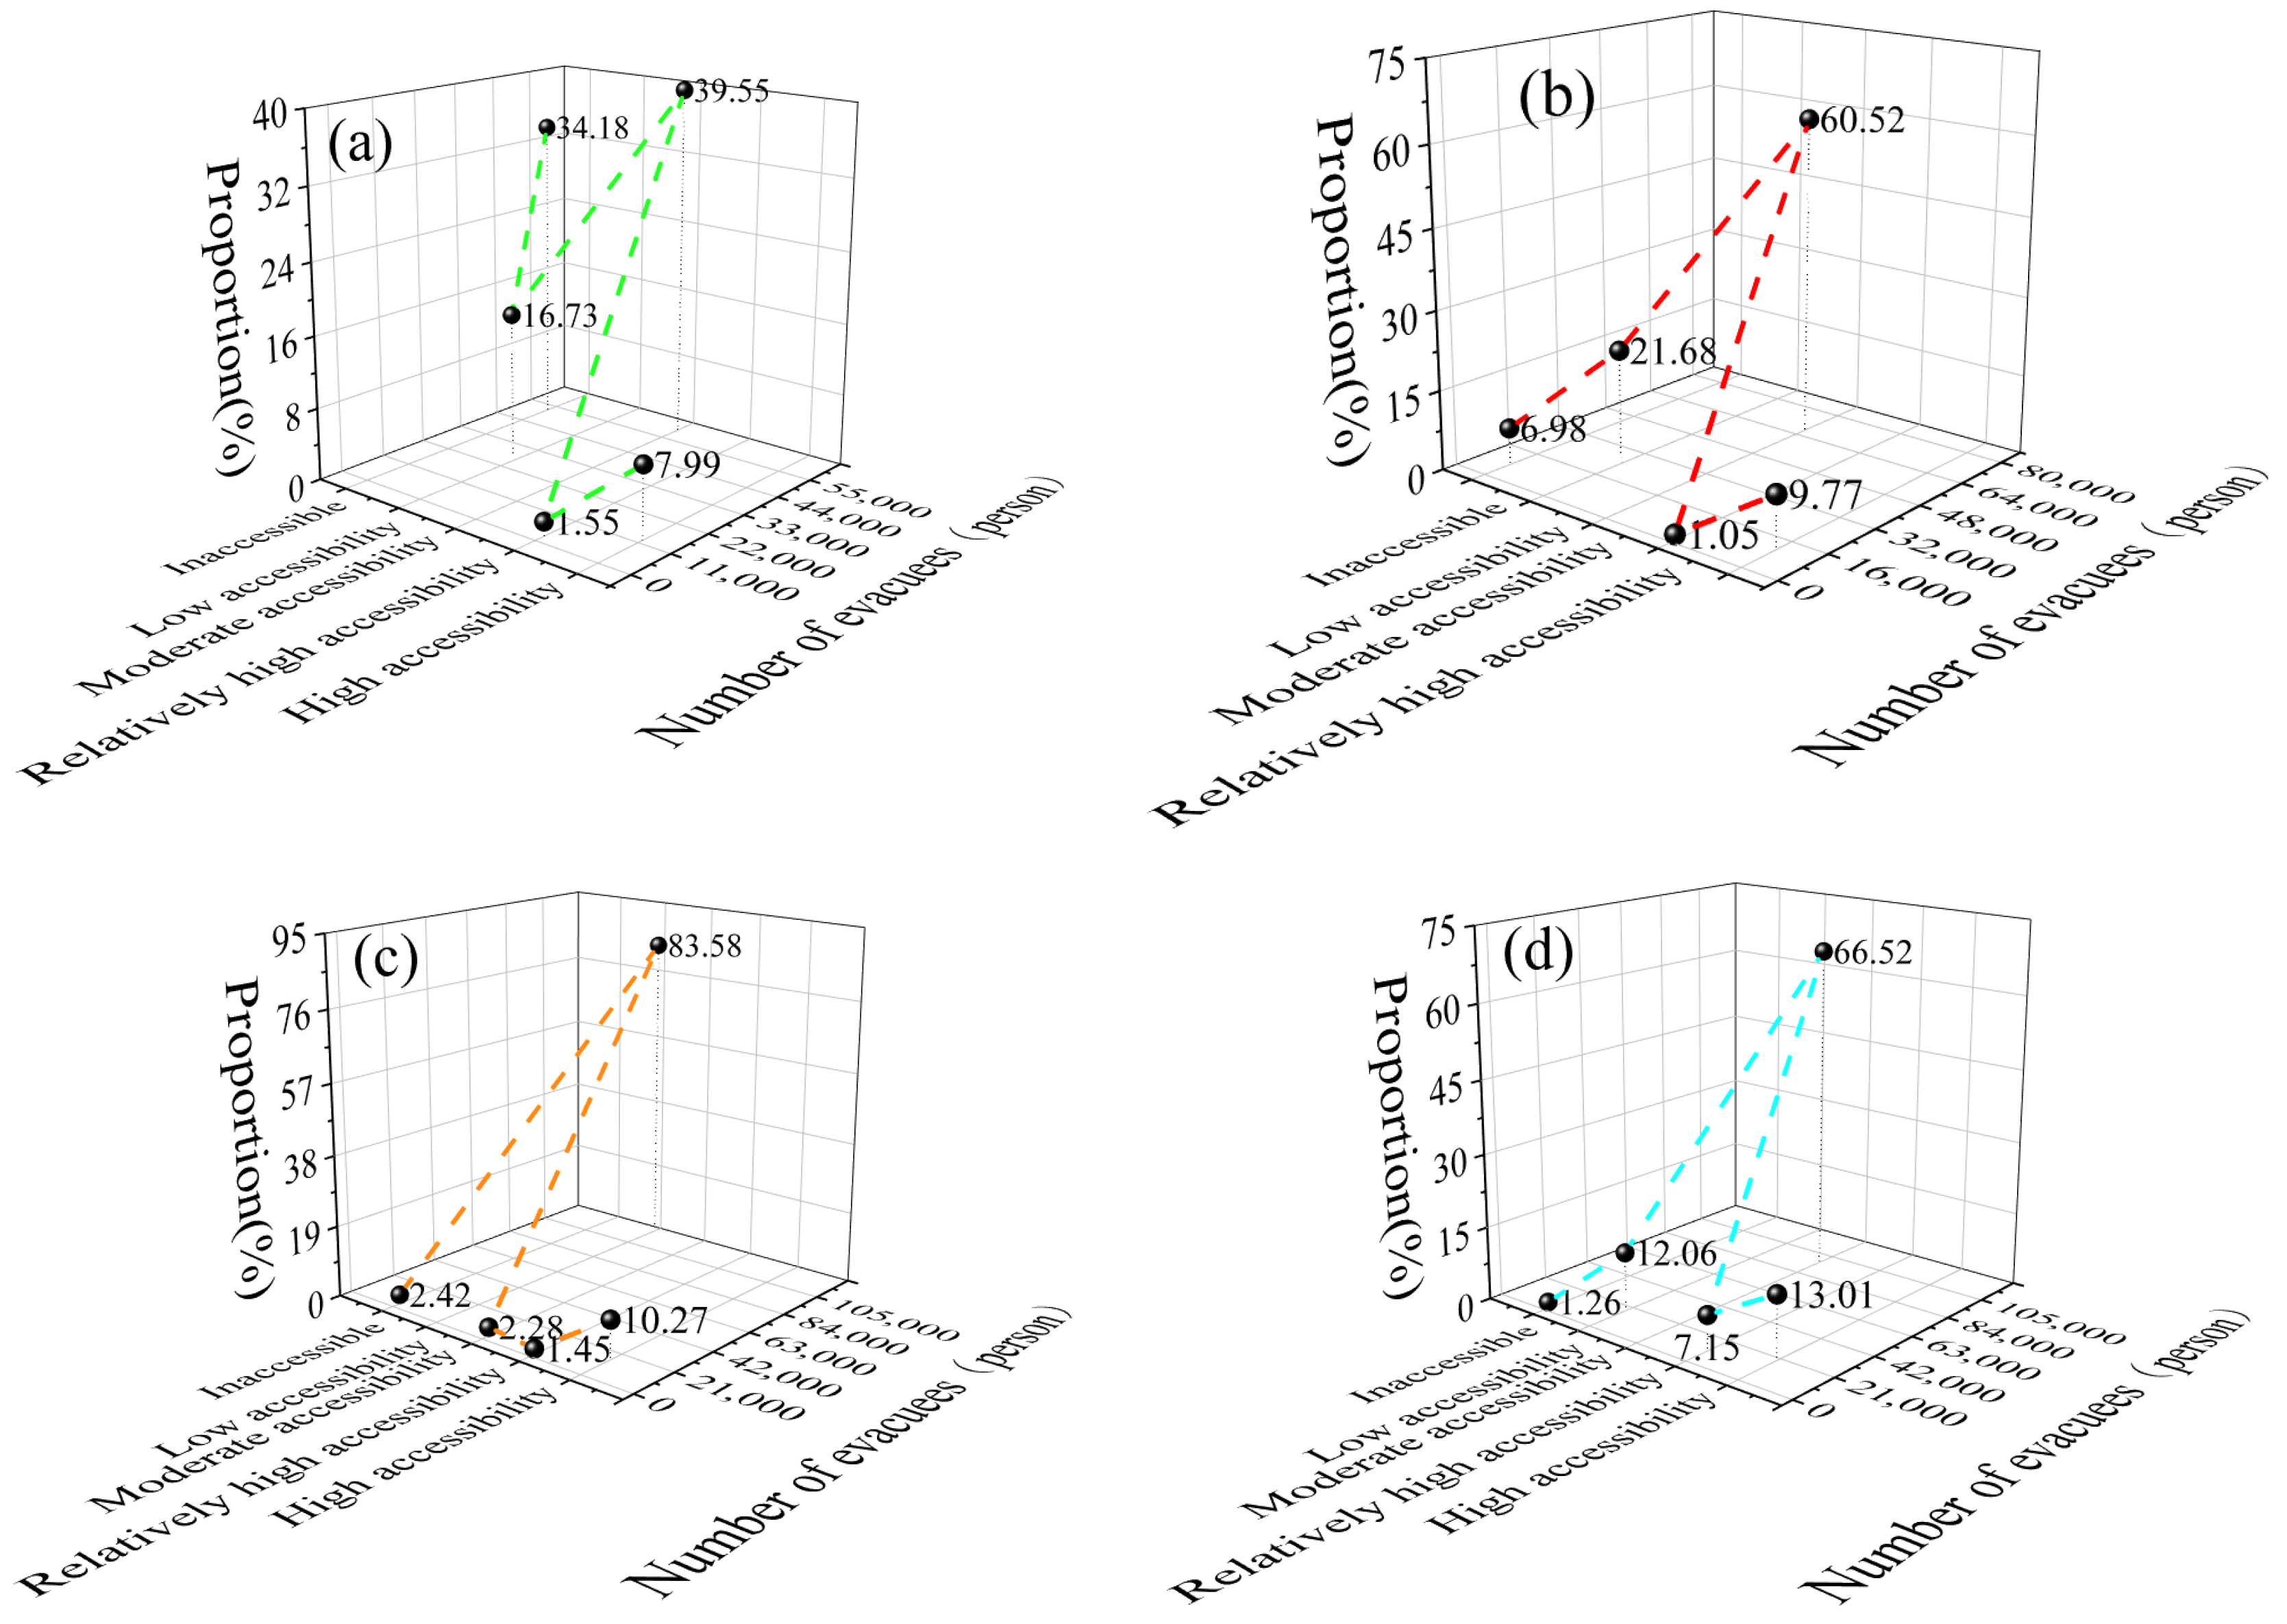
Combined with the spatial distribution of emergency shelter sites and shelter demand points in Sanya City, this study set the residents’ vehicle driving speed at a standard of 20 km/h, and defined the evacuation time thresholds of 0.5 h, 1 h, 1.5 h, and 2 h as the shelter search thresholds after the occurrence of disasters. The gradient time thresholds are tailored to Sanya’s strip coastal mountain terrain and uneven population distribution: 0.5 h for rapid evacuation of coastal dense-population downtown, 1 h for a conventional urban comprehensive evacuation benchmark, 1.5 h and 2 h for remote mountainous rural areas with underdeveloped roads and scattered residents, to quantify the progressive coverage difference in emergency shelter sites from urban core to mountain periphery. The accessibility of Sanya City under different evacuation time scenarios was analyzed and compared. The spatial interpolation results obtained by the inverse distance weighting method for different evacuation times were reclassified at the same interval, and the results were divided into five levels: inaccessible, low accessibility, moderate accessibility, relatively high accessibility, and high accessibility. The population coverage under different evacuation time scenarios is shown in Figure 9.
According to Figure 9 and Figure 10, with the increase in evacuation time, the population with no access to emergency shelter sites in Sanya City gradually decreases, and the proportion of accessible areas in terms of spatial distribution varies among different districts.
i.
When the evacuation time is set to 0.5 h, most areas in Sanya City are inaccessible. The accessible areas of emergency shelter sites are primarily concentrated in regions with dense distributions of candidate emergency shelter sites, namely Haitang District and Yazhou District of Sanya City, with the accessible population accounting for 49.09% of the total population.
ii.
When the evacuation time is further extended to 1 h, the accessible range expands significantly, with the accessible population accounting for 71.34% of the total population. Correspondingly, the proportion of accessible areas in Jiyang District also increases notably, indicating a clear improvement in accessibility compared with the 0.5 h scenario.
iii.
As the evacuation time is further extended to 1.5 h, most areas across Sanya City become accessible, while the area of moderately accessible regions in Haitang District decreases. The primary reason is that as the evacuation time extends, the number of people capable of reaching adjacent emergency shelter sites within the specified time period increases. However, restricted by the effective shelter area of emergency shelter sites in this district, the supply-demand ratio of shelter resources declines, thereby leading to a reduction in the area of accessible regions.
iv.
When the evacuation time is extended to 2 h, the accessibility of emergency shelter sites in Sanya City reaches a relatively high level: the total number of people without access to emergency shelter sites is 1752, who are mainly distributed in the northern areas of Tianya District and Haitang District where the population density is relatively low. The accessible population accounts for 98.74% of the total population, but the majority are concentrated in moderately accessible regions. Specifically, regions with relatively high and high accessibility are mainly concentrated in Yazhou District and the southwestern part of Tianya District, with the accessibility level gradually decreasing from west to east.
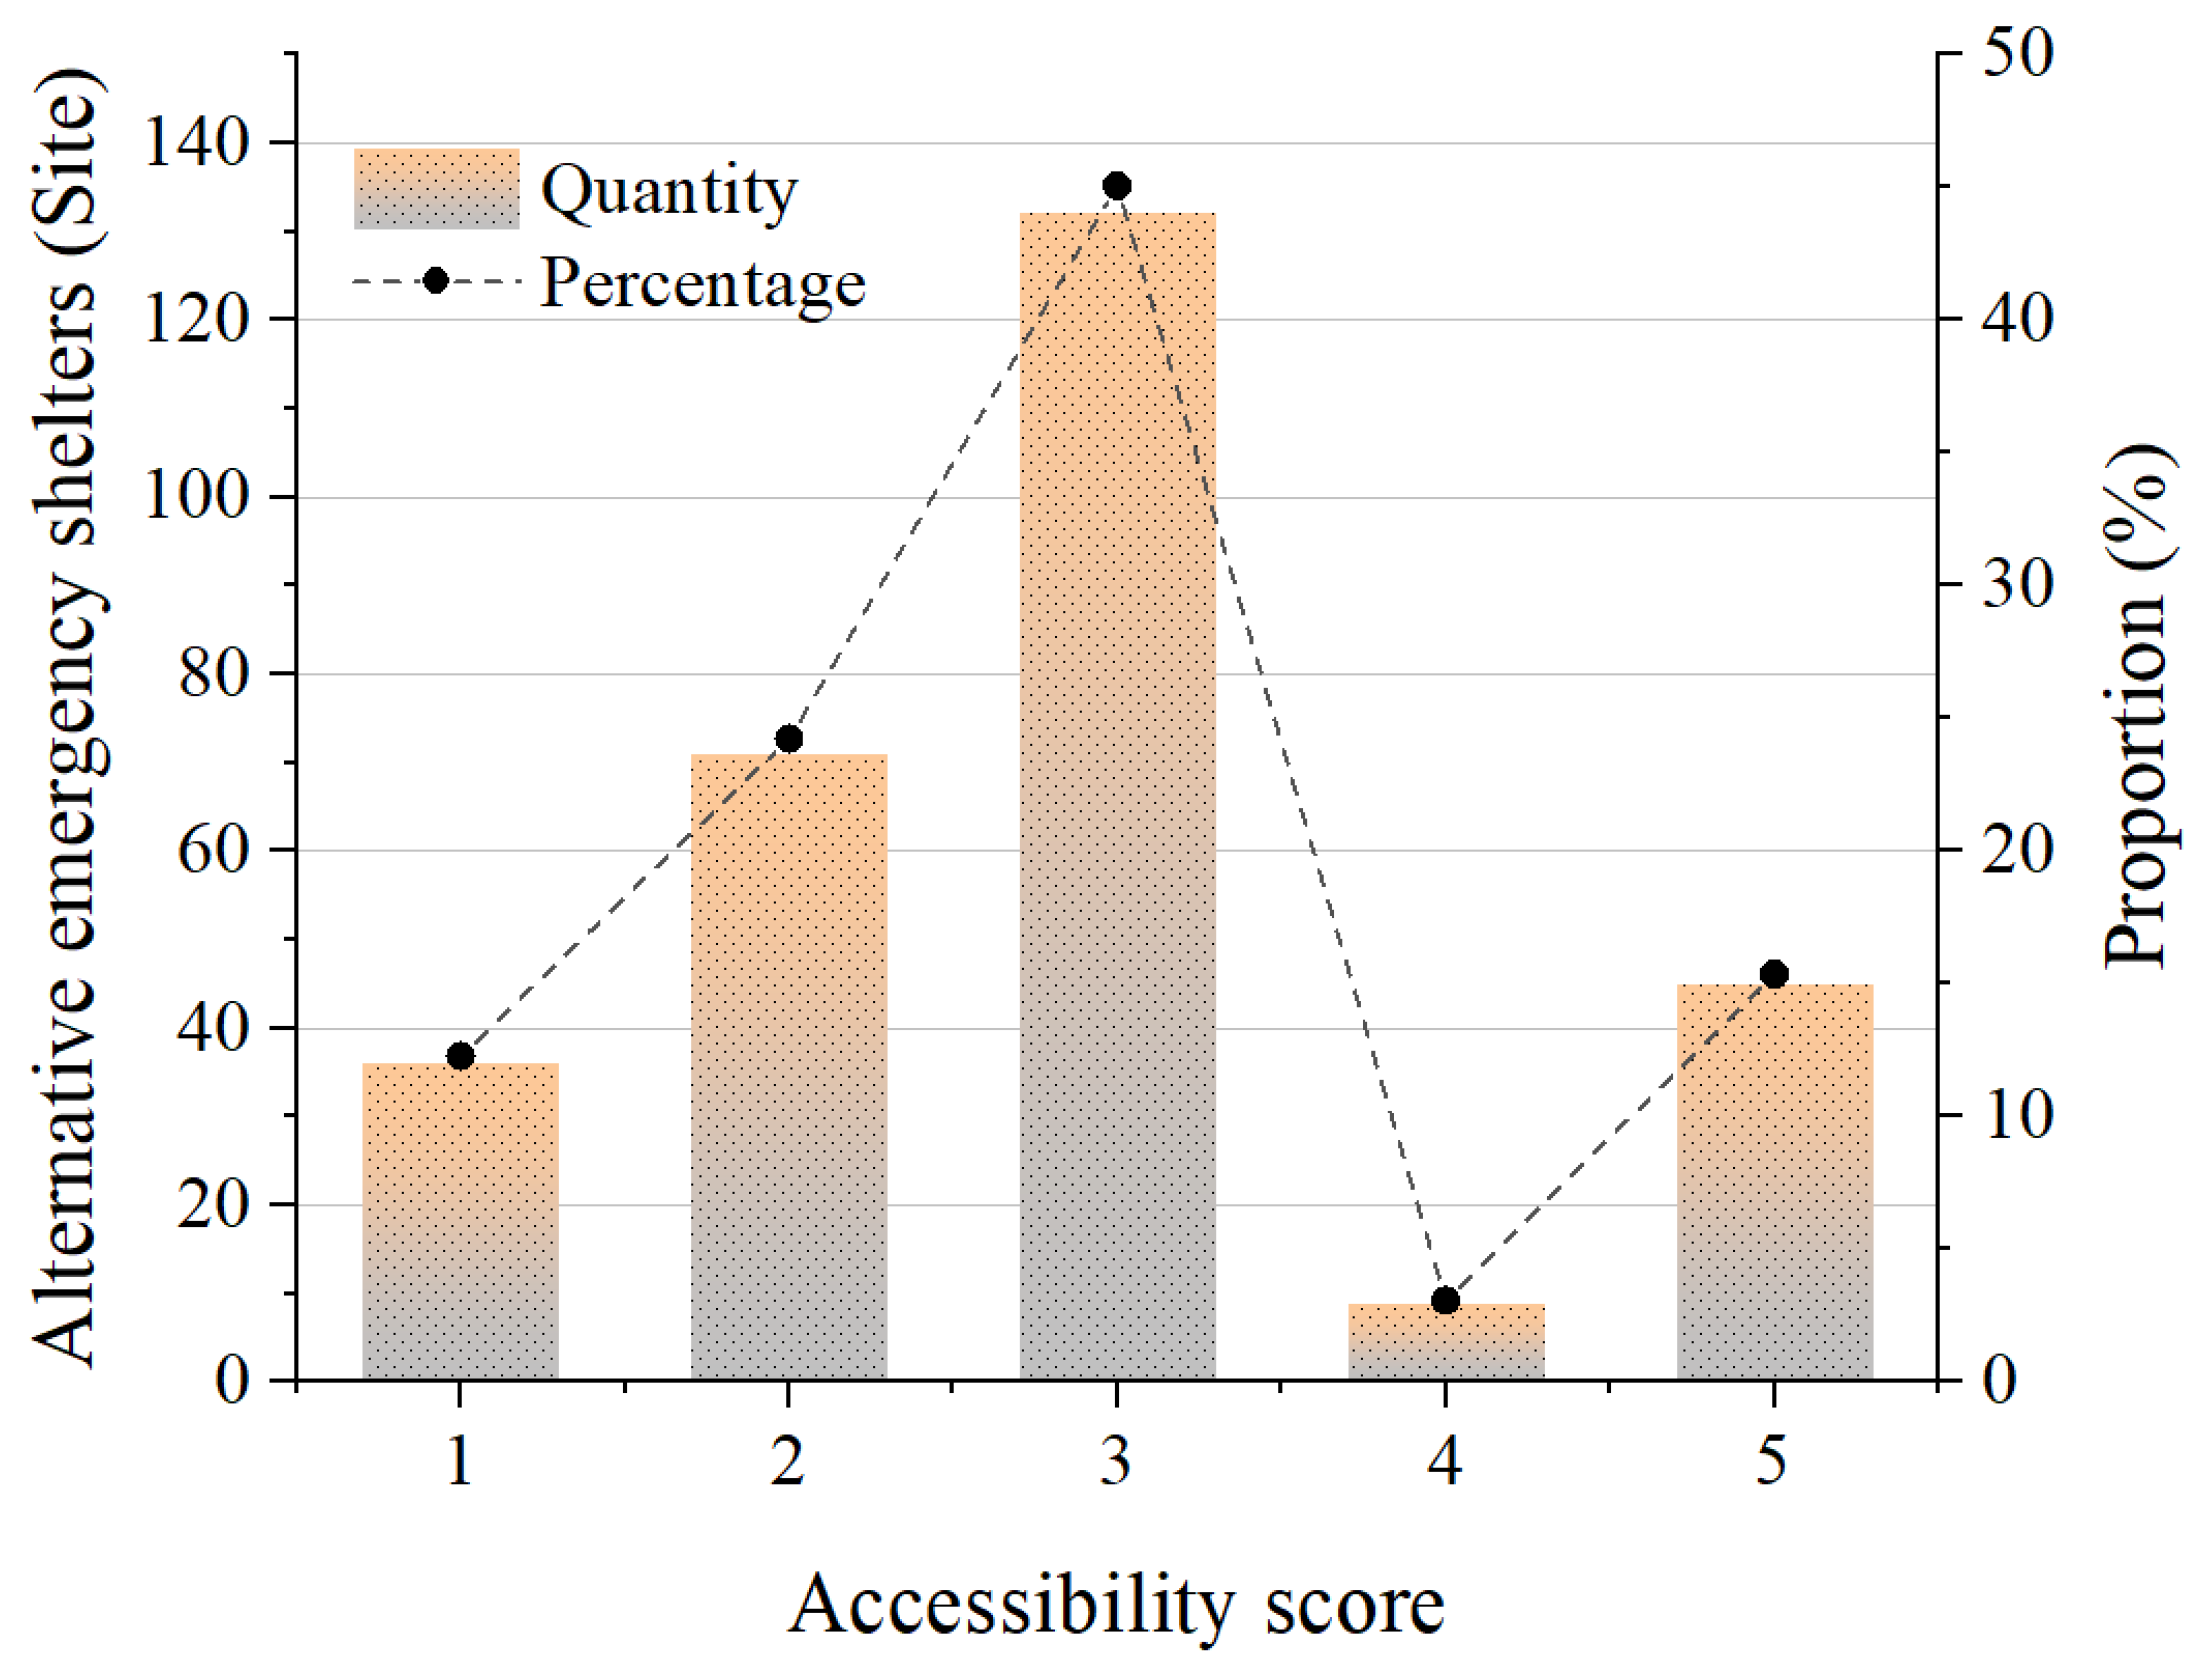
Considering the changes in accessibility and the proportion of population coverage under different evacuation time periods comprehensively, this study selected 1 h as the population evacuation time for refuge in Sanya City, and assigned scores to the accessibility levels of candidate emergency shelter sites in the study area. Specifically, the scores corresponding to “inaccessible”, “low accessibility”, “moderate accessibility”, “relatively high accessibility” and “high accessibility” are “1”, “2”, “3”, “4” and “5” respectively, so as to facilitate the subsequent suitability assessment of emergency shelter sites (Figure 11).

4.3.2. Safety Assessment

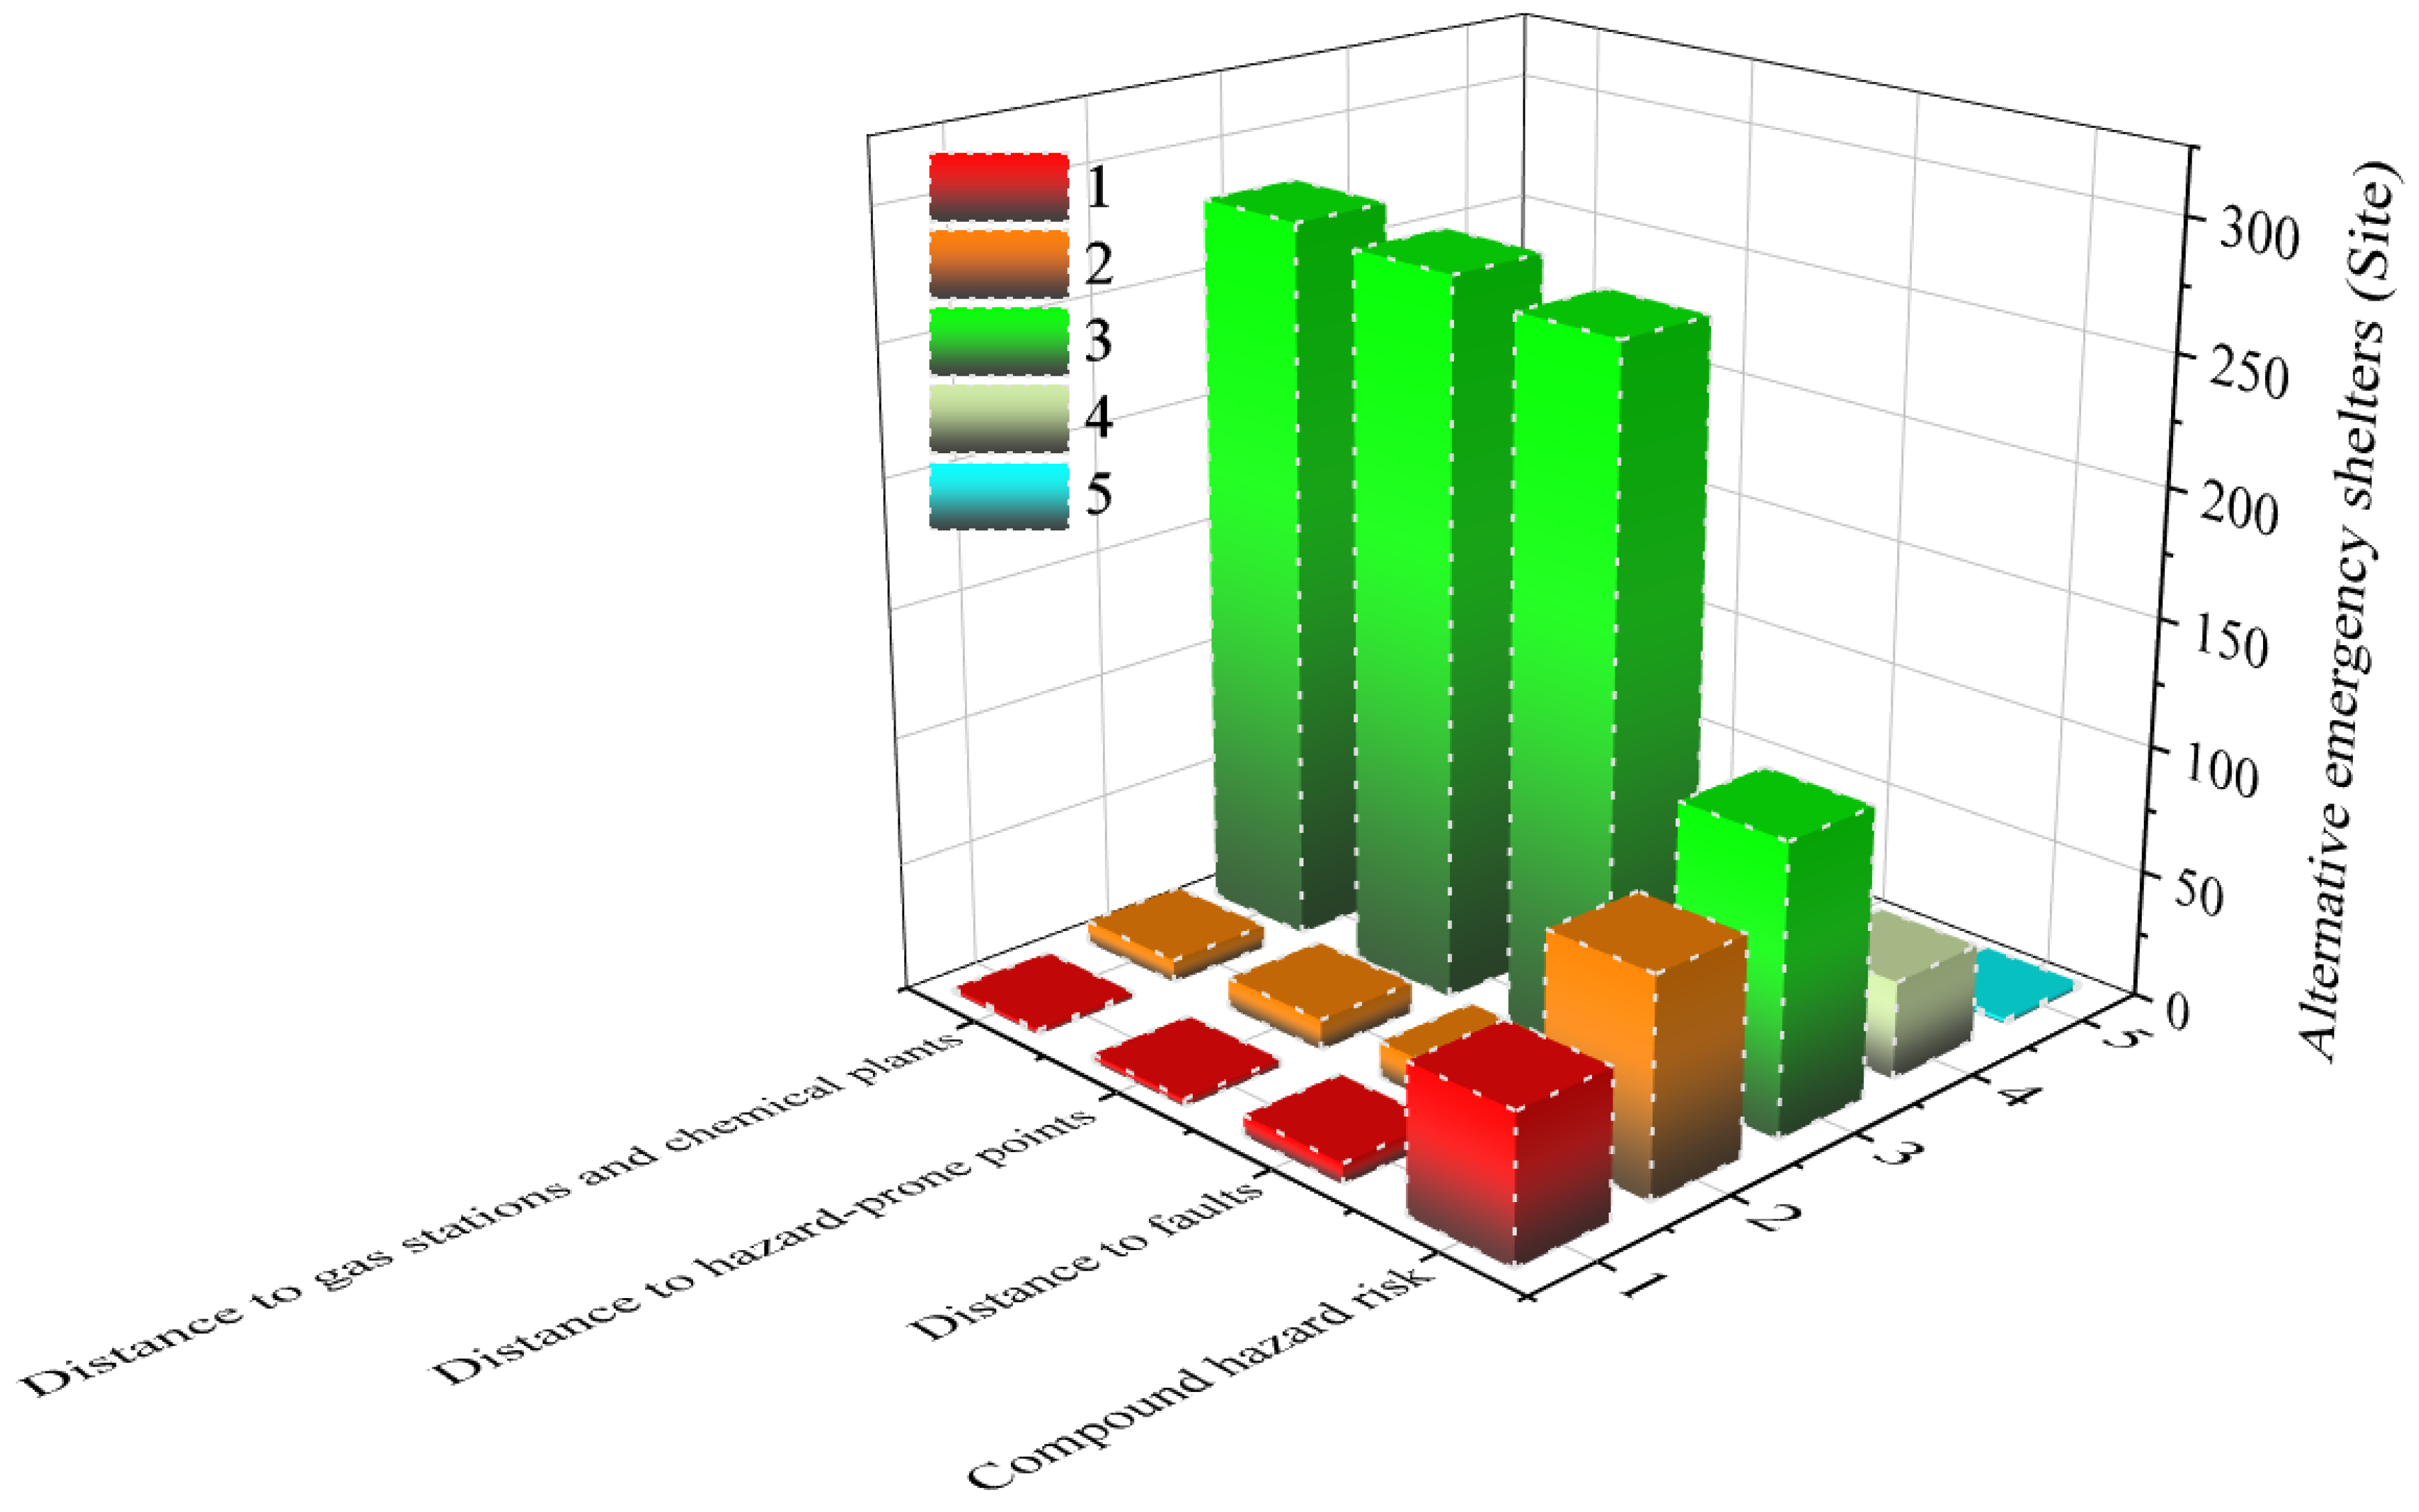
After conducting a preliminary assessment of the accessibility of candidate emergency shelter sites under the scenario of geological-flood disasters in Sanya City, we need to further evaluate their safety to meet the design specifications and refuge requirements of emergency shelter sites. Combined with the actual situation of Sanya City, this study mainly screened their safety from four aspects: the comprehensive hazard level of geological-flood compound disasters, distance to faults, distance to hazard sites, and distance to gas stations and chemical plants. The spatial distances from candidate emergency shelter sites to surrounding faults, disaster sites, gas stations and chemical plants were obtained respectively by means of GIS spatial analysis technology. On the basis of the current relevant standards for emergency shelter site planning, combined with the safety evaluation principles in Table 4, this study assigned scores to the safety of candidate emergency shelter sites according to the four evaluation indicators (Figure 12). The results show that the candidate emergency shelter sites in Sanya City are mainly concentrated in the areas classified as the third grade among the four types of indicators, indicating that the spatial locations of the initially selected candidate emergency shelter sites are mostly in safe zones. To ensure the safety of emergency shelter sites, follow-up research can prioritize the candidate sites within the third-grade range and exclude those falling into the first and second hazard grades.

4.3.3. Suitability Assessment

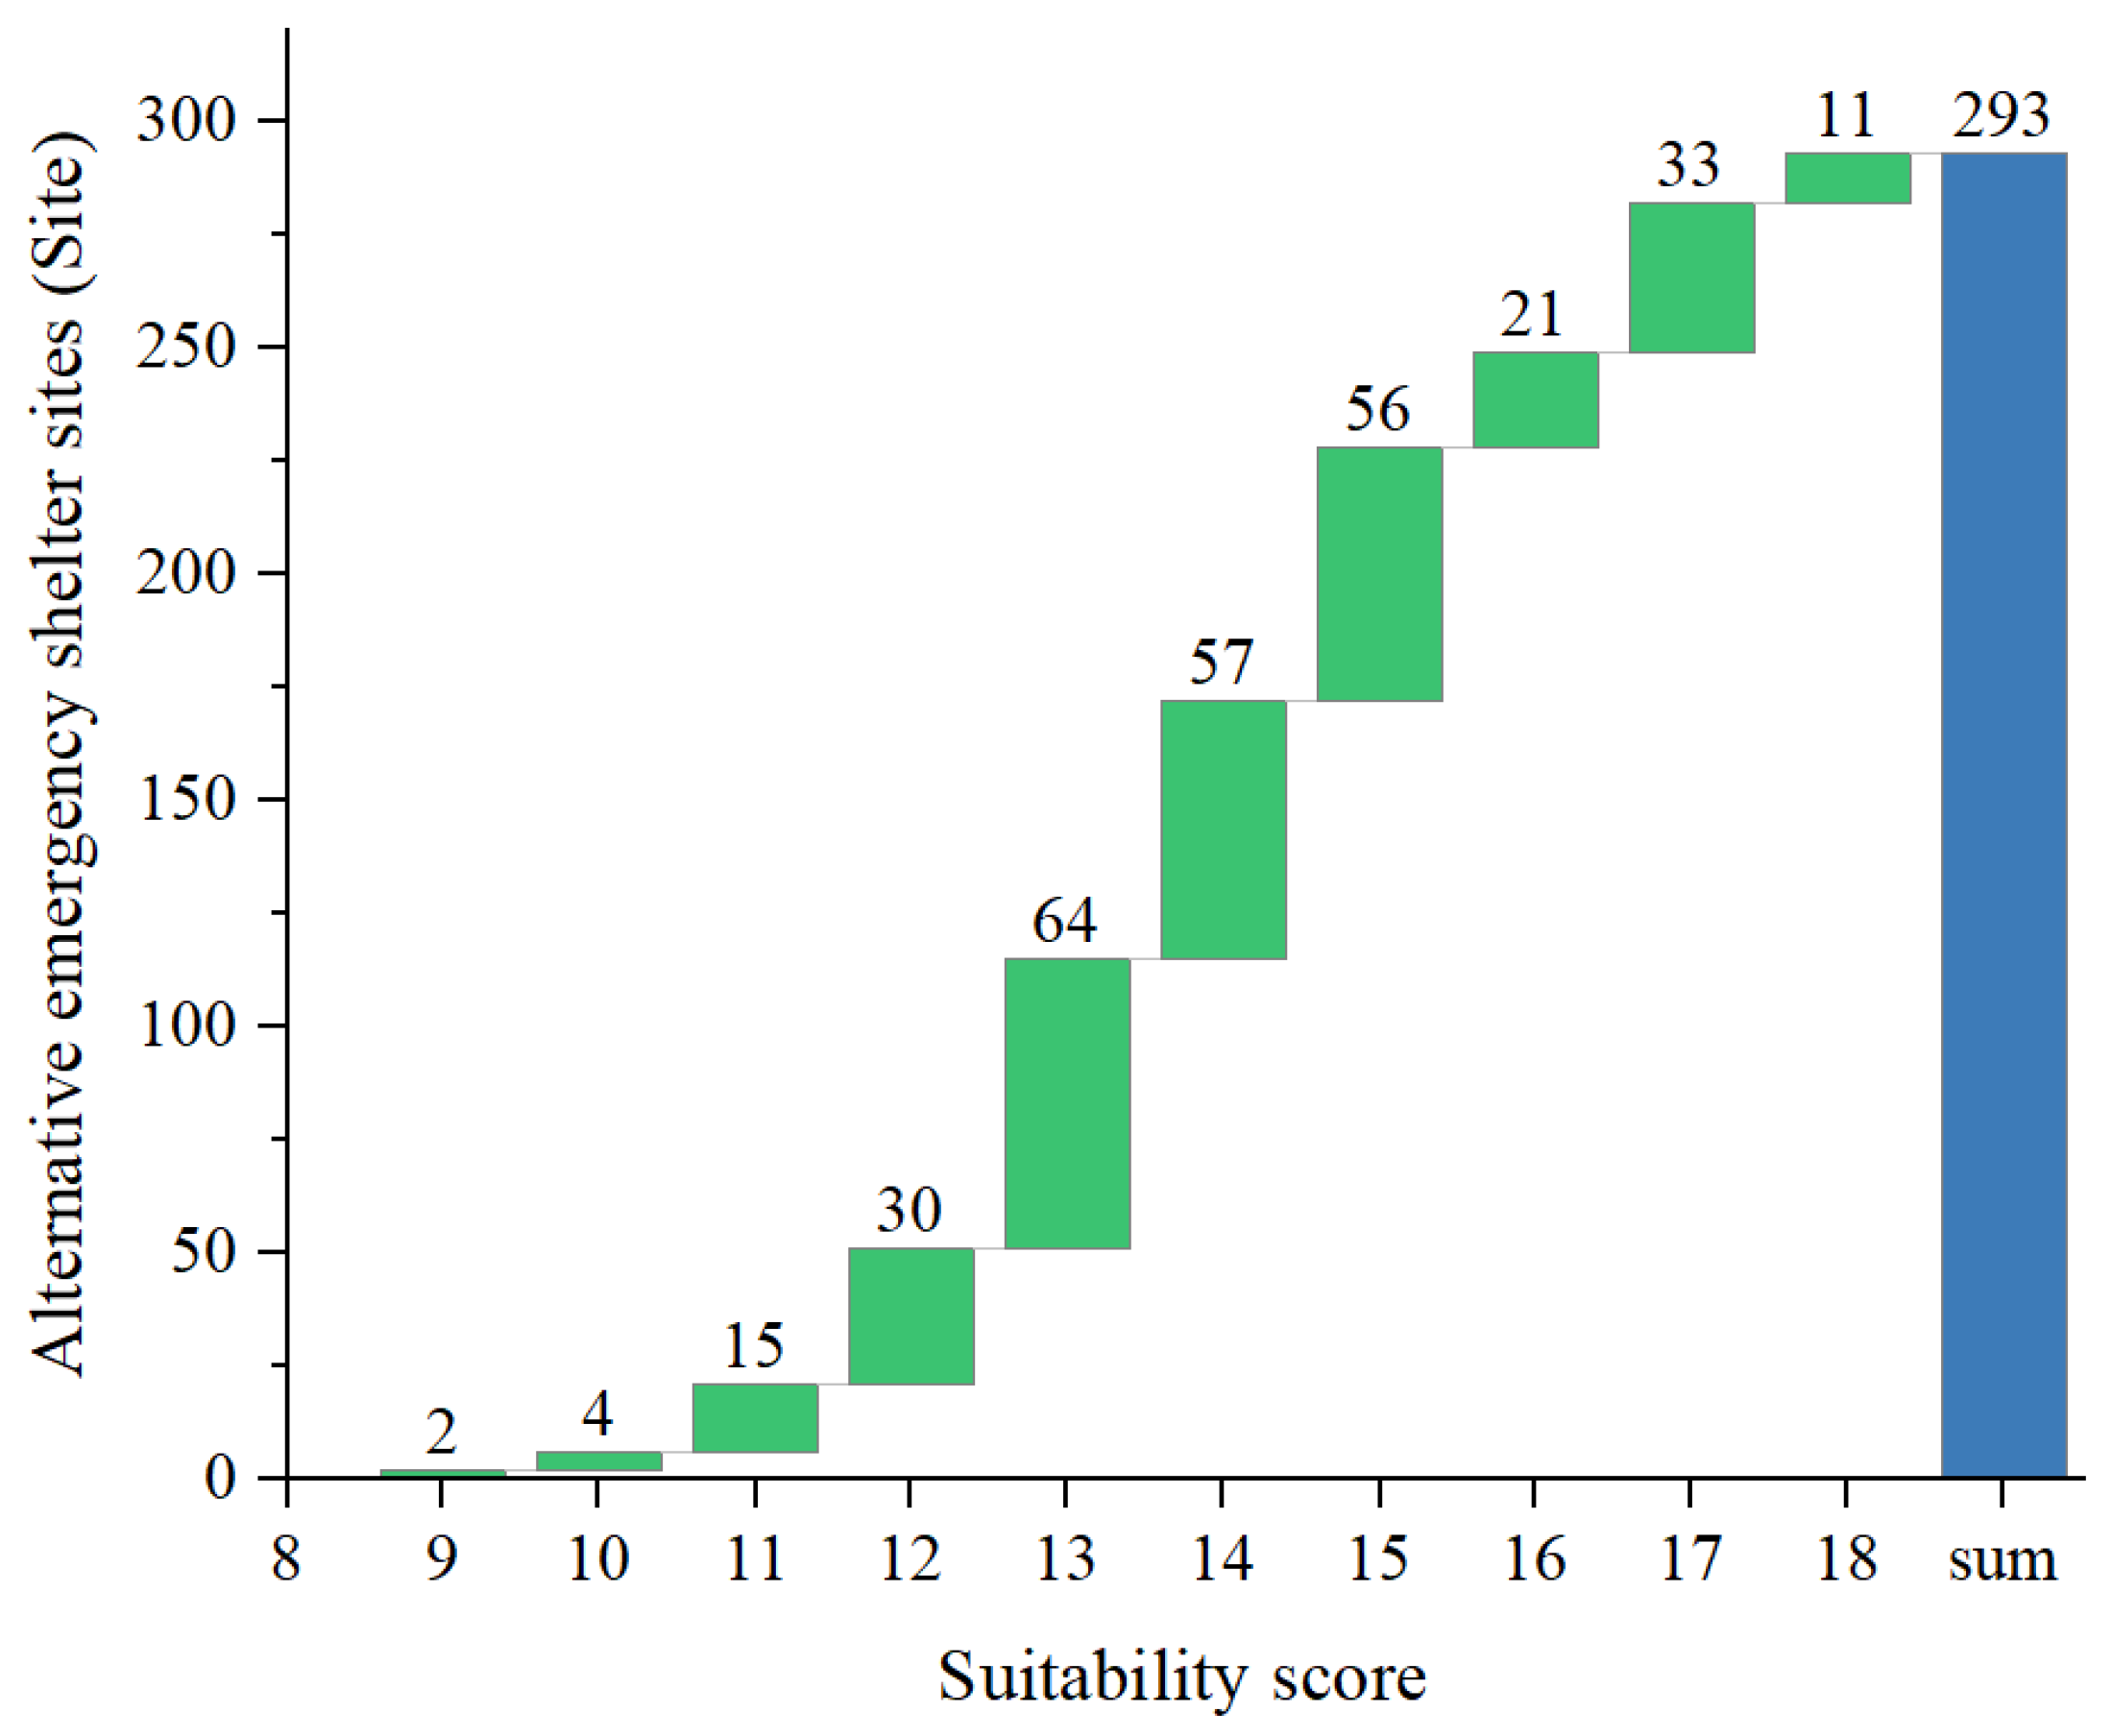
In the early stage, this study carried out relevant research on the accessibility and safety of candidate emergency shelter sites in Sanya City, respectively, and conducted score assessment for them. Based on these results, the comprehensive suitability of candidate emergency shelter sites was calibrated by means of cumulative scores, namely, the higher the cumulative score, the higher the suitability of the candidate emergency shelter sites. Combined with the current situation of refuge demand under geological-flood compound disasters and the results of comprehensive suitability assessment in Sanya City, this study selected candidate sites with a suitability score of no less than 12 as the sample set for the construction of the optimization model in the later stage. According to Figure 13, there are 21 candidate sites with relatively low suitability scores. For instance, the Yucai Nashou Primary School and Gaofeng Junior High School are located in areas with low accessibility, high risk of compound disasters, and close proximity to surrounding faults in the study area, making them unsuitable for the site selection of emergency shelter sites. Starting from the total of 293 initial candidate shelters, this study excluded these 21 poorly suited candidate sites in full and selected 272 candidate emergency shelter sites with high suitability for geological-flood compound disasters, which will be applied to the layout optimization of emergency shelter sites in the later stage.

4.4. Layout Optimization of Emergency Shelter Sites

In prior research, a total of 272 alternative emergency shelter sites were screened out for the geological-flood compound disaster scenario in Sanya City, with a total accommodation capacity of 105.55 × 10⁴ refugees. Secondly, the population distribution grid units located in areas above the high-hazard level of geological-flood disasters were designated as refuge units, totaling 135 units, and the number of people in need of refuge reached 13.91 × 10⁴. Meanwhile, the minimum evacuation time from each demand point to the candidate shelter sites was calculated. Based on this, the preparation of basic data required by the emergency shelter sites layout optimization model under the scenario of geological-flood compound disasters has been completed.
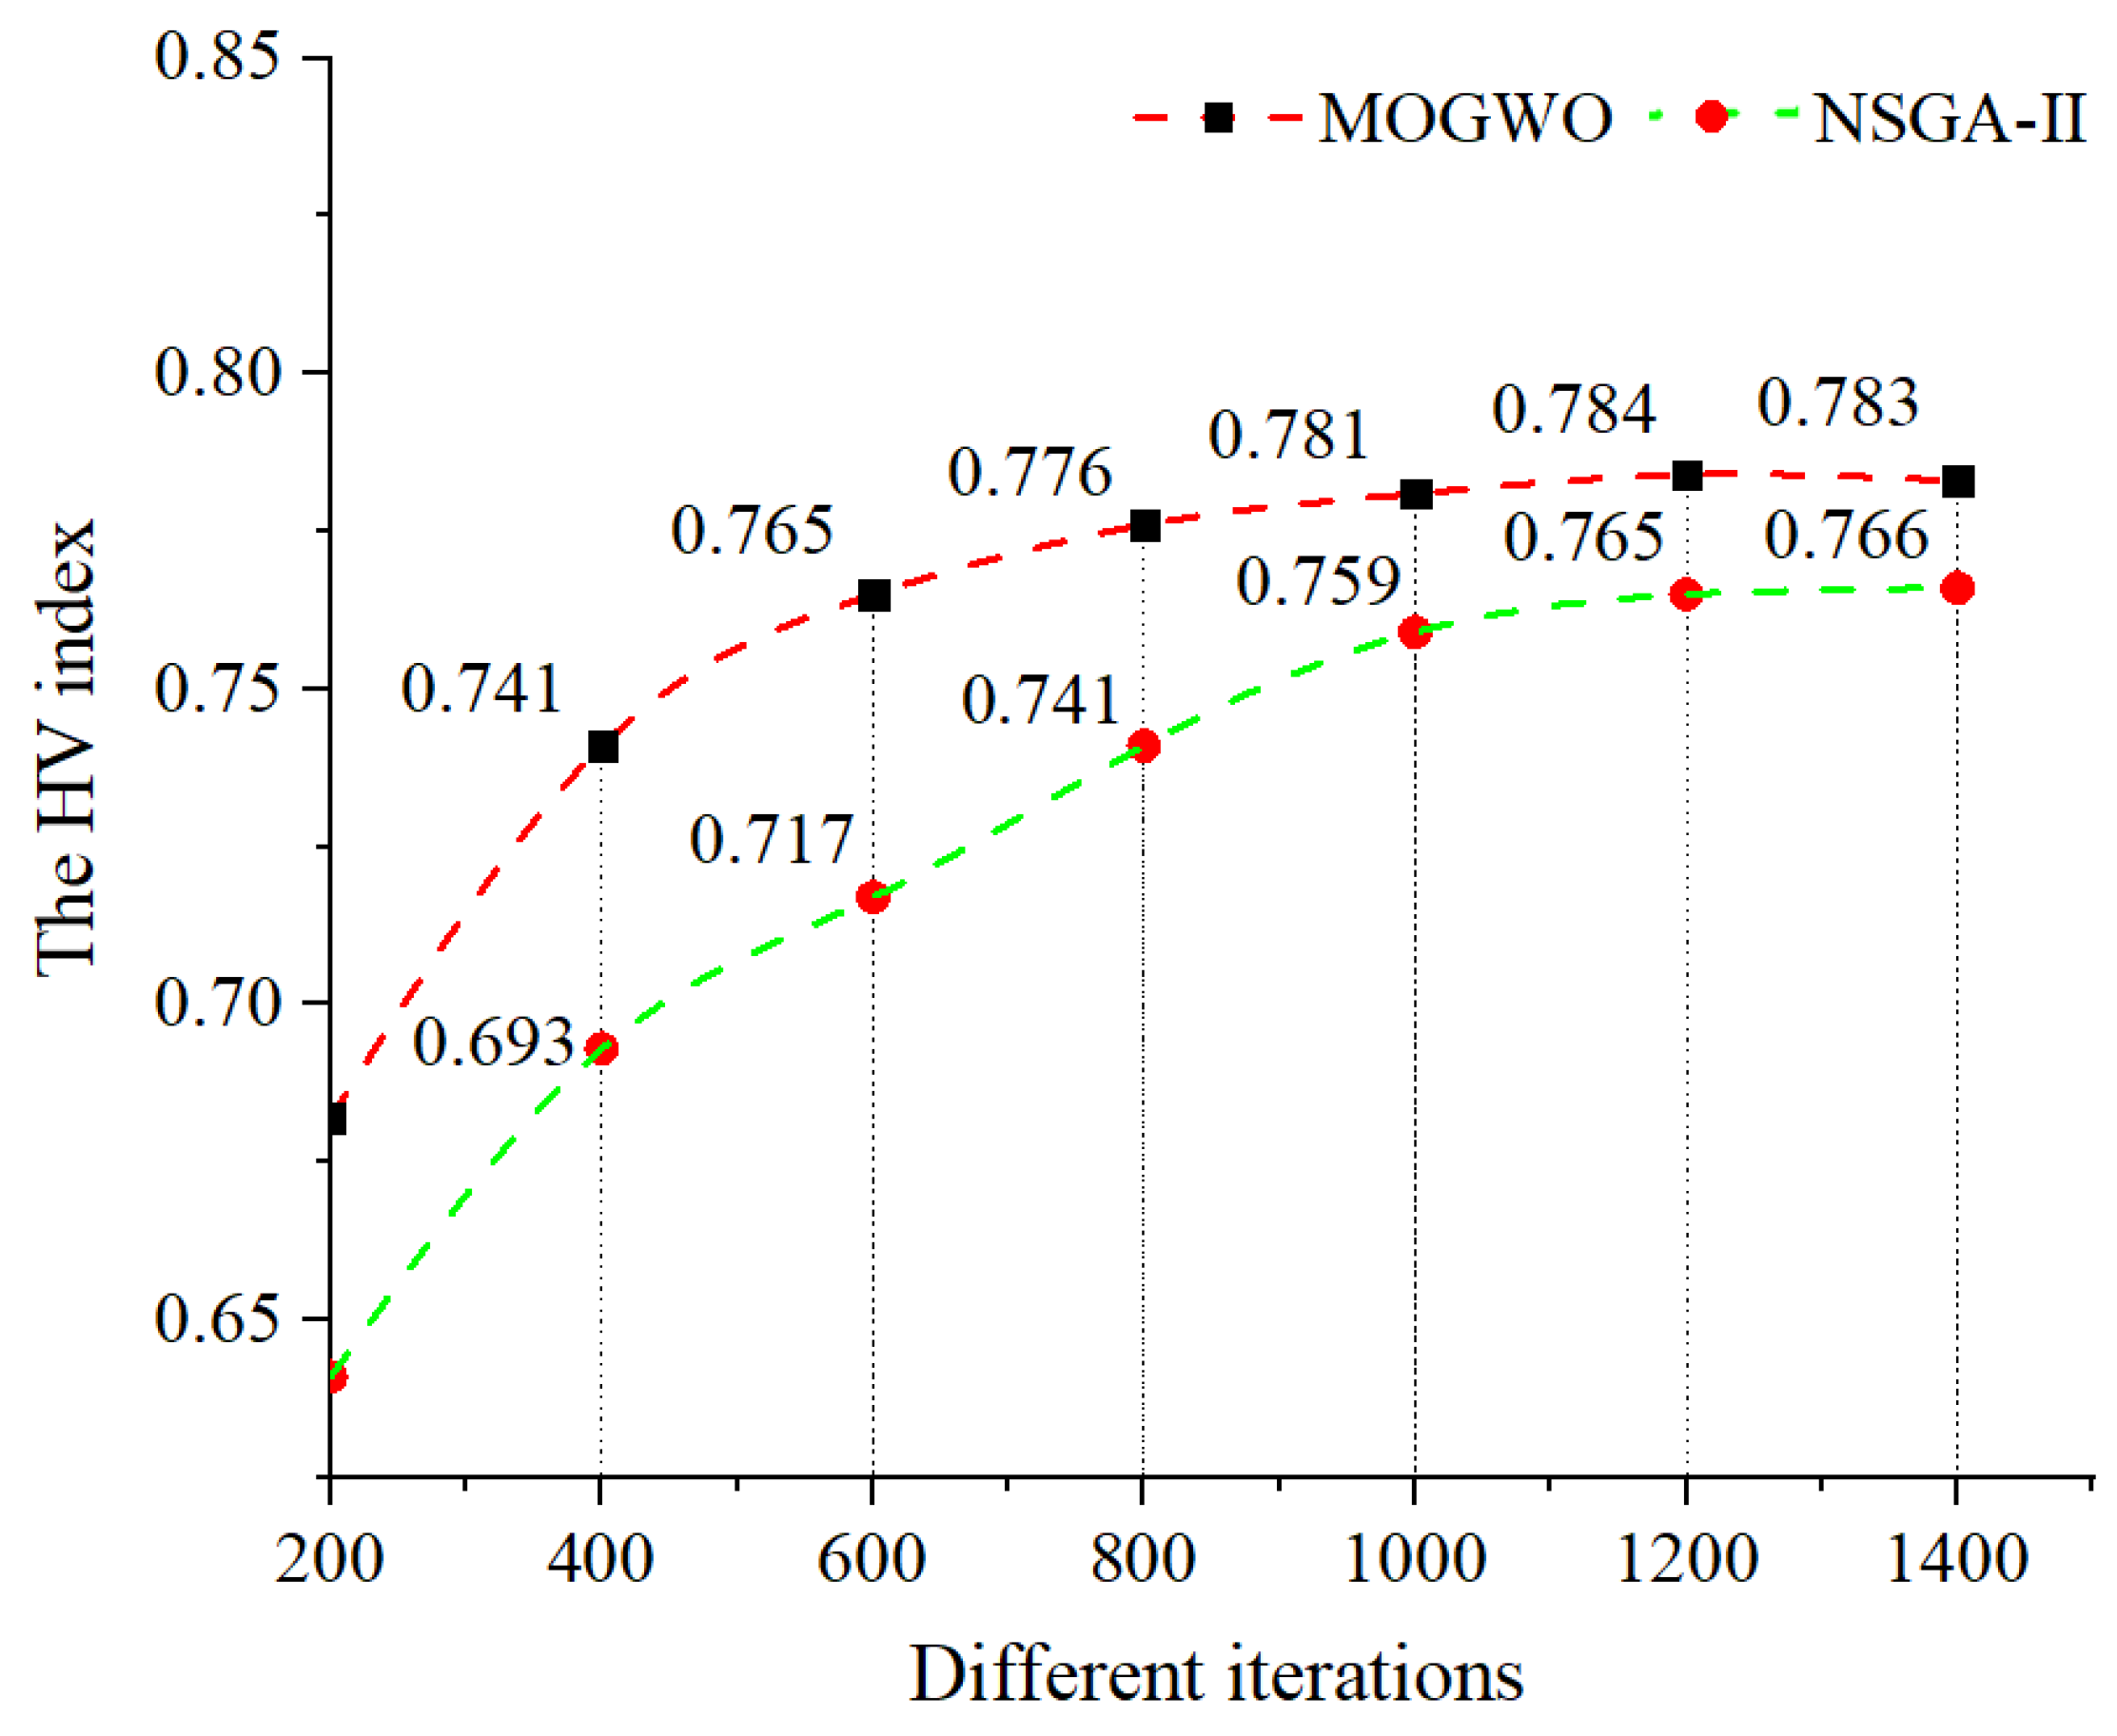
Before model training, to comprehensively analyze the optimization performance of the MOGWO algorithm and eliminate the randomness of single experimental runs, the classic Non-dominated Sorting Genetic Algorithm II (NSGA-II), which has been extensively validated in multi-objective optimization research, was adopted as the benchmark for comparative analysis. Given the inherent conflicts among multiple objectives in the shelter site selection problem, the Hypervolume (HV) indicator was utilized to quantify the convergence and diversity of Pareto solution sets derived from the two algorithms. The HV value represents the volume enclosed by the Pareto front and a predefined reference point in the objective space; a larger HV value indicates that the Pareto front is closer to the true optimal frontier with better spatial distribution uniformity. We calculated the HV values of the two algorithms at various iteration steps under a fixed population size of 100 and plotted the corresponding iterative convergence curves (Figure 14). The results revealed that the HV values of both algorithms generally increased with the growth of iterations. Specifically, the HV of MOGWO rose rapidly within the first 600 iterations, while NSGA-II maintained obvious growth until the 1000th iteration, after which the growth rate of HV slowed down substantially. After 1000 iterations, the HV values of both algorithms exhibited marginal fluctuations, implying that further increasing the iteration budget could hardly improve the optimization performance. Nevertheless, MOGWO achieved a remarkably higher overall HV value than NSGA-II throughout the iteration process. This finding demonstrates that MOGWO delivers superior optimization performance for multi-objective shelter location optimization, which can generate Pareto solutions with favorable diversity, uniform spatial distribution, and proximity to the true Pareto front, alongside stable quality of the optimal solution set.
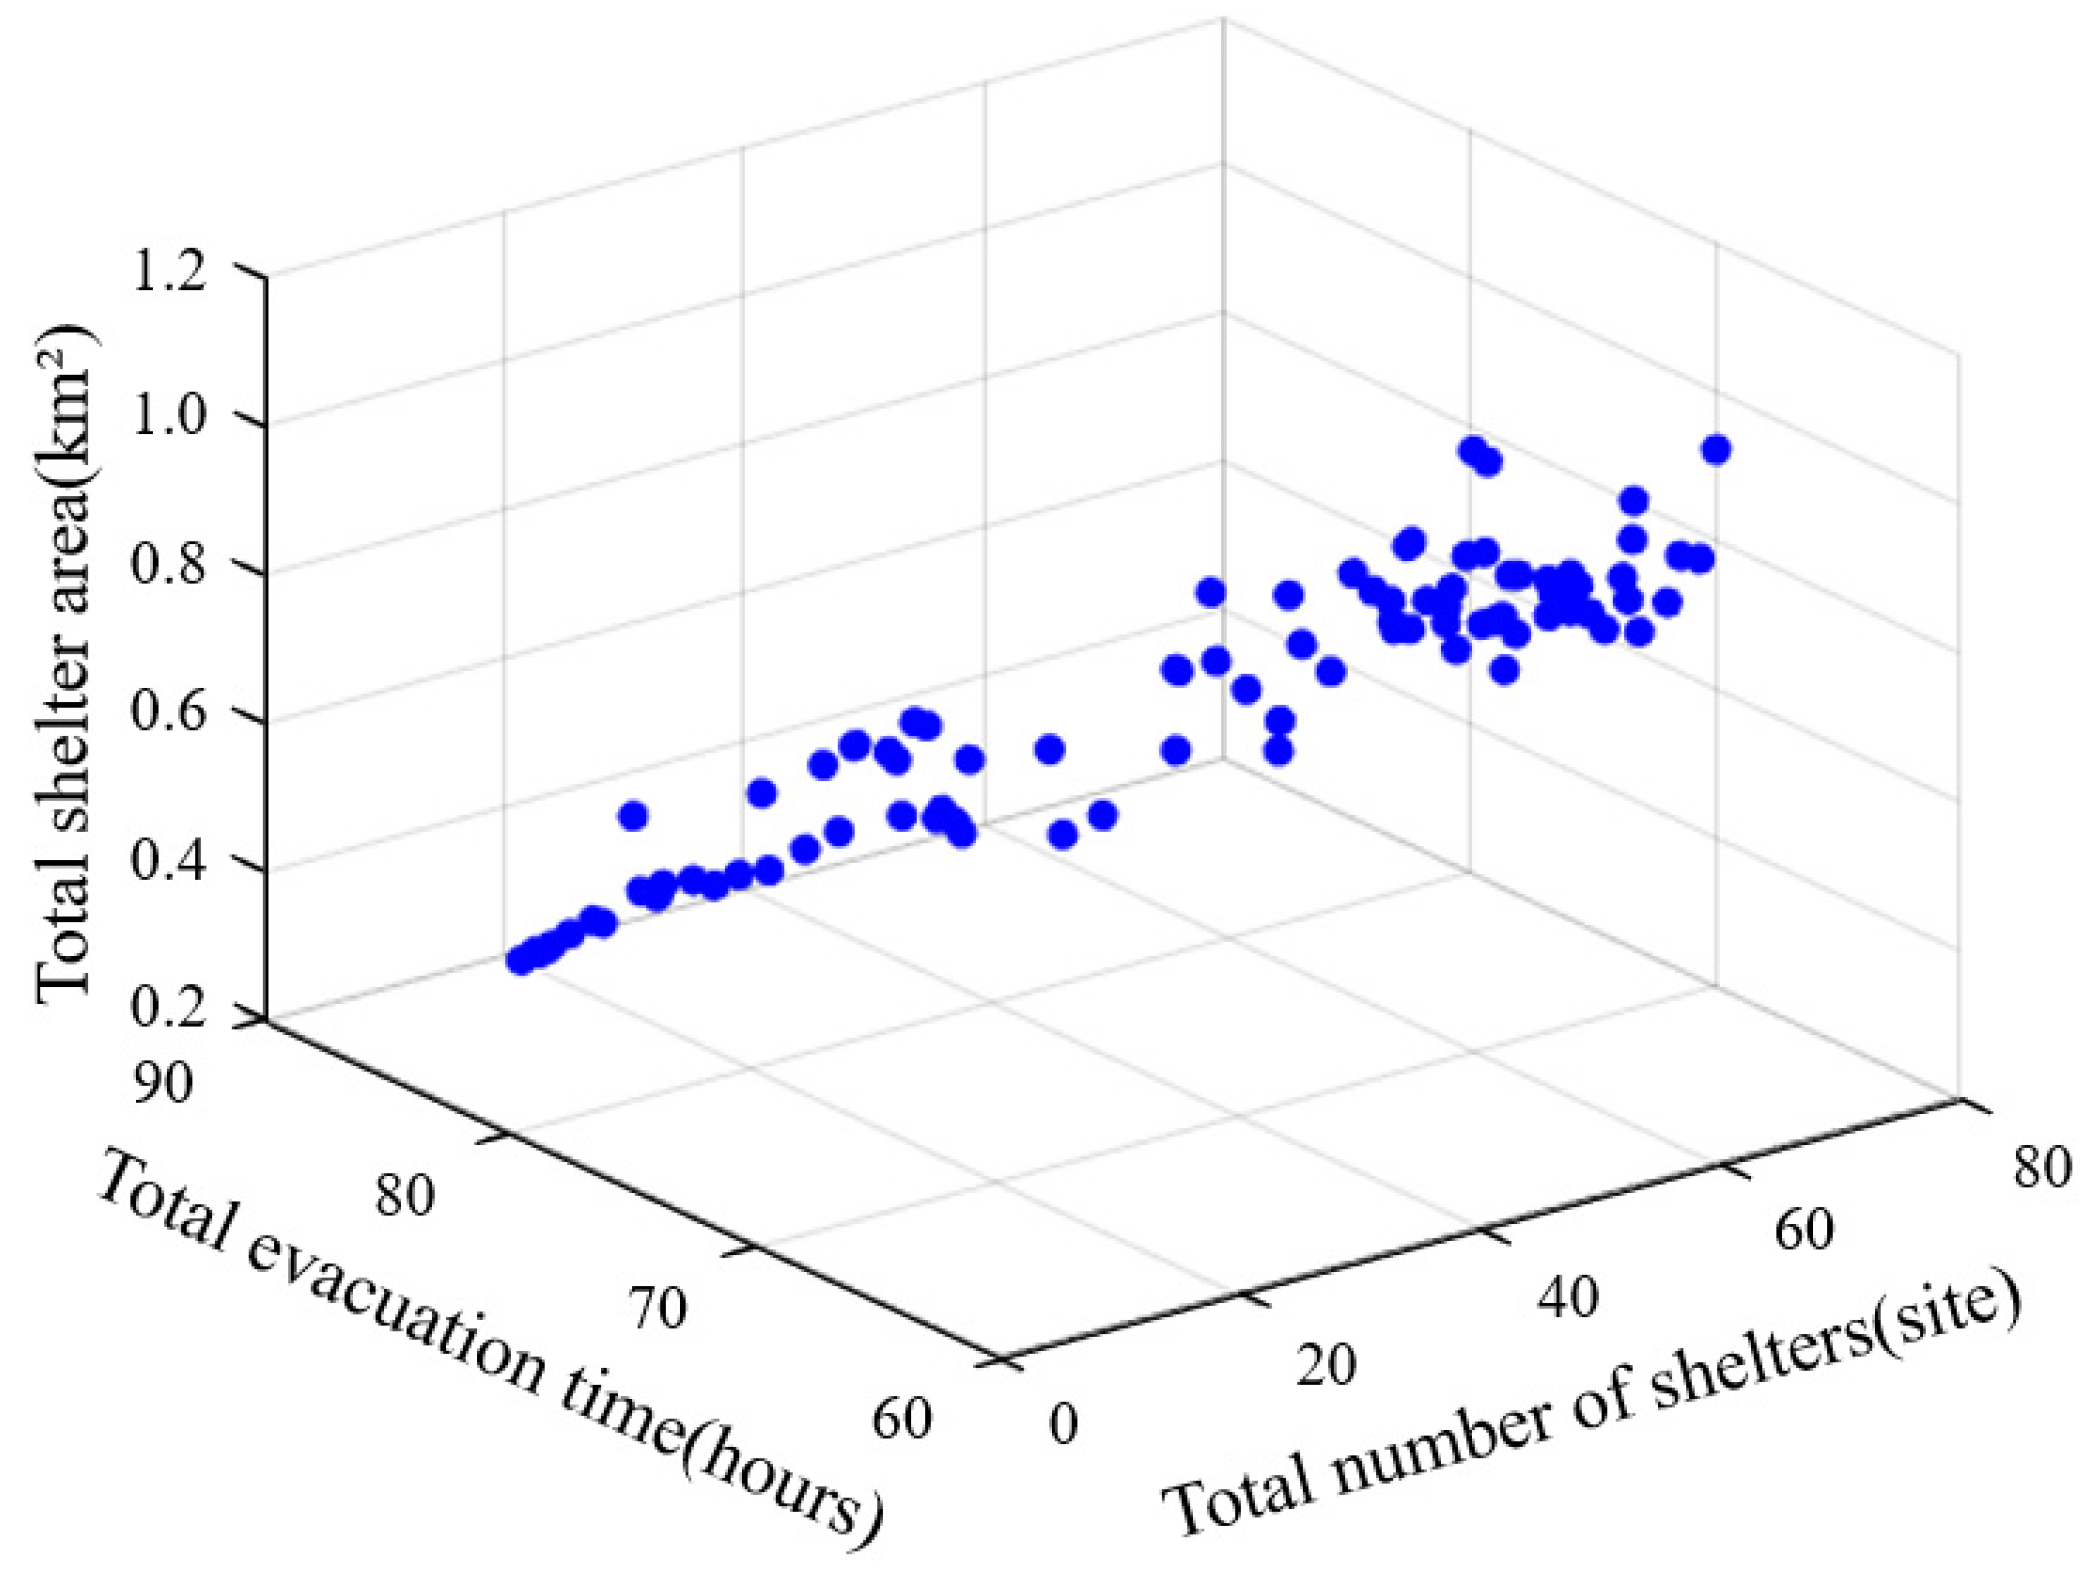
Based on the above convergence curves and performance analysis of the MOGWO algorithm, the initialization parameters of MOGWO were determined for this experiment; the parameters were set as follows: a = 0.2, b = 0.1, c = 6; the gray wolf population size was 100; the Archive population size was 50; and the maximum number of iterations was 1000. We took the total evacuation time, total shelter area and total number of emergency shelter sites as the objective functions and took time, capacity and unique refuge allocation as the constraint conditions, then obtained the Pareto solution set through iterative training and operation of the model. During the process of emergency shelter site selection, restricted by various constraint conditions, the data of the model presented the characteristics of a discrete distribution (Figure 15).
This study obtained a total of 91 site selection schemes through the MOGWO model. Among all the schemes, the minimum total evacuation time is 64 h, the minimum number of emergency shelter sites is 15, and the minimum shelter area is 5.85 × 10⁴ m2. To gain a clearer understanding of the differences in objective function values under the three extreme solutions, the evacuation time was converted into evacuation distance. Statistics were compiled on the per capita evacuation distance, total number of emergency shelter sites, and per capita shelter area under different scenarios (Table 6). These three representative feasible extreme solutions are selected from the Pareto front and all satisfy the planning constraint that the per capita effective shelter area is no less than 2 m2.
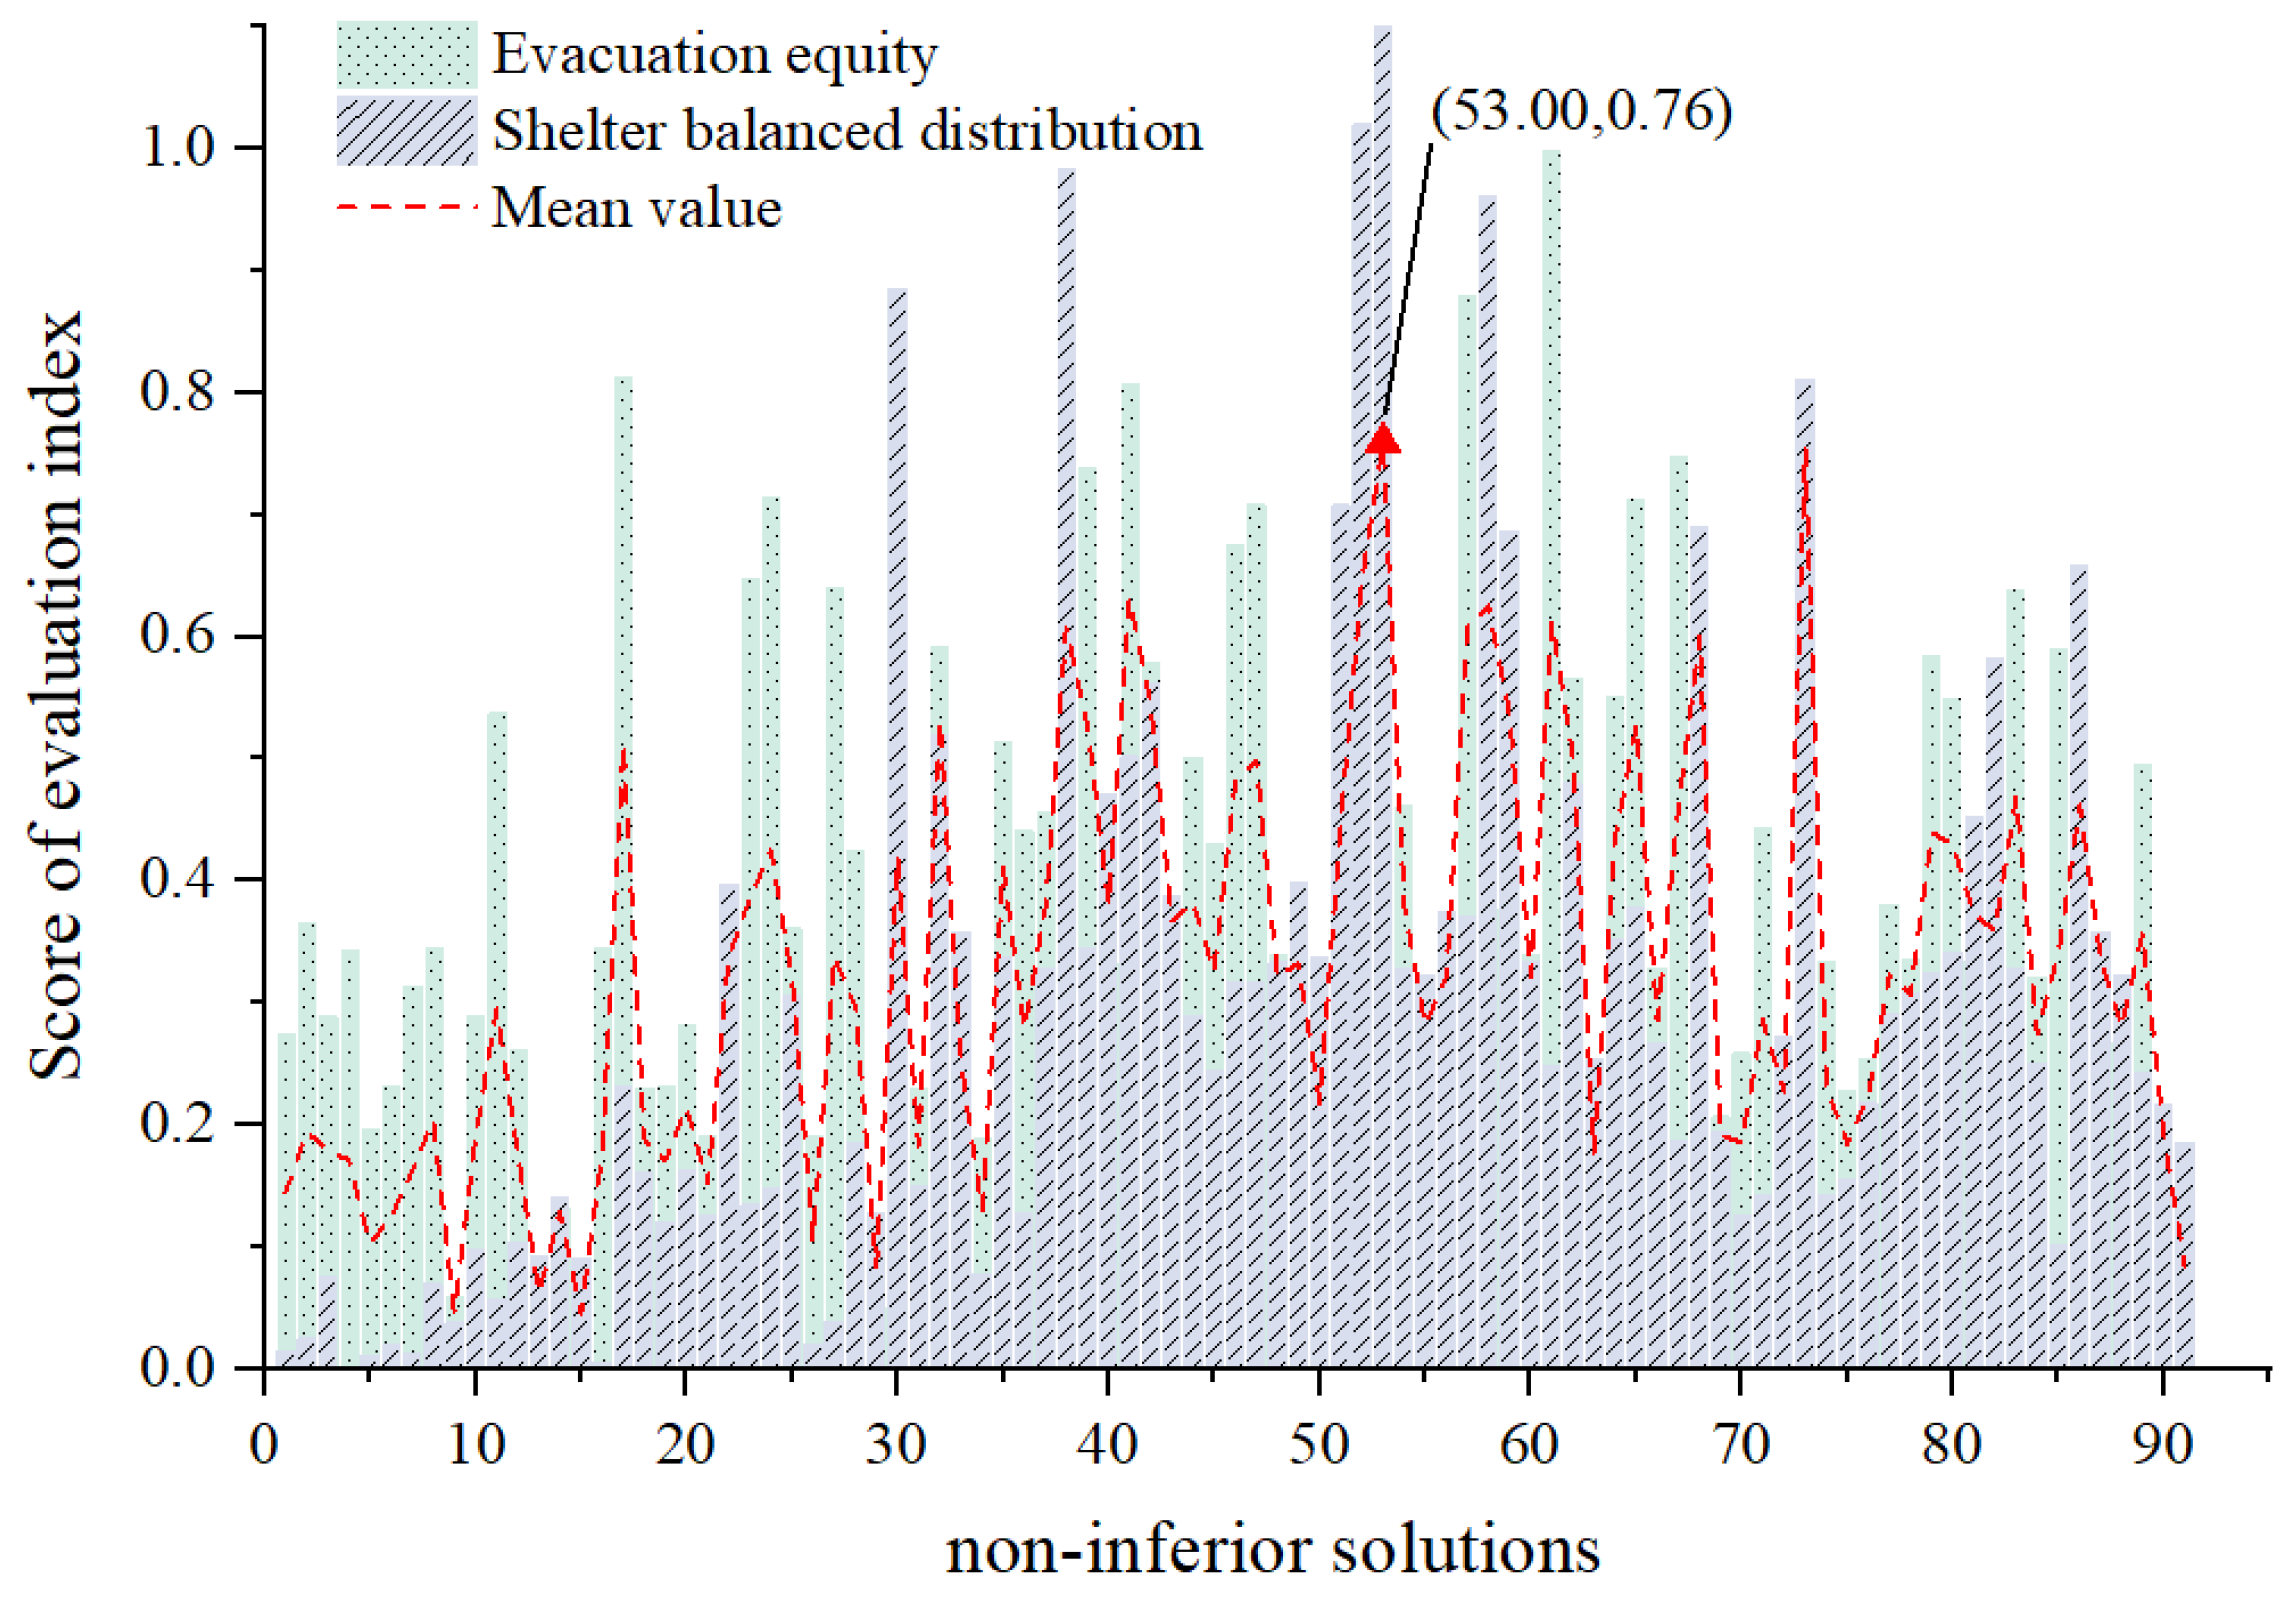
After conducting dimensionless processing on the two indicators via Min-Max normalization to unify the indicator values into the range of [0, 1], we adopted an equal-weight combination strategy to calculate the comprehensive score; that is, the arithmetic mean of normalized evacuation equity and shelter balanced distribution was taken as the scoring criteria for the 91 groups of site selection schemes derived from the multi-objective optimization results. Equal weighting is adopted for the two evaluation indicators for practical planning reasons: evacuation equity and shelter spatial balance are two equally important core goals for emergency shelter site layout under geological-flood compound disasters. Unequal weighting would artificially tilt the planning preference toward either resident evacuation fairness or facility layout uniformity, which cannot satisfy the comprehensive disaster prevention demand of Sanya City. Equal weighting avoids subjective weight assignment and realizes a balanced trade-off of the two planning objectives. Accordingly, we select the relatively optimal emergency shelter site selection scheme (Figure 16).
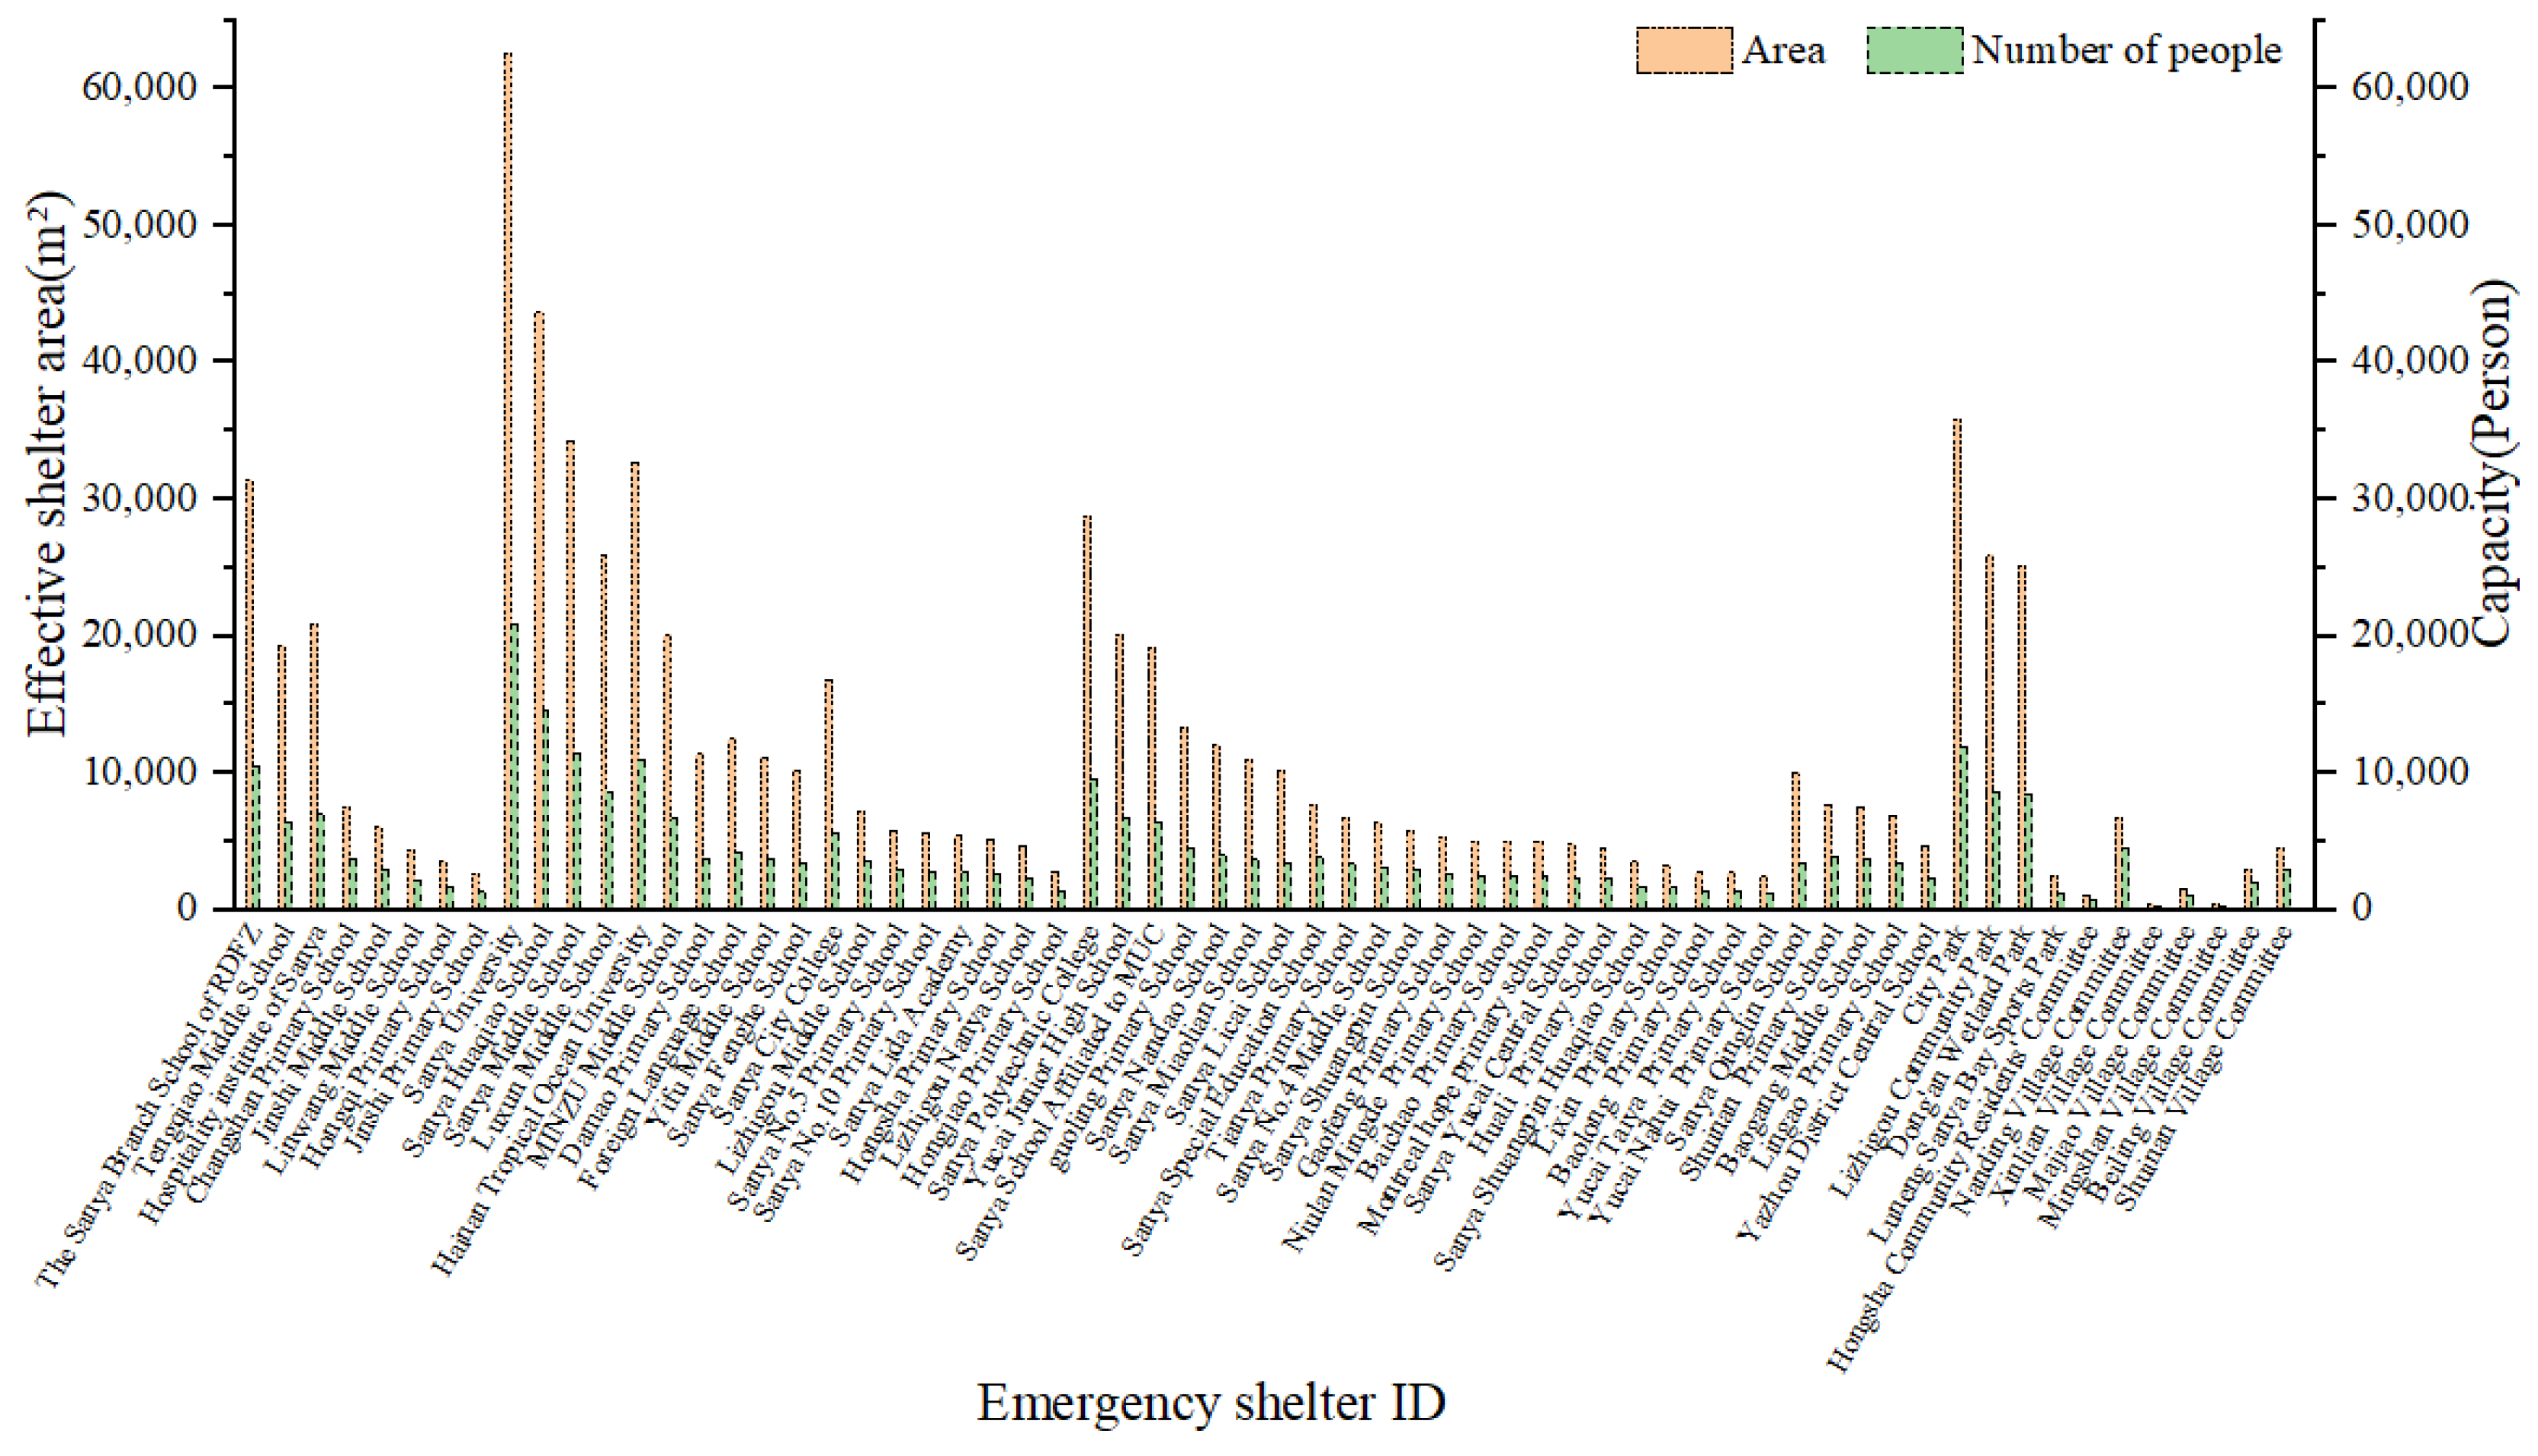
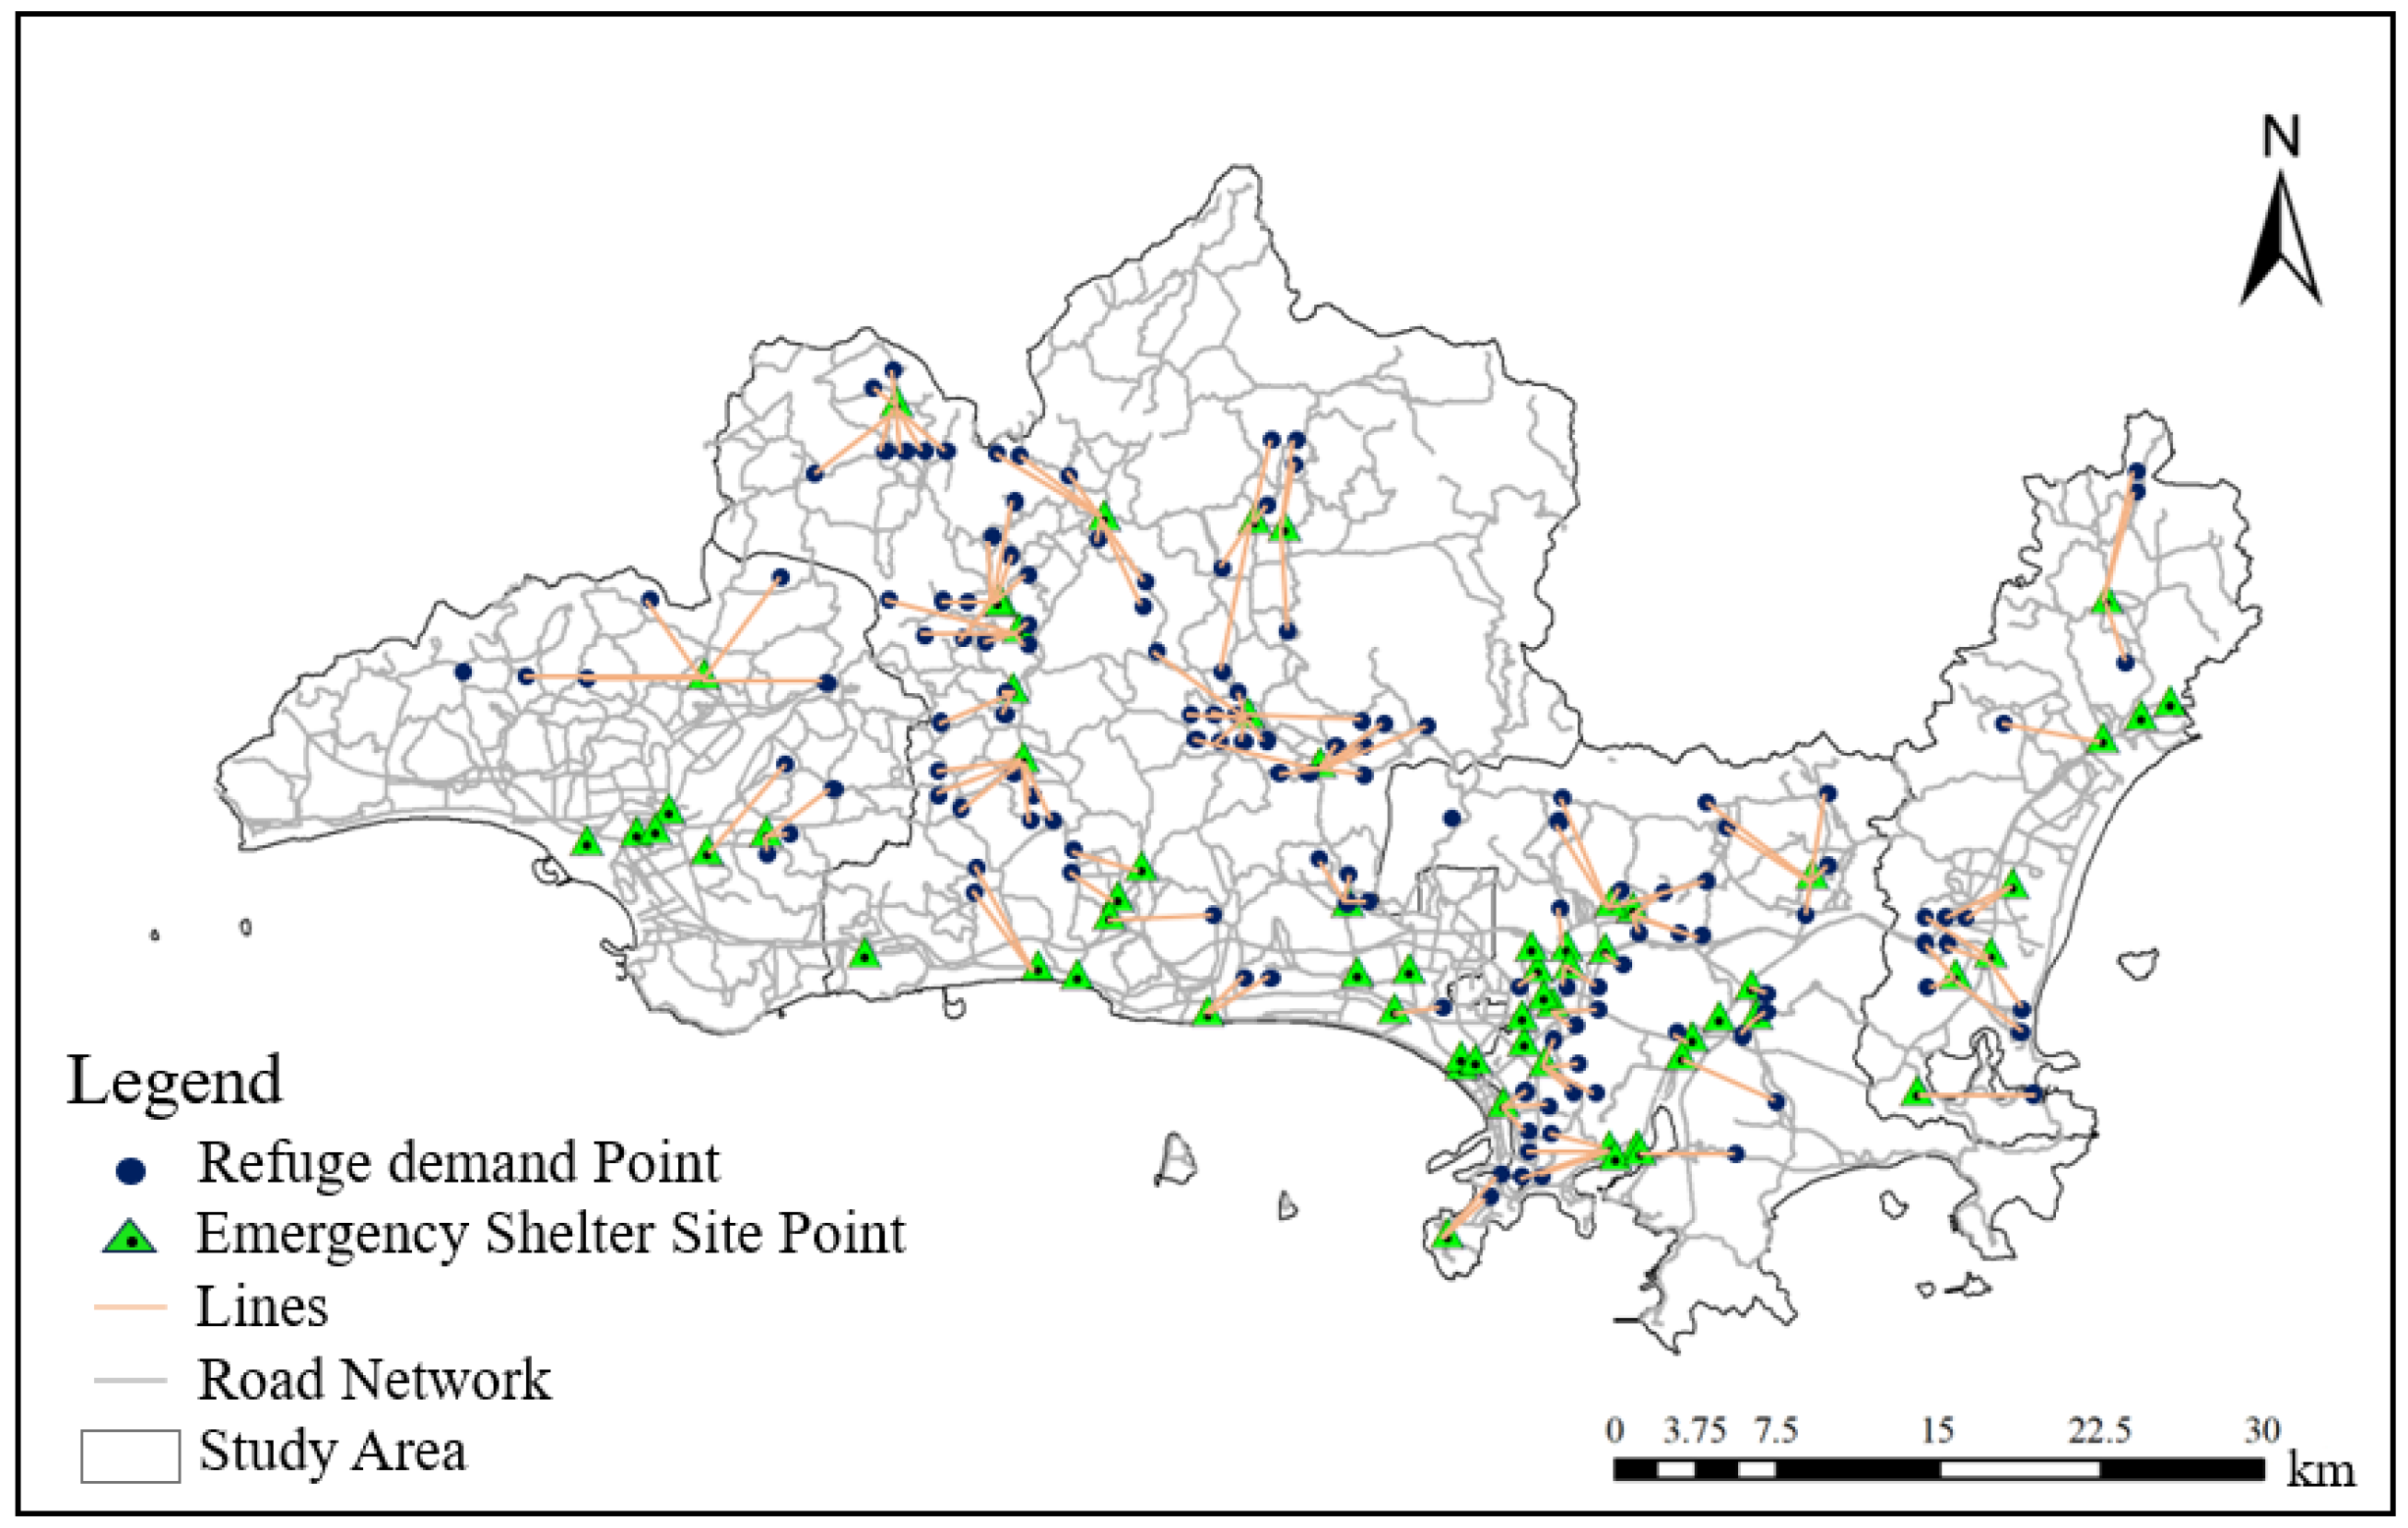
Through the mathematical models of the two types of indicators, we obtained the scores of the two indicators and the comprehensive evaluation results corresponding to the 91 groups of site selection schemes. Among them, the 53rd group of site selection schemes achieved the relatively optimal comprehensive indicator evaluation result with the highest equal-weighted average score (0.76, annotated in Figure 16), with the Min-Max normalized evacuation equity score of 0.58 and the shelter balanced distribution score of 0.94. A total of 64 sites were selected as suitable locations for emergency shelter sites in Sanya City. Specifically, the selected sites include 2 existing emergency shelter sites, 7 village and community neighborhood committees, and 55 schools and parks. Statistics were compiled on the effective shelter area and accommodation capacity of each selected site (Figure 17). To summarize, the relatively optimal scheme can provide a total effective shelter area of 74.20 × 10⁴ m2, which maximizes the satisfaction of refuge demand for 28.01 × 10⁴ people, and is also highly likely to cover areas with high risk of geological-flood compound disasters. The corresponding relationship and spatial distribution between demand points and selected sites in the scheme were visualized (Figure 18).
In the optimization results under the supplementary planning scenario, schools and parks are usually prioritized as the layout sites of emergency shelter sites under the scenario of geological-flood compound disasters, which is also in line with the concepts of the principles of combining peacetime and disaster-use and sustainable development. However, it is worth noting that the coverage of the northern area of Yazhou District in Sanya City is not ideal. In follow-up efforts, measures such as delineating the scope of new sites or expanding the capacity of existing emergency shelter sites can be adopted to fully cover the refuge demand points in the northern area of Yazhou District as much as possible.

5. Conclusions

Against the backdrop of urban safety development in territorial spatial planning, this study took a disaster risk perspective, comprehensively considered factors such as the natural environment and human activities based on the formation mechanism of natural disasters, and selected Sanya City, Hainan Province as the case study area. A hazard assessment index system for urban geological and flood disasters was constructed using the RF algorithm. Then, the multi-hazard coupling incentive model was applied to compound the hazard assessment results of various disaster types, so as to quantitatively evaluate the spatial distribution characteristics of geological-flood compound disaster hazard in the study area. Finally, the G2SFCA was introduced to evaluate the suitability of candidate emergency shelter sites, and the MOGWO was adopted to explore scientific layout schemes of emergency shelter sites under the scenario of compound disasters. The following conclusions are drawn based on the results presented:
(1)
The hazard of geological-flood compound disasters in Sanya City presents a spatial pattern characterized by dominance of medium and low hazards and local agglomeration of high hazards. The extremely high-hazard areas account for 8.41%, concentrated in the mountain-valley transition zones of Tianya District and Jiyang District, as well as the potential storm surge impact zones along the southern coast. This result is highly consistent with Sanya’s regional characteristics, including north-high-south-low terrain, typhoon and rainstorm driving forces, and a disaster-prone environment in the transition zones between coastal and mountainous areas.
(2)
By incorporating the comprehensive hazard assessment coefficient of geological-flood compound disasters into the G2SFCA, the suitability analysis of candidate emergency shelter sites was completed from the dual dimensions of accessibility and safety, breaking the limitation of traditional site selection that prioritizes accessibility while neglecting disaster hazard. The introduction of hazard weights makes the suitability assessment of candidate shelters in the study area more compatible with the scenario of geological-flood compound disasters. Candidate shelters with high suitability are mostly distributed in medium- and low-hazard areas with convenient transportation, effectively avoiding the layout contradiction of shelters being located in high-hazard zones.
(3)
The optimization model for the layout of candidate emergency shelter sites, constructed based on the MOGWO, takes evacuation equity and utilization balance as evaluation indicators, realizing the scientific optimization of shelter layout. The proposed optimization scheme can effectively address the existing problems in current shelter layout, such as insufficient coverage of high-hazard areas, unbalanced accessibility in some regions, and uneven resource utilization efficiency. It achieves the threefold goals of disaster hazard avoidance, rational spatial layout, and optimized service efficiency, verifying the feasibility and applicability of the Multi-Objective Gray Wolf Optimizer in the site selection of emergency shelter sites.

6. Discussion

The geological-flood compound disaster hazard assessment index system constructed based on the RF algorithm and multi-hazard coupling incentive model differs from previous single-hazard risk assessments in that it has a clear framework structure and logical relationship, while also focusing on the interaction mechanisms of different disaster systems. At the level of individual disaster hazard assessment indicators, this study uses RF to quantify the hazard of urban geological and flood disasters, which can accurately reflect the urban safety risk level. When comprehensively analyzing the hazard assessment results of every single disaster, the coupling incentive model takes into account the mutual triggering relationships between various hazards. Unlike previous practices where the weight coefficient was set to 1 in hazard superposition calculations, this model adjusts the disaster hazard intensity, thereby improving the accuracy of urban compound disaster hazard assessment. Nonetheless, the hazard assessment results from the RF model are subject to notable uncertainty caused by fixed hyperparameter settings and inadequate parameter sensitivity testing. In the hazard modeling process, key hyperparameters including the number of decision trees, node splitting thresholds and feature sampling ratios were preset without grid-search-based hyperparameter optimization and driving factor sensitivity analysis. Changes in hyperparameter combinations will alter the contribution weight of disaster-inducing factors, blur the boundary of high-hazard zones, interfere with the division of evacuation units and statistical calculation of evacuable population, and produce cascading errors in subsequent shelter suitability evaluation and multi-objective layout optimization. In addition, the model fails to quantify the marginal impact of critical parameters on hazard mapping precision, which weakens the credibility of disaster risk zoning outcomes.
For emergency shelter site layout optimization, the MOGWO outperforms NSGA-II in convergence speed and Pareto frontier quality verified by HV convergence curves, yet it has obvious drawbacks in parameter calibration and convergence stability. Core hyperparameters of MOGWO were determined merely according to the HV convergence inflection point under a single population size, lacking repeated convergence verification under multiple population scales. After 1000 iterations, the HV indicator only presents mild convergent fluctuation, which cannot thoroughly avoid local optimal solutions in the three-objective optimization scenario covering evacuation time, shelter scale and shelter quantity. Moreover, the archive adaptive pruning mechanism in the later iteration phase may eliminate boundary optimal shelter planning schemes and reduce the diversity of the Pareto optimal solution set.
In terms of optimization model input conditions, static grid population within high-hazard zones is defined as fixed evacuation demand nodes, which greatly simplifies the spatiotemporal dynamic characteristics of emergency evacuation demand in Sanya, a coastal tourist city. Static annual-average population data cannot reflect day-night population migration between coastal scenic spots and urban residential areas: tourist aggregation along coastal belts forms daytime evacuation peaks, while concentrated residential populations bring nighttime evacuation pressure. Additionally, the model assumes uniform evacuation willingness and simultaneous evacuation initiation for all residents in high-risk areas, ignoring residents’ spontaneous pre-warning evacuation behaviors, evacuation capacity disparities of vulnerable groups (the elderly, children, disabled people, etc.) and personalized path selection preferences. Such over-simplified static demand assumptions lead to systematic deviation between the calculated total evacuation time and the actual emergency evacuation process under sudden compound disasters. In addition, this research only focuses on geological-flood compound disasters and ignores coastal-specific hazards such as storm surges and seawater intrusion. As a typhoon-prone coastal city, Sanya faces superimposed disasters composed of typhoon-triggered storm surges, urban waterlogging and geological disasters, which limits the identification accuracy of high-hazard areas and the implementation effect of shelter layout optimization. Future research will add storm surge and seawater intrusion evaluation indicators to construct a comprehensive multi-hazard coupling assessment system covering typhoons, storm surges, geological disasters and floods, so as to enhance the overall recognition ability of high-risk areas in the study area.
During candidate shelter suitability evaluation, this study incorporates the compound disaster hazard coefficient to build a three-dimensional evaluation framework of “hazard-accessibility-safety”, which addresses the long-term contradiction in traditional shelter site selection that disaster hazard conditions are separated from spatial layout planning. On the premise of evacuation fairness and balanced facility utilization, the aforementioned MOGWO algorithm realizes multi-objective optimization of shelter layout to improve the service efficiency of shelters under uncertain disaster scenarios. However, the distance attenuation coefficient of the G2SFCA suitability evaluation model adopts empirical values that cannot adapt to the actual evacuation characteristics of Sanya. Meanwhile, the current multi-objective optimization model fails to incorporate practical constraints such as shelter construction costs, land use control rules and targeted evacuation demands for vulnerable groups. Therefore, follow-up research will calibrate the G2SFCA distance attenuation coefficient based on field evacuation survey data of Sanya, integrate construction cost and land use planning constraints into the optimization model, and construct a dynamic shelter layout optimization model supported by real-time regional traffic flow to realize the dual guarantee of static layout planning and dynamic emergency adjustment based on typhoon and rainstorm early warning information.
Improving disaster prevention, mitigation and emergency rescue capacity in high-hazard zones of geological-flood compound disasters and forming targeted emergency shelter site layout schemes are important ways to implement urban comprehensive safety construction in Sanya. Targeted improvement strategies are proposed for typical high-risk regions including mountain-valley transition zones in Tianya District and Jiyang District as well as storm surge sensitive areas along the southern coast from three perspectives: risk prevention in high-hazard zones, optimization of existing shelter layout and improvement of supporting systems. First, strengthen risk prevention and control in compound disaster high-hazard zones: restrict new construction of high-density population-intensive buildings, conduct safety reinforcement or relocation risk assessment for existing shelters, and deploy standardized emergency supplies around shelter facilities. Second, prioritize the construction of new shelters in medium-low hazard areas with insufficient service coverage (eastern Jiyang District and southern Haitang District) to balance the spatial distribution of emergency shelter sites. Third, formulate a three-level evacuation corridor system connecting high-hazard zones, temporary shelters and permanent fixed shelters, keeping away from disaster-prone areas such as river floodplains and steep slopes. Furthermore, establish a dynamic shelter operation evaluation mechanism to adjust shelter activation scale and material deployment schemes in real time according to typhoon and rainstorm early warning information.

Author Contributions

Conceptualization, Y.Z. and W.Z.; methodology, Y.Z. and Y.L.; software, Y.L.; validation, Y.Z. and W.Z.; formal analysis, Y.L.; investigation, Y.Z.; resources, Y.Z.; data curation, Y.Z.; writing—original draft preparation, Y.Z.; writing—review and editing, Y.Z.; visualization, W.Z.; supervision, X.L.; project administration, Y.Z.; funding acquisition, X.L. All authors have read and agreed to the published version of the manuscript.

Funding

This research was funded by the National Key Research and Development Program of China (2023YFC3007205) and the National Natural Science Foundation of China (42301515).

Data Availability Statement

The original contributions presented in this study are included in the article. Further inquiries can be directed to the corresponding author.

Acknowledgments

We would like to thank the Department of Natural Resources and Planning of Hainan Province and the Emergency Management Department of Hainan Province for providing the Geological and flood disaster and emergency shelter sites data.

Conflicts of Interest

The authors declare no conflicts of interest.

References

  1. Wu, X.J.; Liu, J.K.; Niu, Z.G.; Qin, P.; Feng, Y.; Gu, X.; Gong, J.; He, R. Projection of population exposure to compound extreme climate events in the Yangtze River Basin. J. Earth Sci. 2025, 36, 2771–2788. [Google Scholar] [CrossRef] [Scilit]
  2. Zhou, H.F.; Ye, F.; Fu, W.X.; Liu, B.; Fang, T.; Li, R. Dynamic Effect of Landslides Triggered by Earthquake: A Case Study in Moxi Town of Luding County, China. J. Earth Sci. 2024, 35, 221–234. [Google Scholar] [CrossRef] [Scilit]
  3. Xu, X.; Xing, Y.C.; Guo, Z.; Huang, Y. Stability analysis of rainfall-triggered toe-cut slopes and effectiveness evaluation of pile-anchor structures. J. Earth Sci. 2021, 32, 1104–1112. [Google Scholar] [CrossRef] [Scilit]
  4. Yang, X.L.; Yan, Y.Y.; Zhou, X.; Zhu, L.; Ma, M.; Zhang, J.; Chen, Y.; Gao, L. Risk of compound typhoon disaster chains: Insights from southeastern China. Int. J. Disaster Risk Sci. 2025, 16, 870–887. [Google Scholar] [CrossRef] [Scilit]
  5. Upreti, Y. Role of security forces in disaster management with references to Nepalese security forces. Patan Pragya 2022, 10, 217–227. [Google Scholar] [CrossRef] [Scilit]
  6. Amelia, R.N.; Pasongli, H.; Latupeirissa, A.N.; Saprudin, S.; Aswan, M. Multi-risk analysis of geological disasters in the Jailolo Coastal Area as a disaster mitigation-based tourism development strategy. GeoScienceEd 2024, 5, 68–74. [Google Scholar] [CrossRef] [Scilit]
  7. Zhao, Y.M.; Dong, N.P.; Xu, K.; Wang, H. Quantitative assessment of compound flood disaster in the Xijiang River Basin, considering univariable and multivariable with intra-correlation. Nat. Hazards 2025, 121, 8565–8586. [Google Scholar] [CrossRef] [Scilit]
  8. Wu, Y.; Tan, X.Z.; Mo, H.Y.; Li, X.; Zhang, Y.; Yang, F.; Song, L.; He, Y.; Chen, X. A dynamic game model for emergency resource managers and compound disasters induced by heavy rainstorms. Water 2024, 16, 2959. [Google Scholar] [CrossRef] [Scilit]
  9. Xu, Y.Y.; Zhou, C.Y.; Hu, B. Measuring the accessibility of emergency shelters based on an improved two-step floating catchment area model. Int. J. Digit. Earth 2025, 18, 2479864. [Google Scholar] [CrossRef] [Scilit]
  10. Amiran, A.; Behnam, B.; Seyedin, S. AI-Based model for site-selecting earthquake emergency shelters. Sci. Rep. 2024, 14, 29033. [Google Scholar] [CrossRef] [Scilit]
  11. Wang, X.X.; Guan, M.L.; Dong, C.L.; Wang, J.; Fan, Y.; Xin, F.; Lian, G. A multi-indicator evaluation method for spatial distribution of urban emergency shelters. Remote Sens. 2022, 14, 2722–2741. [Google Scholar] [CrossRef] [Scilit]
  12. Yılmaz, G.; Çakır, Ö. Evaluation of farmers’ disaster risk reduction activities against meteorological disasters in Türkiye: A qualitative study. Nat. Hazards 2025, 121, 16087–16119. [Google Scholar] [CrossRef] [Scilit]
  13. Asnudin, A.; Ali, A.A.; Muhtar, T. Evaluation of disaster risk and mitigation strategies for post-disaster permanent housing in the Palu Koro Fault Area. Eng. Technol. Appl. Sci. Res. 2024, 14, 18941–18948. [Google Scholar] [CrossRef] [Scilit]
  14. Zhang, R.J.; Tian, D.; Wang, H.W.; Kang, X.; Wang, G.; Xu, L. Risk assessment of compound dynamic disaster based on AHP-EWM. Appl. Sci. 2023, 13, 10137. [Google Scholar] [CrossRef] [Scilit]
  15. Pei, J.J.; Dai, C.Y.; Cui, T. A directed weighted network approach for hazard chain risk assessment including heavy rainfall induced geological disasters and flooding. Sci. Rep. 2026, 16, 2866. [Google Scholar] [CrossRef] [Scilit]
  16. Ducros, G.; Tiggeloven, T.; Ma, L.; Daloz, A.S.; Schuhen, N.; Claassen, J.; de Ruiter, M.C. Multi-hazards in Scandinavia: Impacts and risks from compound heatwaves, droughts and wildfires. Nat. Hazards Earth Syst. Sci. 2025, 25, 4693–4712. [Google Scholar] [CrossRef] [Scilit]
  17. Song, Y.; Song, Y.H.; Park, M.; Kim, S.Y. Development of prediction model for damage costs of heavy rainfall disasters using machine learning in the Republic of Korea. Climate 2025, 13, 72. [Google Scholar] [CrossRef] [Scilit]
  18. Haggag, M.; Rezk, E.; El-Dakhakhni, W. Machine learning prediction of climate-induced disaster injuries. Nat. Hazards 2023, 116, 3645–3667. [Google Scholar] [CrossRef] [Scilit]
  19. Bahuguna, H.N.; Bahuguna, S.; Zaini, S.H.R.; Kakkar, K.B. Effectiveness of Random Forest model for flash flood susceptibility in the Himalayan region. J. Inf. Syst. Eng. Manag. 2025, 10, 21–38. [Google Scholar] [CrossRef] [Scilit]
  20. Liu, C.; Ma, Q.; Zhang, X.; Li, C.; Li, Q.; Gourbesville, P.; Guo, L.; Ding, L. Identification and quantitative analysis of flash flood risks for small catchments in China: A new operational modelling approach. LHB 2022, 108, 2019561. [Google Scholar] [CrossRef] [Scilit]
  21. Shankar, B.M.; Vignesh, K.J.; Ashkar, N.C.A.; Anand, G.P. Forest fire severity prediction using random forest and neural network stacking with SMOTE. IJIREEICE 2025, 13, 69–74. [Google Scholar] [CrossRef]
  22. Yu, B.; Xing, H.; Yan, J. Susceptibility assessment of multi-hazards using random forest–back propagation neural network coupling model: A Hangzhou City case study. Sci. Rep. 2024, 14, 21783. [Google Scholar] [CrossRef] [Scilit]
  23. Li, Y.; Wang, L.Q.; Li, F.; Peng, S.G.; Ding, C. Quantitative estimation of urban flood damage from storm surges for a coastal city. Nat. Hazards 2025, 121, 16915–16934. [Google Scholar] [CrossRef] [Scilit]
  24. Zhu, Z.L.; Zhang, W.; Zhu, W.J. Compound impact of storm surge and flood characteristics in coastal area based on copula. Water 2024, 16, 270. [Google Scholar] [CrossRef] [Scilit]
  25. Meng, D.; Liu, Y.M.; Wang, Z.H.; Yang, X.; Liu, X.; Zhang, J.; Gao, K. Decreasing vulnerability of storm surge disasters in coastal cities of China over the past 30 years. J. Mar. Sci. Eng. 2023, 11, 128. [Google Scholar] [CrossRef] [Scilit]
  26. Yalla, V.S.; Satyanarayana, A.N.V.; Murty, P.L.N.; Srinivas, K.S. Influence of land use and cover on storm surge induced coastal flooding in the Sundarbans during Cyclone Amphan. Nat. Hazards 2025, 121, 21531–21549. [Google Scholar] [CrossRef] [Scilit]
  27. Ding, Y.; Wei, H. Modeling the impact of land reclamation on storm surges in Bohai Sea, China. Nat. Hazards 2017, 85, 559–573. [Google Scholar] [CrossRef] [Scilit]
  28. Zhang, D.; Wang, J. Research on the optimization of urban emergency shelters considering flood disaster risks. Geomat. Nat. Hazards Risk 2025, 16, 2585171. [Google Scholar] [CrossRef] [Scilit]
  29. Zhu, W.L.; Xing, H.L.; Kang, W.L. Spatial layout planning of urban emergency shelter based on sustainable disaster reduction. Int. J. Environ. Res. Public Health 2023, 20, 2127. [Google Scholar] [CrossRef] [Scilit]
  30. Wei, Y.; Liu, J.; Jin, L.; Wang, S.; Deng, F.; Ou, S.; Pan, S.; Wu, J. Individual behavior and attention distribution during wayfinding for emergency shelter: An eye-tracking study. Sustainability 2023, 15, 11880. [Google Scholar] [CrossRef] [Scilit]
  31. Ajaj, Q.M.; Bakr, S.A.; Shakoor, Z.H.; Omar, A.S.; Shakir, E.N. An integration of remote sensing and GIS based on multi-criteria decision making for the selection of lands suitable for wind energy harvesting. Eng. Technol. Appl. Sci. Res. 2025, 15, 26383–26388. [Google Scholar] [CrossRef] [Scilit]
  32. Zandi, I.; Pahlavani, P.; Bigdeli, B.; Lotfata, A.; Alesheikh, A.A.; Garau, C. GIS-enabled multi-criteria assessment for hospital site suitability: A case study of Tehran. Sustainability 2024, 16, 2079. [Google Scholar] [CrossRef] [Scilit]
  33. Rashidi, F.; Sharifian, S. A comparative analysis of three multi-criteria decision-making methods for land suitability assessment. Environ. Monit. Assess. 2022, 194, 657. [Google Scholar] [CrossRef] [Scilit]
  34. Tiangtrong, A.; Mangmoon, T.; Apirak, S.; Amornwech, N.; Noipow, N.; Jan, C.-D. Optimized shelter planning in flood-prone areas using geographic information systems (GIS) and the analytical hierarchy process (AHP): An analysis of Ubon Ratchathani, Thailand. Nat. Hazards 2025, 121, 21097–21119. [Google Scholar] [CrossRef] [Scilit]
  35. Sejie, G.A.; Mosarwane, K.; Gaogane, L. Examining the adaptive capacity to flood disaster in Tlokweng Village, Botswana. Discov. Health Syst. 2025, 4, 149. [Google Scholar] [CrossRef] [Scilit]
  36. Yu, G.Y.; Chen, H.; Wu, L.; Mao, W. Disaster response mechanisms for key technology innovation in China’s emergency industry under the new national system. Systems 2025, 13, 803. [Google Scholar] [CrossRef] [Scilit]
  37. Baesler, F.; Cornejo, O.; Obreque, C.; Forcael, E.; Carrasco, R. A multi-objective simulation–optimization framework for emergency department efficiency using RSM and goal programming. Systems 2025, 13, 912. [Google Scholar] [CrossRef] [Scilit]
  38. Luo, C.L.; Gong, X.J.; Xu, L.; Wang, Z. Enhancing rail transit safety under extreme rainfall risks based on stochastic programming model. Qual. Reliab. Eng. Int. 2025, 42, 565–582. [Google Scholar] [CrossRef] [Scilit]
  39. Bhattarai, S.; Song, Y.J. Multistage stochastic programming for integrated network optimization in hurricane relief logistics and evacuation planning. Networks 2024, 85, 3–37. [Google Scholar] [CrossRef] [Scilit]
  40. Bao, D.; Xue, Z.G.; Warner, J.C. Quantifying compound and nonlinear effects of hurricane-induced flooding using a dynamically coupled hydrological-ocean model. Water Resour. Res. 2024, 60, e2023WR036455. [Google Scholar] [CrossRef] [Scilit]
  41. Yuan, Y.R.; Xu, H.; Tang, C.Y. Multi-objective emergency path planning based on improved nondominant sorting genetic algorithm. Symmetry 2025, 17, 1818. [Google Scholar] [CrossRef] [Scilit]
  42. Chen, W.; Shi, Y.J.; Wang, W.; Li, W.; Wu, C. The spatial optimization of emergency shelters based on an urban-scale evacuation simulation. Appl. Sci. 2021, 11, 11909. [Google Scholar] [CrossRef] [Scilit]
  43. Zeng, J.C.; Kim, H.; Kang, J. Spatial analysis and fairness evaluation of seismic emergency shelter distribution in high-density cities based on GIS: A case study of Seoul. ISPRS Int. J. Geo-Inf. 2025, 15, 16. [Google Scholar] [CrossRef] [Scilit]
  44. Zhang, Z.P.; Hu, Y.F.; Lu, W.; Cao, W.; Gao, X. Spatial accessibility analysis and location optimization of emergency shelters in Deyang. Geomat. Nat. Hazards Risk 2023, 14, 2213809. [Google Scholar] [CrossRef] [Scilit]
  45. Aivaliotis-Apostolopoulos, P.; Loukidis, D. Swarming genetic algorithm: A nested fully coupled hybrid of genetic algorithm and particle swarm optimization. PLoS ONE 2022, 17, e0275094. [Google Scholar] [CrossRef] [Scilit]
  46. Chen, L.Q.; Lai, X.; Hu, H.X.; Zhang, K.; Zeng, Z. Evaluation of geological disaster hazard in mountainous pipeline areas utilizing unascertained measurement theory. Nat. Hazards 2025, 121, 23055–23073. [Google Scholar] [CrossRef] [Scilit]
  47. Wu, C.S.; Guo, Y.G.; Su, L.B. Risk assessment of geological disasters in Nyingchi, Tibet. Open Geosci. 2021, 13, 219–232. [Google Scholar] [CrossRef] [Scilit]
  48. Shao, J.L.; Shi, M.Z.; Xie, L.N.; Guo, Y.; Wu, S. Hazard assessment and early warnings of flood disasters in the Yangtze-Huaihe River Basin. Geomat. Nat. Hazards Risk 2025, 16, 2525427. [Google Scholar] [CrossRef] [Scilit]
  49. Lv, H.; Liu, S.M.; Yan, D.M.; Li, J.; Yu, Z.; Cao, L. Dynamic vulnerability assessment framework for urban flood disasters considering real-time population changes. J. Water Clim. Change 2024, 15, 5272–5290. [Google Scholar] [CrossRef] [Scilit]
  50. Ermagun, A.; Smith, V.; Janatabadi, F. High urban flood risk and no shelter access disproportionally impacts vulnerable communities in the USA. Commun. Earth Environ. 2024, 5, 2. [Google Scholar] [CrossRef] [Scilit]
  51. Bazai, N.A.; Alam, R.; Cui, P.; Hao, W.; Khan, A.P.; Waseem, M.; Shunyu, Y.; Ramzan, M.; Wanhong, L.; Ahmed, T. Dynamics and impacts of monsoon-induced geological hazards: A 2022 flood study along the Swat River in Pakistan. Nat. Hazards Earth Syst. Sci. 2025, 25, 1071–1093. [Google Scholar] [CrossRef] [Scilit]
  52. Khemiri, L.; Katlane, R.; Khelil, M.; Gaidi, S.; Ghanmi, M.; Zargouni, F. Flood mapping of the Lower Mejerda Valley (Tunisia) using Sentinel-1 SAR: Geological and geomorphological controls on flood hazard. Front. Earth Sci. 2024, 11, 1332589. [Google Scholar] [CrossRef] [Scilit]
  53. Gao, X.C.; Wang, P.F.; Yang, Z.Y.; Liang, W.; Lou, W.; Zhou, J. A review of urban flood disaster chain research: Causes, identification, and assessment. Water 2025, 17, 3344. [Google Scholar] [CrossRef] [Scilit]
  54. Lei, X.Y.; Li, C.L.; Wang, Y.W.; Song, W. Geological disaster causes analysis based on knowledge graph link prediction. Nat. Hazards 2025, 121, 21483–21504. [Google Scholar] [CrossRef] [Scilit]
  55. Li, R.W.; Tan, S.C.; Zhang, M.F.; Zhang, S.; Wang, H.; Zhu, L. Geological disaster susceptibility evaluation using a random forest empowerment information quantity model. Sustainability 2024, 16, 765. [Google Scholar] [CrossRef] [Scilit]
  56. Ren, H.C.; Pang, B.; Bai, P.; Zhao, G.; Liu, S.; Liu, Y.; Li, M. Flood susceptibility assessment with random sampling strategy in ensemble learning (RF and XGBoost). Remote Sens. 2024, 16, 320. [Google Scholar] [CrossRef] [Scilit]
  57. Dou, L.T.; Wu, L.; Bi, Y.S.; Li, F.; Li, D.; Zhang, M. Mechanism of fault rockburst-induced coal and gas outburst: Mine accident’s reconstruction via a coupled model of compound disasters. AIP Adv. 2025, 15, 065304. [Google Scholar] [CrossRef] [Scilit]
  58. Liu, B.; Han, X.; Qin, L.; Li, J.; Yu, Z.; Cao, L. Multi-hazard risk mapping for coupling of natural and technological hazards. Geomat. Nat. Hazards Risk 2021, 12, 2544–2560. [Google Scholar] [CrossRef] [Scilit]
  59. Wang, Q.Y.; Hou, J.D.; Guo, H.X. Exploring and analyzing disaster coupling characteristics at the regional scale: Evidence from Hubei Province. Geomat. Nat. Hazards Risk 2024, 15, 2367639. [Google Scholar] [CrossRef] [Scilit]
  60. Akamatsu, T.; Yamamoto, K. Suitability analysis for the emergency shelters allocation after an earthquake in Japan. Geosciences 2019, 9, 336. [Google Scholar] [CrossRef] [Scilit]
  61. Ji, Z.H.; Zheng, H.L.; Zou, J.X. Integrated approach for flood shelter site selection and emergency response accessibility analysis at the provincial scale: A case study in Henan, China. J. Water Clim. Change 2024, 15, 5291–5308. [Google Scholar] [CrossRef] [Scilit]
  62. Wang, L.C.; Liang, Y.P.; Yan, S.H. Post-earthquake damage detection and safety assessment of the ceiling panoramic area in large public buildings using image stitching. Buildings 2025, 15, 3922. [Google Scholar] [CrossRef] [Scilit]
  63. Ding, Z.L.; Dong, H.J.; Yang, L.; Xue, N.; He, L.; Yao, X. A study on the emergency shelters spatial accessibility based on the adaptive catchment size 2SFCA method. ISPRS Int. J. Geo-Inf. 2022, 11, 593. [Google Scholar] [CrossRef] [Scilit]
  64. Żochowska, R.; Pamuła, T. Impact of traffic flow rate on the accuracy of short-term prediction of origin-destination matrix in urban transportation networks. Remote Sens. 2024, 16, 1202. [Google Scholar] [CrossRef] [Scilit]
  65. Dong, H.X.; Ding, F.; Tan, H.C.; Wu, Y.; Li, Q.; Ran, B. Rail transit OD-matrix completion via manifold regularized tensor factorisation. IET Intell. Transp. Syst. 2021, 15, 1304–1317. [Google Scholar] [CrossRef] [Scilit]
  66. Lv, W.; Li, C.X.; Ma, Y.P. Division of responsibility areas for urban emergency shelters based on a GIS location-allocation analysis. J. Tsinghua Univ. Sci. Technol. 2022, 62, 1102–1109. [Google Scholar] [CrossRef]
  67. Chen, K.L.; Wang, H.T.; Jia, H.; Di, D.; Fu, W.; Sun, C.; Guo, W. Integrating river channel flood diversion strategies into dynamic urban flood risk assessment and multi-objective optimization of emergency shelters. Phys. Fluids 2025, 37, 037204. [Google Scholar] [CrossRef] [Scilit]
  68. Zhang, D.; Meng, H.; Wang, M.Y.; Xu, X.; Yan, J.; Li, X. A multi-objective optimization method for shelter site selection based on deep reinforcement learning. Trans. GIS 2024, 28, 2722–2741. [Google Scholar] [CrossRef] [Scilit]
  69. Li, W.; Pang, T.; Yue, Z.; Qin, Z.; Sun, D. Parameter identification of a two-degree-of-freedom lower limb exoskeleton dynamics model based on Tent-GA-GWO. Processes 2026, 14, 406. [Google Scholar] [CrossRef] [Scilit]
  70. Khan, M.W.; Siddiqui, A.A.; Rizvi, S.S.H. An improved variant of multi-population cooperative constrained multi-objective optimization (MCCMO) for multi-objective optimization problem. Comput. Mater. Contin. 2025, 86, 1–15. [Google Scholar] [CrossRef] [Scilit]
  71. Kwakye-Boateng, P.; Tartibu, L.; Tien-Chien, J. Performance optimization of a silica gel–water adsorption chiller using grey wolf-based multi-objective algorithms and regression analysis. Algorithms 2025, 18, 542. [Google Scholar] [CrossRef] [Scilit]
  72. Heidari, A.; Imani, D.M.; Khalilzadeh, M.; Sarbazvatan, M. Green two-echelon closed and open location-routing problem: Application of NSGA-II and MOGWO metaheuristic approaches. Environ. Dev. Sustain. 2022, 25, 9163–9199. [Google Scholar] [CrossRef] [Scilit]
  73. Wang, W.L.; Jiang, L.L.; Fan, Q.Q. GIS-based optimization framework for shelter site selection and population allocation under multi-hazard scenarios. Geomat. Nat. Hazards Risk 2026, 17, 2615217. [Google Scholar] [CrossRef] [Scilit]
  74. Liu, Z.; Zhang, Z.L.; Zhou, C.Y.; Ming, W.; Du, Z. An adaptive inverse-distance weighting interpolation method considering spatial differentiation in 3D geological modeling. Geosciences 2021, 11, 51. [Google Scholar] [CrossRef] [Scilit]
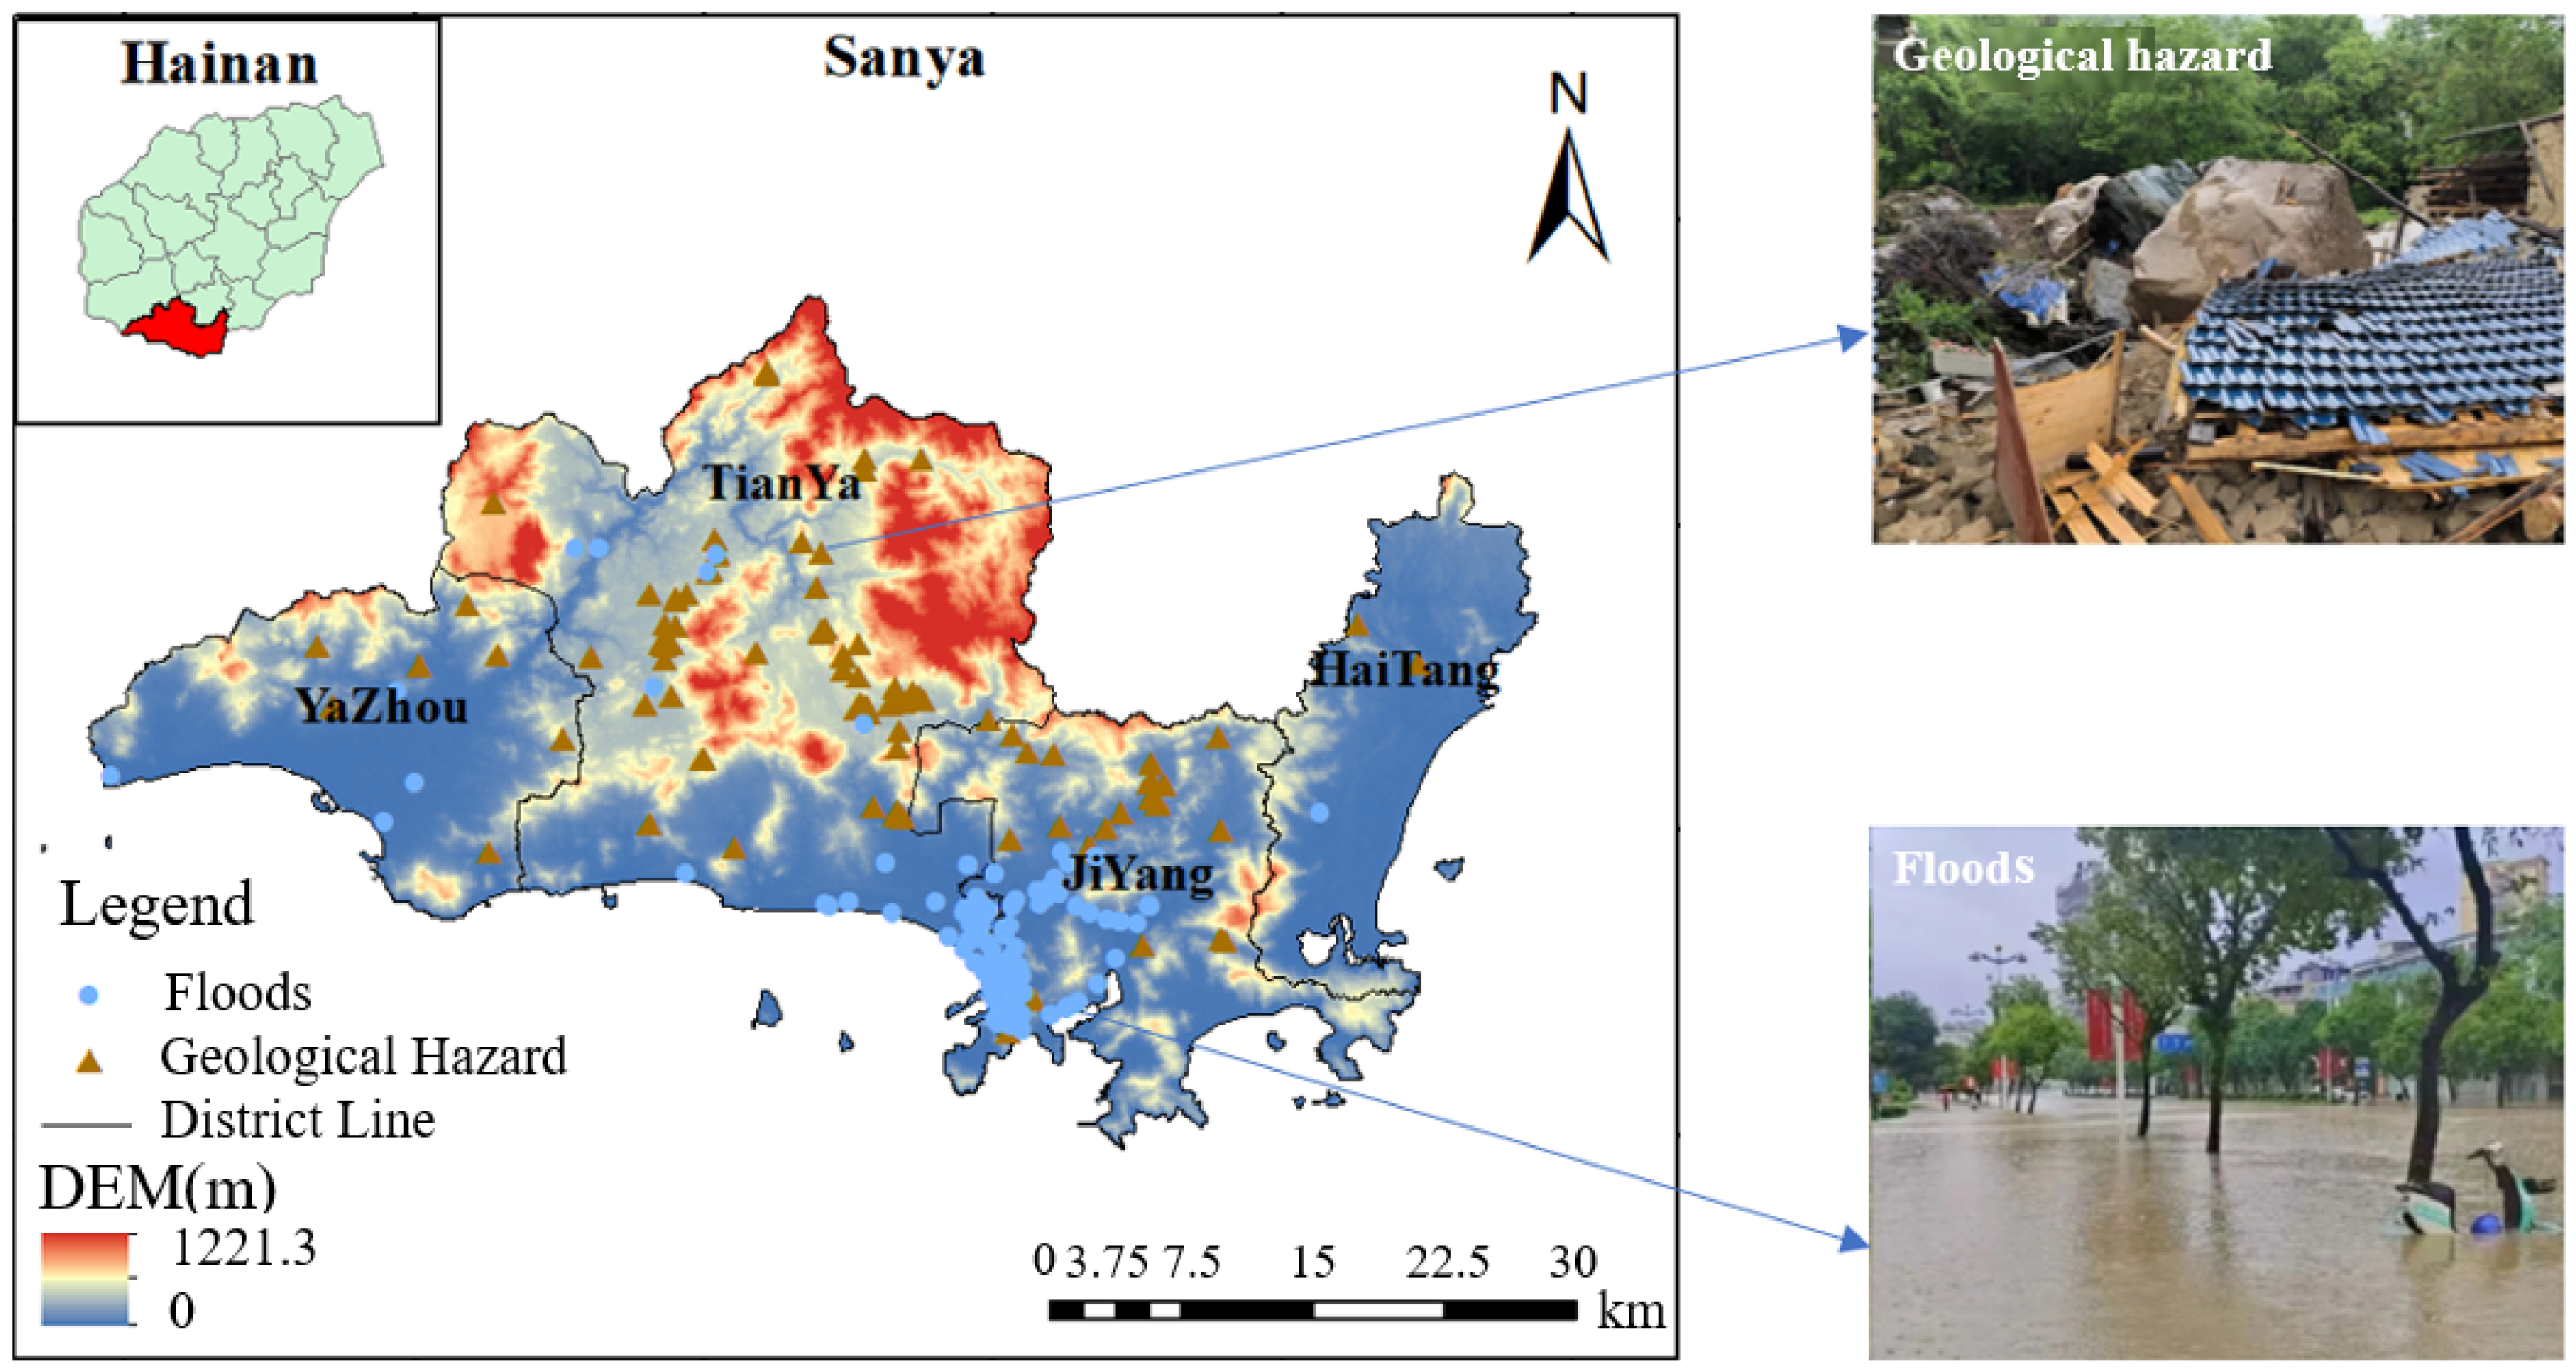
Figure 1. Basic information of the study area. The background displays the Digital Elevation Model (DEM) with elevation units in meters. Insets show the geographical location of Sanya within Hainan Province, with field photographs of typical geological hazard and flood disaster scenes on the right.
Remotesensing 18 02945 g001
Figure 2. Spatial distribution of candidate emergency shelter sites.
Remotesensing 18 02945 g002
Figure 3. Overall research framework for shelter site-selection under flood-landslide compound hazards. The triple arrows denote the transmission and output of intermediate results between research modules. Abbreviations: OD, origin-destination; IDW, inverse distance weighting; G2SFCA, two-step floating catchment area method; MOGOW, multi-objective grey wolf optimizer.
Remotesensing 18 02945 g003
Figure 4. Spatial distribution maps of 14 conditioning factors for disaster susceptibility assessment, including topographic, hydrological, geological, soil, vegetation, meteorological and land cover variables. (Row 1): (a) Elevation (m), (b) Slope (°), (c) Aspect; (Row 2): (d) TWI, (e) Surface curvature, (f) Distance to faults (m); (Row 3): (g) Engineering rock mass type, (h) MAP (mm), (i) NDVI; (Row 4): (j) SPI, (k) Soil type, (l) Distance to rivers (m); (Row 5): (m) Land cover type, (n) Distance to roads (m). Black dots denote historical geological hazard locations; blue dots represent recorded flood disaster points; all spatial layers adopt a unified projected coordinate system for geographic analysis.
Remotesensing 18 02945 g004aRemotesensing 18 02945 g004b
Figure 5. Pearson correlation matrix and factor importance ranking of conditioning factors for hazard susceptibility modeling. (a) Correlation matrix of influencing factors for geological hazard susceptibility. (b) Correlation matrix of influencing factors for flood hazard susceptibility. (c) Random forest-based importance ranking of conditioning factors for geological hazard modeling. (d) Random forest-based importance ranking of conditioning factors for flood hazard modeling. The color gradient in the correlation matrices represents the magnitude of Pearson correlation coefficients ranging from −1 to 1.
Remotesensing 18 02945 g005
Figure 6. The ROC curves and spatial hazard distribution maps of geological and flood hazard susceptibility models. (a) Training and test ROC curves for the geological hazard random forest model. (b) Spatial distribution of geological hazard susceptibility levels across Sanya City. (c) Training and test ROC curves for the flood hazard random forest model. (d) Spatial distribution of flood hazard susceptibility levels across Sanya City. The susceptibility is divided into five grades: very low, low, medium, high, and very high hazard. TPR represents the true positive rate, and FPR denotes the false positive rate.
Remotesensing 18 02945 g006
Figure 7. Spatial distribution of comprehensive hazard index for geological-flood compound disasters. The color legend corresponds to five hazard levels ranging from very low to very high, and the scale bar indicates the geographic distance in kilometers, showing the spatial variation in compound disaster hazard across the whole study area.
Remotesensing 18 02945 g007
Figure 8. Spatial distribution of permanent population and evacuation demand points. (a) Population distribution of Sanya City. (b) Spatial distribution of evacuation demand points of Sanya City.
Remotesensing 18 02945 g008
Figure 9. Spatial evacuation accessibility zoning for emergency shelter sites under different evacuation time scenarios. (a) Evacuation accessibility zoning under the 0.5 h evacuation threshold. (b) Evacuation accessibility zoning under the 1 h evacuation threshold. (c) Evacuation accessibility zoning under the 1.5 h evacuation threshold. (d) Evacuation accessibility zoning under the 2 h evacuation threshold.
Remotesensing 18 02945 g009
Figure 10. Evacuation population status in the study area during different time periods. (a) Evacuation population statistics for the 0.5 h scenario. (b) Evacuation population statistics for the 1 h scenario. (c) Evacuation population statistics for the 1.5 h scenario. (d) Evacuation population statistics for the 2 h scenario. The green, red, orange, and cyan dashed lines in subplots (ad) respectively illustrate the changing trends in the proportion of the population requiring refuge in Sanya City across different accessibility levels under each evacuation-time scenario.
Remotesensing 18 02945 g010
Figure 11. Accessibility score of emergency shelter sites.
Remotesensing 18 02945 g011
Figure 12. Score assessment of safety evaluation indicators.
Remotesensing 18 02945 g012
Figure 13. Frequency distribution of candidate emergency shelter sites grouped by comprehensive suitability scores. The horizontal axis represents the suitability score, and the vertical axis indicates the number of candidate shelter sites within each score interval. Green bars indicate the number of candidate emergency shelter sites corresponding to each suitability-score value, and the blue bar represents the total number of all candidate emergency shelter sites. Sites with a suitability score lower than 12 were excluded from the subsequent layout optimization model.
Remotesensing 18 02945 g013
Figure 14. The HV index changes under different iterations.
Remotesensing 18 02945 g014
Figure 15. Pareto solutions of the MOGWO. Each blue dot corresponds to a feasible site selection scheme under the constraints of shelter capacity and unique refuge allocation.
Remotesensing 18 02945 g015
Figure 16. Comprehensive evaluation of non-inferior solutions.
Remotesensing 18 02945 g016
Figure 17. Basic information of relatively optimal emergency shelter sites.
Remotesensing 18 02945 g017
Figure 18. Relatively optimal site selection and allocation of refuge demand points.
Remotesensing 18 02945 g018
Table 1. Indicator system for hazard assessment of geological and flood disasters.
Disaster TypesDisaster System ElementsIndicator Types
Geological hazardHazard-causing factorsMAP, Distance to roads, Distance to faults
Hazard-predisposing factorsElevation, Slope, Aspect, Surface curvature, TWI, NDVI, Land cover, Engineering rock mass, Soil types
FloodsHazard-causing factorsMAP, Distance to rivers
Hazard-predisposing factorsElevation, Slope, Surface curvature, Soil types, SPI, NDVI, TWI, Land cover
Note: MAP refers to Mean Annual Precipitation, TWI refers to Topographic Wetness Index, NDVI refers to Normalized Difference Vegetation Index, and SPI refers to Standardized Precipitation Index.
Table 2. Disaster coupling excitation effect matrix.
Disaster Triggering RelationshipTriggered Disasters
EarthquakeTorrential RainFloodsGeological HazardTsunamiTyphoon
Triggering disastersEarthquake-01220
Torrential rain0-2200
Floods00-200
Geological hazard001-00
Tsunami0020-0
Typhoon02220-
Note: Rows represent the initiating hazards, and columns represent the potential secondary hazards; The symbol “-” indicates self-relations with undefined coupling relationships.
Table 3. Assignment rules of disaster coupling excitation correction multipliers.
Coupling Excitation ValueInduction LevelPrimary Hazard GradeHazard Intensity Correction Multiplier
0No inductionAll grades1.0
1Low induction
probability
1–21.1
3–41.2
51.3
2High induction
probability
1–21.3
3–41.4
51.5
Note: Coupling excitation denotes the triggering level, where 0 represents no induction, 1 represents low induction probability, and 2 represents high induction probability. The primary hazard grade ranges from 1 to 5. The hazard intensity correction multiplier acts as a dimensionless coefficient.
Table 4. Safety evaluation indicator system for emergency shelter candidate sites.
No.Evaluation IndexClassification and Scoring
1The geological-flood compound disaster
hazard
  • Extremely low: 5;
  • Low: 4;
  • Medium: 3;
  • High: 2;
  • Extremely high: 1;
2Distance to faults
  • >500 m: 3;
  • 100~500 m: 2;
  • <100 m: 1;
3Distance to hazard sites
  • >100 m: 3;
  • 50~100 m: 2;
  • <50 m: 1;
4Distance to gas stations and chemical plants
  • >100 m: 3;
  • 50~100 m: 2;
  • <50 m: 1;
Note: All distance units in this table are meters (m). The score represents the safety level of emergency shelter sites; a higher score corresponds to better safety conditions for shelter construction.
Table 5. Parameter settings of the random forest model.
ParameterGeological DisastersFlood Disasters
n_estimators500100
max_depth155
min_samples_leaf11
min_samples_split210
max_features55
criterion----
min_impurity_decrease----
Note: n_estimators: number of decision trees; max_depth: maximum depth of each tree; min_samples_leaf: minimum number of samples required at a leaf node; min_samples_split: minimum number of samples required to split an internal node; max_features: number of features considered for splitting; criterion: split quality function; min_impurity_decrease: minimum impurity decrease for a split. Symbol “--“ denotes the default value adopted in the model. All parameters are dimensionless.
Table 6. Statistics of extreme solutions from the Pareto front.
Extreme SolutionsPer Capita Evacuation Distance (m)Number of
Shelters (Site)
Per Capita
Effective Shelter Area (m2)
Minimum total
Evacuation time
9.21687.66
Minimum total
number of shelters
11.10152.03
Minimum total emergency shelter sites area12.04212.18
Note: All listed solutions meet the planning constraint of per capita effective shelter area ≥ 2 m2.
Disclaimer/Publisher’s Note: The statements, opinions and data contained in all publications are solely those of the individual author(s) and contributor(s) and not of MDPI and/or the editor(s). MDPI and/or the editor(s) disclaim responsibility for any injury to people or property resulting from any ideas, methods, instructions or products referred to in the content.