Article

Applicability Assessment of Lutan-1 and Sentinel-1 for Potential Landslide Identification in Densely Vegetated Mountainous Areas: A Case Study of Hanyuan County, Sichuan Province, China


1
State Key Laboratory of Geohazard Prevention and Geoenvironment Protection, Chengdu University of Technology, Chengdu 610059, China
2
Sichuan Institute of Land and Space Ecological Restoration and Geological Hazard Prevention, Chengdu 610081, China
3
China Railway Eryuan Engineering Group Co., Ltd., Chengdu 610031, China
4
Guangxi Transportation Design Group Co., Ltd., Nanning 530029, China
*
Author to whom correspondence should be addressed.
Remote Sens. 2026, 18(17), 3053; https://doi.org/10.3390/rs18173053
Submission received: 23 July 2026 / Revised: 2 September 2026 / Accepted: 4 September 2026 / Published: 7 September 2026

Highlights

What are the main findings?
  • Under comparable geometric visibility, Lutan-1 maintained higher coherence and a greater proportion of valid grid cells, identifying about 4.4 times more potential landslides than Sentinel-1.
  • Both datasets captured negative cumulative LOS displacement in representative landslides, but Lutan-1 showed 2–3 times larger amplitudes at strongly deforming points.
What are the implications of the main findings?
  • In densely vegetated mountainous areas, Sentinel-1 alone may preferentially detect larger landslides or stronger deformation signals and miss weaker deformation on vegetated slopes.
  • Lutan-1 and Sentinel-1 are complementary, with Lutan-1 improving spatial mapping and Sentinel-1 supporting time-series verification.

Abstract

In densely vegetated and topographically complex mountainous areas, the applicability of SAR data for potential landslide hazard identification depends not only on whether slopes are visible to the radar, but also on whether stable interferometric coherence can be preserved under vegetation and terrain constraints. To clarify the applicability differences between L-band Lutan-1 and C-band Sentinel-1 in such environments, this study focused on Hanyuan County, Sichuan Province, China. Ascending and descending SAR images acquired by the two satellite systems from 2024 to 2025 were processed using stacking-based Interferometric Synthetic Aperture Radar (Stacking-InSAR) and Small Baseline Subset Interferometric Synthetic Aperture Radar (SBAS-InSAR) to extract regional deformation anomalies and time-series deformation characteristics of representative landslides. DEM, LiDAR, optical imagery, fractional vegetation cover (FVC) derived from Sentinel-2, and field investigation data were further integrated to establish a comparative framework linking geometric visibility, interferometric coherence, and landslide identification results. The results show that both Lutan-1 and Sentinel-1 provided favorable geometric observation conditions after combining ascending and descending tracks, with joint visibility proportions of 98.48% and 97.76%, respectively, indicating limited differences in geometric coverage within the study area. However, at a unified grid scale, the mean coherence and valid grid-cell proportion of Lutan-1 reached 0.564 and 72.49%, respectively, substantially higher than those of Sentinel-1, which were 0.320 and 24.26%. As FVC increased, coherence decreased for both datasets, but Lutan-1 maintained higher coherence in densely vegetated areas, suggesting stronger adaptability to vegetation-induced decorrelation. Based on integrated interpretation of multi-source remote sensing data, 77 potential landslide hazards were identified in the study area, including 74 detected by Lutan-1, 17 detected by Sentinel-1, and 14 jointly detected by both datasets. Comparisons of representative landslides further show that Lutan-1 provided a higher density of valid deformation points in densely vegetated and small-scale landslides, with deformation patterns corresponding well to slope geomorphic boundaries and local deformation zones. Sentinel-1, with its higher temporal sampling density, can provide complementary information for time-series verification and multi-source cross-validation of key landslides. These results indicate that Lutan-1 is more suitable for spatial identification of potential landslide hazards in densely vegetated, topographically complex mountainous areas, while the joint use of Lutan-1 and Sentinel-1 can better balance landslide identification detail and time-series monitoring continuity.

1. Introduction

Landslides are among the most common and destructive geohazards in mountainous regions, posing long-term threats to regional ecological security, major engineering projects, and the safety of local communities. In southwestern China, strong terrain relief, complex geological structures, and deeply incised valleys result in potential landslide hazards that are widely distributed, difficult to detect, and prone to sudden failure. Conventional field investigations are therefore limited by terrain accessibility, observation blind spots, and the difficulty of repeated surveys [1,2]. Interferometric Synthetic Aperture Radar (InSAR), which enables all-weather, day-and-night, wide-area, and high-precision measurements of surface deformation, has been widely applied in recent years to the identification, monitoring, and risk assessment of active landslides in southwestern China, particularly as multi-source and multi-band SAR data have become increasingly available [1,3,4,5,6,7,8,9].
However, the effective observation capability of InSAR remains constrained by dense vegetation cover and strong topographic relief. In complex mountainous terrain, layover, shadow, and other geometric distortions can prevent some slope surfaces from being effectively observed by radar, thereby reducing the spatial continuity of deformation information [10,11]. At the same time, vegetation canopy structure, seasonal growth, and changes in surface scattering mechanisms can induce temporal decorrelation, lower interferometric coherence, and even obscure the weak deformation signals of slow-moving landslides [12]. Studies on forest-covered hidden landslides have also shown that dense vegetation not only weakens the direct interpretation of landslide boundaries, cracks, and scarps from optical imagery, but also limits deformation anomaly extraction by reducing InSAR coherence [13]. Therefore, in mountainous areas with dense vegetation cover and strong topographic relief, there is still a need to systematically evaluate the effective observation conditions of SAR data at different wavelengths and their influence on landslide identification results.
Sentinel-1 is one of the most widely used C-band SAR data sources for InSAR-based landslide monitoring, owing to its wide coverage, short revisit cycle, and stable time-series acquisitions. C-band radar is generally sensitive to shallow surface scattering and subtle slope deformation, providing a strong basis for deformation monitoring over bare ground, urban areas, and regions with low vegetation cover. However, in densely vegetated mountainous areas, the shorter wavelength of C-band data makes it more susceptible to volume scattering from vegetation and temporal decorrelation, resulting in sparse valid deformation points or insufficient spatial continuity [14,15,16]. In contrast, L-band SAR has a longer wavelength and generally provides stronger penetration capability and better interferometric coherence stability in vegetated areas, which helps preserve more continuous surface deformation information [14,15,16,17,18]. Therefore, C-band and L-band SAR data are complementary in terms of spatial coverage, deformation sensitivity, and vegetation adaptability, providing a basis for multi-band data comparison in potential landslide hazard identification in complex mountainous areas [15,16,18,19,20].
Lutan-1 is China’s first L-band SAR satellite system designed specifically for interferometric deformation measurement, and it features a twin-satellite formation and multi-mode imaging capability [21,22]. In-orbit testing and system performance studies have confirmed its technical foundation for interferometric measurement and surface deformation monitoring [21,23,24,25]. To date, Lutan-1 data have been applied to mine deformation monitoring, coseismic deformation inversion, geohazard detection, and landslide identification, preliminarily demonstrating its capability for deformation detection in complex surface environments [26,27,28,29,30,31,32,33]. In particular, a recent comparison between Lutan-1 and Sentinel-1 for landslide identification in vegetation-covered mountainous areas showed that L-band data have promising potential for spatial characterization of vegetation-covered and small landslides [30]. However, existing studies have mostly focused on the identification performance of typical landslides or local areas, and quantitative analyses within a unified framework of the relationships among geometric visibility, interferometric coherence, vegetation response, and landslide identification results for different SAR datasets in the same study area remain limited [34].
Hanyuan County, Sichuan Province, China, is located in the transition zone between the Qinghai–Tibet Plateau and the Sichuan Basin, where complex geological conditions contribute to high geohazard susceptibility. On 21 August 2020, prolonged heavy rainfall triggered a large-scale landslide in Zhonghai Village, Fuquan Town, Hanyuan County, damaging houses, interrupting provincial road traffic, and leaving eight people missing and one injured [35,36]. The combination of dense vegetation cover, strong topographic relief, and frequent landslide activity makes Hanyuan County an area with a strong demand for potential landslide hazard identification and monitoring. It also provides a representative setting for comparing the applicability of Lutan-1 and Sentinel-1 in landslide identification in complex mountainous terrain.
Motivated by these considerations, this study focuses on Hanyuan County, Sichuan Province, China, and uses ascending and descending SAR images acquired by Lutan-1 and Sentinel-1 from 2024 to 2025, together with optical imagery, DEM, and LiDAR data, to identify potential landslide hazards. Under a consistent processing workflow and unified spatial statistical units, we compare the observation geometry, terrain visibility, interferometric coherence stability, and valid grid-cell proportion of the two SAR datasets, and analyze their differences in effective observation capability under dense vegetation cover. We further link these sensor-specific observation differences with landslide identification results, comparing the two datasets in terms of the number of identified landslides, the density of valid deformation points, and their ability to delineate landslide boundaries. This study aims to clarify the applicability differences between L-band Lutan-1 and C-band Sentinel-1 for potential landslide hazard identification in densely vegetated and topographically complex mountainous areas, from the perspective of the relationship between effective observation capability and landslide identification outcomes. The results provide a reference for SAR data-source selection and multi-source collaborative applications in geohazard identification in similar regions.

2. Study Area

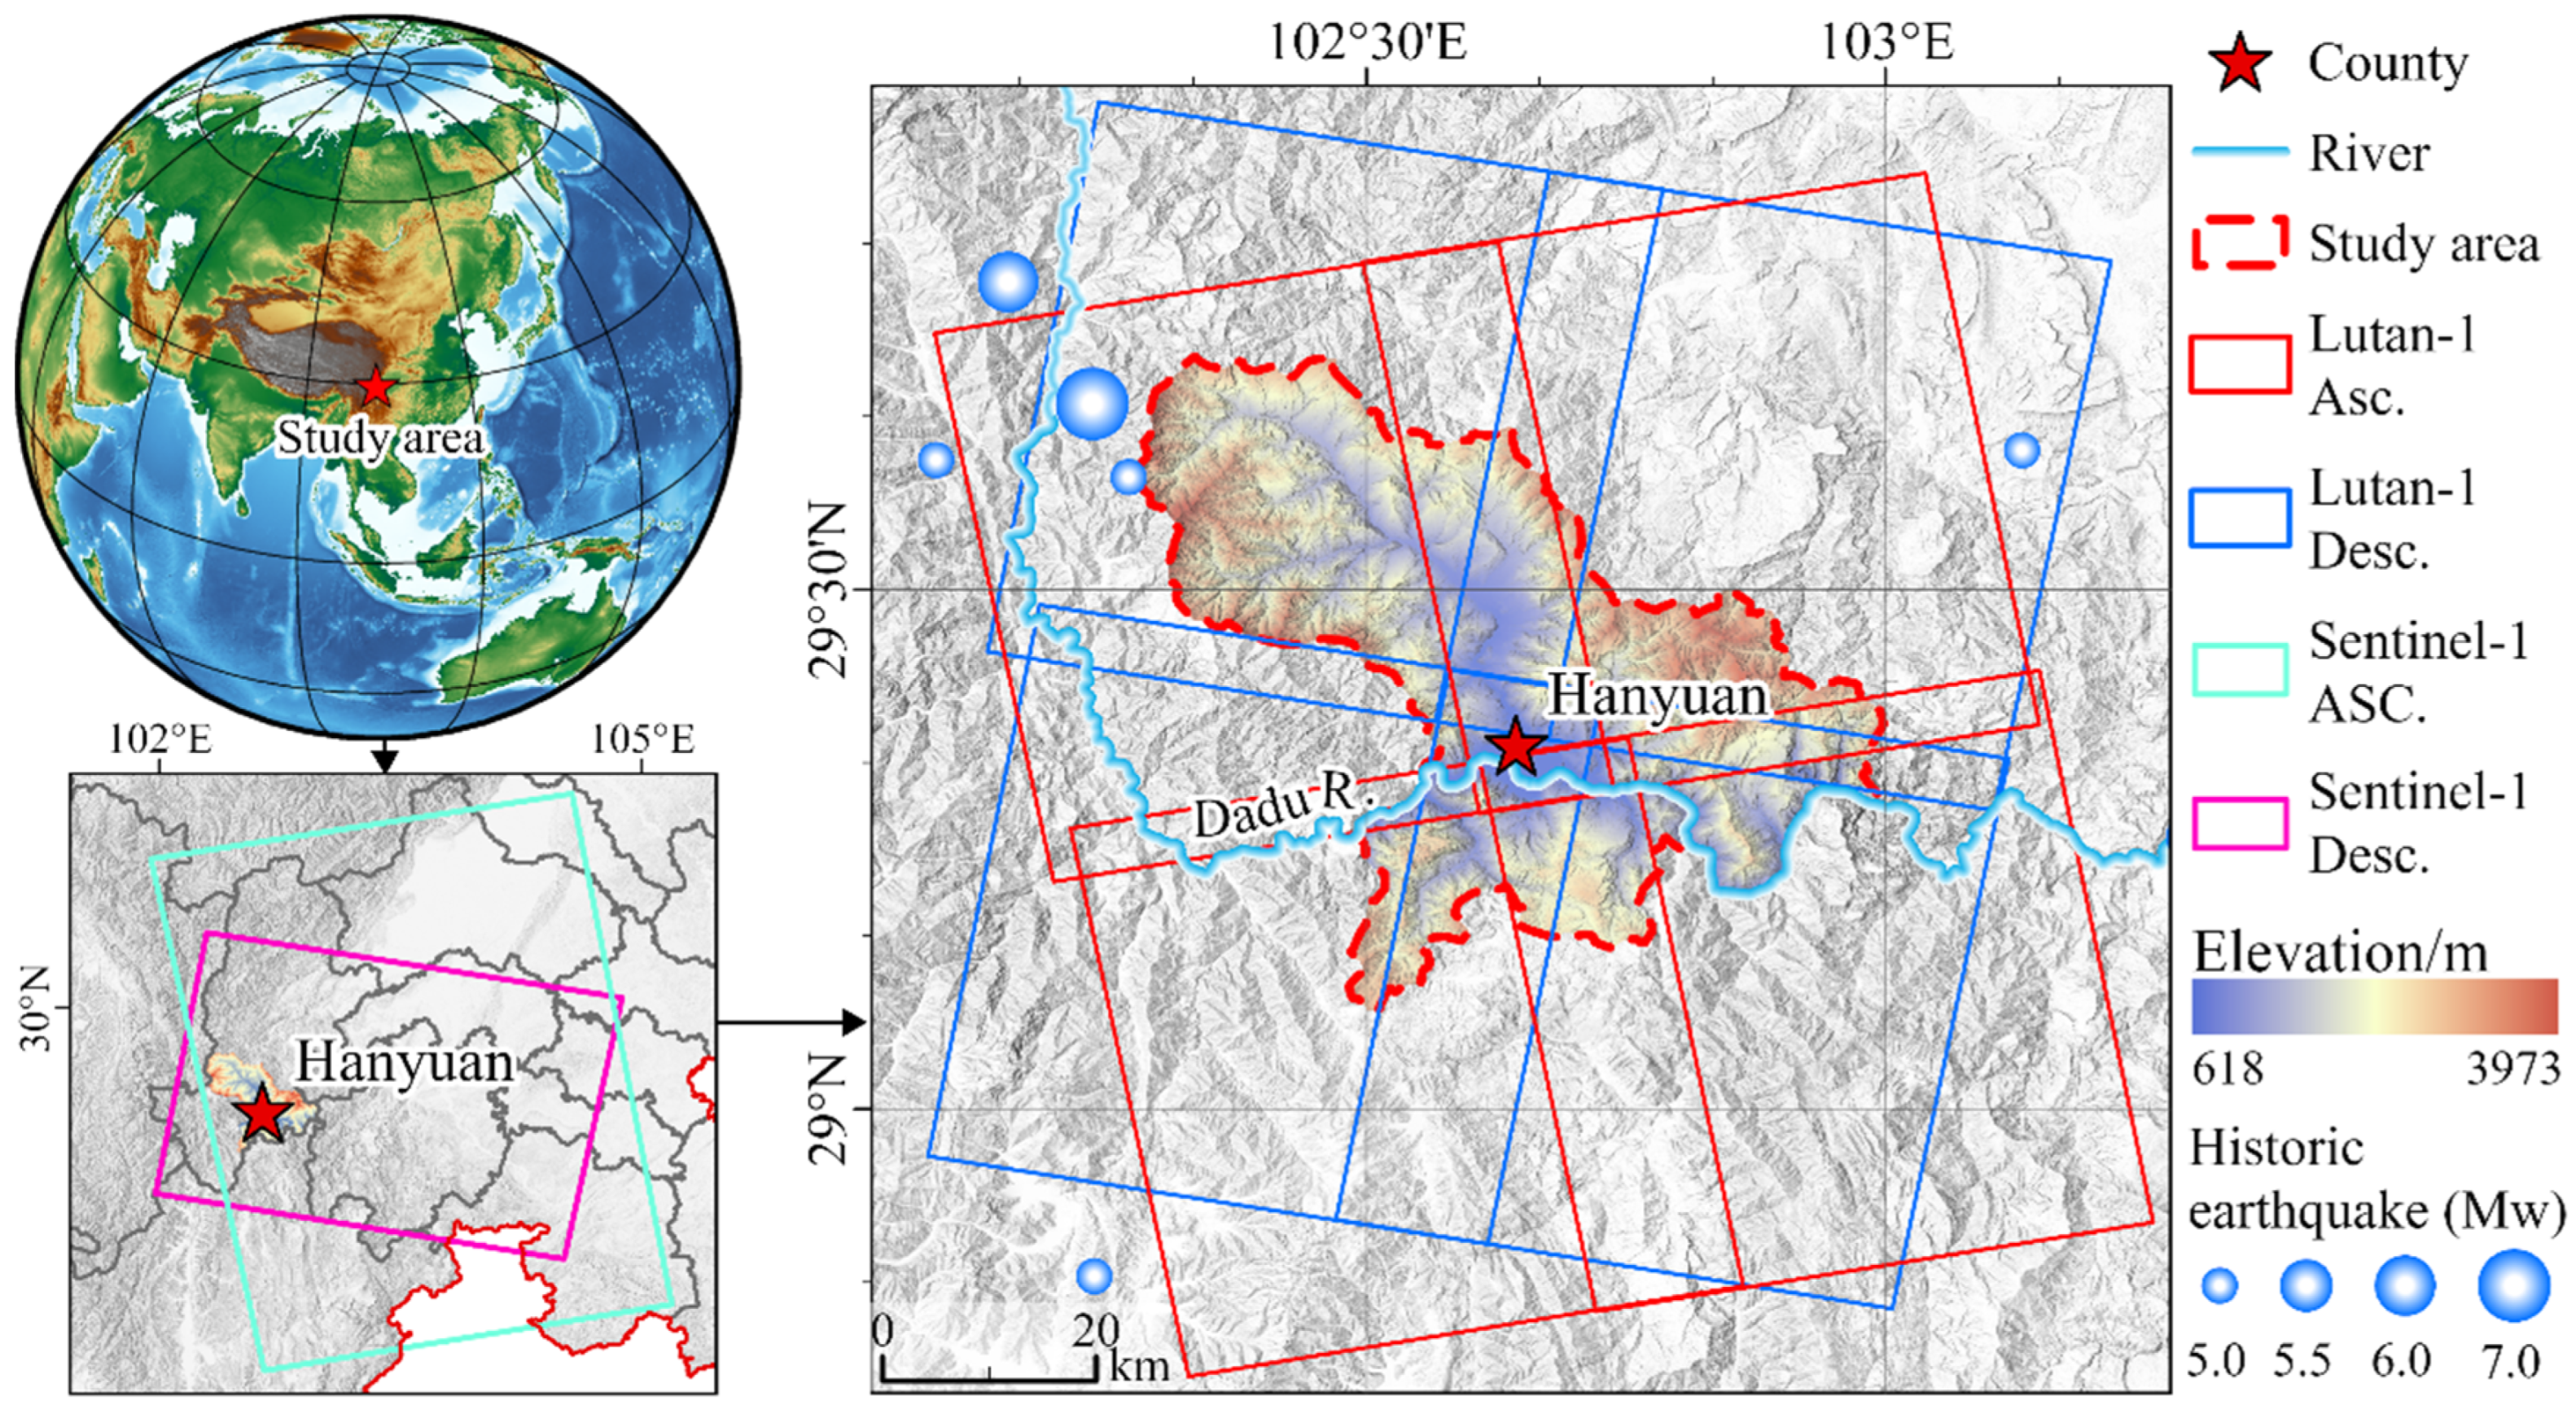
The study area is located in western Sichuan Province, China, within the transition zone between the eastern margin of the Qinghai–Tibet Plateau and the western margin of the Sichuan Basin. It covers an area of approximately 2300 km2, and its location is shown in Figure 1. The terrain is higher in the northwest and lower in the southeast, with elevations ranging from 550 m to 4020 m and a maximum relief of approximately 3400 m. The area has a subtropical monsoon climate influenced by both the southwest and southeast monsoons. Rainfall is mainly concentrated from May to October, with a mean annual precipitation of approximately 780 mm. Geomorphologically, the study area is surrounded by mountains, with river valleys occupying the central part. The vertical climatic differentiation is distinct, with lower temperatures in high mountain areas and relatively hot conditions in the valley regions. The study area belongs to the Dadu River system. As the largest tributary of the Minjiang River, the Dadu River has a total length of 1062 km, of which approximately 75.6 km flows through the study area.
Geologically, Hanyuan County is located in the northern part of the Sichuan–Yunnan north–south tectonic belt, where geological structures are complex, faults are densely distributed, and seismic activity is frequent. Based on the United States Geological Survey (USGS) earthquake catalog, 26 earthquake events with magnitudes of Mw ≥ 5.0 were collected in and around the study area. Among them, earthquakes with magnitudes of Mw ≥ 6.0 mainly included the 1935 eastern Sichuan earthquake, the 1952 Xichang earthquake, the 1955 Kangding earthquake, the 2013 Lushan earthquake, and the 2022 Luding earthquake.
Overall, landslide hazards in Hanyuan County are widely distributed and highly concealed, showing typical geohazard development characteristics of complex alpine-gorge mountainous regions. Regional studies and investigations of representative landslides in Hanyuan County have documented persistent slope deformation, rainfall-related instability, and local reactivation [35,36]. Together with the county’s dense vegetation, pronounced relief, and deeply incised terrain, these characteristics provide a representative setting for the wide-area identification of potential landslides and comparative evaluation of Lutan-1 and Sentinel-1.

3. Data and Methods

3.1. Data

3.1.1. SAR Imagery

In this study, L-band Lutan-1 SAR images acquired from 2024 to 2025 were collected for potential landslide hazard identification in the study area, and contemporaneous Sentinel-1 data were also used for comparison, as shown in Figure 1. Because the single-scene swath width of Lutan-1 is relatively limited, multiple Lutan-1 scenes were mosaicked to achieve complete coverage of the study area. This mosaicking procedure was used primarily to ensure spatial completeness for wide-area landslide identification. To improve the comparability of results across different coverage zones, all Lutan-1 scenes were processed in GAMMA using identical workflows and parameter settings [37,38].
The Lutan-1 satellite operates at a wavelength of 23.5 cm and a frequency of 1.26 GHz, and is equipped with twin-satellite formation capability, L-band interferometric measurement, and multi-mode imaging functions [21,22]. Its primary orbit is a quasi-sun-synchronous orbit at an altitude of about 600 km above the Earth’s surface. A total of 81 Lutan-1 scenes were used in this study, including 35 ascending scenes acquired from March 2024 to January 2025, with an average incidence angle of approximately 34.02°, and 46 descending scenes acquired from January 2024 to January 2025, with an average incidence angle of approximately 37.35°. The spatial resolution of the Lutan-1 imagery is 3 m × 3 m, and the coverage of a single scene is approximately 30 km × 60 km. Detailed parameters of the Lutan-1 imagery used in this study are listed in Table 1.
Sentinel-1 is a C-band SAR satellite mission of the European Space Agency (ESA), launched in October 2014 [39]. The Sentinel-1 data used in this study were acquired in Single Look Complex (SLC) format from January 2024 to January 2025, including 29 ascending scenes and 30 descending scenes. The images were acquired in Interferometric Wide (IW) swath mode with VV + VH polarization, and have a spatial resolution of approximately 5 m × 20 m. Detailed information on the satellite data is provided in Table 1.

3.1.2. Optical Satellite Imagery

Sentinel-2 multispectral imagery [40] and high-resolution optical imagery from Tianditu were used as auxiliary data in this study. Sentinel-2 MSI Level-2A products acquired from 2024 to 2025 with cloud cover below 10% were selected. The red and near-infrared bands were used to calculate the Normalized Difference Vegetation Index (NDVI) and derive fractional vegetation cover (FVC), which was used to analyze the influence of vegetation cover on the coherence and identification performance of the two SAR datasets. Sentinel-2 imagery was not directly used for landslide boundary interpretation. High-resolution optical imagery from Tianditu was mainly used for interpreting landslide geomorphic features, delineating potential landslide boundaries, and conducting integrated interpretation with InSAR-derived deformation anomalies.

3.1.3. Other Auxiliary Data

In addition to SAR and optical imagery, this study also used auxiliary datasets including DEM, precise orbit products for Sentinel-1, water masks, and UAV LiDAR data.
During InSAR processing, SRTM DEM data were used in GAMMA. The SRTM DEM is a global digital elevation dataset acquired by the Shuttle Radar Topography Mission [41]. It was mainly used for topographic phase removal, image geocoding, and subsequent terrain factor analysis, providing basic topographic constraints for deformation extraction and landslide geomorphic interpretation in the study area. During Sentinel-1 processing, OPOD precise orbit data corresponding to the acquisition dates were also used to improve the accuracy of satellite orbit parameters and reduce the influence of orbit errors on co-registration, interferometric processing, and deformation inversion.
To reduce the influence of water bodies on coherence statistics and vegetation cover analysis, water areas within the study area were masked using OpenStreetMap (OSM) water data. OSM is an open collaborative geographic data source that has been widely used for extracting basic geographic features and spatial analysis [42]. Subsequent statistical analyses were conducted only over land areas. In addition, UAV LiDAR data were collected for representative landslide areas to obtain high-precision topographic information and identify micro-geomorphic features such as rear scarps, steep scarps, cracks, and deposits. These data were compared with InSAR-derived deformation anomalies and optical image interpretation results to support refined boundary delineation and validation of representative landslides.

3.2. Methodology

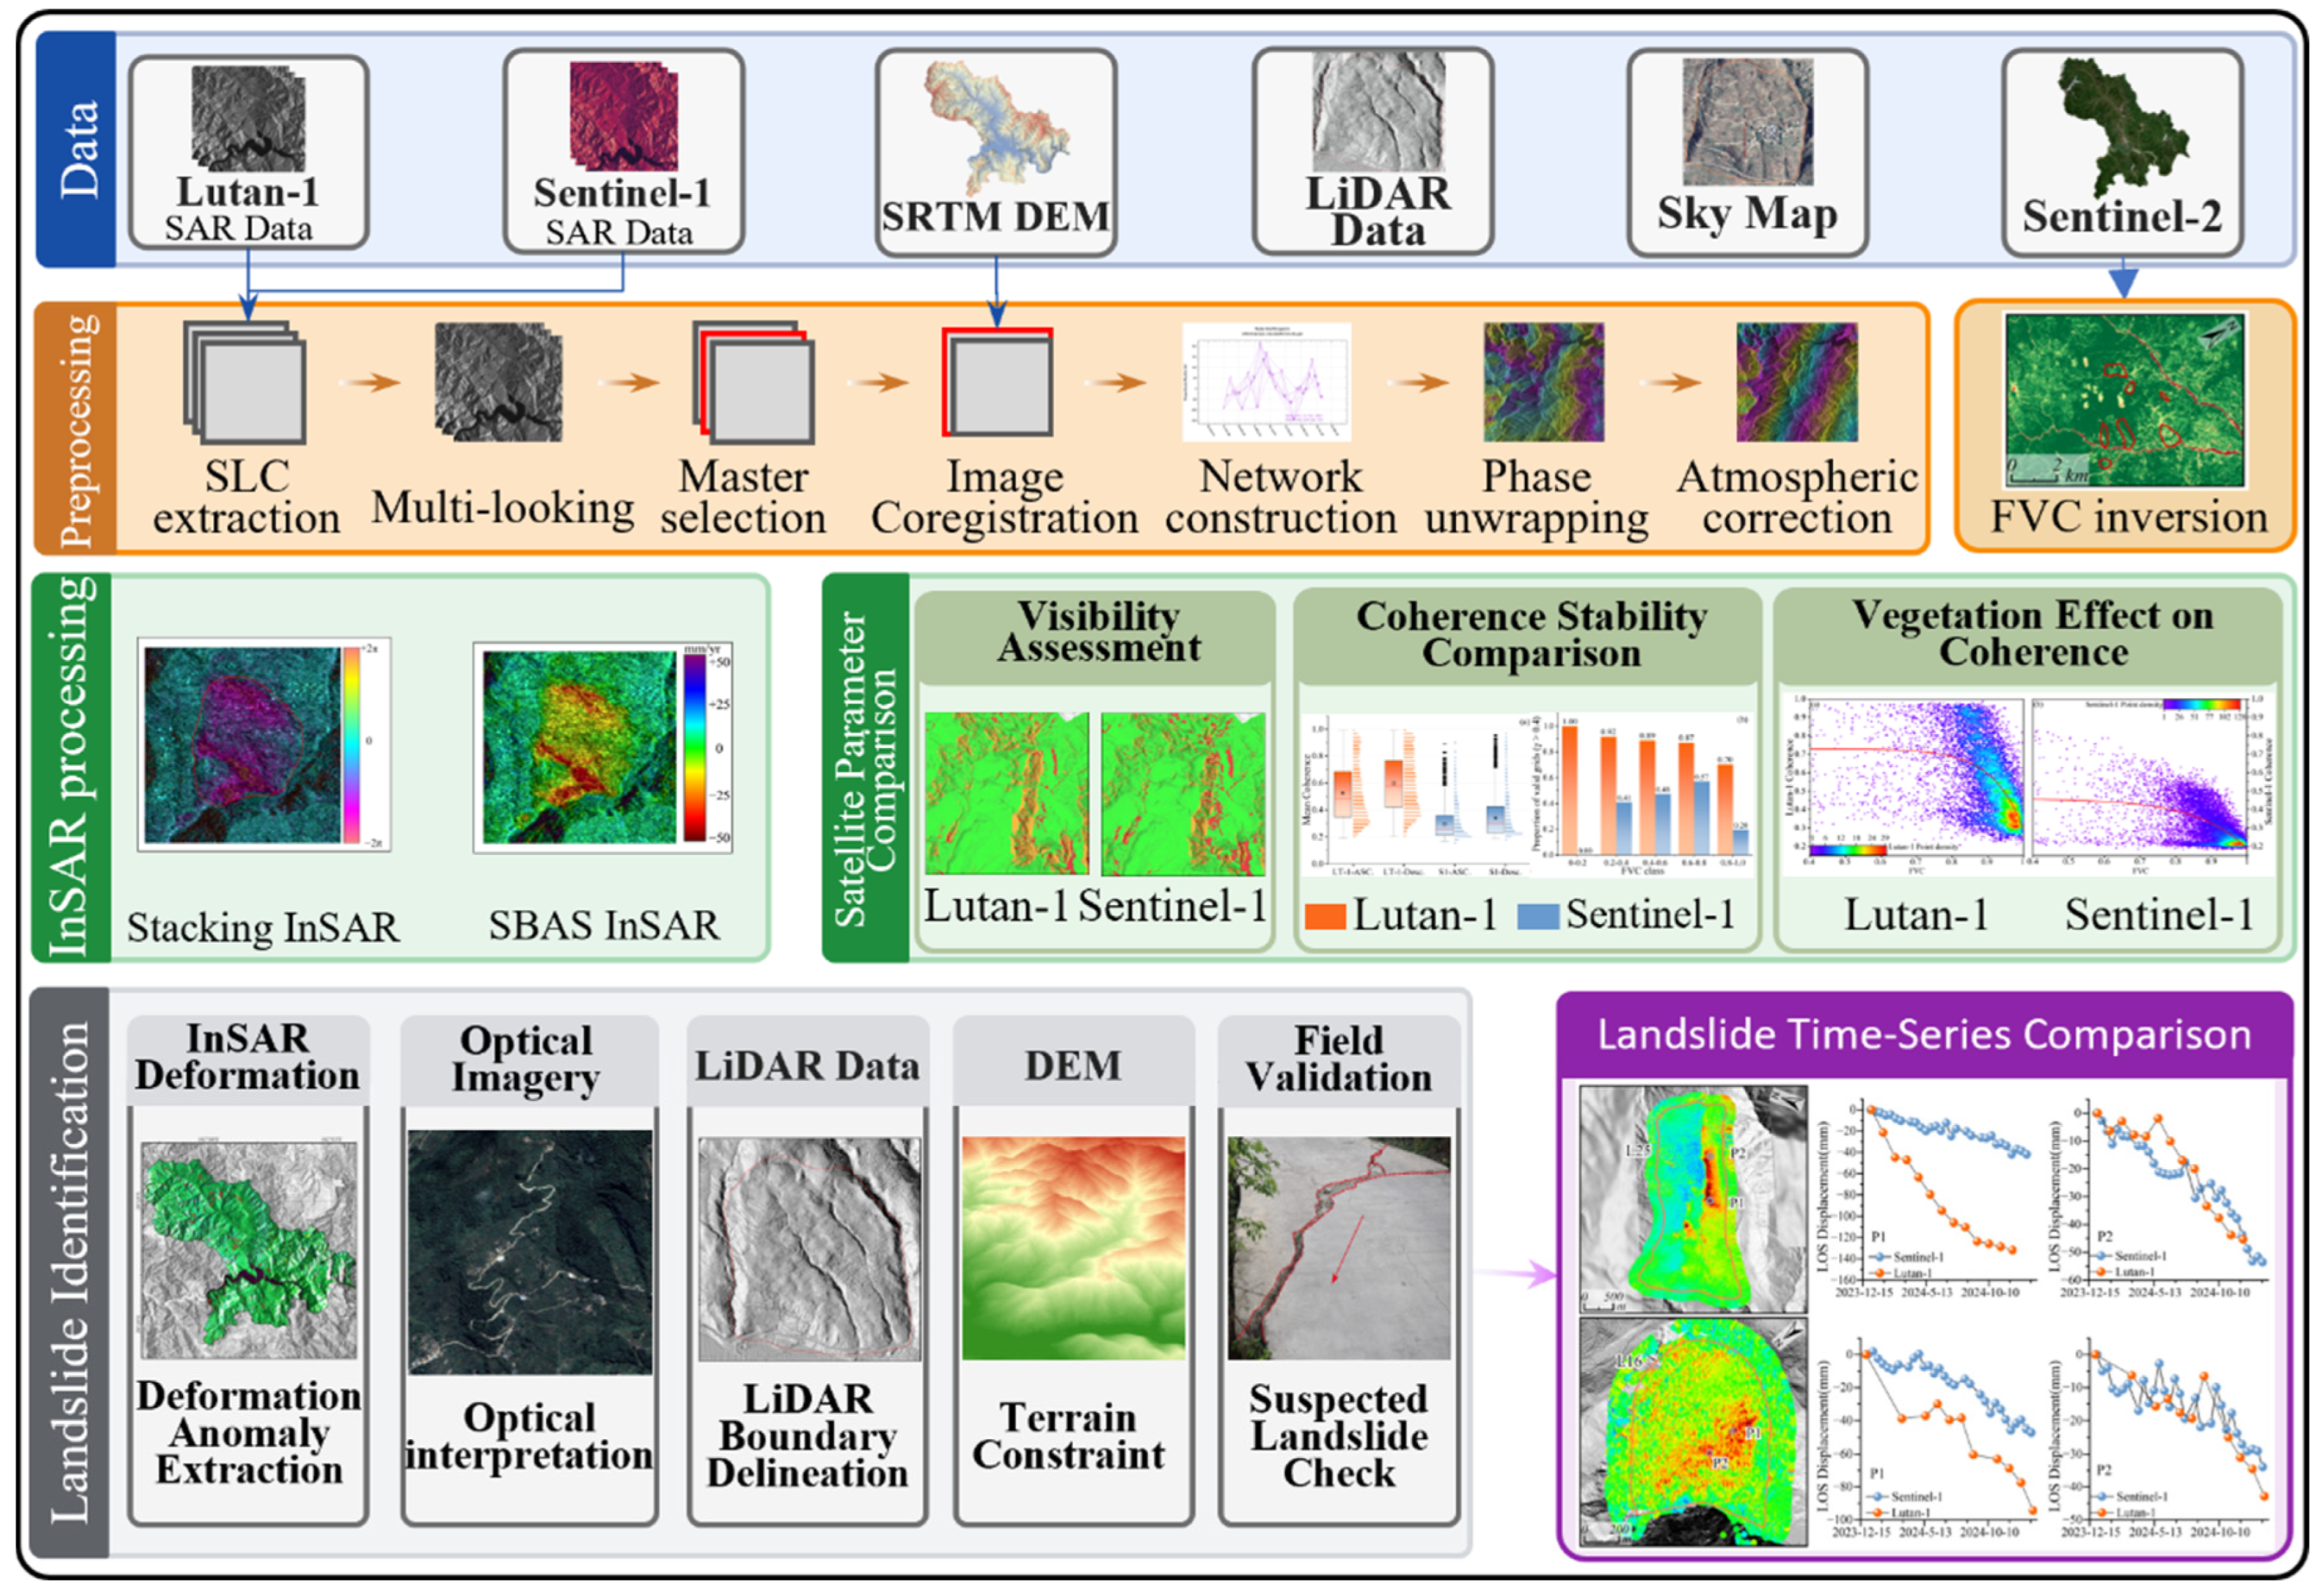
The overall technical workflow of this study is shown in Figure 2. It mainly includes multi-source data acquisition, data preprocessing, quantitative comparison of satellite parameters, integrated potential landslide identification, and time-series deformation comparison of representative landslides. First, ascending and descending SAR images from Lutan-1 and Sentinel-1 were collected, together with SRTM DEM, Sentinel-2 multispectral imagery, high-resolution optical imagery from Tianditu, UAV LiDAR data, and field investigation data, to build a multi-source dataset for the study area. Among these datasets, Lutan-1 and Sentinel-1 SAR images were used to extract InSAR-derived deformation information, Sentinel-2 imagery was used to retrieve FVC, SRTM DEM was used for terrain-related processing and topographic constraints, and optical imagery, LiDAR data, and field investigation data were used for integrated landslide identification and validation. During data preprocessing, the Lutan-1 and Sentinel-1 SAR datasets were processed through SLC extraction, multi-looking, master image selection, precise co-registration, interferometric network construction, phase unwrapping, and atmospheric model construction and correction.
On this basis, Stacking-InSAR was used to extract regional phase-change anomalies, and SBAS-InSAR was used to retrieve LOS deformation rates and time-series deformation information for representative landslides [5,43,44]. Potential landslides were then identified and delineated by integrating optical imagery, LiDAR-derived fine-scale geomorphic features, DEM-based topographic constraints, and field validation. Finally, representative landslides were selected for time-series deformation comparison between Lutan-1 and Sentinel-1, further evaluating the applicability differences in the two SAR datasets for potential landslide identification and monitoring in densely vegetated, topographically complex mountainous areas.

3.2.1. SAR Data Processing

In this study, ascending and descending Lutan-1 and Sentinel-1 SAR data were processed on the GAMMA platform using both Stacking-InSAR and SBAS-InSAR. Stacking-InSAR was used to obtain annual mean phase-change-rate maps for regional deformation-anomaly detection, whereas SBAS-InSAR was used to derive LOS deformation-rate maps and time-series deformation characteristics of representative landslides.
In the preprocessing stage, single-look complex (SLC) images were first extracted from the original SAR data. The Lutan-1 SAR data available for the study area were acquired in single-polarization HH mode, whereas the Sentinel-1 SAR data were acquired in dual-polarization VV + VH mode. Accordingly, the HH channel of Lutan-1 and the VV channel of Sentinel-1 were selected during data preparation for subsequent InSAR processing. The multi-looking factors were determined from the range and azimuth pixel spacings and incidence angle of each scene. After multi-looking, the Lutan-1 and Sentinel-1 data had ground pixel scales of approximately 6 m and 20 m, respectively. These settings reduced speckle noise and improved phase quality while retaining the spatial detail required for landslide identification. [45,46,47,48]. An acquisition with stable image quality and complete spatial coverage was selected as the reference master image, and the mapping relationship between radar coordinates and geographic coordinates was established using the SRTM DEM [41]. After being resampled into the radar geometry of the master image, the DEM was used for topographic phase simulation, layover and shadow identification, and geocoding. All images in the stack were then precisely co-registered to the master image.
During interferometric processing, we constructed a fully connected interferometric network to make full use of the multi-temporal observations. After removing the topographic phase, the differential interferograms were processed using the two-dimensional adaptive interferogram filter implemented in the GAMMA mk_adf_2d module. The filter estimates the local power spectral density and interferometric correlation coefficient, and adjusts the spectral-filter exponent according to the local coherence. This approach corresponds to a coherence-adaptive modification of the Goldstein interferogram filter [49,50,51]. Subsequently, a quality-control procedure implemented in Python 3.6.9 was applied to the filtered differential interferograms. The mean coherence of each interferometric pair was calculated, and pairs with a mean coherence below 0.3 were excluded from subsequent processing. The retained interferometric pairs were then used for subsequent Stacking-InSAR estimation and SBAS-InSAR inversion. Phase unwrapping was performed in radar geometry using the minimum cost flow (MCF) algorithm [52]. The phase reference point was selected from a stable, high-coherence area away from landslide deformation zones and water bodies. To reduce the influence of topography-correlated atmospheric delay, we corrected height-dependent phase errors in the unwrapped phase before stacking estimation.
For Stacking-InSAR, the corrected unwrapped phases were weighted by the temporal interval of each interferometric pair and stacked to estimate the annual mean phase-change rate. The minimum number of valid interferograms was set to 10. After geocoding, the resulting phase-rate maps were used to identify regional-scale phase-change anomalies, providing a basis for the preliminary detection and spatial localization of suspected landslide hazard areas [5,43].
For SBAS-InSAR, stable candidate points were first selected from the quality-controlled unwrapped interferograms by considering coherence, phase standard deviation, layover and shadow masks, and water masks. Time-series inversion was then performed using a multi-baseline weighted least-squares model, in which singular value decomposition was used to solve the cumulative deformation at each acquisition epoch. A deformation-rate smoothing constraint was introduced to suppress noise [44,53]. After obtaining the phase time series of point targets, we estimated the long-term average deformation rate using a linear phase model that included both temporal and perpendicular-baseline terms. Point targets with unstable fitting results were removed based on an upper threshold of the phase residual standard deviation. Finally, geocoded annual mean deformation-rate maps and historical deformation time series of representative landslides were generated.
The relevant terms are distinguished as follows. “Effective observation information” refers to pixel- or grid-level information that, after interferogram quality screening, can be used for subsequent phase processing and provide stable interferometric observations. In the grid-based analysis, grid cells with a mean coherence of at least 0.4 were classified as valid grid cells. “Effective deformation information” refers to surface-deformation results derived from valid interferometric observations after phase unwrapping, time-series inversion, and quality control. These results mainly include LOS deformation rates and cumulative displacement. “Valid deformation points” specifically refer to individual pixels or point locations that passed the relevant quality screening and for which deformation parameters were successfully retrieved.

3.2.2. Geometric Visibility Analysis

Because of the strong topographic relief and deeply incised valleys in the study area, SAR side-looking imaging is prone to geometric distortions such as layover and shadow, which affect terrain observability under different orbital geometries. To quantitatively evaluate visibility under different observation geometries, we used a geometry-based classification method that accounts for the relationship between the DEM and SAR imaging geometry.
The topographic data were derived from the Shuttle Radar Topography Mission (SRTM) DEM, with an original spatial resolution of approximately 30 m. The horizontal coordinate reference system was WGS 84, and elevations were referenced to the EGM96 geoid. For ascending and descending observations from Lutan-1 and Sentinel-1, multi-look intensity images with stable imaging quality and complete coverage of the study area were selected as reference images. Satellite orbit, slant-range, and azimuth imaging parameters were obtained from the corresponding image parameter files and used together with the DEM as inputs to the GAMMA gc_map2 module. The mean incidence angles for the ascending and descending Lutan-1 acquisitions were 34.02° and 37.35°, with corresponding heading angles of −12.20° and 192.21°, respectively. For Sentinel-1, the mean incidence angles were 36.63° and 41.66°, with corresponding heading angles of −12.69° and 192.67°, respectively.
The basic principle is as follows. Orbit parameters and radar imaging parameters are used to determine the sensor LOS direction and imaging-plane geometry. The DEM-derived surface topography is then projected into the slant-range and azimuth coordinate system, and the occlusion and range-direction compression of each terrain element relative to the radar LOS are analyzed pixel by pixel. A terrain element is classified as visible if it can be directly illuminated by the radar and does not overlap with foreground terrain during projection. If different terrain elements are compressed into the same imaging cell after range projection, the area is classified as layover. If a slope faces away from the radar and is blocked by foreground terrain, preventing effective backscatter from being received, it is classified as shadow.
Based on this procedure, we used the gc_map2 module in GAMMA to generate visibility classification results in radar geometry. The spatial distribution and area proportions of visible, layover, and shadow areas were then quantified for Lutan-1 and Sentinel-1 under ascending, descending, and combined ascending–descending observation conditions, thereby characterizing differences in geometric observation capability between the two sensors in complex mountainous terrain.

3.2.3. Regional FVC Analysis

FVC is an important biophysical parameter for quantifying the proportion of green vegetation cover on the land surface. Previous studies have shown that NDVI is closely related to FVC and leaf area index, and can therefore be used for FVC retrieval [54]. In this study, FVC in the study area was retrieved using the dimidiate pixel model. This model assumes that the NDVI of a mixed pixel can be represented as a linear combination of pure vegetation and bare soil endmembers according to their areal proportions [55], as follows:
N D V I = F V C · N D V I v + 1 F V C · N D V I s
Thus, FVC can be derived as:
F V C = N D V I N D V I s N D V I v N D V I s
where NDVIv and NDVIs represent the NDVI values of pure vegetation pixels and bare soil pixels, respectively. To determine these two endmember parameters, we first calculated the cumulative frequency distribution of valid NDVI pixels for each acquisition date. The NDVI value at the 5th percentile was used as the initial value of NDVIs, and the value at the 95th percentile was used as the initial value of NDVIv. After retrieving FVC for each acquisition date, we generated the FVC distribution map for the study period using a multi-temporal averaging method. Specifically, the FVC values of the same pixel across all valid acquisition dates were averaged to represent the overall vegetation-cover background during the 2024–2025 SAR observation period. This procedure reduces the influence of local outliers and short-term phenological fluctuations in single-date images, making the FVC results more suitable for subsequent coherence statistics and applicability analysis of landslide hazard identification.
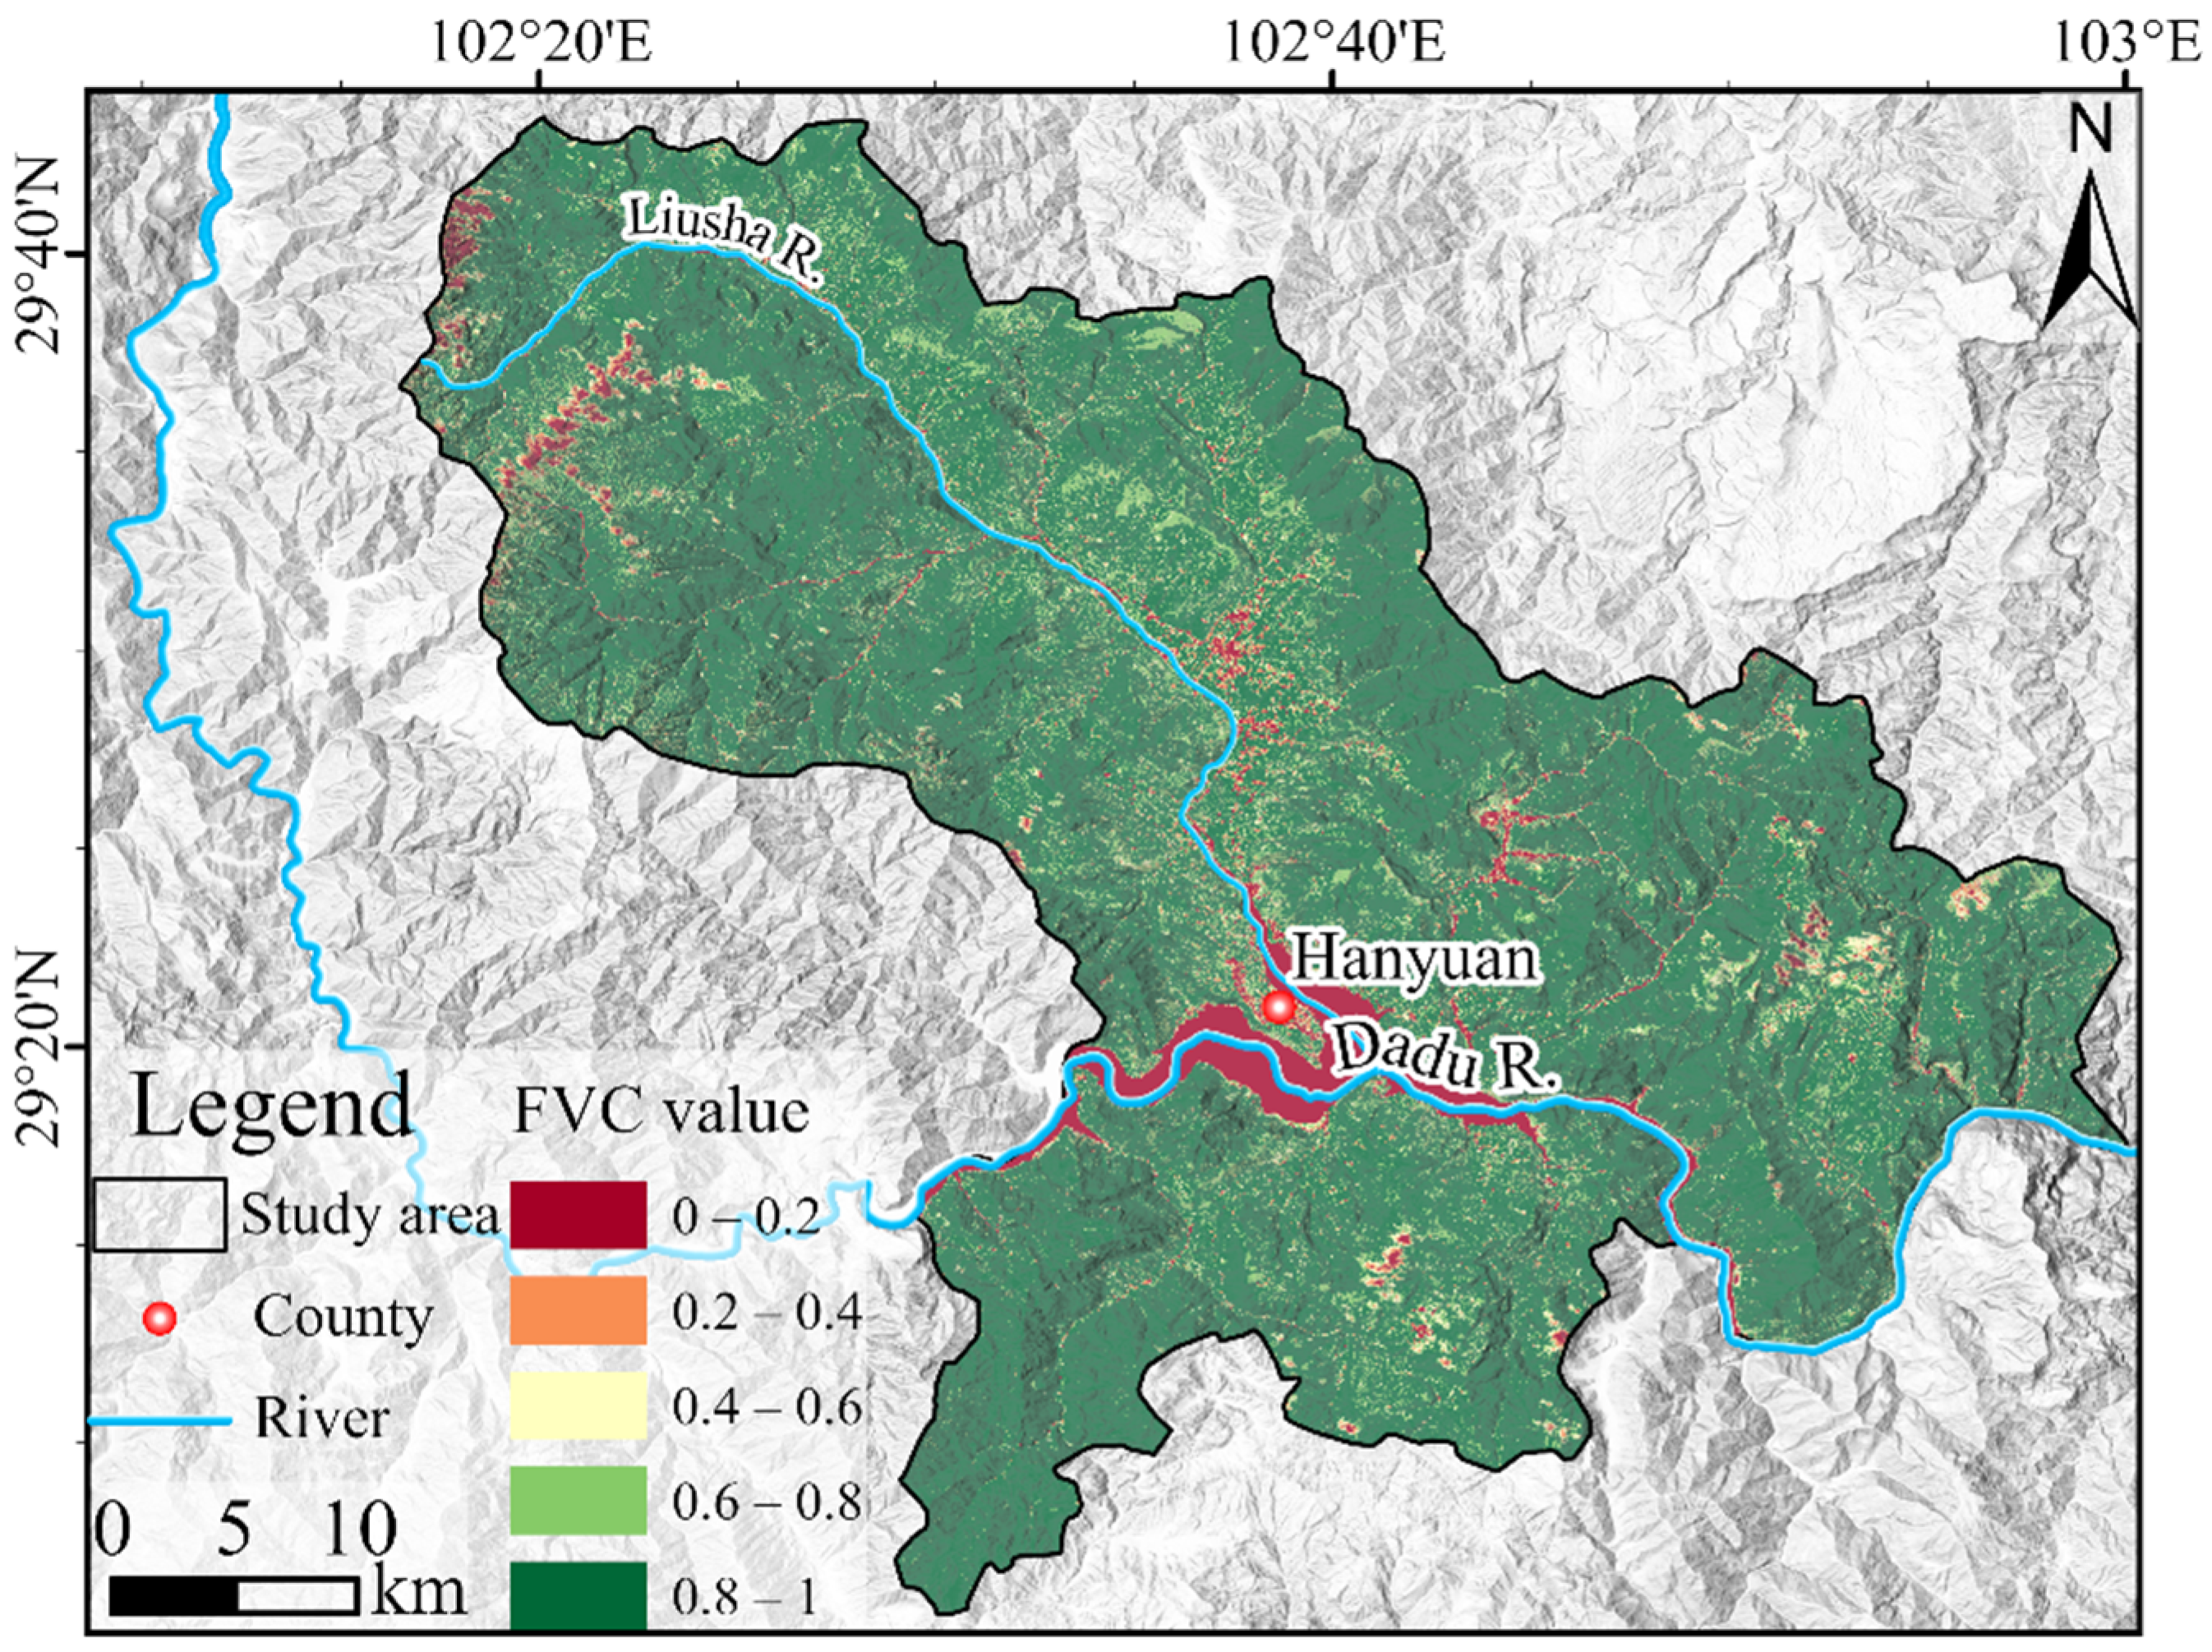
FVC ranges from 0 to 1, with higher values indicating denser green vegetation cover. Based on previous studies and the actual vegetation-cover conditions in the study area, FVC was divided into five classes. The classification criteria are shown in Table 2.
The FVC results are shown in Figure 3. Overall, the study area is characterized by high vegetation cover. High-FVC areas are widely distributed in mountainous areas and along both sides of valleys, whereas low-FVC areas are mainly concentrated near river valleys, water bodies, towns, and locally exposed ground surfaces. This indicates that dense vegetation cover is a prominent environmental feature of the study area. The continuous distribution of dense vegetation increases the concealment of landslide hazards, making some landslide boundaries and morphological features difficult to interpret directly from optical imagery alone. It may also intensify temporal decorrelation during SAR interferometry, thereby affecting the extraction of valid deformation information from SAR images.

3.2.4. Unified Grid-Based Framework and Evaluation Metrics for Effective Observation Statistics

To compare the observation performance of Lutan-1 and Sentinel-1 in the study area at a unified spatial scale, we constructed a 500 m × 500 m square grid as the basic statistical unit. All grid cells were generated in a common coordinate system and spatially overlaid with the study-area boundary, FVC data, and coherence results. Because water bodies such as rivers and lakes generally show low coherence, and their decorrelation mechanisms differ markedly from those of slopes and vegetation-covered areas, grid cells corresponding to water bodies were masked using OSM water data. Only non-water grid cells were retained for subsequent statistical analysis.
At the grid-cell scale, we calculated the mean FVC and mean coherence within each grid cell. FVC was used to characterize vegetation-cover conditions, whereas mean coherence was used to represent the interferometric coherence stability of different radar datasets within the same spatial unit. Aggregating datasets from different sources and with different spatial resolutions to a unified grid scale can reduce the influence of pixel-level random noise, spatial mismatch, and mixed pixels on the statistical results, thereby improving the consistency and interpretability of the comparison between Lutan-1 and Sentinel-1.
On this basis, grid cells with a mean coherence of γ ≥ 0.4 were defined as valid grid cells, representing spatial units with relatively stable interferometric coherence under a unified quality-control condition. This threshold was used as an empirical criterion for grid-scale statistical analysis, rather than an absolute boundary between stable and unstable coherence. Based on this definition, we further calculated the proportion of valid grid cells for different data sources and orbital combinations to quantitatively compare the effective observation capability of Lutan-1 and Sentinel-1 in the study area.
Because each 500 m grid cell represented a paired comparison between Lutan-1 and Sentinel-1, McNemar’s test was used to determine whether the proportion of valid grid cells differed significantly between the two datasets. A grid cell was classified as valid when its mean coherence was greater than or equal to 0.4; otherwise, it was classified as invalid. A p value below 0.05 was considered statistically significant.

4. Results

4.1. Comparison of Effective Observation Capability Between Lutan-1 and Sentinel-1

To clarify differences in the applicability of Lutan-1 and Sentinel-1 for landslide hazard identification in the study area, we compared the effective observation capability of the two SAR datasets from three aspects: observation geometry, interferometric coherence stability, and response to dense vegetation cover. Observation geometry was used to evaluate the basic visibility coverage under complex terrain conditions. Coherence stability was used to assess the ability of different sensors to preserve interferometric information. The relationship between FVC and coherence was further analyzed to reveal the influence of dense vegetation cover on the effective observation capability of the two datasets.

4.1.1. Comparison of Observation Geometry and Terrain Visibility

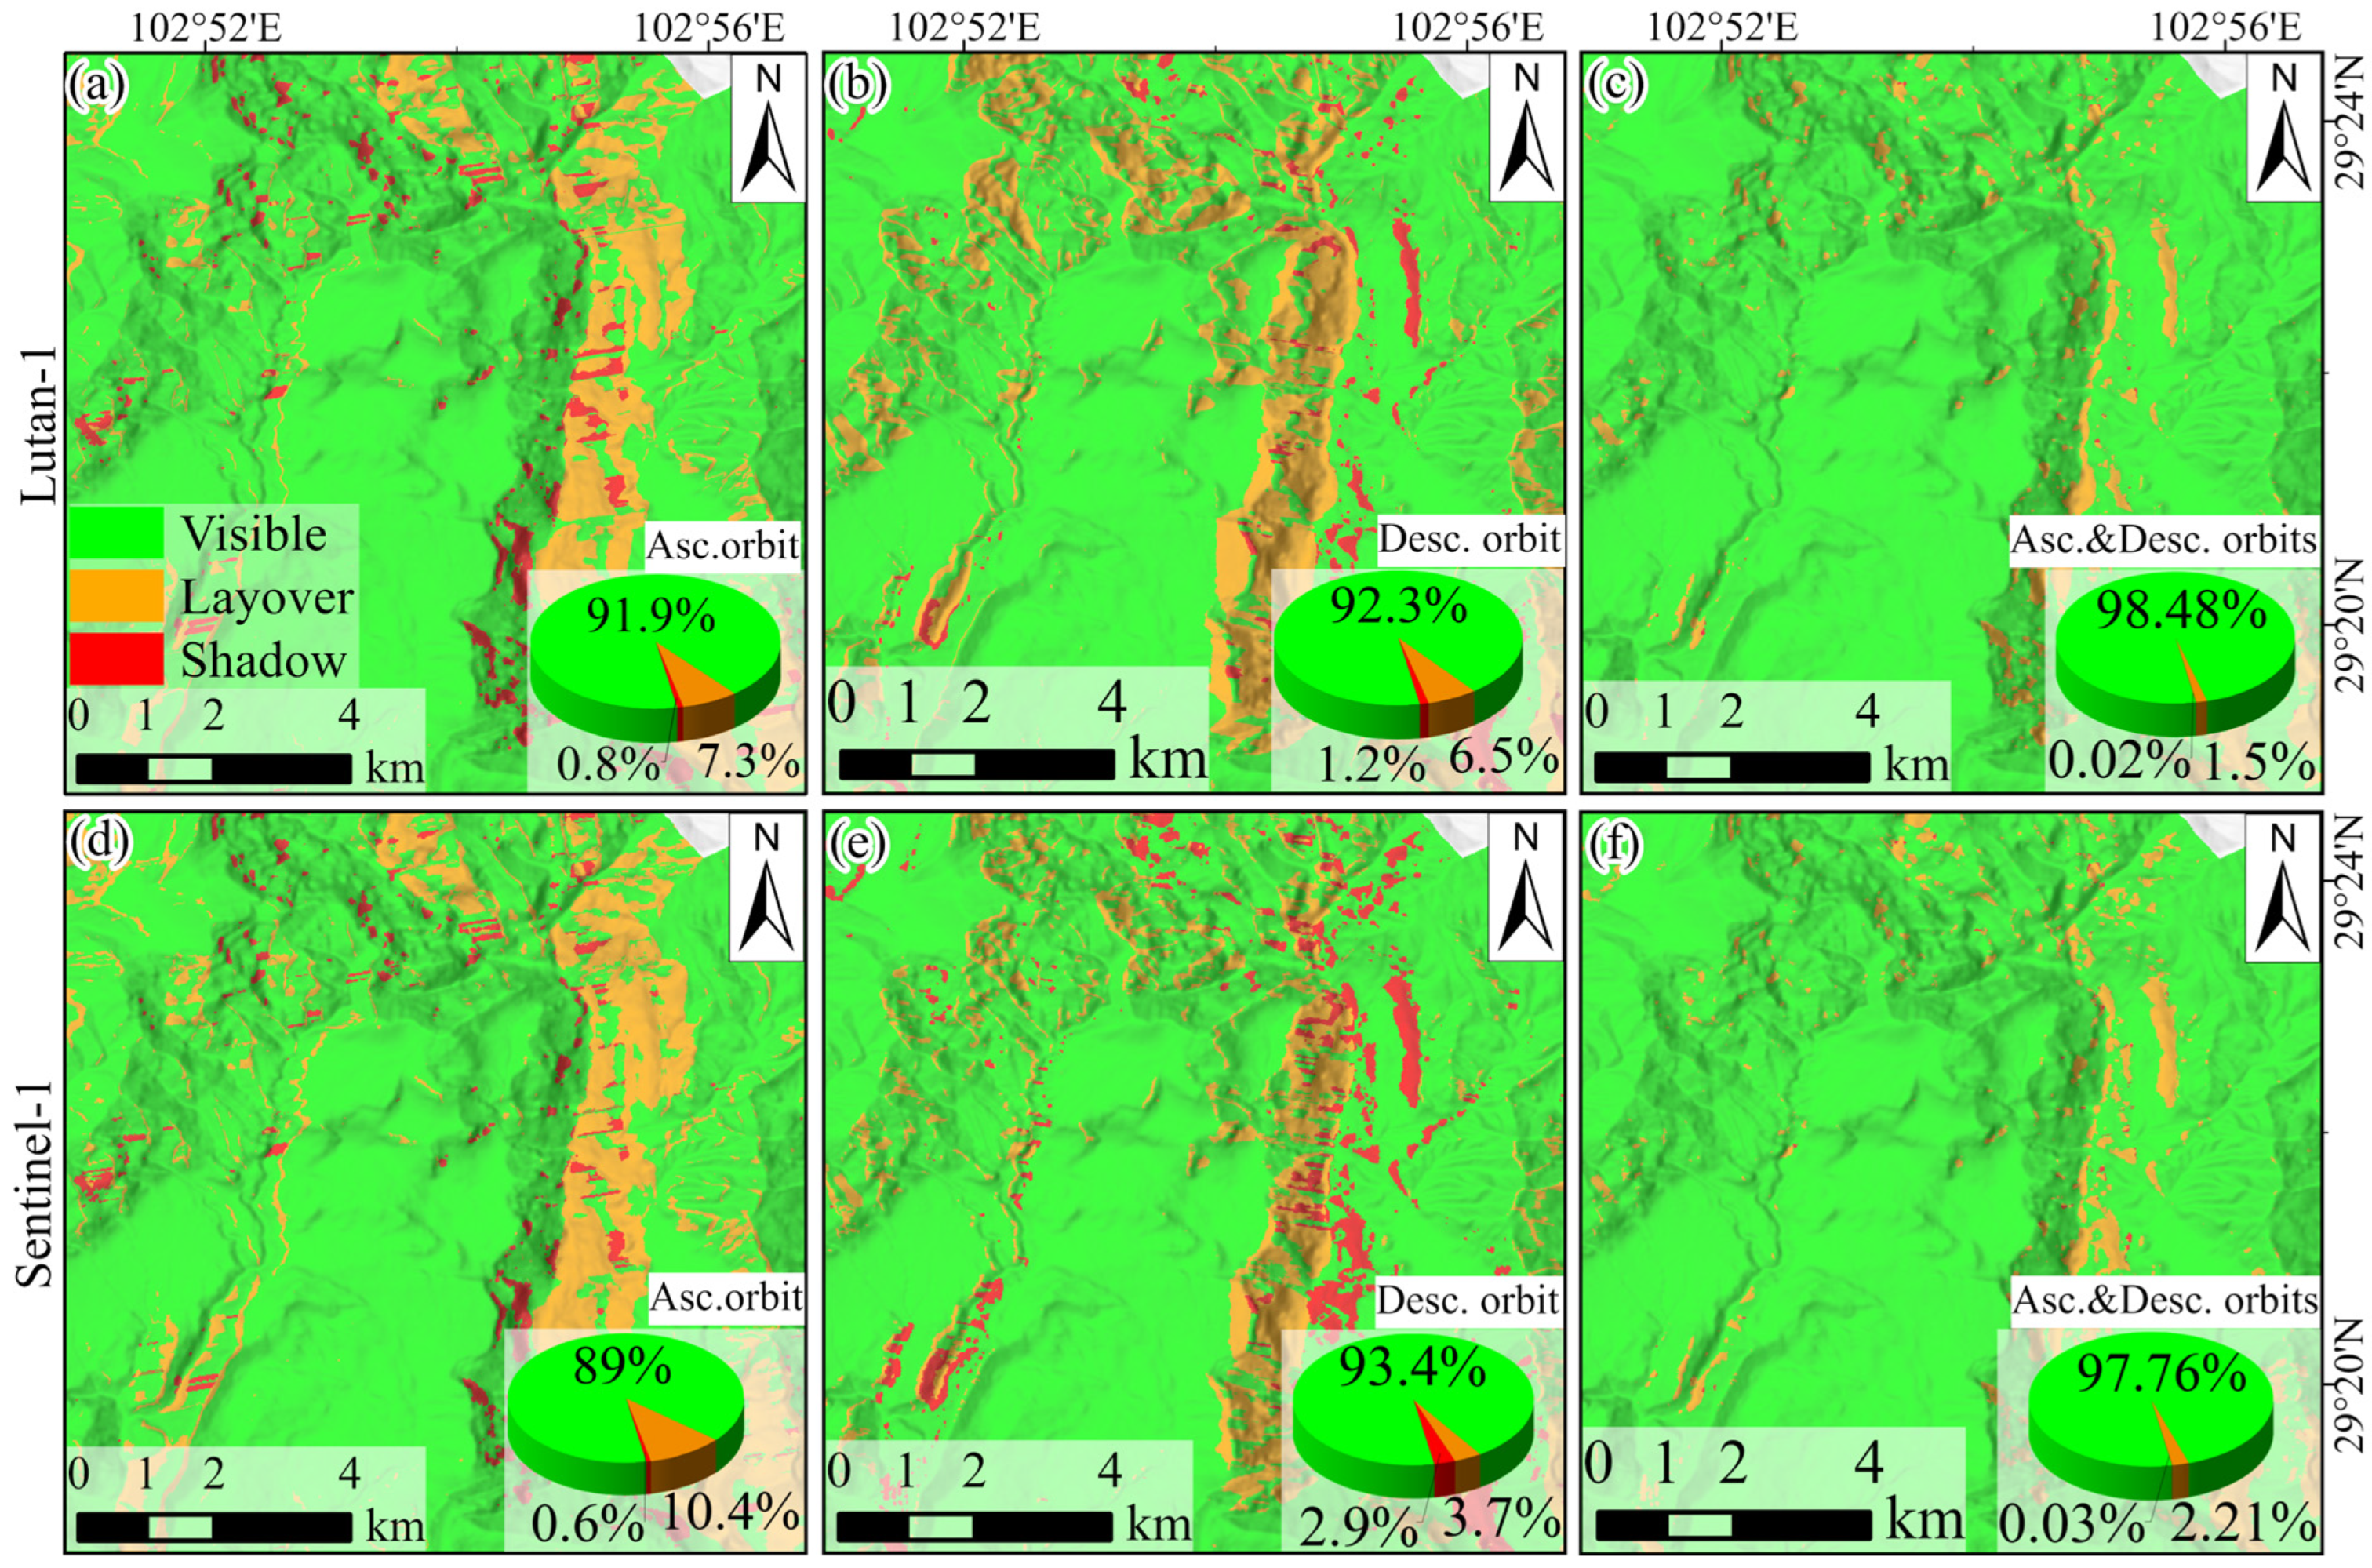
The GAMMA-based geometric visibility statistics show that both Lutan-1 and Sentinel-1 are affected by strong topographic relief, deeply incised valleys, and changes in slope aspect in the study area. Under single-track observation conditions, both datasets contain certain proportions of layover and shadow areas. For Lutan-1, the visible proportions of the ascending and descending tracks were 91.9% and 92.3%, respectively, with corresponding layover proportions of 7.3% and 6.5% and shadow proportions of 0.8% and 1.2%. For Sentinel-1, the visible proportions of the ascending and descending tracks were 89.0% and 93.4%, respectively, with layover proportions of 10.4% and 3.7% and shadow proportions of 0.6% and 2.8%. The single-track results indicate that the visible proportions of the Lutan-1 ascending and descending tracks are relatively similar, suggesting a more balanced geometric coverage under different viewing directions. In contrast, the Sentinel-1 descending track shows a markedly higher visible proportion than the ascending track, together with a substantial reduction in layover, indicating more favorable terrain adaptability and geometric observation conditions for the descending track in the study area.
After combining ascending and descending observations, the geometric visibility coverage of both satellite datasets improved substantially. For Lutan-1, the combined visible proportion increased to 98.48%, while the layover and shadow proportions decreased to 1.50% and 0.02%, respectively. For Sentinel-1, the combined visible proportion reached 97.76%, with layover and shadow proportions decreasing to 2.21% and 0.03%, respectively. These results indicate that ascending and descending tracks provide clear complementarity on both sides of valleys and across slopes with different aspects, effectively compensating for geometric blind zones caused by a single viewing direction. The spatial distributions of the geometric visibility classes corresponding to these results are shown in Figure 4.
Overall, both Lutan-1 and Sentinel-1 exhibit favorable geometric visibility in the study area, with combined ascending and descending visibility ratios approaching or exceeding 98%. Although the combined visibility of Sentinel-1 is slightly lower than that of Lutan-1, its descending-track visibility remains prominent, and the shadow proportion after combined observation is extremely low, indicating that Sentinel-1 still provides reliable geometric observation conditions in complex mountainous terrain. Therefore, differences in subsequent landslide identification between the two datasets should not be attributed solely to geometric visibility, but should be further interpreted in conjunction with coherence retention, preservation of effective deformation information, and vegetation-cover conditions.

4.1.2. Comparison of Grid-Scale Coherence Stability and Effective Observation Proportion

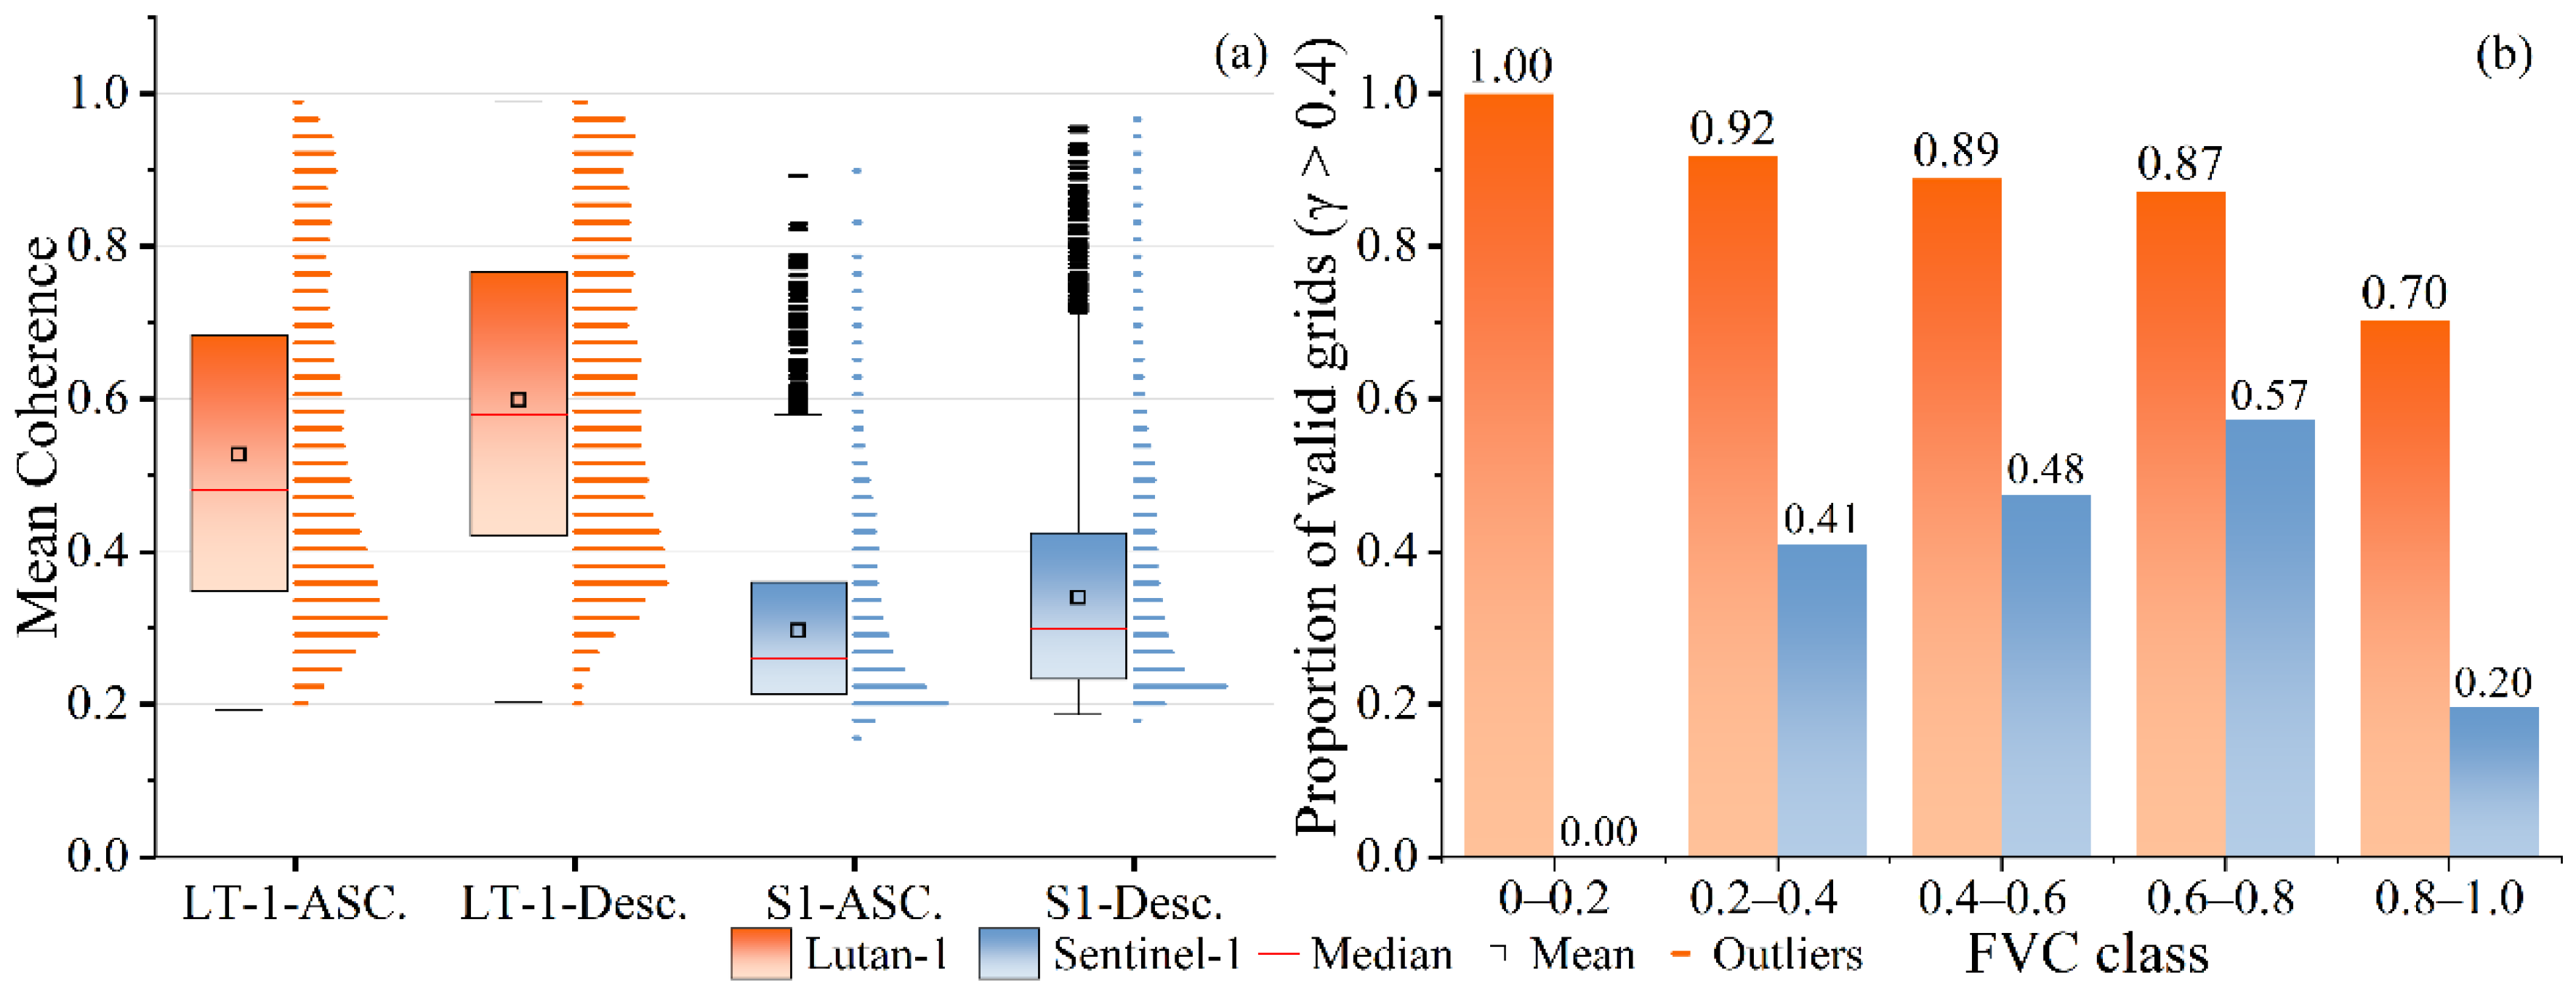
The boxplots in Figure 5a indicate that Lutan-1 generally exhibits higher coherence than Sentinel-1 in both ascending and descending tracks, with higher medians, higher means, and a more concentrated high-coherence distribution. The paired statistics show mean coherence values of 0.564 for Lutan-1 and 0.320 for Sentinel-1, corresponding to a mean difference of 0.244. It should be noted that the interferometric networks of the two SAR datasets were not matched on a one-to-one basis in terms of temporal and spatial baselines because of differences in revisit intervals, acquisition dates, and orbital conditions. For each dataset, the coherence values at each pixel or grid cell were averaged across all interferometric pairs retained after quality screening to obtain the corresponding mean-coherence result. The two mean-coherence results were then resampled to a common grid for comparison. Therefore, the comparison represents the average coherence performance of each dataset under its respective observation conditions and interferometric network configuration. The effects of differences in temporal and spatial baselines could not be completely separated and may contribute to the observed differences in coherence.
The lower coherence of Sentinel-1 is mainly related to the shorter wavelength of the C-band, which is more susceptible to temporal decorrelation, vegetation volume scattering, and changes in surface scattering conditions in densely vegetated mountainous areas. This does not imply that Sentinel-1 lacks effective observation capability in the study area. Instead, Sentinel-1 still maintains relatively good coherence in some grid cells, indicating that it can provide effective interferometric observations in local areas with low vegetation cover, relatively stable surface scattering conditions, or stronger deformation signals.
Figure 5b highlights a clear contrast between the two datasets across the FVC classes. The 0.0–0.2 class contains only seven grid cells and is therefore not used to infer a general trend. Across the remaining classes, the valid-grid proportion of Lutan-1 generally decreased from 0.92 in the 0.2–0.4 class to 0.70 in the 0.8–1.0 class, with the largest decline occurring under the densest vegetation cover. Sentinel-1 showed a different pattern, increasing from 0.41 to 0.57 between the 0.2–0.4 and 0.6–0.8 classes before decreasing sharply to 0.20 in the 0.8–1.0 class. The increase in the intermediate FVC classes does not indicate that moderate vegetation cover improves Sentinel-1 coherence. These classes are spatially heterogeneous and may include exposed ground, built-up areas, or valley surfaces with relatively stable scattering properties. Their valid-grid proportions therefore reflect the combined effects of vegetation cover, terrain, land-cover composition, and scattering stability. In contrast, the 0.8–1.0 class contains 6882 grid cells, accounting for 87.31% of the statistical sample, and is more representative of the prevailing conditions in the study area. Within this class, Lutan-1 retained a valid-grid proportion of 0.70, compared with 0.20 for Sentinel-1. The widening difference under dense vegetation is consistent with the stronger coherence-retention capability of the longer-wavelength L-band data.

4.1.3. Response Differences in SAR Coherence Under Dense Vegetation Cover

Based on the grid-scale coherence comparison, we further analyzed the influence of FVC on the interferometric coherence of Lutan-1 and Sentinel-1 from a continuous-variable perspective. Because vegetation cover in the study area is generally dense, grid cells with FVC below 0.4 are relatively scarce and have limited representativeness for the dominant observation environment of the region. Therefore, this section focuses on grid cells with FVC values ranging from 0.4 to 1.0 for correlation analysis. This range includes 7817 grid cells, accounting for 99.18% of all grid cells included in the statistics, and thus provides a good representation of the coherence response characteristics of the main vegetation-cover conditions in the study area.
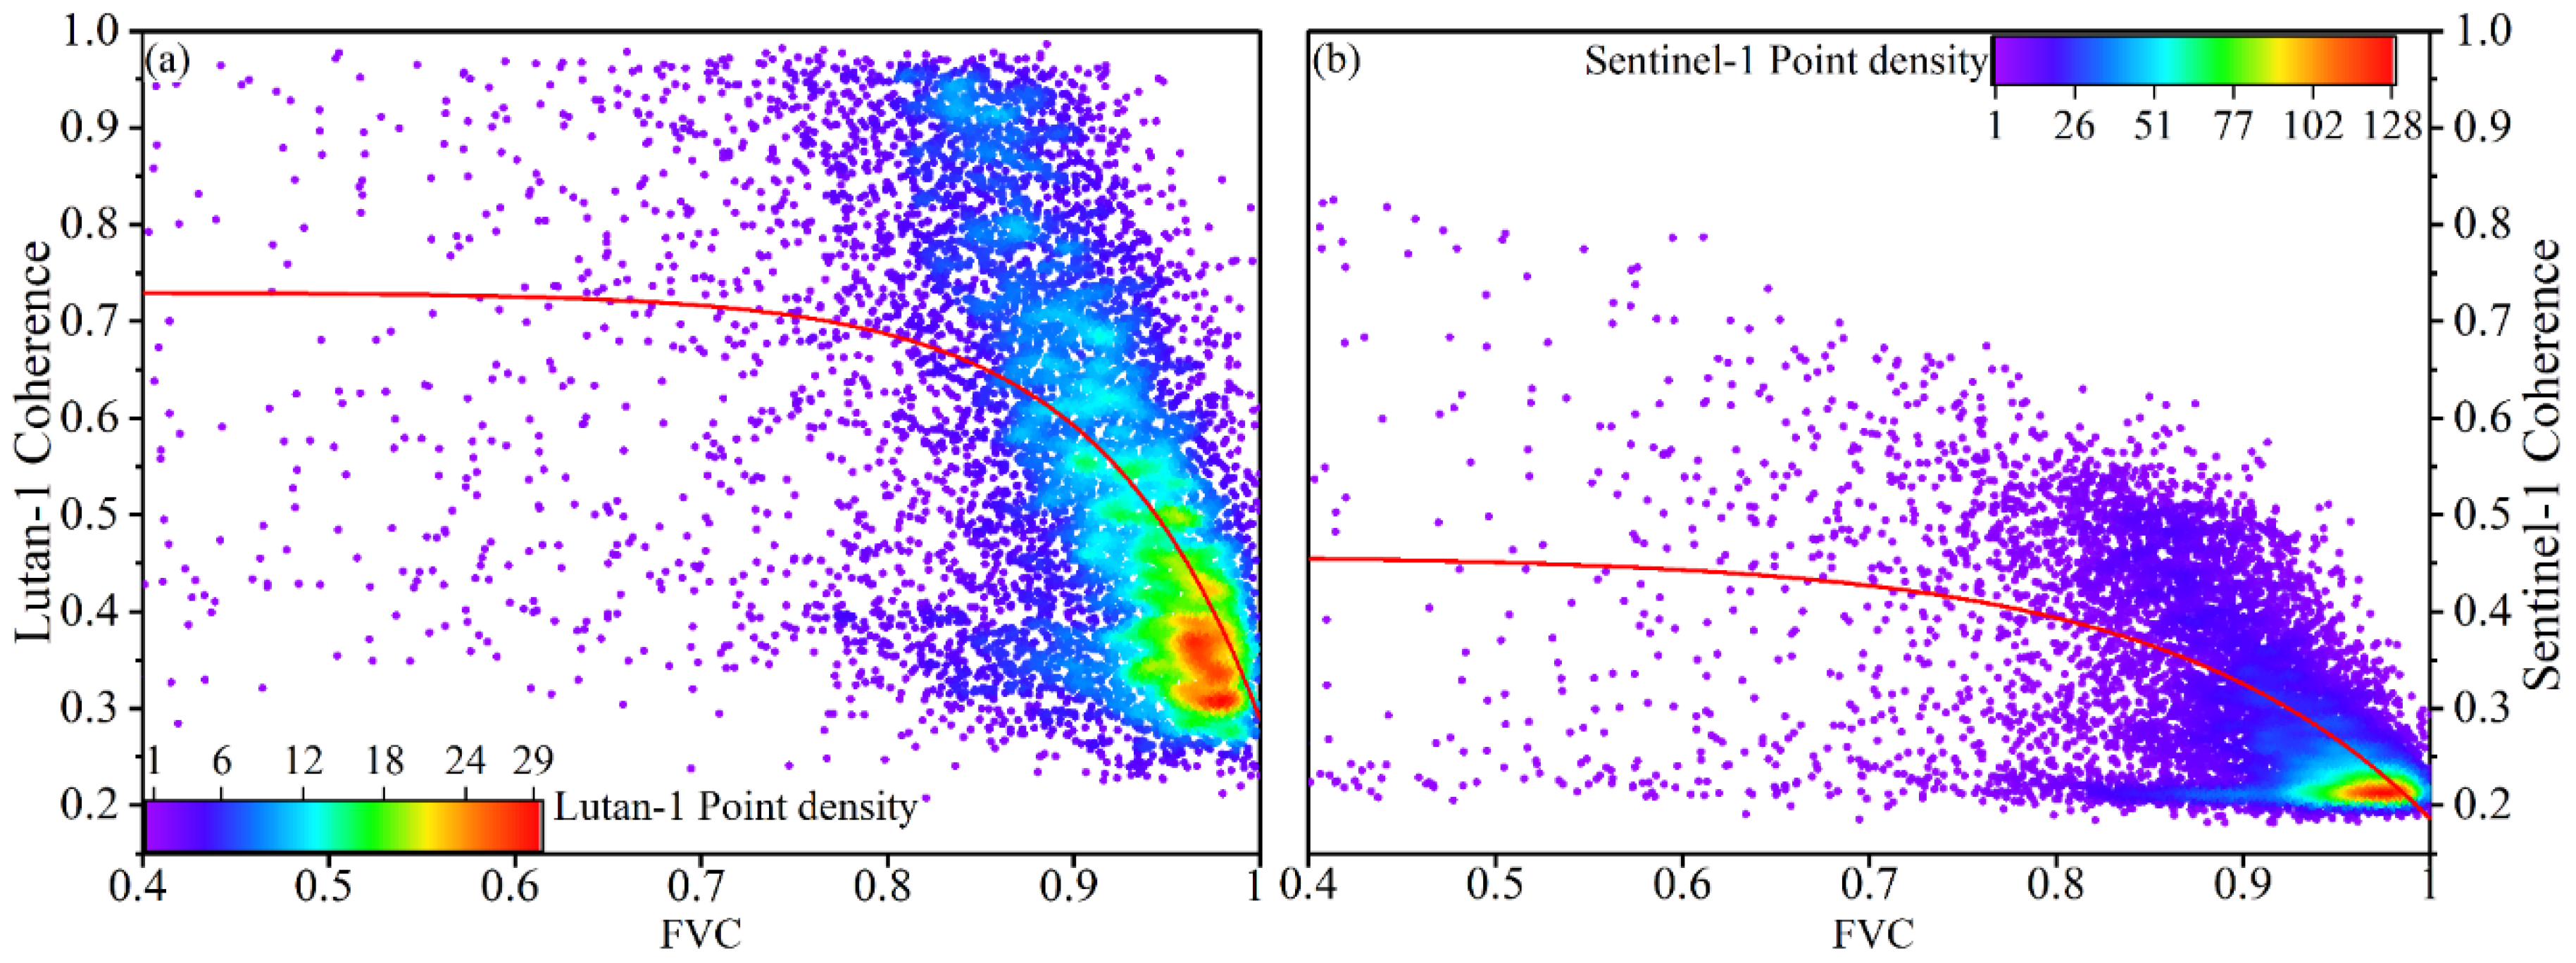
As shown in Figure 6, mean coherence for both Lutan-1 and Sentinel-1 decreases as FVC increases, indicating that vegetation cover weakens interferometric coherence in both datasets. Spearman correlation analysis shows significant negative correlations between FVC and mean coherence for both Sentinel-1 and Lutan-1, with correlation coefficients of −0.565 and −0.549, respectively, both significant at p < 0.0001. The scatter-density distribution and exponential decay fitting curves indicate that coherence does not decrease linearly with increasing FVC. Instead, a more pronounced concentration of low-coherence observations appears in the high-FVC range, suggesting that dense vegetation cover is an important factor limiting InSAR effective observation in the study area.
Although both datasets are influenced by vegetation cover, the fitted curve for Lutan-1 lies consistently above that of Sentinel-1, indicating that Lutan-1 maintains a higher coherence level in densely vegetated areas. This difference is likely related to the longer wavelength of L-band data, which generally provides stronger penetration and better coherence retention in vegetated terrain. By contrast, Sentinel-1, as a C-band dataset, is more sensitive to vegetation canopy structure, seasonal growth, and changes in surface scattering conditions, and therefore shows a more pronounced coherence decline in densely vegetated areas.
Overall, Lutan-1 and Sentinel-1 both exhibit favorable geometric observation conditions in the study area. After combining ascending and descending tracks, the effects of layover and shadow caused by a single viewing direction are substantially reduced. By contrast, the two datasets show more pronounced differences in interferometric coherence retention and response to vegetation cover. Under the unified grid framework, Lutan-1 achieves higher mean coherence and a greater proportion of valid grid cells, and it can still maintain relatively high coherence in the high-FVC range, indicating more stable interferometric observations in densely vegetated mountainous areas. Although Sentinel-1 shows a more pronounced coherence decline in densely vegetated areas, it can still provide effective observations in some regions with more favorable geometric conditions, more stable scattering characteristics, or stronger deformation signals, and it offers better temporal continuity.

4.2. Landslide Identification Results from Lutan-1

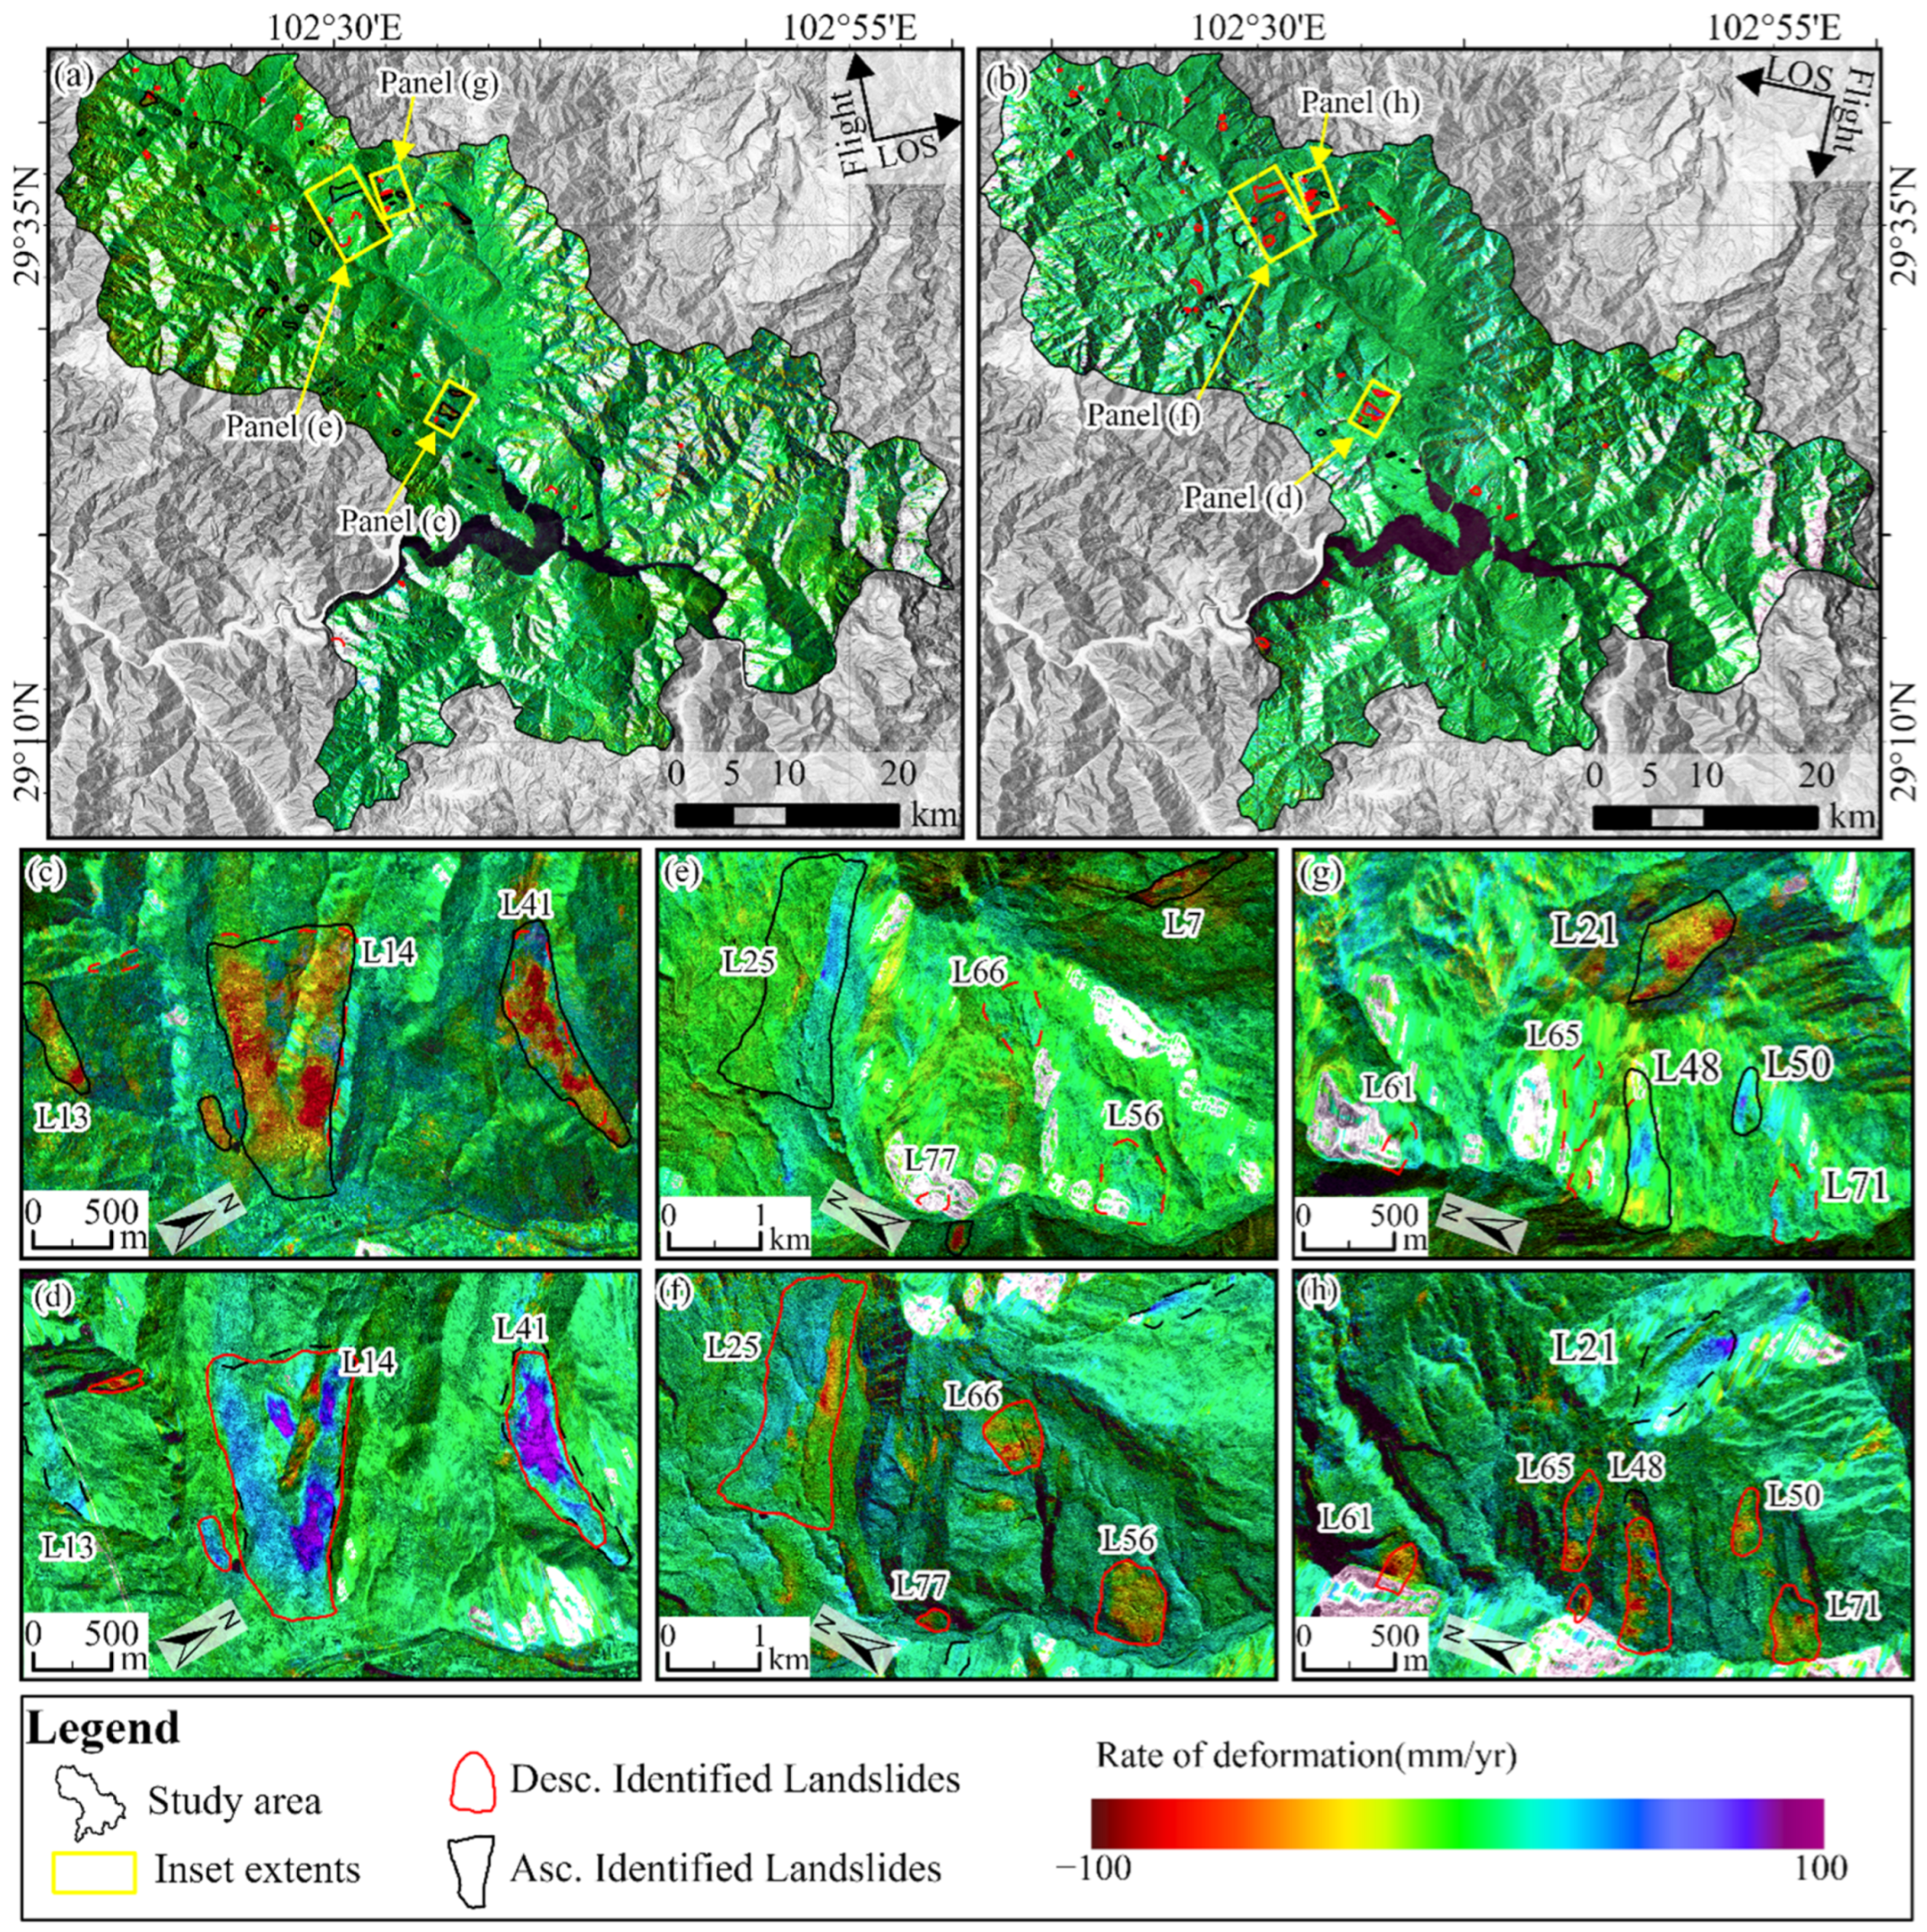
Based on the Lutan-1 ascending and descending InSAR deformation results, together with optical imagery, DEM, and LiDAR-derived geomorphic features, we conducted an integrated identification and boundary delineation of potential landslide hazards in the study area. A total of 77 potential landslides were delineated and assigned unified IDs from L1 to L77. Among them, Lutan-1 identified 74 landslide hazards in total, including 29 identified only from the ascending track, 27 identified only from the descending track, and 18 identified by both tracks. The identification results are shown in Figure 7.
From a spatial perspective, the potential landslide hazards identified by Lutan-1 are mainly distributed along both sides of the Dadu River and its tributary valleys, at the foot of steep slopes, and in the middle to upper parts of slope bodies, exhibiting an overall distribution pattern controlled by valleys and slope topography. This spatial pattern is consistent with the deeply incised valleys, strong topographic relief, and slope unloading conditions in the study area, indicating that the Lutan-1 InSAR results can reasonably reflect the geomorphic setting of potential landslide development in the region.
To further demonstrate the performance of Lutan-1 in identifying representative landslide hazards, three typical areas, A (Figure 7c,d), B (Figure 7e,f), and C (Figure 7g,h), were selected for local enlargement and analysis. Typical area A is located near Daling Township, where the potential active landslides are mainly distributed along the valley and adjacent slopes, showing relatively distinct spatial clustering. Among them, L41 exhibits the most prominent deformation characteristics. The SBAS-InSAR results show that its maximum annual mean deformation rate is approximately 228 mm/yr, indicating that this slope still undergoes relatively strong and continuous deformation.
In typical areas B and C, the results are jointly influenced by slope aspect, local relief, and radar side-looking geometry. In the ascending-track results, some slope sections are affected by foreshortening and layover, leading to narrower deformation extents, blurred boundaries, or local omissions. In contrast, the deformation anomalies in the descending-track observations are clearer, and their correspondence with valley boundaries, slope-foot positions, and landslide geomorphic outlines is more evident. This suggests that the differences observed for the same slope body under different tracks are mainly caused by the sensor’s varying response to slope aspect and local topography, rather than by real changes in slope activity between viewing geometries. Therefore, when interpreting local deformation anomalies, the viewing geometry and slope geometry should be considered together, so that projection effects are not directly mistaken for differences in deformation extent.

4.3. Landslide Identification Results from Sentinel-1

To maintain consistency with the Lutan-1 results, we used Sentinel-1 ascending and descending SAR images acquired over the same period and applied the same InSAR processing workflow to extract deformation and identify potential landslide hazards in the study area. Based on the combined ascending and descending Sentinel-1 deformation results, together with auxiliary interpretation from optical imagery, DEM, and LiDAR-derived geomorphic features, 17 potential landslide hazards were identified in the study area. Among them, 4 were identified only from the ascending track, 4 only from the descending track, and 9 by both tracks.
From a spatial perspective, the potential landslide hazards identified by Sentinel-1 are mainly concentrated along both sides of the Dadu River and its tributary valleys, showing a certain correspondence with the main geomorphic setting of landslide development in the study area. These areas are mostly located where valley incision is strong, slope unloading is evident, or local slope deformation is relatively concentrated, indicating that Sentinel-1 can extract effective deformation anomalies in some areas with more obvious deformation signals.
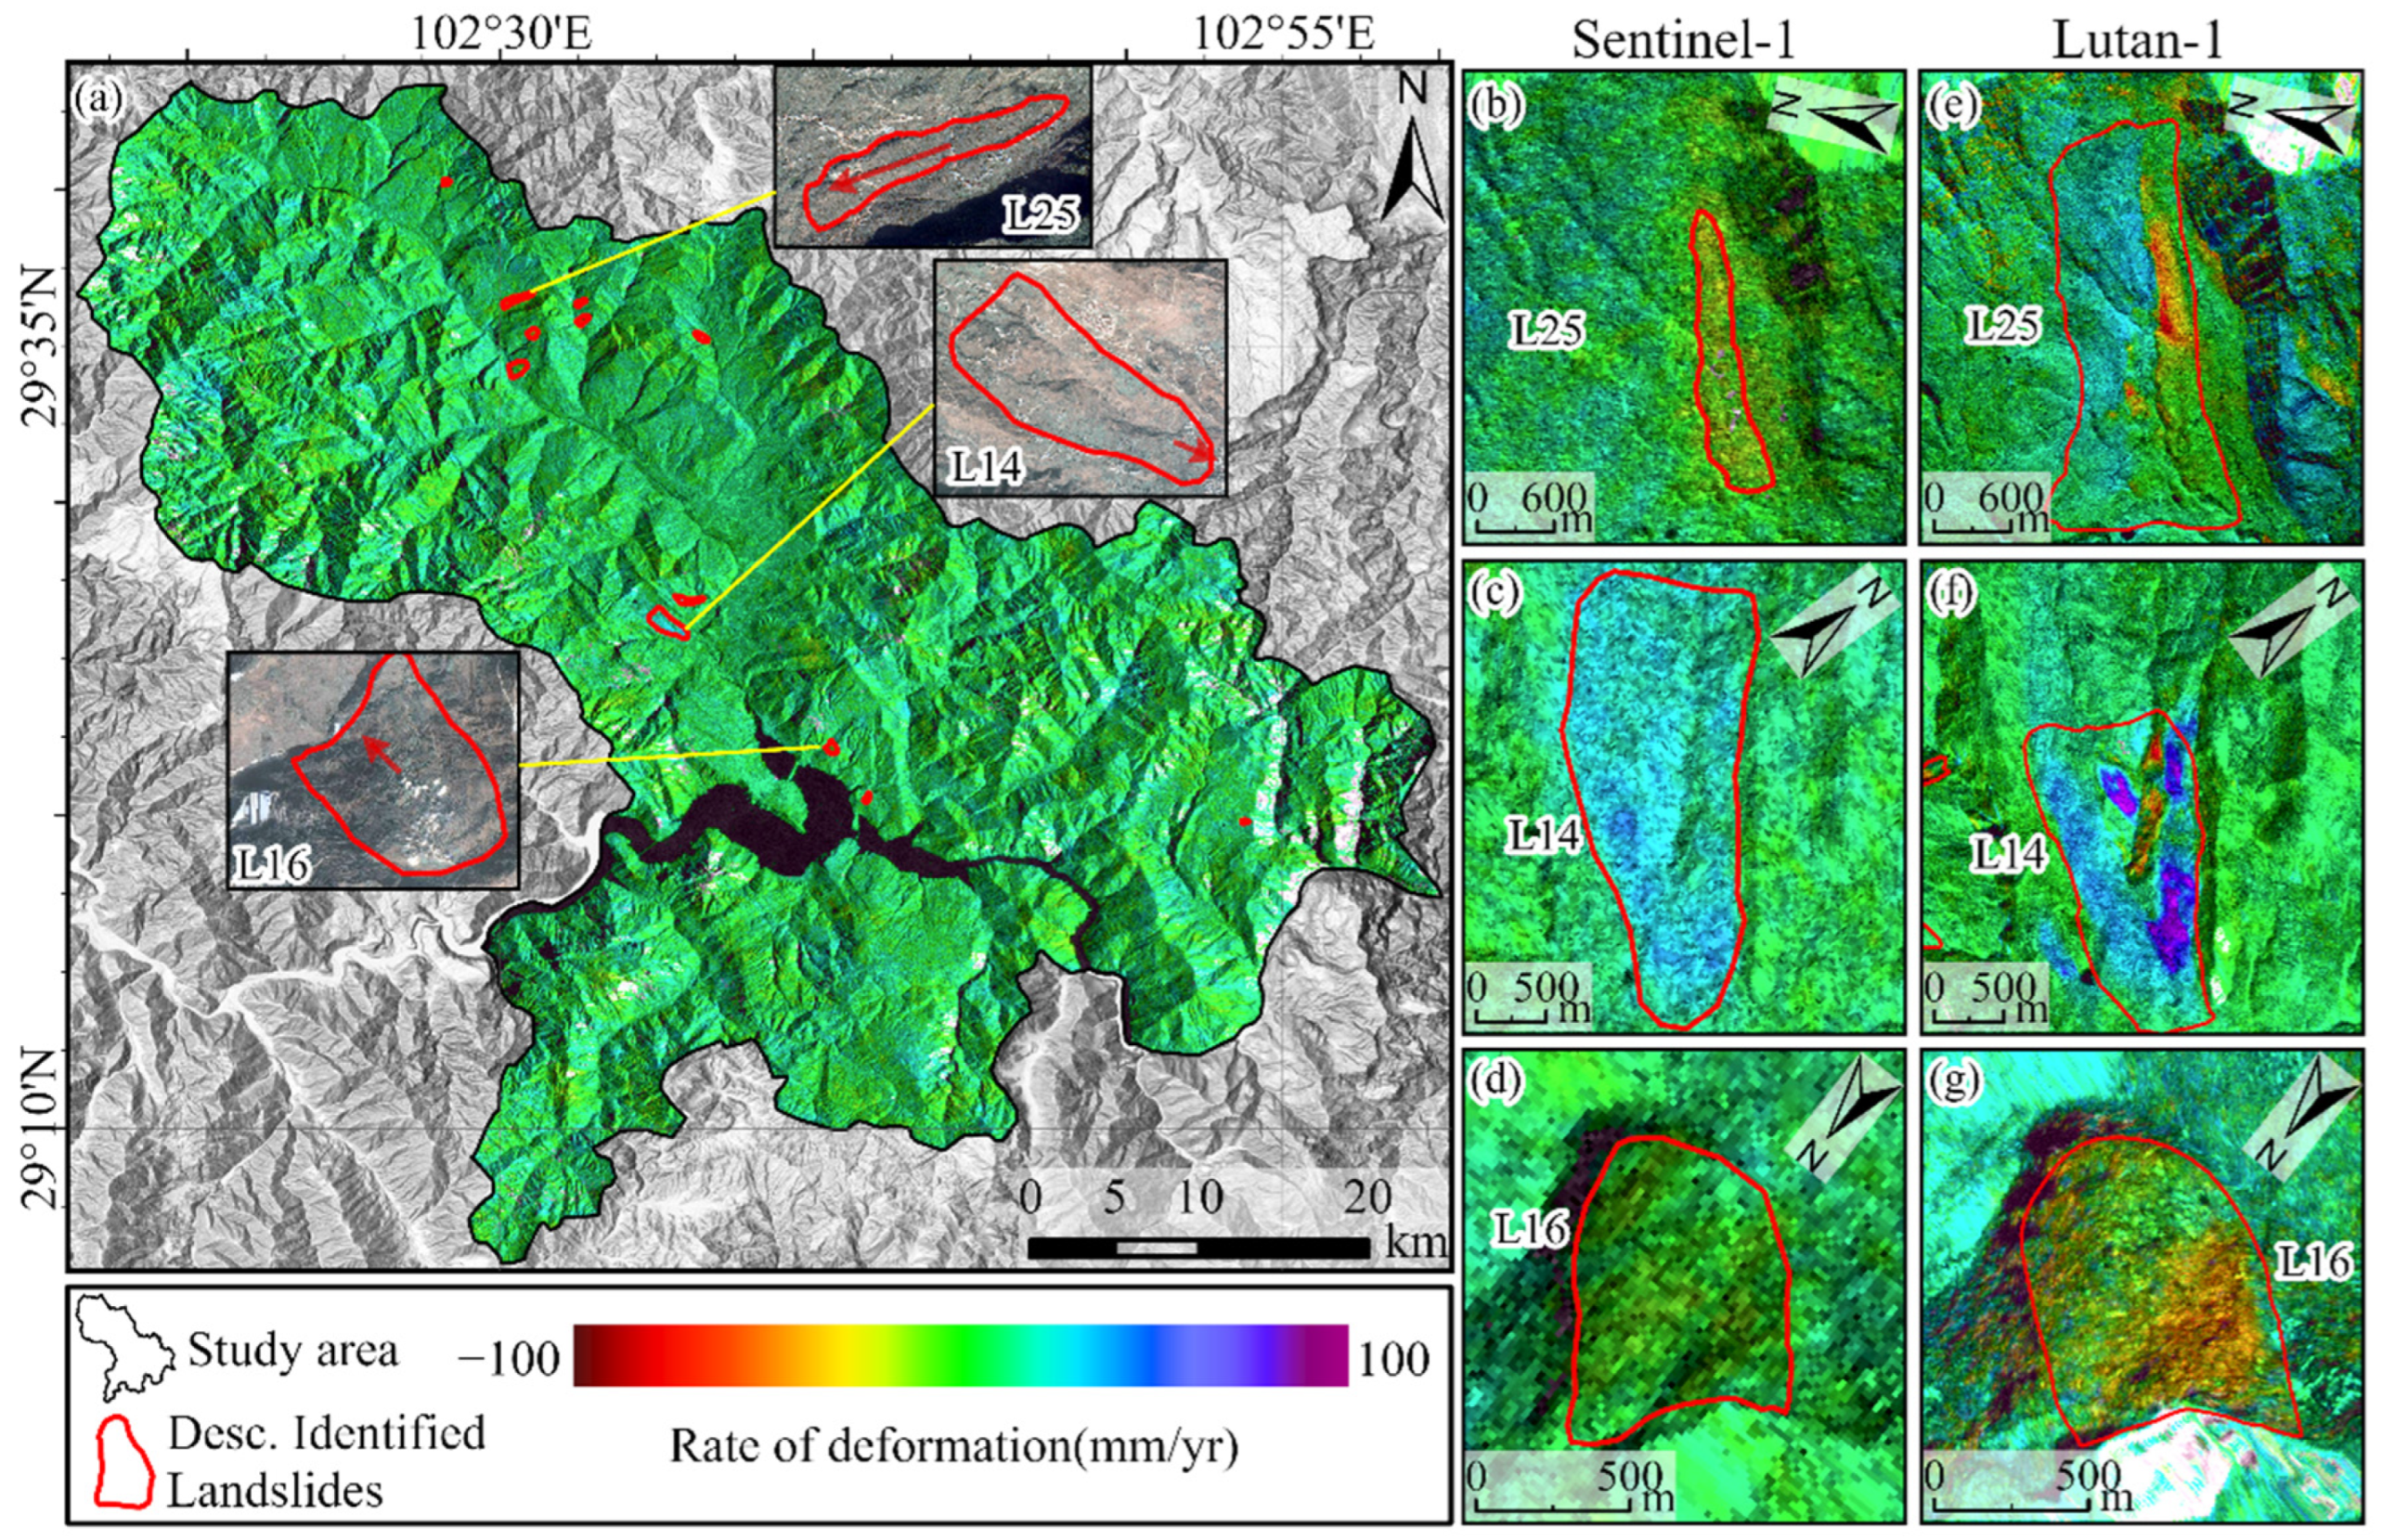
To further illustrate the landslide-scale performance of Sentinel-1, three representative landslides, L25, L14, and L16, were selected for local analysis (Figure 8b–g). The results show that both datasets can extract deformation anomalies associated with slope activity, but they differ in the distribution of deformation points, boundary delineation, and the representation of internal deformation zoning.
For L25, the deformation range identified by Sentinel-1 is relatively limited, and the local deformation center does not fully coincide with that derived from Lutan-1. The landslide boundary is also less distinct. In contrast, Lutan-1 preserves a more complete deformation response within the landslide body, allowing the overall extent of the landslide and its internal differences to be represented more clearly. For L14, the deformation range identified by Sentinel-1 is broadly consistent with that of Lutan-1, but the internal deformation zoning is less distinct and the overall cumulative LOS displacement is relatively smaller. Lutan-1 not only delineates the boundary more clearly, but also distinguishes several deformation units within the slope body, indicating a finer representation of internal deformation structure. For L16, Sentinel-1 captures only sparse and weak deformation signals in localized areas, whereas Lutan-1 presents the main activity range of the landslide more completely.
Overall, these three representative landslides indicate that, in slopes with dense vegetation cover or relatively weak deformation signals, Lutan-1 is more effective at preserving valid deformation information at the landslide scale, whereas Sentinel-1 mainly provides effective identification in areas with stronger deformation or more favorable geometric conditions.

4.4. Comparison of Landslide Identification Results Between Lutan-1 and Sentinel-1

4.4.1. Overall Identification Results

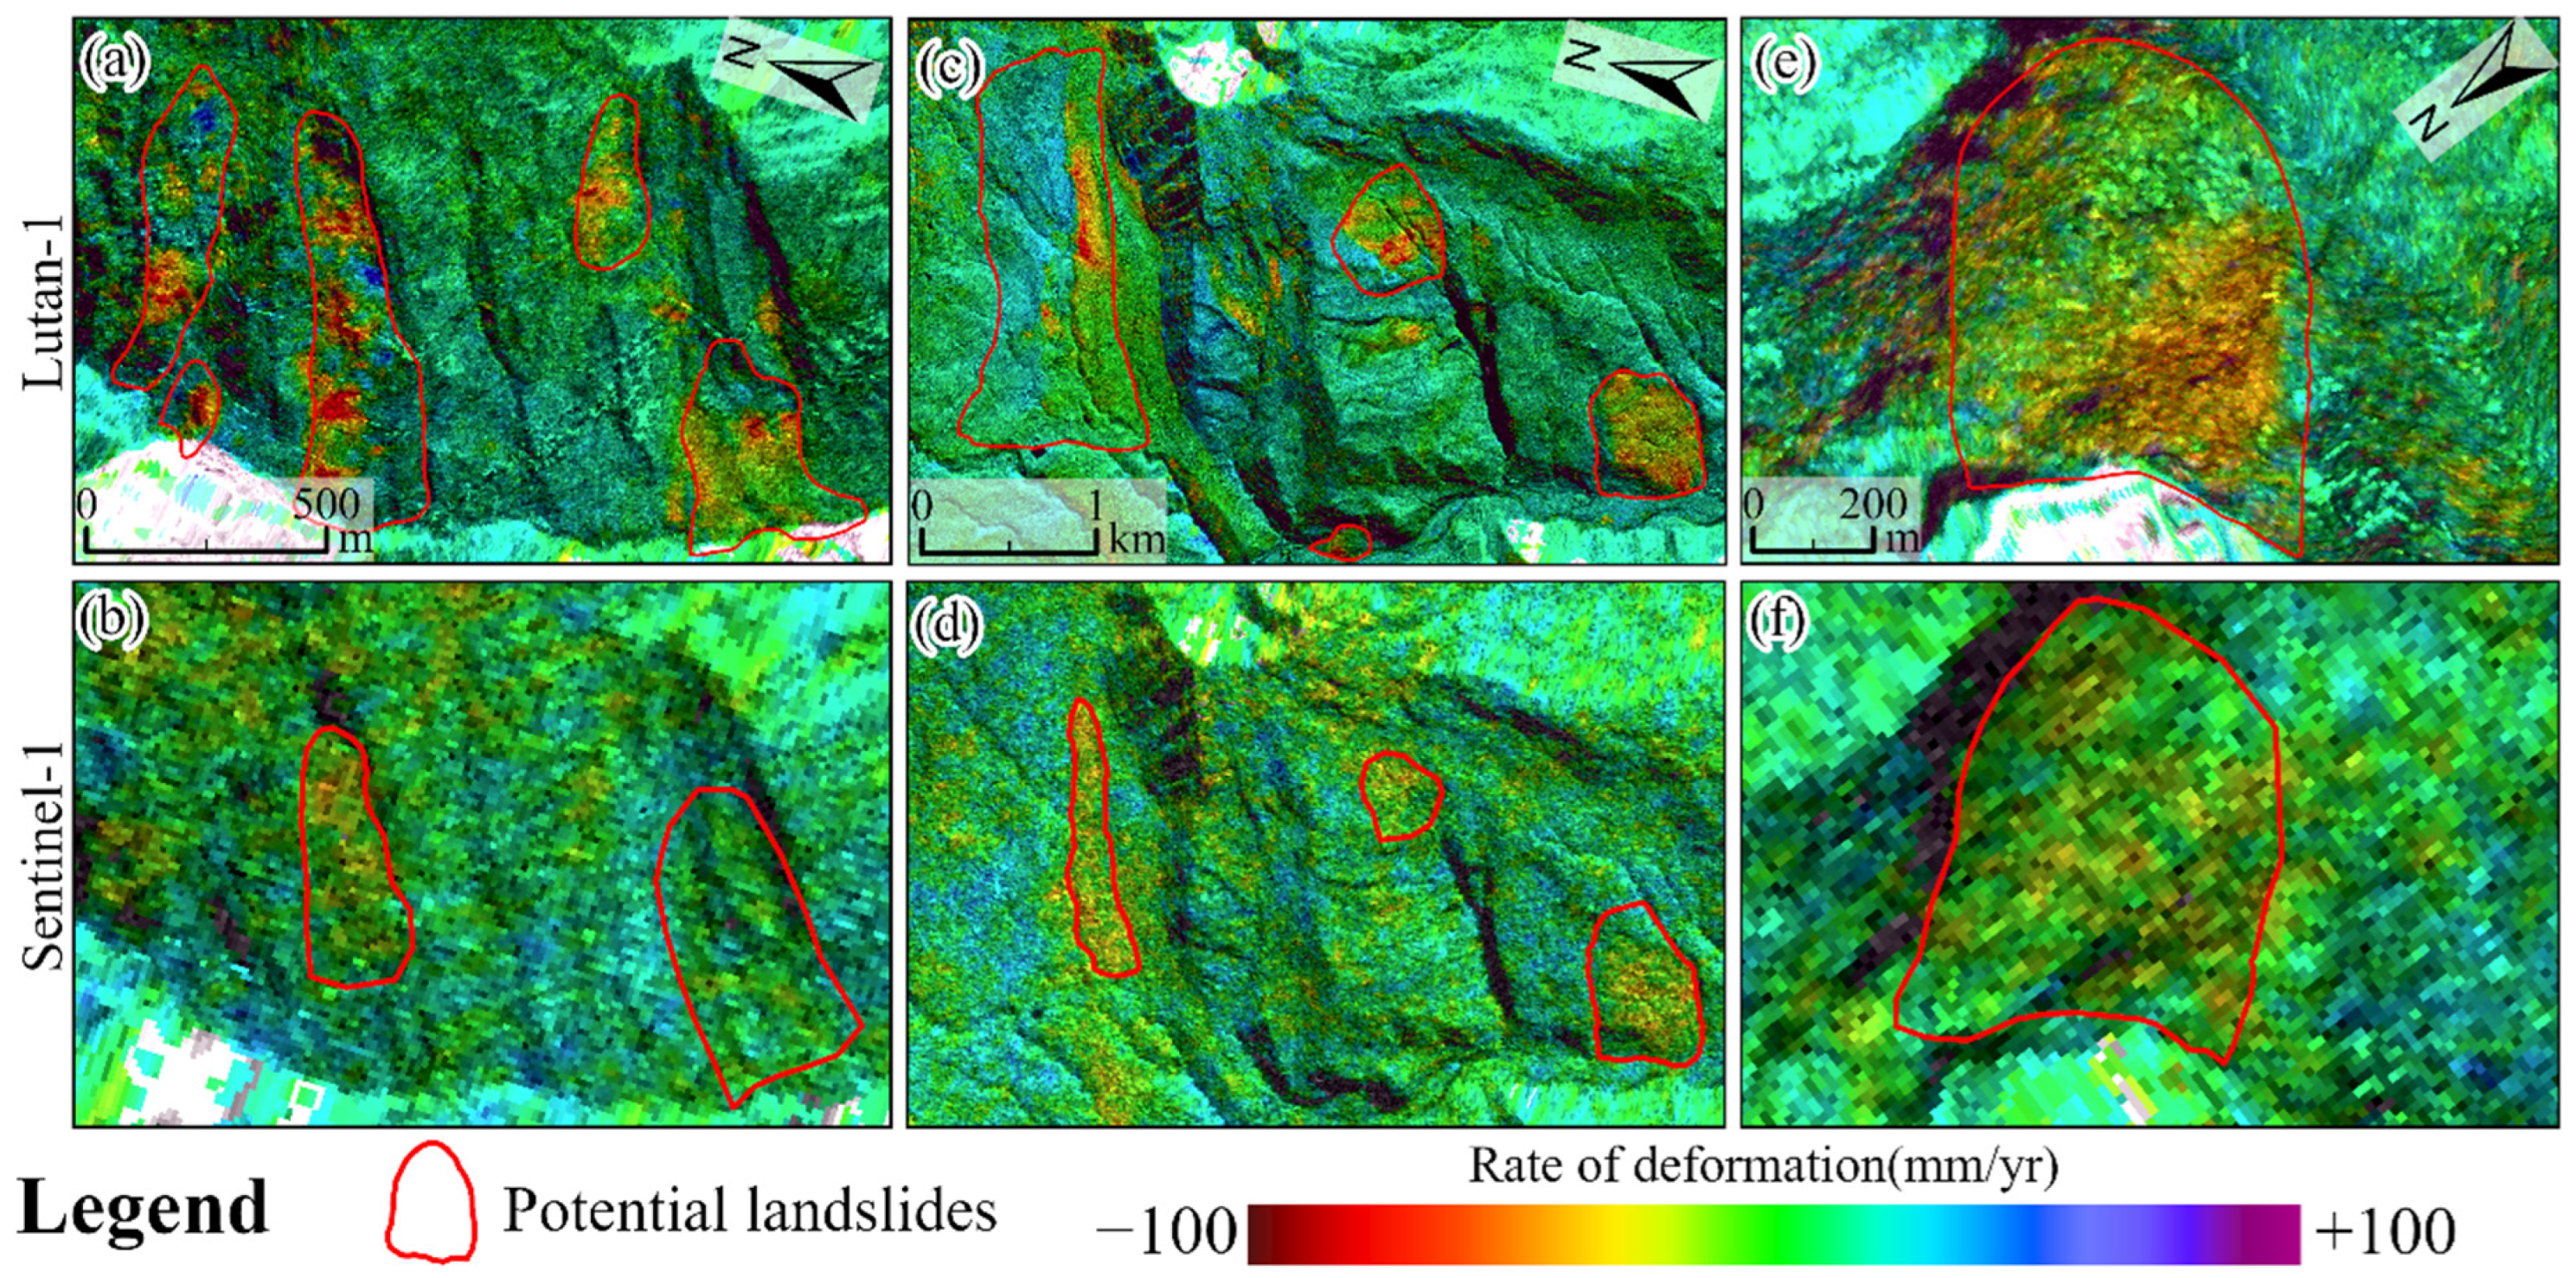
After completing landslide hazard identification separately with Lutan-1 and Sentinel-1, we further compared the results of the two satellite datasets. For landslide patches identified by the two satellite datasets that show spatial overlap, the patches were considered to represent the same jointly identified potential landslide when the overlap area was at least 100 m2 and accounted for at least 0.5% of the area of the smaller patch. Based on this criterion, 77 potential landslide hazards were identified in the study area, of which 74 were detected by Lutan-1 and 17 by Sentinel-1. The two datasets jointly identified 14 landslides, while 60 were identified only by Lutan-1 and 3 only by Sentinel-1. Overall, the two datasets show a certain degree of consistency for landslides with larger scales or stronger deformation responses. However, for slopes with dense vegetation cover, obscured boundaries, or weaker signs of activity, Lutan-1 covers a broader identification range and captures more potential deformation areas. Although Sentinel-1 identifies fewer landslides overall, it still provides effective detection for some local slope sections with clearer deformation responses.
To further compare the ability of the two SAR datasets to characterize landslide deformation, three representative areas were selected, and the annual mean LOS deformation rates derived from descending-track Lutan-1 and Sentinel-1 data were compared (Figure 9). The two datasets generally captured deformation at similar locations. However, Lutan-1 provided more spatially continuous deformation signals and more clearly resolved spatial variations within the landslides, whereas the Sentinel-1 signals were comparatively fragmented.
Spatially, the jointly identified landslides are clustered along the Dadu River and its tributary valleys, whereas those identified only by Lutan-1 extend beyond the main valley corridors and are distributed more widely across the study area.

4.4.2. Field Validation

To assess the field correspondence of the three identification categories, 15 of the 77 potential landslide hazards were selected for field validation, representing 19.48% of all identified hazards. The validation sites covered three cases, namely sites identified only by Lutan-1, sites jointly identified by Lutan-1 and Sentinel-1, and sites identified only by Sentinel-1. Specifically, 10 sites were identified only by Lutan-1, 4 were jointly identified by the two satellites, and 1 was identified only by Sentinel-1, allowing the field correspondence of different identification types to be examined.
Field validation focused on typical deformation indicators such as slope cracks, road deformation, building cracks, and surface displacement, and was combined with slope morphology, local surface disturbance, and remote sensing interpretation for integrated judgment. The results show that 12 of the 15 validation sites exhibited clear signs of landslide activity and could be confirmed as landslides. The remaining 3 sites showed deformation anomalies in the remote sensing results, but no clear landslide deformation signs were found in the field, so they were not classified as definite landslides. Overall, the field observations are in good agreement with the InSAR-based identification results for most sites, indicating that the potential landslide identification results derived from time-series InSAR deformation anomalies, together with optical imagery, DEM, and LiDAR geomorphic features, are relatively reliable.
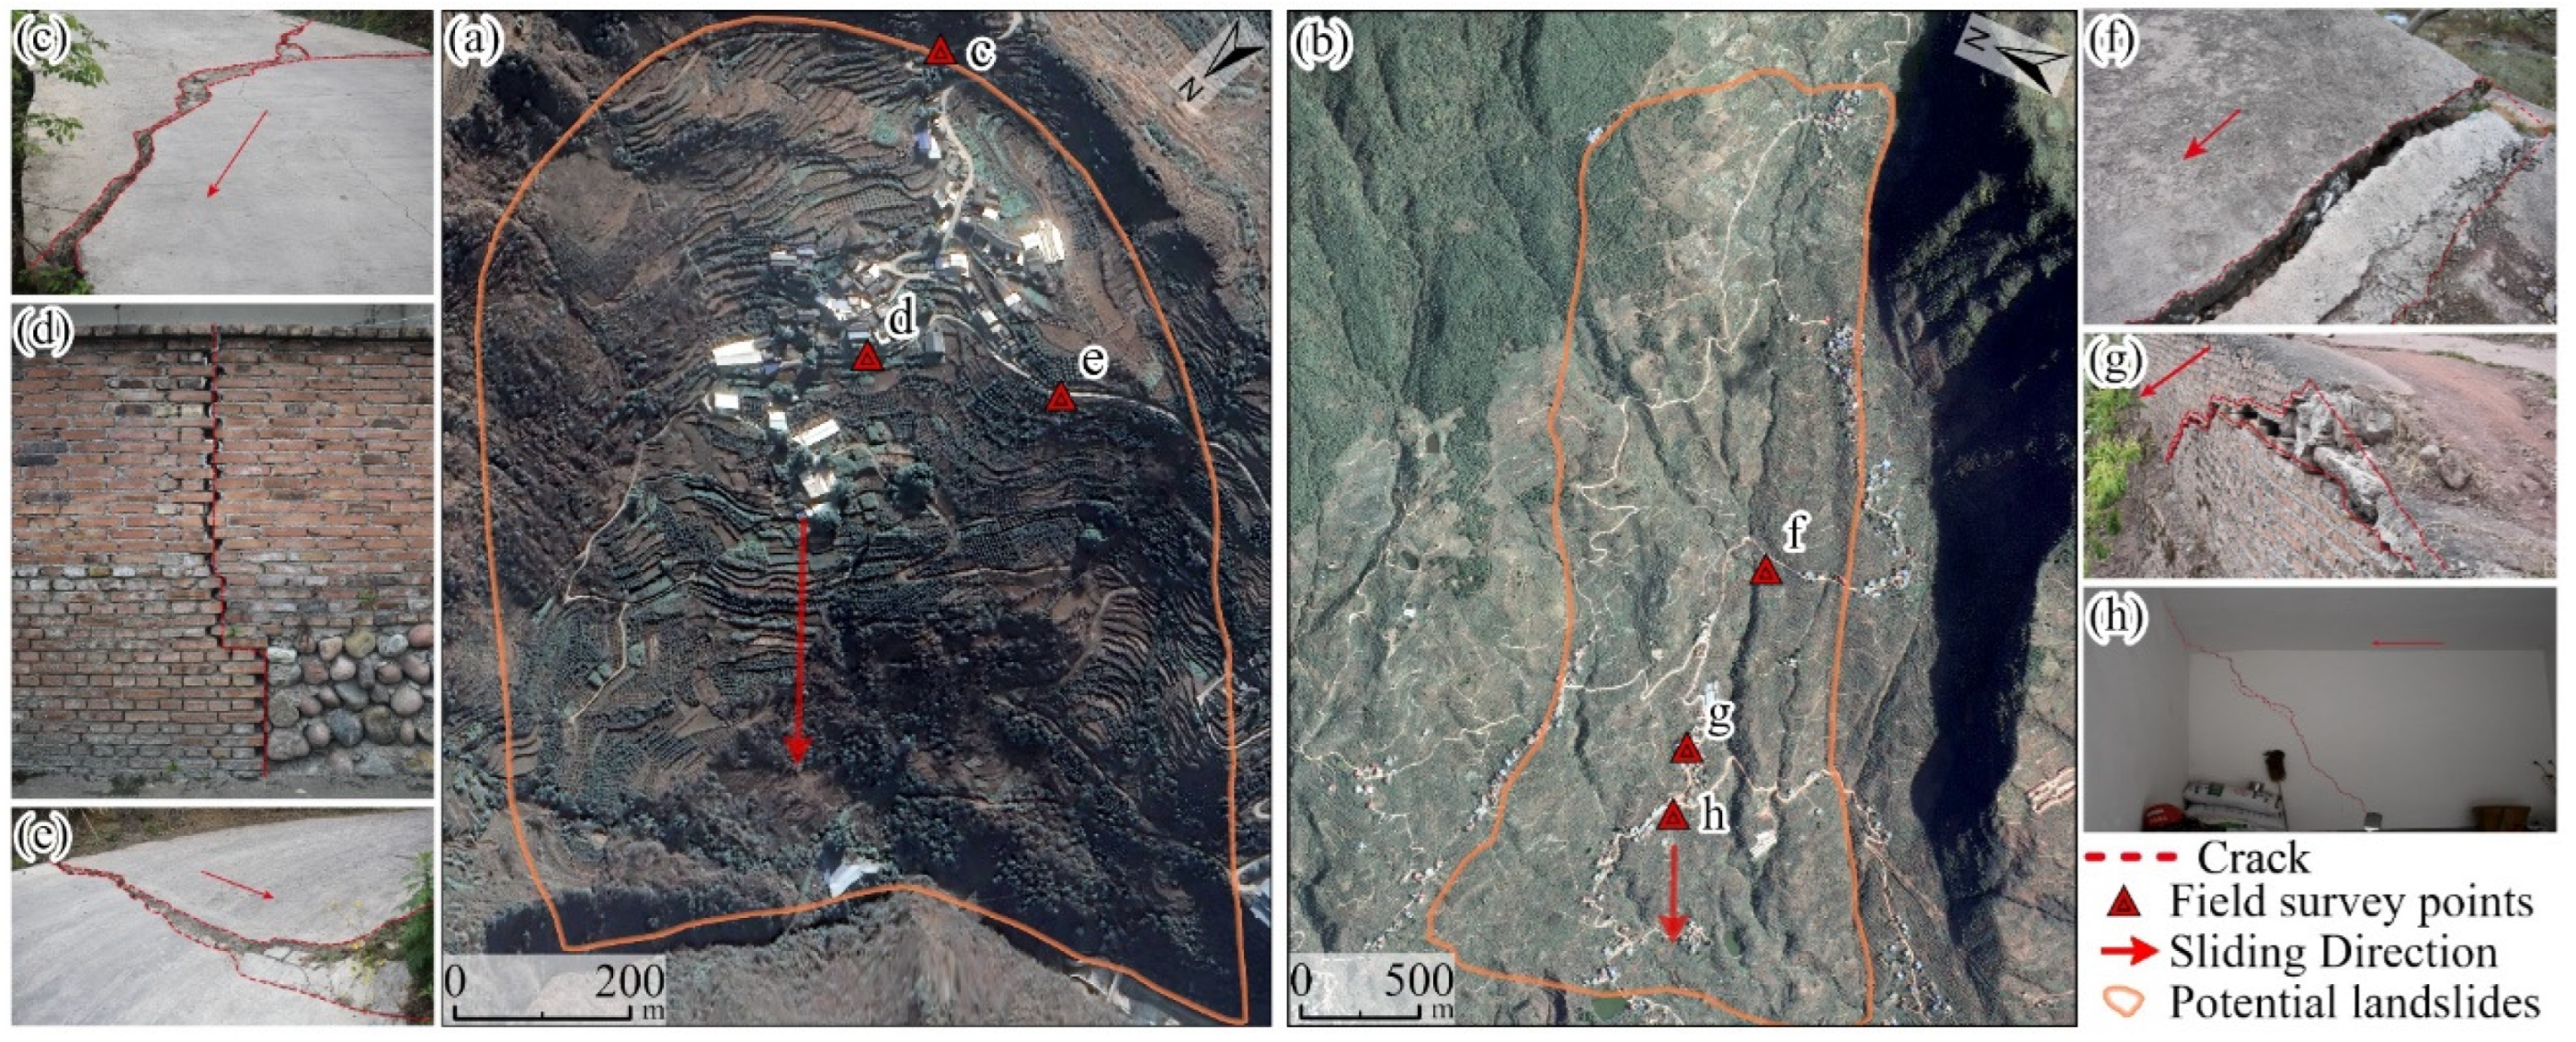
Figure 10 shows the field validation of two representative landslides, L16 and L25. In L16, multiple tensile cracks can be observed on roads in the middle to rear part of the slope, and some building walls show clear cracking, indicating that the slope is still undergoing continuous deformation. In L25, road damage and cracks are visible in the middle to front part of the landslide, and through-going cracks also appear inside some residential buildings. The deformation signs observed in the field are broadly consistent with the potential landslide boundaries interpreted from remote sensing data, providing field evidence for the landslide hazard identification results of this study.

4.4.3. Spatial and Time-Series Comparison of Representative Landslides

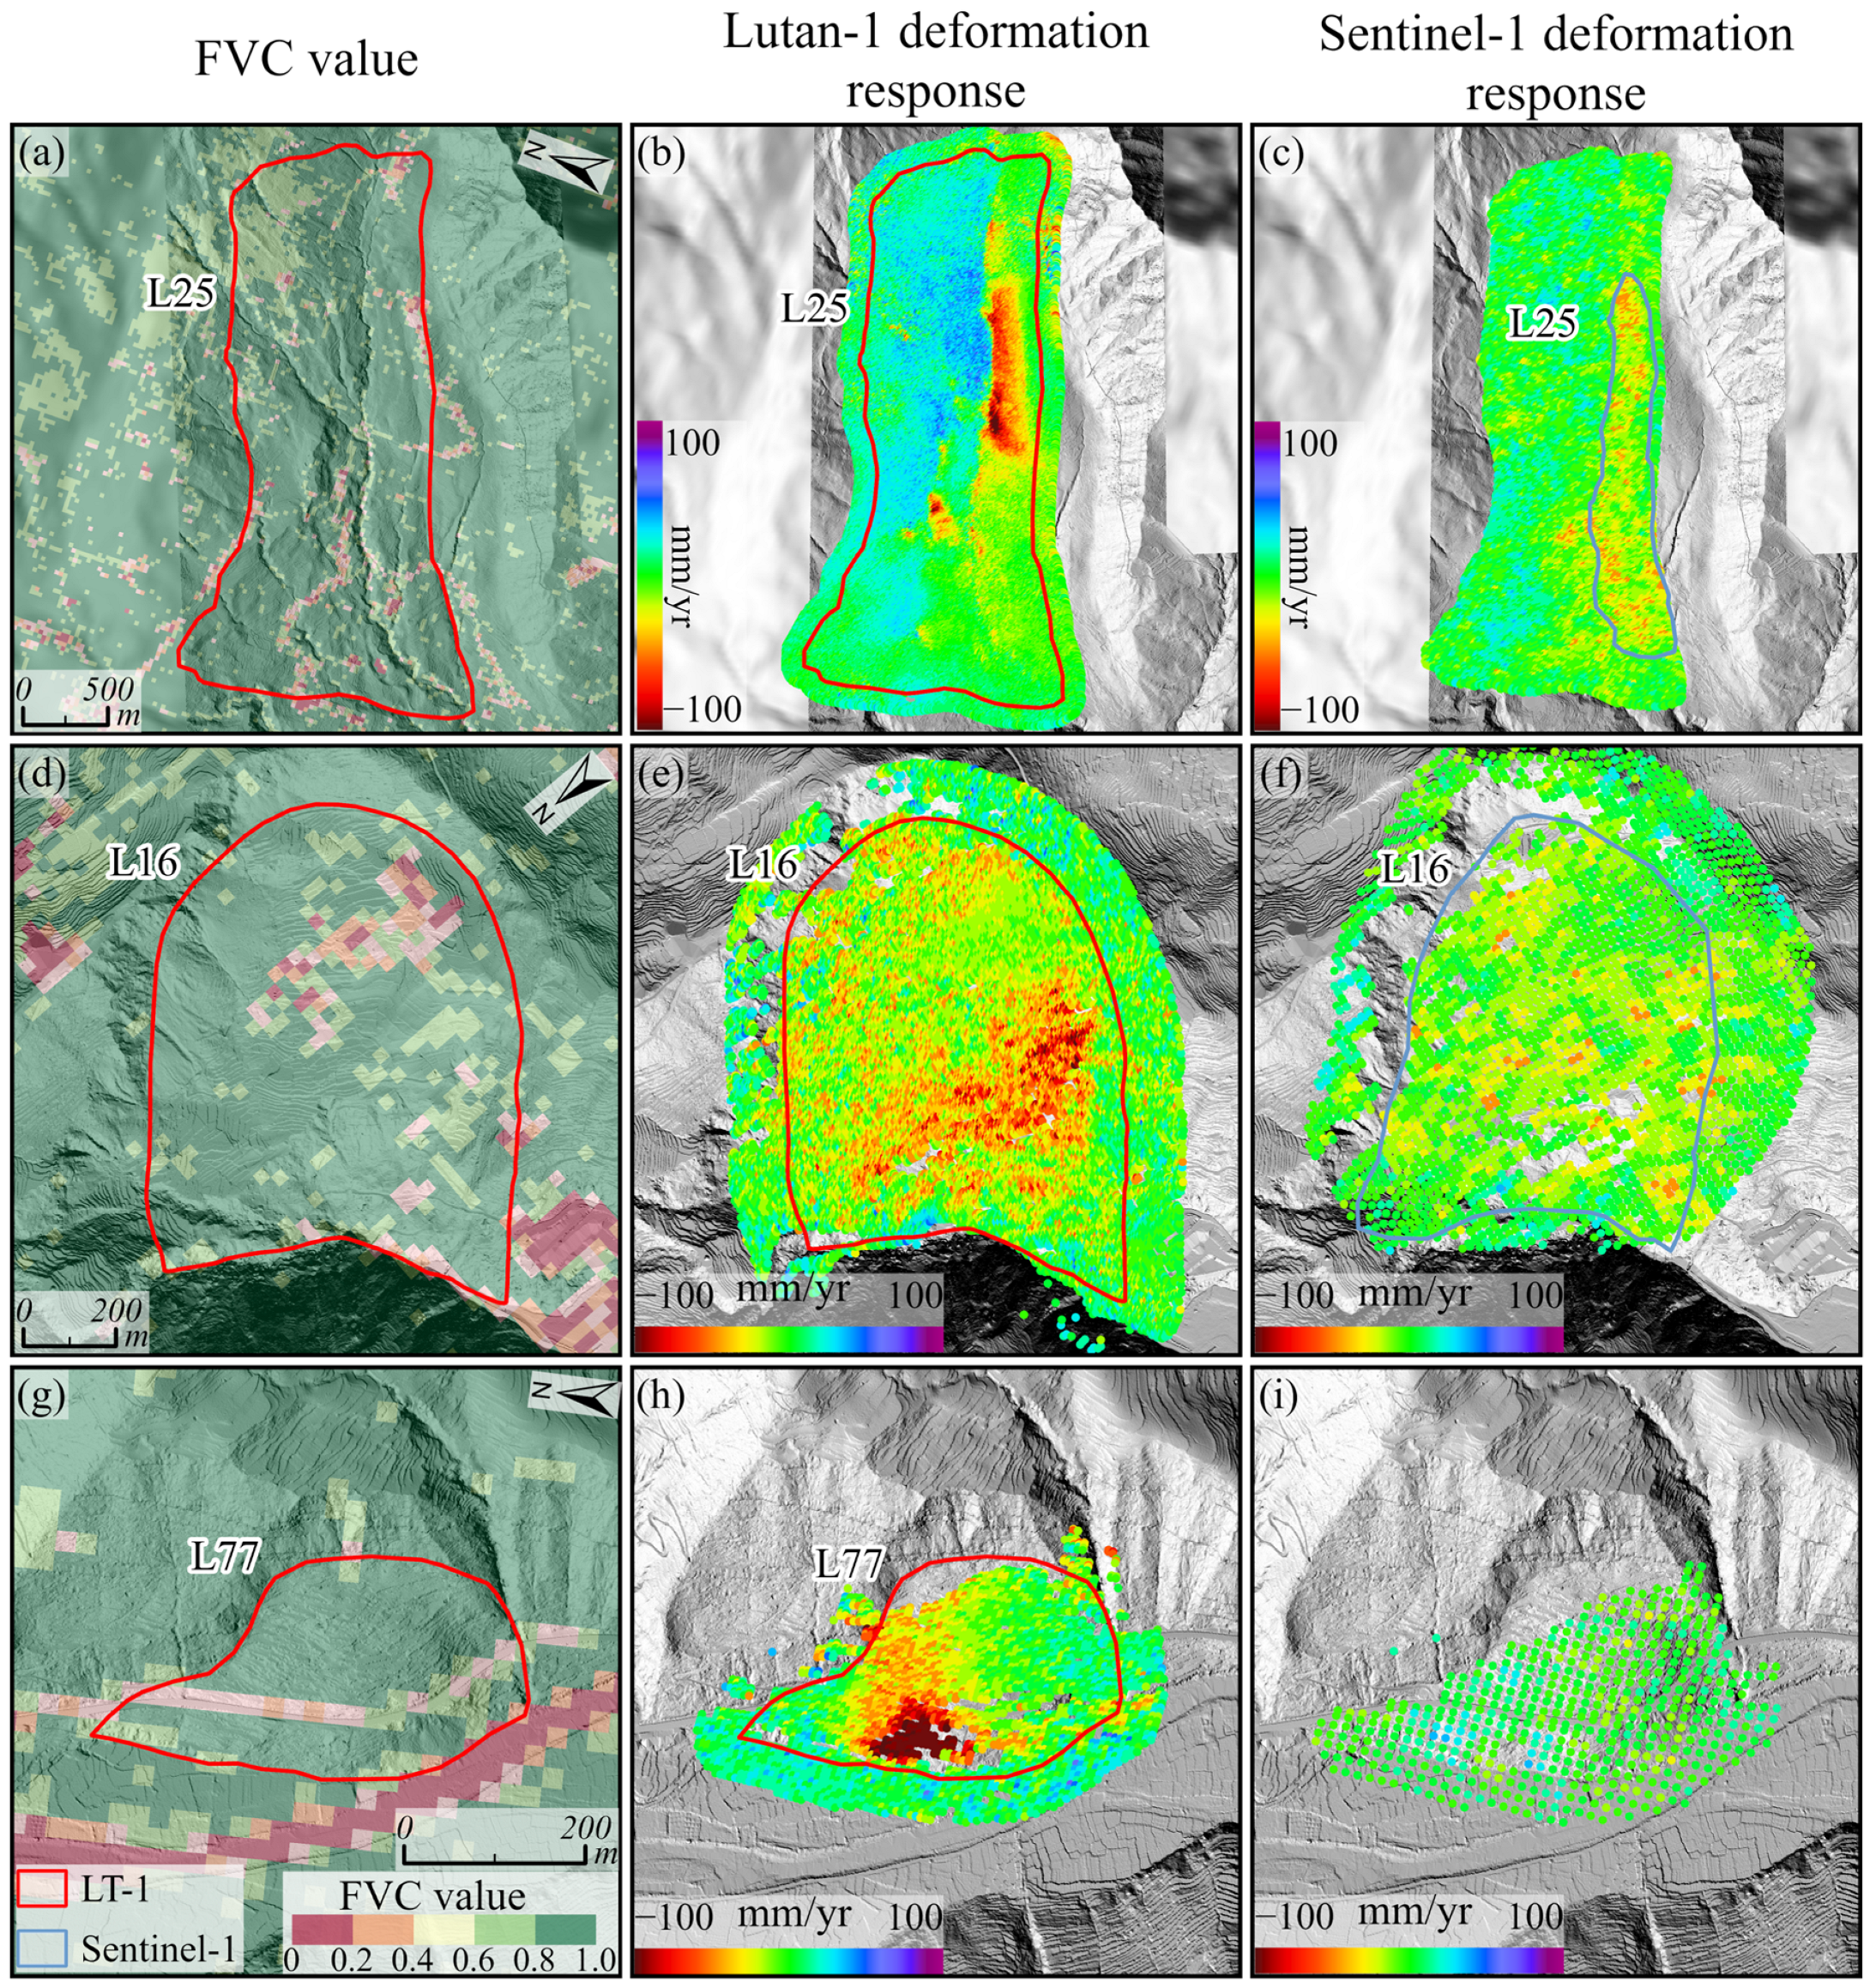
To further compare the landslide-scale identification performance of Lutan-1 and Sentinel-1, three landslides, L25, L16, and L77, were selected for local comparative analysis. The point-density maps were used to compare the ability of the two SAR datasets to preserve valid deformation information within and around the landslide bodies, while the time-series deformation plots were used to compare the cumulative LOS displacement evolution at representative points.
Figure 11 presents the valid deformation points and LOS deformation-rate patterns of L25, L16, and L77 derived from Lutan-1 and Sentinel-1. Compared with Sentinel-1, Lutan-1 preserves denser and more spatially continuous valid deformation points within the three landslide bodies, with distributions that better correspond to the landslide boundaries, slope morphology, and local geomorphic anomalies.
Taking L25 as an example, Lutan-1 deformation anomalies are continuously distributed within the landslide area, clearly reflecting deformation differences among different parts of the landslide. A distinct deformation-zoning boundary can also be observed within the landslide body. The deformation rate and LOS deformation pattern differ on the two sides of this boundary, which may be related to changes in slope aspect, micro-geomorphic conditions, and internal deformation zoning. In comparison, Sentinel-1 also captures the main active area of L25, but the deformation points are more dispersed, and the spatial clustering of high-rate deformation points is weaker than that observed from Lutan-1.
For L16, the Lutan-1 results show that points with higher deformation rates are mainly concentrated in the middle part of the landslide, forming a relatively focused deformation anomaly zone that corresponds well to the main landslide body. Some internal deformation differences are still present within this anomaly zone, while the surrounding areas are dominated by medium- to low-rate deformation points. Overall, the deformation gradually weakens from the center toward the margins. Sentinel-1 also extracts deformation anomalies in L16, and the high-rate deformation area is spatially consistent with the Lutan-1 result. Unlike L25, the main deformation zones identified by the two datasets in L16 are relatively consistent, although the deformation-rate magnitude derived from Sentinel-1 is generally smaller than that from Lutan-1.
L77 is a small road-slope landslide. The Lutan-1 result preserves a relatively complete set of deformation points within the landslide area. Points with higher deformation rates are mainly concentrated from the middle to lower parts of the landslide, corresponding well to the main active zone and boundary outline, and clearly reflecting internal deformation differences within the slope body. In contrast, the Sentinel-1 result does not show a distinct deformation anomaly corresponding to the L77 landslide area. The deformation rates of the points are generally weak, and no recognizable deformation concentration zone is formed.
The deformation-rate maps above indicate clear differences between Lutan-1 and Sentinel-1 in representing deformation rates for representative landslides, with Sentinel-1 generally showing smaller rate magnitudes. Spatial results alone cannot fully reveal how these differences evolve across acquisition dates, nor do they allow a direct comparison of the temporal response of the two datasets for the same landslide. Therefore, representative points were selected from L25 and L16 to extract cumulative LOS displacement series. The time-series curves were then compared to further examine differences in stage-wise changes and amplitude evolution between the two sensors.
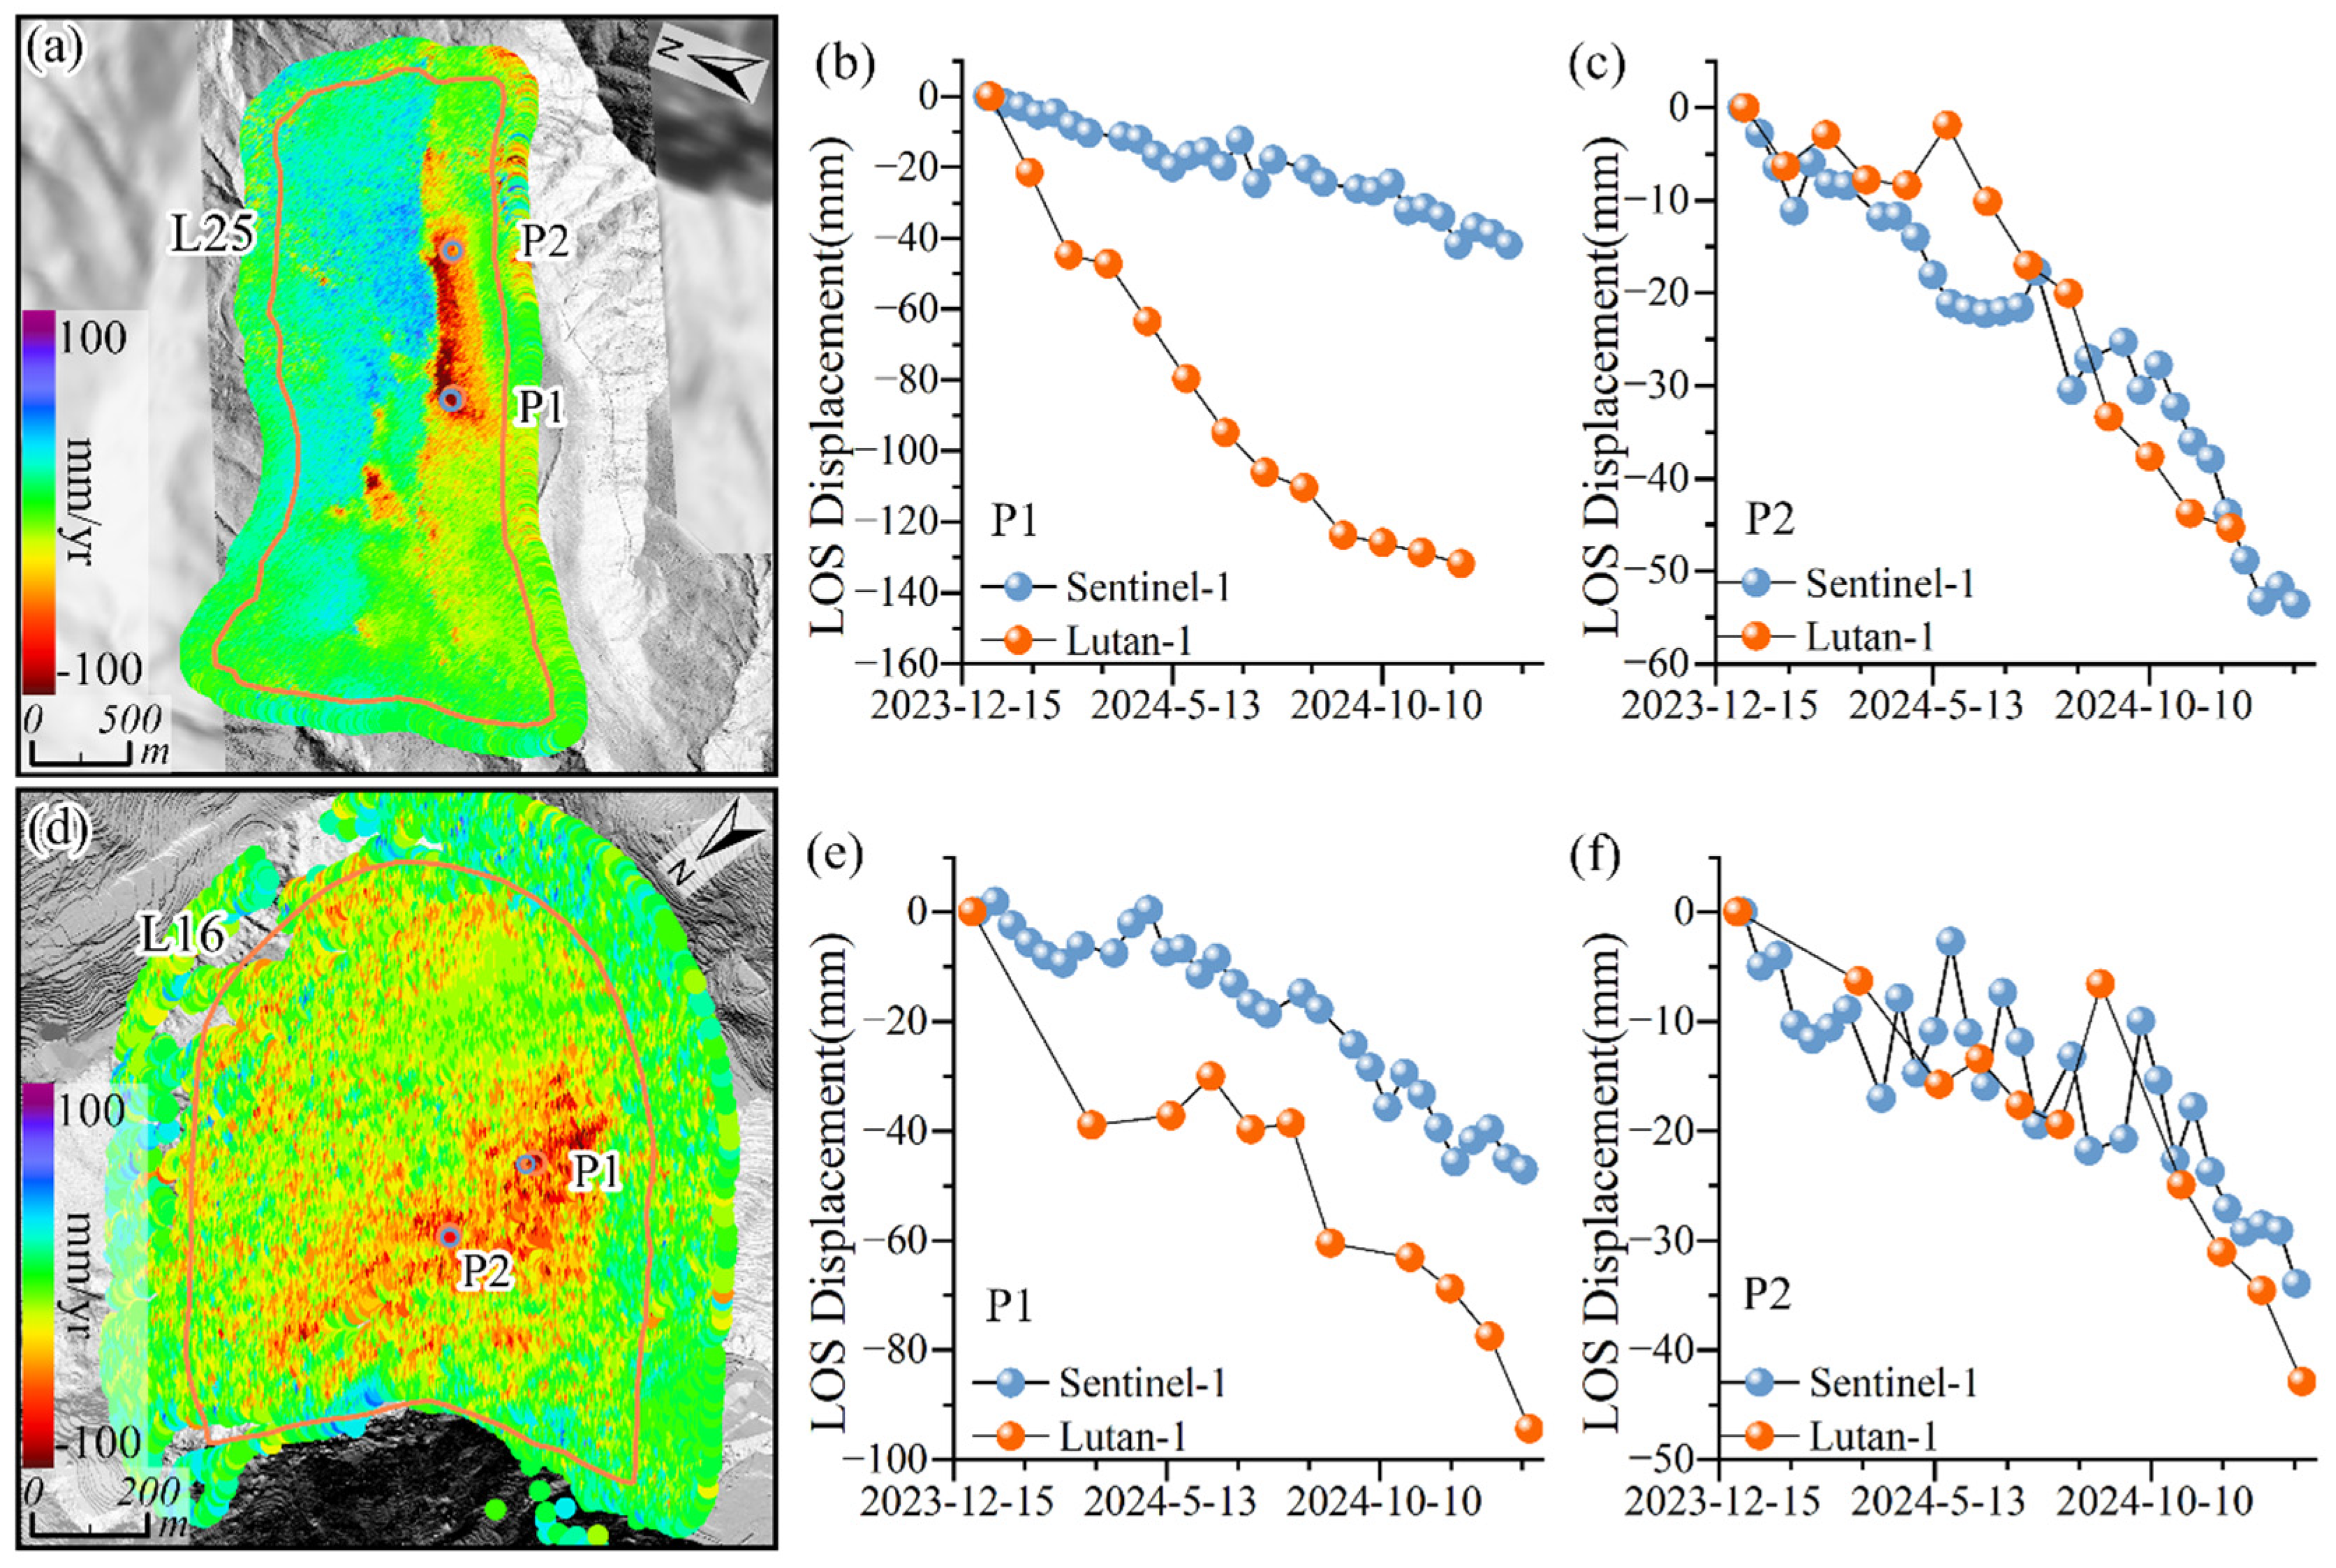
To compare the time-series deformation responses of the two datasets, cumulative LOS displacement changes at representative points in two typical landslides, L25 and L16, are presented in Figure 12. The representative points were selected based on the annual mean deformation-rate results from Lutan-1. P1 represents a location with a relatively high deformation rate within the landslide, whereas P2 represents a location with a moderate deformation rate and relatively stable spatial position. Considering the differences in spatial resolution and geocoded point locations between the two datasets, the Sentinel-1 points were matched near the corresponding Lutan-1 representative points within the same landslide boundary and at similar slope positions.
The time-series results for both datasets are expressed as cumulative displacements along the LOS based on descending-track observations, with the first acquisition epoch of each dataset set to zero. Because the two satellites have different orbital parameters and imaging geometries, their LOS directions are not identical. No projection conversion was applied to transform the results into a common LOS direction. Accordingly, the time series are used primarily to compare displacement trends and relative cumulative amplitudes, and should not be interpreted as direct measurements of the true surface displacement.
Sentinel-1 provided more acquisition epochs, with a temporal sampling interval of approximately 12 days, whereas Lutan-1 had an interval of approximately 28 days. Both datasets yielded displacement time series at the selected representative points.
For L25, P1 shows a clear strong deformation signal. The cumulative LOS displacement derived from Lutan-1 reaches approximately −125.90 mm, whereas the corresponding Sentinel-1 point shows a cumulative LOS displacement of approximately −40.29 mm, indicating a marked difference between the two datasets. In contrast, the cumulative LOS displacement at P2 is more similar between the two datasets, suggesting that for the weaker deformation part within the same landslide, the two SAR datasets can provide comparable displacement trends. This indicates that the deformation response varies spatially within L25, and that the time-series performance of the two sensors differs across points with different deformation intensities.
For L16, both datasets show negative cumulative displacement trends at P1 and P2. The cumulative LOS displacements of P1 and P2 from Lutan-1 are −94.34 mm and −42.88 mm, respectively, while those from Sentinel-1 are −46.99 mm and −33.94 mm. The difference in cumulative displacement between the two datasets is more evident at P1, whereas the amplitudes at P2 are more similar, indicating that deformation intensity also varies among different parts of L16.

5. Analysis and Discussion

5.1. Effective Observation Capability in Complex Mountainous Areas

In densely vegetated and topographically complex mountainous areas, the differences between Lutan-1 and Sentinel-1 in landslide identification do not arise mainly from insufficient geometric visibility, but rather from differences in coherence retention, spatial resolution, and temporal sampling under vegetation cover. The results of this study show that, after combining ascending and descending tracks, both datasets achieved relatively high geometric visibility, indicating that most slopes in the study area provide a basic geometric basis for InSAR observations. Therefore, the observed differences in landslide identification should be further interpreted in terms of radar wavelength, vegetation scattering, spatial resolution, and coherence-retention mechanisms.
From a physical perspective, the shorter wavelength of C-band Sentinel-1 makes it more sensitive to shallow surface scattering and subtle deformation changes. However, in densely vegetated slopes, C-band observations are more susceptible to canopy structure, seasonal growth, and changes in vegetation volume scattering, which in turn induce temporal decorrelation. By contrast, the longer wavelength of L-band Lutan-1 provides stronger penetration into vegetation and better coherence retention, making it easier to preserve continuous and stable interferometric observations at the slope scale.
It should also be noted that the longer wavelength of L-band implies lower phase sensitivity to very small displacement changes than C-band. However, Lutan-1’s higher spatial resolution partially compensates for this limitation. Finer spatial sampling helps preserve landslide boundaries, local deformation partitioning, and small-scale slope morphology, enabling a more continuous and interpretable landslide-scale deformation expression even in densely vegetated mountainous terrain. Thus, the advantage of Lutan-1 in this study is not determined solely by its L-band wavelength, but by the combined effects of better coherence retention and higher spatial resolution.
This understanding is broadly consistent with previous multi-band SAR landslide monitoring studies, which show that C-band data are advantageous for time-series monitoring over bare ground, urban areas, or regions with low vegetation cover, whereas L-band data are better suited to maintaining coherence and preserving continuous deformation information in vegetated mountainous terrain. For areas such as Hanyuan County, where dense vegetation cover and deeply incised valleys coexist, higher coherence retention and more refined spatial expression jointly affect the continuity of valid deformation points, the delineation of landslide boundaries, and the detection of concealed landslides. Accordingly, the applicability differences between Lutan-1 and Sentinel-1 in the study area should be understood as observation differences jointly controlled by wavelength, spatial resolution, and temporal sampling under broadly comparable geometric visibility conditions. Lutan-1 is therefore more suitable for the spatial identification of potential landslides in densely vegetated slopes, whereas Sentinel-1 remains valuable for time-series verification and multi-source validation in areas with relatively clear deformation signals or more stable scattering conditions.

5.2. Differences in Time-Series Deformation Response and Multi-Source SAR Complementarity

The time-series deformation results shown in Figure 12 reveal differences in how the two SAR datasets respond to different deformation-intensity zones within the same landslide. Representative points in both L25 and L16 exhibit negative cumulative LOS displacement, indicating that both datasets can capture the deformation evolution of landslides. However, the differences between the two datasets are mainly observed at strongly deforming points, whereas their time-series trends are more similar at moderately deforming points. Taking L25 as an example, P1 is located in a relatively strongly deforming zone, and the cumulative displacement derived from Lutan-1 differs markedly from that of Sentinel-1. By contrast, at P2 and other moderately deforming locations, the two curves are more similar. L16 shows a similar pattern: the amplitude difference at P1 is more pronounced, whereas P2 exhibits a more comparable trend. In other words, the two datasets do not respond identically to different deformation-intensity zones within the same landslide, and the discrepancy is more evident at strongly deforming points.
This deformation differentiation may be associated with differences in wavelength, coherence retention, temporal sampling, and LOS observation geometry. In InSAR, deformation-induced phase change is directly related to LOS displacement, with one 2π phase cycle corresponding to a LOS displacement of λ/2 [45,56]. Sentinel-1 operates in the C band and has a shorter wavelength, making it more sensitive to displacement changes, but it is also more prone to decorrelation and temporal inversion fluctuations under larger deformation gradients. Lutan-1 operates in the L band and has a longer wavelength, which provides a wider phase-change tolerance for strongly deforming areas and therefore favors a more stable cumulative displacement series. At the same time, the dense vegetation cover in the study area further weakens C-band coherence, making Sentinel-1 more susceptible to vegetation volume scattering and temporal decorrelation in some strongly deforming areas [12,57]. These factors can help explain why Lutan-1 shows a more stable and larger cumulative LOS displacement response at strongly deforming points, whereas the time-series changes in the two datasets are more similar at moderately deforming locations.
The main advantage of Sentinel-1 lies in temporal sampling. Its revisit cycle of approximately 12 days provides denser acquisition epochs, which is helpful for identifying stage-wise changes in the displacement sequence. Lutan-1 has a revisit cycle of approximately 28 days. Although it provides fewer epochs, it can still maintain a relatively stable coherence basis under dense vegetation cover, supporting long-term cumulative deformation expression. Therefore, the two datasets are complementary in the temporal dimension: Sentinel-1 is better suited to checking short-term stage-wise changes, whereas Lutan-1 is more effective at preserving cumulative responses at strongly deforming points and the overall deformation pattern at the landslide scale.

5.3. Uncertainties and Limitations

Although this study systematically compared Lutan-1 and Sentinel-1 in terms of geometric visibility, interferometric coherence, FVC response, and the time-series deformation characteristics of representative landslides, several limitations remain. First, owing to data availability, independent observations such as GNSS measurements, corner reflectors, or continuous ground-based monitoring were not available. The absolute deformation magnitudes retrieved from the two SAR datasets therefore could not be directly validated. The present analysis relies mainly on relative differences among multi-source remote-sensing results, spatial correspondence, and consistency with field-verified sites. This approach captures the comparative performance of the two datasets, but it provides only limited constraint on absolute accuracy.
The comparability of the two datasets is also affected by their different polarization modes. Lutan-1 and Sentinel-1 used HH and VV polarization modes, respectively. Because these modes respond differently to vegetation structure and surface-scattering conditions, they may affect interferometric coherence, the retention of effective deformation points, phase unwrapping, and deformation retrieval. The two datasets also differ in wavelength, spatial resolution, and imaging geometry. Their individual effects cannot therefore be separated using the available data. The reported differences should consequently be understood as the combined performance of the two sensors under their respective observation conditions, rather than as effects attributable solely to radar wavelength.
The temporal coverage and validation data impose further limitations. The number of available Lutan-1 acquisitions remains limited. For some representative landslides, time-series analysis could only be performed at a small number of representative points, so longer-term evolution and intermittent deformation could not be fully characterized. In addition, the landslide identification results depend on integrated interpretation of InSAR, optical imagery, DEM, and LiDAR data. Although this improves reliability, local boundary delineation and deformation partitioning may still be affected by image-resolution differences, topographic occlusion, and interpreter experience. Field validation covered only 15 sites, including different identification types, but this sample remains insufficient to represent all 77 potential landslide hazards. Finally, because this study was conducted in a single county, the conclusions are closely tied to the dense vegetation cover and strong relief of Hanyuan County. Their transferability to other terrain and vegetation settings still needs further verification. Future work should combine longer time-series multi-band SAR observations, continuous ground monitoring data, and higher-resolution topographic measurements to further assess the applicability and stability of the two sensors in different mountainous environments.

6. Conclusions

This study focused on Hanyuan County, Sichuan Province, China, and compared the applicability of Lutan-1 and Sentinel-1 for potential landslide hazard identification in densely vegetated, strongly dissected mountainous terrain. Ascending and descending SAR images acquired from 2024 to 2025 were used together with optical imagery, DEM, LiDAR, and field survey data. The results show that both datasets provide a favorable geometric basis for observation in the study area. After the ascending and descending tracks were combined, the visible proportions of Lutan-1 and Sentinel-1 reached 98.48% and 97.76%, respectively, with layover and shadow effects substantially reduced. This indicates that both datasets can provide effective geometric coverage for landslide identification in complex mountainous terrain. Under this geometric basis, Lutan-1 showed higher interferometric coherence and a larger valid grid-cell proportion at the unified grid scale. It also maintained relatively stable coherence in densely vegetated areas, indicating stronger effective observation capability of L-band data in this type of mountainous environment.
Based on integrated interpretation of multi-source remote sensing data, 77 potential landslide hazards were identified in the study area, including 74 detected by Lutan-1, 17 by Sentinel-1, and 14 jointly detected by both datasets. Field validation showed clear signs of landslide activity at 12 of the 15 validation sites, supporting the reliability of the landslide identification results derived from InSAR deformation anomalies and optical, DEM, and LiDAR information. Comparisons of representative landslides further showed that Lutan-1 preserved denser and more continuous valid deformation points in densely vegetated and small landslide settings. This is beneficial for landslide boundary interpretation and analysis of internal deformation differences. Although Sentinel-1 identified fewer landslides overall, it still performed well for some larger landslides with more continuous deformation anomalies.
Time-series analysis of representative landslides showed that both Lutan-1 and Sentinel-1 captured negative cumulative LOS displacement at representative points, but their displacement responses differed among zones with different deformation intensities. Lutan-1 tended to show larger cumulative displacement amplitudes at strongly deforming points, whereas Sentinel-1, with its higher temporal sampling density, provided an important complement for checking stage-wise changes and cross-validating multi-source results. Overall, in mountainous regions such as Hanyuan County, where dense vegetation cover and strong topographic relief coexist, Lutan-1 is more suitable for spatial identification of potential landslides and extraction of key landslide deformation information. Sentinel-1 can provide complementary information in the temporal dimension. Their combined use helps balance spatial identification accuracy and temporal monitoring continuity, providing a more reliable data basis for potential landslide hazard identification in complex mountainous regions.

Author Contributions

Conceptualization, L.D. and W.L.; Methodology, L.D. and W.L.; Software, L.D., H.L. and J.Q.; Validation, W.L. and S.Z.; Formal analysis, L.D., W.L. and S.Z.; Investigation, L.D., J.R., H.F., J.H. and W.L.; Resources, W.L.; Data curation, L.D., Y.S. (Yunfeng Shan), Y.S. (Yuyang Song) and Z.L.; Writing—original draft preparation, L.D.; Writing—review and editing, L.D. and W.L.; Visualization, L.D.; Supervision, W.L.; Project administration, W.L.; Funding acquisition, W.L. All authors have read and agreed to the published version of the manuscript.

Funding

This research was funded by the Key R&D Program of the Xinjiang Uygur Autonomous Region (Grant No. 2023B03011) and the Project of Sichuan Institute of Land and Space Ecological Restoration and Geological Hazard Prevention.

Data Availability Statement

The datasets generated and/or analyzed during the current study are available from the corresponding author upon reasonable request.

Acknowledgments

The authors thank the Land Satellite Remote Sensing Application Center, China, for providing the Lutan-1 SAR imagery. The authors also acknowledge the European Space Agency for providing the Sentinel-1A/B data and the United States Geological Survey for providing the SRTM DEM used in this study.

Conflicts of Interest

Authors Juan Ren, Hao Fu, and Jiayang He were employed by the Sichuan Institute of Land and Space Ecological Restoration and Geological Hazard Prevention, Chengdu 610081, China. Author Huiyan Lu was employed by China Railway Eryuan Engineering Group Co., Ltd., Chengdu 610031, China. Author Jiasong Qin was employed by Guangxi Transportation Design Group Co., Ltd., Nanning 530029, China. The remaining authors declare that the research was conducted in the absence of any commercial or financial relationships that could be construed as a potential conflict of interest.

References

  1. Xu, Q.; Zhao, B.; Dai, K.; Dong, X.; Li, W.; Zhu, X.; Yang, Y.; Xiao, X.; Wang, X.; Huang, J.; et al. Remote Sensing for Landslide Investigations: A Progress Report from China. Eng. Geol. 2023, 321, 107156. [Google Scholar] [CrossRef] [Scilit]
  2. Xu, Q.; Dong, X.; Li, W. Integrated Space-Air-Ground Early Detection, Monitoring and Warning System for Potential Catastrophic Geohazards. Geomat. Inf. Sci. Wuhan Univ. 2019, 44, 957–966. [Google Scholar]
  3. Lu, H.; Li, W.; Xu, Q.; Yu, W.; Zhou, S.; Li, Z.; Zhan, W.; Li, W.; Xu, S.; Zhang, P.; et al. Active Landslide Detection Using Integrated Remote Sensing Technologies for a Wide Region and Multiple Stages: A Case Study in Southwestern China. Sci. Total Environ. 2024, 931, 172709. [Google Scholar] [CrossRef] [Scilit]
  4. Cheng, Y.; Pang, H.; Li, Y.; Fan, L.; Wei, S.; Yuan, Z.; Fang, Y. Applications and Advancements of Spaceborne InSAR in Landslide Monitoring and Susceptibility Mapping: A Systematic Review. Remote Sens. 2025, 17, 999. [Google Scholar] [CrossRef] [Scilit]
  5. Zhang, L.; Dai, K.; Deng, J.; Ge, D.; Liang, R.; Li, W.; Xu, Q. Identifying Potential Landslides by Stacking-InSAR in Southwestern China and Its Performance Comparison with SBAS-InSAR. Remote Sens. 2021, 13, 3662. [Google Scholar] [CrossRef] [Scilit]
  6. Zhou, S.; Chen, B.; Lu, H.; Shan, Y.; Li, Z.; Li, P.; Cao, X.; Li, W. Analysis of the Spatial Distribution and Deformation Types of Active Landslides in the Upper Jinsha River, China, Using Integrated Remote Sensing Technologies. Remote Sens. 2024, 16, 100. [Google Scholar] [CrossRef] [Scilit]
  7. Shan, Y.; Xu, Z.; Zhou, S.; Lu, H.; Yu, W.; Li, Z.; Cao, X.; Li, P.; Li, W. Landslide Hazard Assessment Combined with InSAR Deformation: A Case Study in the Zagunao River Basin, Sichuan Province, Southwestern China. Remote Sens. 2024, 16, 99. [Google Scholar] [CrossRef] [Scilit]
  8. Yu, W.; Li, W.; Wu, Z.; Lu, H.; Xu, Z.; Wang, D.; Dong, X.; Li, P. Integrated Remote Sensing Investigation of Suspected Landslides: A Case Study of the Genie Slope on the Tibetan Plateau, China. Remote Sens. 2024, 16, 2412. [Google Scholar] [CrossRef] [Scilit]
  9. Lv, J.; Hong, R.; Bao, X.; Wu, R.; He, X.; Liu, G.; Zhang, R. A Deep Learning Multi-Branch Network Method for Landslide Susceptibility Mapping in the Sichuan-Tibet Transportation Corridor. Bull. Eng. Geol. Environ. 2026, 85, 226. [Google Scholar] [CrossRef] [Scilit]
  10. Cigna, F.; Bateson, L.B.; Jordan, C.J.; Dashwood, C. Simulating SAR geometric distortions and predicting Persistent Scatterer densities for ERS-1/2 and ENVISAT C-band SAR and InSAR applications: Nationwide feasibility assessment to monitor the landmass of Great Britain with SAR imagery. Remote Sens. Environ. 2014, 152, 441–466. [Google Scholar] [CrossRef] [Scilit]
  11. Zhang, Z.; Wu, S.; Zhao, C.; Shi, G.; Ding, X.; Zhang, B.; Li, Z.; Wang, Y.; Lu, Z. Evaluation of InSAR Applicability Using a New Multi-Index and Optical Imagery: A Case Study in the Guangdong-Hong Kong-Macao Greater Bay Area, China. Remote Sens. Appl. Soc. Environ. 2025, 37, 101474. [Google Scholar] [CrossRef] [Scilit]
  12. Chen, Y.; Sun, Q.; Hu, J. Quantitatively Estimating of InSAR Decorrelation Based on Landsat-Derived NDVI. Remote Sens. 2021, 13, 2440. [Google Scholar] [CrossRef] [Scilit]
  13. Li, Z.; Shi, G.; Wu, S.; Li, T.; Lu, Z.; Ding, X. Mapping and early warning of hidden landslides under forests: A case in Lantau, Hong Kong. Remote Sens. Environ. 2025, 331, 115039. [Google Scholar] [CrossRef] [Scilit]
  14. Cao, C.; Zhu, K.; Song, T.; Bai, J.; Zhang, W.; Chen, J.; Song, S. Comparative Study on Potential Landslide Identification with ALOS-2 and Sentinel-1A Data in Heavy Forest Reach, Upstream of the Jinsha River. Remote Sens. 2022, 14, 1962. [Google Scholar] [CrossRef] [Scilit]
  15. Dong, J.; Zhang, L.; Li, M.; Yu, Y.; Liao, M.; Gong, J.; Luo, H. Measuring Precursory Movements of the Recent Xinmo Landslide in Mao County, China with Sentinel-1 and ALOS-2 PALSAR-2 Datasets. Landslides 2018, 15, 135–144. [Google Scholar] [CrossRef] [Scilit]
  16. Liu, X.; Zhao, C.; Zhang, Q.; Yin, Y.; Lu, Z.; Samsonov, S.; Yang, C.; Wang, M.; Tomás, R. Three-Dimensional and Long-Term Landslide Displacement Estimation by Fusing C- and L-Band SAR Observations: A Case Study in Gongjue County, Tibet, China. Remote Sens. Environ. 2021, 267, 112745. [Google Scholar] [CrossRef] [Scilit]
  17. Zhang, R.; Zhao, X.; Dong, X.; Dai, K.; Deng, J.; Zhuo, G.; Yu, B.; Wu, T.; Xiang, J. Potential Landslide Identification in Baihetan Reservoir Area Based on C-/L-Band Synthetic Aperture Radar Data and Applicability Analysis. Remote Sens. 2024, 16, 1591. [Google Scholar] [CrossRef] [Scilit]
  18. Chen, F.; Lin, H.; Hu, X. Slope Superficial Displacement Monitoring by Small Baseline SAR Interferometry Using Data from L-Band ALOS PALSAR and X-Band TerraSAR: A Case Study of Hong Kong, China. Remote Sens. 2014, 6, 1564–1586. [Google Scholar] [CrossRef] [Scilit]
  19. Lv, J.; Zhang, R.; Bao, X.; Wu, R.; Hong, R.; He, X.; Liu, G. Time-Series InSAR Landslide Three-Dimensional Deformation Prediction Method Considering Meteorological Time-Delay Effects. Eng. Geol. 2025, 350, 107986. [Google Scholar] [CrossRef] [Scilit]
  20. Lv, J.; Zhang, R.; Fang, K.; Chen, K.; Shama, A.; Hong, R.; He, X.; Liu, G. Time-Series InSAR with Phase Gradient Stacking and Slope-Constrained Clustering for Large-Scale Landslide Detection in the Sichuan-Tibet Region. Eng. Geol. 2026, 360, 108464. [Google Scholar] [CrossRef] [Scilit]
  21. Wang, R.; Liu, K.; Liu, D.; Ou, N.; Yue, H.; Chen, Y.; Yu, W.; Liang, D.; Cai, Y. LuTan-1: An Innovative L-Band Spaceborne Bistatic Interferometric Synthetic Aperture Radar Mission. IEEE Geosci. Remote Sens. Mag. 2025, 13, 58–78. [Google Scholar] [CrossRef] [Scilit]
  22. Hu, H.; Fu, H.; Zhu, J.; Han, Q.; Wang, A.; Wu, K.; Zeng, D.; Xie, Y.; Zhang, M.; Liu, Y. First Evaluation of the Coherence of LuTan-1 Bistatic InSAR System. Int. J. Appl. Earth Obs. Geoinf. 2025, 144, 104853. [Google Scholar] [CrossRef] [Scilit]
  23. Deng, Y.K.; Wang, Y.; Liu, K.Y.; Ou, N.M.; Liu, D.C.; Zhang, H.; Wang, J.L. Key Technologies for Spaceborne SAR Payload of LuTan-1 Satellite System. Acta Geod. Cartogr. Sin. 2024, 53, 1881–1895. [Google Scholar]
  24. Li, T.; Tang, X.M.; Li, S.J.; Zhou, X.Q.; Zhang, X.; Xu, Y.Z. Classification of Basic Deformation Products of L-Band Differential Interfero-Metric SAR Satellite. Acta Geod. Cartogr. Sin. 2023, 52, 769. [Google Scholar]
  25. Tang, X.M.; Li, T.; Zhang, X.; Zhou, X.Q.; Lu, J.; Zhang, X.F. In-Orbit Application Parameters Test and Analysis of L-Band Differential Interferometric SAR Satellite Constellation. Acta Geod. Cartogr. Sin. 2024, 53, 1863–1872. [Google Scholar]
  26. Ji, Y.; Zhang, X.; Li, T.; Fan, H.; Xu, Y.; Li, P.; Tian, Z. Mining Deformation Monitoring Based on Lutan-1 Monostatic and Bistatic Data. Remote Sens. 2023, 15, 5668. [Google Scholar] [CrossRef] [Scilit]
  27. Li, H.; Li, B.; Li, Y.; Duan, H. The Stability Analysis of Mt. Gongga Glaciers Affected by the 2022 Luding MS 6.8 Earthquake Based on LuTan-1 and Sentinel-1 Data. Remote Sens. 2023, 15, 3882. [Google Scholar] [CrossRef] [Scilit]
  28. Li, X.; Peng, J.; Zheng, Y.; Chen, X.; Peng, Y.; Ma, X.; Su, Y.; Shi, M.; Qi, X.; Jiang, X.; et al. Coseismic Deformation Monitoring and Seismogenic Fault Parameter Inversion Using Lutan-1 Data: A Comparative Analysis with Sentinel-1A Data. Remote Sens. 2025, 17, 894. [Google Scholar] [CrossRef] [Scilit]
  29. Chen, H.; Qin, Z.; Liu, B.; Peng, R.; Yu, Z.; Yao, T.; Yang, Z.; Feng, G.; Wang, W. Assessing the Landslide Identification Capability of LuTan-1 in Hilly Regions: A Case Study in Longshan County, Hunan Province. Remote Sens. 2025, 17, 960. [Google Scholar] [CrossRef] [Scilit]
  30. Jiang, H.; Yang, X.; Wen, H.; Wang, X.; Lei, C.; Zhang, R. Detection of Small-Scale Potential Landslides in Vegetation-Covered Areas of the Hengduan Mountains Using LT-1 Imagery: A Case Study of the Luding Seismic Zone. Remote Sens. 2025, 17, 3225. [Google Scholar] [CrossRef] [Scilit]
  31. Xiong, J.; Chen, T.; Yang, G.; Wang, R.; Li, M.; Zhao, L.; Chen, C. Discussion on the Effectiveness of Landslide Hazard Identification and Factors Affecting the Effectiveness of LT-1 Satellite Based on InSAR Technology. Geocarto Int. 2025, 40, 2461539. [Google Scholar] [CrossRef] [Scilit]
  32. Xu, Q.S.; Hu, J.; Cui, W.G.; Liu, S.H.; Hu, D.; Ning, F.; Li, M. Identification of Landslide Hazards of Beipanjiang Guangzhao Hydropower Station Based on Lutan-1 SAR Satellite. Bull. Surv. Mapp. 2025, 3, 71–75. [Google Scholar]
  33. Yang, J.; Wang, J.; Guo, J.C.; Xie, H.; Feng, H. Analysis of Geological Hazard Potential Detection in Guizhou Mountainous Area Based on L-SAR Data. Sci. Surv. Mapp. 2024, 49, 174–182. [Google Scholar]
  34. Lv, J.; Zhang, R.; Shama, A.; Hong, R.; He, X.; Wu, R.; Bao, X.; Liu, G. Exploring the Spatial Patterns of Landslide Susceptibility Assessment Using Interpretable Shapley Method: Mechanisms of Landslide Formation in the Sichuan-Tibet Region. J. Environ. Manag. 2024, 366, 121921. [Google Scholar] [CrossRef] [Scilit]
  35. Ye, F.; Fu, W.-X.; Zhou, H.-F.; Liu, Y.; Ba, R.-J.; Zheng, S. The “8·21” Rainfall-Induced Zhonghaicun Landslide in Hanyuan County of China: Surface Features and Genetic Mechanisms. Landslides 2021, 18, 3421–3434. [Google Scholar] [CrossRef] [Scilit]
  36. Xu, S.; Zhou, X. Spatiotemporal Evolution Characteristics of Hanyuan Landslide in Sichuan Province, China, on 21 August 2020. Appl. Sci. 2025, 15, 3872. [Google Scholar] [CrossRef] [Scilit]
  37. Wang, Y.; Feng, G.; Li, Z.; Yang, Z.; Wang, B.; Wang, Y.; Du, Y.; Wang, Y.; He, L.; Zhu, J. A Multi-Frame Deformation Velocity Splicing Method for Wide-Area InSAR Measurement Based on Uncontrolled Block Adjustment: A Case Study of Long-Term Deformation Monitoring in Guangdong, China. Remote Sens. Environ. 2024, 301, 113929. [Google Scholar] [CrossRef] [Scilit]
  38. Wang, Y.; Feng, G.; Feng, Z.; Wang, Y.; Wang, X.; Luo, S.; Zhao, Y.; Lu, H. An MT-InSAR Data Partition Strategy for Sentinel-1A/B TOPS Data. Remote Sens. 2022, 14, 4562. [Google Scholar] [CrossRef] [Scilit]
  39. Torres, R.; Snoeij, P.; Geudtner, D.; Bibby, D.; Davidson, M.; Attema, E.; Potin, P.; Rommen, B.; Floury, N.; Brown, M. GMES Sentinel-1 Mission. Remote Sens. Environ. 2012, 120, 9–24. [Google Scholar] [CrossRef] [Scilit]
  40. Drusch, M.; Del Bello, U.; Carlier, S.; Colin, O.; Fernandez, V.; Gascon, F.; Hoersch, B.; Isola, C.; Laberinti, P.; Martimort, P. Sentinel-2: ESA’s Optical High-Resolution Mission for GMES Operational Services. Remote Sens. Environ. 2012, 120, 25–36. [Google Scholar] [CrossRef] [Scilit]
  41. Farr, T.G.; Rosen, P.A.; Caro, E.; Crippen, R.; Duren, R.; Hensley, S.; Kobrick, M.; Paller, M.; Rodriguez, E.; Roth, L.; et al. The Shuttle Radar Topography Mission. Rev. Geophys. 2007, 45, 2005RG000183. [Google Scholar] [CrossRef] [Scilit]
  42. Haklay, M.; Weber, P. Openstreetmap: User-Generated Street Maps. IEEE Pervasive Comput. 2008, 7, 12–18. [Google Scholar] [CrossRef] [Scilit]
  43. Sandwell, D.T.; Price, E.J. Phase Gradient Approach to Stacking Interferograms. J. Geophys. Res. Solid Earth 1998, 103, 30183–30204. [Google Scholar] [CrossRef] [Scilit]
  44. Yao, J.; Yao, X.; Liu, X. Landslide Detection and Mapping Based on SBAS-InSAR and PS-InSAR: A Case Study in Gongjue County, Tibet, China. Remote Sens. 2022, 14, 4728. [Google Scholar] [CrossRef] [Scilit]
  45. Rosen, P.A.; Hensley, S.; Joughin, I.R.; Li, F.K.; Madsen, S.N.; Rodriguez, E.; Goldstein, R.M. Synthetic Aperture Radar Interferometry. Proc. IEEE 2000, 88, 333–382. [Google Scholar] [CrossRef] [Scilit]
  46. Hanssen, R.F. Stochastic Model for Radar Interferometry. In Radar Interferometry: Data Interpretation and Error Analysis; Springer: Dordrecht, The Netherlands, 2001; pp. 81–159. [Google Scholar]
  47. Lee, J.-S.; Hoppel, K.W.; Mango, S.A.; Miller, A.R. Intensity and Phase Statistics of Multilook Polarimetric and Interferometric SAR Imagery. IEEE Trans. Geosci. Remote Sens. 1994, 32, 1017–1028. [Google Scholar] [CrossRef] [Scilit]
  48. Ferretti, A.; Monti-Guarnieri, A.; Prati, C.; Rocca, F.; Massonet, D. InSAR Principles-Guidelines for SAR Interferometry Processing and Interpretation; European Space Agency (ESA) Publications: Noordwijk, The Netherlands, 2007; Volume 19. [Google Scholar]
  49. Goldstein, R.M.; Werner, C.L. Radar Interferogram Filtering for Geophysical Applications. Geophys. Res. Lett. 1998, 25, 4035–4038. [Google Scholar] [CrossRef] [Scilit]
  50. Baran, I.; Stewart, M.P.; Kampes, B.M.; Perski, Z.; Lilly, P. A Modification to the Goldstein Radar Interferogram Filter. IEEE Trans. Geosci. Remote Sens. 2003, 41, 2114–2118. [Google Scholar] [CrossRef] [Scilit]
  51. Wegnüller, U.; Werner, C.; Strozzi, T.; Wiesmann, A.; Frey, O.; Santoro, M. Sentinel-1 Support in the GAMMA Software. Procedia Comput. Sci. 2016, 100, 1305–1312. [Google Scholar] [CrossRef] [Scilit]
  52. Costantini, M. A Novel Phase Unwrapping Method Based on Network Programming. IEEE Trans. Geosci. Remote Sens. 2002, 36, 813–821. [Google Scholar] [CrossRef] [Scilit]
  53. Lv, J.; Zhang, R.; Monserrat, O.; Mao, W.; Bao, X.; Wu, R.; Liu, G. Pixel-Level Landslide Stability Mapping Based on Three-Dimensional Time-Series InSAR Monitoring and Dynamics Factors Extraction. J. Rock Mech. Geotech. Eng. 2026, 18, 5194–5217. [Google Scholar] [CrossRef] [Scilit]
  54. Carlson, T.N.; Ripley, D.A. On the Relation between NDVI, Fractional Vegetation Cover, and Leaf Area Index. Remote Sens. Environ. 1997, 62, 241–252. [Google Scholar] [CrossRef] [Scilit]
  55. Gutman, G.; Ignatov, A. The Derivation of the Green Vegetation Fraction from NOAA/AVHRR Data for Use in Numerical Weather Prediction Models. Int. J. Remote Sens. 1998, 19, 1533–1543. [Google Scholar] [CrossRef] [Scilit]
  56. Massonnet, D.; Feigl, K.L. Radar Interferometry and Its Application to Changes in the Earth’s Surface. Rev. Geophys. 1998, 36, 441–500. [Google Scholar] [CrossRef] [Scilit]
  57. Zebker, H.A.; Villasenor, J. Decorrelation in Interferometric Radar Echoes. IEEE Trans. Geosci. Remote Sens. 1992, 30, 950–959. [Google Scholar] [CrossRef] [Scilit]
Figure 1. Overview of the study area.
Remotesensing 18 03053 g001
Figure 2. Technical workflow of this study.
Remotesensing 18 03053 g002
Figure 3. Spatial distribution of FVC in the study area.
Remotesensing 18 03053 g003
Figure 4. Comparative evaluation of geometric visibility in the study area: (a) Lutan-1 ascending track; (b) Lutan-1 descending track; (c) combined Lutan-1 ascending and descending tracks; (d) Sentinel-1 ascending track; (e) Sentinel-1 descending track; and (f) combined Sentinel-1 ascending and descending tracks.
Remotesensing 18 03053 g004
Figure 5. Comparison of grid-scale interferometric coherence and valid grid-cell proportion between Lutan-1 and Sentinel-1 under a unified grid framework. (a) Boxplots of mean grid-cell coherence, where the horizontal line and square in each box denote the median and mean, respectively, the box indicates the interquartile range (IQR), whiskers extend to 1.5 times the IQR, and short horizontal lines indicate outliers; (b) proportion of valid grid cells with mean coherence ≥ 0.4 across different FVC classes.
Remotesensing 18 03053 g005
Figure 6. Coherence distributions of Lutan-1 and Sentinel-1 in the high-FVC range: (a) scatter-density plot of Lutan-1 coherence versus FVC; (b) scatter-density plot of Sentinel-1 coherence versus FVC. The x-axis denotes FVC, the y-axis denotes coherence, and color indicates point density. The red line shows the fitted curve describing the variation in coherence with FVC.
Remotesensing 18 03053 g006
Figure 7. Lutan-1 InSAR identification results and zoomed-in views of representative areas: (a) ascending-track SBAS-InSAR results for the entire study area; (b) descending-track SBAS-InSAR results for the entire study area; (c,d) enlarged views of Area A; (e,f) enlarged views of Area B; and (g,h) enlarged views of Area C. Across all panels, solid boundaries indicate potential landslides identified from the track corresponding to the underlying map, whereas dashed boundaries indicate those identified from the opposite track.
Remotesensing 18 03053 g007
Figure 8. Sentinel-1 landslide hazard identification results and close-up views of representative landslides. (a) SBAS-InSAR results from Sentinel-1; (bd) Sentinel-1 deformation results for L25, L14, and L16; and (eg) corresponding Lutan-1 deformation results for L25, L14, and L16.
Remotesensing 18 03053 g008
Figure 9. Comparison of annual mean LOS deformation rates derived from descending-track Lutan-1 and Sentinel-1 data in three representative areas. Panels (a,c,e) show the Lutan-1 results, while panels (b,d,f) show the corresponding Sentinel-1 results. Each column represents the same area, and red outlines delineate potential landslides.
Remotesensing 18 03053 g009
Figure 10. Remote sensing images of (a) L16 and (b) L25. (basemap from Tianditu); (ce) surface deformation features corresponding to (a); and (fh) surface deformation features corresponding to (b).
Remotesensing 18 03053 g010
Figure 11. Comparison of LiDAR-derived terrain features and deformation responses from Lutan-1 and Sentinel-1 for representative densely vegetated landslides. (a,d,g) LiDAR hillshade overlaid with FVC; (b,e,h) Lutan-1 deformation response; and (c,f,i) Sentinel-1 deformation response. Red lines indicate landslide boundaries, and the color scale represents annual deformation rate.
Remotesensing 18 03053 g011
Figure 12. Comparison of time-series deformation responses from Lutan-1 and Sentinel-1 for representative landslides: (ac) time-series deformation results for L25; and (df) time-series deformation results for L16.
Remotesensing 18 03053 g012
Table 1. Main information on the satellite data used in this study.
Lutan-1Sentinel-1
Imaging modeSTRIP1IW
PolarizationHHVV + VH
Wavelength (cm)23.55.6
Spatial resolution (R & Az)3 m × 3 m5 m × 20 m
Temporal resolution (days)2812
Swath width (km)60250
Orbit directionAscendingDescendingAscendingDescending
Average incidence angle (°)34.0237.3536.6341.66
Heading angle (°)−12.20192.21−12.69192.67
Number of scenes35462930
Time spanMarch 2024–January 2025January 2024–January 2025January 2024–January 2025January 2024–January 2025
Table 2. FVC classification criteria and interpretation.
Fvc RangeVegetation-Cover ClassInterpretation
0 ≤ FVC < 0.2Bare landDominated by water bodies, bare soil, and built-up land
0.2 ≤ FVC < 0.4Low vegetation coverSparse vegetation cover with a large proportion of bare soil
0.4 ≤ FVC < 0.6Moderate vegetation coverMixed distribution of vegetation and bare soil
0.6 ≤ FVC < 0.8Relatively dense vegetation coverRelatively continuous and dense vegetation cover
0.8 ≤ FVC < 1.0Dense vegetation coverDense vegetation cover
Disclaimer/Publisher’s Note: The statements, opinions and data contained in all publications are solely those of the individual author(s) and contributor(s) and not of MDPI and/or the editor(s). MDPI and/or the editor(s) disclaim responsibility for any injury to people or property resulting from any ideas, methods, instructions or products referred to in the content.