The Browning of Alaska’s Boreal Forest


Abstract
:1. Introduction
2. Data and Methods
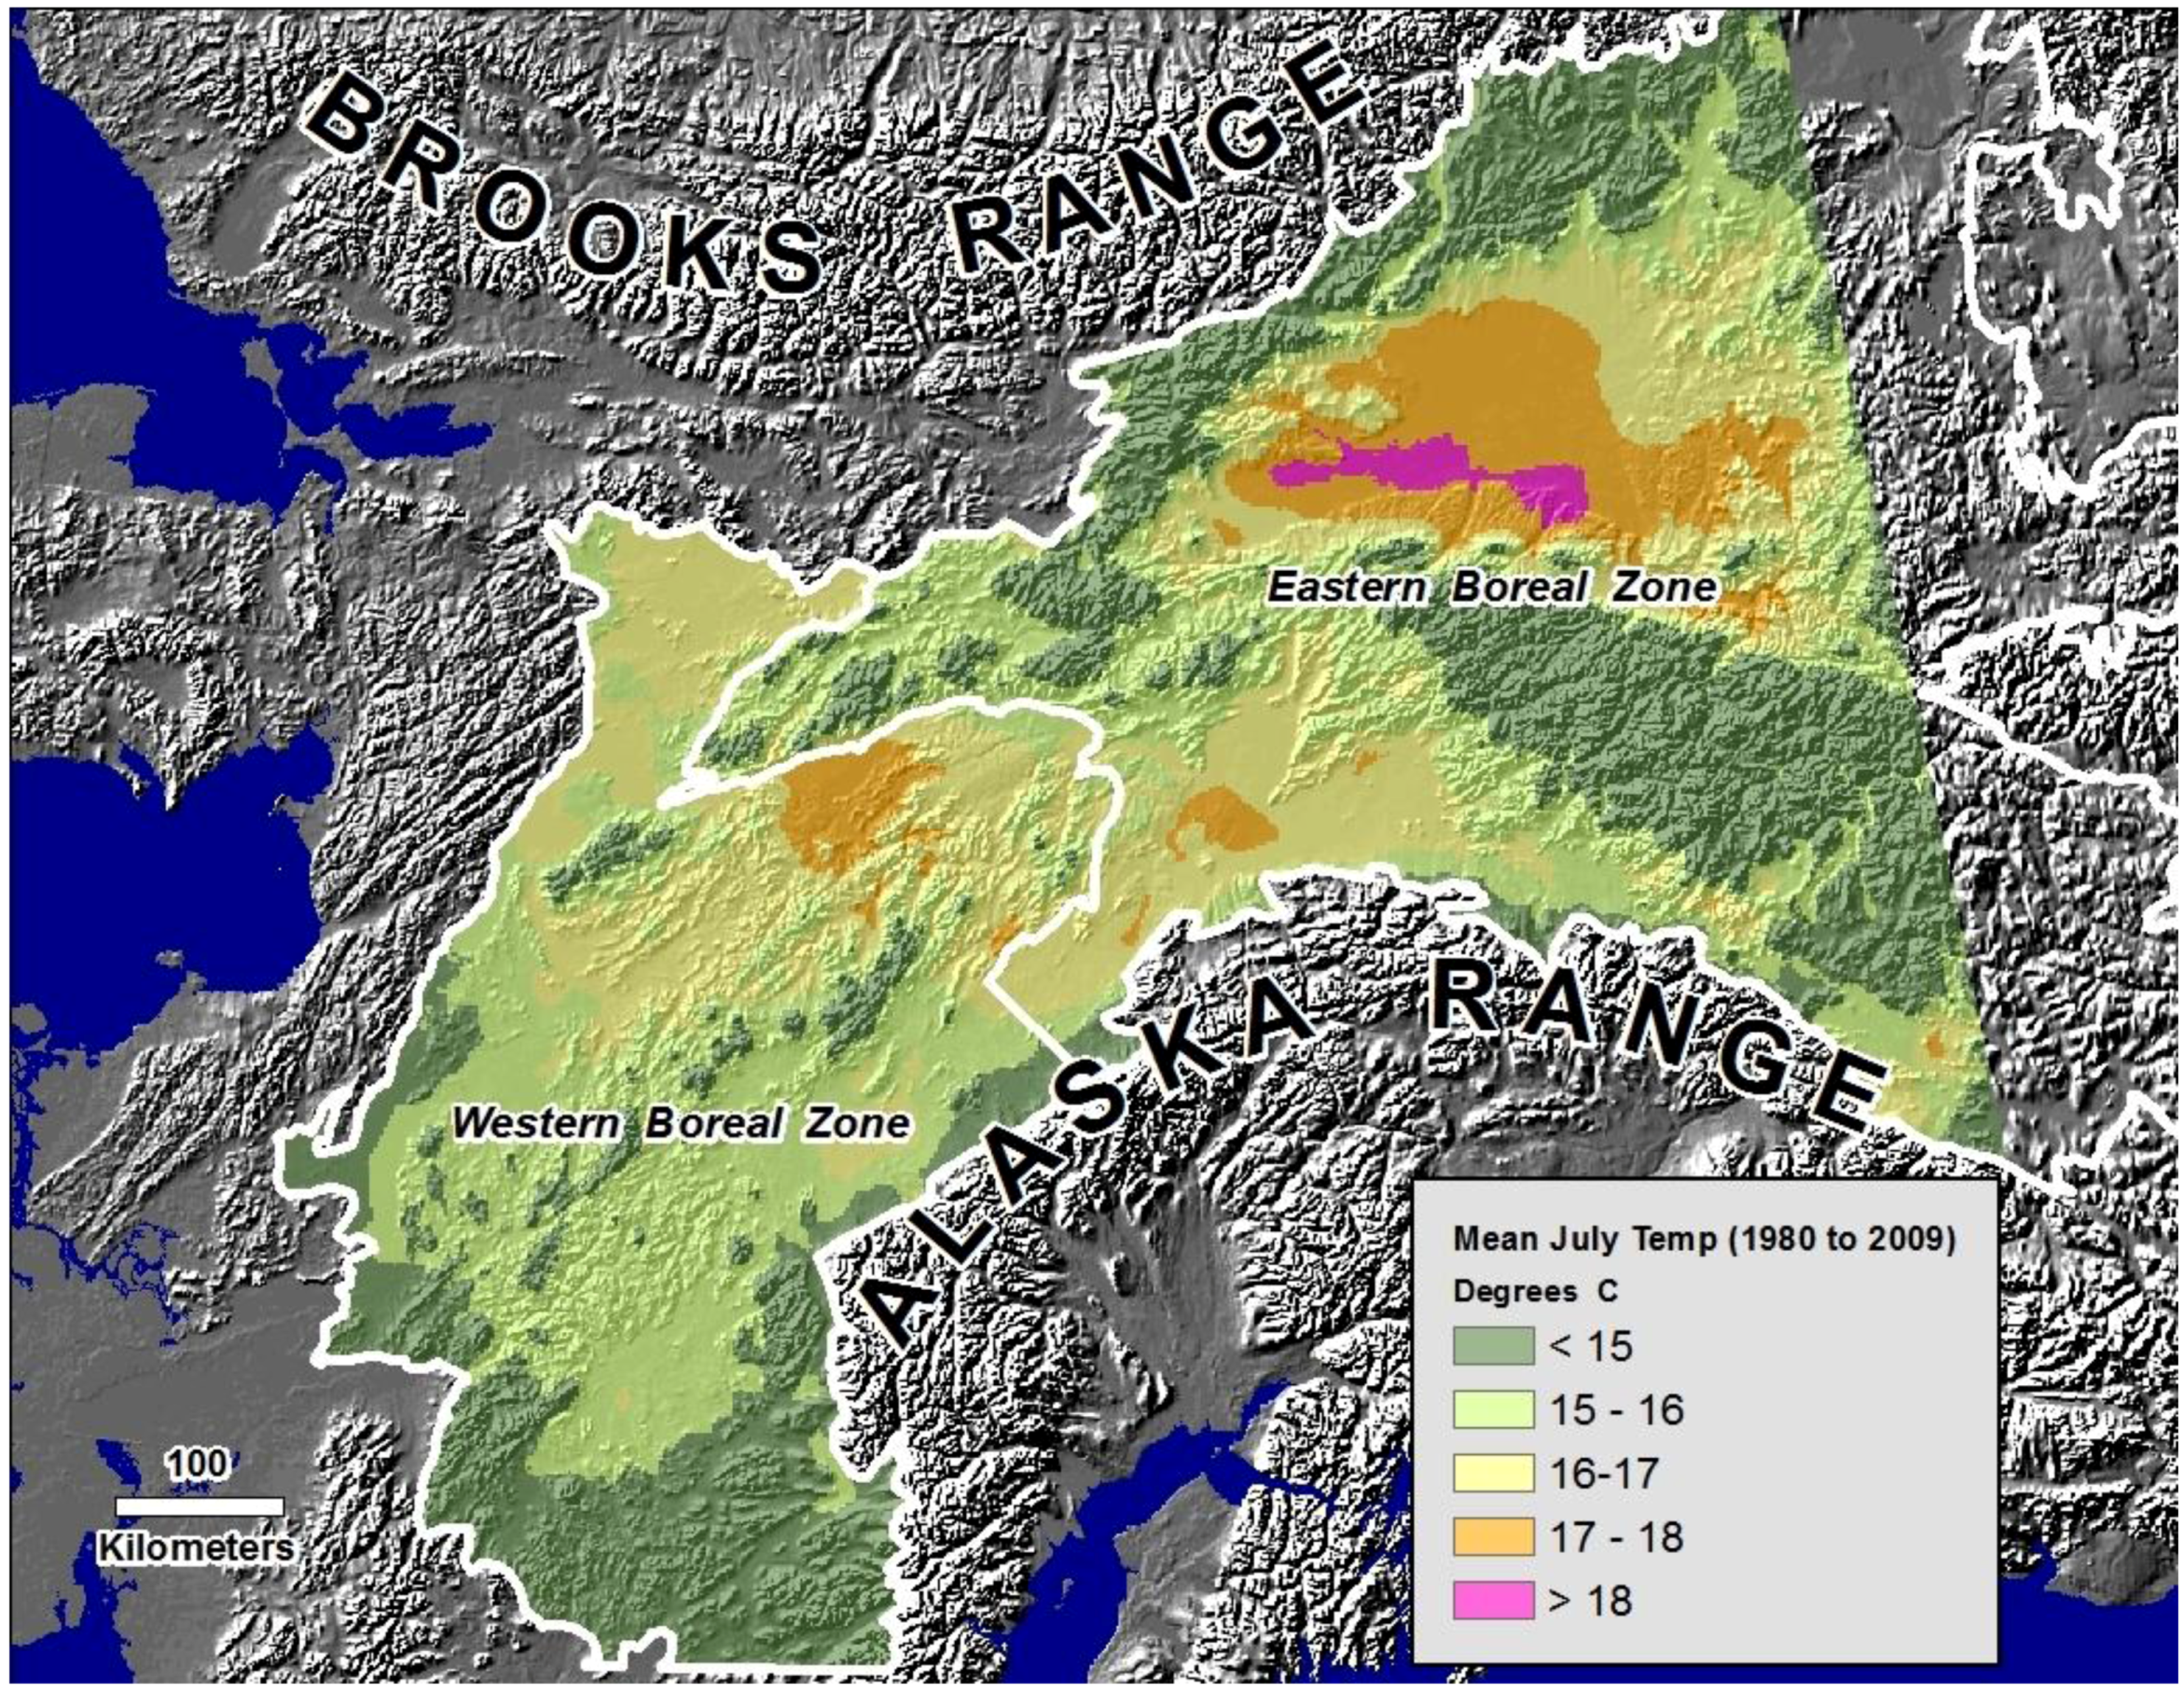
2.1. Study Region
2.2. GIMMS NDVI Data
2.3. MODIS NDVI Data
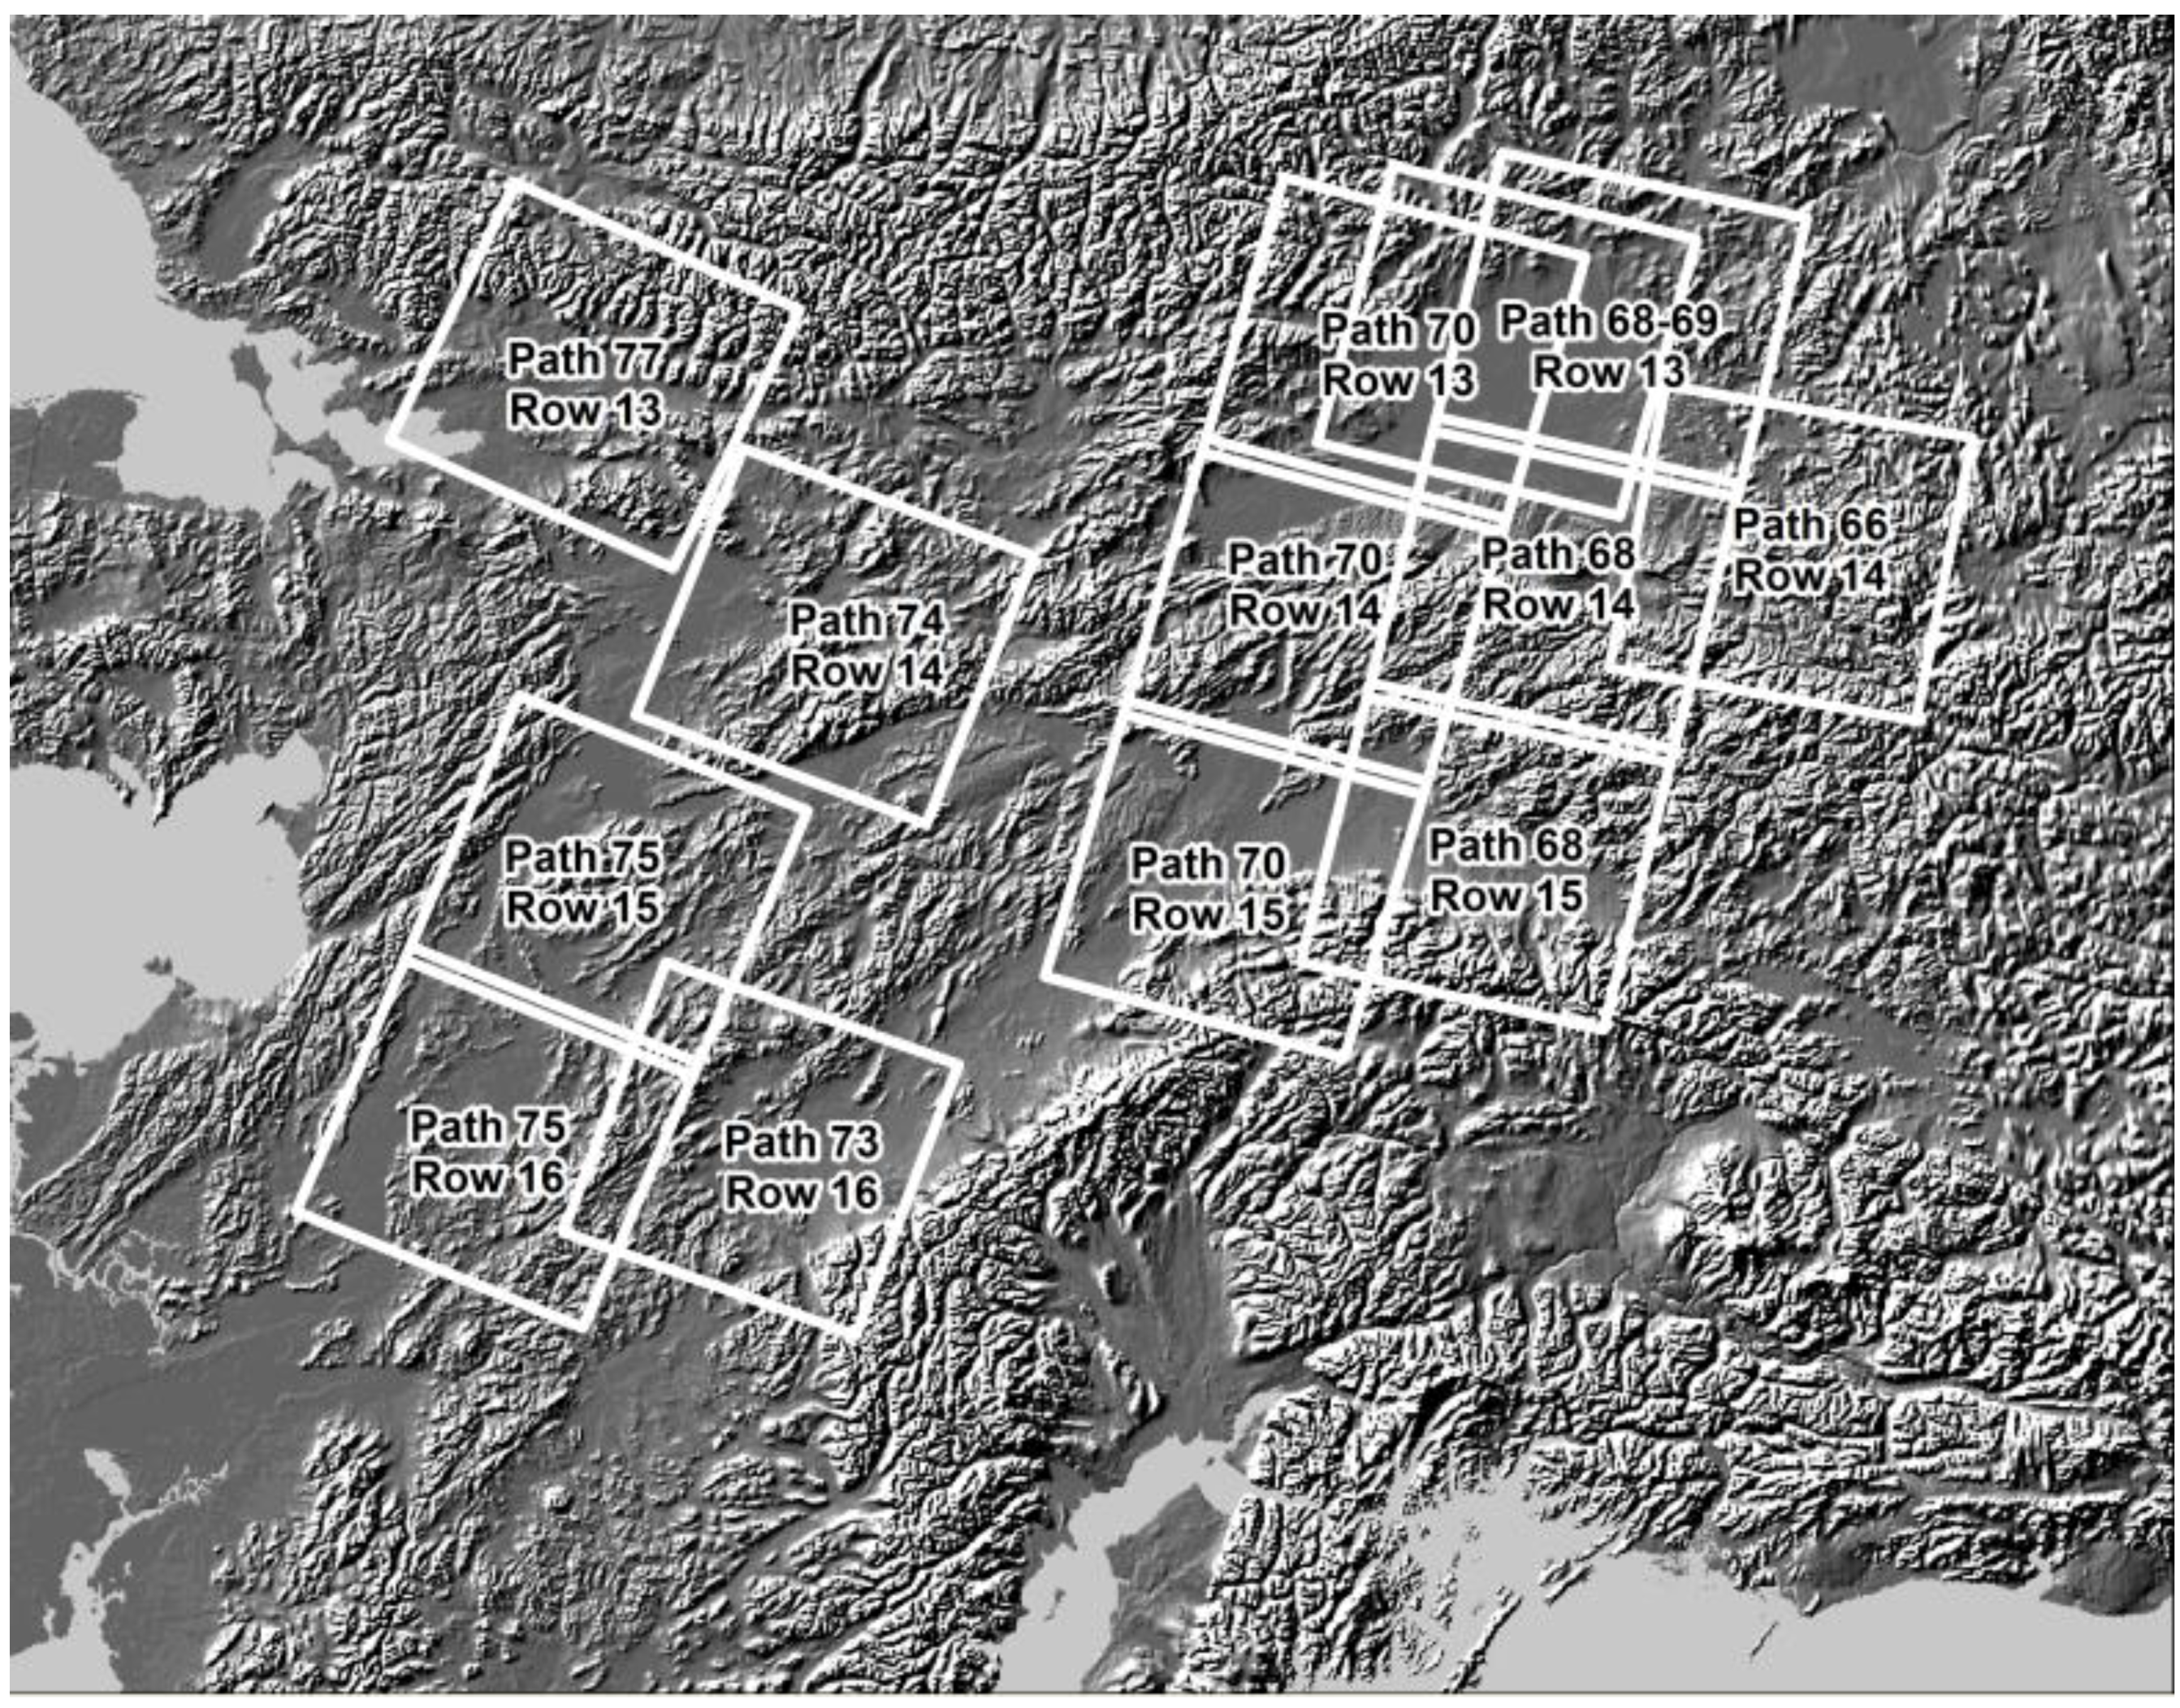
2.4. Landsat TM/ETM Data

| Date | Satellite/Sensor | Percent of cloud-free, vegetated pixels | Date | Satellite/Sensor | Percent of cloud-free, vegetated pixels |
| Path 66/Row14: | Path 73/Row16: | ||||
| 1986-July-5 | Landsat-5/TM | 53 | 1985-July-19 | Landsat-5/TM | 68 |
| 1988-July-2 | Landsat-4/TM | 45 | 1986-July-6 | Landsat-5/TM | 51 |
| 1994-July-11* | Landsat-5/TM | 56 | 1988-July-19 | Landsat-4/TM | 49 |
| 1995-June-28 | Landsat-5/TM | 33 | 1999-July-2 | Landsat-7/ETM+ | 63 |
| 2001-July-20 | Landsat-7/ETM+ | 52 | 2001-June-21* | Landsat-7/ETM+ | 68 |
| 2005-June-23 | Landsat-5/TM | 49 | 2006-June-27 | Landsat-5/TM | 54 |
| 2005-July25 | Landsat-5/TM | 39 | 2008-August-3 | Landsat-5/TM | 27 |
| 2006-July-12 | Landsat-5/TM | 22 | |||
| 2006-July-28 | Landsat-5/TM | 56 | |||
| 2009-July-4 | Landsat-5/TM | 30 | |||
| 2009-July-20 | Landsat-5/TM | 37 | |||
| Date | Satellite/Sensor | Percent of cloud-free, vegetated pixels | Date | Satellite/Sensor | Percent of cloud-free, vegetated pixels |
| Path 68/Row14: | Path 74/Row14: | ||||
| 1985-August-1 | Landsat-5/TM | 48 | 1985-June-24 | Landsat-5/TM | 46 |
| 1986-July-3 | Landsat-5/TM | 32 | 1985-July-26 | Landsat-5/TM | 60 |
| 1993-July-14 | Landsat-4/TM | 44 | 2002-July-17 | Landsat-7/ETM+ | 42 |
| 1994-July-25 | Landsat-5/TM | 33 | 2002-August-2* | Landsat-7/ETM+ | 73 |
| 1999-July-31 | Landsat-7/ETM+ | 43 | 2006-July-20 | Landsat-5/TM | 41 |
| 2003-July-18* | Landsat-7/ETM+ | 56 | 2008-July-25 | Landsat-5/TM | 57 |
| 2009-July-2 | Landsat-5/TM | 33 | 2009-July-12 | Landsat-5/TM | 64 |
| Date | Satellite/Sensor | Percent of cloud-free, vegetated pixels | Date | Satellite/Sensor | Percent of cloud-free, vegetated pixels |
| Path 68/Row15: | Path 75/Row15: | ||||
| 1986-July-3 | Landsat-5/TM | 58 | 1985-August-2 | Landsat-5/TM | 57 |
| 1986-August-4 | Landsat-5/TM | 49 | 1986-July-4 | Landsat-5/TM | 61 |
| 1993-July-14 | Landsat-4/TM | 63 | 1992-July-12 | Landsat-4/TM | 42 |
| 1995-July-28 | Landsat-5/TM | 70 | 1992-July-28 | Landsat-4/TM | 37 |
| 1999-July-31 | Landsat-7/ETM+ | 54 | 1999-June-30 | Landsat-7/ETM+ | 62 |
| 2000-July-1 | Landsat-7/ETM+ | 35 | 2001-June-19 | Landsat-7/ETM+ | 42 |
| 2002-July-23 | Landsat-7/ETM+ | 62 | 2002-June-22 | Landsat-7/ETM+ | 59 |
| 2003-July-18* | Landsat-5/TM | 67 | 2008-June-14* | Landsat-5/TM | 58 |
| 2009-August-3 | Landsat-5/TM | 67 | 2009-July-3 | Landsat-5/TM | 59 |
| Date | Satellite/Sensor | Percent of cloud-free, vegetated pixels | Date | Satellite/Sensor | Percent of cloud-free, vegetated pixels |
| Path 70/Row13: | Path 75/Row16: | ||||
| 1985-July-14 | Landsat-5/TM | 41 | 1985-August-2 | Landsat-5/TM | 55 |
| 1986-July-17 | Landsat-5/TM | 49 | 1992-July-28 | Landsat-4/TM | 32 |
| 1994-August-08 | Landsat-5/TM | 44 | 1999-June-30 | Landsat-7/ETM+ | 53 |
| 1999-July-5 | Landsat-5/TM | 35 | 2000-July-2 | Landsat-7/ETM+ | 50 |
| 2001-July-7 | Landsat-7/ETM+ | 53 | 2002-June-22 | Landsat-7/ETM+ | 64 |
| 2001-July-18 | Landsat-7/ETM+ | 52 | 2009-July-3* | Landsat-5/TM | 74 |
| 2002-August-6 | Landsat-7/ETM+ | 51 | |||
| 2006-August-9 | Landsat-5/TM | 30 | |||
| 2009-July-16* | Landsat-5/TM | 66 | |||
| Date | Satellite/Sensor | Percent of cloud-free, vegetated pixels | Date | Satellite/Sensor | Percent of cloud-free, vegetated pixels |
| Path 70/Row14: | Path 77/Row13: | ||||
| 1985-July-30 | Landsat-5/TM | 38 | 1985-July-31 | Landsat-5/TM | 57 |
| 1991-June-29 | Landsat-5/TM | 38 | 1986-July-2 | Landsat-5/TM | 77 |
| 1999-August-6 | Landsat-5/TM | 45 | 1988-June-29 | Landsat-4/TM | 62 |
| 2000-July-15 | Landsat-7/ETM+ | 39 | 1992-July-29 | Landsat-4/TM | 30 |
| 2001-June-16* | Landsat-7/ETM+ | 53 | 1995-July-27 | Landsat-5/TM | 58 |
| 2001-July-18 | Landsat-7/ETM+ | 45 | 2002-June-20 | Landsat-7/ETM+ | 62 |
| 2002-July-21 | Landsat-7/ETM+ | 44 | 2002-August-7 | Landsat-7/ETM+ | 62 |
| 2002-August-6 | Landsat-7/ETM+ | 57 | 2006-July-9 | Landsat-5/TM | 28 |
| 2006-August-9 | Landsat-5/TM | 51 | 2008-June-28* | Landsat-5/TM | 76 |
| 2009-July-16 | Landsat-5/TM | 31 | 2008-July-30 | Landsat-5/TM | 54 |
| 2009-July-17 | Landsat-5/TM | 45 | |||
| Date | Satellite/Sensor | Percent of cloud-free, vegetated pixels | Date | Satellite/Sensor | Percent of cloud-free, vegetated pixels |
| Path 70/Row15: | Path 69and68/Row13: | ||||
| 1986-July-1 | Landsat-5/TM | 50 | 1985-July-7 | Landsat-5/TM | 46 |
| 1992-July-25 | Landsat-4/TM | 23 | 1986-July-3 | Landsat-5/TM | 34 |
| 2000-July-15* | Landsat-7/ETM+ | 50 | 1994-July-25 | Landsat-5/TM | 46 |
| 2001-July-18 | Landsat-7/ETM+ | 50 | 1999-June-28 | Landsat-5/TM | 32 |
| 2002-July-21 | Landsat-7/ETM+ | 59 | 1999-July-14* | Landsat-5/TM | 62 |
| 2006-June-22 | Landsat-5/TM | 33 | 2000-July-8 | Landsat-7/ETM+ | 31 |
| 2009-June-30 | Landsat-5/TM | 35 | 2001-June-25 | Landsat-7/ETM+ | 57 |
| 2001-July-27 | Landsat-7/ETM+ | 48 | |||
| 2002-July-30 | Landsat-7/ETM+ | 40 | |||
| 2005-June-28 | Landsat-5/TM | 29 | |||
| 2005-July-14 | Landsat-5/TM | 41 | |||
| 2008-June-20 | Landsat-5/TM | 36 | |||
Radiometric Normalization and NDVI Calculations
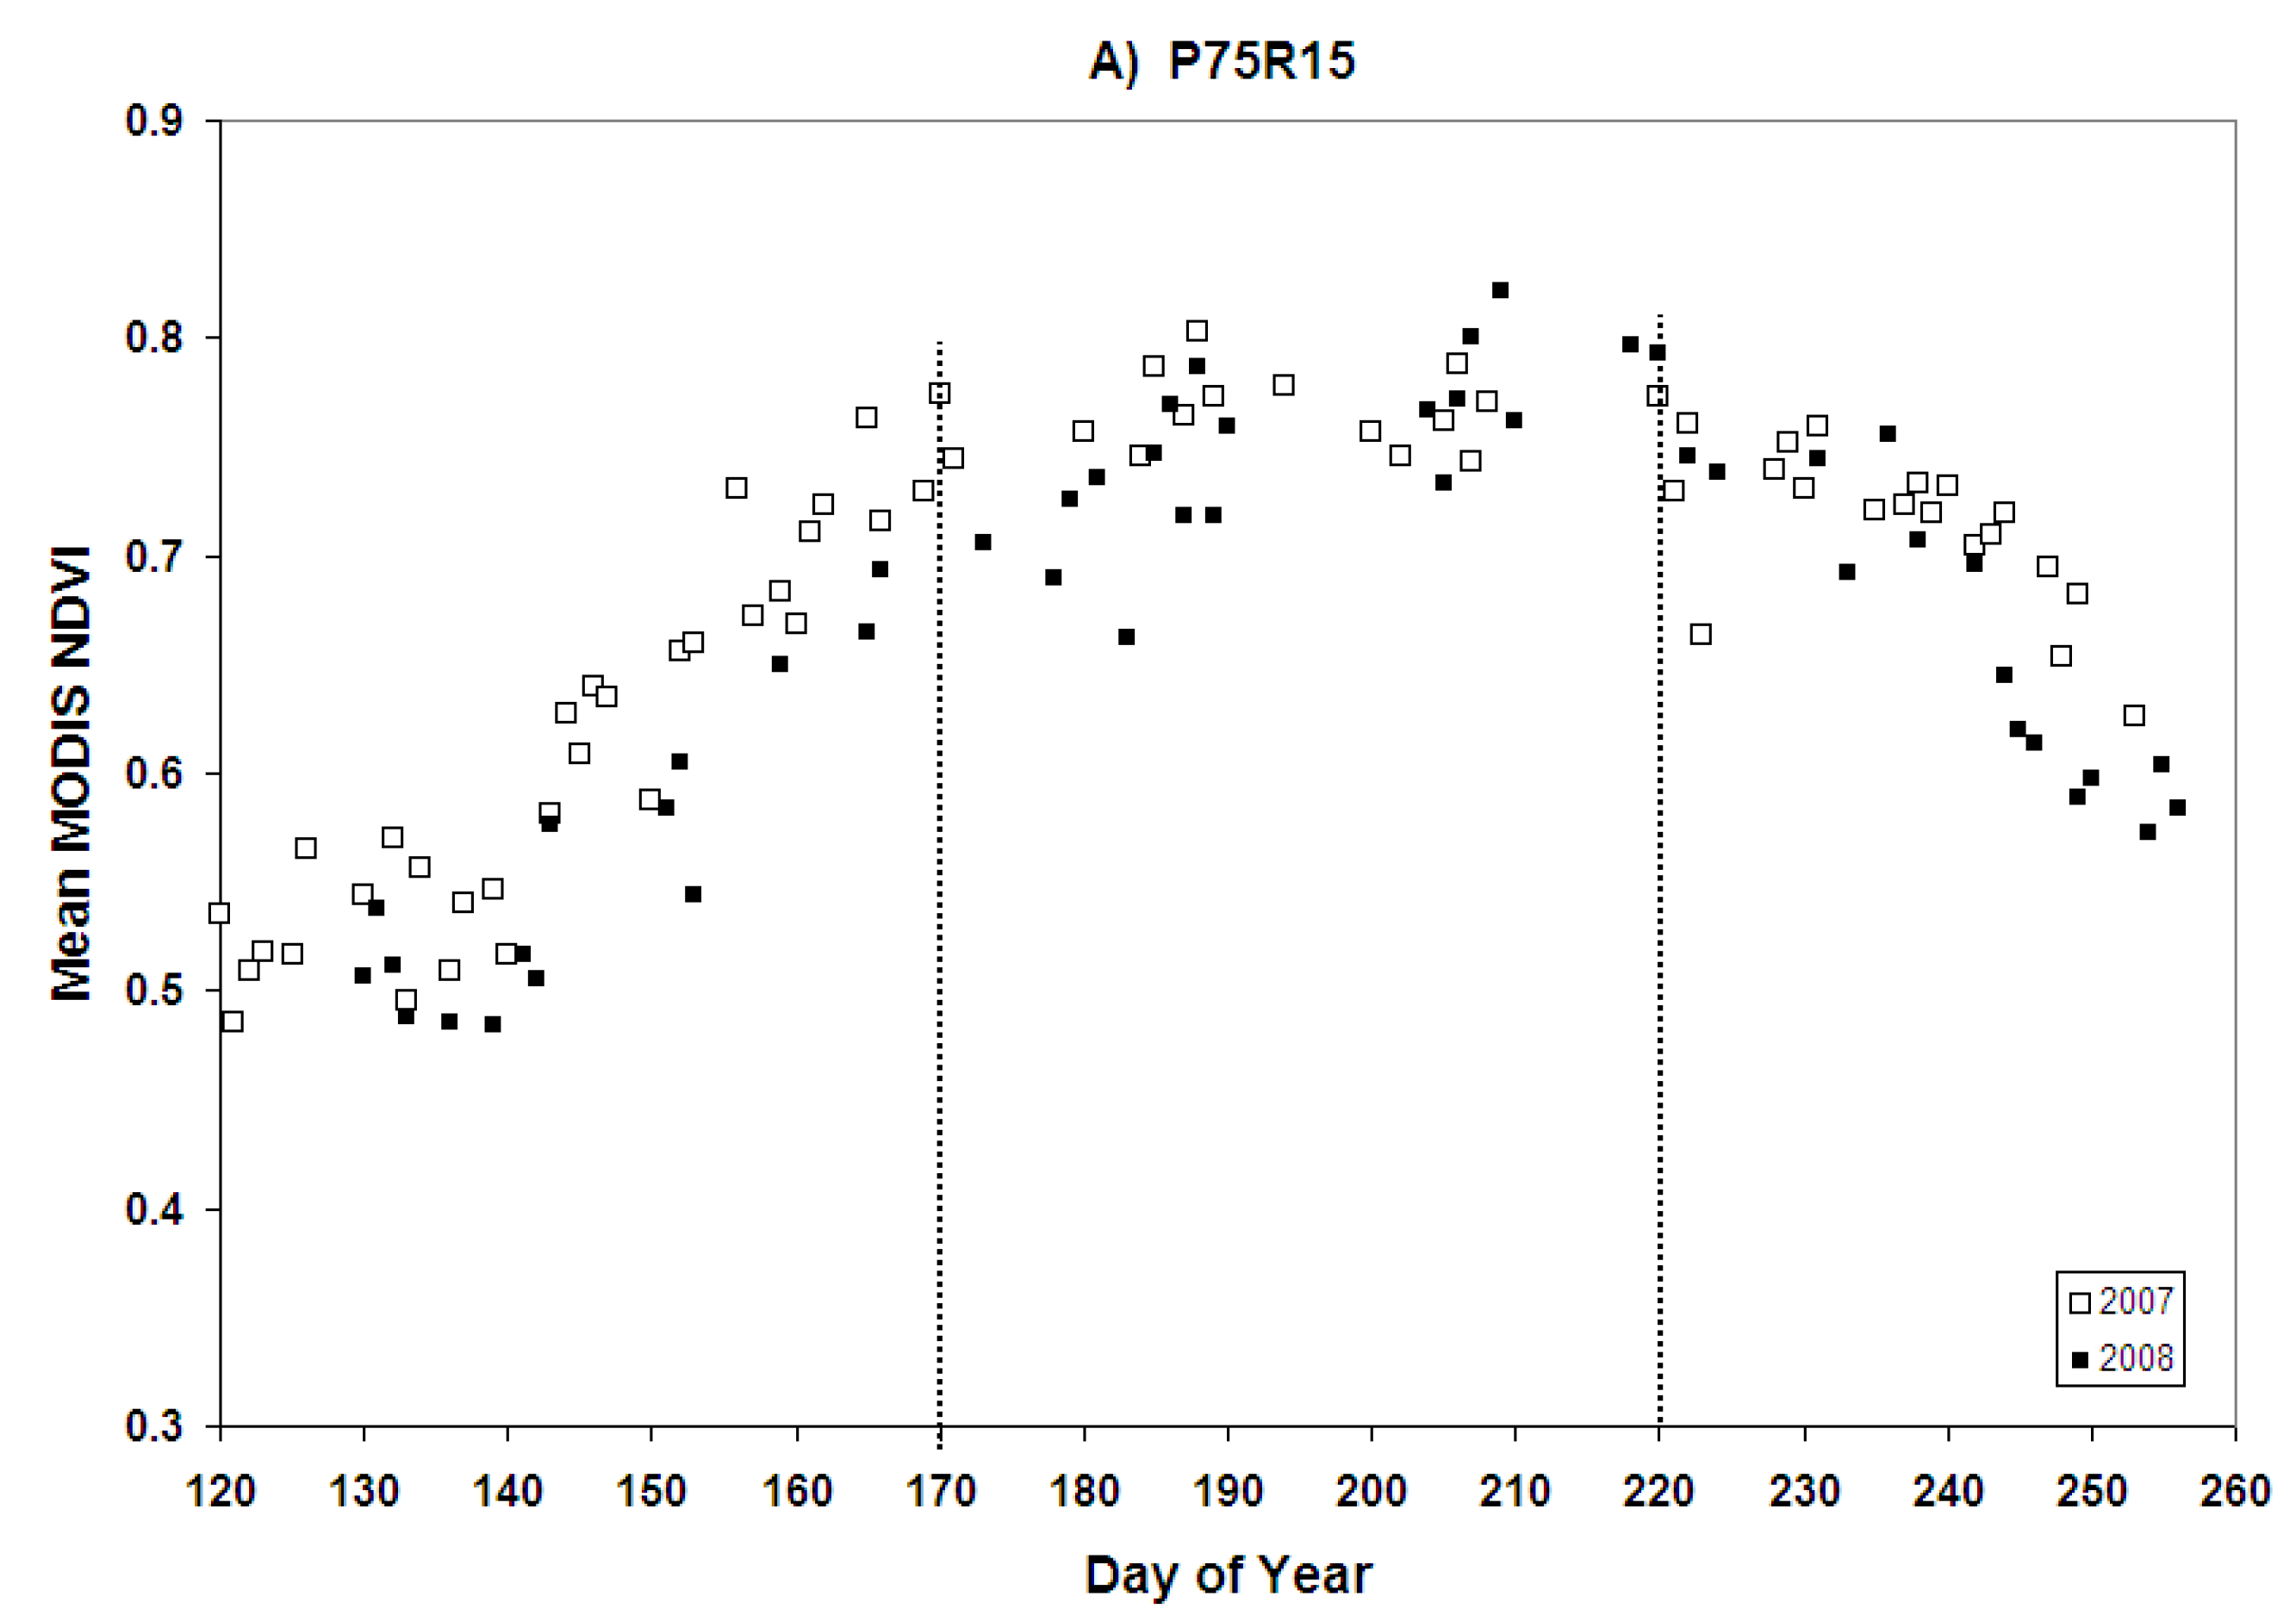
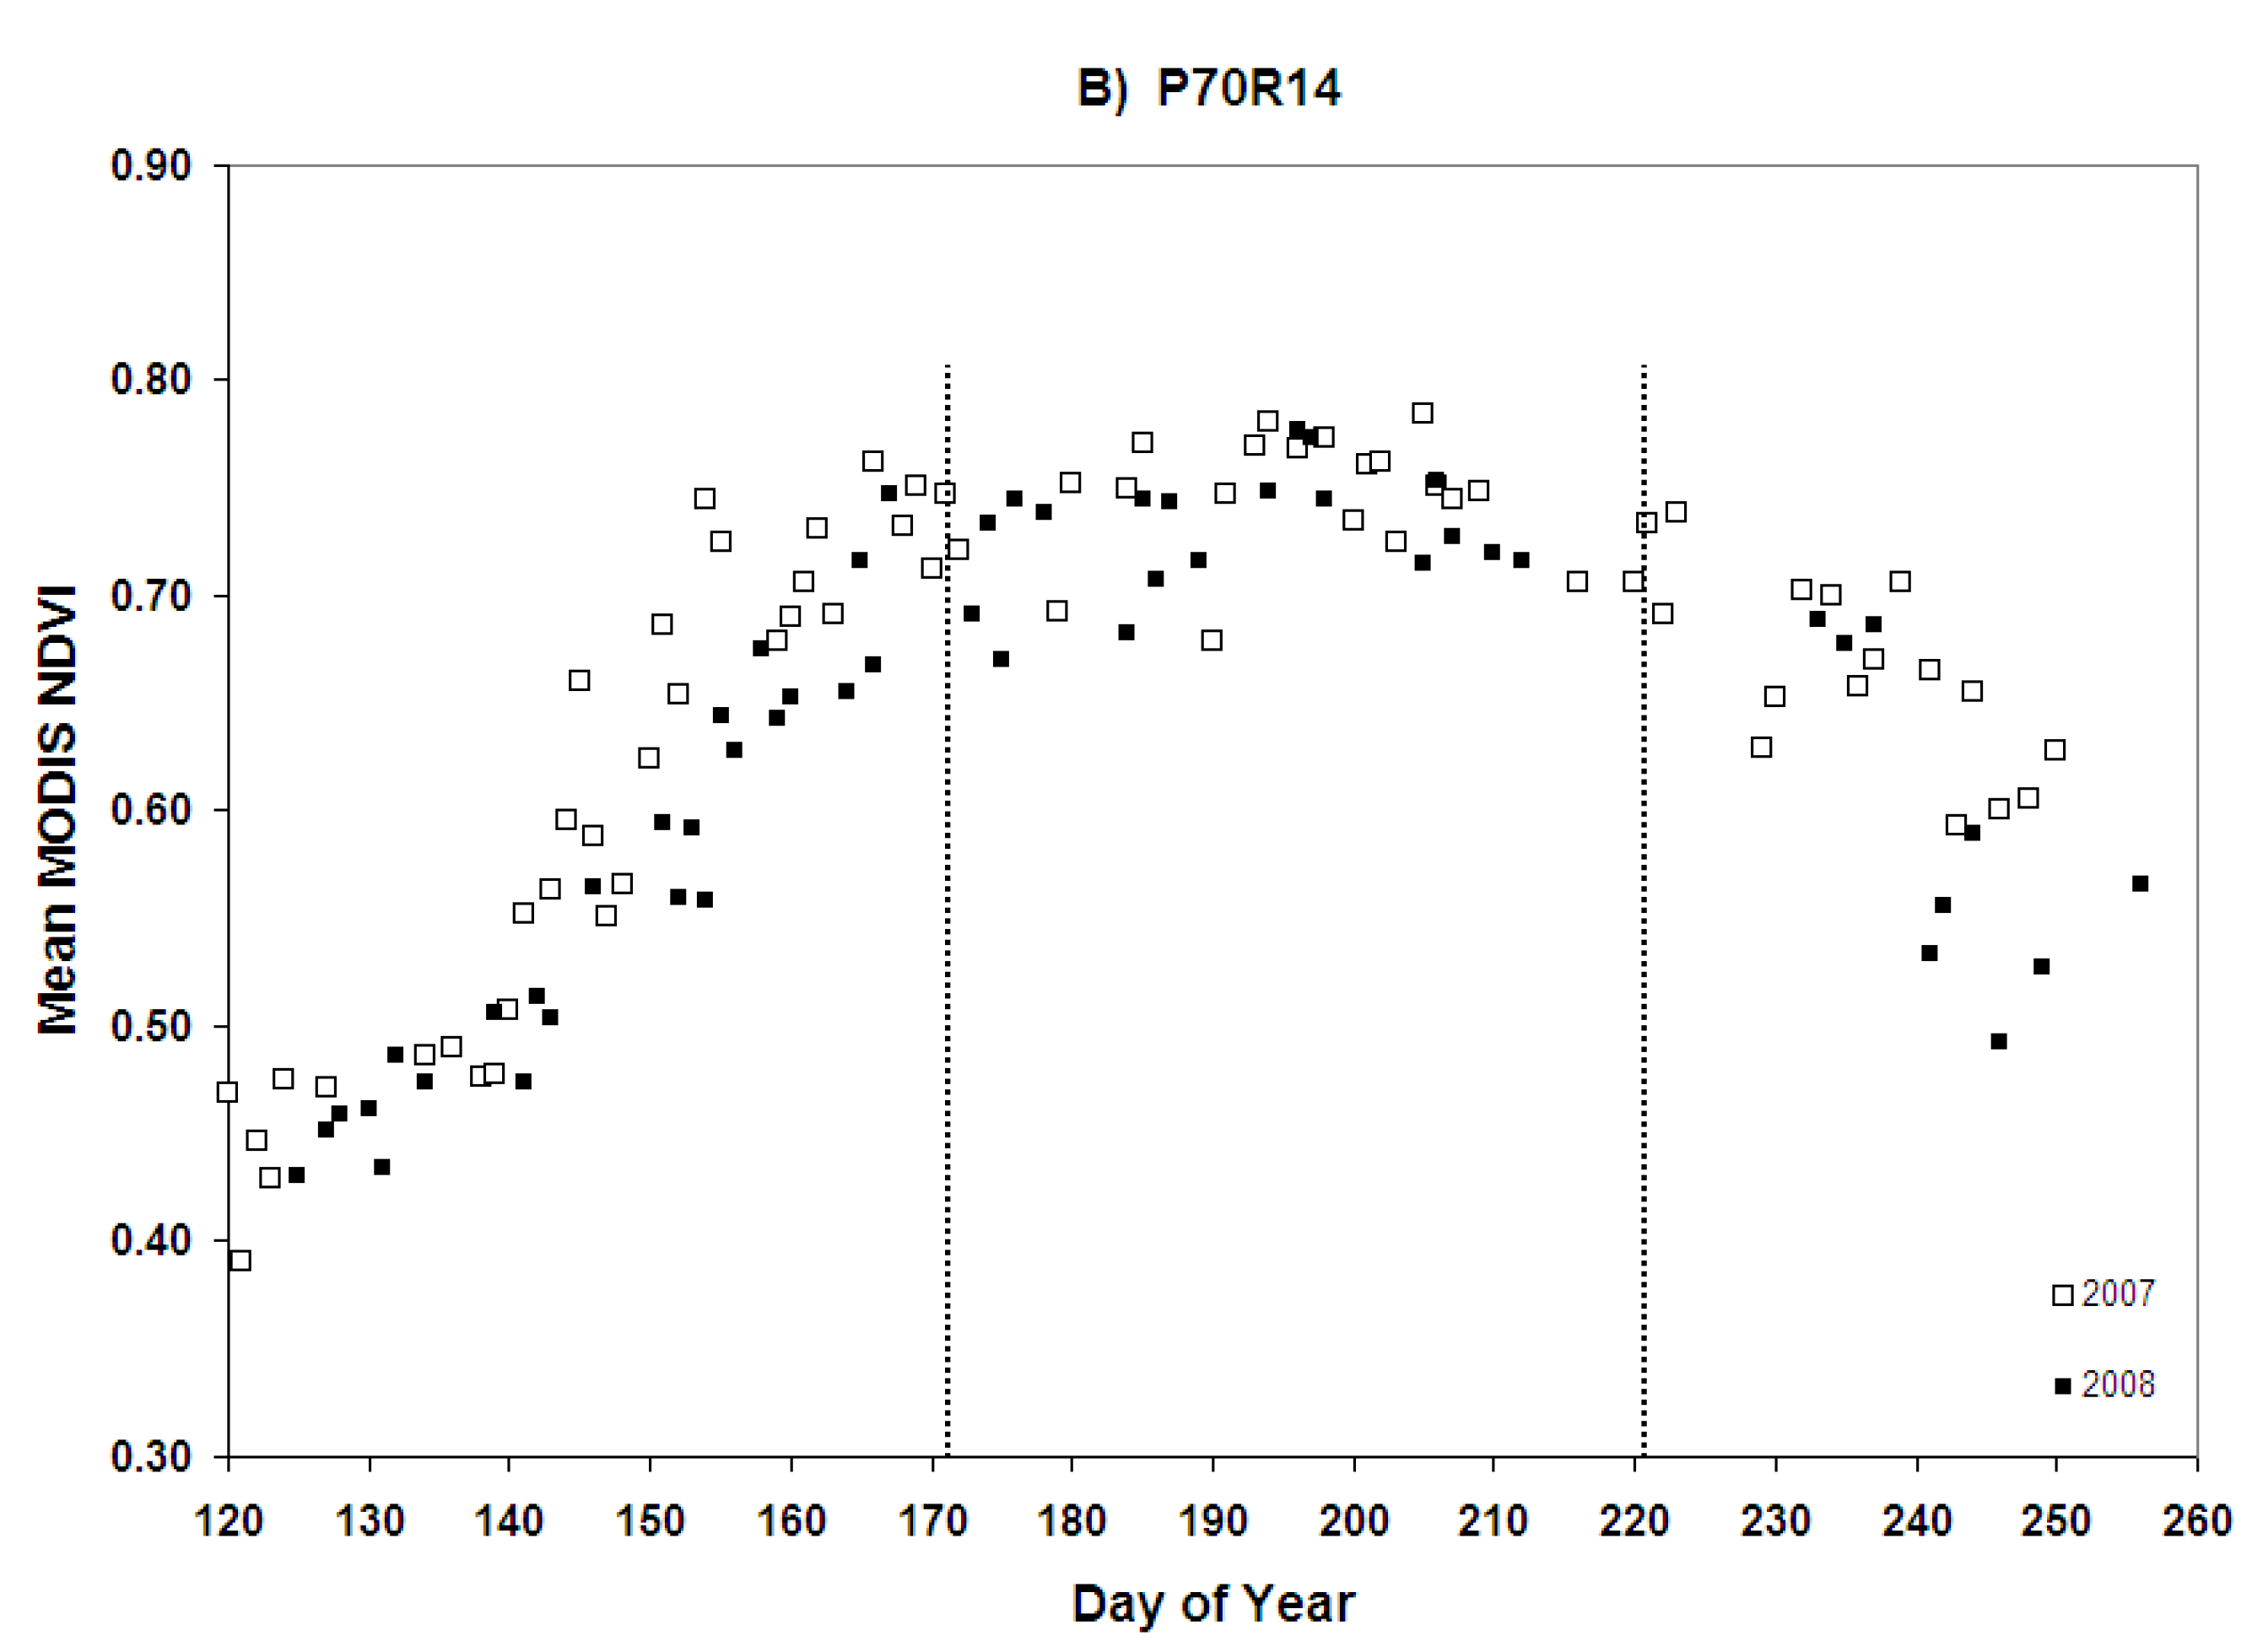
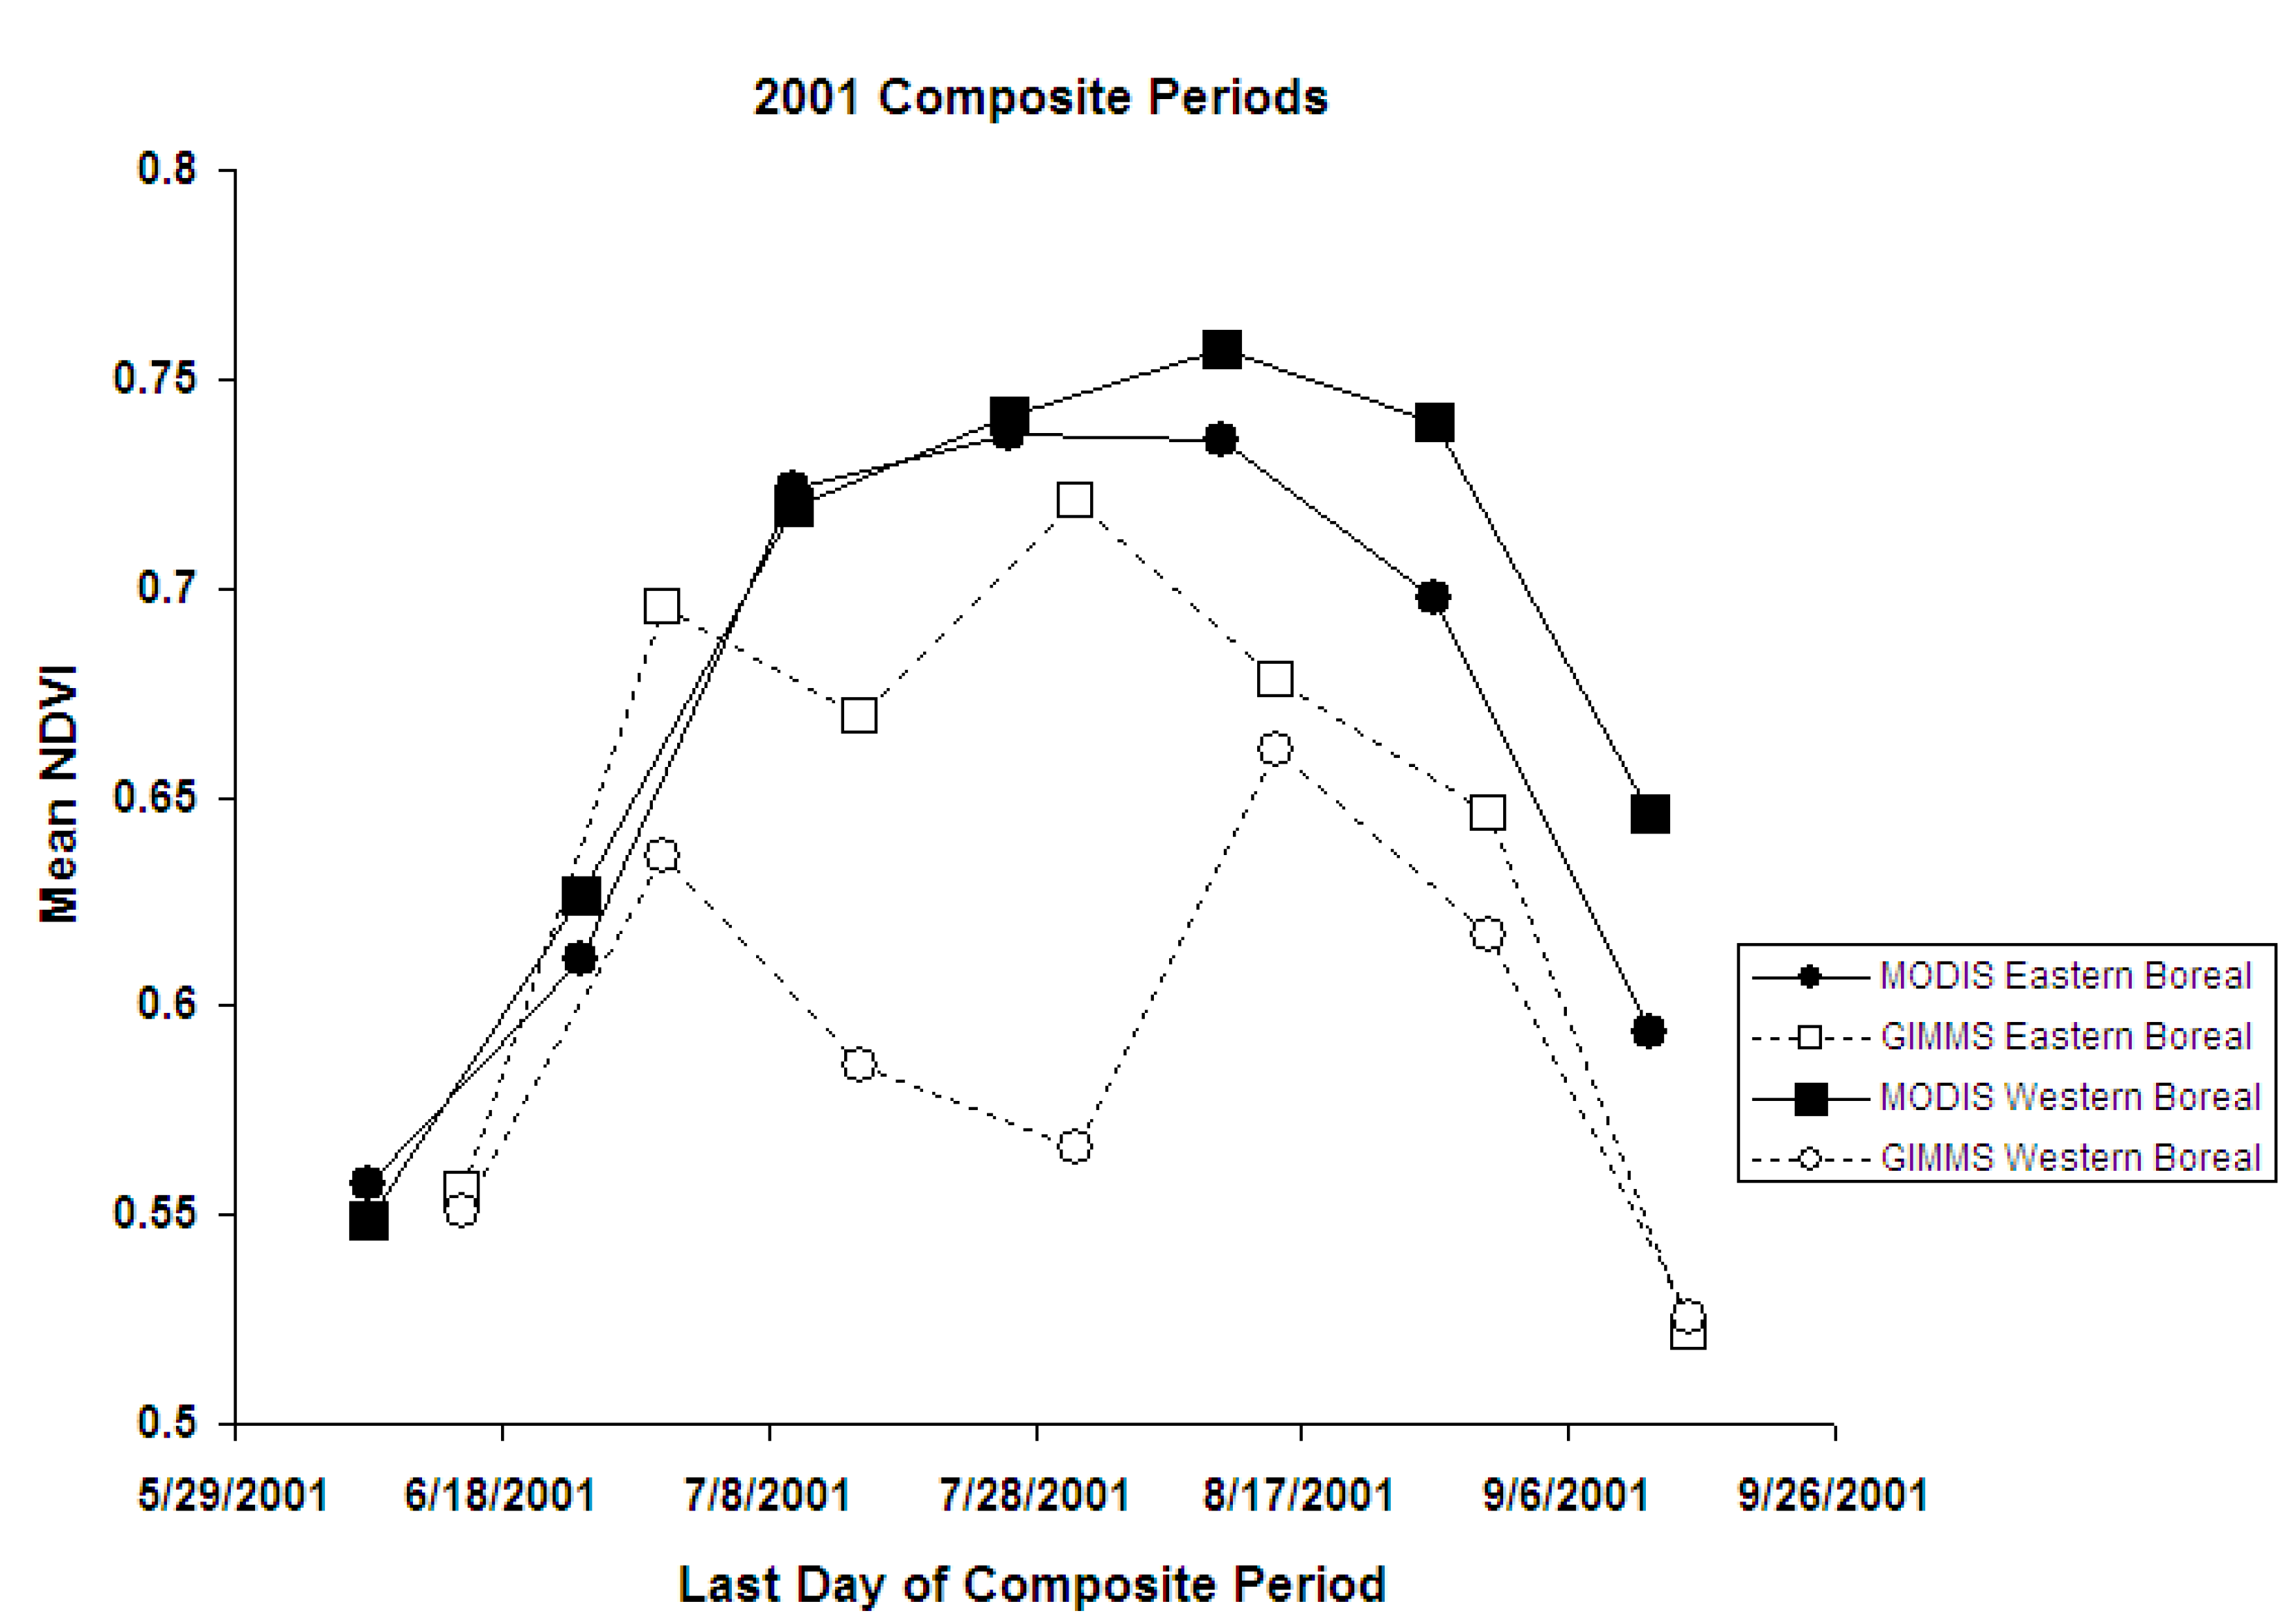
2.5. Comparing GIMMS and MODIS NDVI Trends
3. Results and Discussion
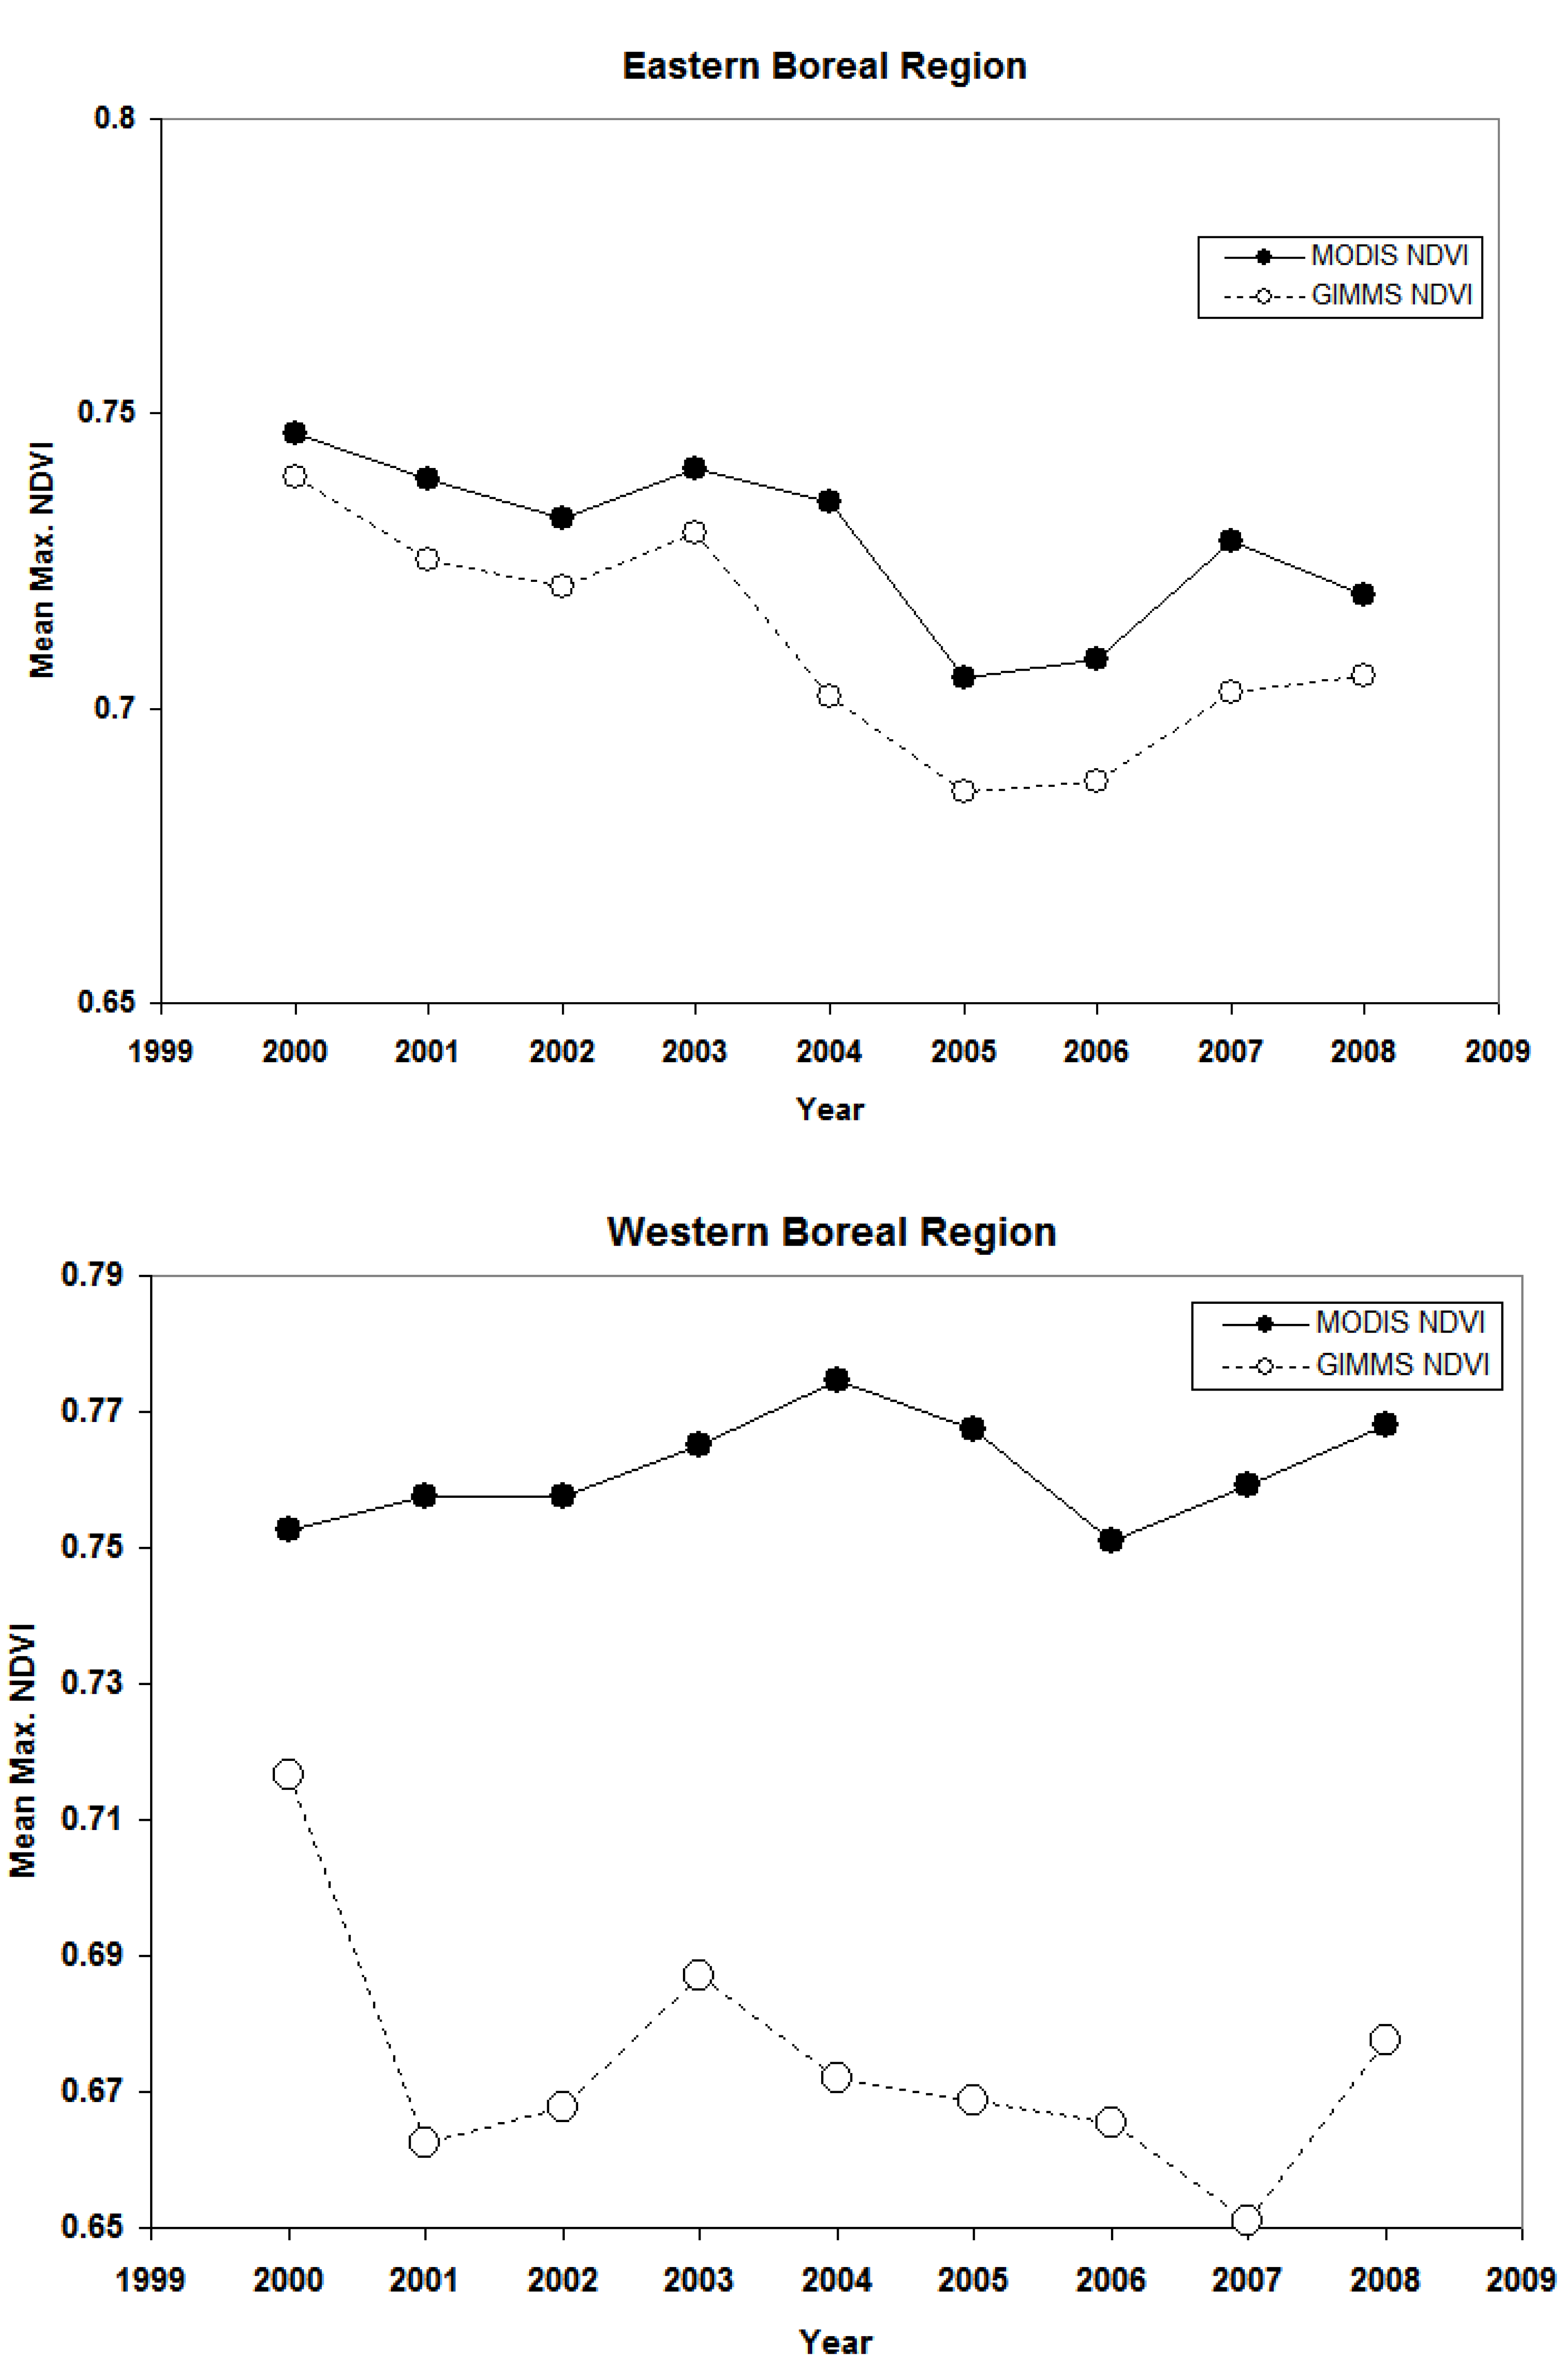
3.1. GIMMS and MODIS NDVI Trends
3.2. Longer Term Trends Based on Landsat TM/ETM+ NDVI
| Path/Row | Location | Regression Slope | R2 value | P-value |
| P68/69/R13 | Eastern | −8.113E-06 | 0.41 | 0.019 |
| P70/R14 | Eastern | −4.432E-06 | 0.28 | 0.117 |
| P68/R15 | Eastern | 1.416E-06 | 0.04 | 0.588 |
| P66/R14 | Eastern | −5.516E-06 | 0.52 | 0.013 |
| P75/R15 | Western | −3.088E-06 | 0.15 | 0.312 |
| P70R15 | Eastern | −8.945E-06 | 0.27 | 0.229 |
| P68/R14 | Eastern | −5.758E-06 | 0.33 | 0.174 |
| P70/R13 | Eastern | −2.254E-06 | 0.06 | 0.521 |
| P74/R14 | Western | 1.610E-06 | 0.06 | 0.590 |
| P77/R13 | Western | 1.103E-06 | 0.02 | 0.690 |
| P73/R16 | Western | −2.478E-06 | 0.08 | 0.535 |
| P75/R16 | Western | −2.375E-06 | 0.12 | 0.506 |
| 2000–2009 Landsat TM/ETM+ Trends | ||||
| Path/Row | Location | Regression Slope | R2 value | P-value |
| P68/69/R13 | Eastern | −2.683E-05 | 0.88 | 0.001 |
| P70/R14 | Eastern | −1.737E-05 | 0.69 | 0.021 |
| P68/R15 | Eastern | −1.516E-05 | 0.95 | 0.026 |
| P66/R14 | Eastern | −1.263E-05 | 0.57 | 0.051 |
| P75/R15 | Western | −1.205E-05 | 0.82 | 0.093 |
| P70R15 | Eastern | −3.494E-05 | 0.66 | 0.094 |
| P68/R14 | Eastern | −2.171E-05 | 0.92 | 0.178 |
| P70/R13 | Eastern | −1.675E-05 | 0.35 | 0.292 |
| P74/R14 | Western | −5.987E-06 | 0.09 | 0.615 |
| P77/R13 | Western | 4.025E-06 | 0.02 | 0.783 |
| P73/R16 | Western | 8.565E-06 | 0.09 | 0.811 |
| P75/R16 | Western | 5.872E-07 | 0.00 | 0.977 |
| Path/Row | Location | Regression Slope | R2 value | P-value | Percent Used |
| P68/69/R13 | Eastern | −7.978E-06 | 0.31 | 0.048 | 3.10 |
| P70/R14 | Eastern | −2.846E-06 | 0.07 | 0.469 | 4.34 |
| P68/R15 | Eastern | 2.823E-07 | 0.00 | 0.900 | 3.79 |
| P66/R14 | Eastern | −6.933E-06 | 0.50 | 0.015 | 0.43 |
| P75/R15 | Western | −4.134E-06 | 0.22 | 0.197 | 7.67 |
| P70R15 | Eastern | −8.282E-06 | 0.26 | 0.242 | 7.09 |
| P68/R14 | Eastern | −6.791E-06 | 0.42 | 0.115 | 2.42 |
| P70/R13 | Eastern | −1.020E-06 | 0.01 | 0.826 | 1.63 |
| P74/R14 | Western | 3.648E-07 | 0.00 | 0.928 | 9.50 |
| P77/R13 | Western | 1.499E-06 | 0.03 | 0.607 | 1.32 |
| P73/R16 | Western | −1.545E-06 | 0.02 | 0.762 | 6.40 |
| P75/R16 | Western | −1.305E-06 | 0.03 | 0.748 | 8.00 |
| 2000–2009 Landsat TM/ETM+ Trends | |||||
| Path/Row | Location | Regression Slope | R2 value | P-value | Percent Used |
| P68/69/R13 | Eastern | −2.390E-05 | 0.64 | 0.017 | 3.10 |
| P70/R14 | Eastern | −2.487E-05 | 0.84 | 0.003 | 4.34 |
| P68/R15 | Eastern | −1.039E-05 | 0.62 | 0.215 | 3.79 |
| P66/R14 | Eastern | −1.993E-05 | 0.68 | 0.022 | 0.43 |
| P75/R15 | Western | −3.277E-05 | 0.65 | 0.097 | 7.67 |
| P70R15 | Eastern | −1.483E-05 | 0.87 | 0.067 | 7.09 |
| P68/R14 | Eastern | −1.973E-05 | 0.61 | 0.428 | 2.42 |
| P70/R13 | Eastern | −1.882E-05 | 0.35 | 0.290 | 1.63 |
| P74/R14 | Western | −4.259E-06 | 0.02 | 0.813 | 9.50 |
| P77/R13 | Western | 4.857E-06 | 0.02 | 0.766 | 1.32 |
| P73/R16 | Western | 1.245E-05 | 0.09 | 0.810 | 6.40 |
| P75/R16 | Western | 2.211E-06 | 0.02 | 0.916 | 8.00 |
| Path/Row | Location | Regression Slope | R2 value | P-value |
| P70R14 | Eastern | −0.0039 | 0.74 | 0.001 |
| P68R15 | Eastern | −0.003 | 0.45 | 0.035 |
| P66R14 | Eastern | −0.005 | 0.5 | 0.02 |
| P75R15 | Western | 0.0014 | 0.13 | 0.31 |
| P70R15 | Eastern | −0.0035 | 0.62 | 0.007 |
| P68R14 | Eastern | −0.0043 | 0.38 | 0.06 |
| P70R13 | Eastern | −0.0043 | 0.44 | 0.001 |
| P74R14 | Western | −0.0003 | 0.03 | 0.605 |
| P77R13 | Western | 0.0002 | 0.01 | 0.793 |
| P73/R16 | Western | −0.0023 | 0.21 | 0.187 |
| P75R16 | Western | 0.0024 | 0.14 | 0.283 |
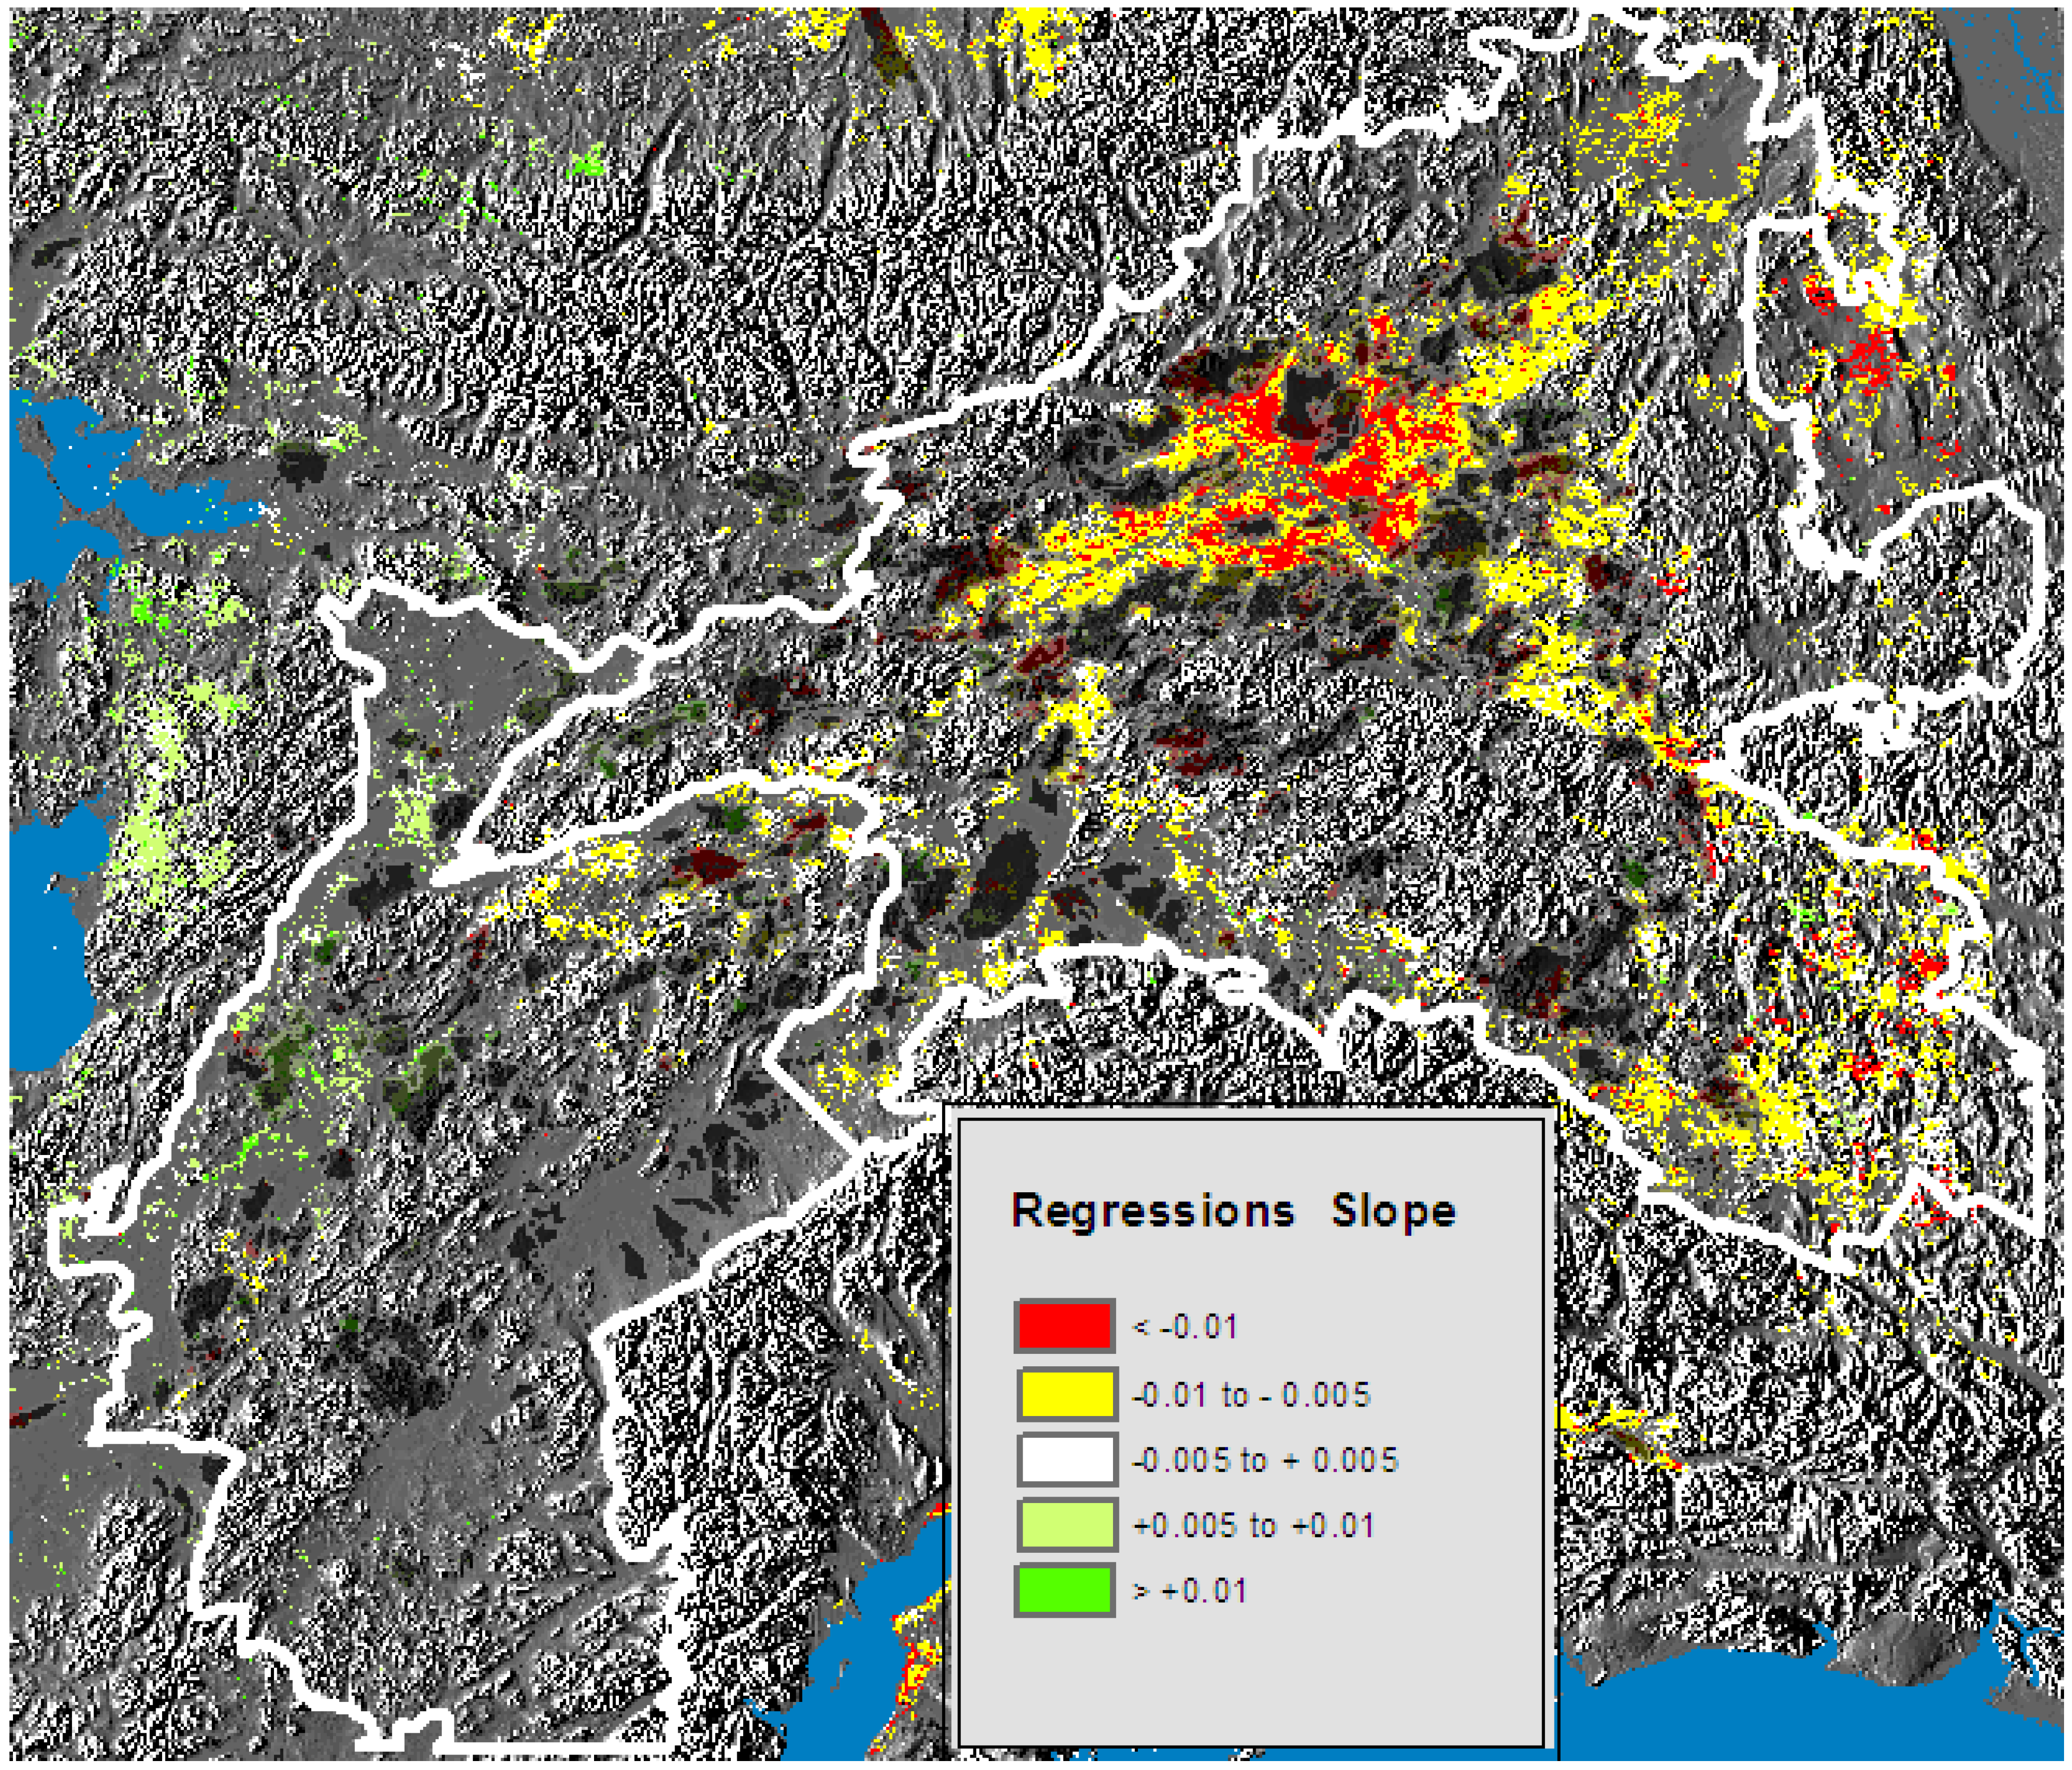
3.3. Pixel-Level Trends Based on MODIS 2000–2009 NDVI
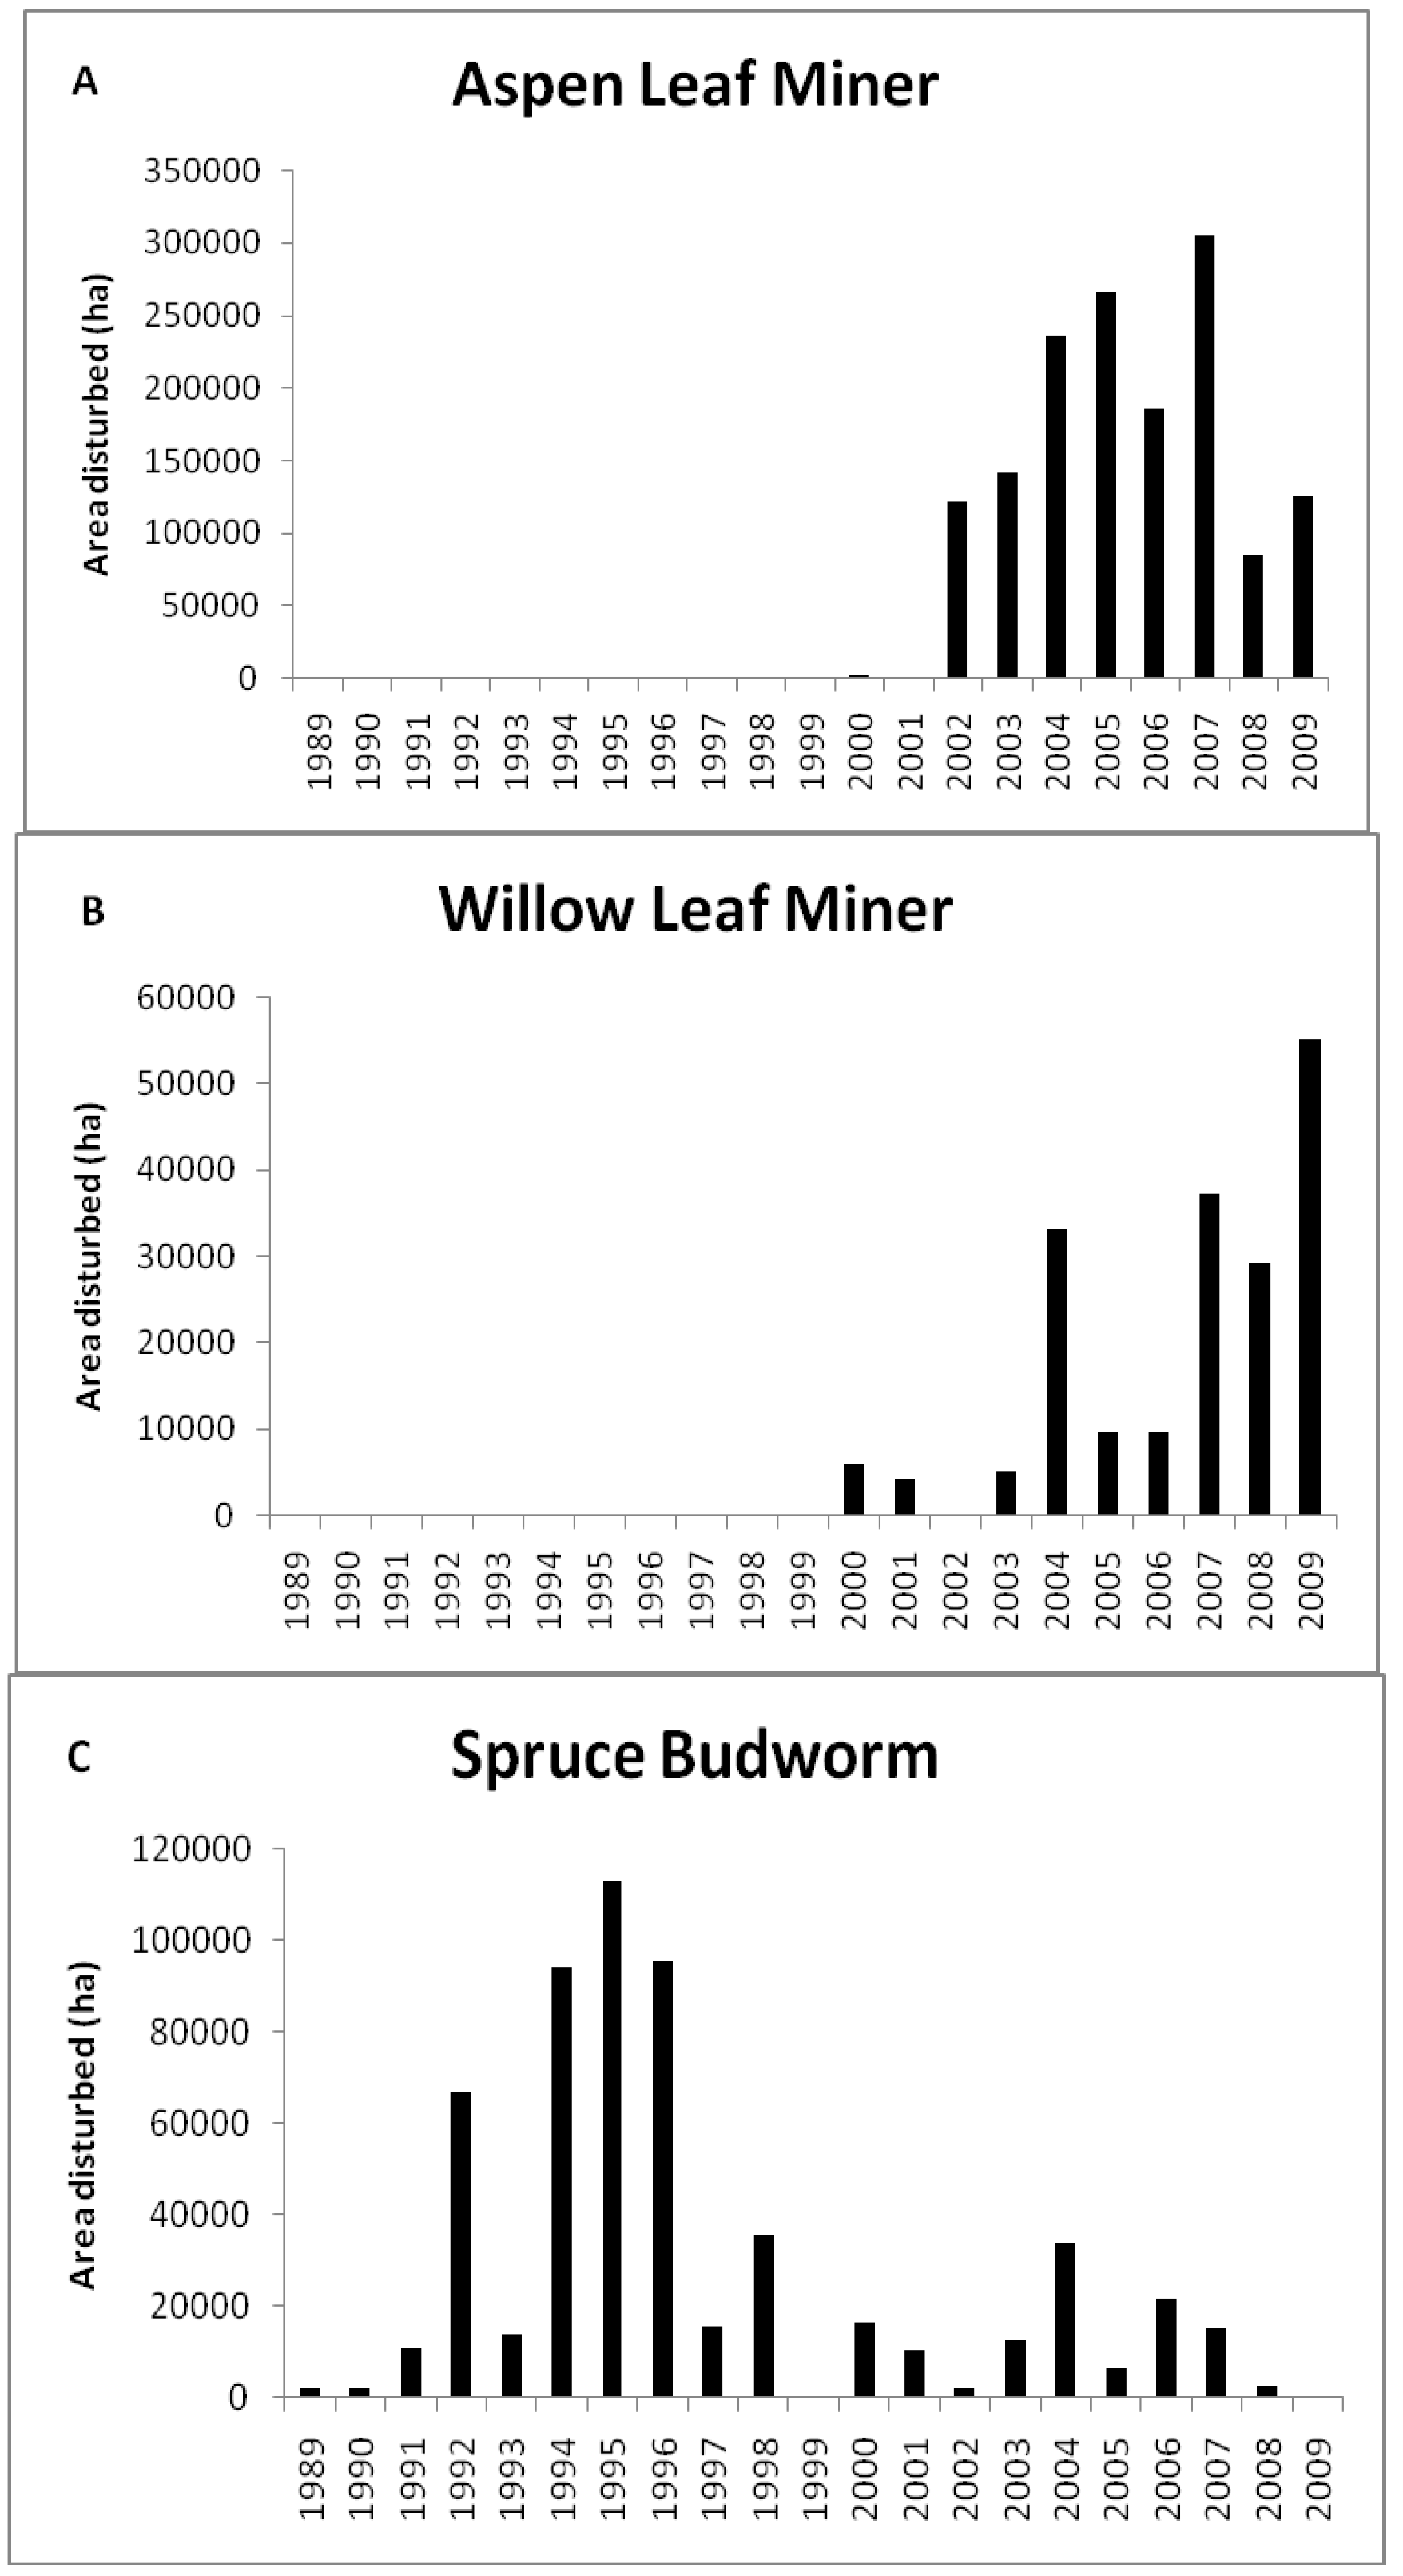
3.4. Potential Causes of NDVI Browning Trends
4. Conclusions
Acknowledgements
References and Notes
- Clegg, B.F.; Hu, F.S. An oxygen-isotope record of Holocene climate change in the south-central Brooks Range, Alaska. Quat. Sci. Rev. 2010, 29, 928–939. [Google Scholar] [CrossRef]
- Zhang, J.; Lindsay, R.; Steele, M.; Schweiger, A. What drove the dramatic retreat of arctic sea ice during summer 2007? Geophys. Res. Lett. 2008, 35, L11505. [Google Scholar] [CrossRef]
- Hinzman, L.D.; Bettez, N.D.; Bolton, W.R.; Chapin, F.S., III.; Dyurgerov, M.; Fastie, C.L.; Griffith, B.; Hollister, R.D.; Hope, A.; Huntington, H.P. Evidence and implications of recent climate change in northern Alaska and other arctic regions. Climatic Change 2005, 72, 251–298. [Google Scholar] [CrossRef]
- Barber, V.A.; Juday, G.P.; Finney, B.P.; Wilmking, M. Reconstruction of summer temperatures in interior Alaska from tree-ring proxies: Evidence for changing synoptic climate regimes. Climatic Change 2004, 63, 91–120. [Google Scholar] [CrossRef]
- Wendler, G.; Shulski, M. A century of climate change for Fairbanks, Alaska. Arctic 2009, 62, 295–300. [Google Scholar] [CrossRef]
- Jia, G.J.; Epstein, H.E.; Walker, D.A. Greening of arctic Alaska, 1981–2001. Geophys. Res. Lett. 2003, 30, 2067. [Google Scholar] [CrossRef]
- Tape, K.; Sturm, M.; Racine, C. The evidence for shrub expansion in northern Alaska and the pan-arctic. Glob. Change Biol. 2006, 12, 686–702. [Google Scholar] [CrossRef]
- Walker, M.D.; Wahren, C.H.; Hollister, R.D. Plant community response to experimental warming across the tundra biome. Proc. Nat. Acad. Sci. USA 2006, 103, 1342–1346. [Google Scholar] [CrossRef] [PubMed]
- Zhou, L.; Tucker, C.J.; Kaufmann, R.K.; Slayback, D.; Shabanov, N.V.; Myneni, R.B. Variations in northern vegetation activity inferred from satellite data of vegetation index during 1981 to 1999. J. Geophys. Res. 2001, 106, 0069–20083. [Google Scholar] [CrossRef]
- Goetz, S.J.; Bunn, A.G.; Fiske, G.J.; Houghton, R.A. Satellite-observed photosynthetic trends across boreal North America associated with climate and fire disturbance. Proc. Nat. Acad. Sci. USA 2005, 102, 13521–13525. [Google Scholar] [CrossRef] [PubMed]
- Verbyla, D. The greening and browning of Alaska based on 1982–2003 satellite data. Glob. Ecol. Biogeogr. 2008, 17, 547–555. [Google Scholar] [CrossRef]
- Alcaraz-Segura, D.; Chuvieco, E.; Epstein, H.E.; Kasischke, E.S.; Trishenko, A. Debating the greening vs. Browning of the North American boreal forest: Differences between satellite datasets. Glob. Change Biol. 2010, 16, 160–770. [Google Scholar]
- Stafford, J.M.; Wendler, G.; Curtis, J. Temperature and precipitation of Alaska: 50 year trend analysis. Theor. Appl. Climatol. 2000, 67, 33–44. [Google Scholar] [CrossRef]
- Tucker, C.J.; Pinzon, J.E.; Brown, M.E.; Slayback, D.A.; Pak, E.W.; Mahoney, R.; Vermote, E.F.; ElSaleous, N. An extended AVHRR 8-km NDVI data set compatible with MODIS and SPOT vegetation NDVI. Int. J. Remote Sens. 2005, 26, 4485–4498. [Google Scholar] [CrossRef]
- Fensholt, R.; Rasmussen, K.; Nielsen, T.T.; Mbow, C. Evaluation of earth observation based long term vegetation trends—Intercomparing NDVI time series trend analysis consistency of Sahel from AVHRR GIMMS, Terra MODIS and SPOT VGT data. Remote Sens. Environ. 2009, 113, 1886–1898. [Google Scholar] [CrossRef]
- Huete, A.; Didan, K.; Miura, T.; Rodriguez, E.P.; Gao, X.; Ferreira, L.G. Overview of the radiometric and biophysical performance of the MODIS vegetation indices. Remote Sens. Environ. 2002, 83, 195–213. [Google Scholar] [CrossRef]
- Chander, G.; Markham, B.L.; Helder, D.L. Summary of current radiometric calibration coefficients for Landsat MSS, TM, ETM+, and EO-1 ALI sensors. Remote Sens. Environ. 2009, 113, 893–903. [Google Scholar] [CrossRef]
- Hall, F.G.; Strebel, D.E.; Nickeson, J.E.; Goetz, S.J. Radiometric rectification: toward a common radiometric response among multidate, multisnesor images. Remote Sens. Environ. 1991, 35, 11–27. [Google Scholar] [CrossRef]
- Schroeder, T.A.; Cohen, W.B.; Song, C.; Canty, M.J.; Yang, Z. Radiometric correction of multi-temporal Landsat data for characterization of early successional forest patterns in western Oregon. Remote Sens. Environ. 2006, 103, 16–26. [Google Scholar] [CrossRef]
- Wagner, D.; DeFoliart, L.; Doak, P. Impact of epidermal leaf mining by the aspen leaf miner (Phyllocnistis populiella) on the growth, physiology, and leaf longevity of quaking aspen. Oecologia 2008, 157, 259–267. [Google Scholar] [CrossRef] [PubMed]
- Furniss, M.M.; Holsten, E.H.; Foote, M.J.; Bertram, M. Biology of a Willow Leafblotch Miner, Micrurapteryx salicifoliella, (Lepidoptera: Gracillariidae) in Alaska. Environ. Entomol. 2001, 30, 736–741. [Google Scholar] [CrossRef]
- Volney, W.J.A.; Fleming, R.A. Spruce budworm (Choristoneura spp.) biotype reactions to forest and climate characteristics. Glob. Change Biol. 2007, 13, 1630–1643. [Google Scholar] [CrossRef]
- Werner, R.A.; Raffa, K.F.; Illman, B.L. Dynamics of Phytophagous Insects and their pathogens in Alaskan boreal forests. In Alaska’s Changing Boreal Forest; Chapin, F.S., III, Oswood, M.W., Van Cleve, K., Viereck, L.A., Verbyla, D.L., Eds.; Oxford University Press: New York, NY, USA, 2006; pp. 134–135. [Google Scholar]
- Zhang, K.; Kimball, J.S.; Mu, Q.; Jones, L.A.; Goetz, S.J.; Running, S.W. Satellite based analysis of northern ET trends and associated changes in regional water balance from 1983 to 2005. J. Hydrol. 2009, 379, 92–110. [Google Scholar] [CrossRef]
- McGuire, A.D.; Ruess, R.W.; Lloyd, A.; Yarie, J.; Clein, J.S.; Juday, G.P. Vulnerability of white spruce tree growth in interior Alaska in response to climate variability: dendrochronological, demographic, and experimental perspectives. Canad. J. Forest Res. 2010, 40, 1197–1209. [Google Scholar] [CrossRef]
- Wilkimg, M.; Myers-Smith, I. Changing climate sensitivity of blacks spruce (Picea mariana Mill.) in a peatland-forest landscape in interior Alaska. Dendrochronologic 2008, 25, 167–175. [Google Scholar]
- Kljun, N.; Black, T.A.; Griffis, T.J.; Barr, A.G.; Gaumont-Guay, D.; Morgenstern, K.; McCaughey, J.H.; Nesic, Z. Response of net ecosystem productivity of three boreal forest stands to drought. Ecosystems 2006, 9, 1128–1144. [Google Scholar] [CrossRef]
© 2010 by the authors; licensee MDPI, Basel, Switzerland. This article is an open access article distributed under the terms and conditions of the Creative Commons Attribution license (http://creativecommons.org/licenses/by/3.0/).
Share and Cite
Parent, M.B.; Verbyla, D. The Browning of Alaska’s Boreal Forest. Remote Sens. 2010, 2, 2729-2747. https://doi.org/10.3390/rs2122729
Parent MB, Verbyla D. The Browning of Alaska’s Boreal Forest. Remote Sensing. 2010; 2(12):2729-2747. https://doi.org/10.3390/rs2122729
Chicago/Turabian StyleParent, Mary Beth, and David Verbyla. 2010. "The Browning of Alaska’s Boreal Forest" Remote Sensing 2, no. 12: 2729-2747. https://doi.org/10.3390/rs2122729
APA StyleParent, M. B., & Verbyla, D. (2010). The Browning of Alaska’s Boreal Forest. Remote Sensing, 2(12), 2729-2747. https://doi.org/10.3390/rs2122729