1. Introduction
Human activities can generate severe negative impacts in the Earth system, resulting in environmental changes greater than natural variability [
1]. The term Global Change is commonly employed to refer to such environmental changes. This concept considers a wide range of changes in Earth ecosystems with three common characteristics: (1) changes of human origin; (2) an exponential growth rate over time; and (3) a global scale manifestation [
2]. Factors such as habitat change, overexploitation of natural resources, invasive species introduction, pollution and climate change have been recognized as major global change drivers [
3]. Land-cover (
i.e., biophysical attributes of the Earth’s surface) and land-use (human purpose applied to these attributes) changes are among the most important drivers of the Earth’s global change [
4,
5], and significantly affect key aspects of Earth System functioning [
6]. In fact, land-use/land-cover changes have been identified as the factor with the largest effect on terrestrial ecosystems than any other driver of global change [
7].
Land-cover changes may result from human-induced land-use changes or natural processes such as climatic variability and natural disturbances [
8]. The status and rate of land-cover changes may be estimated through a monitoring approach with remotely sensed data [
9]. Thus, Earth-observing systems allow the study of the role of terrestrial vegetation in large-scale global processes (e.g., the carbon cycle) with the goal of understanding how the Earth functions as a system [
10]. In fact, satellite data provides a synoptic view, worldwide coverage and repeated temporal sampling of the Earth’s surface with a great potential for monitoring vegetation dynamics from regional to global scales [
11]. Accurate, timely information on the distribution of vegetation on the Earth's surface is a pre-requisite for understanding how changes in land-cover affect phenomena as diverse as atmospheric CO
2 concentrations, terrestrial primary productivity, the hydrologic cycle, and the energy balance at the surface-atmosphere interface [
12].
Vegetation indices have been used to derive a measure that correlates with surface biophysical properties [
13] that facilitate the analysis of large amounts of satellite data, thereby providing valuable large spatial- and temporal-scale analyses [
12]. The fact that vegetation indices are directly related to plant vigor, density, and growth conditions, means that they can be used to detect environmental conditions like droughts in semiarid regions [
9]. During the last decades, multiple studies have provided a wide range of vegetation indices, the most frequently used being the Normalised Difference Vegetation Index (NDVI) described by Rousse
et al. [
14]. Despite the undeniable usefulness of the NDVI, it has some constraints inherent to vegetated canopies (
i.e., canopy background contamination and saturation problems) which restrict its use and interpretation [
15]. In this sense, many indices have been developed to minimize these limitations. The Enhanced Vegetation Index (EVI) described by Huete
et al. [
15] was employed in this study. This index has been implemented as a standard product (along with NDVI) for the data acquired by the Moderate Resolution Imaging Spectroradiometer (MODIS) sensor. A MODIS-EVI dataset was used for the selected study area.
Vegetation indices have contributed to characterize seasonal variations and phenologic activity of vegetation in time series of satellite data, providing baseline data to monitor length of the growing season, peak greenness, onset of greenness, or land-cover changes associated with events such as fire, drought, land-use conversion, and climate fluctuation [
15,
16,
17]. The study of vegetation-index time series for the analyses of vegetation phenology is highly complex and multiple approaches and techniques have been developed. Time series anomalies and the Fourier Transform (FT) are commonly used techniques for vegetation phenology analyses. Vegetation index time series anomalies, defined as differences between standardized EVI values from their mean-daily (or any other unit of time) values attempt to track daily values (or the corresponding unit of time) that are associate to the degree of wetness or dryness (positive or negative anomaly values) of the condition of ground vegetation [
18]. On the other hand, the application of the Fourier Transform (harmonic analysis) facilitates the extraction of valuable and interpretable characteristics from the time series, which are usually disturbed by atmospheric noise, sensor instability or orbit deviations [
19]. Harmonic analysis of remote sensing time-series can be used to detect changes in land use/land covers by examining changes in annual values of amplitude, phase, or the additive term over a period of years [
20]. In addition, the amplitude and phase values of the harmonic terms for the different frequencies inform about the relative importance of periodic climate processes [
21]. Harmonic analysis of time-series data offers a valuable tool for monitoring land surface phenologies [
16,
22], for mapping land-uses [
20,
23], for modeling bioclimatic indices [
24], or monitoring flooding extent [
25].
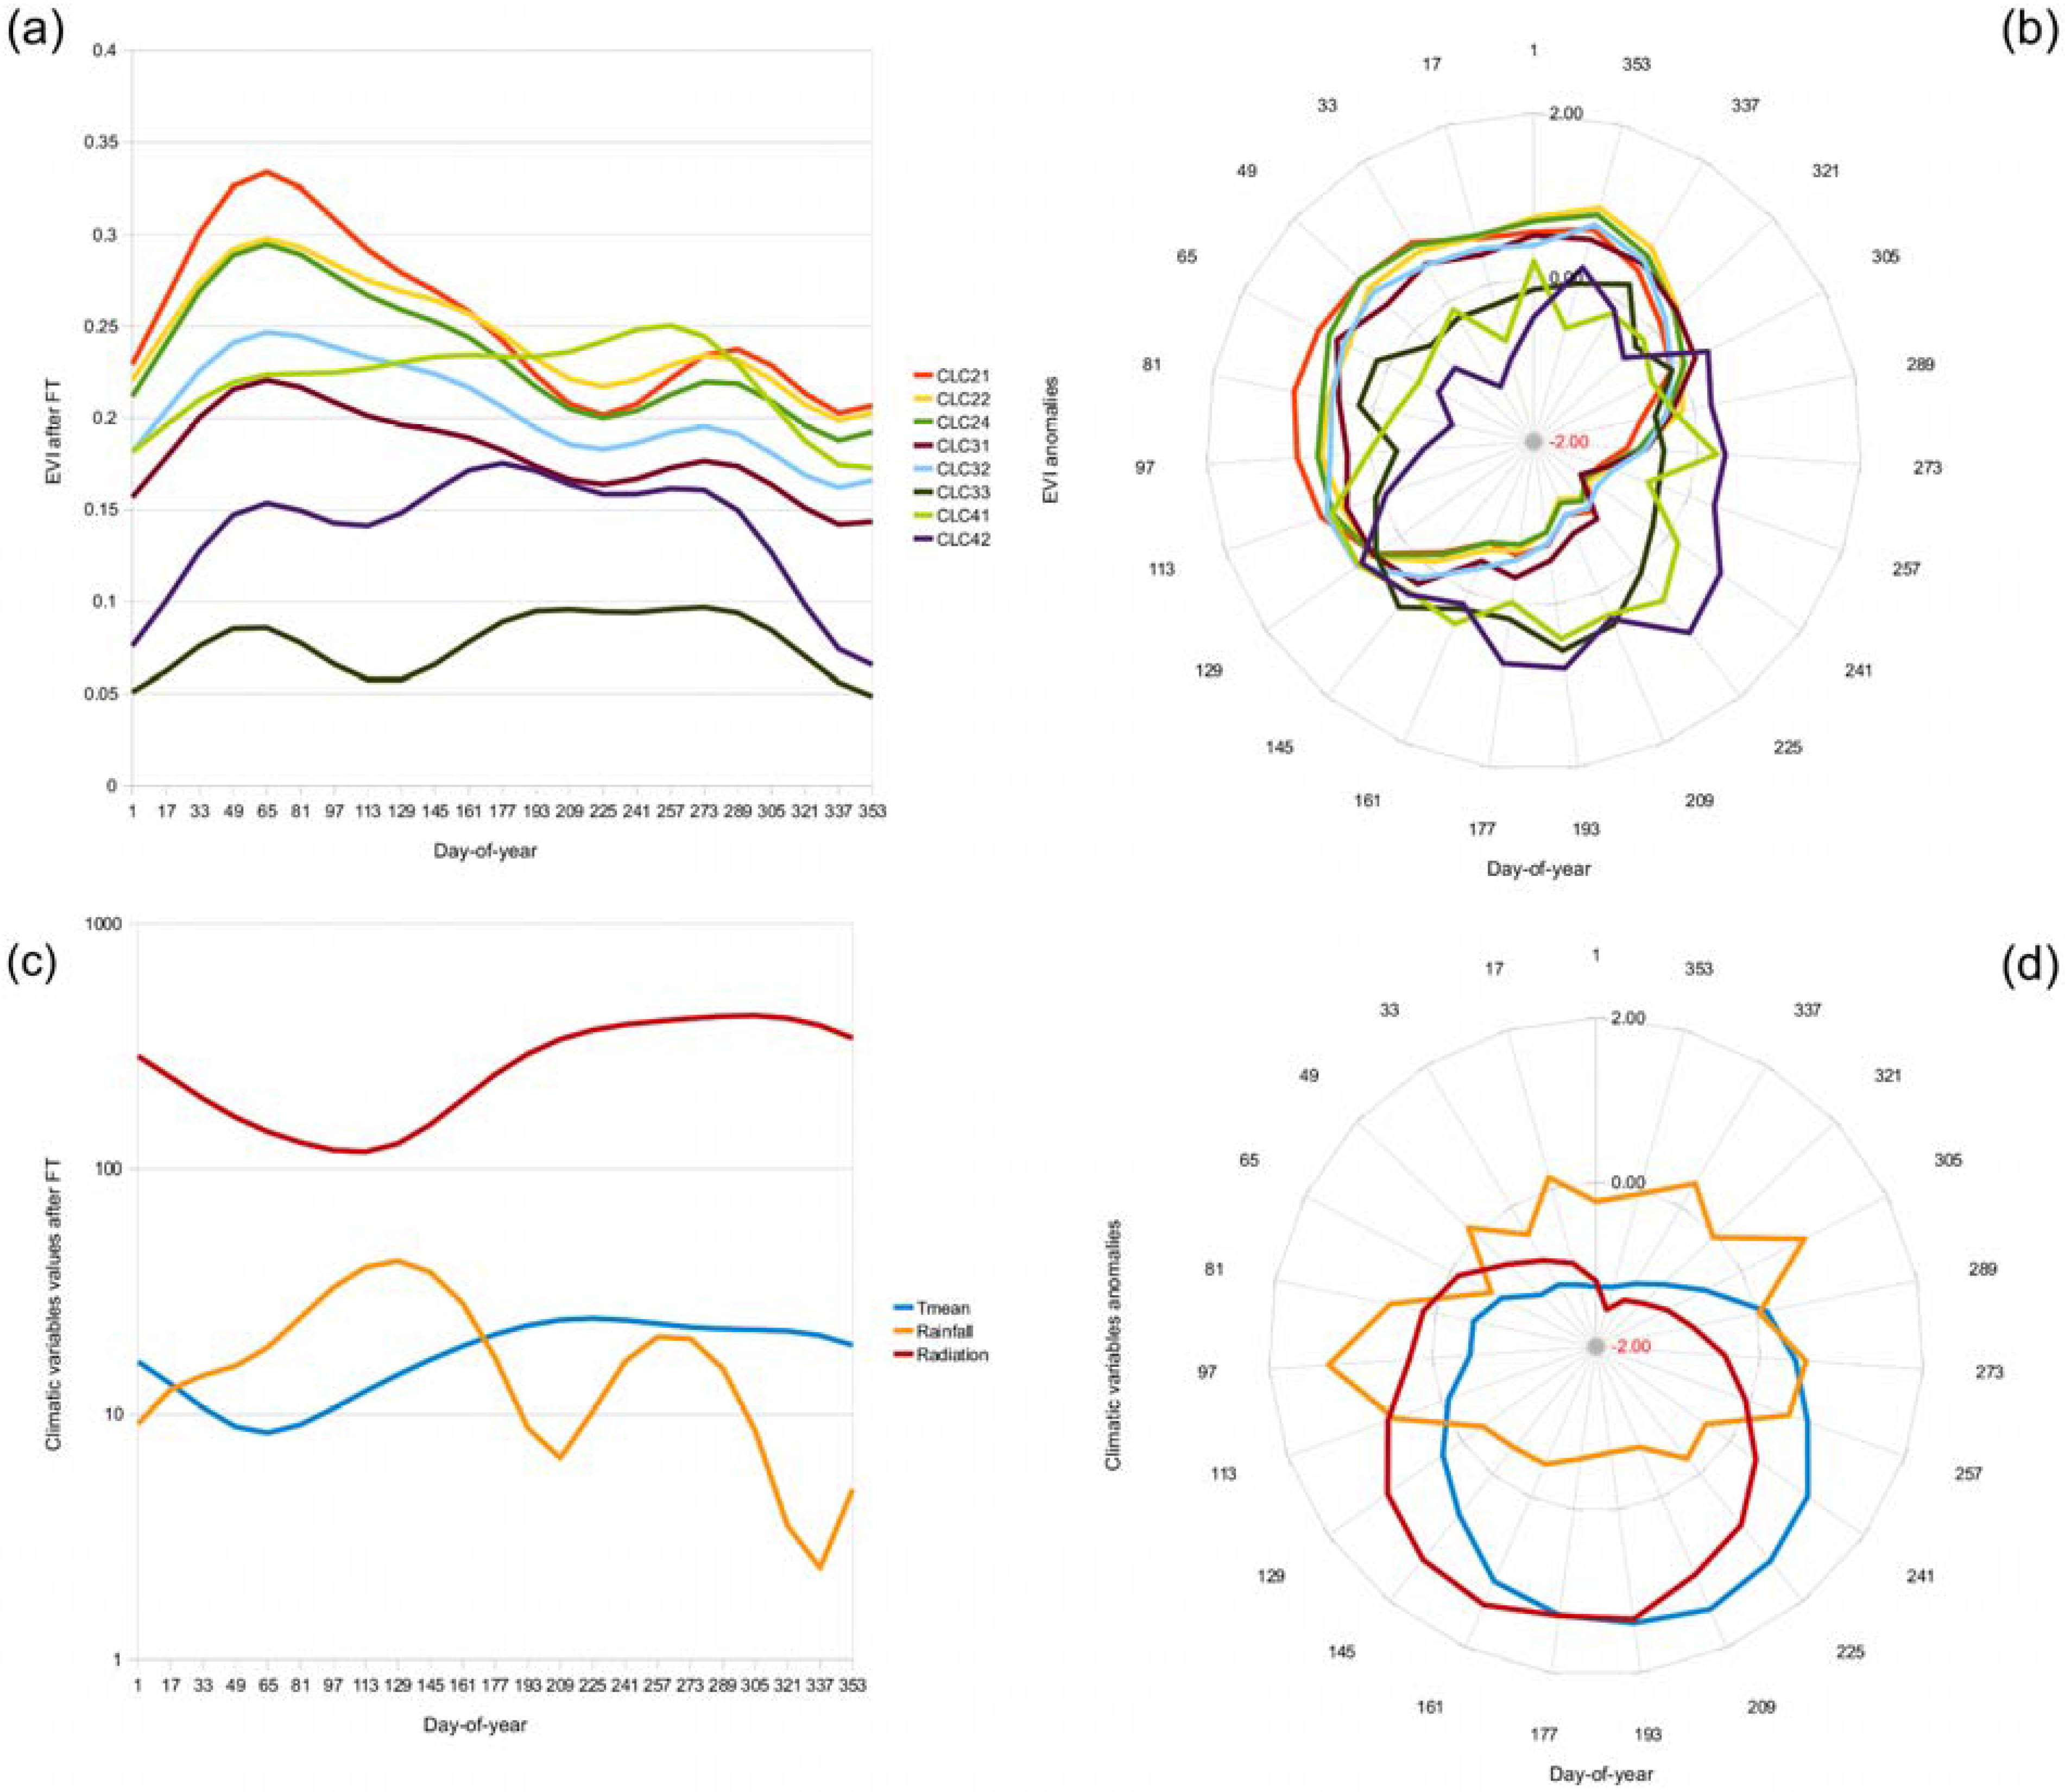
This study quantitatively describes EVI temporal changes for Mediterranean land-covers from the viewpoint of vegetation phenology and its relation with climate. MODIS-EVI time series anomalies and Fourier Transform parameters provided valuable information about the dynamics of vegetation during the period 2001–2007. Time series of climatic variables were analyzed in the same way that the time series of the vegetation index. Significant correlations between vegetation and climate time series parameters were searched for to better understand the response of vegetation land-covers to climate variability.
2. Material and Methods
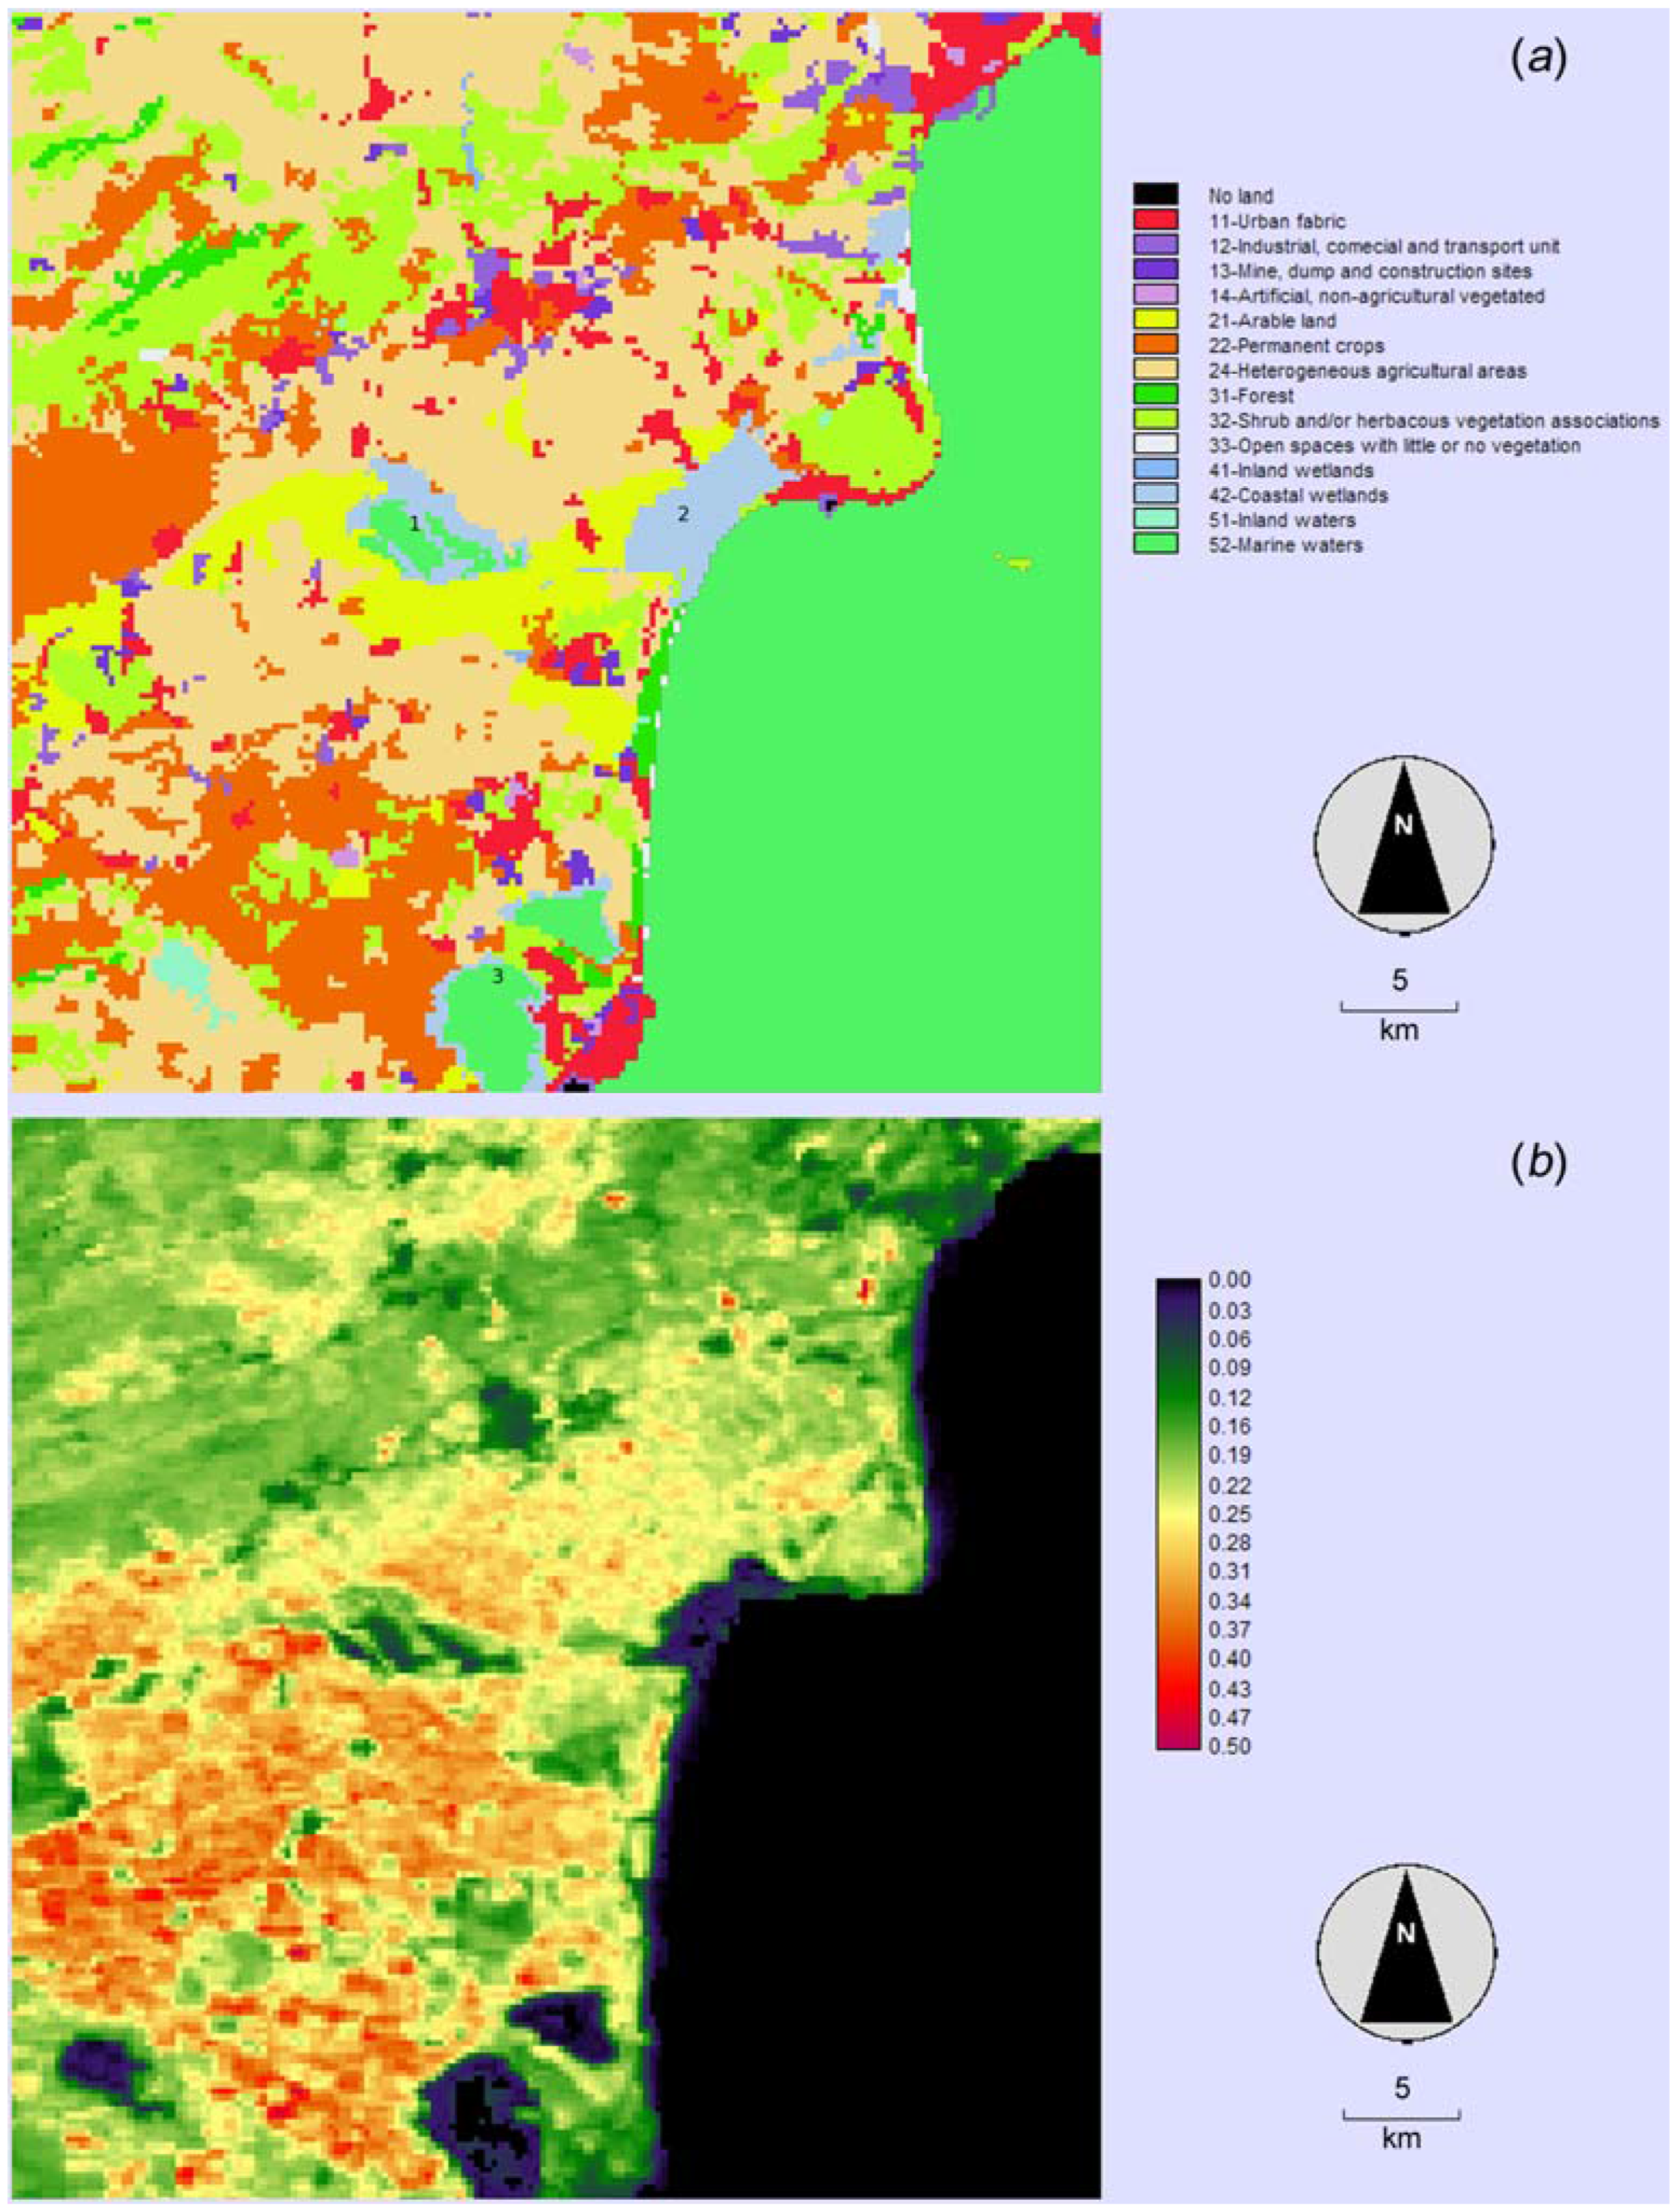
The study area is located in a coastal zone of SE Spain in southern Alicante province. It is located around 38.18°N latitude and 0.68°W longitude. The study area is 45 × 45 kilometers in area, accounting for a total of 2,025 square kilometers. This area is a mixture of medium size cities, coastal urban areas, scattered residential houses, irrigated crops and isolated and scattered wetlands. The climate of the study area is defined by the Köppen climate classification system as
Bsk class (dry climate with a dry season in summer and a mean annual temperature of less than 18 ºC). The climate is arid or semiarid according to the aridity index of Martonne [
26] and the aridity index of UNEP [
27] respectively. Major soil groups in the study area include Fluvisols, Calcisols, Solonchaks and Gleysols [
28,
29] based on the World Reference Base for Soil Resources [
30].
Vegetation phenology was assessed by analyzing time series anomalies of vegetation index and Fourier Transform parameters for a 16-day time series from 2001 to 2007. The selected vegetation index was the EVI acquired by the moderate resolution MODIS sensor at 16-day time interval, a standard product coded as MOD13Q1. A total of 161 EVI 16-day composite images were employed in the analyses. Land cover information was obtained from the CORINE Land-cover (CLC) 2000 database of the European Environmental Agency. This database provided information about the European Union land-cover for the year 2000. CLC cartography uses a hierarchical system of land-cover classes with different levels of specificity. This analysis employed a Level II coverage that provided a good description of land-cover for the study area.
Table 1 shows land-cover identified for the study area and their surfaces (percentage of terrestrial area). EVI time series phenology analyses were carried out for all land-cover classes with the exception of urban-industrial areas (CLC11 to CLC14) and water bodies (CLC51 and CLC52) because of by their low or null-vegetation presence. A stratified random sampling (stratification based on the land-cover map) was performed on the images of the EVI time series. About 1,500 pixels were selected after visual inspection in order to avoid outliers and pixels that have undergone land-use changes during the study period. These pixels were used to extract the values of EVI from each image of the time series. A final matrix with 161 EVI values and land-cover classes for each pixel was obtained and employed for the vegetation analyses.
Table 1.
CORINE land-cover 2000 level II land-cover classes of the study area, and their relative areas.
Table 1.
CORINE land-cover 2000 level II land-cover classes of the study area, and their relative areas.
| Code | Land-covers | Surface coverage (%) |
| CLC11 | Urban | 6.93 |
| CLC12 | Industrial, commercial and transport unit | 1.79 |
| CLC13 | Mine, dump and construction sites | 1.28 |
| CLC14 | Artificial, non-agricultural vegetated | 0.30 |
| CLC21 | Arable land | 6.43 |
| CLC22 | Permanent crops | 19.96 |
| CLC24 | Heterogeneous agricultural areas | 39.29 |
| CLC31 | Forest | 1.52 |
| CLC32 | Shrub and/or herbaceous vegetation associations | 16.17 |
| CLC33 | Open spaces with little or no vegetation | 0.33 |
| CLC41 | Inland wetlands | 0.15 |
| CLC42 | Coastal wetlands | 3.34 |
| CLC51 | Inland water | 0.39 |
| CLC52 | Marine waters | 2.13 |
Several daily climatic variables, namely mean temperature (Tmean, °C), maximum temperature (Tmax, °C), minimum temperature (Tmin, °C), rainfall (mm), incoming solar radiation (MJ m−2 day−1) and evapotranspiration (ETP, mm), were used as explanatory variables for the discussion of the vegetation phenology behavior. Climatic variables were obtained from five meteorological stations maintained by the Spanish Ministry of Environment (MARM). Meteorological stations are located in a coastal plain with low climate variability. Therefore, they can be assumed to be representative of the climatic conditions of the study area. For each meteorological station, daily values of climatic variables were computed (i.e., average temperatures, and accumulated rainfall, radiation and ETP) for the same 16-day time intervals of EVI time series.
A brief description of the vegetation index time series, the time series anomaly analysis method, the Fourier Transform method and the statistical methods to assess the relationship between vegetation phenology and climatic variables are presented.
2.1. MODIS-EVI Time Serie
EVI is a vegetation index optimized to avoid background and atmospheric influences [
15]. EVI is based in the approach developed by Liu and Huete [
31] to incorporate both background adjustment and atmospheric resistance concepts and thus improve on the Normalised Difference Vegetation Index (NDVI) which was originally developed by Rouse
et al. [
14]. This resulted in the enhanced soil and atmosphere resistant-vegetation index (EVI) adopting the following expression [
15]:
where
ρNIR,
ρR,
ρB are ‘apparent’ (top-of-the-atmosphere) or ‘surface’ directional reflectance for the NIR (near infrared), red and blue bands respectively.
L is a canopy background adjustment term, and C
1 and C
2 weight the use of the blue channel in aerosol correction of the red channel.
A time series of satellite images acquired by the TERRA-MODIS sensor was used for the analysis. The selected MODIS product was an EVI thematic product, namely MOD13Q1 Version 005. MOD13Q1 is a Level II product that contains EVI 16-day composites at 250 m spatial resolution image data acquired by the Terra satellite. An EVI time series from 2001 to 2007 composed of 161 MOD13Q1 images was analyzed.
MODIS data were transformed from Sinusoidal projection to UTM projection for a subset of 45 × 45 km over the study area. MODIS time series were geometrically co-registered to a Landsat ETM+ scene from 8 July 2001 (with 30 m of spatial resolution). Landsat ETM+ scene had been previously geometrically corrected using aerial orthophotography and vector cartography at a scale of 1:10,000.
2.2. Detection and Quantification of Time Series Anomalies
The analysis of vegetation index time series anomalies is a useful method of assessing the degree of wetness or dryness of the condition of ground vegetation for each time unit in relation to the average value of the time series [
18]. Time series anomalies were computed for each 16-day EVI composite value in relation to the average EVI value from 2001 to 2007. The time series anomaly was computed using the following expression:
where
TSt is the time series value for a given moment, and
TSΔt and
σΔt are respectively the mean value and the standard deviation value of the time series for the full period of time studied. When the
TSanomaly is negative, it indicates below-normal vegetation conditions, thereby pointing to prevailing drought, and when it is positive it indicates above normal vegetation conditions thereby pointing to wetness [
18]. Time series anomalies of the climatic variables were also computed. Time series anomalies have been previously employed for vegetation index time series analysis in relation to climatic variables [
32,
33]. It provided an intuitive way to identify intensity and duration of the canopy change/stress or different climatic variations.
Various non-dimensional coefficients have been previously described to represent magnitude and timing of the anomalies of a time series, such as [
33]: (1)
coefficient D, that is the sum of negative anomalies for a given study period; and (2)
coefficient S, that is the sum of positive anomalies for a given study period. Both coefficients were computed for time series of EVI and climatic variables for each year of the studied period. Finally, a new coefficient that we named
normalized D/S was computed as a normalized coefficient between coefficient D and coefficient S. The normalized D/S coefficient synthesized in a single value the general pattern of time series anomalies for each year. Values range between −1 to +1. For the EVI time series, negative normalized D/S coefficient values represent a year above normal vegetation (or climatic variable) conditions, while a positive value represent a year below normal vegetation (or climatic variable) conditions.
2.3. Fourier Transform
MODIS-EVI time series were analyzed by the Fourier Transform to obtain its frequency domain components. Fourier analysis allows the decomposition of temporal data to the frequency domain, by which frequency information is represented in terms of the sum of a set of sine and cosine functions [
34]. Harmonic or Fourier analysis allows a complex curve to be expressed as the sum of a cosine waves (terms) and an additive term [
35,
36]. The Fourier Transform converts a function
f(
x) to the frequency domain by a linear combination of trigonometric functions as follows [
22]:
where
ω is the frequency and
F(
ω) is the Fourier coefficient with frequency
ω. It is customary to use a discrete form as follows [
22]:
where
K = 0, 1, 2, …,
N–1 and
N is the total number of input data.
For a correct interpretation of harmonic analysis results, several key-concepts must be considered [
37]: (1) each wave is defined by a unique amplitude and phase angle, where amplitude is the difference between the maximum value of a wave and the overall average of the time series (usually 0 because the mean is equal to the harmonic term with k = 0), and the phase angle defines the offset between the origin and the peak of the wave over the range 0 to 2π; (2) the additive or zero term is the arithmetic mean of the variable over the time series; (3) high amplitude values for a given term indicate a high level of variation in temporal variable time series, and the term in which that variation occurs indicate the periodicity of the event; and (4) phase indicates the time of year at which the peak value for a term occurs. Each term indicates the number of complete cycles completed by a wave over a defined interval [
20]. The Fourier Transform was applied individually for each studied year. The additive term and the first three harmonic components for each year of the EVI time series were extracted for all land-cover classes for subsequent analysis. IDRISI Andes © software was employed for the harmonic analysis of the time series.
2.4. Statistical Analysis
Statistical analyses were used to assess different phenological responses of vegetation, and to determine the influence of climatic variables on those vegetation land-covers.
Annual EVI differences for selected land-cover were assessed with the one-way Analysis of Variance (ANOVA) test using years as factor. Pairwise comparisons were performed with the Tukey post-hoc test at the P < 0.05 significance level. Homogeneous subgroups (years with similar EVI values) were defined based on the post-hoc test results.
A two-way ANOVA test was employed to assess annual differences and differences among meteorological stations for the climatic variables time series. Climatic variables with significant differences among meteorological stations were discarded for further analysis because such variables did not show a homogeneous spatial pattern.
Pearson bivariate correlations were used to analyze the influence of climatic variables on location-specific land-cover phenology. Pearson correlation coefficients were computed by using as variables several parameters such as: the anomaly values for the full time series (ATS), the normalized D/S values for each year (NDS), annual amplitude (for the first three harmonic terms and the additive one) values computed with the Fourier Transform (FT-A), and annual phase (for the first three harmonic terms) values computed with the Fourier Transform (FT-P).


 ,
, 

