1. Introduction
The Cerrado, the Brazilian central savanna biome, encompasses an area of approximately 2 million km
2, distributed over 11 states (roughly 26% of the country) [
1]. Being the headwater region of major rivers of eastern South America, it is considered one of the world’s biodiversity hotspots [
2] for its natural value and endangerment level. Its different inner ecosystems—ranging from grasslands to tropical dry forests—and transitional areas toward all other major Brazilian biomes contain high levels of biodiversity, as well as endemism.
Satellite based assessments have estimated the remaining natural vegetation cover to be as low as 50% [
3,
4] and highly fragmented [
5,
6]. These large-scale human induced changes, of unparalleled proportions and speed [
7] and particularly prominent in the Cerrado’s southern portions, date back to the 1960s, as a consequence of extensive cattle ranching and intensive commodity crops, which turned the Cerrado into the main agricultural frontier in the country [
8,
9], hosting the largest national commercial productions of soybean and cattle meat for exportation [
10,
11].
Although the Cerrado conversion has been treated as secondary to the clearance of the Amazon forest, it certainly has impacted the regional hydrology [
12,
13,
14], global temperature [
15] and C-fluxes [
16,
17]. Evidence from global and regional estimations [
18,
19,
20] suggests that about 0.1 Pg of C have been released from the Cerrado in the last 40 years (
i.e., half of the losses due to all the deforestation in the Amazon basin). Nevertheless, such figure and related assessments are still subject to much speculation, as our knowledge of the Cerrado C-stocks, both above and below ground, rely on insufficient and poorly distributed ground plot inventories [
21].
Passive optical remote sensing data has been extensively and successfully used for retrieving and mapping some key surface biophysical parameters in the Cerrado, such as its conspicuous and peculiar phenology [
22,
23,
24], variations in canopy equivalent water thickness [
25] and % green cover [
26]. However, consistent biomass determinations, at the biome scale, require, in addition to a detailed horizontal coverage of the dominant land-cover types, precise vertical measurements, beyond the sensitivity of the Landsat-TM like sensors, the primary data source for multiple-scale land-cover assessments in the Cerrado [
4,
27], or the different Moderate Resolution Imaging Spectroradiometer (MODIS) data products, which has been systematically used for both biophysical retrieval, as well as for monitoring on-going deforestations and burnings [
28,
29,
30].
One alternative, the use of sub-metric optical imagery for extracting canopy structural parameters (e.g., crown area) which can then be related to other biometric properties (e.g., stem density) and to biomass via allometric equations, has shown some promising results over Amazon forested areas [
31] and is currently being evaluated over different Cerrado locations in pursuit of a Cerrado regional biomass map (Palace, M., Personal communication, 2011). In the microwave domain, different studies have demonstrated the ability of SAR (Synthetic Aperture Radar) backscatter, at different polarizations and wavelengths, to respond to variations in structure and biomass in savanna environments [
32,
33]. In particular, Sano
et al. [
34] showed better performance by L-band SAR, compared to optical vegetation indices, in differentiating the major Cerrado physiognomies, characterized by a complex mosaic of intermixed—vertically and laterally—grass, shrub and tree layers. Nevertheless, and despite the ability of the microwave radiation to penetrate through the canopy and to respond to volumetric parameters, it may saturate at relatively low biomass [
35], within the range of biomass values encountered in the Cerrado woodland, where tree cover can be as high as 70% [
36].
On the other hand, waveform LIDAR (LIght Detection And Ranging), which consists of height temporal profiles precisely recorded as the transmitted energy returns from the ground and from inside the canopy [
37], has been proven to correlate well to a wide range of biomass values and other structural parameters [
38,
39,
40,
41,
42]. The GLAS (Geoscience Laser Altimeter System), onboard ICESat (Ice, Cloud and land Elevation Satellite), operational from 2003 to 2009, is the only source of spaceborne LIDAR data available [
43]. Due to mission requirements,
i.e., repeating of individual transects, and circumstances (failure of laser 1 at the very early stage of the mission forced the two remaining lasers to operate on a reduced sampling scheme), GLAS spaced transects provided incomplete data coverage. Limitation in data availability, however, can be minimized by combining the GLAS LIDAR records with other wide swath sensors, which in turn can boost the specific information provided by each sensor individually [
44,
45]. Concerning the Cerrado biome, in addition to being instrumental for the retrieval of regional biomass values, the analysis of the GLAS LIDAR waveforms can also provide new insights on the structure and functionality of the Cerrado physiognomies and how they respond to seasonality, a key element in carbon flux [
46], as well as serve to evaluate the environmental impacts of human-induced disturbances, such as deforestation and fires [
47]. Likewise, orbital LIDAR data could be used to assess degradation in cultivated pastures, the dominant land use form in the Cerrado and certainly its most important emergent ecosystem. Although the differences in pasture height are likely below the GLAS detection threshold, the shapes and overall energy of the waveforms can vary in response to differences in biomass, increase in bare soil exposure, prevalence of non-photosynthetic grasses and arbustive regrowth, the most evident signs of degradation, believed to affect at least 50% of the approximately 600,000 km
2 of pastures encountered in the Cerrado [
48].
In spite of the enormous potential of LIDAR remote sensing for improving our understanding of the Cerrado ecology and, to a certain extent, its territorial governance, to date no use whatsoever has been made of the different GLAS data products. Within this context, we conducted a meta-analysis study on the GLAS LIDAR data availability over the Cerrado biome, which could subsidize future derivation of regional biophysical maps and assessments of anthropogenic changes and impacts. Specifically, we focused on the availability and spatial distribution of GLAS data over the Cerrado remnant vegetation and cultivated pastures, as well as over specific sites of interest, including fully protected areas (where ecological studies can rely on pristine vegetation) and areas subject to recent deforestation or burnings.
2. Data Analysis and Approaches
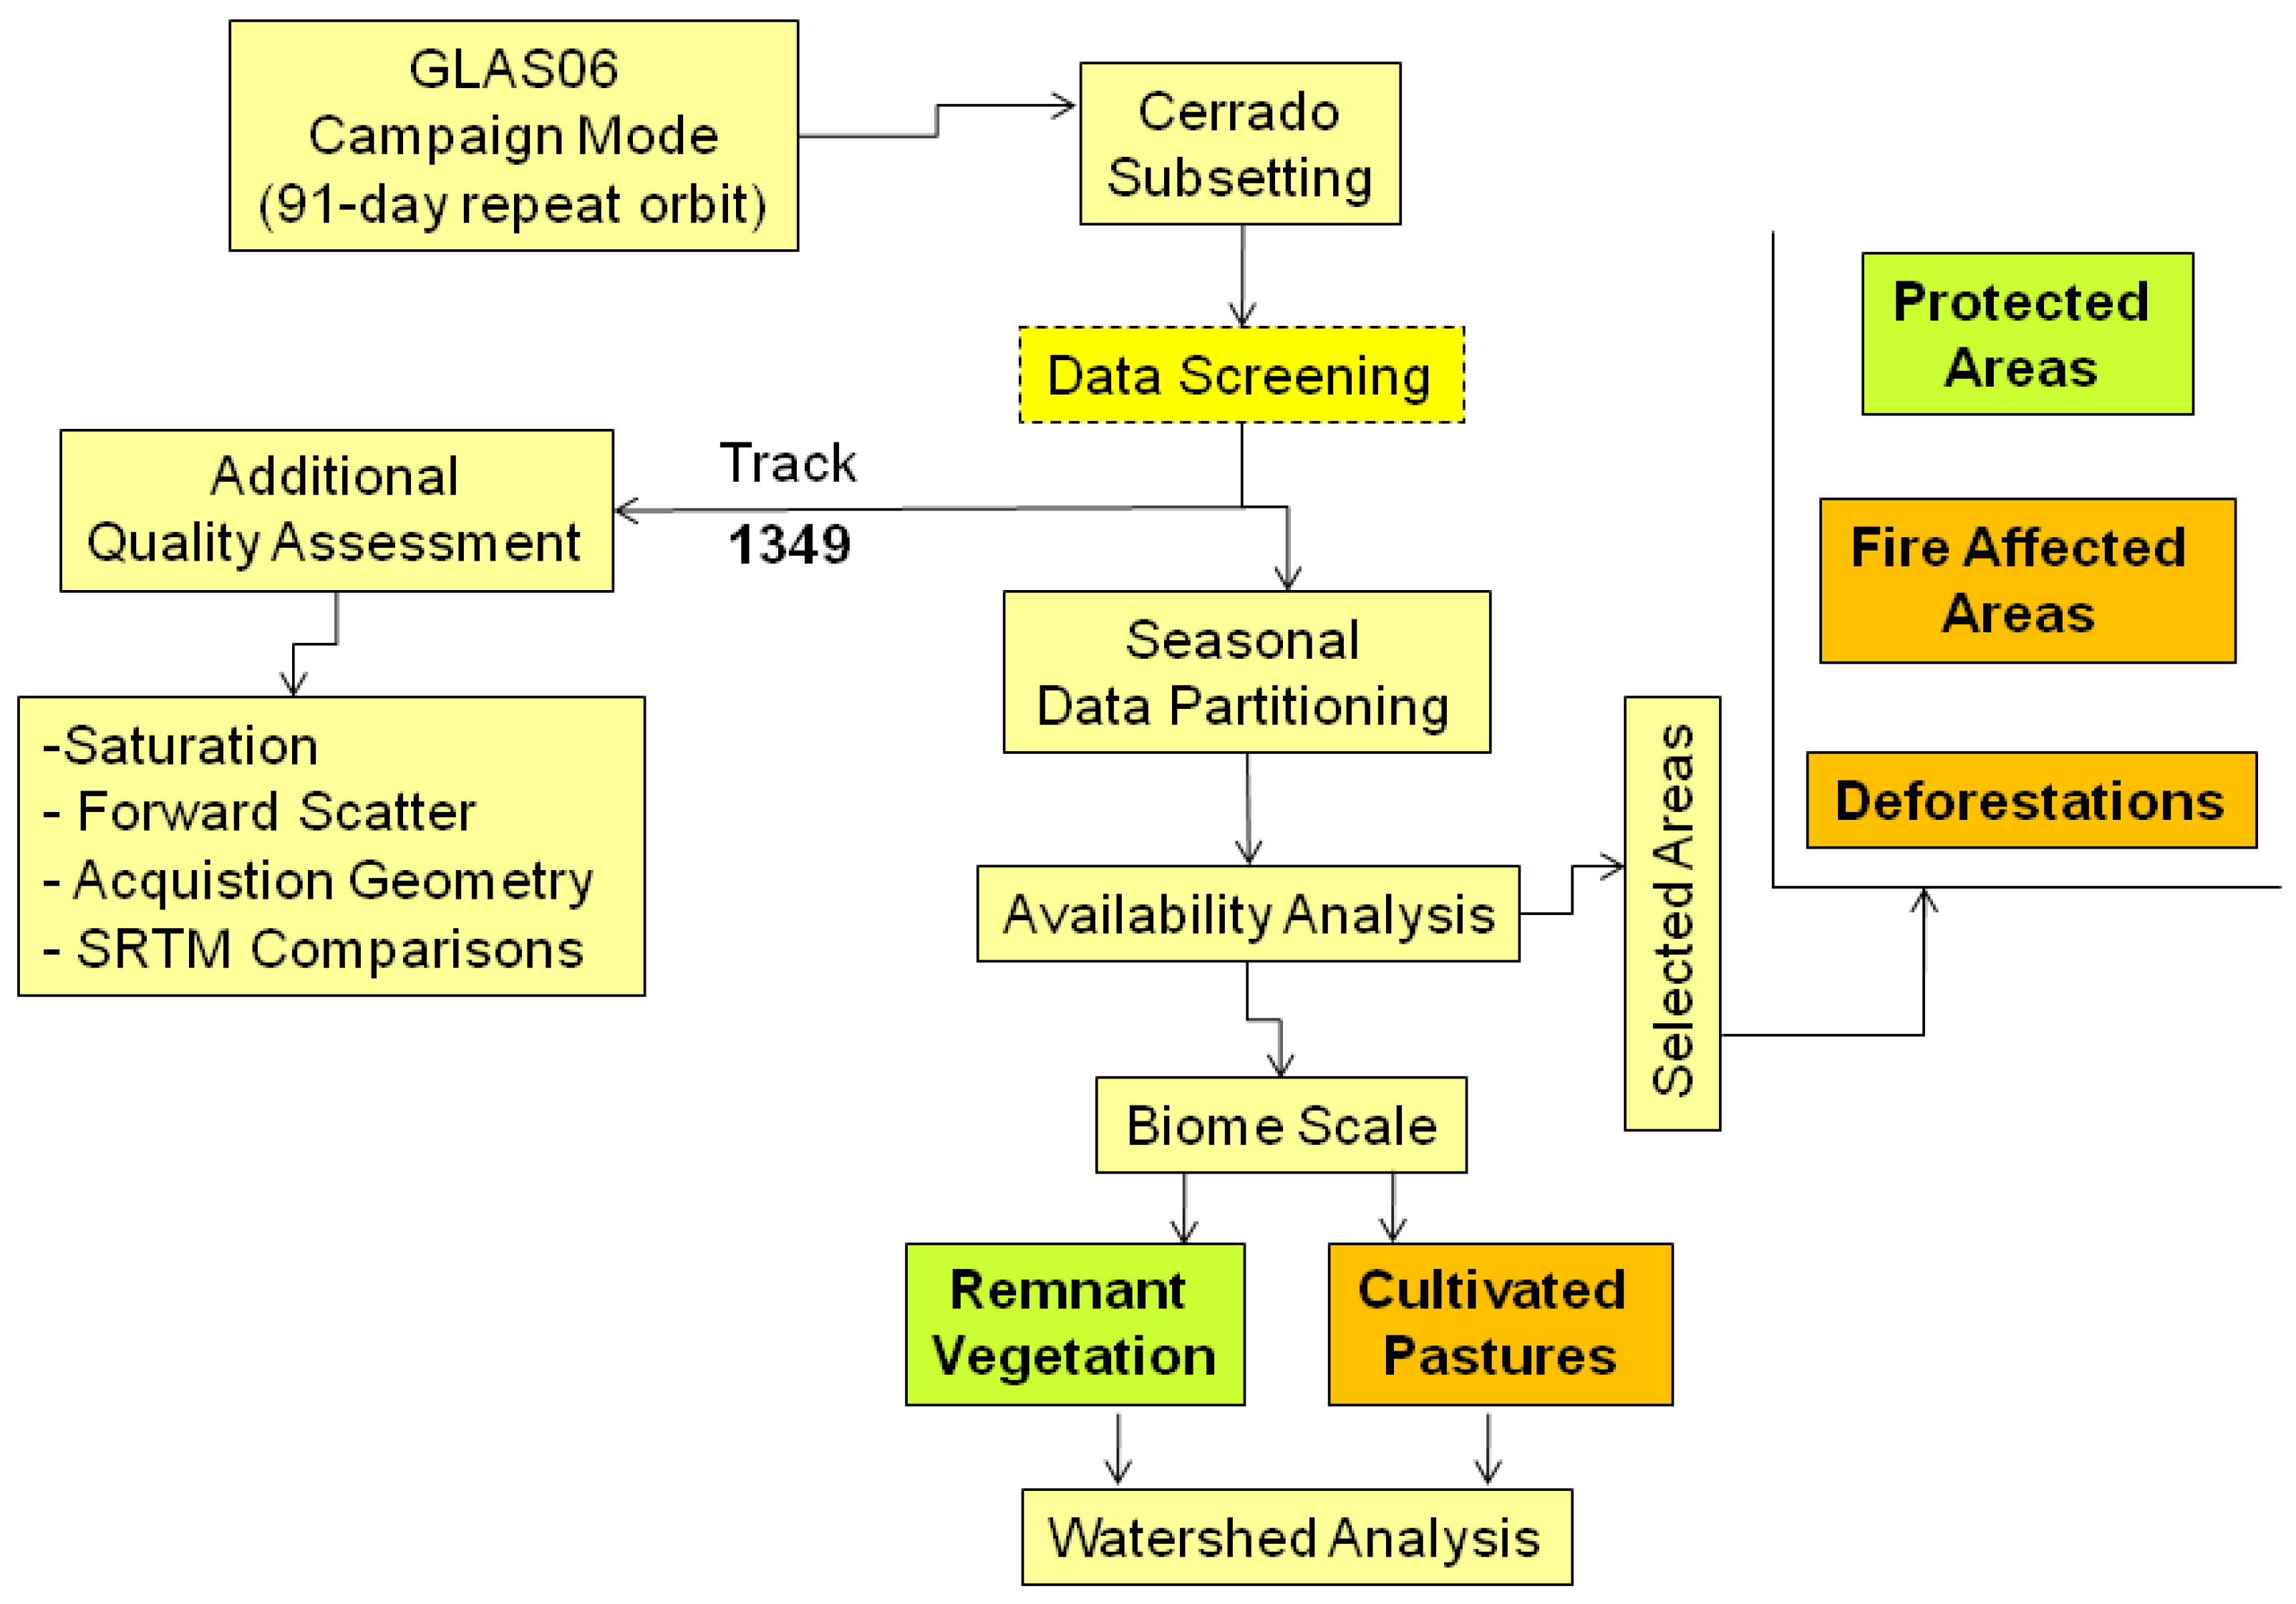
The main steps of this study concerning data organization, processing, and analysis are depicted in
Figure 1. ICESat GLAS availability assessments were based on the level 1B GLA06 global elevation data (release 31), campaign mode 91-day repeat orbit acquisitions (2a through 2f), obtained from the Center for Space Research (UT-Austin CSR) in-house data archives. Data points within the Cerrado limits, screened for cloud contamination (based on the GLA06 elevation flag), were partitioned into three main seasonal categories (dry season, early wet season, and late wet season) and then subsetted according to the different levels of analysis,
i.e., major Cerrado land-cover types, fully-protected conservation units, and deforestation and burnt areas. Additional quality assessments of the laser shots were performed for one specific track (and successive campaigns), based on the analysis of the saturation (low and high gains), saturation and forward scatter, large off-nadir angle, and transmit energy flags, as well as on the comparison with the shuttle radar topography mission (SRTM) elevation data. Although GLAS06 and SRTM elevations are based on distinct geoids and models and depict the landscape from different perspectives and at different resolutions, the SRTM data, obtained from an 11 day mission in February 2000 [
49,
50], can be considered a stable reference, against which the LIDAR elevation differences may indicate both variations in data quality and temporary or permanent target changes.
Figure 1.
Flowchart depicting the organization, processing, and analysis of GLAS data availability over the Cerrado biome.
Figure 1.
Flowchart depicting the organization, processing, and analysis of GLAS data availability over the Cerrado biome.
At the biome scale, the spatial distribution patterns of the LIDAR data points over the total remnant vegetation and cultivated pastures, as selected from the 2002 Landsat-based PROBIO map [
51] (Conservation and Sustainable Use of Brazilian Biodiversity Project, Brazilian Ministry of the Environment Biodiversity Program. Map, in both vector and raster format, freely available at
http://mapas.mma.gov.br/mapas/), were investigated in relation to the 15,612 watersheds comprised in the 6th order Otto basin classification system [
52,
53]. LIDAR data availability over remnant vegetation was also evaluated in relation to the 130 fully-protected conservation units, at the Federal, State, and Municipality levels, distributed throughout the biome.
As for the assessment of LIDAR availability over disturbed areas, for which before and after datasets are needed for comparative purposes, both recent deforestation polygons detected within the scope of the Cerrado Warning Deforestation System (SIAD Cerrado) [
28,
30], through the comparison of 2006 and 2007 MOD13Q1 normalized difference vegetation index images [
54], as well as the 2007 fire affected areas (burnt scars over natural vegetation) assessed through the MOD45A1 product [
55,
56,
57], were considered.
3. Results and Discussions
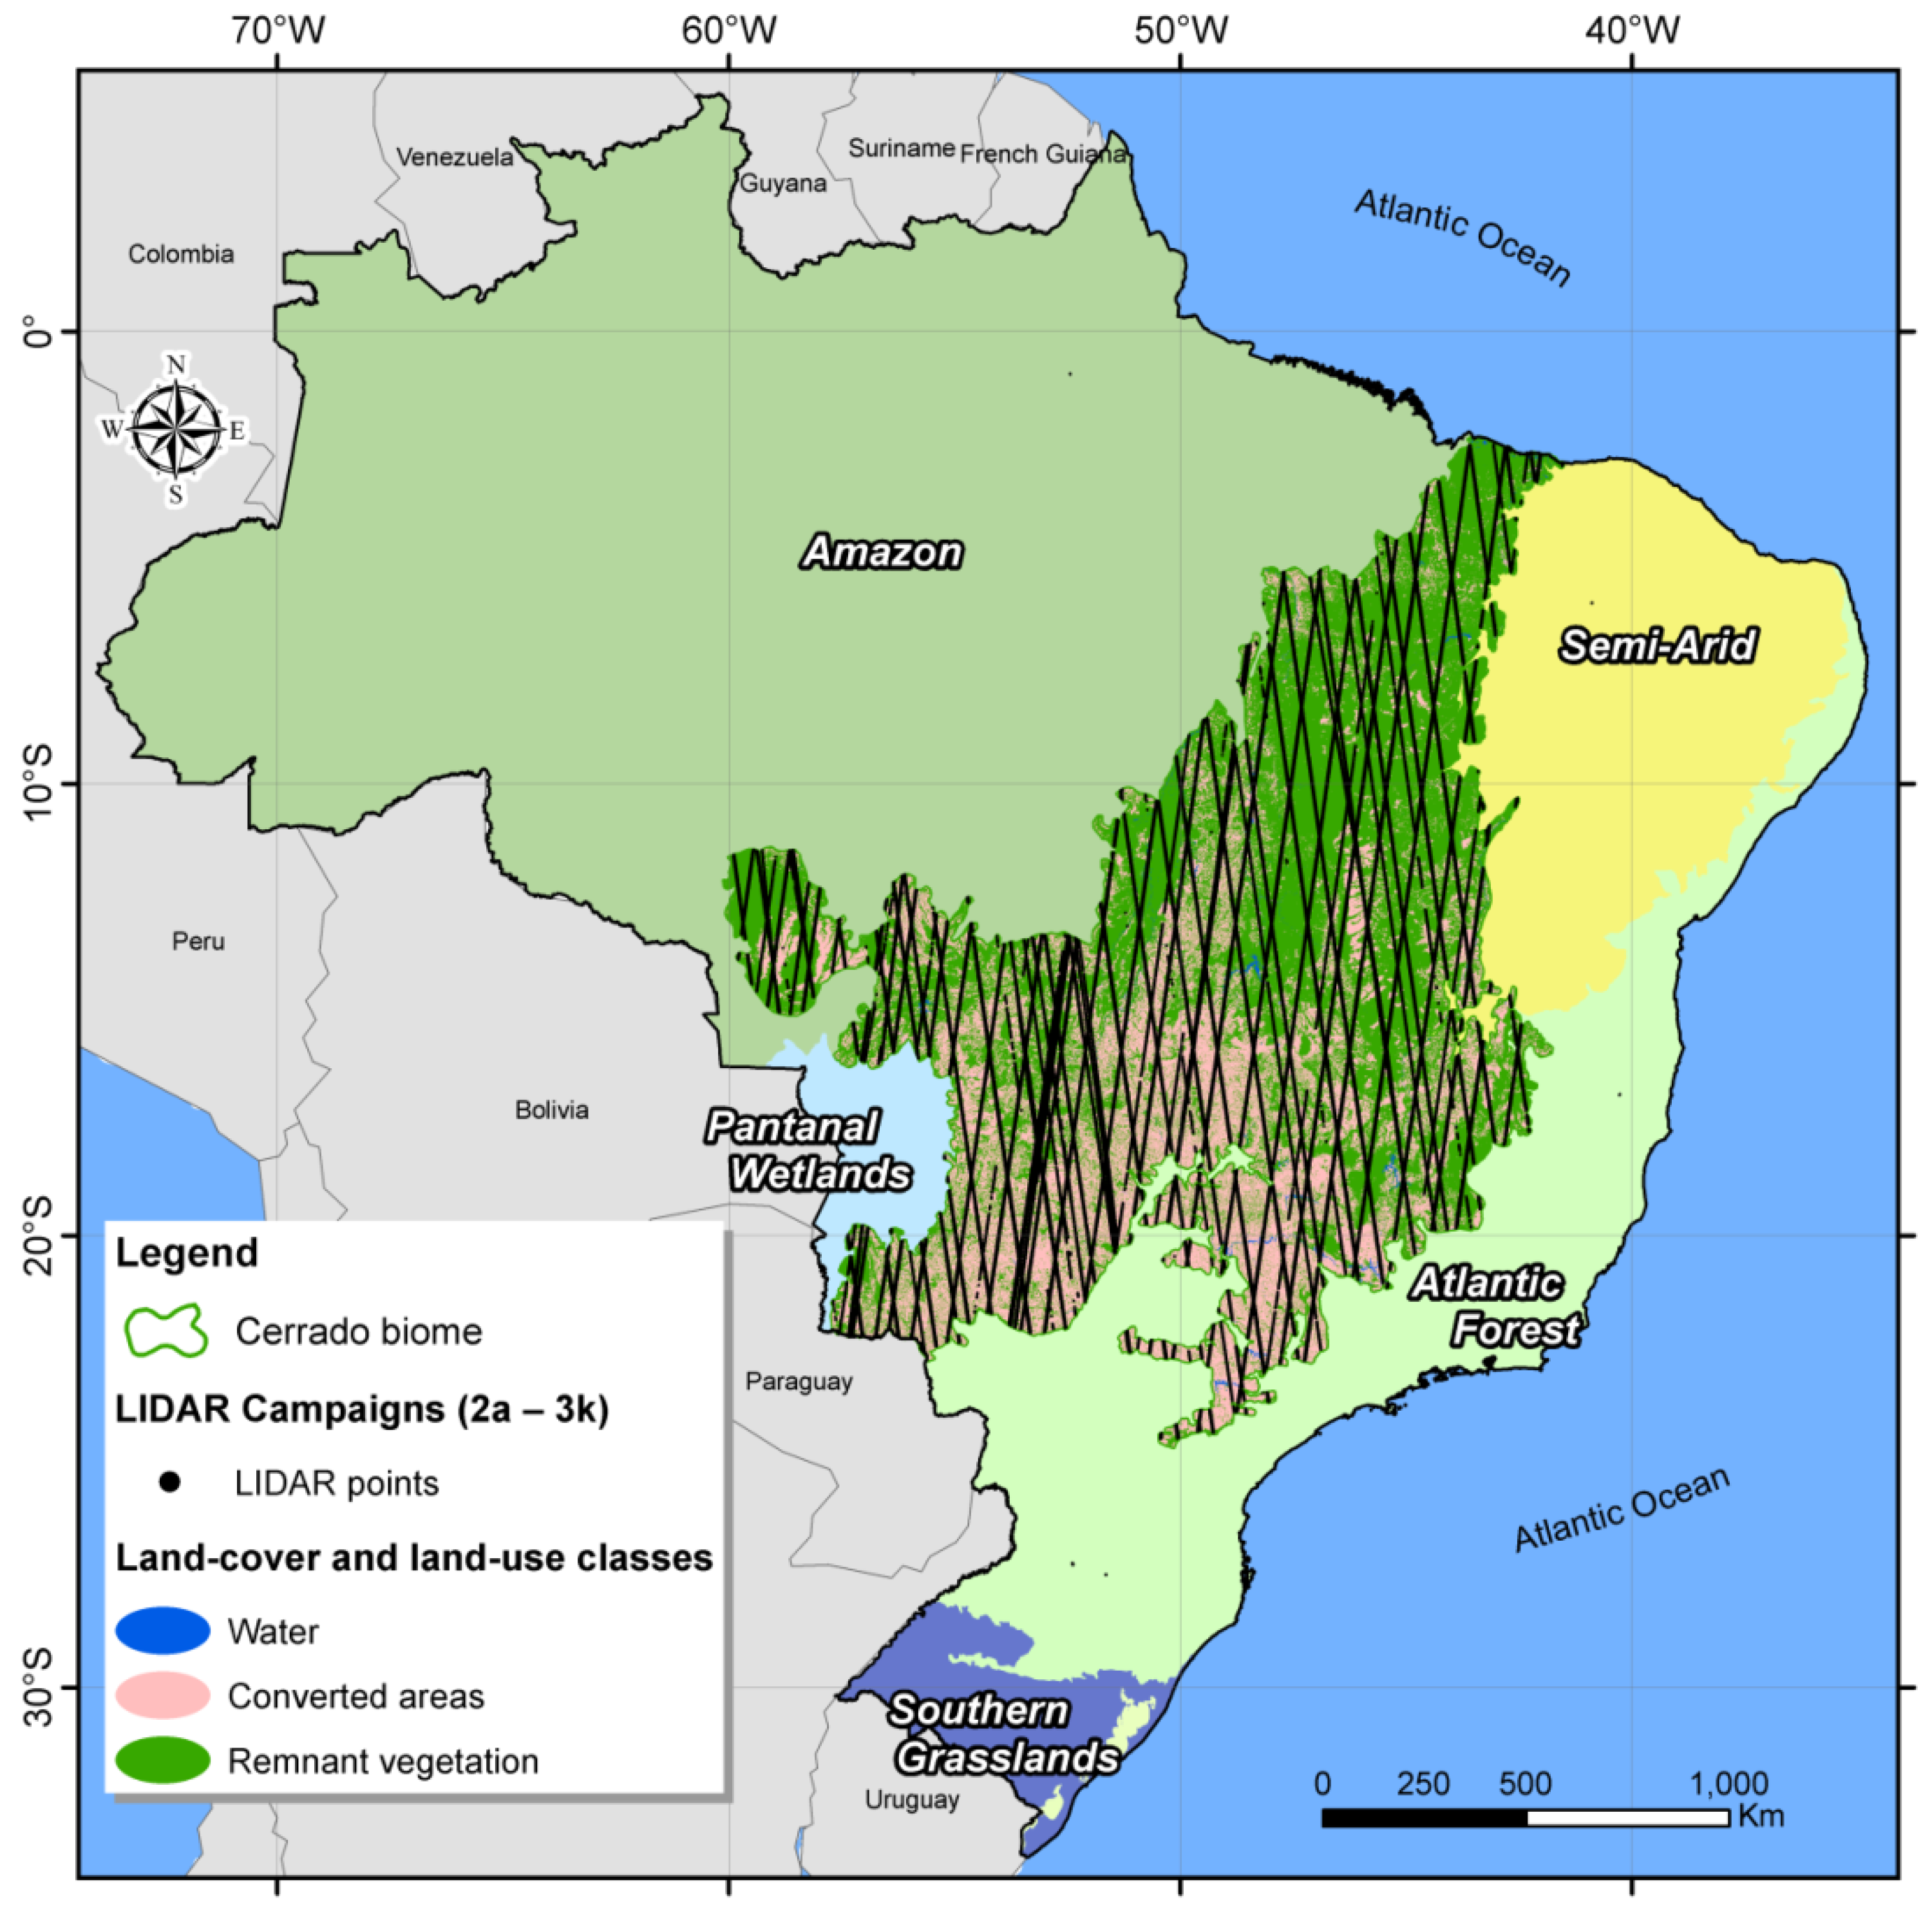
During the entire ICESat GLAS lifespan (2003–2009), approximately 2.5 million laser returns were acquired over the Cerrado biome (
Figure 2), distributed between 17 campaigns, whose duration, time of the year covered, and quantity of data collected are shown in
Table 1. Our analysis did not include the brief period of operation of laser 1 (02-20-2003 to 03-21-2003 and 03-21-2003 to 03-29-2003), nor the laser 2 acquisitions at the 8-day repeat orbit (09-25-2003 to 10-04-2003). In general, each campaign lasted for about 33 days, exceptions being campaign 2a, the longest one, and the shorter than expected campaigns 3k and 2f, which acquired data for only 15 and 11 days, due to failures and termination of lasers 3 and 2, respectively.
Figure 2.
GLAS LIDAR data points over the Cerrado biome (shown relative to other major Brazilian biomes), as obtained from the 17 (91-day repeat orbit) campaigns (2003–2009) along 70 tracks.
Figure 2.
GLAS LIDAR data points over the Cerrado biome (shown relative to other major Brazilian biomes), as obtained from the 17 (91-day repeat orbit) campaigns (2003–2009) along 70 tracks.
Table 1.
Time and duration of each GLAS LIDAR campaign and respective amount of data acquired over the Cerrado biome.
Table 1.
Time and duration of each GLAS LIDAR campaign and respective amount of data acquired over the Cerrado biome.
![Remotesensing 03 02187 i001]() |
The proportion of good data,
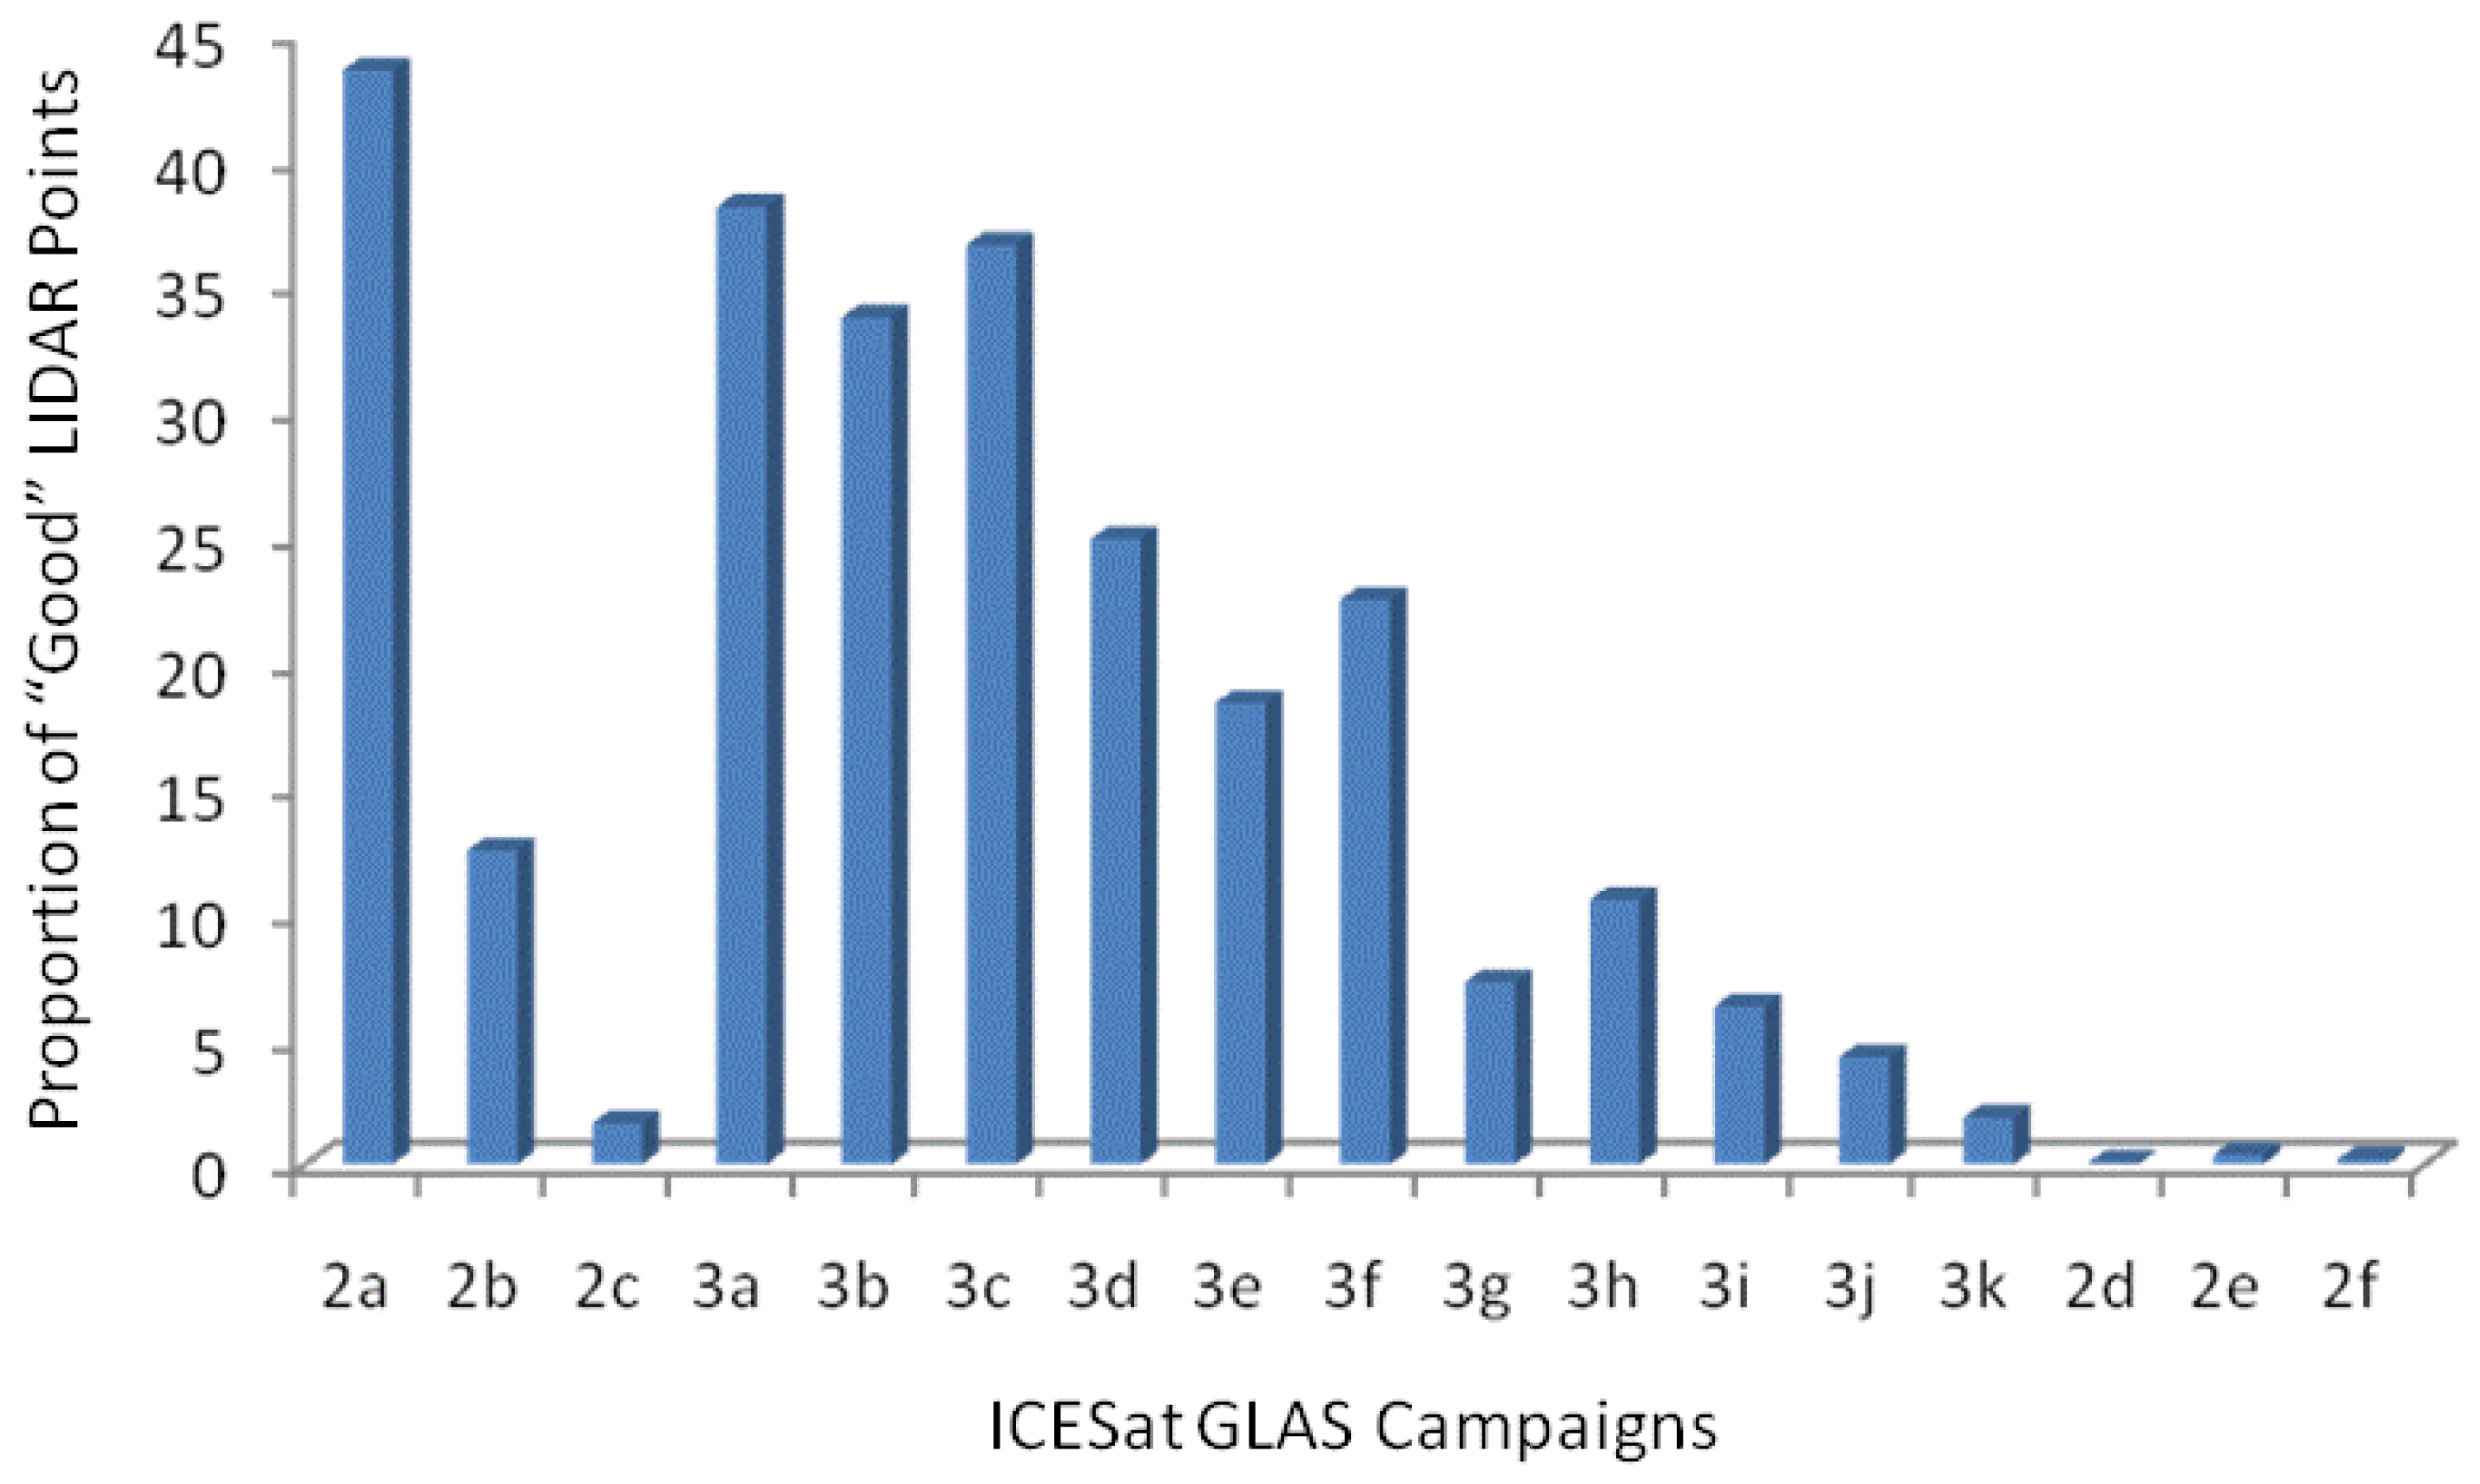
i.e., returns with gain values smaller or equal to 30 (a threshold value above which data can be cloud contaminated and higher gain values, up to 255, are needed to boost the weak signal) for each campaign is shown in
Figure 3. In relation to laser 2, the amount of good data available drops dramatically from campaign 2a (43%) to campaigns 2b (12%) and 2c (2%), while only few good data points were acquired after the laser 2 revival in late 2008,
i.e., during campaigns 2d (0.1%), 2e (0.4%), and 2f (0.2%). Regarding laser 3, the proportion of good data can be grouped into three main domains, varying from 38 to 34% (campaigns 3a, 3b, and 3c), from 25 to 18% (campaigns 3d, 3e, and 3f), and from 11 to 2% (campaigns 3g, 3h, 3i, 3j, and 3k), which are consistent with its diminishing power over time (
i.e., October 2004 to June 2005, October 2005 to June 2006, and October 2006 to October 2008).
Figure 3.
Proportion of good data (i.e., gain values ≤ 30) acquired over the Cerrado biome during the GLAS 17 campaigns (90-day repeat orbit).
Figure 3.
Proportion of good data (i.e., gain values ≤ 30) acquired over the Cerrado biome during the GLAS 17 campaigns (90-day repeat orbit).
It is interesting to observe that the differences in elevation between the GLAS06 and the SRTM data (track 1349) (
Table 2) also tend to accompany the variations shown in
Figure 3,
i.e., higher differences seem to be more prevalent with the low energy campaigns. In fact, comparative to the campaign 2a, whose mean LIDAR–SRTM difference is 14.75 m, the campaign 2e transmitted energy is, on average, 14 times lower, which may explain its much higher elevation difference in relation to the SRTM data (26.97 m). Although these differences are primarily related to the way each elevation data is derived, as indicated by their high latitude dependence, variations in the correlation values also indicate the role played by the data quality itself and other extrinsic factors, such as seasonality. Overall, the similar magnitude of the LIDAR–SRTM differences corroborates the usefulness, although at different confidence intervals, of the screened data from the 17 GLAS campaigns. Likewise, the analysis of additional GLAS06 quality flags over ICESat track 1349 also suggests that data screening based on the elevation flag (
i.e., selection of data with gain values ≤ 30) eliminates large off nadir and saturated LIDAR returns (
i.e., use of a gain value lower or higher than required, due to the influence of contrasting adjacent returns) as well.
Table 2.
Differences between elevation retrievals from GLAS LIDAR and SRTM data.
Table 2.
Differences between elevation retrievals from GLAS LIDAR and SRTM data.
| LIDAR–SRTM Differences |
|---|
| Campaigns | Differences − Latitude (r) | # LIDAR Points | Mean Values | CV |
|---|
| 2a | −0.60 | 1,817.00 | −14.75 | 0.42 |
| 2b | |
| 2c | −0.56 | 307.00 | −17.18 | 0.27 |
| 3a | −0.63 | 1,996.00 | −13.42 | 0.48 |
| 3b | −0.85 | 2,338.00 | −15.80 | 0.48 |
| 3c | −0.80 | 1,144.00 | −19.26 | 0.36 |
| 3d | −0.64 | 1,827.00 | −16.55 | 0.33 |
| 3e | −0.79 | 350.00 | −16.57 | 0.46 |
| 3f | −0.78 | 1,225.00 | −14.87 | 0.44 |
| 3g | −0.59 | 396.00 | −11.52 | 0.34 |
| 3h | −0.71 | 297.00 | −15.43 | 0.30 |
| 3i | −0.44 | 597.00 | −16.25 | 0.29 |
| 3j | −0.24 | 448.00 | −17.78 | 0.30 |
| 3k | −0.72 | 173.00 | −18.58 | 0.24 |
| 2d | |
| 2e | −0.78 | 43.00 | −26.97 | 0.19 |
| 2f | |
The ICESat GLAS screened data, grouped according to the major Cerrado seasonal domains, is shown in
Table 3. Overall, about 500,000 good LIDAR returns are available, from which 29.7% were acquired during the Cerrado dry season, while 46.9 and 23.5% were acquired during the early and late stages of the wet season, respectively.
Table 3.
Distribution of good LIDAR points (i.e., gain value ≤ 30) according to the 17 GLAS campaigns (91-day repeat orbit) and major Cerrado seasonal domains.
Table 3.
Distribution of good LIDAR points (i.e., gain value ≤ 30) according to the 17 GLAS campaigns (91-day repeat orbit) and major Cerrado seasonal domains.
| | Campaigns | Shots | % Total Good Data | % Total Data |
|---|
| Dry Season | 2c | 3,131 | 29.7 | 1.6 |
| 3c | 86,529 | 36.6 |
| 3f | 57,046 | 22.5 |
| Early Wet Season | 2a | 93,488 | 46.9 | 43.5 |
| 2d | 41 | 0.1 |
| 2f | 47 | 0.2 |
| 3a | 69,814 | 38.1 |
| 3d | 43,597 | 24.9 |
| 3g | 10,700 | 7.2 |
| 3i | 12,483 | 6.3 |
| 3k | 1,832 | 1.9 |
| Late Wet Season | 2b | 17,609 | 23.5 | 12.5 |
| 2e | 273 | 0.4 |
| 3b | 46,943 | 33.7 |
| 3e | 25,845 | 18.4 |
| 3h | 20,688 | 10.5 |
| 3j | 4,681 | 4.2 |
| % Total “Good” Shots | | 100% | |
Concerning the major Cerrado land cover types,
i.e., the remnant natural vegetation and the cultivated pastures, a total of 206,026 and 176,035 data points are available, respectively, mostly acquired during the early wet season (50.5% and 45.1%), followed by acquisitions in the dry season (28.1% and 30.7%) and late wet season (21.4% and 24.2%). It is interesting to note that, as opposed to sun-synchronous passive orbital sensors, whose data quality is strongly coupled to the Cerrado seasonality [
58], LIDAR data, although subject to severe availability issues, can be obtained at key seasonal phenological stages (
Figure 5).
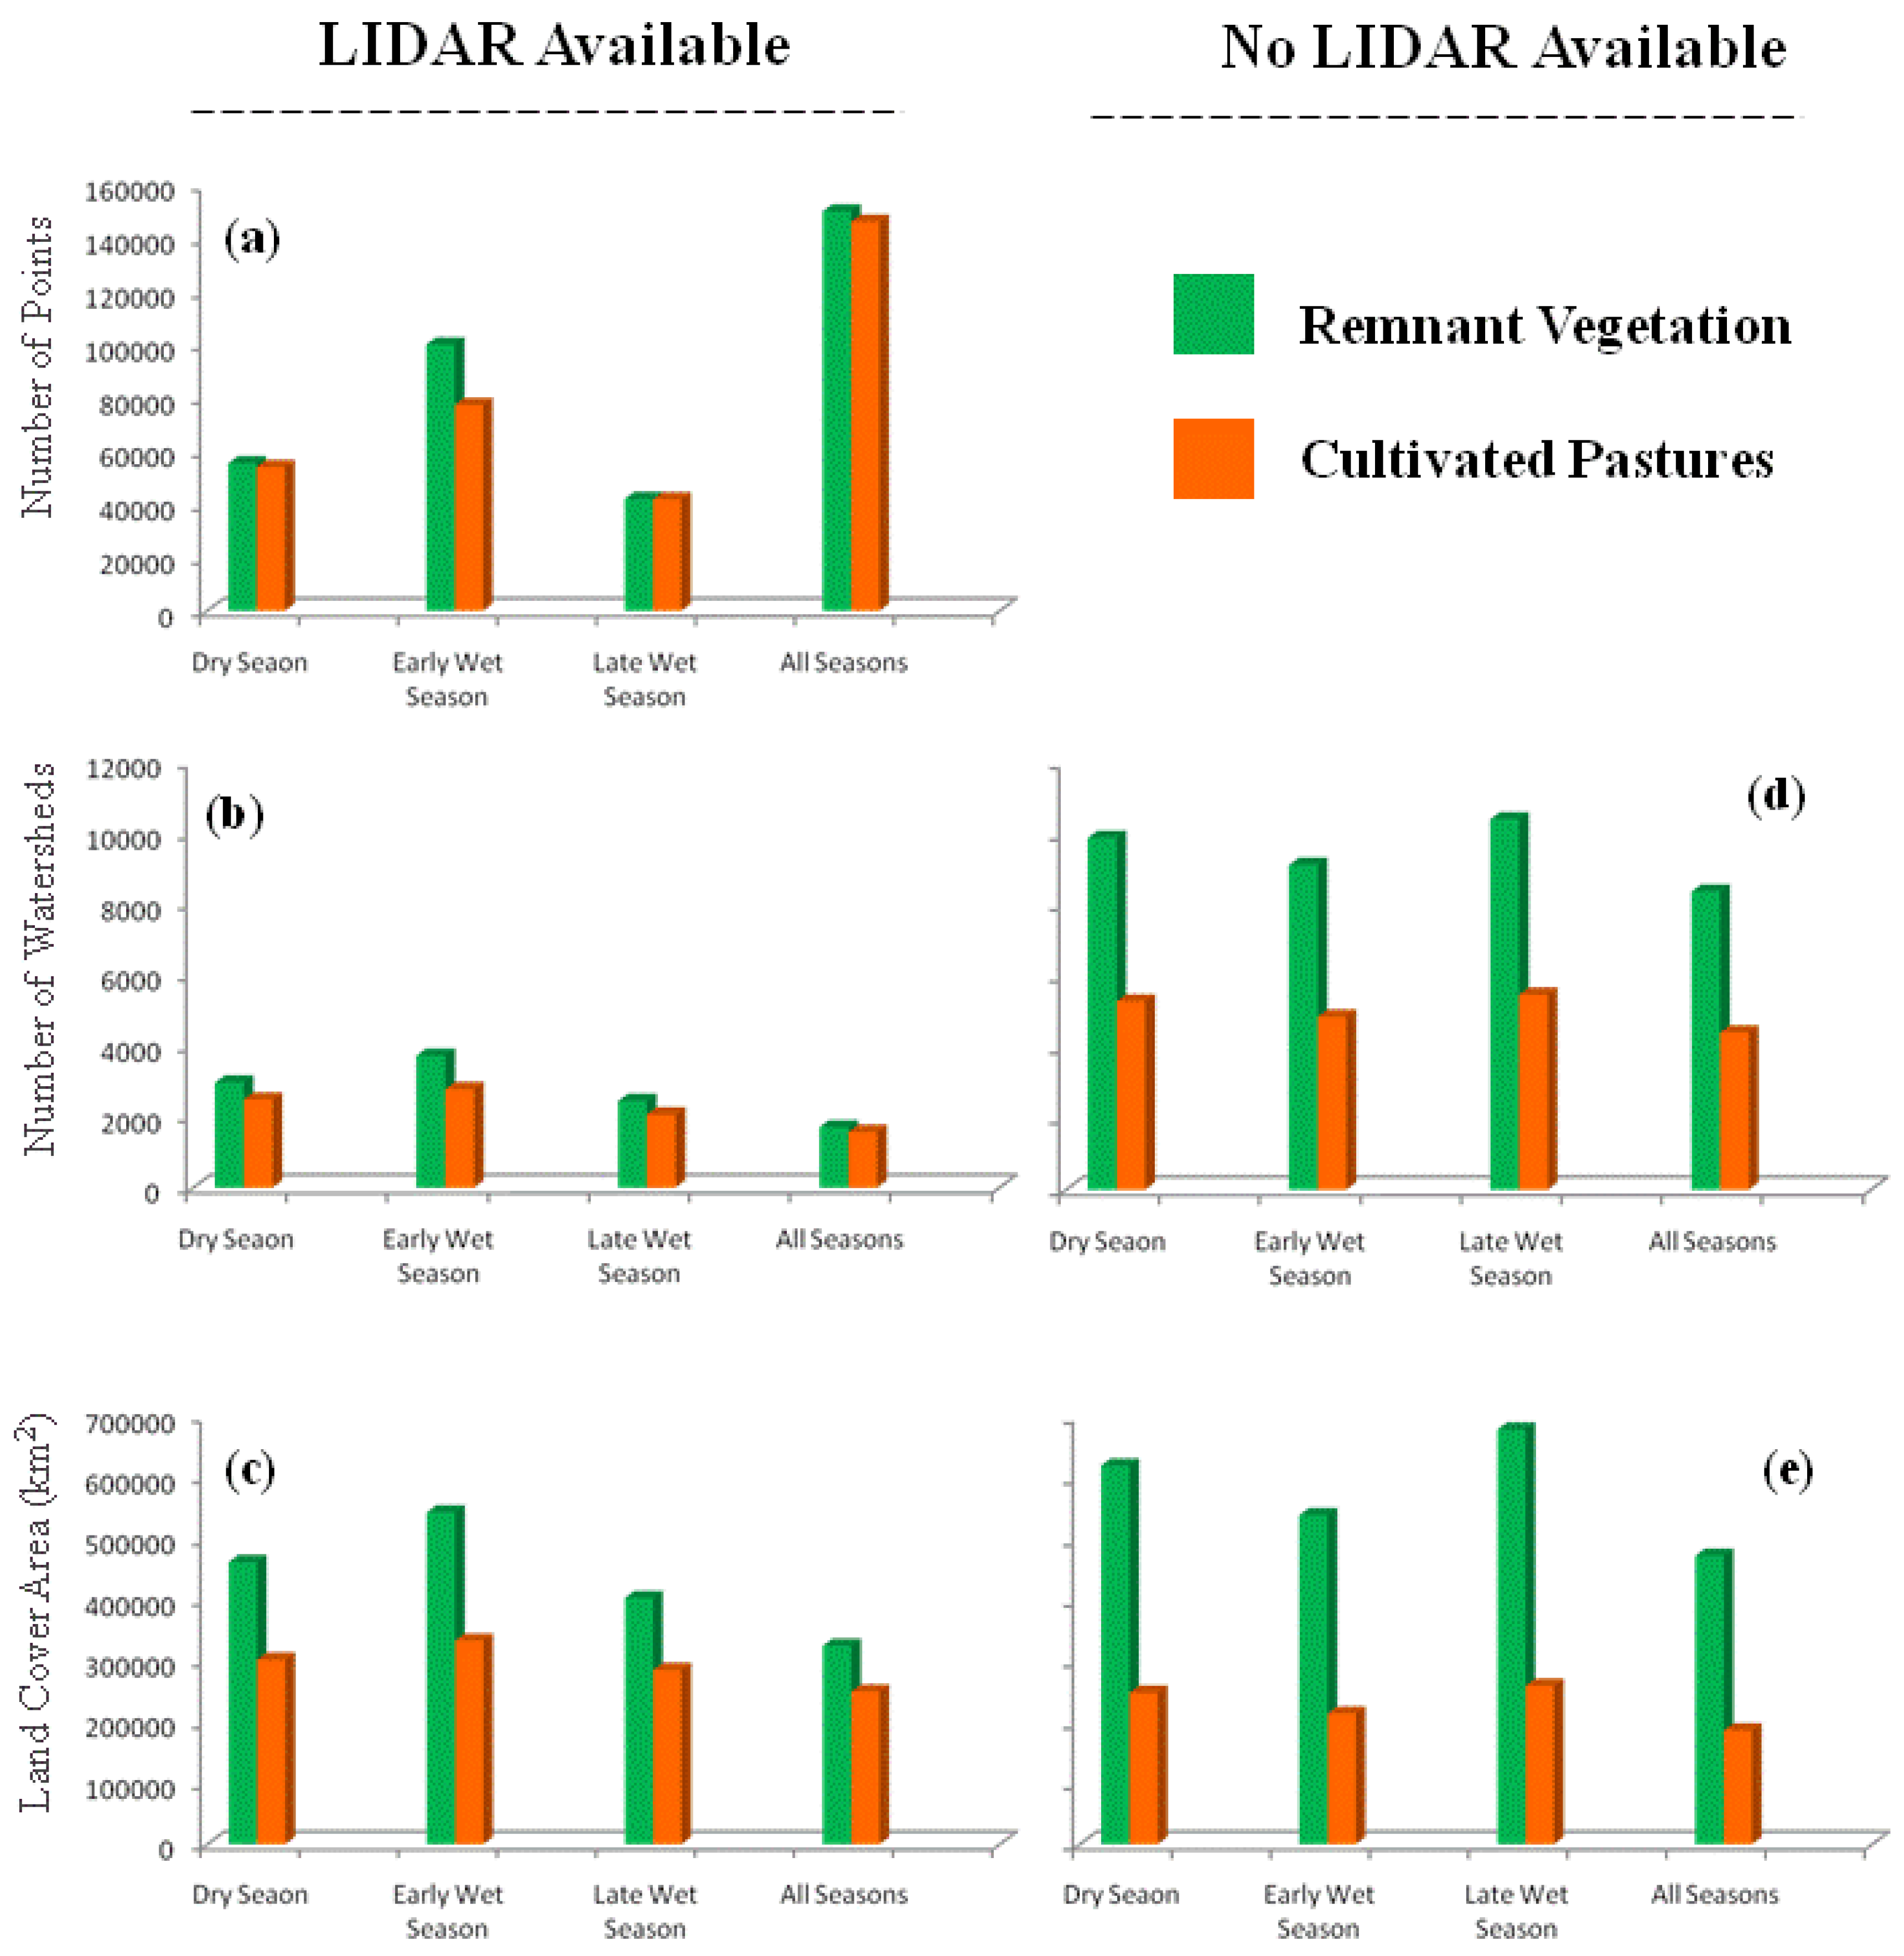
At the watershed level, and considering only those watersheds for which either the remnant vegetation or cultivated pastures comprise at least 20% of the total land cover, a similar distribution pattern is observed regarding the number of LIDAR points, as well as the number of watersheds containing these observations and the respective land cover area they comprise (
Figure 4(a–c)). As the Cerrado area covered with natural vegetation is significantly larger and more widespread, more data points, comparatively to those over the pasture sites, are observed. Such differences, however, seem to be less important at those watersheds coincidentally containing data points from all the three main acquisition periods considered (
i.e., 150,421 and 146,553 LIDAR points over the natural vegetation and cultivated pastures, respectively). Although these “coincident” watersheds are fewer in number (1,697 and 1,564) and comprise smaller amounts of remnant vegetation and cultivated pastures (325,065 and 250,132 km
2), they encompass 73% and 83% of all acquisitions over the natural vegetation and cultivated pastures.
Regarding the watersheds without LIDAR acquisitions over their respective remnant vegetation or pasture covers, these are found in much larger number for both land cover types and at any given period (
Figure 4(d)). Interestingly, while the proportion of remnant vegetation located at those watersheds without LIDAR observations is always higher, the total pasture area at such watersheds is slightly smaller, compared to the pasture area encountered within watersheds with LIDAR acquisitions (
Figure 4(e)). Overall, 472,739 and 186,350 km
2 of remnant vegetation and cultivated pastures, distributed over 8,369 and 4,415 watersheds, respectively, are completely deprived of LIDAR points.
Figure 4.
(a) Amount of LIDAR points over the Cerrado remnant vegetation and cultivated pastures, according to major seasonal periods and coincident occurrences, at the watershed level; (b) number of watersheds with LIDAR points, according to each major seasonal period and coincident occurrences; (c) total area of remnant vegetation or pasture within watersheds with respective LIDAR occurrences; (d) number of watersheds without LIDAR occurrences over remnant vegetation or pastures, according to major seasonal periods; (e) total area of remnant vegetation or pasture within watersheds without LIDAR occurrences at specific seasonal periods or completely deprived of laser shots.
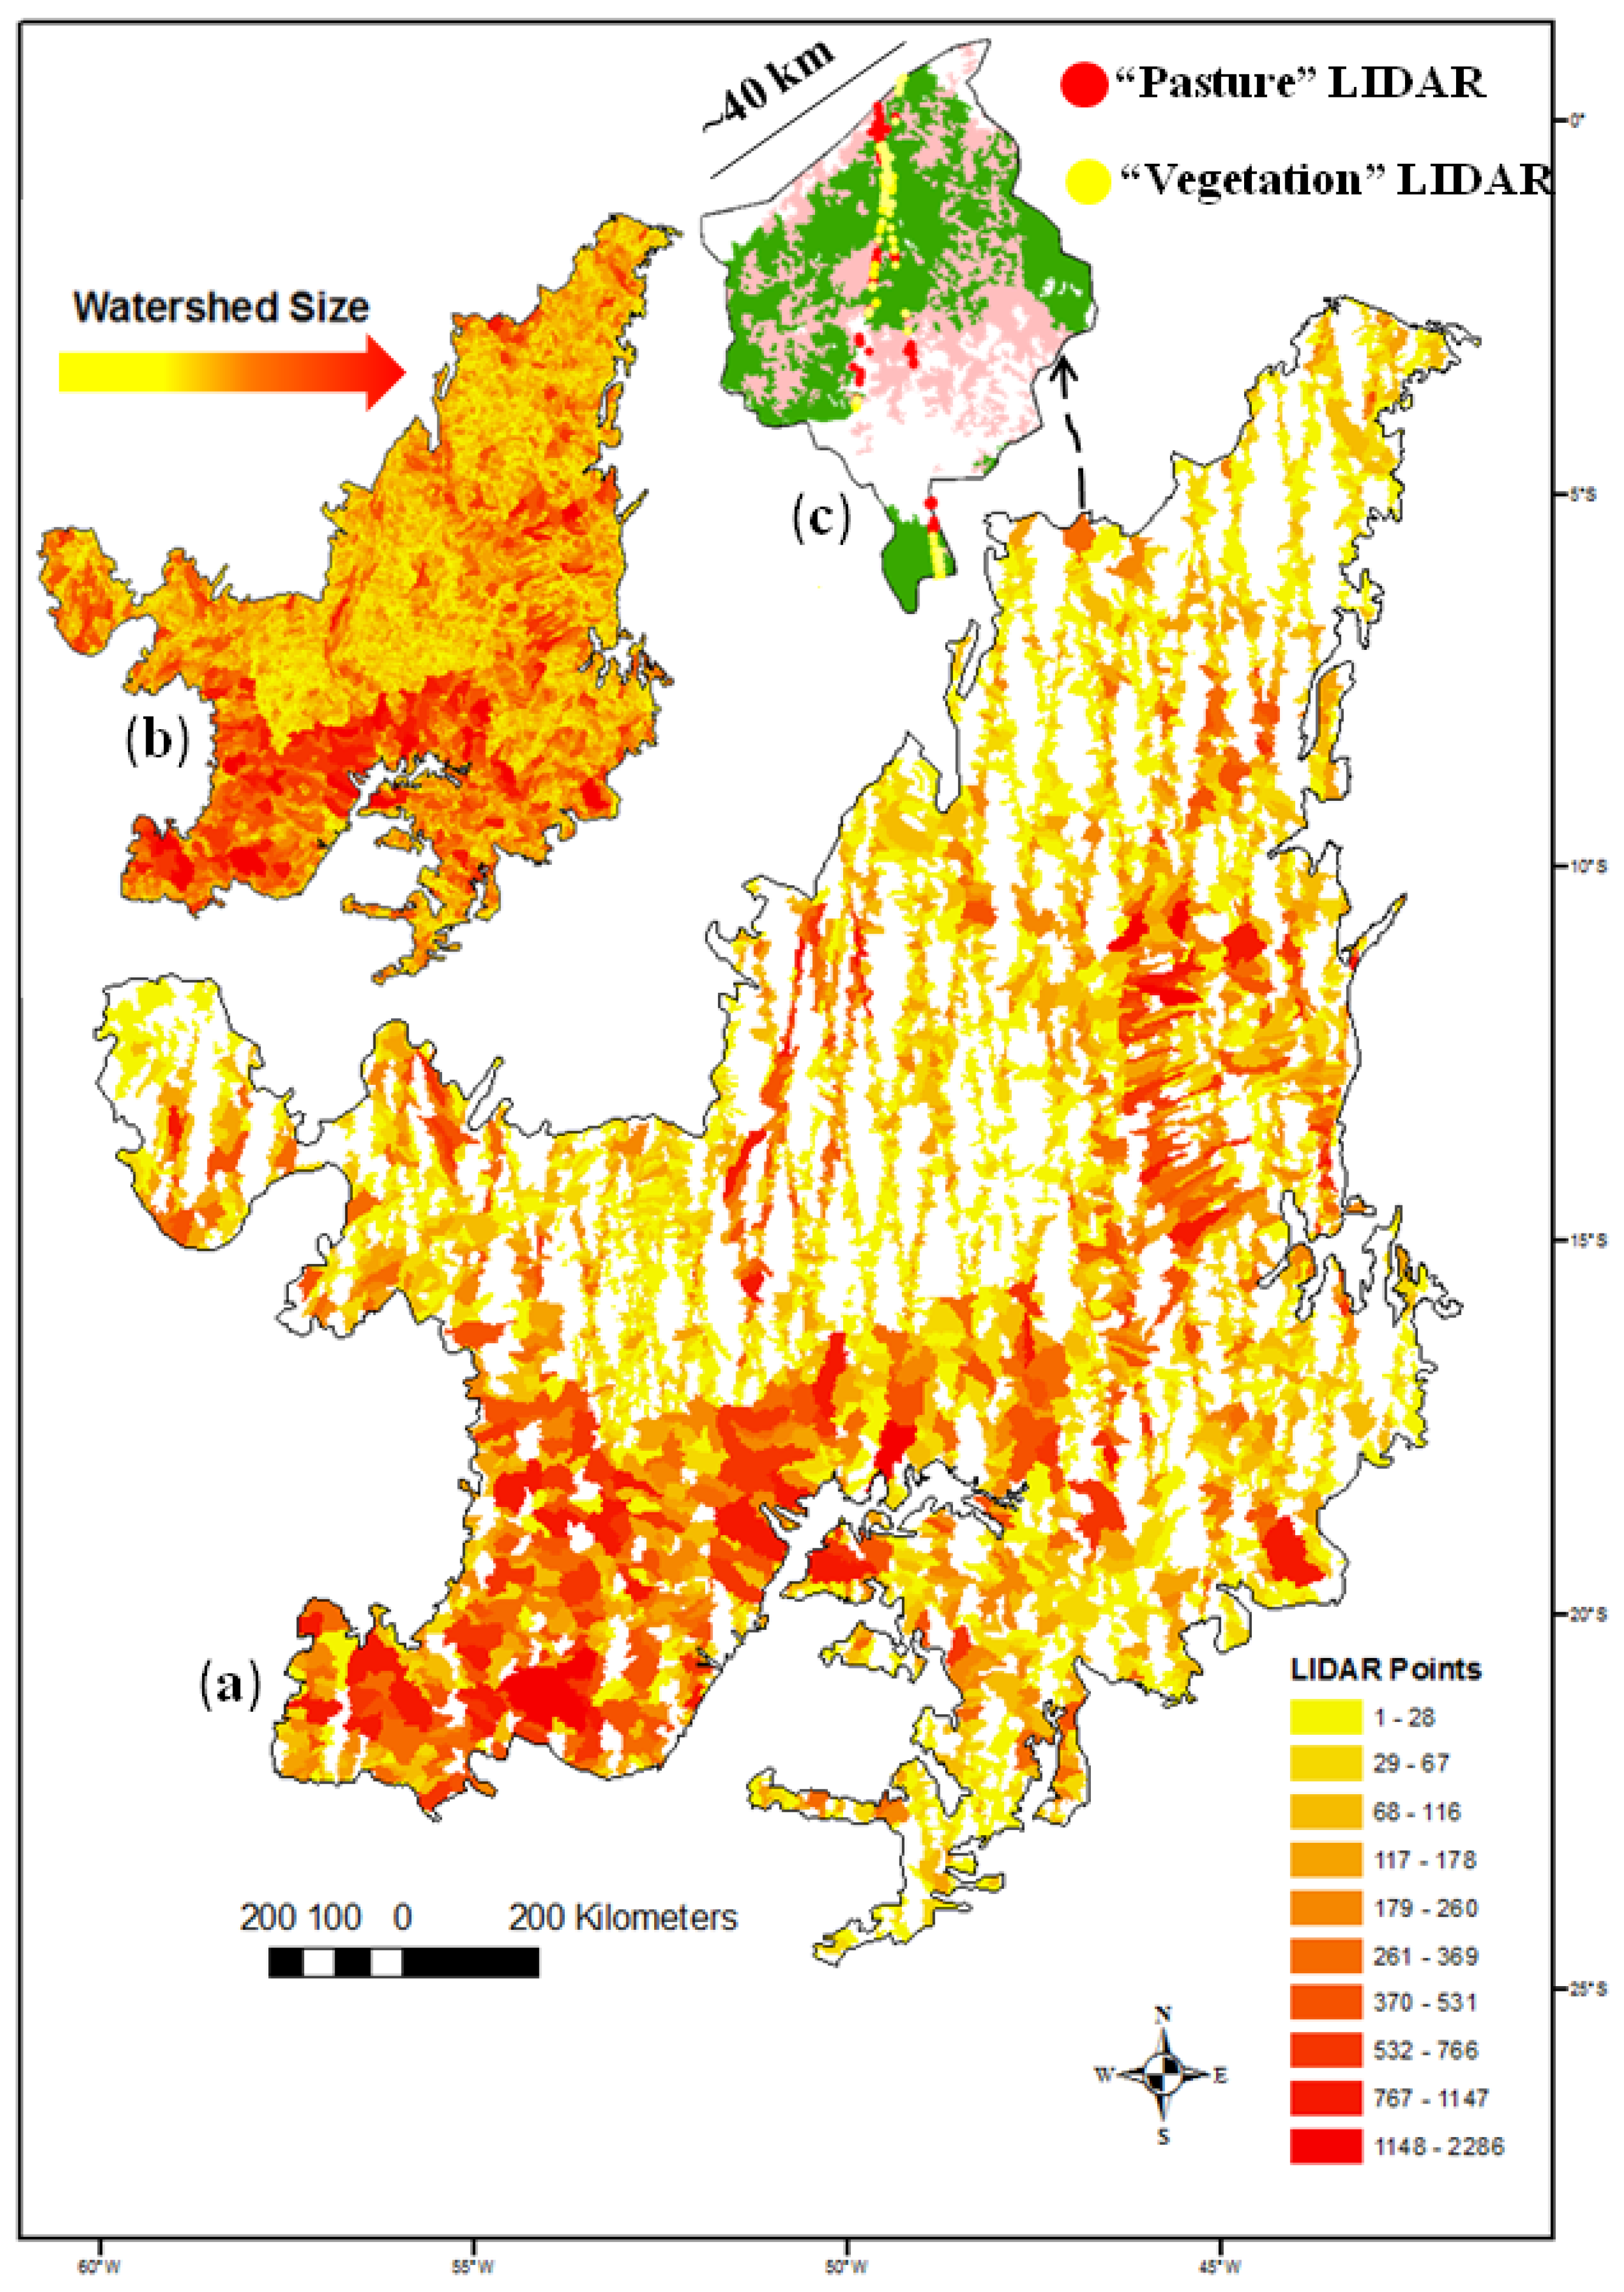
The incomplete spatial coverage of the orbital LIDAR points is clearly depicted at both the watershed level as well as within any given watershed, in which most of the surface of interest is beyond the reach of the transect collected laser footprints (
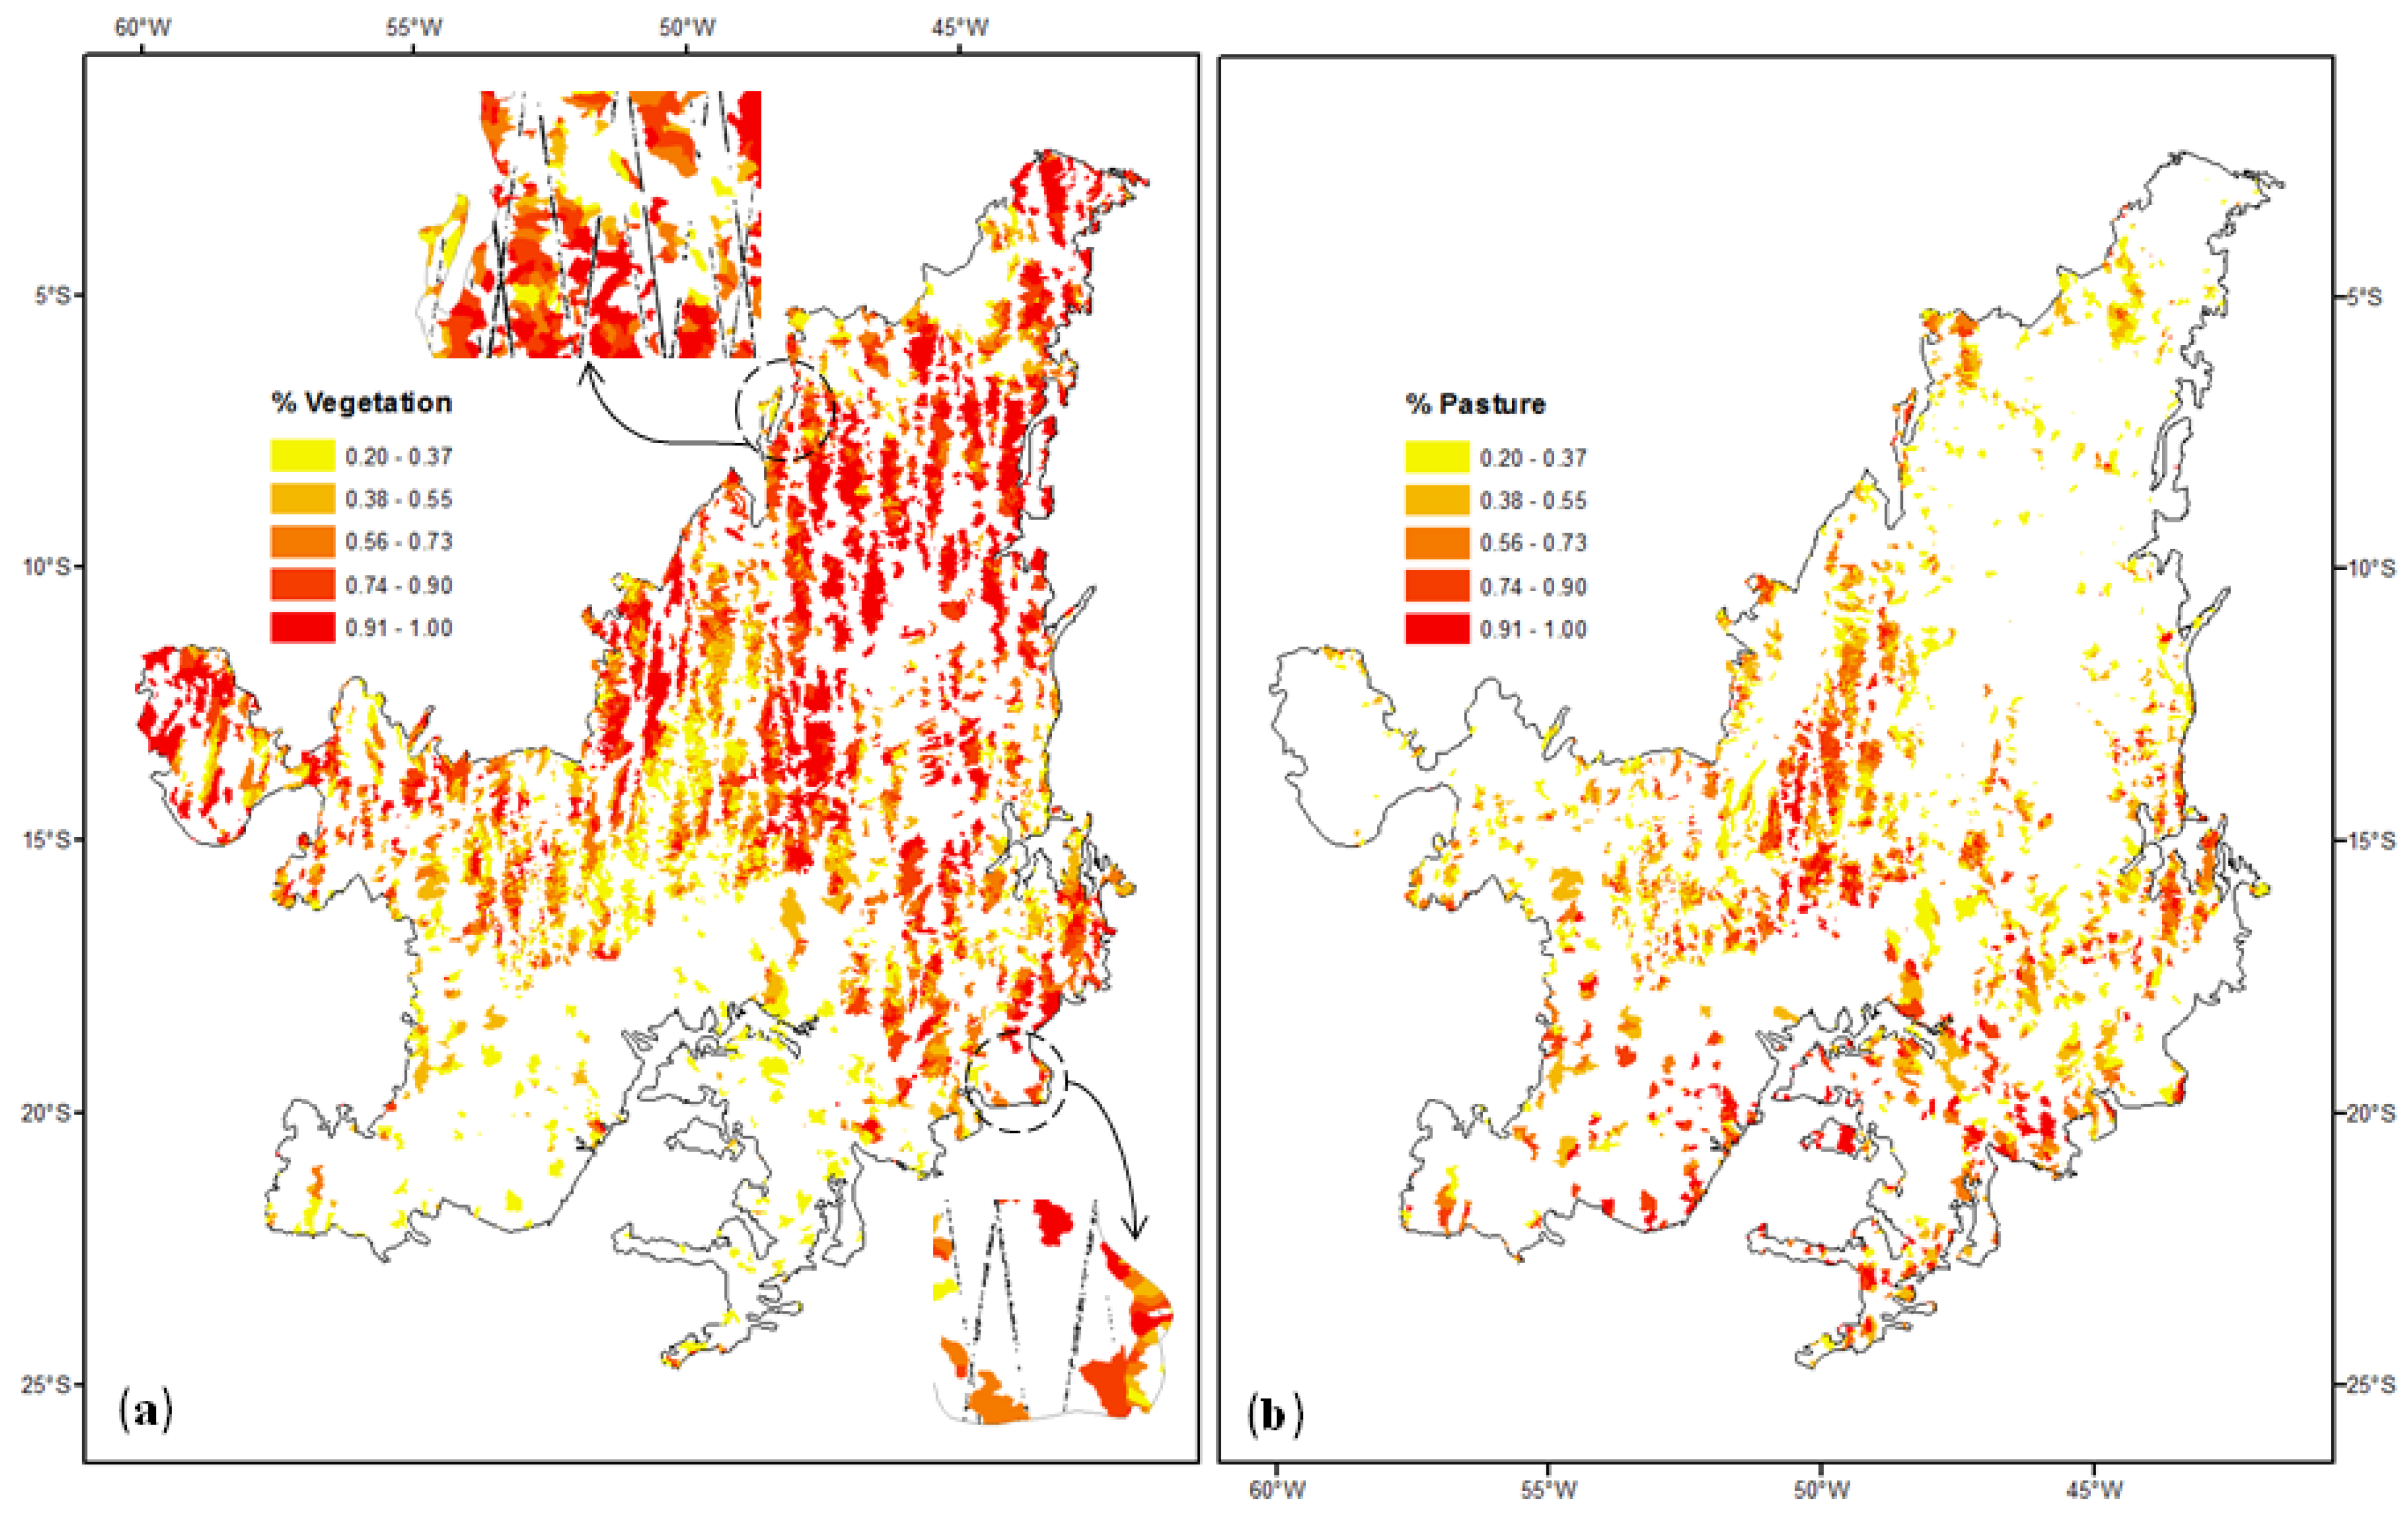
Figure 5). As the number of acquired LIDAR points (over both remnant vegetation and pasture) tend to increase with watershed size (r = 0.61), data gaps are most prominent in the northern portions of the biome, dominated by smaller watersheds over hilly terrains. Concerning the remnant vegetation areas, data gaps, well delineated by the GLAS overpasses, are widespread over the regional Araguaia and Sao Francisco basins and particularly evident over the well preserved northeastern portion of the biome (
Figure 6(a)). As for the pastures, although data gaps are widely spread over the entire biome, these tend to be concentrated over the Araguaia basin, well known for its large pasture areas and important cattle herds (
Figure 6(b)).
Figure 5.
(a) 5,972 watersheds with at least one LIDAR occurrence; (b) size distribution of the Cerrado watersheds (6th level Ottobasins); and (c) LIDAR occurrences over remnant vegetation and cultivated pastures within a single watershed.
Figure 5.
(a) 5,972 watersheds with at least one LIDAR occurrence; (b) size distribution of the Cerrado watersheds (6th level Ottobasins); and (c) LIDAR occurrences over remnant vegetation and cultivated pastures within a single watershed.
Figure 6.
(a) 8,369 watersheds completely deprived of LIDAR points over their remnant vegetation fraction (>20%) (the two insets highlight the GLAS transects); (b) 4,415 watersheds lacking LIDAR points over their pasture areas (>20%).
Figure 6.
(a) 8,369 watersheds completely deprived of LIDAR points over their remnant vegetation fraction (>20%) (the two insets highlight the GLAS transects); (b) 4,415 watersheds lacking LIDAR points over their pasture areas (>20%).
In reality, effective data availability can be even further compromised due to seasonality, which creates three major and distinct data clusters, each one likely to yield unique responses over similar targets. Such concern is particularly important for the derivation of regional biophysical estimations, for which each single data point is needed for creating denser and more accurate representations of the landscape. Nevertheless, if properly accounted for, different observations are always useful for the determination and validation of biophysical properties. Likewise, as the Cerrado phenology significantly varies among its physiognomies, as well as within each class, seasonal data can be instrumental for understanding the spatial variability and distribution of biophysical properties, particularly those volumetric in nature, such as biomass.
In relation to the regions of interest, and particularly concerning areas with remnant vegetation, from the 130 fully-protected conservation units in the Cerrado, while no single laser shot was acquired, over 87 of them, 22 parks and research stations have been subject to multi-seasonal LIDAR acquisitions, which yielded a total of 4,697, 6,087, and 3,922 coincident data points from the dry, early, and late wet seasons, respectively (
Table 4). It is worth mentioning that, despite the rather restricted availability of LIDAR points, their repetitive acquisitions and the wide distribution of the 22 fully-protected conservation units over a variety of Cerrado ecosystems enables consistent LIDAR-based assessments of distinct and representative vegetation structures and biomass coupled to seasonality and other environmental constraints.
Table 4.
22 fully-protected Cerrado conservation units with coincident LIDAR occurrences from all major Cerrado seasonal periods (the inset figure details the LIDAR points from the dry season, early wet season, and late wet season over the Serra da Bocaina wildlife refuge).
Table 4.
22 fully-protected Cerrado conservation units with coincident LIDAR occurrences from all major Cerrado seasonal periods (the inset figure details the LIDAR points from the dry season, early wet season, and late wet season over the Serra da Bocaina wildlife refuge).
| Protected Areas | LIDAR Points |
|---|
| Name | State | Latitudes | Longitudes | Area (km2) | Dry | Early Wet | Late Wet |
|---|
| Veredas do Oeste Baiano Wildlife Refuge | BA | −14.061 | −45.289 | 1,280.49 | 31 | 250 | 88 |
| Águas Emendadas Ecol. Station | DF | −15.562 | −47.613 | 91.81 | 42 | 27 | 29 |
| Paraúna State Park | GO | −16.984 | −50.657 | 33.35 | 10 | 6 | 10 |
| Serra da Bocaina Wildlife Refuge | GO | −14.165 | −49.903 | 156.57 | 19 | 12 | 9 |
| Chapada das Mesas Nat. Park | MA | −7.152 | −47.145 | 1,599.52 | 142 | 60 | 59 |
| Lençóis Maranhenses Nat. Park | MA | −2.556 | −43.049 | 1,566.06 | 83 | 209 | 88 |
| Mirador State Park | MA | −6.584 | −45.282 | 4,464.47 | 477 | 578 | 46 |
| Serra da Canastra Nat. Park | MG | −20.331 | −46.585 | 1,978.11 | 4 | 33 | 6 |
| Serra Azul Biosphere Reserve | MG | −15.294 | −43.913 | 74.07 | 16 | 35 | 9 |
| Veredas do Peruaçú State Park | MG | −15.017 | −44.623 | 314.20 | 70 | 44 | 52 |
| Lapa Grande State Park | MG | −16.725 | −43.964 | 95.20 | 3 | 32 | 9 |
| Maracajú Nat. Monument | MS | −21.278 | −55.719 | 661.30 | 86 | 54 | 71 |
| Serra de Maracajú - Corguinho Nat. Mon. | MS | −19.704 | −55.279 | 365.95 | 21 | 80 | 2 |
| Iquê Ecol. Station | MT | −12.063 | −59.301 | 2,240.18 | 6 | 54 | 2 |
| Chapada dos Guimarães Nat. Park | MT | −15.324 | −55.882 | 326.56 | 26 | 70 | 5 |
| Araguaia State Park | MT | −12.280 | −50.785 | 2,258.53 | 956 | 963 | 1,274 |
| Uruçuí-Una Ecol. Station | PI | −8.869 | −45.199 | 1,386.81 | 44 | 373 | 139 |
| Nascentes do Rio Parnaíba Nat. Park | PI-MA-TO | −10.004 | −45.945 | 7,301.88 | 1,159 | 1,882 | 553 |
| Jalapão State Park | TO | −10.377 | −46.689 | 1,589.73 | 249 | 7 | 107 |
| Araguaia Nat. Park | TO | −10.554 | −50.170 | 5,665.91 | 74 | 438 | 158 |
| Cantão State Park | TO | −9.644 | −50.069 | 900.20 | 28 | 20 | 146 |
| Serra Geral do Tocantins Ecol. Station | TO-BA | −10.856 | −46.691 | 7,183.90 | 1,151 | 860 | 1,060 |
| | Totals | | | |
| | % (130 Protected Areas) | 99.1 | 86.5 | 98.2 |
![Remotesensing 03 02187 i002]() |
Matching transect-based LIDAR points with specific ground targets is also a challenge regarding the relatively small disturbed areas. As for the 2006–2007 deforestation, from the 3,225 polygons mapped (encompassing an area of approximately 3,510 km
2), only 16 polygons show coincident 3c and 3f GLAS campaign acquisitions,
i.e., likely encompassing the landscape immediately before and after deforestation occurred (
Table 5). In relation to the 2007 burnt scars over the remnant vegetation, the GLAS LIDAR data was evaluated according to three distinct before-after groups: (1) before (2002_2a, 2004_3a, 2005_3d, and 2006_3g) and after (2008_3k, 2008_2d, and 2009_2f) using
early wet-season data, (2) before (2004_2b, 2005_3b, and 2006_3e) and after (2008_3j and 2009_2e) using
late wet-season data, and (3)
during the 2007 fire season,
i.e., immediately before (2007_3h) and after (2007_3i) the fire season (considering that about 85% and 15% of the 2007 fires took place between May and September and in the first half of October, respectively). From the 26,601 burnt scar polygons extracted from the MCD45A1 product (considering only the most confidently detected pixels), amounting to an area of approximately 109,260 km
2, only 64 polygons (~ 17,436 km
2) met the above before-after criteria (
Table 6). Over both the deforested and burned polygons, it is interesting to observe the prevalence of “before” laser shots, which is in agreement with the higher proportion of good data in the earlier GLAS campaigns. Nevertheless, and in spite of the overall small data availability, the wide distribution of deforestation and burnings sites corroborates the possibility of using the LIDAR waveforms to assess the extent of changes and how these impact the structure and biomass content of a variety of Cerrado physiognomies. Particularly concerning the burnt scars, multi-temporal availability, encompassing four years and two years worth of data before and after the burnings, can also be instrumental in assessing the trajectories of recovery of some of the impacted areas.
Table 5.
Deforestation polygons with “coincident” LIDAR acquisitions from the 3c and 3f GLAS campaigns (the inset gives a detailed look at one of these deforestation polygons).
Table 5.
Deforestation polygons with “coincident” LIDAR acquisitions from the 3c and 3f GLAS campaigns (the inset gives a detailed look at one of these deforestation polygons).
| Deforestation Polygons | LIDAR Points |
|---|
| # | Area (km2) | Year | Campaign | Year | Campaign |
| 2005 | 3c | 2006 | 3f |
| 16 | 59.4 | 75 | 64 |
![Remotesensing 03 02187 i003]() |
Table 6.
Number of LIDAR points over burnt scars in the Cerrado (2007), organized in before and after groups and according to the three main observation periods (inset figure shows the spatial distribution of all burnt scars with before-after LIDAR occurrences).
Table 6.
Number of LIDAR points over burnt scars in the Cerrado (2007), organized in before and after groups and according to the three main observation periods (inset figure shows the spatial distribution of all burnt scars with before-after LIDAR occurrences).
| Time of the Year | LIDAR | Burnt Scar Polygons | ![Remotesensing 03 02187 i004]() |
|---|
| Before | After | # | Area |
|---|
| Early wet | 488 | 16 | 10 | 1,127.5 |
| Late wet | 1,734 | 322 | 36 | 9,245.4 |
| During | 44 | 667 | 18 | 7,063.6 |
4. Concluding Remarks
The Ice Cloud and Land Elevation Satellite (ICESat) was the first of its kind to demonstrate the ability of orbital laser altimeter measurements to provide key information on the different components of the earth system, from the assessment of changes in ice sheet elevations [
59] and sea level variability [
60] to the derivation of the first global map of forest heights [
45]. Interestingly, there has been no attempt to use GLAS data in the Brazilian Cerrado, in spite of the approximately 2.5 million laser shots acquired over the entire ICESat mission and the enormous potential of orbital laser profiling for more accurate regional estimations of carbon stocks and ecosystem productivity, as well as the assessment of anthropogenic environmental impacts, an urgent concern in the fast-change and threatened Cerrado.
Specifically, this study focused on the GLAS availability over the Cerrado, based on the analysis of screened data from the GLAS06 product. At the biome scale, we found 206,026 and 176,035 data points over remnant vegetation and cultivated pasture areas, respectively. The importance of laser shots over cultivated pastures, the main land use form in the Cerrado, reside in the possibility that the LIDAR waveforms, which include returns from the top of the canopy, within the canopy, and from the ground, may potentially respond to differences in pasture conditions and grazing intensity. If such hypothesis can be confirmed, LIDAR technology could become instrumental in assessing the quality of the Cerrado pasture, 50% of which are believed to be degraded.
The spatial patterns of these remnant vegetation and pasture data points were assessed in relation to 15,612 watersheds, from which 4,467 and 3,213 have some LIDAR observation over either a natural vegetation target or a pasture site, respectively. Nevertheless, 8,369 and 4,415 watersheds, comprising an area of about 472,739 km2 and 186,350 km2 of either remnant vegetation or pasture, do not have a single LIDAR shot over these two land-cover types.
LIDAR availability was also evaluated in relation to the 130 fully-protected conservation units, 109,260 km2 of burnt scars formed in 2007, and 3,510 km2 of deforested areas during the 2005–2006 period. In 22 protected areas, well distributed over the biome and encompassing a wide range of vegetation types, 14,706 LIDAR points are available from the different GLAS campaigns. Regarding the burned areas (mostly human-induced), 3,271 points were found, according to three distinct before-after periods and distributed over an area of about 17,436 km2. Concerning the 3,225 (2005–2006) deforestation polygons, 16 of them, comprising 59 km2 of new clearings, showed coincident LIDAR points from both the 3f (2005) and 3c (2006) campaigns.
It is important to emphasize that all the 450,000 LIDAR shots encountered over the Cerrado comprise three main seasonal domains (i.e., dry season, early wet season and late wet season). While such seasonal availability can be instrumental for capturing the conspicuous phenology of the natural Cerrado physiognomies and for providing new insights on how the vegetation recovers after major disturbances, it also requires caution when combining shots from multiple campaigns or when combining LIDAR with other satellite products, in particular sun-synchronous passive optical data.
Although the effective data available may be slightly reduced after further “surface slope” and transmit pulse energy screening, the total amount of ICESat GLAS shots is certainly enough for acquiring a comprehensive understanding on how the echo waveforms respond to a variety of targets and conditions, many of them intrinsic to the Cerrado ecosystems. In particular, and as this study indicates, the amount of LIDAR data points, in spite of the data gaps, are well distributed for the retrieval of regional biophysical estimates. However, a synergistic approach with other remote sensing products seems to be necessary.
ICESat ceased acquiring data on 11 October 2009 and will remain the only source of orbital LIDAR data ever collected over the earth’s surface until 2016, when ICESat 2 is scheduled for launch. This long interruption in data collection, although critical in many aspects, also gives the opportunity for further utilizing the millions of laser shots fired during the seven years ICESat was operational providing overall an excellent performance [
61]. In the case of the Brazilian Cerrado, this is the time we need to catch up on exploring LIDAR applications at the biome scale, addressing key ecosystem questions yet poorly understood. The ICESat 2, carrying the only LIDAR instrument that will be flying for the remainder of the decade (as the DESDynI mission has been cancelled), relies on both the ICESat legacy, for continuity purposes as well as on new technology and broader mission goals [
62]. Among the expanded mission objectives is the assessment of the global vegetation biomass, likely to benefit from a new micropulse cross-track channel, expected to yield data at 1 km spatial resolution. For the Cerrado, in particular, the possibility of 12 years worth of data across an 18 year period (assuming five years of ICESat 2 observations) may enable the accurate mapping of carbon stocks, as well as the assessment of major natural and anthropogenic changes in biomass, in support of the implementation of REDD-like (Reducing Emissions from Deforestation and Forest Degradation) conservation enforcement mechanisms.


