1. Introduction
Trends in climate change and permafrost degradation in northern high latitudes have raised questions over the potential greenhouse gas emissions response from permafrost, lakes, and wetlands. Northern high latitude soils contain approximately 1,000 petagrams (Pg) of carbon in the top 3 m [
1]. Changing climate is likely to increase vulnerability of this soil carbon [
2], and could alter net CO2 and CH4 emissions significantly [
3–
5]. One of the primary drivers of net emissions in peatlands response is hydrological flux and water balance, which can influence both rates of methane and carbon dioxide emissions and of permafrost thaw [
6,
7]. Therefore, accurate spatiotemporal information on hydrological variability is critical for assessing peatland emissions response to climate change.
Remote sensing can provide a powerful tool for assessing landscape hydrology at large spatial scales and in remote regions. Efforts to improve understanding of hydrological varability and high latitude wetlands have utilized Synthetic Aperture Radar (SAR). The advantages of SAR relative to optical sensors include the ability to penetrate vegetation canopies, a direct sensitivity to water and vegetation structure, and the capacity for observation in all weather conditions. The Phased Array L-band Synthetic Aperture Radar (PALSAR) instrument onboard the Advanced Land Observing Satellite (ALOS-1) was one such platform with a mission to provide regional and consistent (regular overpass collections) microwave data collection. The relatively long L-band wavelength (23.5 cm, 1.275 GHz), as compared to C- or X-band, enables the capture of different scattering mechanisms that make detecting flood status in different wetland types (
i.e., herbaceous, forested, emergent, grassland) feasible with high accuracies [
8–
13]. Recent efforts have also highlighted L-band advantages over C-band when using techniques that apply phase differencing and decomposition of scattering to effectively discriminate detailed wetland classes and monitor peat thickness and wetness [
14,
15].
While ALOS-1 is no longer collecting data, the archives of ALOS-1 PALSAR provide five years of observations at multiple scales and modes. This includes fine-beam single and dual (FBS/D) pol (HH, HH+HV) observations along with a polarimetric (PLR) mode (HH+HV+VH+VV) at ground resolutions on the order of 6.25 m to 24 m, respectively, with adequate signal-to-noise ratios for mapping hydroperiod. In this application, hydroperiod is defined as the frequency and duration of inundation or flooding. The planned launch of ALOS-2, scheduled to continue L-band collections in 2013, will have even more advanced capabilities. Concordantly, other high resolution platforms will likely become operational that can provide complementing observations, such as Light Detection and Ranging (LiDAR) data. LiDAR uses a laser pulse sent from above that interacts with surface features and returns. From this process information can be extracted including precise elevation or land surface topography along with canopy structure metrics. The ability to collect LiDAR at a fine-scale has led to many wetland and wetland hydrology applications, such as the mapping of topographic attributes and flow paths (e.g., [
16,
17]), and planned operational LiDAR platforms are underway. The fusion of these different remotely sensed data for characterizing aquatic ecosystems will continue to expand as research applications seek to extract and combine the individual strengths (
i.e., spatial resolution, spectral coverage, temporal frequency) of SAR, LiDAR, optical, and ancillary spatial datasets such as soil or climate information (e.g., [
18–
21]).
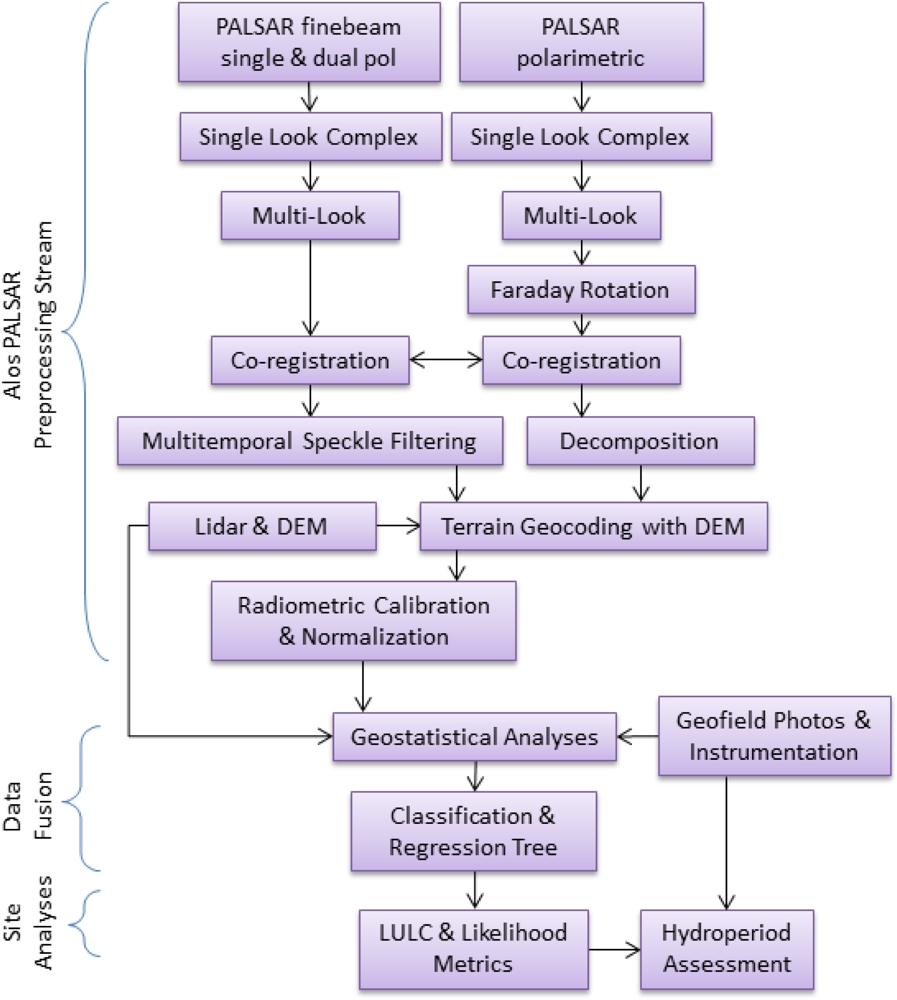
The use of high temporal frequency (e.g., daily–weekly), finer-scale (e.g., <25m) SAR for mapping high latitude peatland hydroperiod has potential to improve our understanding of dynamics and climate change response. Further, operational techniques that fuse multiple high-resolution platforms (e.g., PALSAR, LiDAR) need to be developed for integrating the strengths of multiple sensors for wetlands assessment and monitoring. The overarching goal of this research application was to assess hydroperiod at a high latitude wetland using fine-scale, multi-mode PALSAR and LiDAR observations. Spatial structure of the data and the high latitude wetland were characterized using a geostatistical approach. A Classification and Regression Tree was developed to take advantage of all available SAR and LiDAR, independent of mode or scale, to generate fused hydroperiod maps. The geospatial products were integrated with field data to provide a comprehensive assessment of the site. The approach was designed to be easily scalable, transferable, and to potentially be implemented in an operational context to support assessment and monitoring of wetland response to climate change as similar platforms (e.g., SMAP, ALOS-2, ICESat-2) come online.
3. Results and Discussion
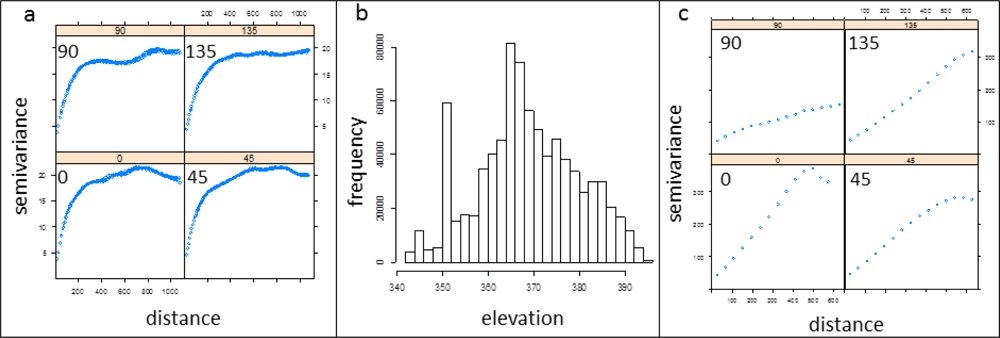
The variograms indicate landscape structure and measure the spatial autocorrelation in the remotely sensed imagery at the given resolutions of the PALSAR (6.25–25 m) and Lidar (1 m) (
Figure 4). The fine-beam single and dual pol terrain geocoded PALSAR imagery found no major structural features at the scale of the mire as evident in the variograms which are primarily isotropic across the different DOY intervals and different fine-beam modes (HH or HV) with no drastic points of inflection. When modeling the larger region several large waterbodies created non-stationarity and first order drift. Therefore, the results and discussion are focused on the mire itself and exclude all regional drivers. Minor inflection along the sill was present when moving from high elevations toward lower elevations. Strong spatial dependence (correlation) was observed at the mire at a range of several hundred meters with relatively steep slope and modest nugget discontinuity considering the fine scale of the SAR data. Gradual ecotonal shifts were present in structure, as observed from the multitemporal filtered, fine-beam data indicating the ability to distinguish “pure pixels” and vegetative structure of major wetland classes and larger patches, considering the range which the sill begins to level off. In other words, there are pixels with mixed surface vegetation at the scale of the PALSAR observations.
A summary of spatial regression results are presented in
Tables 2–
4. The OLS results between LiDAR-derived elevation (independent variable), PALSAR sigma nought (dB) backscatter (dependents), and PLR decomposition products (dependents) indicate significant albeit weak correlation (
Table 2). OLS regression is based on an underlying assumption that the error terms are independent and identically distributed with a mean of zero and constant variance. The strength of the LiDAR to “predict” PALSAR was weak as indicated by the R
2; implying elevation or topography are not strong determinates of scattering mechanisms as observed from the PALSAR. Diagnostic testing of the OLS results show that these underlying assumptions are violated, however. The lagrange multipier (LM) diagnostics (
Table 3) indicate that there is spatial autocorrelation in the error terms (LMerr). The highly significant paired LM diagnostics (
i.e., LMerr and LMlag) and the corresponding robust (RLM) diagnostics were all significant; since the robust LMerr (RLMerr) statistics were greater than the corresponding RLMlag statistics, it was concluded that the spatial error model (SEM) was most appropriate to evaluate the relationship between LiDAR-derived elevation and each of the dependent variables. Results of the SEM are summarized in
Table 4. The spatial autocorrelation coefficient (Lambda) was very strong across PALSAR products and likelihood ratio (LR) testing was found significant. This confirms the presence of spatial autocorrelation observed in the directional variograms. Furthermore, the Akaike Information Criterion (AIC) value for the SEM was lower than the AIC value for the OLS model in all cases; this indicates that the SEM provides a better fit to the data than the OLS model. These patterns were typical across modes and DOY. These results imply that at the given scales of the data and ecological processes the LiDAR-derived elevation is not a strong predictor of backscatter or PLR derived scattering mechanisms; however, modest significant ability to predict is present. Ecologically, this implies that elevation changes influence vegetative patterns at the mire, although the remotely sensed data found the relationship weak due to the scales of the SAR data.
The directional variograms of the sub-meter LiDAR at the mire show greater sensitivity to the features the LiDAR is observing (
i.e., “elevation”) relative to the PALSAR observations of scattering mechanisms of the mire according to the directional variograms (
Figure 4). Most notably was the 135° directional variogram that distinctly captured relatively strong anisotropic behavior highlighting surface hydrology patterns, or surface flow direction, that were notably in this direction as compared to other directions. The variogram assessment in this application shows that the LiDAR derived-elevation, which is also indicative of hydrogeomorphology, was slightly more sensitive to topographic structure compared to multitemporal filtered, fine-beam PALSAR sensitivity to mire scattering mechanisms at the given observation scales. Conversely, this implies that elevation is not the sole driver of vegetative structure.
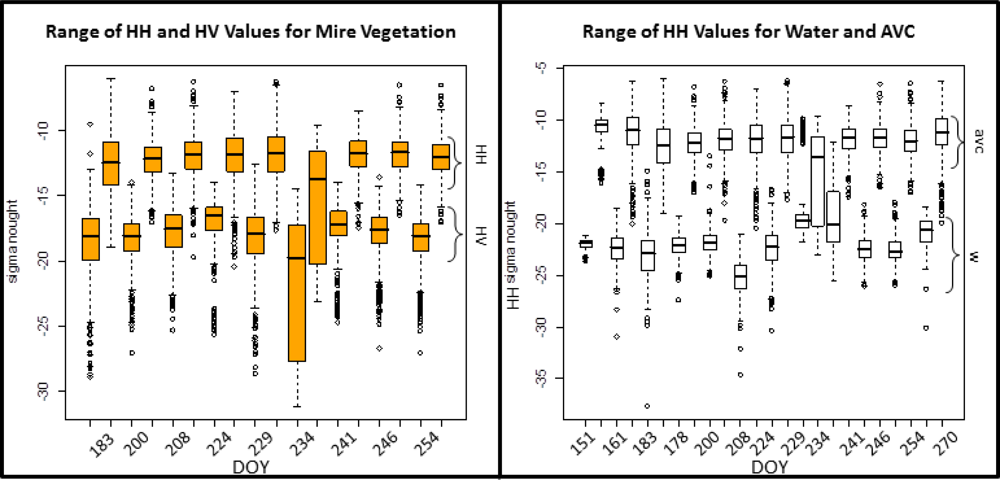
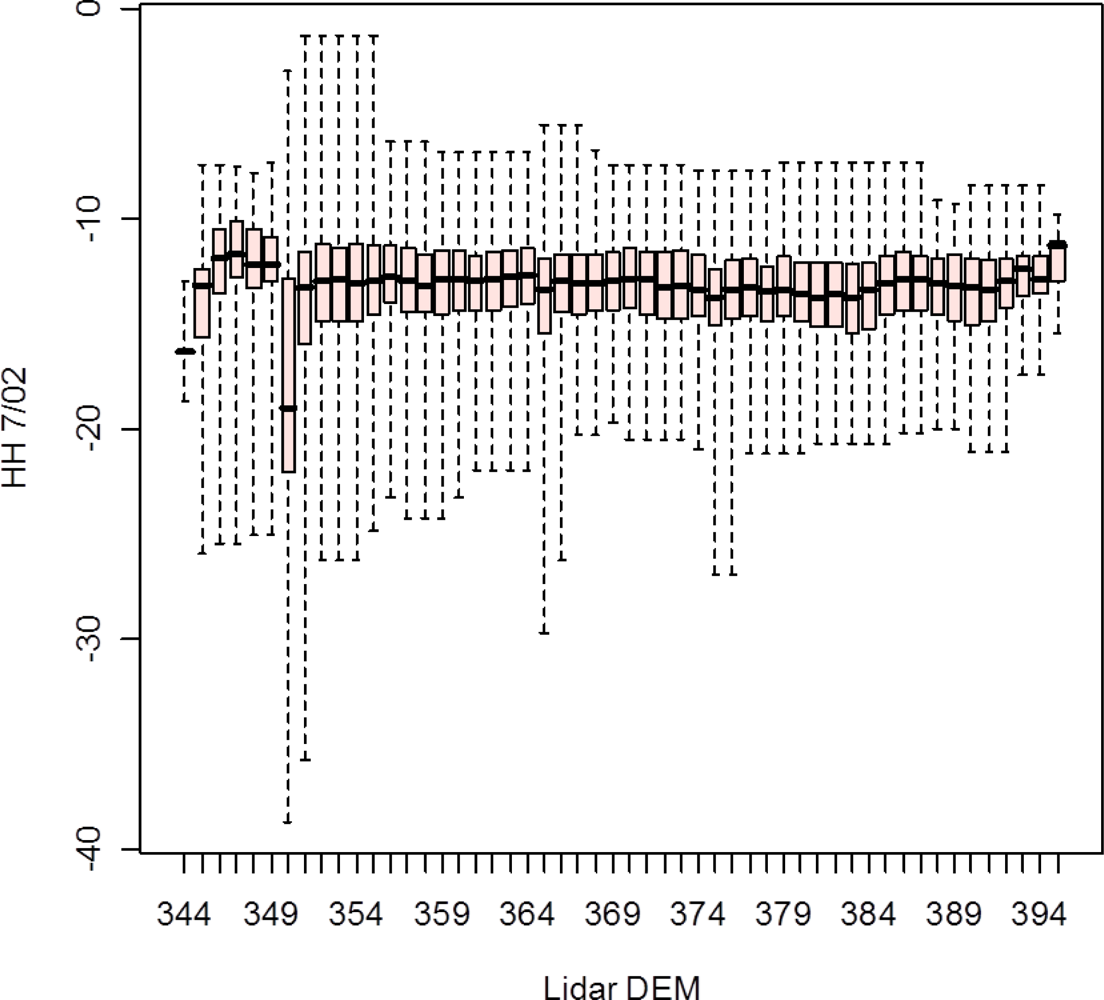
Across observation modes and DOY the range of HH and HV decreases as elevation increases (
Figure 5). This is not a result of topographic features influencing radiometry as the highest elevations of the actual mire and permafrost are gradual shifts and do not contain rock features. This corresponds with mire vegetation configuration, which is, in part, driven by a combination of elevation and hydrological fluctuations. At elevations near the 350 m zone the water table tends to create ponding which promotes herbaceous-emergent and erectly oriented edge species compositions (
Carex rotundata,
Eriophorum vaginatum,
Politrichum jensenii). The dynamic hydrology (
i.e., water table depth, soil moisture, freeze/thaw) also promotes palsa and embankment collapse creating more complex scattering targets along with ecotonal species. However, the hydrogeomorphology, permafrost, and active later depth of the mire also create small ponding features at higher elevations. Therefore, only using the LiDAR data individually to map surface hydrology would be inadequate for a thorough characterization of mire hydrology and dynamics due to the single overpass time of LiDAR, sensitivity of PALSAR to vegetative structure, and fact that elevation is not the sole driver of community composition.
Slightly higher than 350 m and adjacent to many ponding features, dry ombrotrophic, ombro-minerotrophic, and ombrotrophic (
Empetrum hermaphroditum, Betula nana, Rubus chamaemorus Eriophorum vaginatum, Carex rotundata, S. balticum, Drepanucladus schulzei, and
Politrichum jensenii) species dominate the hummock, wet, and semiwet peat soils [
22] with the palsa patches underlain by permafrost. As the surface elevation increases at the mire, backscatter variability tends to become more uniform with backscatter minimum increasing, backscatter maximum and range decreasing, and the 25th and 75th percentile distribution becomes less variable (
Figure 5). This supports the notion that geomorphic setting, measured in part by the LiDAR, is one key driver of surface water pooling and drainage, and thus, vegetative composition and configuration, which was captured by the PALSAR. At the same time this shows the use of both LiDAR and PALSAR are uniquely advantageous for interpretations of mire characteristics and ecology.
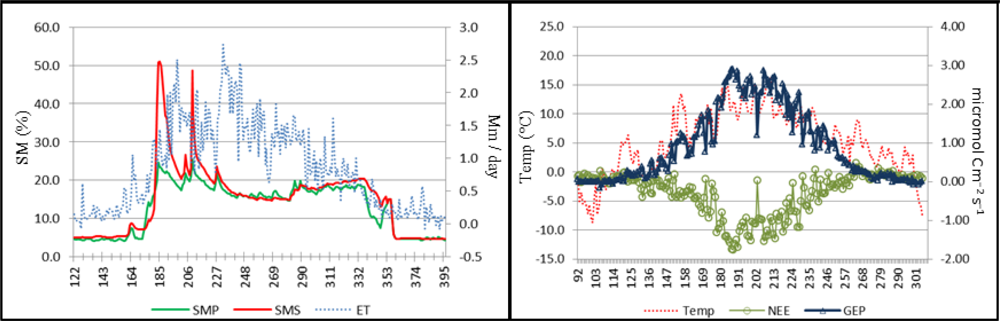
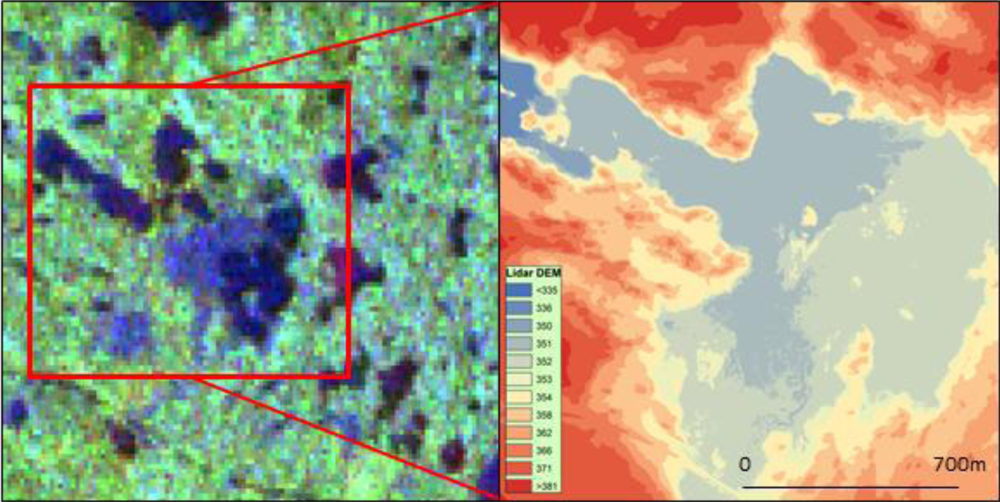
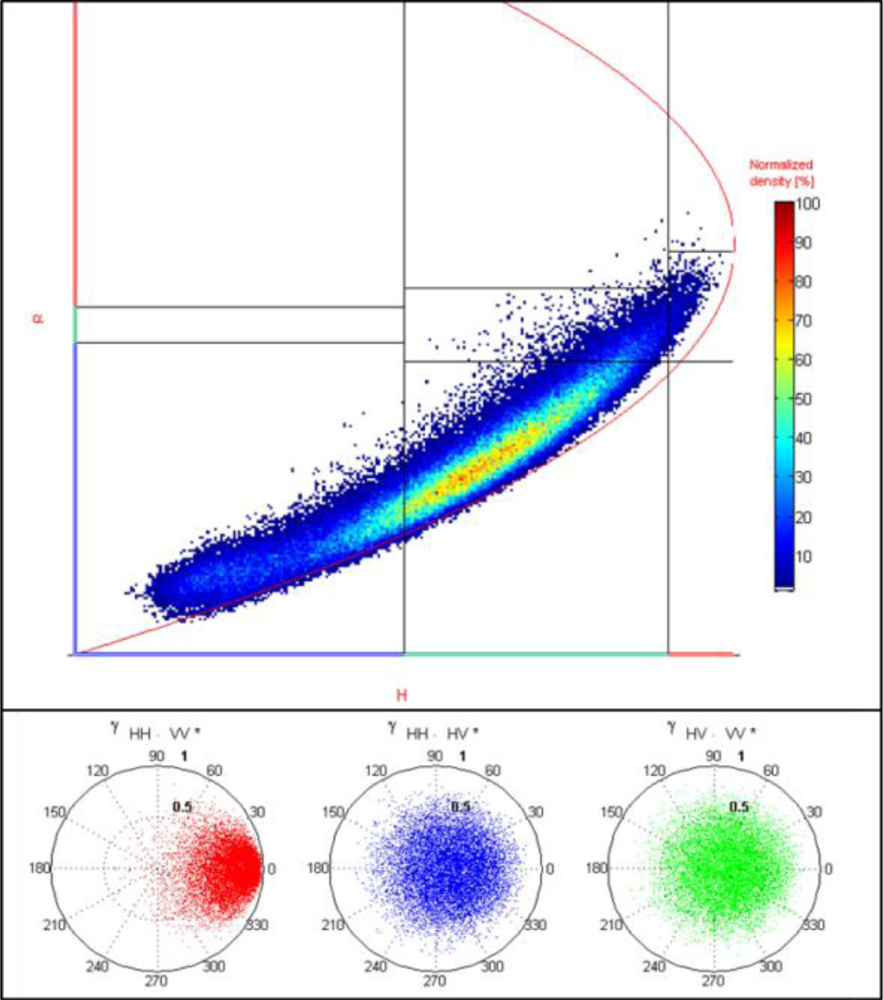
The PLR observation was early in the thawing stage (DOY 151) and therefore was not at a peak time for mapping maximum soil moisture across the mire. A sharp rise in soil moisture occurs near DOY 183; however, minimum daily temperature typically remains above freezing after DOY 145 and corresponds to divergence in net ecosystem production and gross primary production. Therefore, DOY 151 is suitable for mapping mire surface hydrology however precautions must be used in interpretations. The relatively low pedestal height (0.25) of the copolarized and (0.15) cross-polarized PLR signature shows the maximum return at the horizontal polarization was indicative of less complex single bounce scattering. This was due, in part, to an early thaw image as the double bounce of densely vegetated wetlands was not dominant and was uniform at elevations higher than most of the ponding areas (e.g., ∼350 m a.s.l.). With increasing elevation, tall, erectly-oriented graminoids shift toward scrub-shrub communities at even higher elevations with occasional patches of barren rock. Canopy scattering was more apparent at higher elevations as visible in the green-yellow tones of
Figure 6 compared to the blue-purple tones at lower elevations with surface scattering from water and the mesic and palsa regions underlain by permafrost.
The CP scattering decomposition histogram (
Figure 7) indicates mostly surface scattering and medium entropy tend to dominate while vegetative scattering was present at smaller quantities. By using the LiDAR the vegetative scattering tended to occur at high elevations for DOY 151. This supports the interpretation that the dominant Bragg scatterer was the primary signal from peat moisture conditions and water table levels, much of which is over a subsurface permafrost layer especially when considering phenology (
i.e., freeze/thaw) at this DOY (151). Several ponds, with a distinct single bounce surface scattering response, are located at the site and this was evident in the PLR decomposition products by the dark purple-black colored patches dispersed across the image. The low alpha implies the mire site, as observed on DOY 151 by PALSAR, was largely a single-bounce scattering target lending itself to sensitivity to permafrost peat condition this time of year. These patterns are visually apparent in
Figure 6 where the purple colors are present which also happens to be the location of a permafrost zone.
The CART classifications had overall accuracies between 70 to 86% and kappa between 64 to 80% using out-of-sample validation (n = 800) with significant
p-values (<0.00001) (
Table 5). The water class tended to have the highest class-level accuracies (sensitivity: 0.94, specificity: 0.97, positive prediction value: 0.92, negative prediction value: 0.98) which was not unexpected considering the unique scattering mechanisms of the water class compared to the other classes. An advantage of this CART approach was that pixels receive a series of votes. This created not only a thematic map that was determined by the class with the maximum number of votes, but also a continuous likelihood map for each class that corresponds to the total number of votes. For mixed pixels, pixels with high soil moisture, or pixels with the presence of surface water the number of votes for the water class varied depending on how that pixel matched the training data (PALSAR and LiDAR products that vary by DOY).
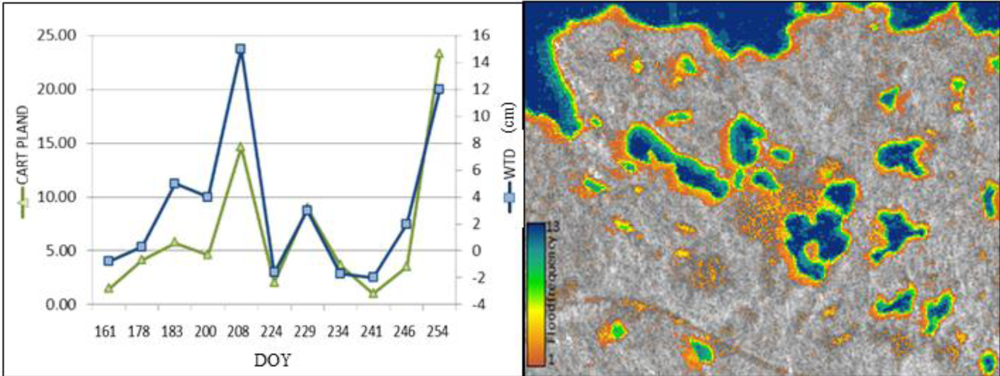
The CART water maps were cross-referenced with field WTD observations from a wet site for all available corresponding time periods. While the number of samples limits the utilization of traditional goodness-of-fit measures, the WTD and fused LiDAR-PALSAR water maps match extremely well (
Figure 8: R
2 = 0.86, n = 11); PLAND (“Percent of Landscape”) is an index common in landscape ecology that in this case is simply derived by averaging (pixels) the CART water class map across the mire study area. Each data point direction (±) and magnitude of change to the next data point was found very consistent between the two datasets. Further, a small temporal window (May–September for 2008 and 2009) of available soil moisture data measured at palsa and sphagnum sites were strongly correlated (R
2 0.69–0.78) with the WTD measurements. Therefore, the CART water maps were qualitatively strong and accurate indicators of soil moisture. Thus, in the dry ombrotrophic, ombro-minerotrophic, and ombrotrophic ecotonal communities including palsa bog underlain by permafrost, L-band had abilities to penetrate the vegetative canopy and characterize peat moisture levels that are driven largely by water table depth and precipitation. This supports similar findings that ALOS L-band has abilities to characterize inundation dynamics in high latitude wetlands [
14,
15].
The applied results show that annual and interannual variability can vary by an order of magnitude and a hydrological surplus or deficit can occur early or late in the warm season.
Figure 8 displays the flood likelihood values across the mire. Areas over a permafrost zone adjacent to water pools, that appears dark blue in
Figure 6, were observed to have low to moderate fluctuating (appears green-yellow in
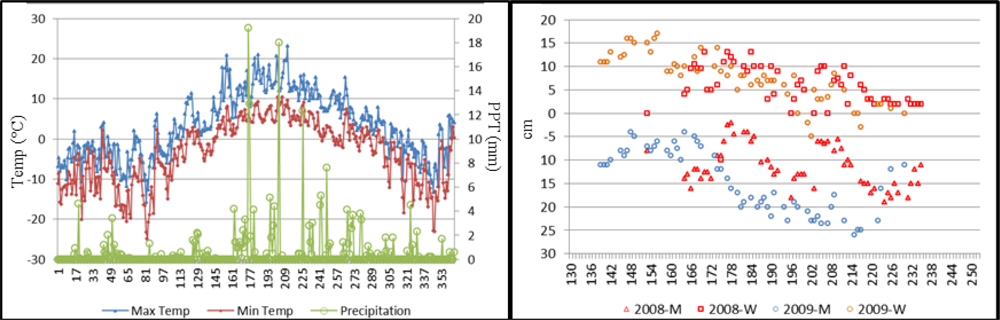
Figure 6) hydroperiod conditions. Excluding surface water pools, this permafrost region of the mire tended to have a relatively dynamic hydroperiod during the aggregated warm season. The ability to remotely monitor peat hydroperiod over space and time successfully is important as our recent efforts to understand peatland C balance have shown that Net Ecosystem Exchange for the palsa areas were significantly lower (
i.e., greater uptake) in wetter years (
i.e., 2008) compared to drier years (
i.e., 2009) during key warm months [
24]. The CART maps can also potentially provide an indicator of the active layer and permafrost degradation as wetness and the depth of the permafrost layer have been linked at this site [
40]. These results have significant implications for the hydrological variability of high latitude wetlands and monitoring hydroperiod. This hydrological variability influences the partitioning of the soil into anoxic and oxic zones, and thus net greenhouse gas emissions, with a potential feedback to climate. It also influences rates of permafrost degradation, and thus soil wetness, again with potential feedbacks to the climate system.
In this application the information derived from both Lidar and PALSAR is enhanced when combined to more comprehensively characterize hydroperiod and related hydrogeomorphic conditions of the mire. The Lidar was primarily utilized to map topographic features, including surface flow paths, while PALSAR was primarily utilized to map surface and vegetative conditions, including hydroperiod, over time across the site. Together the sensors were able to extract useful and unique information that when combined enable a more thorough assessment of hydroperiod and hydrgeomorphic conditions. Neither sensor was capable of comprehensively mapping multiple hydrogeomorphic attributes (i.e., topography and hydroperiod) at the mire; however, together a more detailed characterization was feasible. For example, the single date Lidar was not capable of mapping hydrological attributes over time, while the fine-beam PALSR was not capable of resolving topographic features influencing flow paths on the order of magnitude of sub-meter scale. In this application each sensor has strengths and limitations that were enhanced by the other sensor.
The approach described in this research application provides a useful spatiotemporal assessment of hydrological variability and hydrogeomorphic attributes of the mire. Ecologically, the results show that both datasets (
i.e., LiDAR and PALSAR) provide unique and valuable information for characterizing mire spatial structure and hydroperiod. These types of spatial databases will be useful for driving biogeochemical models and extrapolating field measurements. A qualitative comparison of the CART technique was performed against simple thresholding techniques that have been successful for mapping hydroperiod in agricultural systems. The thresholding values were based on the box and whisker plots (
Figure 3) generated for each DOY observation. The CART substantially outperformed the thresholding technique as the WTD values did not correspond well with thresholding products of water for this site likely due to the thresholding values being generated from the open water class and not optimized to mesic or wet minerotrophic conditions with higher soil moisture.


