Article

Can Night-Time Light Data Identify Typologies of Urbanization? A Global Assessment of Successes and Failures

School of Forestry and Environmental Studies, Yale University, 195 Prospect Street, New Haven, CT 06511, USA
*
Author to whom correspondence should be addressed.
Remote Sens. 2013, 5(7), 3476-3494; https://doi.org/10.3390/rs5073476
Submission received: 13 June 2013 / Revised: 15 July 2013 / Accepted: 16 July 2013 / Published: 19 July 2013

Abstract

:
The world is rapidly urbanizing, but there is no single urbanization process. Rather, urban areas in different regions of the world are undergoing myriad types of transformation processes. The purpose of this paper is to examine how well data from DMSP/OLS nighttime lights (NTL) can identify different types of urbanization processes. Although data from DMSP/OLS NTL are increasingly used for the study of urban areas, to date there is no systematic assessment of how well these data identify different types of urban change. Here, we randomly select 240 sample locations distributed across all world regions to generate urbanization typologies with the DMSP/OLS NTL data and use Google Earth imagery to assess the validity of the NTL results. Our results indicate that where urbanization occurred, NTL have a high accuracy (93%) of characterizing these changes. There is also a relatively high error of commission (42%), where NTL identified urban change when no change occurred. This leads to an overestimation of urbanization by NTL. Our analysis shows that time series NTL data more accurately identifies urbanization in developed countries, but is less accurate in developing countries, suggesting the need to exert caution when using or interpreting NTL in developing countries.

1. Introduction

Researchers in a range of fields including economics, sociology, and geography have developed urbanization typologies to categorize cities into different classes in order to understand their similarities and differences [15]. One of the most common urbanization typologies is based on population size. However, in addition to a demographic transition, urbanization is a process that simultaneously involves the transition from a rural, agricultural-based economy to an industrial, services-based economy [6,7], and land cover change from more natural ecological systems to the built environment [8,9]. Therefore, figures on demographic changes alone are insufficient for providing information about other dimensions of urbanization. For example, urban areas may change their economic base from agriculture to manufacturing or services. In terms of urban form and structure, urbanization may result in the built environment becoming more linear, dispersed, or compact. Furthermore, not all urban areas may be rapidly growing: some are stable or shrinking. Thus, there are multiple dimensions that should be considered when considering typologies of urbanization.
Over the last decade, there has been an increase in the use of night-time light (NTL) data collected by the Defense Meteorological Satellite Program/Operational Linescan System (DMSP/OLS) to study urbanization. NTL data measure lights on Earth’s surface, including street lights, but the signal also captures gas flares, illuminated boats, and lit agricultural fields [10]. NTL data have been shown to be correlated with urban economic activity [1113], population [1416], and the built environment [1720]. Thus, the data offer a unique opportunity to characterize urbanization from multiple dimensions. Furthermore, the long historical archive of NTL data starting in 1992 provides a valuable time series that could be used to explore the temporal dynamics of urbanization.
Although NTL images have been used in many urban applications, there has been no systematic assessment of whether, when, where and under what conditions these data succeed or fail to correctly identify different types of urbanization around the world. The purpose of this paper is to examine these issues explicitly and systematically. We first assess how well a time series of NTL data identifies the process of urbanization, defined as a process of simultaneous changes in land cover and the built environment, economic activity, and population density. Next, we examine how well the NTL data are able to characterize urbanization typologies for different regions of the world. We quantify errors of omission and commission for different urbanization typologies across different world regions. Finally, we discuss opportunities and challenges for using time series NTL data for urbanization studies based on the findings.
The remote sensing community has generated abundant information about urban areas in a single year [2125]. Among these studies, efforts to assess the accuracy of NTL data to identify urban extent show that DMSP/OLS NTL data often overestimate the illuminated area. This overestimation is the result of a combination of factors, including the large NTL pixel size, the capability of NTL to detect sub-pixel light sources, atmospheric effects, and geolocation errors [21,22,25,26]. However, only a few studies monitor urbanization dynamics with time series NTL data [20,2729]. Although differing in their approaches and scopes, these analyses commonly suggest that time series NTL data have enormous potential to characterize urbanization processes at national, regional and global scales. However, to date, there has been no systematically and globally quantitative accuracy assessment of how well time series NTL data can identify different typologies of urbanization as processes. We ask the following research questions in this study: Does the time series NTL signature accurately capture the urbanization changes underway on the ground? When and where are NTL data able to correctly characterize urbanization? What are the underlying reasons for when NTL data succeed or fail to correctly characterize urbanization?
Our study differs from previous efforts in four respects. First, while the main foci of previous studies have been urban land extent, we use a multi-dimensional definition of urbanization and examine it as a simultaneous process of change in land cover and the built environment, economic activity, and population density. Second, we use time series NTL data and multiple Google Earth images to identify urbanization, rather than assessing a snapshot of urban activity in a single year. Third, while previous studies chose only a few select city or metro case studies, we randomly selected sample points distributed across all world regions, which enables us to compare urbanization processes across the world. Fourth, most prior studies used Landsat TM/ETM+ images to compare with NTL. Here, we use multi-temporal images from Google Earth, which combines a mix of different high spatial resolution satellite and aerial data from multiple providers, such as TruEarth® 15 m and GeoEye 0.5 m images, for a given area. Because of their high spatial resolution, Google Earth images provide more detailed information about land cover and land use than do Landsat images [30]. These high resolution images enable us to make inferences on land uses and economic activities that are not possible with Landsat data. For example, detached residential housing, commercial space, and industrial activities are often distinguishable from each other in a Google Earth image but are not in a Landsat scene.

2. Methodology

2.1. Data and General Procedures

The NTL data sets used in this research are from the Earth Observation Group, NOAA National Geophysical Data Center [31]. There are significant variations in the NTL signal collected from different satellites [32]. We attempt to minimize these inconsistencies by using NTL data from only the F14 satellite for the 1997–2003 period.
Our analytical approach included multiple steps, the key components of which involve selecting NTL points, labeling each site, and comparing them with Google Earth imagery (Figure 1). First, we used a stratified random sampling scheme to select 240 NTL data points around the world. Next, six remote sensing analysts independently labeled NTL profiles as urbanization or non-urbanization and interpreted the sites based on land use/cover, economic activity, and the presence/absence of infrastructure inferred from Google Earth imagery. We then integrated the questionnaire results where there was consistency in response of over 4/6 for each point. Comparing the Google Earth labels with the NTL data profiles, we assessed when and where NTL data are able to correctly identify urbanization. Based on these assessments, we examined whether urbanization could be identified with NTL data, and the conditions under which NTL data succeed or fail to identify different types of urbanization.
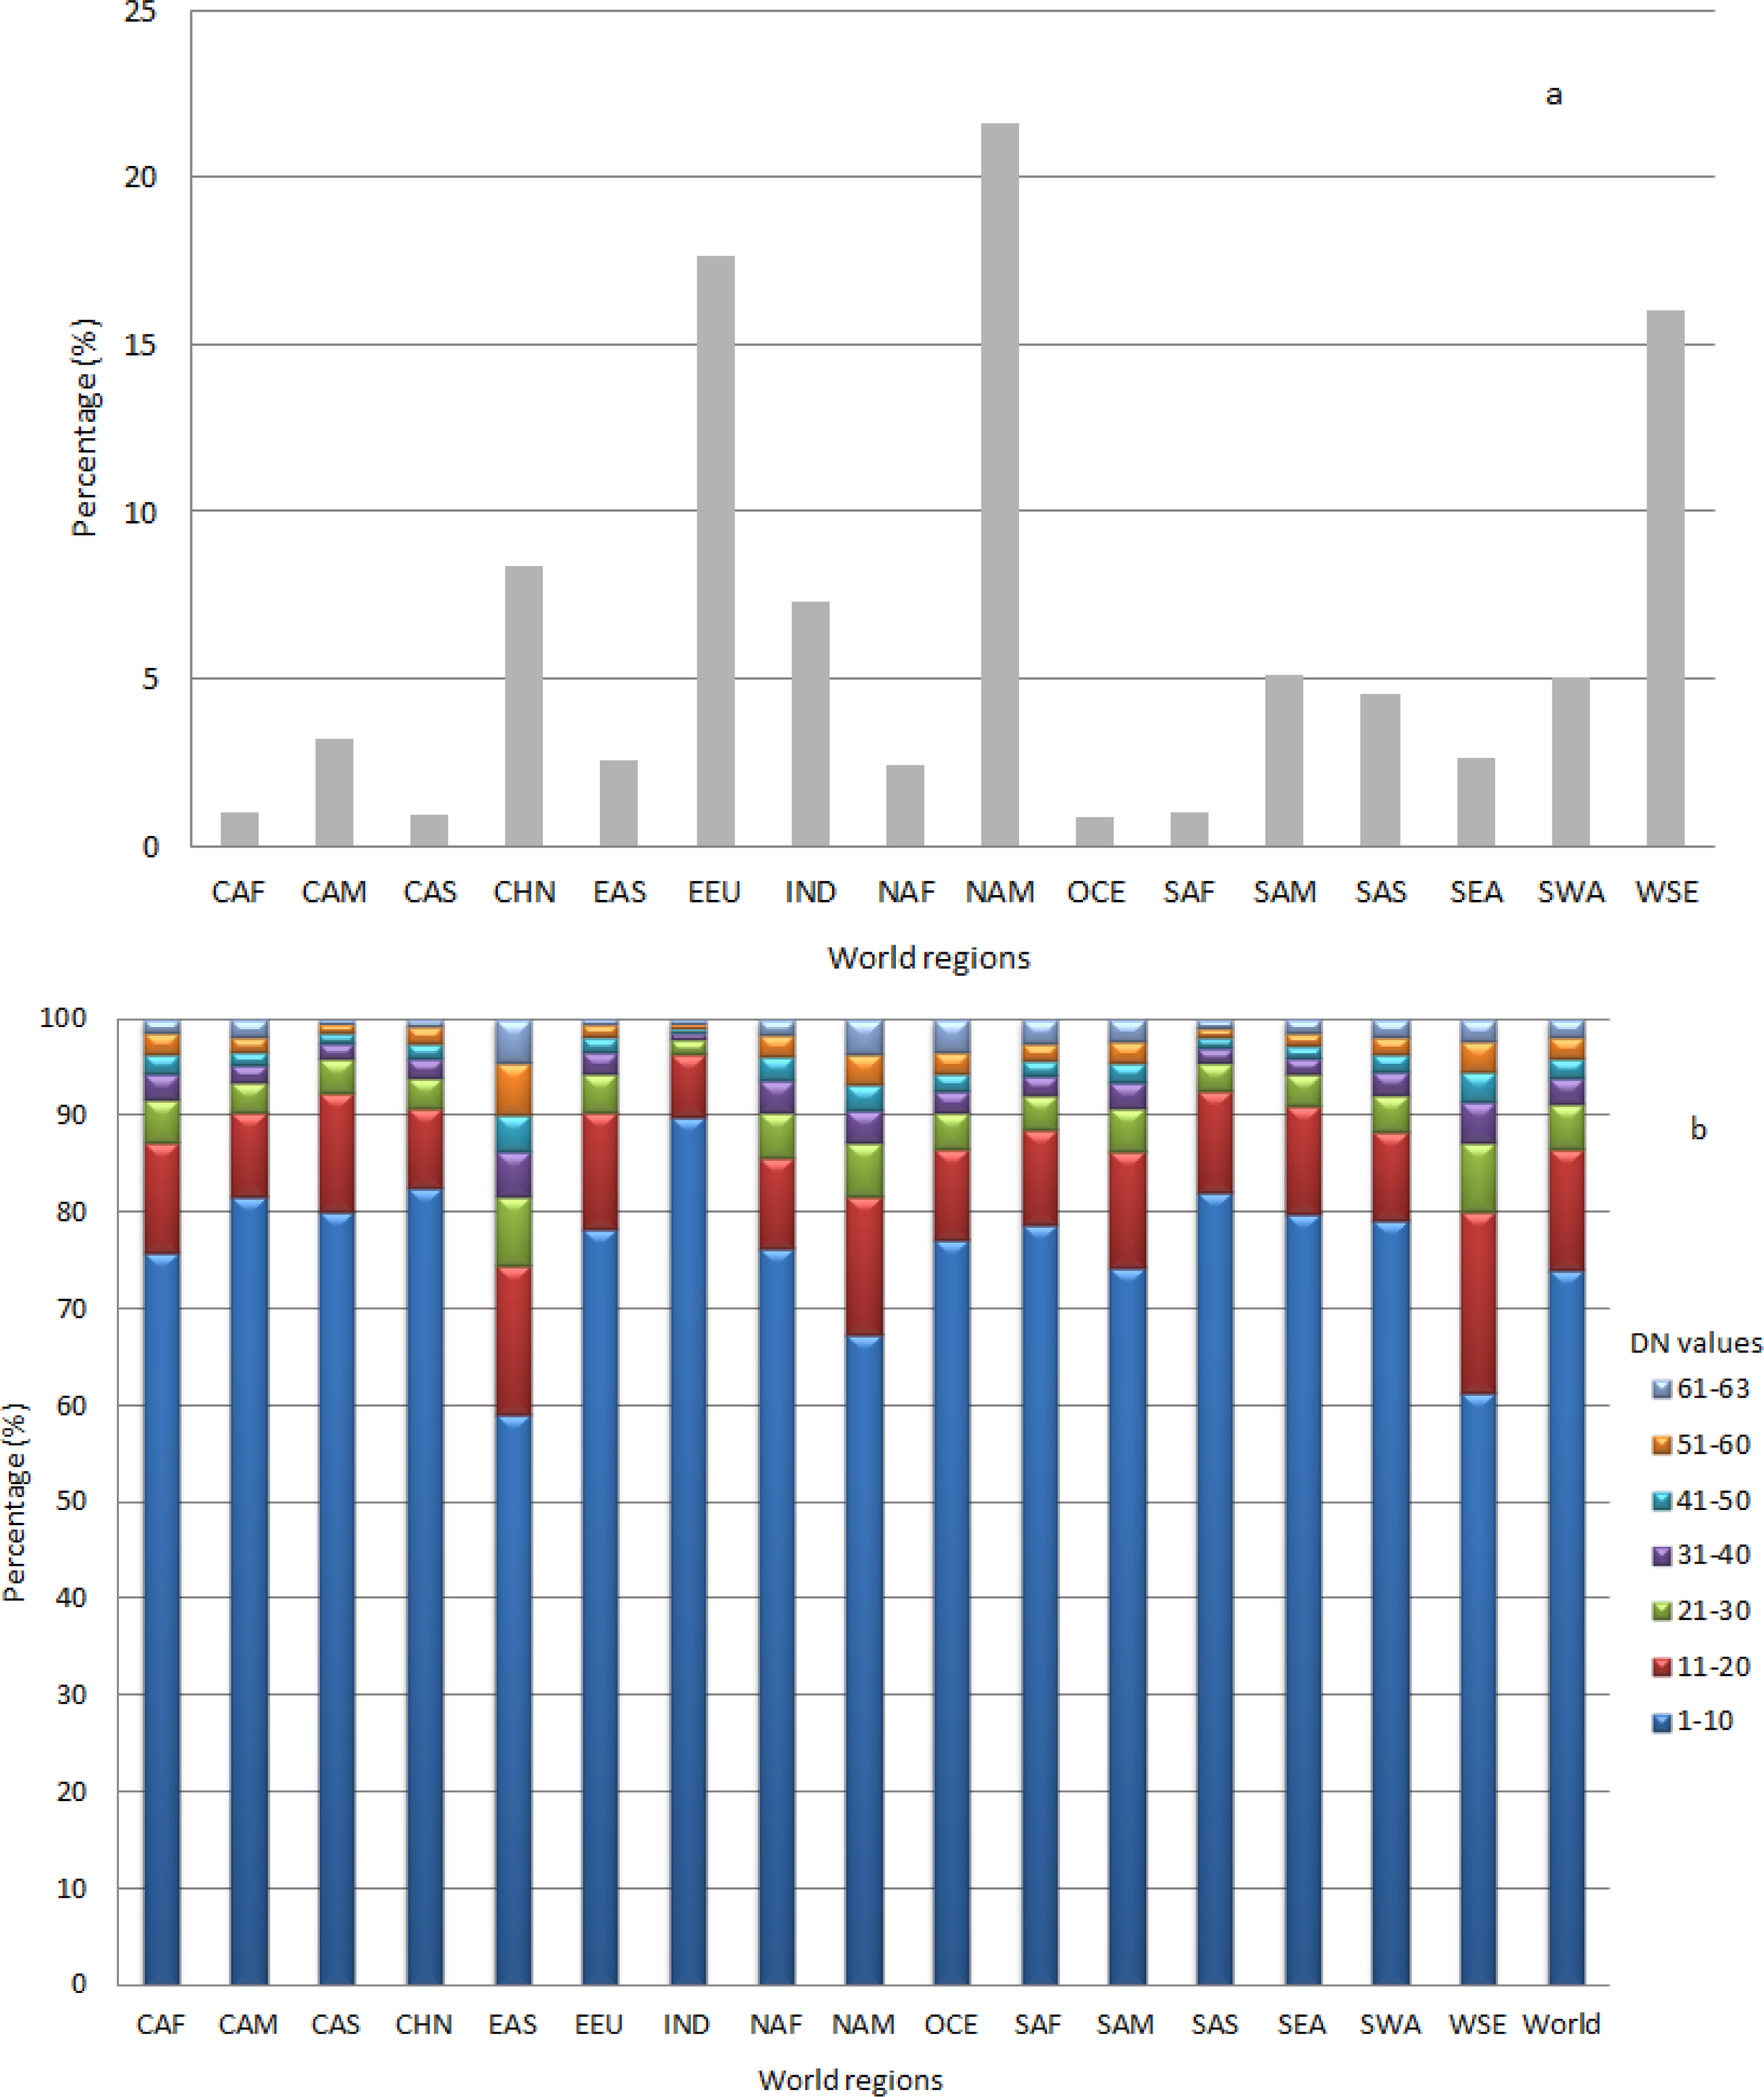
The sampling strategy we adopted is based on the global distribution of all available non-zero NTL pixels, which is geographically uneven (Figure 2a). Furthermore, the total numbers of non-zero NTL pixels at 10-unit intervals of digital number (Figure 2b) are highly variable among regions (Table 1). For these reasons, we used a stratified random sampling scheme to select sampling points, stratifying first by region and second by intervals of NTL data values in the end year of the study period. We used the world regions developed by Seto et al. [33], which are broadly based on the United Nations world regions. The regions differ from the UN regions when one country is economically dissimilar to other countries in its region and more similar economically to a neighboring region. We treat China and India as individual regions because of the size of their population, economy, and land area.

2.2. Labeling and Interpretation

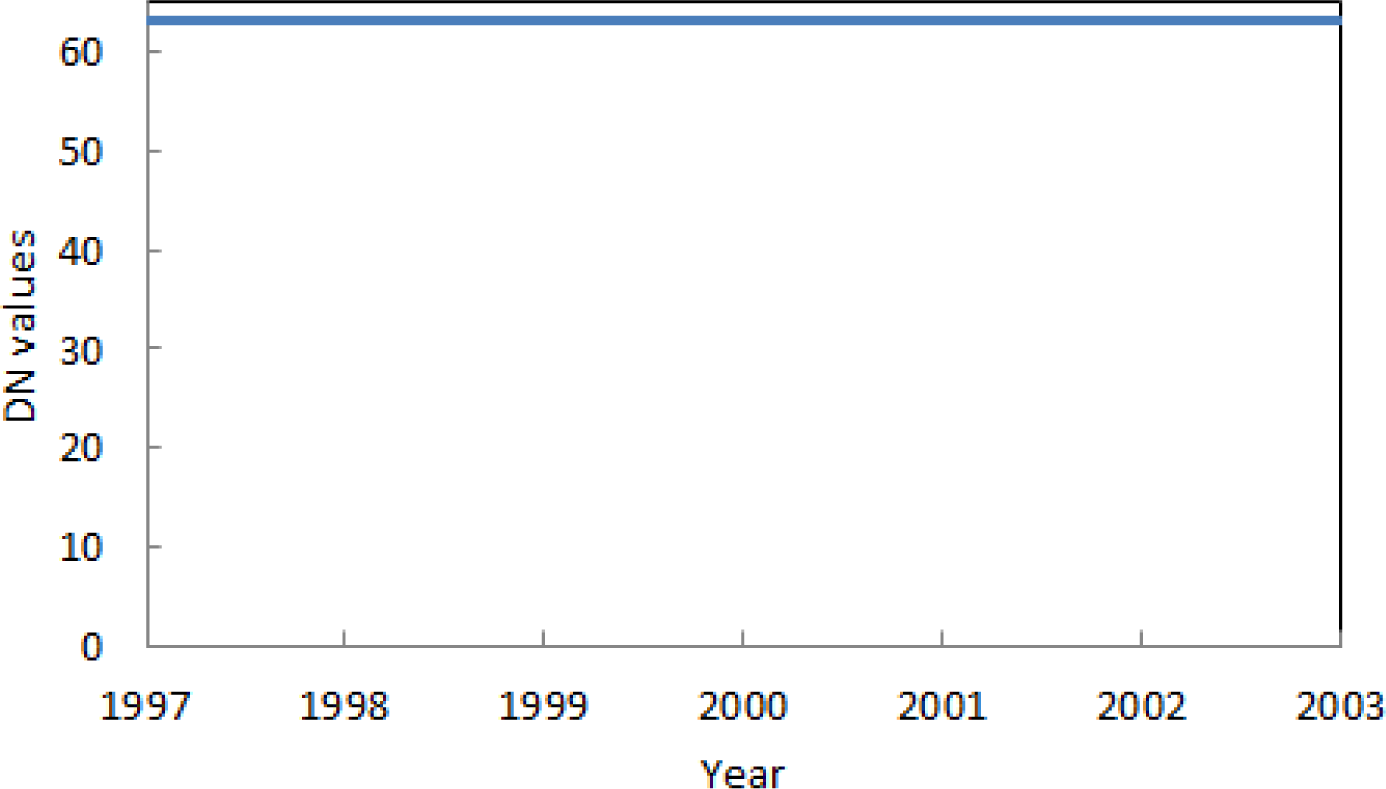
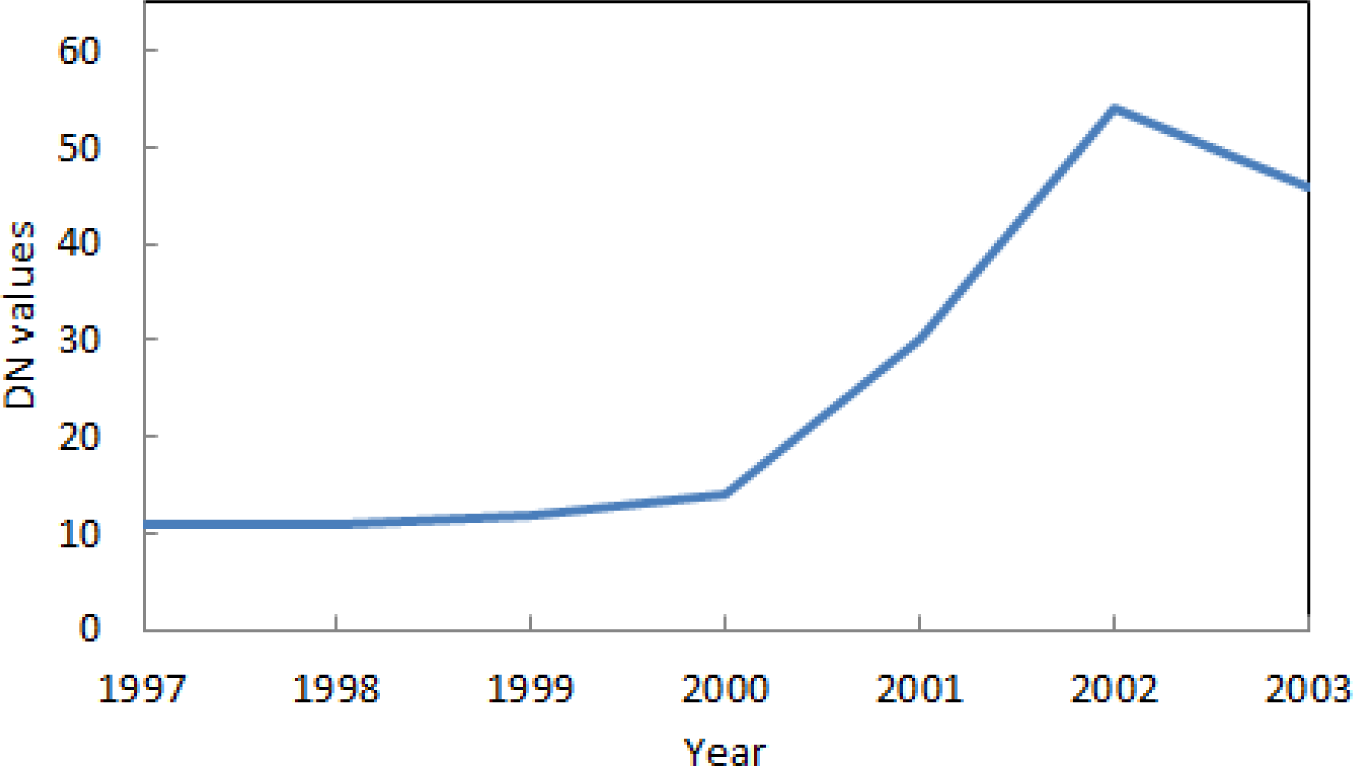
Although previous studies have linked NTL data with urban land cover [27], in this study, we considered not only prevailing land cover types, but also infrastructural elements and dominant economic activities within a single pixel (1 km × 1 km) and its 5 km × 5 km window. We use multi-temporal Google Earth images as references to evaluate transitions of urban-related activities occurring on the ground. For each NTL sample point, we found the corresponding geographic location in the Google Earth image and each analyst labeled the Google Earth pixel for each of the three categories: land cover (1 = urban, 2 = rural, 3 = forest and grassland, 4 = agriculture, 5 = water, or 6 = other); infrastructure (1 = present or 0 = absent); and economic activity (1 = commercial, 2 = industrial, 3 = residential, 4 = agriculture, or 5 = other). Final interpretation and label results for each point were achieved when the consistency of all analysts was over 4/6 (>67%). Otherwise, all the analysts discussed the disputable points until they reached an agreement or criterion for consistency. We then compared the Google Earth interpretations with the NTL labels. We assigned NTL labels using time series NTL data profiles, where a data profile is similar to a spectral signature, in which the x-axis of the curve is the year and the y-axis is the digital number of NTL data. After comparison with the Google Earth images, the NTL pixel was labeled either “success” where the data profile of the time series NTL data correctly matched the land cover/use, economic activity and infrastructural elements identified by the remote sensing analysts or “failure” where the data profile did not match with the Google Earth image interpretation (Figure 1).
The “success” pixels were further divided into two categories: “true positive” where the time series NTL profile correctly identified urbanization when any of the three components (land, economy, and population) is inferred as urban; and “true negative” where the time series NTL profile correctly identified the pixel as not urbanized. For these “true positive” pixels, we developed urbanization typologies through visualized interpretation of the NTL time series profiles. The “failures” refer to points where the NTL profiles did not match the labeled assigned by the remote sensing analysts. We further disaggregated failures into two types: “false positives”, where the analysts inferred urbanization from the NTL profile but not from the Google Earth images, and “false negatives”, where the analysts inferred urbanization from the Google Earth images but not from the NTL profile. For “false positives”, we also distinguished the failures induced by over-glow from those due to other reasons. Google Earth images were not available for some points for the final study year (2003). For these points, we used Google Earth images dated after 2003 as references when labeling the points. This temporal mismatch introduces uncertainty when labeling the “false negatives”. For example, “false negatives” may not be true errors if urbanization occurred between 2003 and the year of Google Earth image used for the assessment.

2.3. Quantitative Indicators

The numbers of “successes” and “failures” counted by regions and accuracy indicators are calculated correspondingly. In the field of remote sensing, producer’s and user’s accuracies and the Kappa coefficient are commonly used to measure the accuracy assessment of classified images [34]. In the field of medical statistics, sensitivity and specificity analyses are used to evaluate a clinical test, whereas positive and negative predictive values are used to consider the value of a test to a clinician [35,36]. These tests examine the nature of the errors and under what conditions certain errors are more likely than others. Clinical indicators interpret how well a test correctly identifies certain types of “successes” and “failures”. We adopt these measures from medical statistics and apply them to our remote sensing measures of accuracy in order to distinguish the types of errors and accuracies we obtain with the NTL profiles. Using these clinical indicator measures, we can interpret how well the NTL data correctly identify both urbanization and the absence of urbanization (Table 2) as well as spatially show the types of omission and commission that are likely. The parameter “1-sensitivity” is the probability of committing an error of omission, a Type II error, or false negative. The parameter “1-specificity” is the probability of committing an error of commission, a Type I error, or false positive.

3. Results and Discussion

3.1. Overall Accuracy

Our stratified random sampling scheme to select points, which stratify first by region and second by intervals of NTL data values in the end year of the study period, covers most types of urbanization in each world region. Moreover, there is a high degree of consistency in interpretation of the ground truth images and NTL profiles from the six remote sensing experts (Table 3). Among all sampling points, the six analysts disagreed on only 14 points (accounting for 6% of all sampling points).
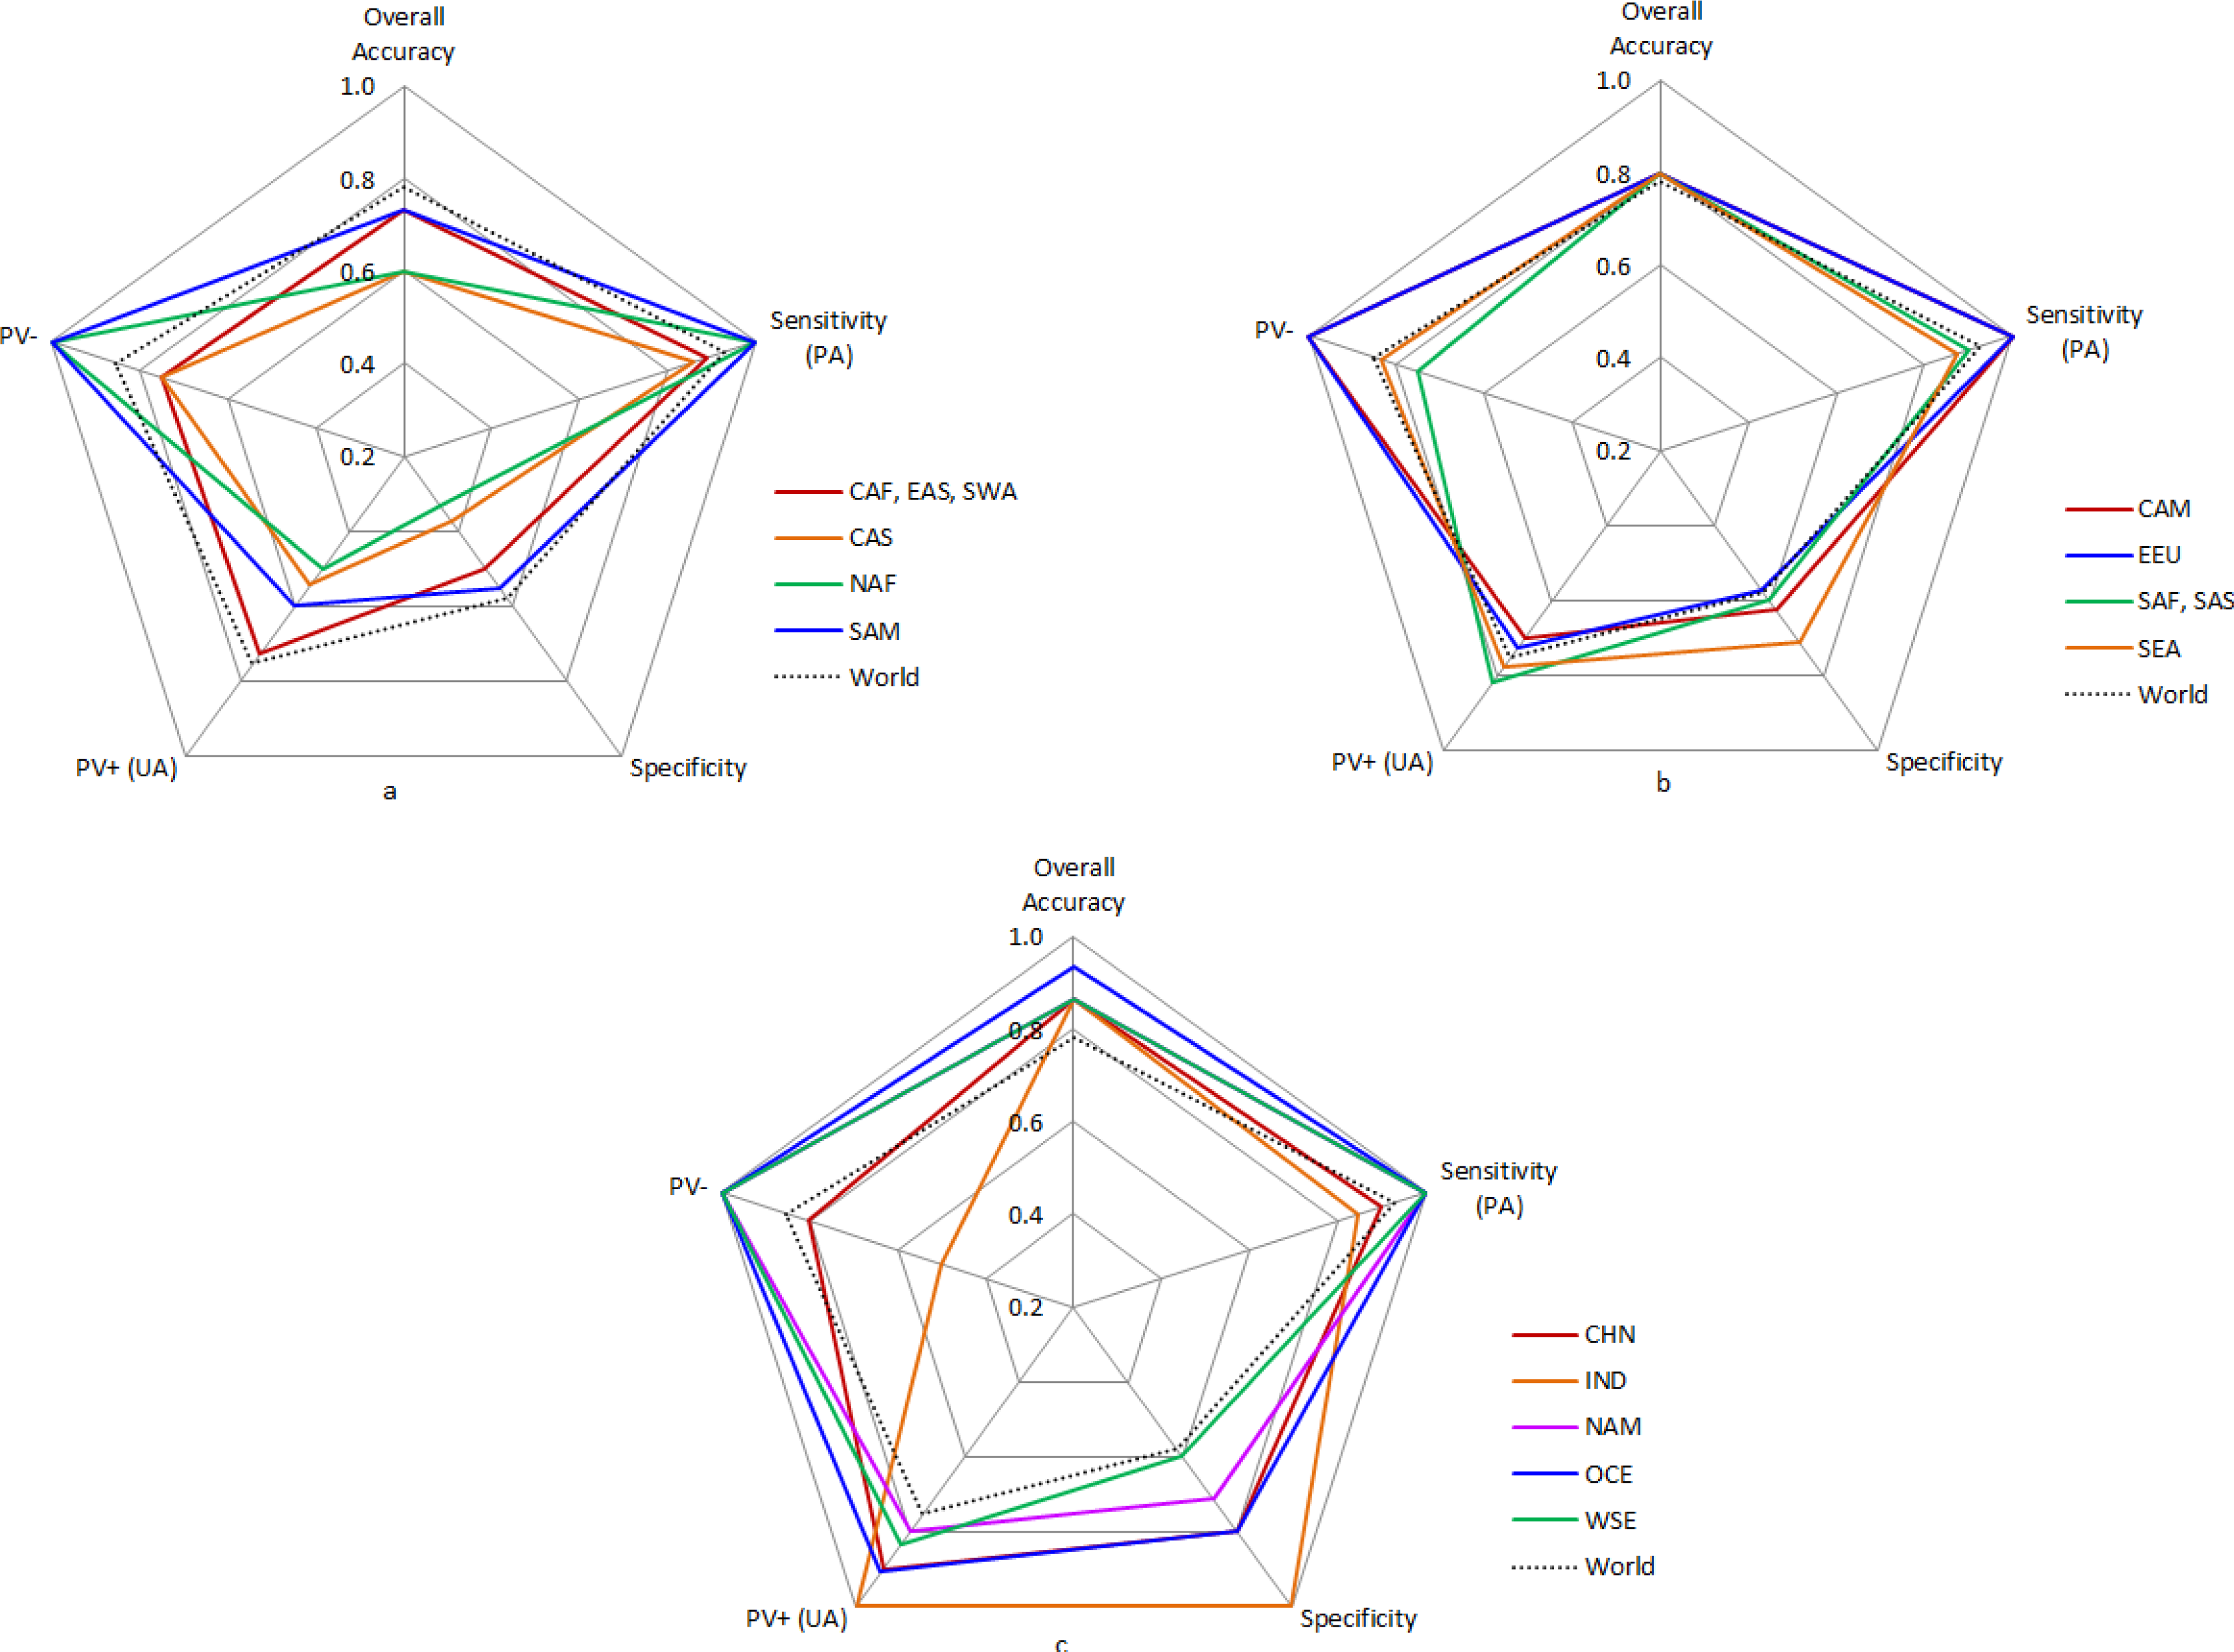
Based on the sample points around the world, the overall accuracy of time-series NTL data in identifying urbanization typologies is 78.3%. Most of the failures are false positives; these account for 80.8% of the total number of errors. The overall sensitivity of our sample is 0.93, with 130 true positives and 10 false negatives. The high overall sensitivity value indicates that if urbanization is identified from Google imagery, there is a high likelihood (93%) that we can infer urbanization from the NTL profile. The overall specificity of our sample is only 0.58, based on 42 false positives and 58 true negatives. This specificity value indicates that 42% of the time (1-specificity), an analyst will infer urbanization from a NTL profile when there is an absence of actual urbanization (as identified from Google Earth images). In other words, there is a 42% probability of a false positive. Furthermore, the predictive value for a positive result (PV+) of 0.76 indicates that if the NTL profile has urbanization-related signatures, there is a 76% likelihood that pixel experienced urbanization. The predictive value for a negative result (PV−) of 0.85 indicates that there is 85% likelihood that the pixel did not experience urbanization when the NTL profile suggests an absence of urbanization-related signature.
Together, these indicators provide an assessment of the utility of time series NTL data for identifying different types of global urbanization. The key insight from these indicators is that if a location experienced urbanization (as identified by the Google Earth images), an analyst will infer urbanization from the NTL data profile 93% of the time, similar to a producer’s accuracy. However, 42% of the time, urbanization will be incorrectly inferred from the NTL profiles when no urbanization occurred on the ground, similar to a user’s accuracy. In other words, nearly half of the time (42%), the NTL data profiles will have false positives, thus leading to an overestimation of urbanization.
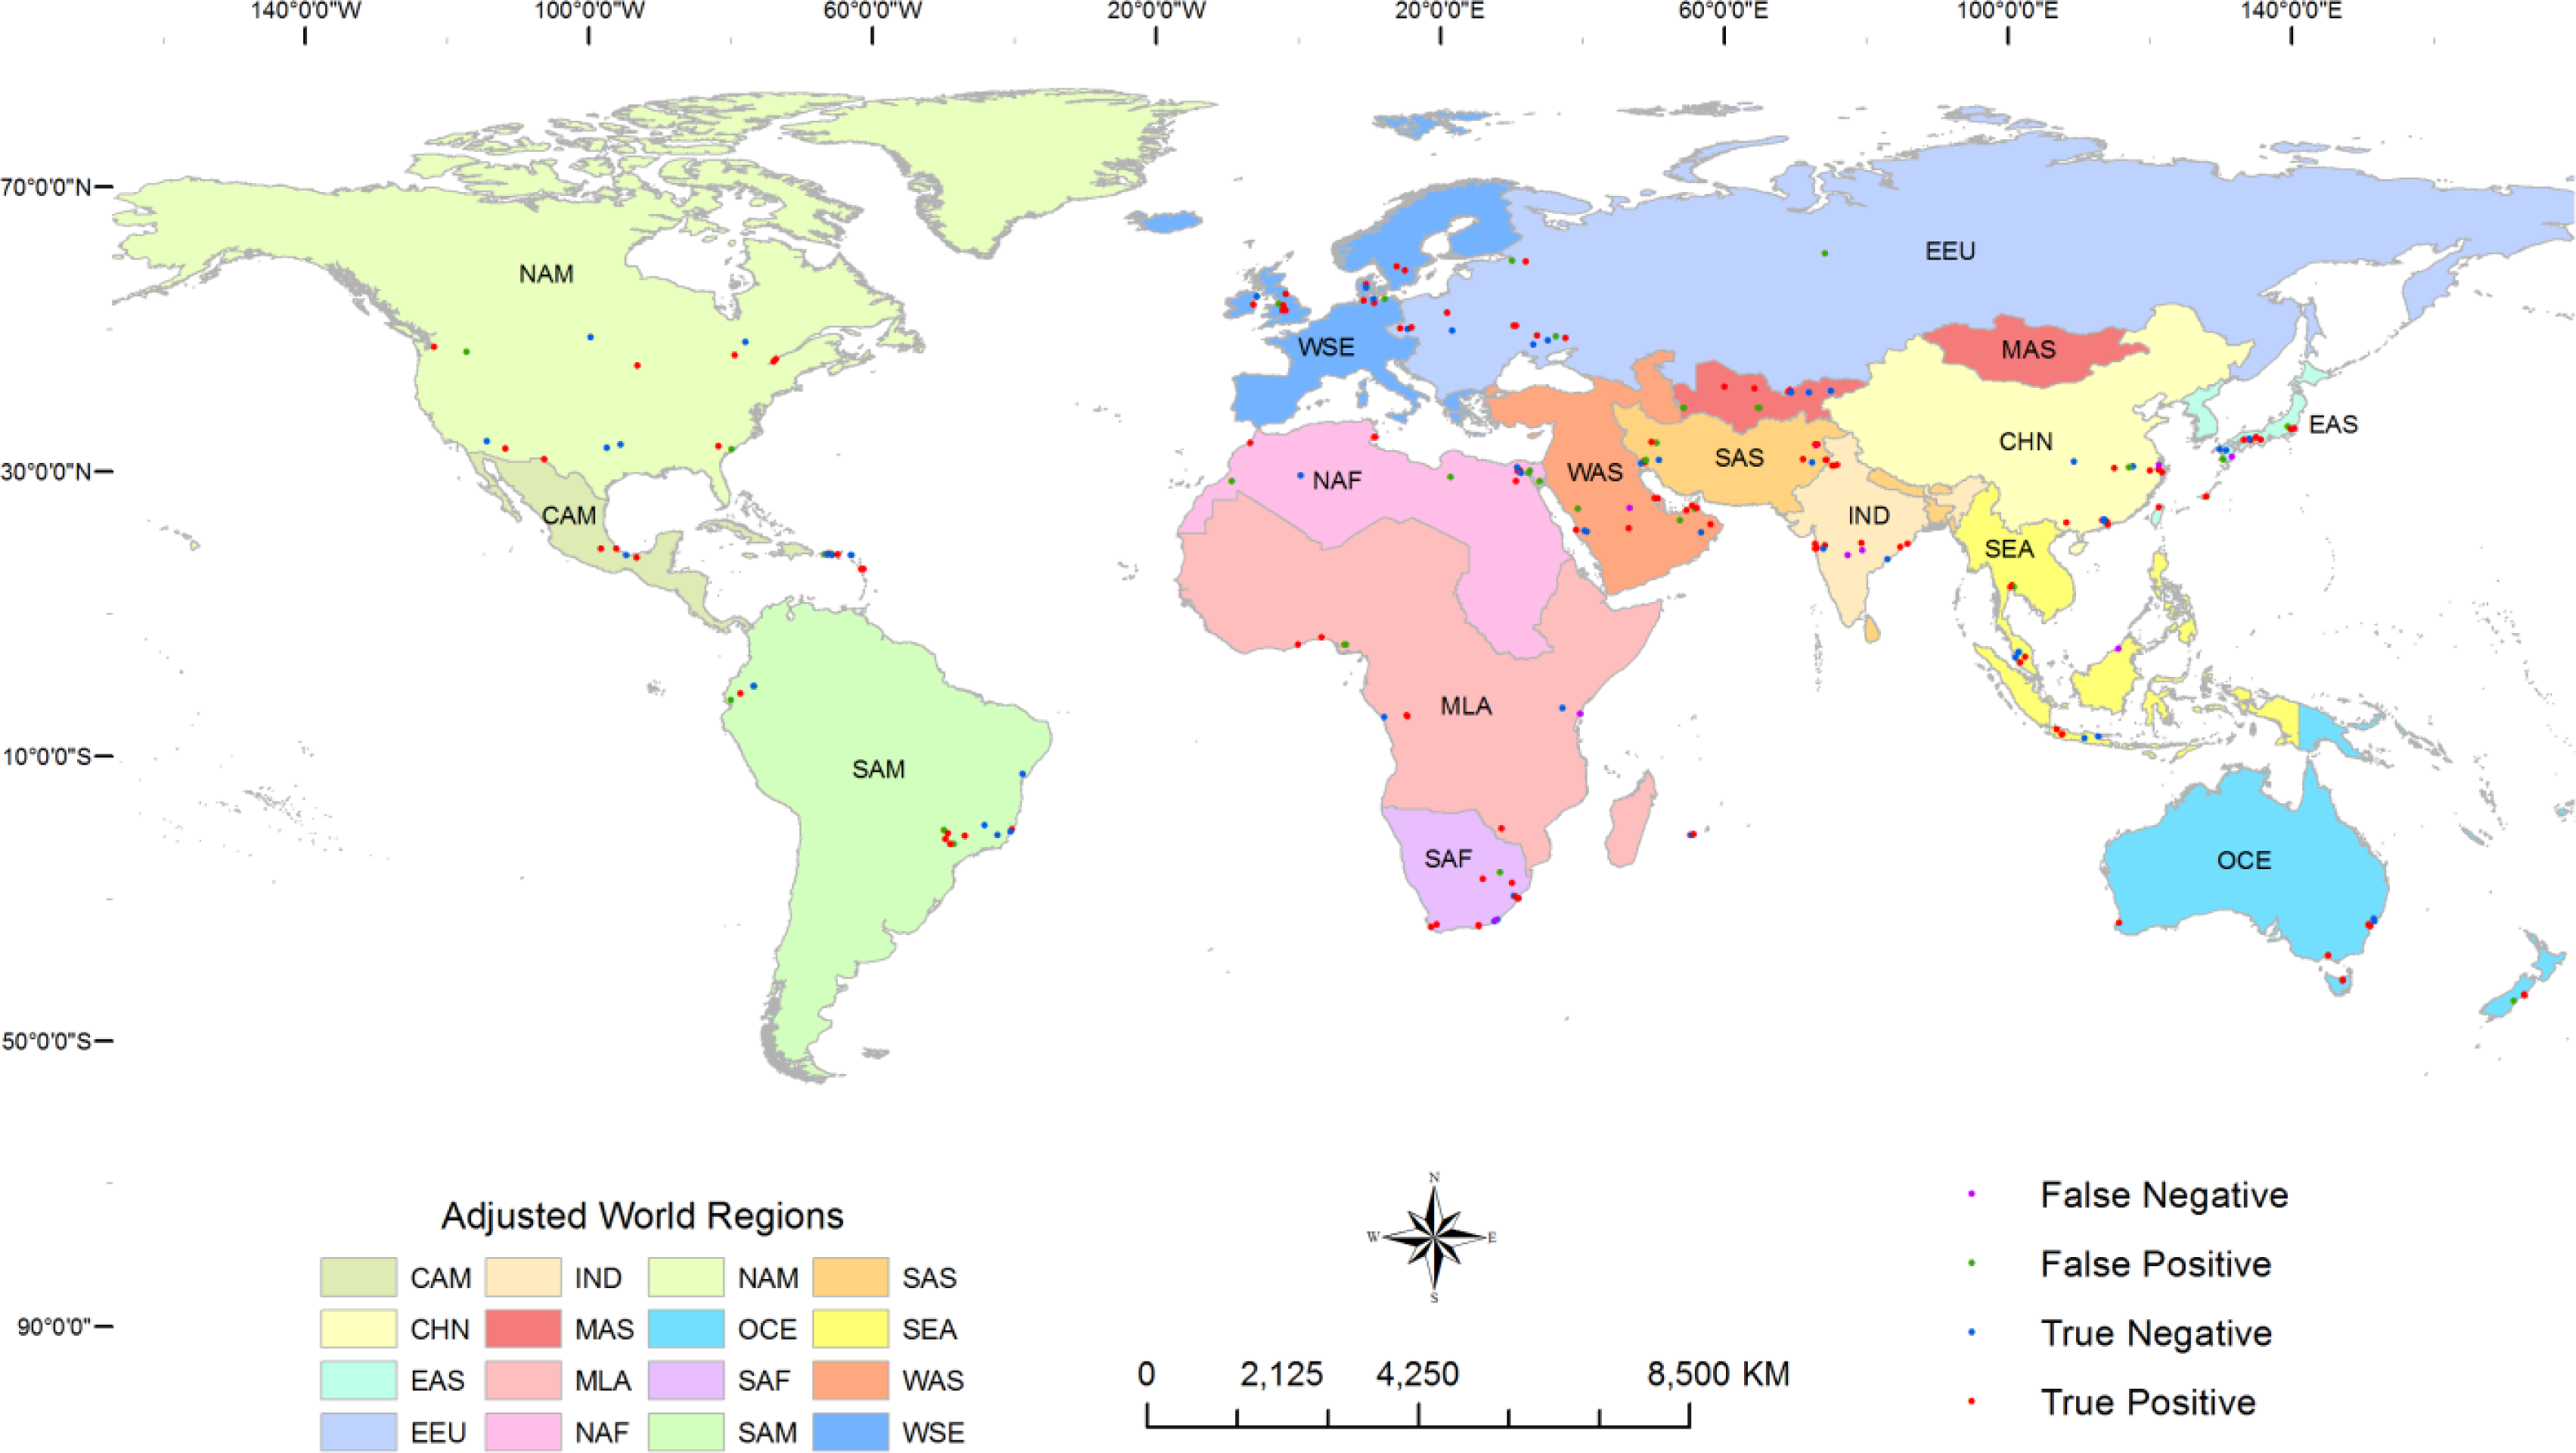
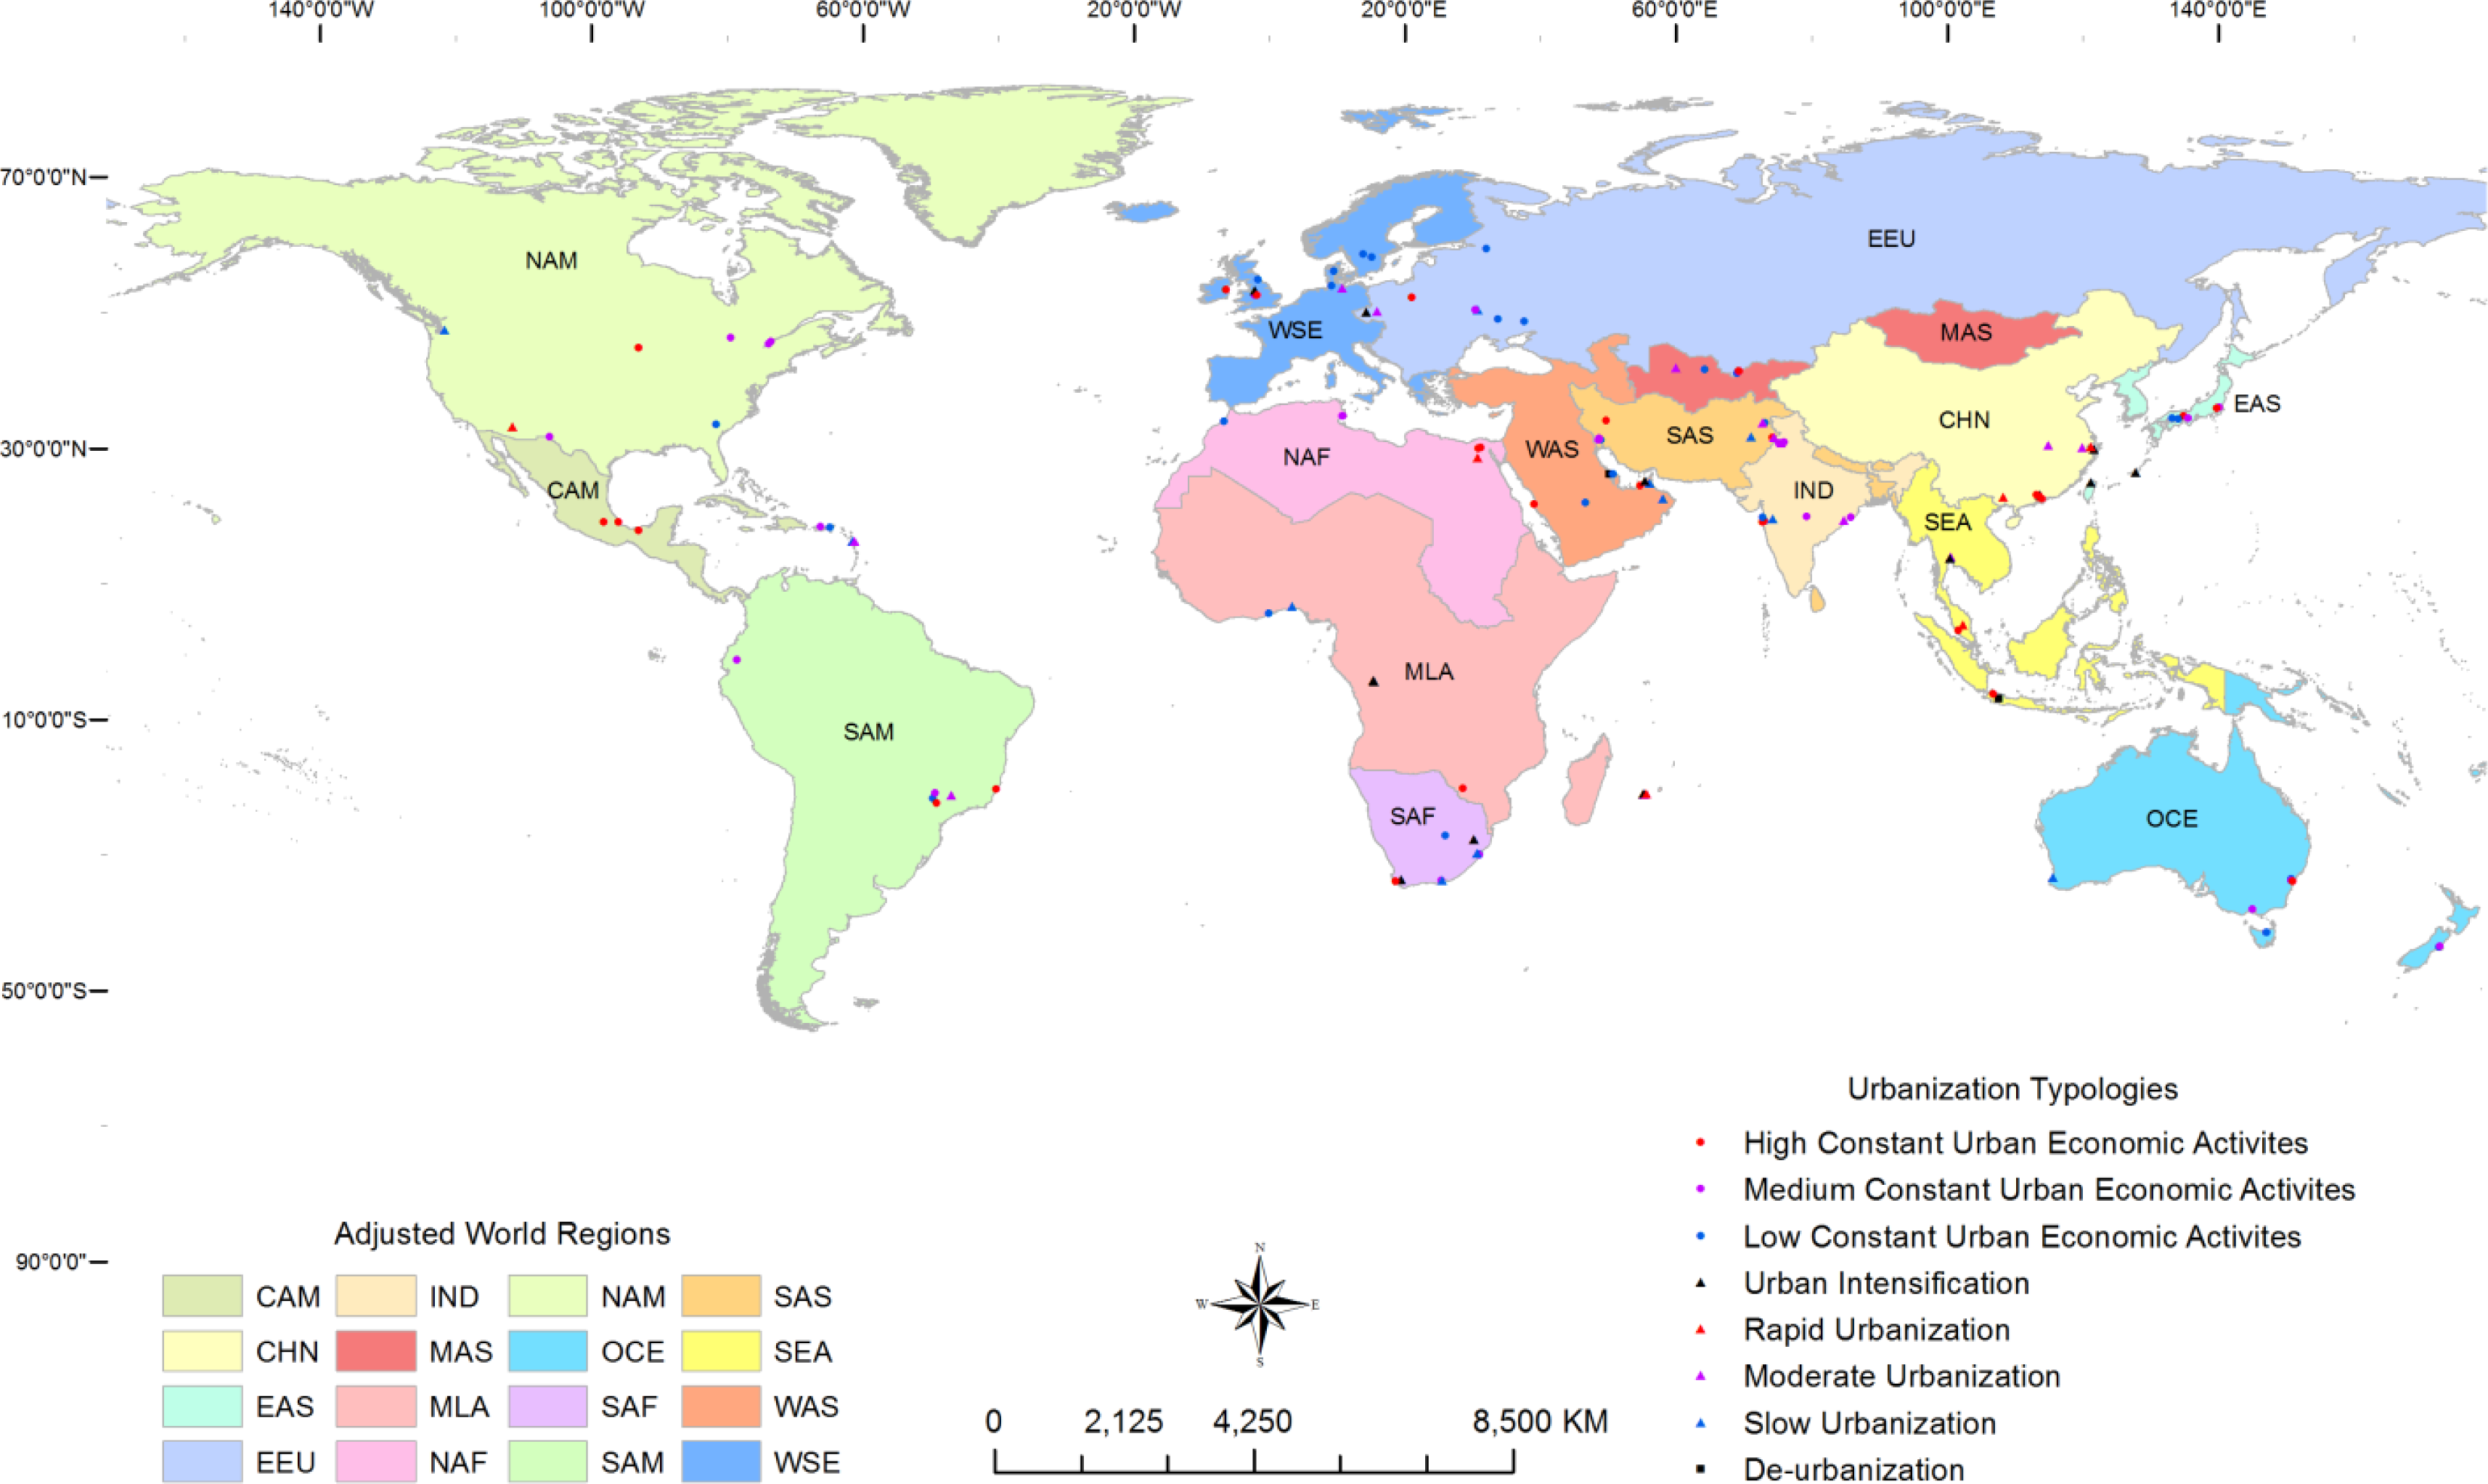
Next, we examine the underlying conditions (e.g., geography, type of urbanization) under which types of “successes” and “failures” were most likely to occur. This is a contribution to the scientific literature because previous studies did not quantify the conditions under which NTL data could identify urbanization. In order to do this, we divided the 16 regions into three groups based on the overall accuracy of each region compared with the overall world accuracy (Figure 3). The overall accuracies of groups a, b, and c are respectively below, near, and above the overall world accuracy. The values and occurrences of the four accuracy indexes (sensitivity, specificity, PV+, and PV−) vary by region. The spatial distributions of correctly and incorrectly identified sampling points also vary according to region (Figure 4). Based on the information presented in Figures 3 and 4, Oceania has the highest overall accuracy (93.3%), followed by Northern America, Western-Southern-Northern Europe, China, and India (86.7%) although they have different numbers of false positives and false negatives. This indicates that time series NTL data are successful in identifying urbanization in developed regions, such as Oceania, Northern America, and Western-Southern and Northern Europe, where there is greater density of lights in urban and peri-urban areas than in non-urban or rural areas. In contrast, the overall accuracies in Central Asia and Northern Africa are low (60%), suggesting that time series NTL data do a poor job in identifying urbanization in less developed regions. Our hypothesis is that urban activities are less correlated with intensity and density of illumination in less developed regions, resulting in lower accuracies compared with developed regions.

3.2. Successes: True Positives and True Negatives

The more urban-related activities dominate the pixel, the higher the likelihood that NTL profile correctly identifies it as being urbanized. That is, NTL data are better able to correctly identify urbanization for pixels that contain more urban-related features and activities on the ground than those that contain fewer such features and activities. All urban core areas with high-intensity urban economic activities and peri-urban areas are correctly identified with the NTL data profile. Compared with NTL data for a single year, time series NTL data provide an account of the process of urbanization and the speed of change over the study period. Consequently, urbanization processes such as urban intensification and de-urbanization, and the trajectories and relative speeds of urbanization, can be determined from time series NTL data profiles. Taken together, time series NTL data, acting as diagnostic “spectral” profiles, can be used to determine urbanization typologies for every pixel.
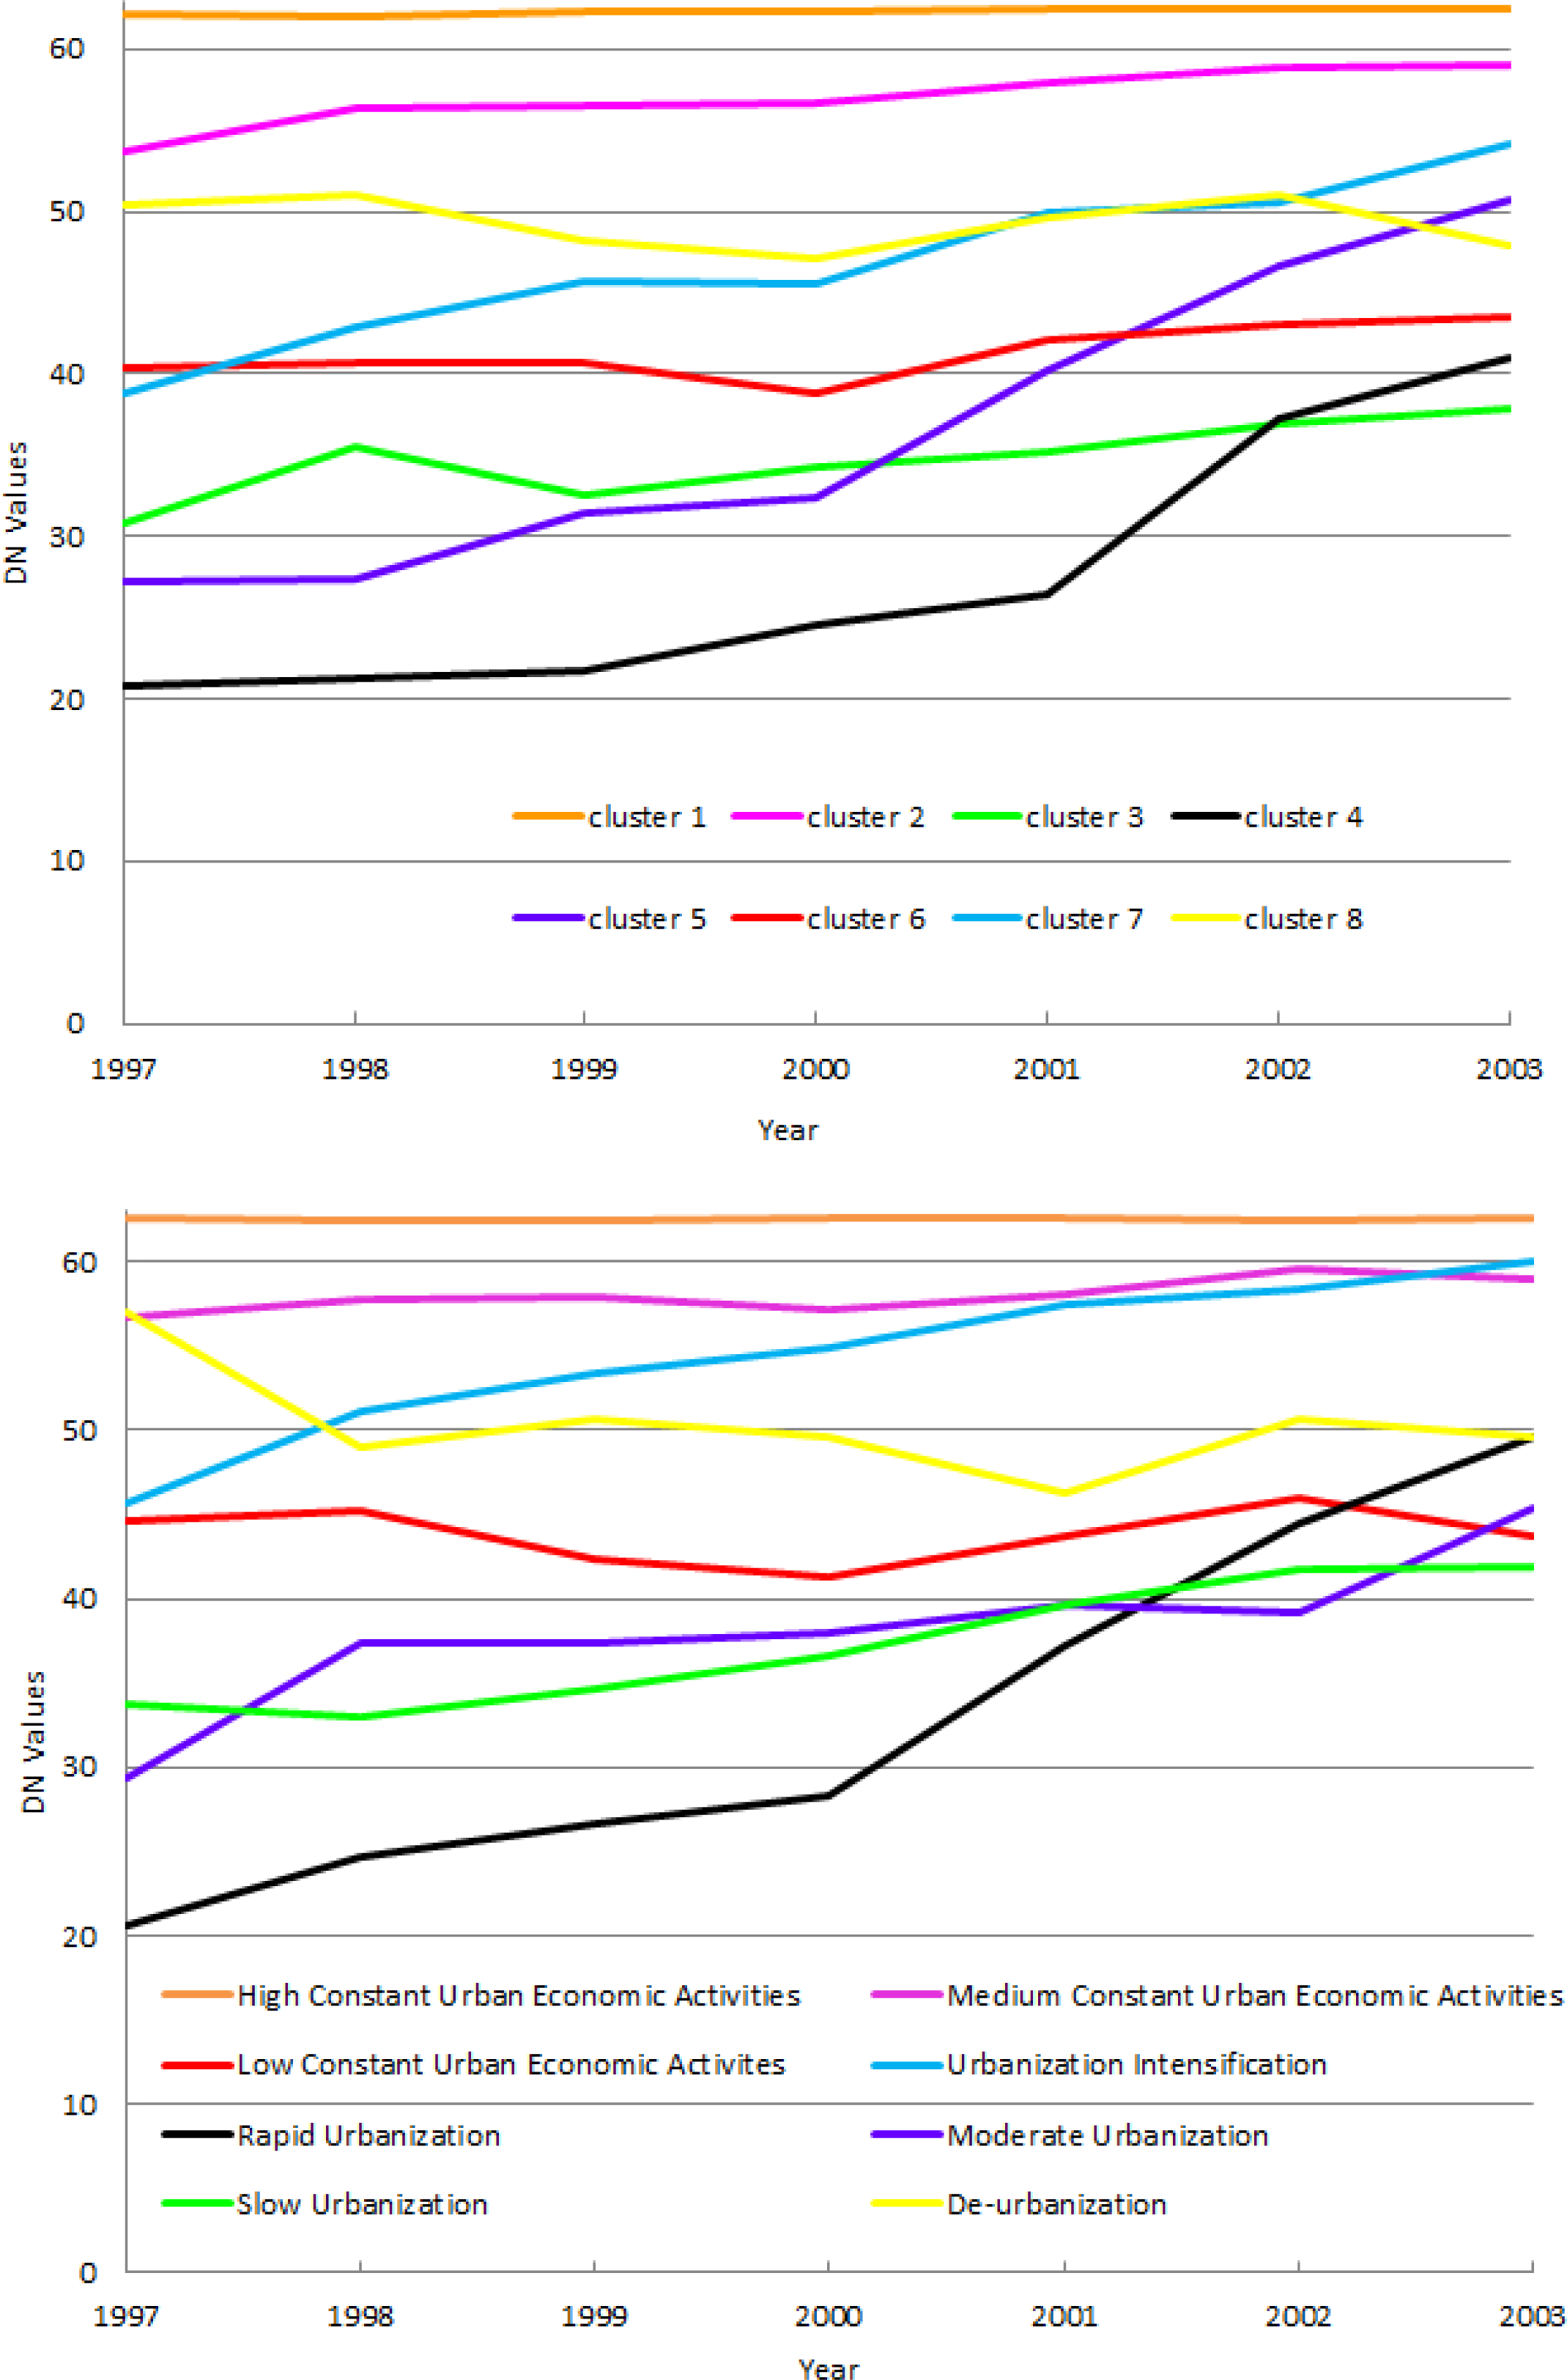
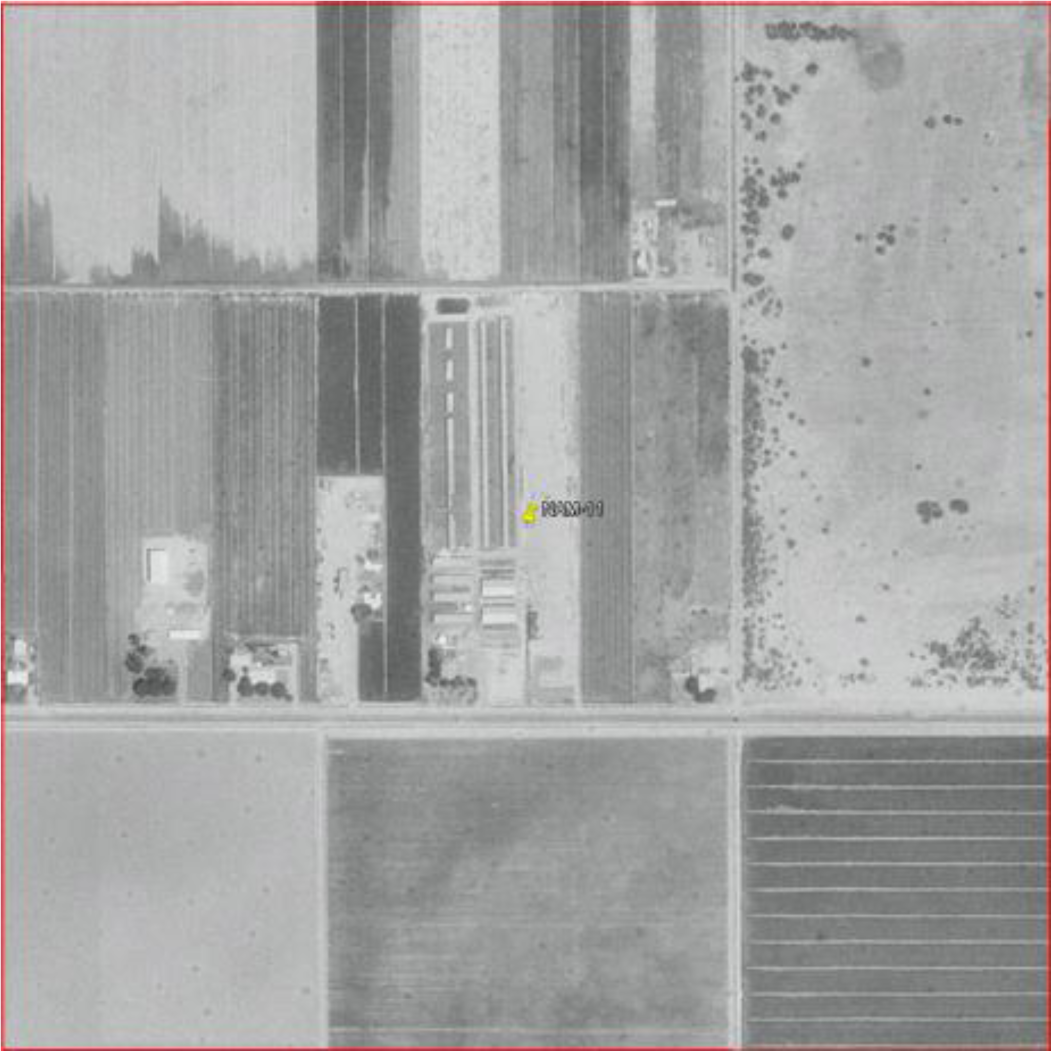
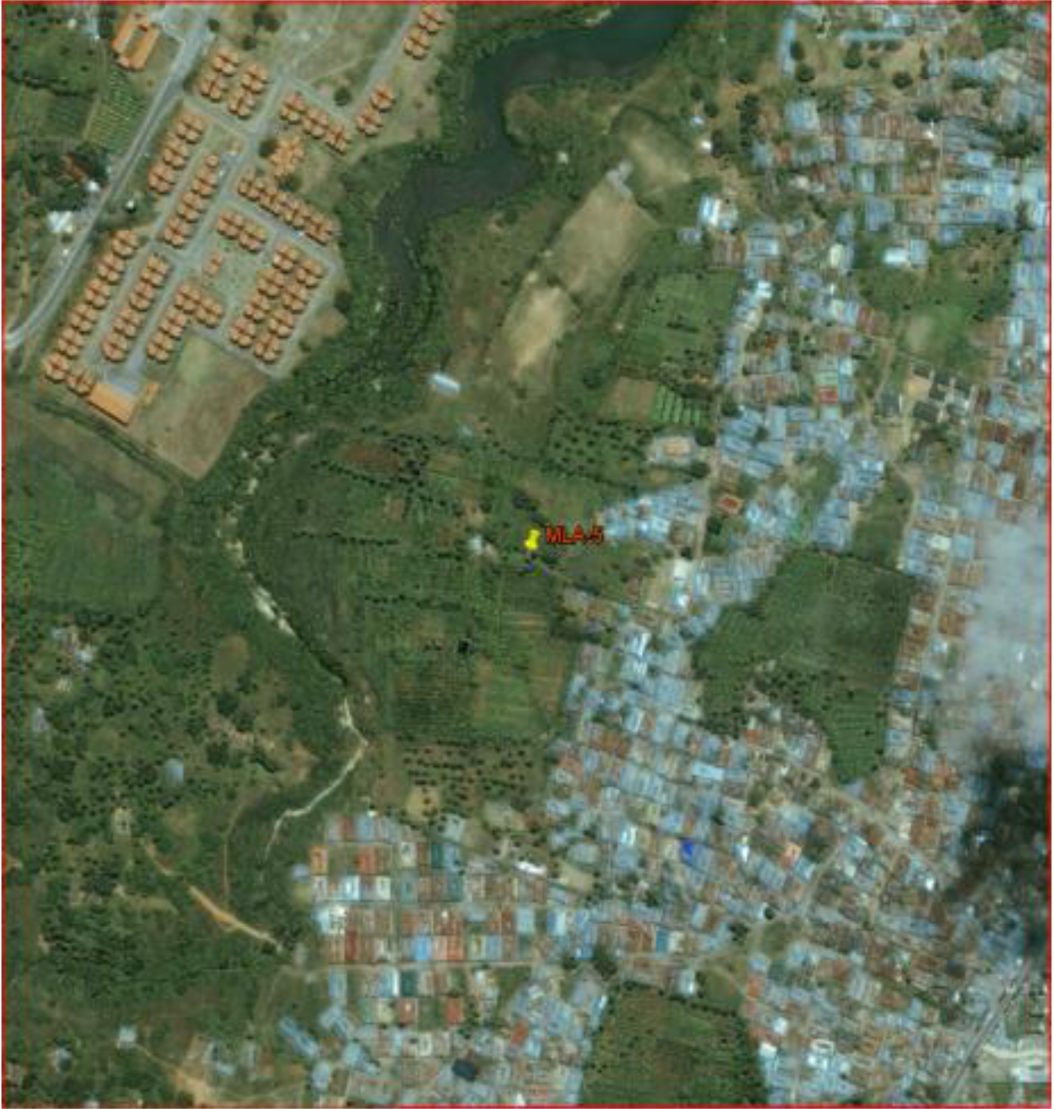
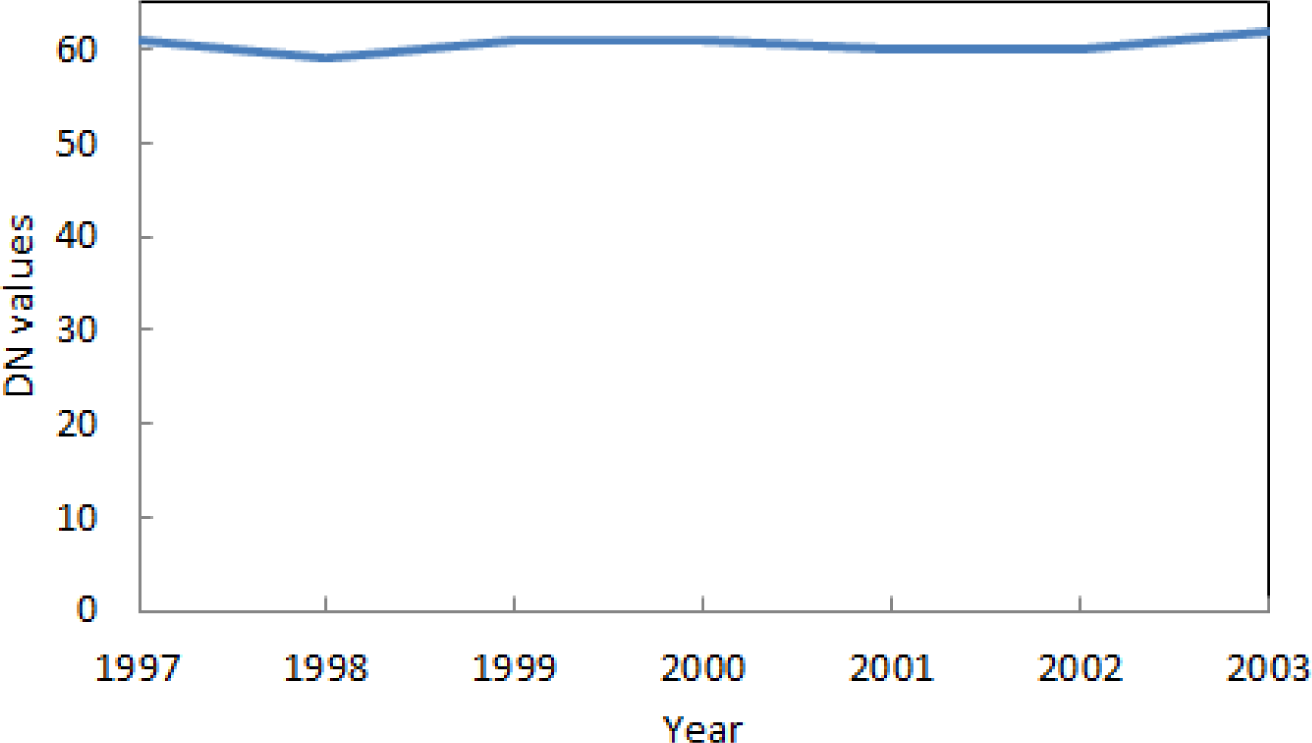
We took the true positives and further analyzed them by applying a two-step clustering method [37] which categorized the points into eight classes (Figure 5a). Using the clustering result, we examined the NTL data profiles and the Google Earth images of these true positive points and then adjusted their categories according to the similarities of data value ranges and shapes of curves. That is, the more similar the data value ranges and shapes of NTL curves, the more likely they will be grouped into the same category. Based on the profiles of the eight classes, we generated stylized urbanization typologies (Figure 5b). The stylized urbanization typologies include three constant levels of urban economic activity (high, medium, and low), four urbanization classes (urban intensification, rapid, moderate, and slow urbanization), and de-urbanization. Selected NTL data profiles and Google Earth images (Table 4) illustrate the example patterns found. All NTL data curves for constant urban economic activities are essentially smooth, and the ranges of NTL data values for these typologies occupy >60 for high levels of activity, 55–60 for medium, and 40–45 for low. These thresholds are only approximate, depend on the region and the type of economic activities, and may be adjusted to better reflect the urbanization realities on the ground. Urban intensification means that urban economic activities existed in the start year and increased to a higher intensity later in the study period. This intensification usually occurs in the urban core areas and peri-urban areas. NTL profiles for rapid, moderate, and slow urbanization exhibit an increasing trend but differ in their degree and speed of increase, and reflect the range of urbanization trajectories across the world. De-urbanization occurs when the intensity of urban activities reduces over time, and is characterized by declines in NTL data values over the study period.
Here we synthesized eight classes through visualized interpretation with the guidance from a cluster analysis (Figure 5b). However, this is only one way to generate the clusters. The number of unique urbanization typologies globally requires further study and is beyond the scope of this analysis. Testing of different clustering methods, such as the K-means algorithm, the iterative self-organizing data analysis technique (ISODATA), and the fuzzy c-means clustering algorithm (FCM), constitutes potential ways forward to obtain the minimum number of unique classes that maximizes the variation of the NTL dataset. Although our study assessed the utility of time series NTL data for identifying urbanization typologies without using an algorithm, this investigation represents the primary step towards understanding and distinguishing different urbanization typologies across different world regions.
Bearing in mind the number of correctly identified sample points (188), and taking a conservative approach to our conclusions, we summarized the general pattern of the spatial distribution of successes in identifying urbanization typologies (Table 5 and Figure 6). Constant urbanization (high, medium, and low) took place across all regions of the world but occurred more in some places and less in others. Urban intensification occurred in Southern Africa, Western-Middle-Eastern Africa, China, Eastern Asia, Southeastern Asia, and Western Asia. In contrast, of the 13 true positives in Western-Southern-Northern Europe, there was only one case of urbanization intensification, and none in either Northern America or Oceania. All types of urbanization (rapid, moderate, or slow) took place across the world. China’s urban growth is dominated by high constant urban economic activities, rapid and moderate urbanization, and urbanization intensification. In particular, one fourth of rapid and moderate urbanization (5 out of 20 points) occurred in China. This corroborates the characteristic of contemporary China’s urbanization: explicit and tremendous dynamics of land cover, infrastructure, and economic activities [38,39], which can be explicitly presented by NTL profiles.

3.3. Failures: False Positives and False Negatives

All regions have at least one type of failure. False positives and false negatives account for 80.8% and 19.2% of the total failures, respectively. Over-glow, which can be described as dim lighting detected from lights in surrounding areas through the scattering of lights in the atmosphere, is the major challenge of using time series NTL data to generate urbanization typologies, and 95% of false positive failures are due to over-glow from lights in surrounding areas of bright lighting.
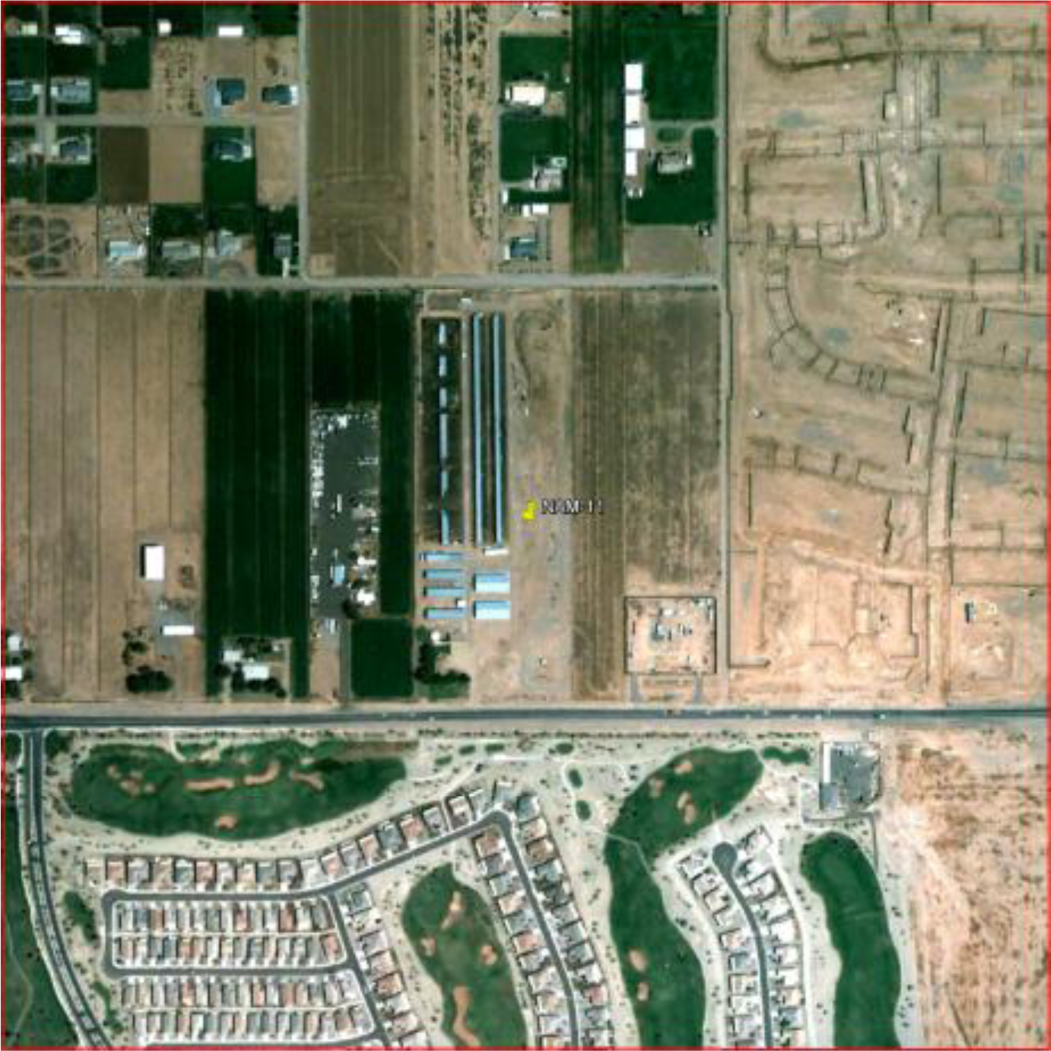
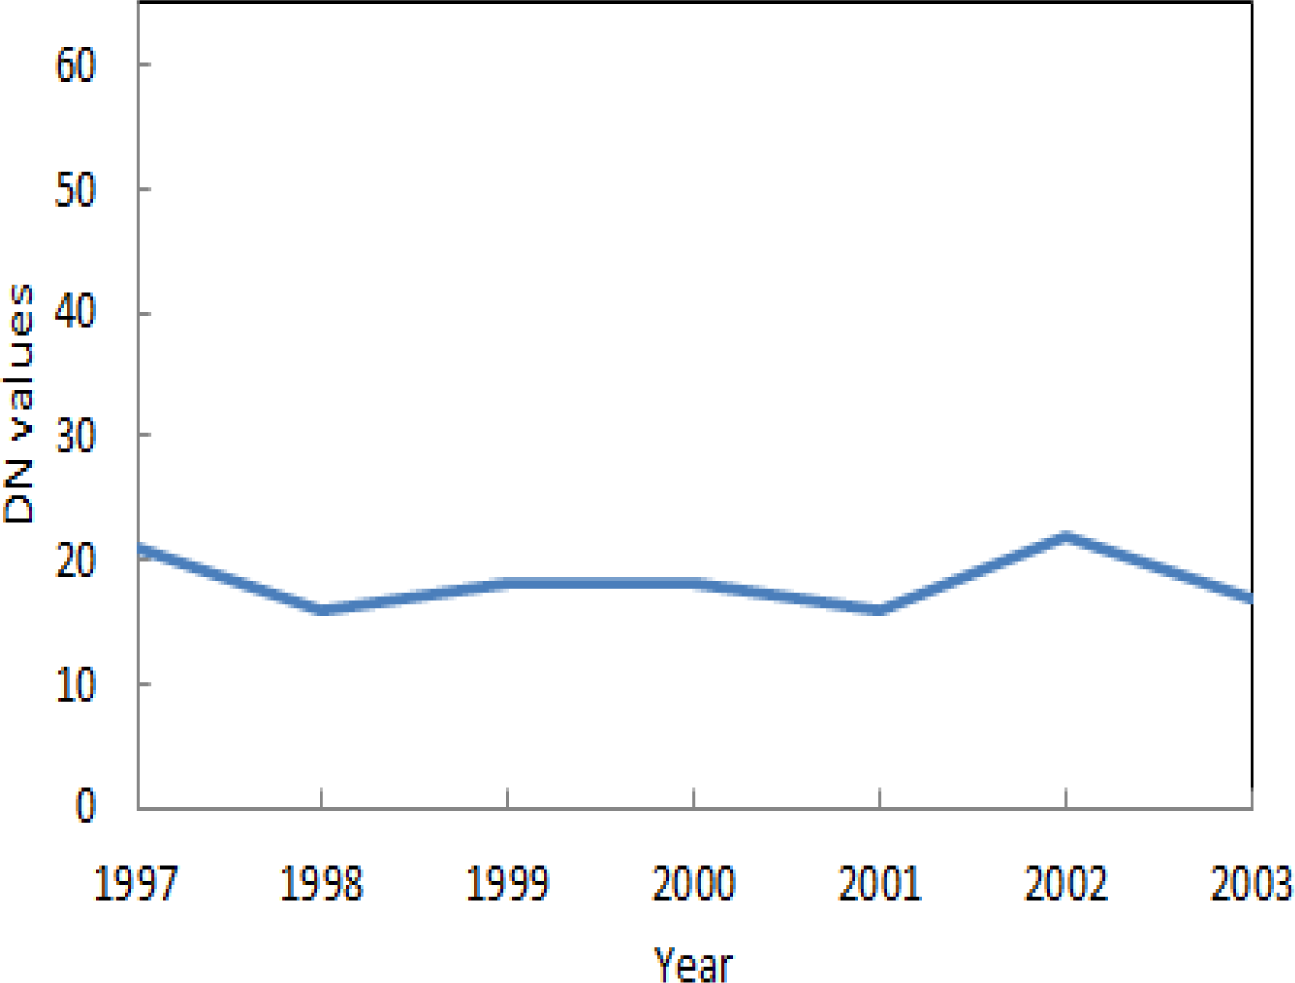
Examples of NTL data profiles and Google Earth images of false negatives and false positives illustrate the circumstances of these errors (Table 6). Analyzing all false positive points improved our understanding of the locations preferentially affected by over-glow. Topographic effects are evident, as fewer than 20% (8 of 42) of over-glow occurrences took place in mountainous areas. This is not only because mountainous areas have fewer lights, but also because flat, open areas are more affected by over-glow effects than mountainous areas. Also noteworthy is that not only do mega- or big cities cause over-glow, but some major traffic routes also contribute to over-glow in their surrounding areas.
One-fifth of the false negative failures took place in India. This not only accounts for 15% probability of committing an error of omission in this country, but also indicates highest likelihood (50%) among the 16 world regions that the pixel experiences urbanization when the NTL profile suggests an absence of urbanization-related signature. This confirms that the character of urbanization in India is different from that in China. One possible reason of false negatives errors is that the places have urban-related activities but with limited or no access to electric power [40]. India’s power shortage is prominent and has threatened urban and industrial growth in the country [41]. Of the 1.4 billion people of the world who have no access to electricity in the world, India accounts for over 21% [42,43]. For those in India who have access to electricity, supply is often both intermittent and unreliable. In contrast, there are no false negative failures in developed regions, such as Oceania, Northern America, and Western-Southern-Northern Europe (Figure 4). We hypothesize that in these highly industrialized regions, urban-related activities are strongly correlated with outdoor and street lighting. Consequently, NTL pixels that contain urban-related activities will always have high NTL profiles.
Our analysis shows that there are no false positives in India. This does not suggest that over-glow does not exist. False positives might exist beyond these sample points, as peri-urban areas are tightly connected to their urban areas, and these regions are characterized by relatively high densities of human settlements and infrastructure. Therefore, we count them as having urban-related activities, but in actuality they do not contain such activities. In contrast, false positives occurred more in less developed regions than in other regions, such as Northern Africa (6 out of 15) and Central Asia (5 out of 15). Examining the Google Earth images shows that these failures occurred in wide-open areas that lack infrastructure and human settlements within a 25 km2 area.

4. Conclusions

In this paper, we systematically examined the ability of NTL time series data to characterize urbanization and further analyzed cases of “successes” and “failures”. Our research fills an important knowledge gap by quantitatively assessing the ability of NTL data to characterize different types of urbanization.
First, accuracy assessment indicators provide a comprehensive picture of the utility of time series NTL data for identifying global urbanization typologies. The key insight is that there is a high likelihood (93%) that NTL time series will accurately identify these transitions in our global sample if urbanization occurred. This corroborates earlier studies that NTL data are successful at characterizing urbanization when urbanization actually occurred on the ground. We also found that 42% of the time, urbanization as inferred by the NTL data profile when no urbanization occurred, thus leading to an overestimation of urbanization.
Second, through examining the types of errors that were most likely to occur, the results indicate that most of the failures are false positives, accounting for 80.8% of the total errors, and that 95% of the false positives are due to over-glow from lights nearby, which is the major challenge of using time series NTL data to differentiate urbanization typologies. With well-calibrated and finer spatial resolution nighttime lights data, such as the new Visible Infrared Imaging Radiometer Suite (VIIRS) instrument, it may be possible to model, mitigate, and even remove over-glow using an atmospheric radiative transfer model. This would resolve a large percentage of the errors found in this study.
Third, the analysis identifies where and under what conditions the NTL data succeed or fail to characterize urbanization. The result illustrates that the more urban-related activities dominate a pixel, the higher the likelihood that NTL data correctly identify it as urbanized. It is worth mentioning that the study geographically shows the types of errors that are likely for the first time. There are no false negatives in developed regions, such as Oceania, Northern America, and Europe, and false positives are prevalent in developing regions, such as Northern Africa and Central Asia. Consequently, Oceania has the highest overall accuracy (93.3%), followed by Northern America, Western-Southern-Northern Europe, China, and India (86.7%) although they have different numbers of false positives and false negatives. These findings suggest that time series NTL data are successful in identifying urbanization in developed regions and do a comparatively poor job in less developed regions, suggesting the need to be cautious when using or interpreting NTL data in these areas.
Using time series NTL data (rather than single-year data) and treating them as continuous “spectral” profiles can improve the capability to identify trajectories of urbanization, because time series NTL data profiles represent the evolution of urban characteristics as captured by a single pixel through time. For this reason, generating consistent time series NTL data profiles will play a significant role in the study of the development of global urbanization typology over a longer period (1992 to present). After several years of data of acquisition, it will be possible to conduct a similar and comparative study on the newly available data from the VIIRS instrument, which continues the low light imaging measurements of the OLS, with substantial improvements in calibration, spatial resolution and levels of quantification.

Acknowledgments

This research was supported by NASA grant NNX11AE88G. We thank Michail Fragkias, Qingling Zhang, Peter Christensen, Mahesh Ramachandran and Li Jiang for their assistance with the remote sensing analysis and constructive comments on earlier drafts, and Bill Solecki and Peter Marcotullio for discussions on urban typologies. We especially thank Lindsi Seegmiller whose suggestions helped to improve the clarity of the manuscript.

Conflict of Interest

The authors declare no conflict of interest.

References

  1. Batty, M. The size, scale, and shape of cities. Science 2008, 319, 769–771. [Google Scholar]
  2. Lankao, P.R.; Nychka, D.; Tribbia, J.L. Development and greenhouse gas emissions deviate from the “modernization” theory and “convergence” hypothesis. Clim. Res 2008, 38, 17–29. [Google Scholar]
  3. Mumford, L. The City in History: Its Origins, Its Transformations, and Its Prospects; Harcourt, Brace & World: New York, NY, USA, 1961; p. 794. [Google Scholar]
  4. Montgomery, M.R.; Stren, R.; Cohen, B.; Reed, H.E. Cities Transformed: Demographic Change and Its Implications in the Developing World; The National Academies Press: Washington, DC, USA, 2003; p. 552. [Google Scholar]
  5. Weber, M. The City; Free Press: New York, NY, USA, 1966; p. 252. [Google Scholar]
  6. Davis, J.C.; Henderson, J.V. Evidence on the political economy of the urbanization process. J. Urban Econ 2003, 53, 98–125. [Google Scholar]
  7. Henderson, V. The urbanization process and economic growth: The so-what question. J. Econ. Growth 2003, 8, 47–71. [Google Scholar]
  8. Schneider, A.; Friedl, M.A.; Potere, D. A new map of global urban extent from modis satellite data. Environ. Res. Lett 2009, 4, 044003. [Google Scholar]
  9. Seto, K.C.; Fragkias, M.; Güneralp, B.; Reilly, M.K. A meta-analysis of global urban land expansion. PLoS One 2011, 6, e23777. [Google Scholar]
  10. Baugh, K.; Elvidge, C.; Ghosh, T.; Ziskin, D. Development of a 2009 Stable Lights Product Using DMSP-OLS Data. Proceedings of the 30th Asia-Pacific Advanced Network Meeting, Hanoi, Vietnam, 9–10 August 2010; pp. 114–130.
  11. Chen, X.; Nordhaus, W.D. Using luminosity data as a proxy for economic statistics. Proc. Natl. Acad. Sci. USA 2011, 108, 8589–8594. [Google Scholar]
  12. Henderson, J.V.; Storeygard, A.; Weil, D.N. Measuring economic growth from outer space. Am. Econ. Rev 2012, 102, 994–1028. [Google Scholar]
  13. Sutton, P.C.; Elvidge, C.D.; Ghosh, T. Estimation of gross domestic product at sub-national scales using nighttime satellite imagery. Int. J. Ecol. Econ. Stat 2007, 8, 5–21. [Google Scholar]
  14. Sutton, P.; Roberts, D.; Elvidge, C.; Baugh, K. Census from heaven: An estimate of the global human population using night-time satellite imagery. Int. J. Remote Sens 2001, 22, 3061–3076. [Google Scholar]
  15. Sutton, P.C.; Elvidge, C.; Obremski, T. Building and evaluating models to estimate ambient population density. Photogramm. Eng. Remote Sensing 2003, 69, 545–553. [Google Scholar]
  16. Zhuo, L.; Ichinose, T.; Zheng, J.; Chen, J.; Shi, P.J.; Li, X. Modelling the population density of china at the pixel level based on DMSP/OLS non–radiance–calibrated night-time light images. Int. J. Remote Sens 2009, 30, 1003–1018. [Google Scholar]
  17. Elvidge, C.D.; Imhoff, M.L.; Baugh, K.E.; Hobson, V.R.; Nelson, I.; Safran, J.; Dietz, J.B.; Tuttle, B.T. Night-time lights of the world: 1994–1995. ISPRS J. Photogramm 2001, 56, 81–99. [Google Scholar]
  18. Elvidge, C.D.; Tuttle, B.T.; Sutton, P.C.; Baugh, K.E.; Howard, A.T.; Milesi, C.; Bhaduri, B.; Nemani, R. Global distribution and density of constructed impervious surfaces. Sensors 2007, 7, 1962–1979. [Google Scholar]
  19. Lu, D.; Tian, H.; Zhou, G.; Ge, H. Regional mapping of human settlements in Southeastern China with multisensor remotely sensed data. Remote Sens. Environ 2008, 112, 3668–3679. [Google Scholar]
  20. Ma, T.; Zhou, C.; Pei, T.; Haynie, S.; Fan, J. Quantitative estimation of urbanization dynamics using time series of dmsp/ols nighttime light data: A comparative case study from China’s cities. Remote Sens. Environ 2012, 124, 99–107. [Google Scholar]
  21. Elvidge, C.; Safran, J.; Nelson, I.; Tuttle, B.; Ruth Hobson, V.; Baugh, K.; Dietz, J.; Erwin, E. Area and Positional Accuracy of Dmsp Nighttime Lights Data. In Remote Sensing and GIS Accuracy Assessment; Lunetta, R., Lyon, J., Eds.; CRC Press: Boca Raton, FL, USA, 2004; pp. 281–292. [Google Scholar]
  22. Henderson, M.; Yeh, E.T.; Gong, P.; Elvidge, C.; Baugh, K. Validation of urban boundaries derived from global night-time satellite imagery. Int. J. Remote Sens 2003, 24, 595–609. [Google Scholar]
  23. Levin, N.; Duke, Y. High spatial resolution night-time light images for demographic and socio-economic studies. Remote Sens. Environ 2012, 119, 1–10. [Google Scholar]
  24. Small, C.; Elvidge, C.D.; Balk, D.; Montgomery, M. Spatial scaling of stable night lights. Remote Sens. Environ 2011, 115, 269–280. [Google Scholar]
  25. Small, C.; Pozzi, F.; Elvidge, C.D. Spatial analysis of global urban extent from DMSP-OLS night lights. Remote Sens. Environ 2005, 96, 277–291. [Google Scholar]
  26. Tuttle, B.T.; Anderson, S.J.; Sutton, P.C.; Elvidge, C.D.; Kim, B. It used to be dark here: Geolocation calibration of the defense meteorological satellite program operational linescan system. Photogramm. Eng. Remote Sensing 2013, 79, 287–297. [Google Scholar]
  27. Liu, Z.; He, C.; Zhang, Q.; Huang, Q.; Yang, Y. Extracting the dynamics of urban expansion in china using DMSP-OLS nighttime light data from 1992 to 2008. Landsc. Urban Plan 2012, 106, 62–72. [Google Scholar]
  28. Small, C.; Elvidge, C.D. Night on earth: Mapping decadal changes of anthropogenic night light in asia. Int. J. Appl. Earth Observ. Geoinf 2013, 22, 40–52. [Google Scholar]
  29. Zhang, Q.; Seto, K.C. Mapping urbanization dynamics at regional and global scales using multi-temporal dmsp/ols nighttime light data. Remote Sens. Environ 2011, 115, 2320–2329. [Google Scholar]
  30. Sutton, P.C.; Taylor, M.J.; Anderson, S.; Elvidge, C.D. Sociodemographic Characterization of Urban Areas Using Nighttime Imagery, Google Earth, Landsat, and “Social” Ground Truthing in Urban Remote Sensing. In Urban Remote Sensing; Weng, Q., Quattrochi, D.A., Eds.; CRC Press: Boca Raton, FL, USA, 2007; pp. 291–310. [Google Scholar]
  31. Version 4 DMSP-OLS Nighttime Lights Time Series. Available online: http://www.ngdc.noaa.gov/eog/dmsp/downloadV4composites.html (accessed on 29 March 2013).
  32. Elvidge, C.D.; Ziskin, D.; Baugh, K.E.; Tuttle, B.T.; Ghosh, T.; Pack, D.W.; Erwin, E.H.; Zhizhin, M. A fifteen year record of global natural gas flaring derived from satellite data. Energies 2009, 2, 595–622. [Google Scholar]
  33. Seto, K.C.; Güneralp, B.; Hutyra, L.R. Global forecasts of urban expansion to 2030 and direct impacts on biodiversity and carbon pools. Proc. Natl. Acad. Sci. USA 2012, 109, 16083–16088. [Google Scholar]
  34. Congalton, R.G. A review of assessing the accuracy of classifications of remotely sensed data. Remote Sens. Environ 1991, 37, 35–46. [Google Scholar]
  35. Bland, M. An Introduction to Medical Statistics, 3rd ed.; Oxford University Press: Oxford, UK, 2000; p. 405. [Google Scholar]
  36. Lalkhen, A.G.; McCluskey, A. Clinical tests: Sensitivity and specificity. Contin. Educ. Anaesth. Crit. Care Pain 2008, 8, 221–223. [Google Scholar]
  37. Hastie, T.; Tibshirani, R.; Friedman, J.H. The Elements of Statistical Learning; Springer: New York, NY, USA, 2003; p. 552. [Google Scholar]
  38. Liu, J.; Liu, M.; Zhuang, D.; Zhang, Z.; Deng, X. Study on spatial pattern of land-use change in china during 1995–2000. Sci. China Ser. D-Earth Sci 2003, 46, 373–384. [Google Scholar]
  39. Liu, J.; Tian, H.; Liu, M.; Zhuang, D.; Melillo, J.M.; Zhang, Z. China’s changing landscape during the 1990s: Large-scale land transformations estimated with satellite data. Geophys. Res. Lett 2005, 32, L02405. [Google Scholar]
  40. Elvidge, C.D.; Baugh, K.E.; Sutton, P.C.; Bhaduri, B.; Tuttle, B.T.; Ghosh, T.; Ziskin, D.; Erwin, E.H. Who’s in the Dark—Satellite Based Estimates of Electrification Rates. In Urban Remote Sensing; Yang, X., Ed.; John Wiley & Sons, Ltd: Chichester, UK, 2011; pp. 211–224. [Google Scholar]
  41. Yep, E. Power problems threaten growth in India. The Wall Street Journal, 3 January 2012. [Google Scholar]
  42. Agency, I.E. World Energy Outlook 2011: Energy for All; International Energy Agency (IEA): Paris, France, 2011. [Google Scholar]
  43. Remme, U.; Trudeau, N.; Graczyk, D.; Taylor, P. Technology Development Prospects for the Indian Power Sector; International Energy Agency (IEA): Paris, France, 2011. [Google Scholar]
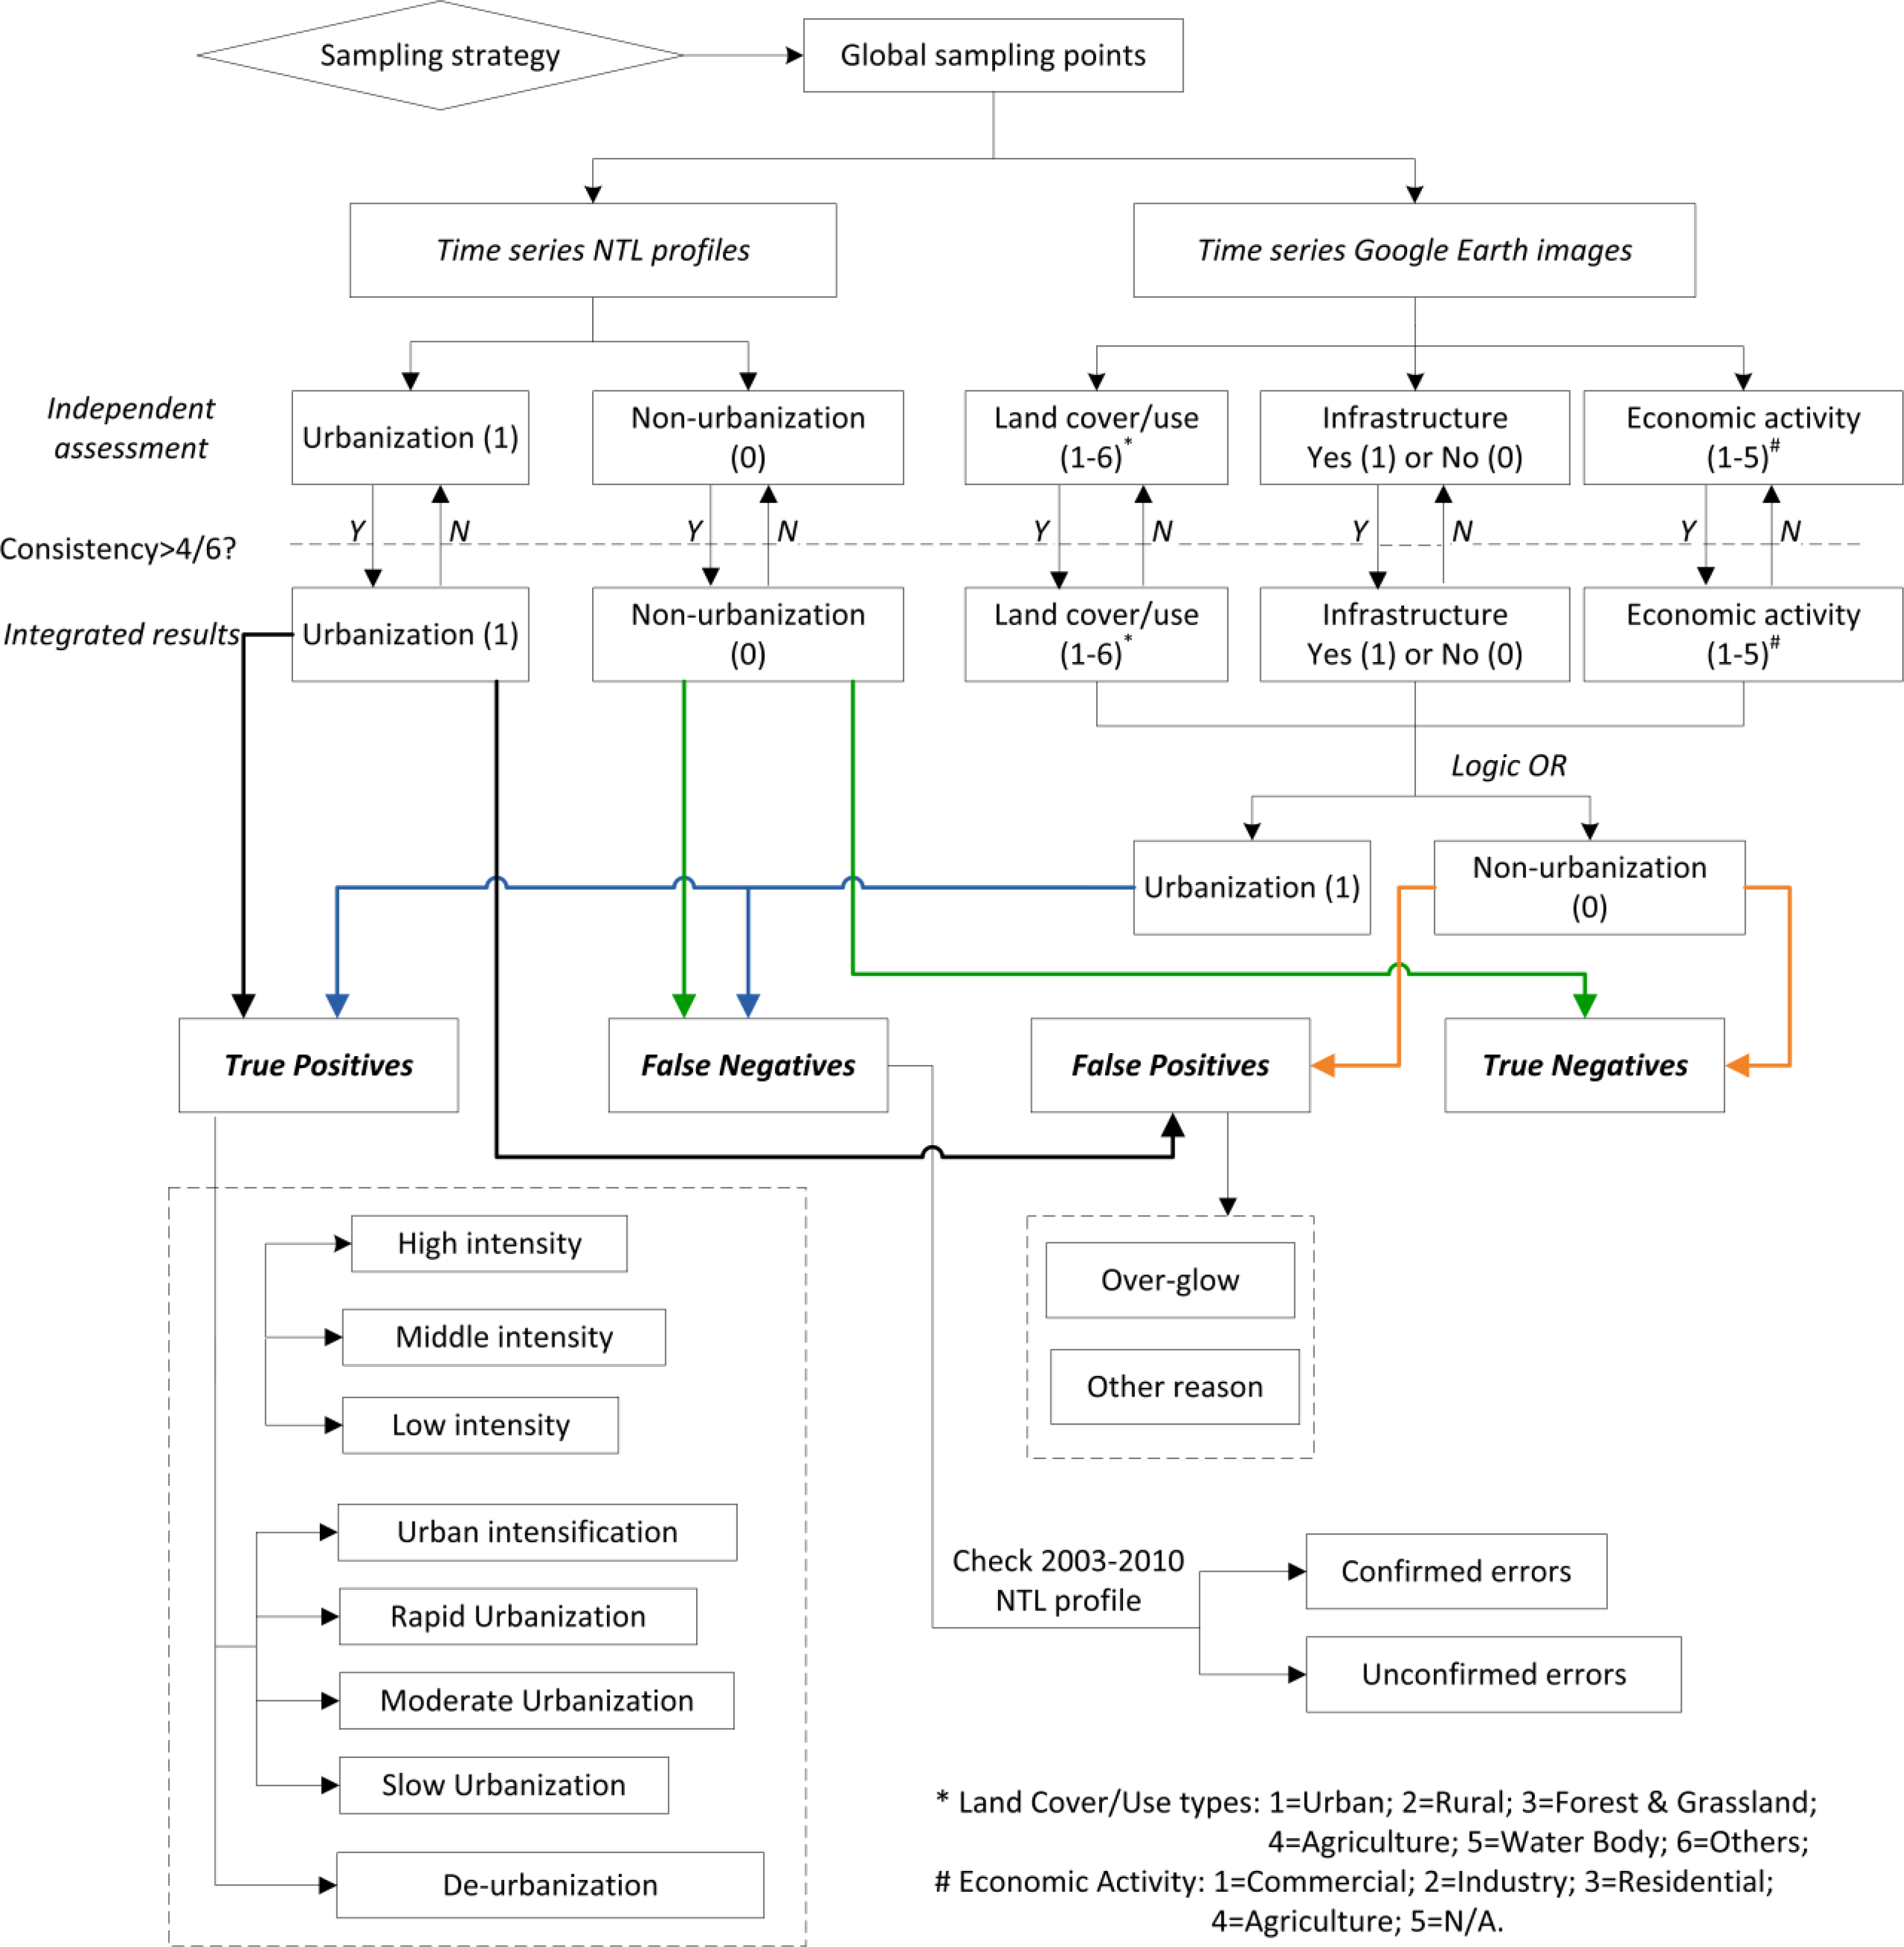
Figure 1. Overall structure and analytical procedures of the study.
Remotesensing 05 03476f1
Figure 2. (a) Non-zero pixels as percentage of total pixels worldwide; (b) Non-zero pixels at 10-unit intervals of digit number as percentage of total non-zero night-time light (NTL) pixels. Region abbreviations are defined in Table 1.
Remotesensing 05 03476f2
Figure 3. Radar maps of accuracy assessment results for each region. Region abbreviations are defined in Table 1.
Remotesensing 05 03476f3
Figure 4. Spatial distribution of successes and failures. Region abbreviations are defined in Table 1.
Remotesensing 05 03476f4
Figure 5. (a) Clustering of true positive points; and (b) visualized interpreted urbanization typologies.
Remotesensing 05 03476f5
Figure 6. Spatial pattern of successfully identified urbanization typologies based on the presented results. Region abbreviations are defined in Table 1.
Remotesensing 05 03476f6
Table 1. Composition of regions used in this study, adapted from Seto et al. [33]
RegionAbbreviationIncluded UN RegionsPlusMinus
Central AmericaCAMCentral America, Caribbean
ChinaCHNChina, Hong Kong, Macao
Eastern AsiaEASEastern AsiaTaiwanChina, Hong Kong, Macao, Mongolia
Eastern EuropeEEUEastern EuropeKazakhstan, Estonia, Lithuania, Latvia, Albania, Bosnia-Herzegovina, Croatia, Macedonia, Montenegro, Serbia
IndiaINDIndia
Mid-AsiaMASCentral AsiaMongoliaKazakhstan
Mid-Latitudinal AfricaMLAWestern, Middle, Eastern Africa
Northern AfricaNAFNorthern Africa
Northern AmericaNAMNorthern America
OceaniaOCEOceania
Southern AfricaSAFSouthern Africa
South AmericaSAMSouthern America
Southern AsiaSASSouthern AsiaIndia
Southeastern AsiaSEASoutheastern Asia
Western AsiaWASWestern Asia
Western EuropeWSEWestern, Southern, and Northern EuropeEstonia, Lithuania, Latvia, Albania, Bosnia-Herzegovina, Croatia, Macedonia, Montenegro, Serbia
Table 2. Quantitative indicators for assessing the ability of time series night-time light (NTL) data to identify both urbanization and the absence of urbanization.
NoIndicatorEquationImplication
1Overall accuracy TP + TN TP + TN + FP + FNthe overall accuracy of time series NTL profile for identifying a particular urbanization typology
2Sensitivity TP TP + FNthe ability of the NTL profile to correctly identify urbanization
3Specificity TN TN + FPthe ability of the NTL profile to correctly identify the absence of urbanization
4Predictive value for a positive result (PV+) TP TP + FPHow likely is the pixel experienced urbanization, given that the NTL profile shows urbanization-related signatures?
5Predictive value for a negative result (PV−) TN TN + FNHow likely is the pixel did not experience urbanization, given that the NTL profile suggests an absence of urbanization-related signature?
TP: True Positives; TN: True Negatives; FP: False Positives; FN: False Negatives.
Table 3. Consistency of interpretation and labeling results.
ConsistencyLand Cover/UseInfrastructureEconomic ActivityNTL Profile
100% (6/6)35.9%54.7%42.2%81.3%
83.3% (5/6)42.8%29.7%39.0%15.6%
66.7% (4/6)21.3%15.6%18.8%3.1%
Table 4. Examples of urbanization typologies identified by time series night-time light (NTL) data.
High Constant Urban Economic ActivitiesRapid Urbanization
Time series NTL profileRemotesensing 05 03476i1Remotesensing 05 03476i2
Time series Google Earth images (1 km × 1 km)Remotesensing 05 03476i3
1944-12-31
Remotesensing 05 03476i4
1997-04-29
Remotesensing 05 03476i5
2002-07-18
Remotesensing 05 03476i6
2003-09-05
All images taken from Google Earth (©2013 Google, ©2013 Cnes/Spot Image, Image ©2013 Digital Globe, Image © 2013 GeoEye).
Table 5. Regions for which urbanization typologies were correctly identified by time series night-time light (NTL) data.
High CUEAMedium CUEALow CUEAUrbanization IntensificationRapid UrbanizationModerate UrbanizationSlow UrbanizationDe-Urbanization
CAM
CHN
EAS
EEU
IND
MAS
MLA
NAF
NAM
OCE
SAF
SAM
SAS
SEA
WAS
WSE
A cell containing a tick mark means that correctly identified urbanization typology involved was found in that particular region, whereas, a vacant cell (i.e., does not contain a tick mark), means that correctly identified urbanization typology involved was not found in that particular region. CUEA is abbreviation for constant urban economic activities.
Table 6. Examples of failures.
Time Series NTL ProfileTime Series Google Earth Images (1 km × 1 km)
False NegativesRemotesensing 05 03476i7Remotesensing 05 03476i8
2003-09-22
False PositivesRemotesensing 05 03476i9Remotesensing 05 03476i10
2002-06-07
Remotesensing 05 03476i11
2003-12-29
All images taken from Google Earth (©2013 Google, ©2013 Cnes/Spot Image, Image ©2013 Digital Globe, Image © 2013 GeoEye).