A Comparative Study on Satellite- and Model-Based Crop Phenology in West Africa
Abstract
:1. Introduction
2. Material
2.1. Study Area
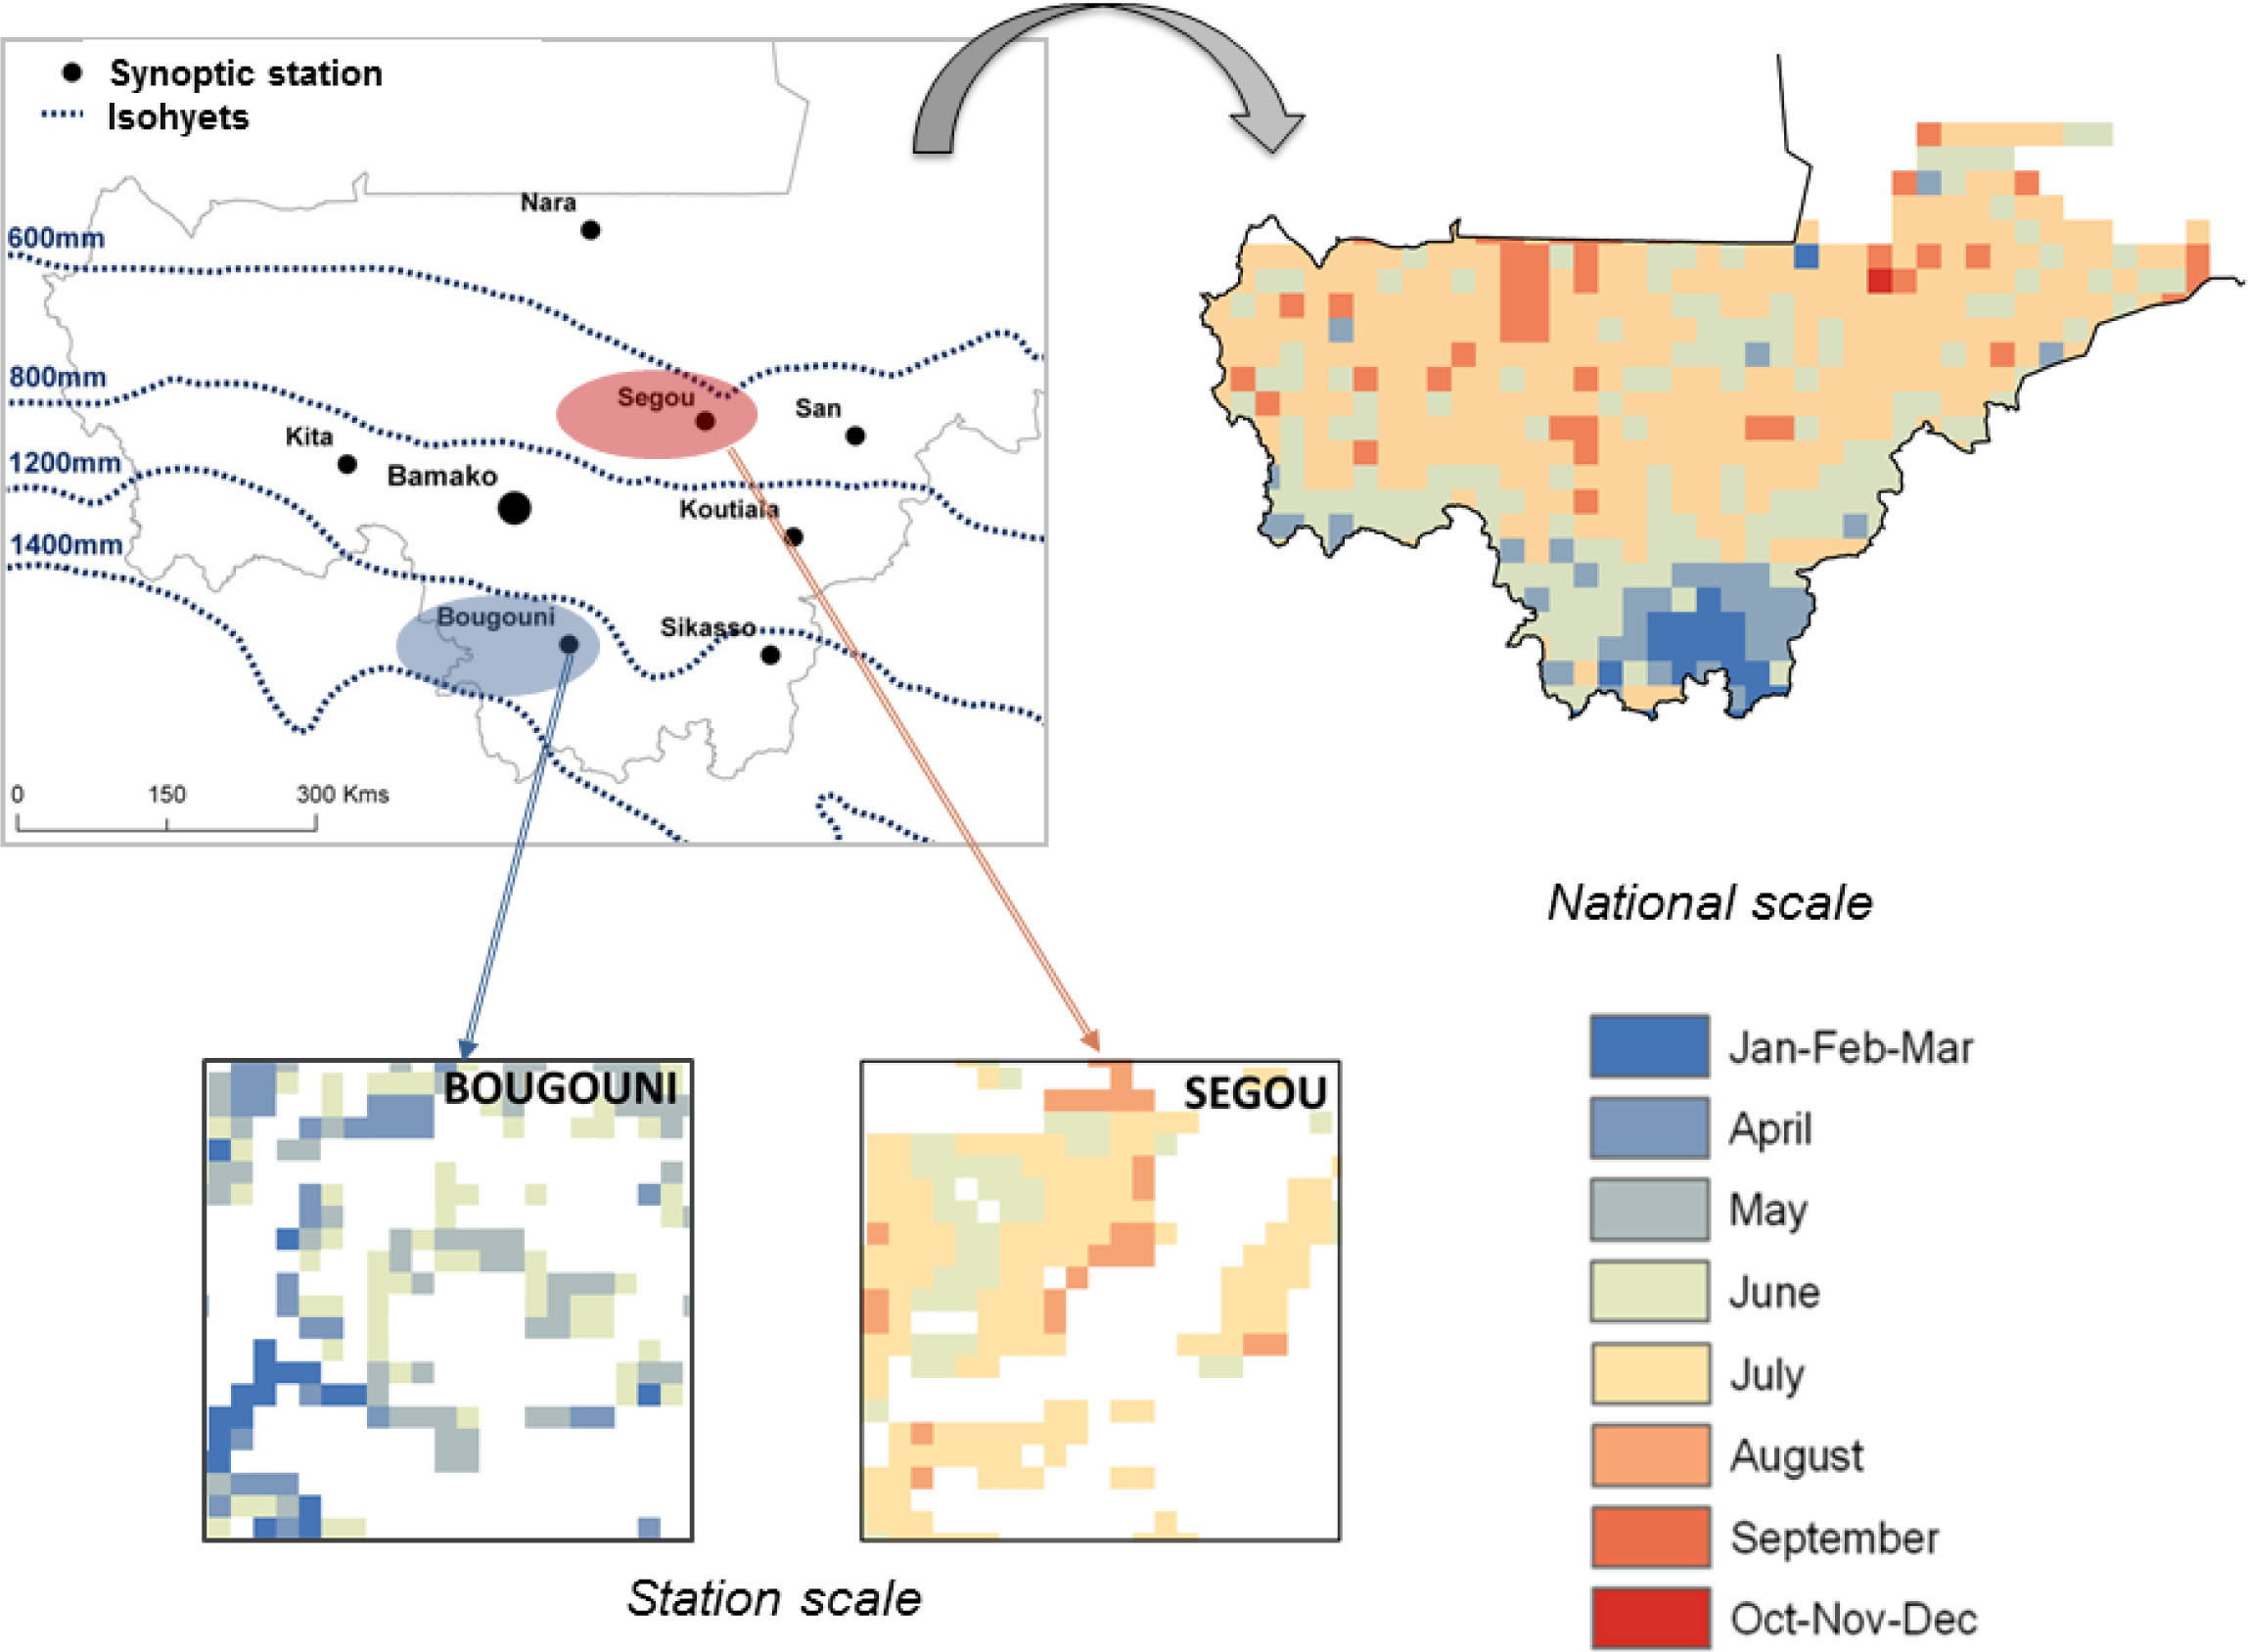
- - Food-producing agriculture: area dedicated to millet and sorghum (>50%) as well as cotton (<10%);
- - Intensive agriculture: area dedicated to maize and cotton (>40%);
- - Mixed agriculture: area dedicated to sorghum (>20%) and cotton (between 5% and 40%).
2.2. Satellite Data
2.2.1. The MODIS Land Cover Dynamics Product (MCD12Q2)
2.2.2. MCD12Q2 Product Pre-Processing
2.3. Cropland and Agricultural System Maps
2.4. Climate Data
2.5. The SARRA-H Crop Model
3. Methods
3.1. Satellite-Derived Phenometrics
3.2. Model-Derived Phenometrics
3.2.1. Model Simulation Set
- - Species composition and intensification mode: the species and intensification options were derived from the crop production systems map (Figure 1); the intensive and auto-subsistence food-producing system crops were simulated using higher and lower fertilization levels, respectively.
- - Species variety: the variety used was based on previous studies and expert knowledge; it mainly depends on the cropping season length and sowing strategies. Early and intermediate sowing dates imply photoperiodic varieties, and species adapted to the end of the rainy season were necessary; thus, we used photoperiodic (sorghum and pearl millet) and non-photoperiodic varieties (sorghum and maize).
- - Soil type: soils in this region are mainly sandy [42]. The soil layer available for the rooting zone mainly depends on topography; it may be absent or may vary up to more than 2 m thick. Two types of soils (sandy and sandy clay) and two maximum root depths (80 cm and 180 cm) were examined to include the variability.
- - Sowing date: the model automatically generated a sowing date that was the day when the available soil water was greater than 10 mm at the end of the day followed by a 20-day period, during which we monitored crop establishment [39]. If the daily simulated total biomass decreases 11 out of 20 days, the juvenile stage of the crop is considered a failure, which triggers automatic re-sowing. While the beginning of the growth cycle depends on the crop species, the sowing strategy is decided at the plot management level and considers the available labor and rainfall hazards. We use the most common strategy, wherein the end of the crop cycle (EOS) coincides with the end of the rainy season. Local photoperiodic millet and sorghum varieties were sown either as soon as the first rains began or later, depending on the growing season length. However, for maize and non-photoperiodic sorghum, the sowing dates depend on cycle length and the date the season typically ends, which varies from north to south.
3.2.2. Model-Derived Phenometric Calculations
3.3. Comparison between Satellite and Model-Derived Phenometrics
4. Results
4.1. LAI Simulation Results
- - The choice of different soil types has a limited impact on LAI dynamics, except for EMAX (Table 4). For SOS, SMAX, and EOS, the soil effect was insignificant (bias < 5 days, except for Sikasso). For EMAX, the standard deviation between the different phenometrics using different types of soils varied from four to 12 days.
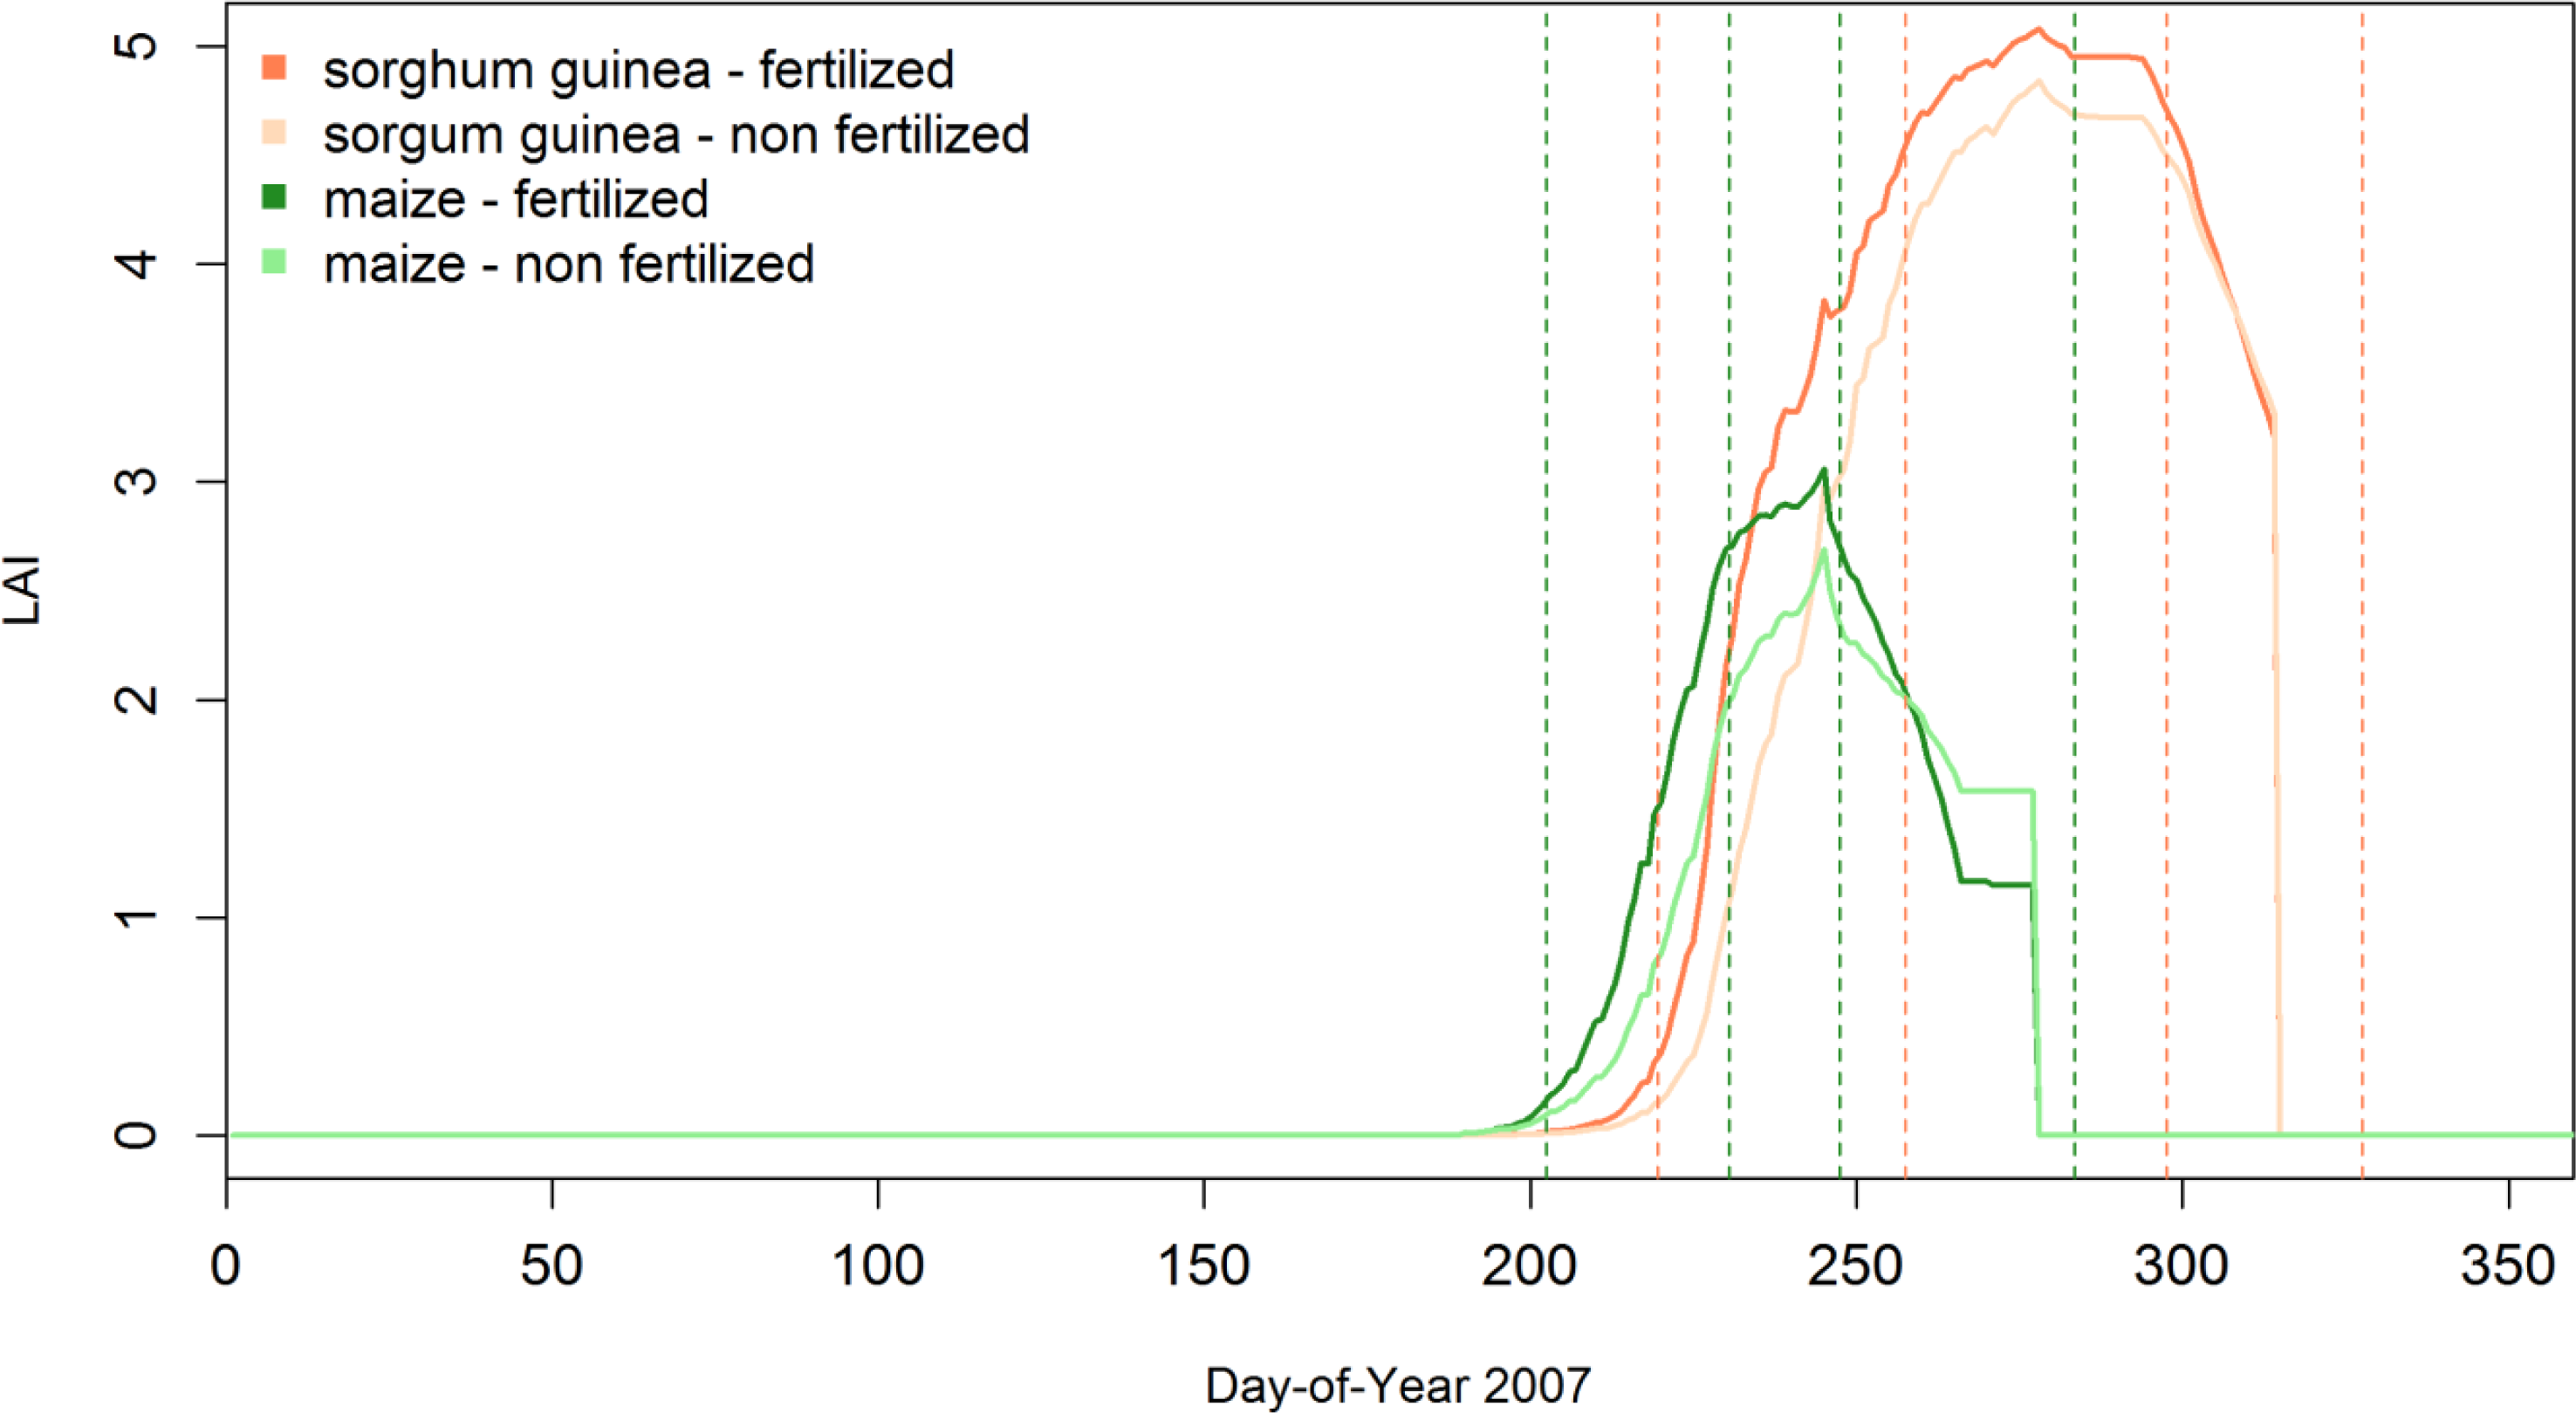
- - The phenological indicators for fertilized crops appeared approximately five days earlier than for non-fertilized crops (Table 4). As an illustration, Figure 4 shows four LAI profiles for the Kita synoptic station in 2007 (one maize variety and one sorghum variety with two fertilizer treatments each).
4.2. Phenometrics Spatial Analysis
4.2.1. North-South Gradient Analysis
4.2.2. A Comparison of the Satellite- and Model-Derived Phenometrics
4.3. Phenometrics Temporal Analysis
4.3.1. Inter- and Intra-Annual Variations
4.3.2. Comparison of the Satellite and Model-Derived Phenometrics
4.4. Inconsistencies Analysis
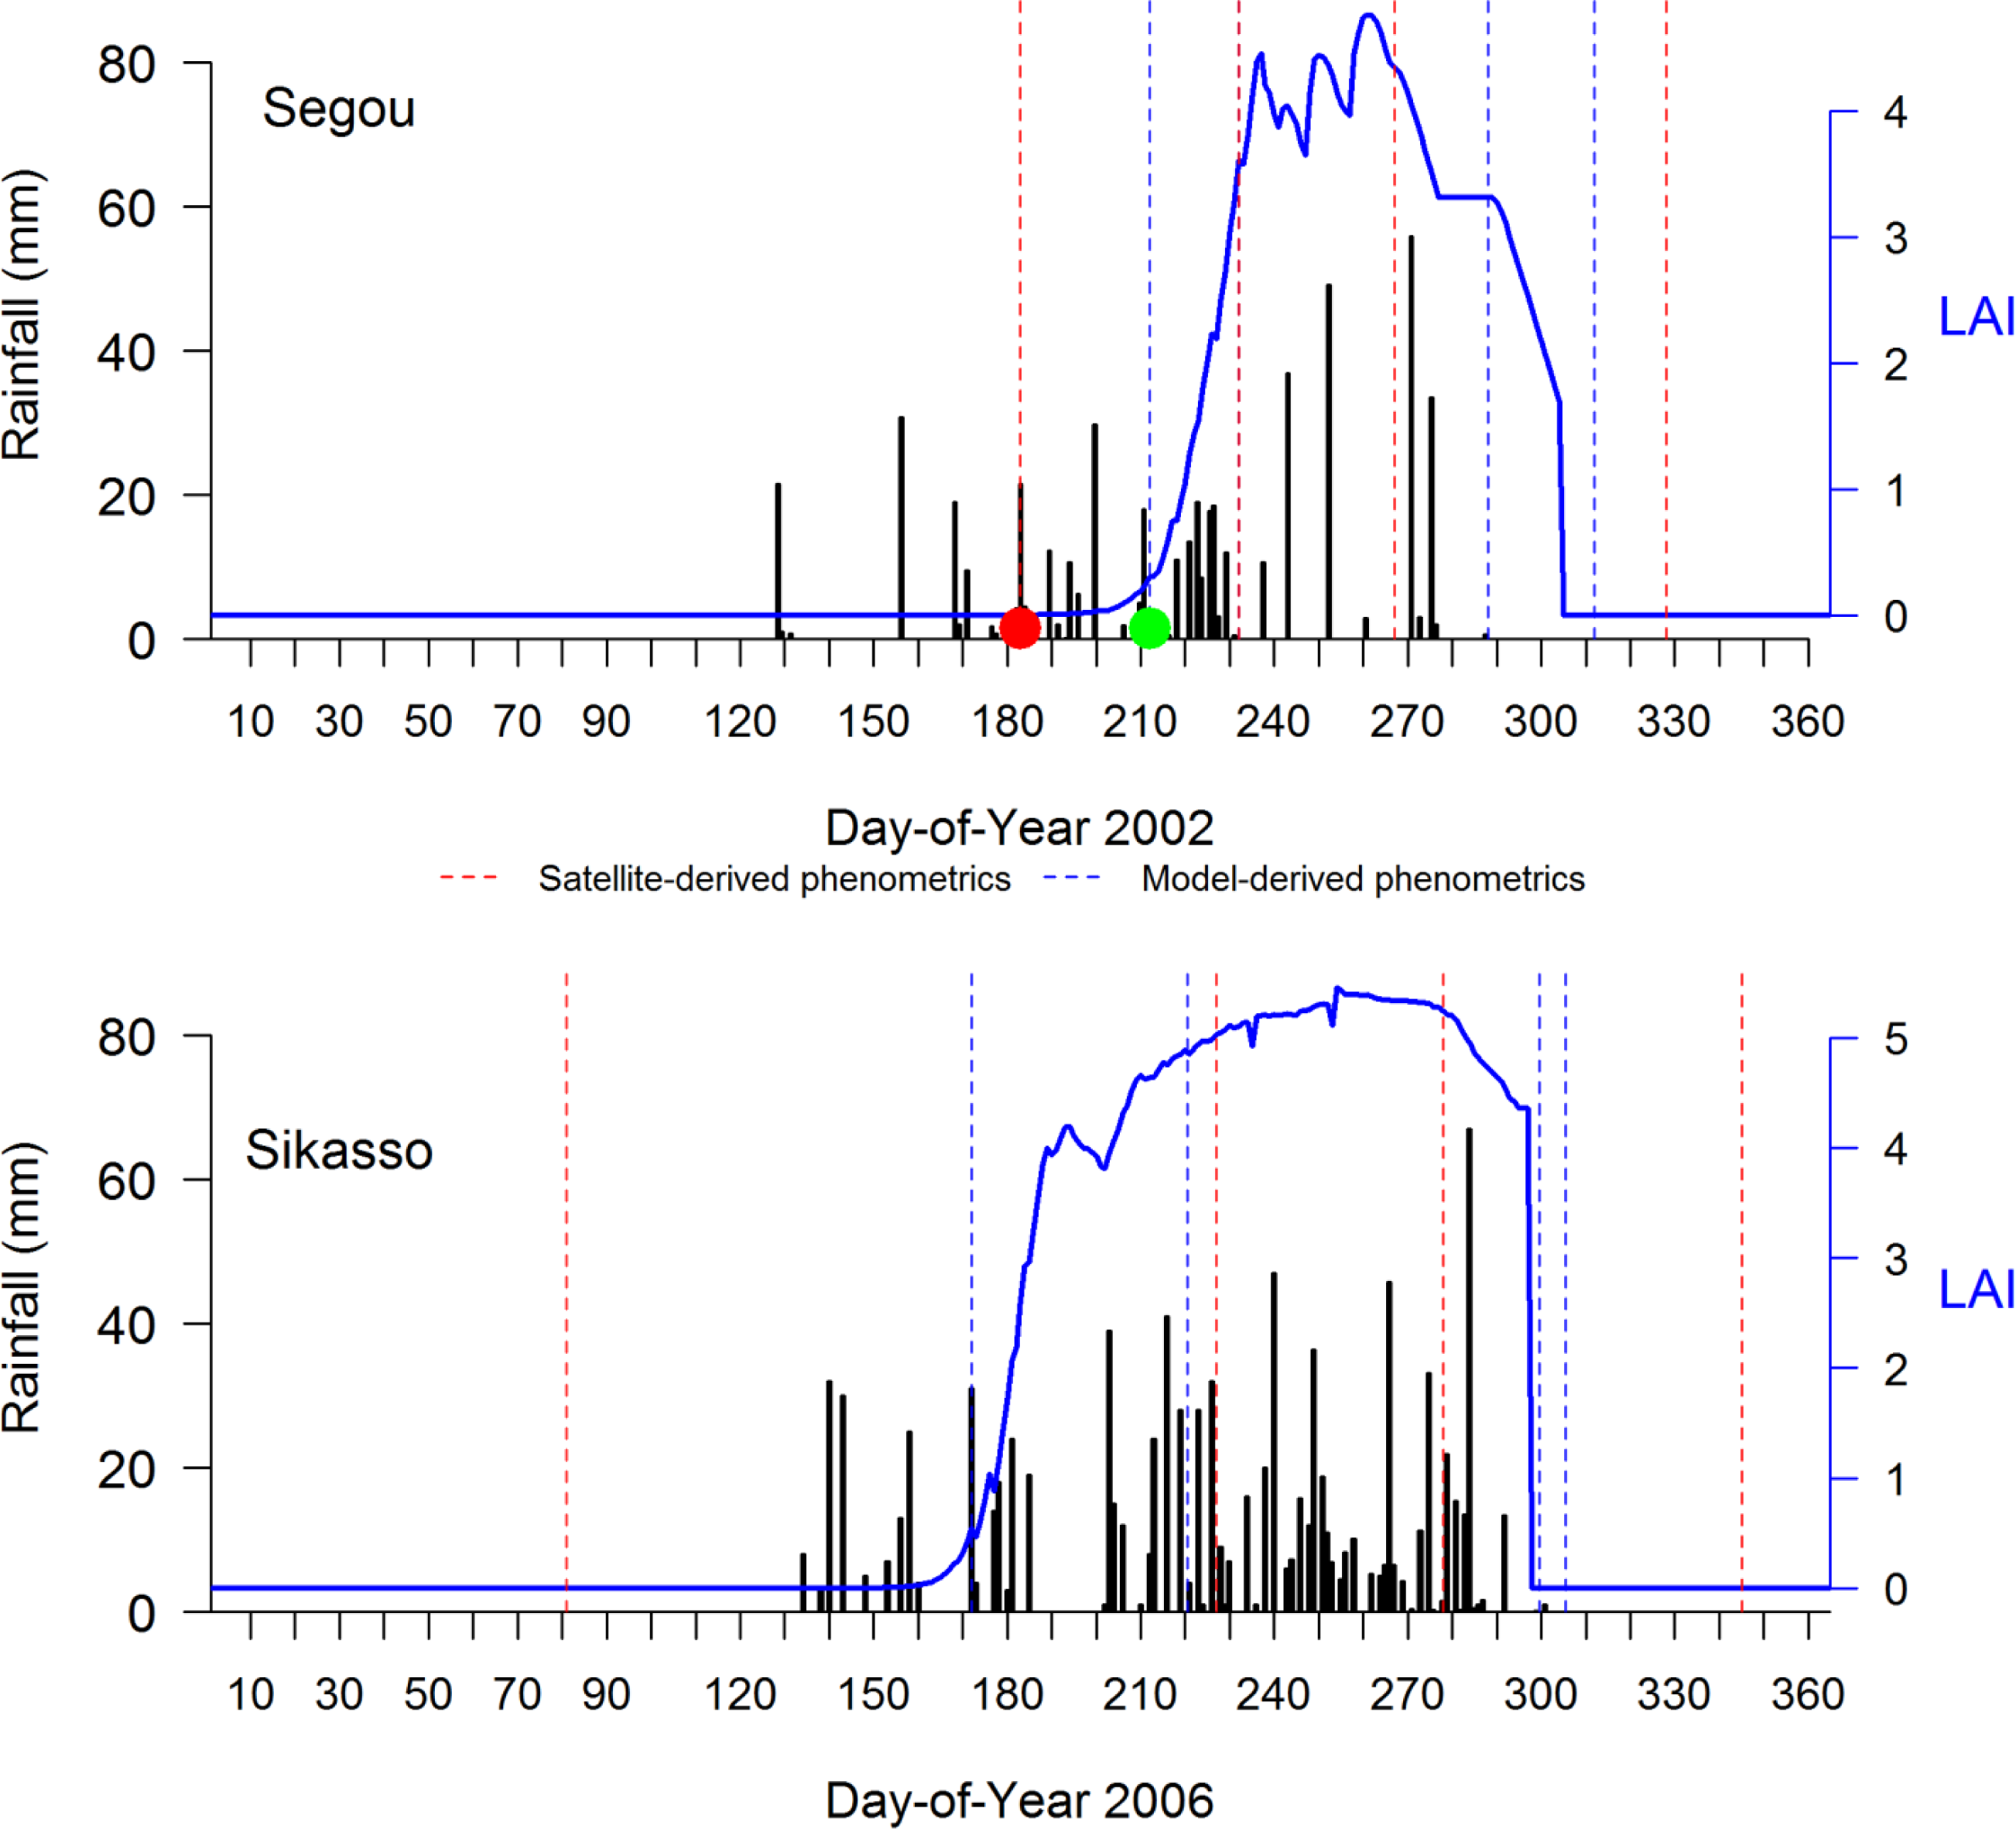
- - For Segou, in 2002, the time lag between the satellite- and model-derived phenometrics may be due to either satellite indices that were too early or model indices that were too late to detect the sowing dates. A closer look at the rainfall data showed that the satellite-derived SOS was consistent with the first rains. However, the model considered the rainfall levels and highlighted a false start in plant emergence, which is commonly referred to as failed sowing dates (Figure 9, with red circles that indicate failed sowing dates and green circles that indicate successful sowing dates). Thus, the model indicates that the plant was first sown on DOY 170 (such as for the satellite), but it did not grow properly and was re-sown 30 days later; this additional information from the model was not considered by the satellite.
- - For Sikasso, in 2006, the satellite-derived SOS was detected two months before the first rains (Figure 9). The satellite-derived SOS was unusually early, and likely, the rain gauges may have missed the first rains in the area, which raises questions on the spatial representativeness of the local rainfall measurements.
5. Discussions
5.1. Comparison between Satellite- and Model-Derived Phenometrics
5.2. Uncertainties, Data Limitations, and Interpretations
5.3. Crop Monitoring and Early Warning Systems
6. Conclusions
Acknowledgments
Author Contributions
Conflicts of Interest
References
- Becker-Reshef, I.; Justice, C.; Sullivan, M.; Vermote, E.; Tucker, C. Monitoring global croplands with coarse resolution earth observations: The global agriculture monitoring (GLAM) project. Remote Sens 2010, 2, 1589–1609. [Google Scholar]
- Sakamoto, T.; Yokozawa, M.; Toritani, H.; Shibayama, M.; Ishitsuka, N. A crop phenology detection method using time-series MODIS data. Remote Sens. Environ 2005, 96, 366–374. [Google Scholar]
- Zhang, X.; Friedl, M.A.; Schaaf, C.B.; Strahler, A.H.; Liu, Z. Monitoring the response of vegetation phenology to precipitation in Africa by coupling MODIS and TRMM instruments. J. Geophys. Res. Atmos 2005, 110. [Google Scholar] [CrossRef]
- Rembold, F.; Atzberger, C.; Savin, I.; Rojas, O. Using low resolution satellite imagery for yield prediction and yield anomaly detection. Remote Sens 2013, 5, 1704–1733. [Google Scholar]
- Kathuroju, N.; White, M.A.; Symanzik, J.; Schwartz, M.D.; Powell, J.A. On the use of the advanced very high resolution radiometer for development of prognostic land surface phenology models. Ecol. Model 2007, 201, 144–156. [Google Scholar]
- Reed, B.C.; Brown, J.F.; VanderZee, D.; Loveland, T.R.; Merchant, J.W. Measuring phenological variability from satellite imagery. J. Veg. Sci 1994, 5, 703–714. [Google Scholar]
- Zhang, X.; Friedl, M.; Schaaf, C. Sensitivity of vegetation phenology detection to the temporal resolution of satellite data. Int. J. Remote Sens 2009, 30, 2061–2074. [Google Scholar]
- Fritz, S.; Massart, M.; Savin, I.; Gallego, J.; Rembold, F. The use of modis data to derive acreage estimations for larger fields: A case study in the south-western rostov Region of Russia. Int. J. Appl. Earth Obs. Geoinf 2008, 10, 453–466. [Google Scholar]
- Atzberger, C. Advances in remote sensing of agriculture: Context description, existing operational monitoring systems and major information needs. Remote Sens 2013, 5, 949–981. [Google Scholar]
- White, M.A.; de Beurs, K.M.; Didan, K.; Inouye, D.W.; Richardson, A.D. Intercomparison, interpretation, and assessment of spring phenology in North America estimated from remote sensing for 1982–2006. Glob. Chang. Biol 2009, 15, 2335–2359. [Google Scholar]
- Schwartz, M.D.; Hanes, J.M. Intercomparing multiple measures of the onset of spring in Eastern North America. Int. J. Climatol 2010, 30, 1614–1626. [Google Scholar]
- Hmimina, G.; Dufrêne, E.; Pontailler, J.-Y.; Delpierre, N.; Aubinet, M. Evaluation of the potential of MODIS satellite data to predict vegetation phenology in different biomes: An investigation using ground-based NDVI measurements. Remote Sens. Environ 2013, 132, 145–158. [Google Scholar]
- Atkinson, P.M.; Jeganathan, C.; Dash, J.; Atzberger, C. Inter-comparison of four models for smoothing satellite sensor time-series data to estimate vegetation phenology. Remote Sens. Environ 2012, 123, 400–417. [Google Scholar]
- Funk, C.; Budde, M.E. Phenologically-tuned MODIS NDVI-based production anomaly estimates for Zimbabwe. Remote Sens. Environ 2009, 113, 115–125. [Google Scholar]
- Rojas, O.; Rembold, F.; Delincé, J.; Léo, O. Using the NDVI as auxiliary data for rapid quality assessment of rainfall estimates in Africa. Int. J. Remote Sens 2011, 32, 3249–3265. [Google Scholar]
- Atzberger, C.; Klisch, A.; Mattiuzzi, M.; Vuolo, F. Phenological metrics derived over the european continent from NDVI3G data and MODIS time series. Remote Sens 2013, 6, 257–284. [Google Scholar]
- Balme, M.; Galle, S.; Lebel, T. Démarrage de la saison des pluies au sahel: Variabilité aux échelles hydrologique et agronomique, analysée à partir des données epsat-Niger. Sécheresse 2005, 16, 15–22. [Google Scholar]
- Heumann, B.W.; Seaquist, J.; Eklundh, L.; Jonsson, P. Avhrr derived phenological change in the Sahel and Soudan, Africa, 1982–2005. Remote Sens. Environ 2007, 108, 385–392. [Google Scholar]
- Wessels, K.; Steenkamp, K.; von Maltitz, G.; Archibald, S. Remotely sensed vegetation phenology for describing and predicting the biomes of South Africa. Appl. Veg. Sci 2010, 14, 49–66. [Google Scholar]
- Brown, M.E.; de Beurs, K.M. Evaluation of multi-sensor semi-arid crop season parameters based on NDVI and rainfall. Remote Sens. Environ 2008, 112, 2261–2271. [Google Scholar]
- Baron, C.; Sultan, B.; Balme, M.; Sarr, B.; Traoré, S.B. From GCM grid cell to agricultural plot: Scale issues affecting modelling of climate impact. Philos. Trans. R. Soc. B: Biol. Sci 2005, 360, 2095–2108. [Google Scholar]
- Oettli, P.; Sultan, B.; Baron, C.; Vrac, M. Are regional climate models relevant for crop yield prediction in West Africa? Environ. Res. Lett 2011, 6. [Google Scholar] [CrossRef]
- Zhang, X.; Friedl, M.A.; Schaaf, C.B.; Strahler, A.H.; Hodges, J.C.F. Monitoring vegetation phenology using modis. Remote Sens. Environ 2003, 84, 471–475. [Google Scholar]
- Traoré, S.B.; Alhassane, A.; Muller, B.; Kouressy, M.; Somé, L. Characterizing and modeling the diversity of cropping situations under climatic constraints in west africa. Atmos. Sci. Lett 2011, 12, 89–95. [Google Scholar]
- Kouressy, M.; Dingkuhn, M.; Vaksmann, M.; Heinemann, A.B. Adaptation to diverse semi-arid environments of sorghum genotypes having different plant type and sensitivity to photoperiod. Agric. For. Meteorol 2008, 148, 357–371. [Google Scholar]
- Soumare, M.; Bazile, D.; Vaksmann, M.; Kouressy, M.; Diallo, K. Agroecosystemic diversity and future of traditional cereals in the Malian cotton belt. Divers. Agroecosystemique Devenir Cereales Tradit. Sud Mali 2008, 17, 79–85. [Google Scholar]
- Vintrou, E.; Soumaré, M.; Bernard, S.; Bégué, A.; Baron, C. Mapping fragmented agricultural systems in the Sudano-Sahelian environments of Africa using random forest and ensemble metrics of coarse resolution MODIS imagery. Photogramm. Eng. Remote Sens 2012, 78, 839–848. [Google Scholar]
- Zhang, X.; Friedl, M.A.; Schaaf, C.B. Global vegetation phenology from moderate resolution imaging spectroradiometer (MODIS): Evaluation of global patterns and comparison with in situ measurements. J. Geophys. Res 2006, 111. [Google Scholar] [CrossRef]
- Ganguly, S.; Friedl, M.A.; Tan, B.; Zhang, X.; Verma, M. Land surface phenology from MODIS: Characterization of the collection five global land cover dynamics product. Remote Sens. Environ 2010, 114, 1805–1816. [Google Scholar]
- LP DAAC. Land Cover Dynamics Yearly l3 Global 500 m SIN Grid. Available online: https://lpdaac.usgs.gov/products/modis_products_table/mcd12q2 (accessed on 15 March 2012).
- Huete, A.; Didan, K.; Miura, T.; Rodriguez, E.P.; Gao, X. Overview of the radiometric and biophysical performance of the MODIS vegetation indices. Remote Sens. Environ 2002, 83, 195–213. [Google Scholar]
- Beck, P.S.; Atzberger, C.; Høgda, K.A.; Johansen, B.; Skidmore, A.K. Improved monitoring of vegetation dynamics at very high latitudes: A new method using MODIS NDVI. Remote Sens. Environ 2006, 100, 321–334. [Google Scholar]
- Maatoug, L.; Arvor, D.; Simoes, M.; Bégué, A. Monitoring Crop Phenology in Mato Grosso (Brazil) Using Remote Sensing Data. Proceedings of the 15th Sociedad Especialistas Latino-Americana en PErcepción Remota (SELPER) Symposium, French Guiana, France, 19–23 November 2012.
- Vintrou, E.; Bégué, A.; Baron, C.; Lo Seen, D.; Saad, A. Analysis MODIS Phenometrics Quality on Cropped Land in West Africa. Proceedings of the ESA Sentinel-2 Preparatory Symposium, Frascati, Italy, 23–27 April 2012.
- Vintrou, E.; Desbrosse, A.; Bégué, A.; Traoré, S.B.; Baron, C. Crop area mapping in West Africa using landscape stratification of MODIS time series and comparison with existing global land products. Int. J. Appl. Earth Obs. Geoinf 2012, 14, 83–93. [Google Scholar]
- Dingkuhn, M.; Baron, C.; Bonnal, V.; Maraux, F.; Sarr, B. Decision Support Tools for Rainfed Crops in the Sahel at the Plot and Regional Scales. In A Practical Guide to Decision-Support Tools for Agricultural Productivity and Soil Fertility Enhancement in Sub-Saharan Africa, IFDC, CTA; Struif-Bontkes, T.E., Wopereis, M.C.S., Eds.; International Fertilizer Development Center: Muscle Shoals, AL, USA, 2003; pp. 127–139. [Google Scholar]
- Baron, C.; Clopes, A.; Perez, P.; Muller, B.; Maraux, F. Users Manuals for the: Sarramet (45 p.), Sarrabil (35 p.) and Sarrazon (29 p.) Softwares; CIRAD: Montpellier, France, 1996. [Google Scholar]
- Sultan, B.; Baron, C.; Dingkuhn, M.; Sarr, B.; Janicot, S. Agricultural impacts of large-scale variability of the West African monsoon. Agric. For. Meteorol 2005, 128, 93–110. [Google Scholar]
- Marteau, R.; Sultan, B.; Moron, V.; Alhassane, A.; Baron, C. The onset of the rainy season and farmers’ sowing strategy for pearl millet cultivation in Southwest Niger. Agric. For. Meteorol 2011, 151, 1356–1369. [Google Scholar]
- Dingkuhn, M.; Kouressy, M.; Vaksmann, M.; Clerget, B.; Chantereau, J. A model of sorghum photoperiodism using the concept of threshold-lowering during prolonged appetence. Eur. J. Agron 2008, 28, 74–89. [Google Scholar]
- Prince, S.D.; Goward, S.N. Global primary production: A remote sensing approach. J. Biogeogr 1995, 22, 815–835. [Google Scholar]
- Advances in Integrated Soil Fertility Management in Sub Saharan Africa: Challenges and Opportunities; Bationo, A.; Waswa, B.; Kihara, J.; Kimetu, J (Eds.) Springer: Berlin, Germany, 2007.
- Kouressy, M.; Traoré, S.B.; Vaksmann, M.; Grum, M.; Maikano, I. Adaptation of Malian sorghums to climate variability. Cah. Agric 2008, 17, 95–100. [Google Scholar]
- Sultan, B.; Janicot, S.; Diedhiou, A. The West African monsoon dynamics. Part I: Documentation of intraseasonal variability. J. Clim 2003, 16, 3389–3406. [Google Scholar]
- Sultan, B.; Janicot, S.; Diedhiou, A. The West African monsoon dynamics. Part II: The “Preonset” and the “Onset” of the summer monsoon. J. Clim 2003, 16, 3407–3427. [Google Scholar]
- Ramarohetra, J.; Sultan, B.; Baron, C.; Gaiser, T.; Gosset, M. How satellite rainfall estimate errors may impact rainfed cereal yield simulation in West Africa. Agric. For. Meteorol 2013, 180, 118–131. [Google Scholar]
- Xiao, W.; Sun, Z.; Wang, Q.; Yang, Y. Evaluating MODIS phenology product for rotating croplands through ground observations. J. Appl. Remote Sens 2013, 7. [Google Scholar] [CrossRef]
- Buerkert, A.; Moser, M.; Kumar, A.K.; Fuerst, P.; Becker, K. Variation in grain quality of pearl millet from Sahelian West Africa. Field Crop. Res 2001, 69, 1–11. [Google Scholar]


| Station | Latitude (dd) | Longitude (dd) | 2007 Rainfall (mm) | Cropping System |
|---|---|---|---|---|
| Nara | 15.17 | −7.29 | 441 | Food-producing agriculture |
| Segou | 13.4 | −6.16 | 521 | Food-producing agriculture |
| San | 13.29 | −4.91 | 748 | Food-producing agriculture |
| Kita | 13.07 | −9.46 | 883 | Mixed agriculture |
| Bamako | 12.53 | −7.95 | 856 | Mixed agriculture |
| Koutiala | 12.4 | −5.47 | 962 | Intensive agriculture |
| Bougouni | 11.41 | −7.51 | 1,330 | Mixed agriculture |
| Sikasso | 11.35 | −5.69 | 1,357 | Intensive agriculture |
| Year | Segou | Sikasso |
|---|---|---|
| 2002 | 500 | 780 |
| 2003 | 610 | 1,160 |
| 2004 | 500 | 1,140 |
| 2005 | 480 | 1,010 |
| 2006 | 560 | 970 |
| 2007 | 520 | 1,360 |
| 2008 | 680 | 950 |
| Station | Species and Variety | Sowing Date | Fertilization | Soil Type | Soil Depth | Number of Simulations |
|---|---|---|---|---|---|---|
| Nara | Sorghum caudatum Millet souna | Intermediate | No | Sandy and sandy clay | 80 cm and 180 cm | 8 |
| Segou | Sorghum guinea Sorghum kenikeba Millet choho | Late and intermediate | No | Sandy and sandy clay | 80 cm and 180 cm | 24 |
| San | Sorghum guinea Sorghum kenikeba Millet choho | Late and intermediate | No | Sandy and sandy clay | 80 cm and 180 cm | 24 |
| Kita | Sorghum guinea Sorghum kenikeba Millet choho Maize | Intermediate for millet and sorghum, and intermediate and late for maize | Yes/No | Sandy and sandy clay | 80 cm and 180 cm | 42 |
| Bamako | Sorghum guinea Sorghum kenikeba Millet choho Maize | Late, intermediate | Yes/No | Sandy and sandy clay | 80 cm and 180 cm | 64 |
| Koutiala | Sorghum guinea Millet choho Maize | Late and intermediate | Yes | Sandy and sandy clay | 80 cm and 180 cm | 32 |
| Bougouni | Sorghum guinea Sorghum kenikeba Millet choho Maize | Early, late, intermediate (except for maize: intermediate and late only) | Yes/No | Sandy and sandy clay | 80 cm and 180 cm | 88 |
| Sikasso | Sorghum guinea Sorghum kenikeba Millet choho Maize | Early, late, intermediate for millet and sorghum, and intermediate and late for maize | Yes/No | Sandy and sandy clay | 80 cm and 180 cm | 88 |
| Standard Deviation (days) | Nara | Segou | San | Kita | Bamako | Koutiala | Bougouni | Sikasso |
|---|---|---|---|---|---|---|---|---|
| Soil type factor: | ||||||||
| SOS | 0 | 1 | 1 | 1 | 1 | 0 | 2 | 10 |
| SMAX | 1 | 1 | 1 | 3 | 3 | 0 | 3 | 6 |
| EMAX | 7 | 12 | 10 | 9 | 6 | 4 | 7 | 7 |
| EOS | 2 | 1 | 4 | 2 | 1 | 1 | 3 | 3 |
| Fertilization mode: | ||||||||
| SOS | 4 | 2 | 5 | 4 | ||||
| SMAX | 5 | 7 | 10 | 5 | ||||
| EMAX | 6 | 3 | 0 | 2 | ||||
| EOS | 3 | 2 | 1 | 2 | ||||
© 2014 by the authors; licensee MDPI, Basel, Switzerland This article is an open access article distributed under the terms and conditions of the Creative Commons Attribution license (http://creativecommons.org/licenses/by/3.0/).
Share and Cite
Vintrou, E.; Bégué, A.; Baron, C.; Saad, A.; Lo Seen, D.; Traoré, S.B. A Comparative Study on Satellite- and Model-Based Crop Phenology in West Africa. Remote Sens. 2014, 6, 1367-1389. https://doi.org/10.3390/rs6021367
Vintrou E, Bégué A, Baron C, Saad A, Lo Seen D, Traoré SB. A Comparative Study on Satellite- and Model-Based Crop Phenology in West Africa. Remote Sensing. 2014; 6(2):1367-1389. https://doi.org/10.3390/rs6021367
Chicago/Turabian StyleVintrou, Elodie, Agnès Bégué, Christian Baron, Alexandre Saad, Danny Lo Seen, and Seydou B. Traoré. 2014. "A Comparative Study on Satellite- and Model-Based Crop Phenology in West Africa" Remote Sensing 6, no. 2: 1367-1389. https://doi.org/10.3390/rs6021367
APA StyleVintrou, E., Bégué, A., Baron, C., Saad, A., Lo Seen, D., & Traoré, S. B. (2014). A Comparative Study on Satellite- and Model-Based Crop Phenology in West Africa. Remote Sensing, 6(2), 1367-1389. https://doi.org/10.3390/rs6021367


