Article

Vicarious Radiometric Calibration of a Multispectral Camera on Board an Unmanned Aerial System

by
Susana Del Pozo
1,
Pablo Rodríguez-Gonzálvez
1,*,
David Hernández-López
2 and
Beatriz Felipe-García
2
1
Department of Cartographic and Land Engineering, University of Salamanca, Hornos Caleros, Ávila 05003, Spain
2
Institute for Regional Development (IDR), University of Castilla La Mancha, University Campus, Albacete 02017, Spain
*
Author to whom correspondence should be addressed.
Remote Sens. 2014, 6(3), 1918-1937; https://doi.org/10.3390/rs6031918
Submission received: 16 December 2013 / Revised: 7 February 2014 / Accepted: 19 February 2014 / Published: 28 February 2014

Abstract

:
Combinations of unmanned aerial platforms and multispectral sensors are considered low-cost tools for detailed spatial and temporal studies addressing spectral signatures, opening a broad range of applications in remote sensing. Thus, a key step in this process is knowledge of multi-spectral sensor calibration parameters in order to identify the physical variables collected by the sensor. This paper discusses the radiometric calibration process by means of a vicarious method applied to a high-spatial resolution unmanned flight using low-cost artificial and natural covers as control and check surfaces, respectively.

1. Introduction

Unmanned aerial systems (UASs) are gaining ground in the field of remote sensing as a new and versatile tool for data acquisition. In this sense, the interest of the international scientific community in them is steadily increasing. NASA has been a pioneer in the use of UASs, an example being agricultural resource monitoring, such as coffee crops [1,2], or the analysis of vineyard crop vigor variables [3], among others.
In comparison with manned aircraft or satellite platforms, UASs provide unique advantages in the data captured: their low operating height enables the generation of data at a very high spatial resolution in small areas [4], up to 1 cm per pixel [5,6]. Furthermore, UAS platforms allow short revisit periods, in contrast to satellite platforms, with their unfavorable orbital coverage patterns [7]. In addition, this high temporal resolution in data capturing [8] and increased maneuverability allow remote data acquisition in small inaccessible areas or in hazardous environments [9]. For these reasons, together with their low operational costs, UASs are becoming a key tool to meet the requirements of satellite imagery and aerial photography users.
The progress of microelectronics in the field of digital sensors, navigation equipment (GNSS/IMU (Global Navigation Satellite System/inertial measurement unit)), along with the design of small aircraft and light-weight materials, has reduced the cost of the fundamental components of UASs [10]. Several authors have published works in which, using cameras on board small planes or radio-controlled helicopters, they have demonstrated the viability of such airborne vehicles as image acquisition platforms for scientific purposes [1116]. With the increasing availability of commercial, low-cost components, research groups now have the option to develop their own projects based on UASs. Accordingly, they have the possibility of loading sensors with adequate spectral and radiometric resolution to satisfy their own research requirements.
The possibility of working with multispectral cameras on these platforms allows radiometric studies to be carried out. To this end, sensors must undergo a calibration that analyzes the radiometric behavior of each pixel in the different regions of the spectrum in which information has been recorded. This behavior depends on the weather conditions and the characteristics of the sensor [17]. Analyzing and comparing these magnitudes to other field measurements, a vicarious calibration model is achieved [18] following the empirical line approach [19]. As a result, vicarious calibration allows physical quantities to be known in units of radiance (W·m−2·sr−1·nm−1) for any pixel from a single image in a particular camera channel. The basis of this behavior is that each body has its own, different reflected/emitted energy pattern that sets it apart from other material when electromagnetic energy impinges on it [20].
This study aims to obtain the calibration parameters of a multispectral camera onboard a UAS using low-cost targets. To achieve this, different natural and artificial surfaces were used to determine radiance accurately at the sensor level through the use of a calibrated radiometer [21]. As result, it was possible to extract quantitative data from the multispectral imaging. Additionally, with the determination of the radiometric calibration parameters, several sensor corrections were applied to improve the data quality [22]. This workflow highlights the advantages, limitations and problems associated with radiometric capture using multispectral remote sensing onboard UASs.
The present work has the following structure and organization. First, the instruments employed are described, together with the flight planning for data gathering (Section 2) and the radiometric and geometric corrections made to the camera (Section 3). We then discuss the proposed calculation process of the radiometric calibration (Section 4). Thirdly, the field campaign of the case study is explained, and the results achieved are analyzed and validated (Section 5). Finally, we outline the conclusions and future work (Section 6).

2. Materials

The instruments employed included a multispectral camera, an aerial platform and the spectroradiometer, which will set the ground truth in the form of radiances over artificial control surfaces and natural check surfaces. In the case of the UAS, the flight planning needs to be considered to optimize the data gathering step.

2.1. Instruments

A Mini-MCA camera with 6 channels was used as the multispectral sensor [23] (Figure 1); its low weight suggested that it was suitable for loading on a UAS. The specifications of the multispectral camera are listed in the following table (Table 1).
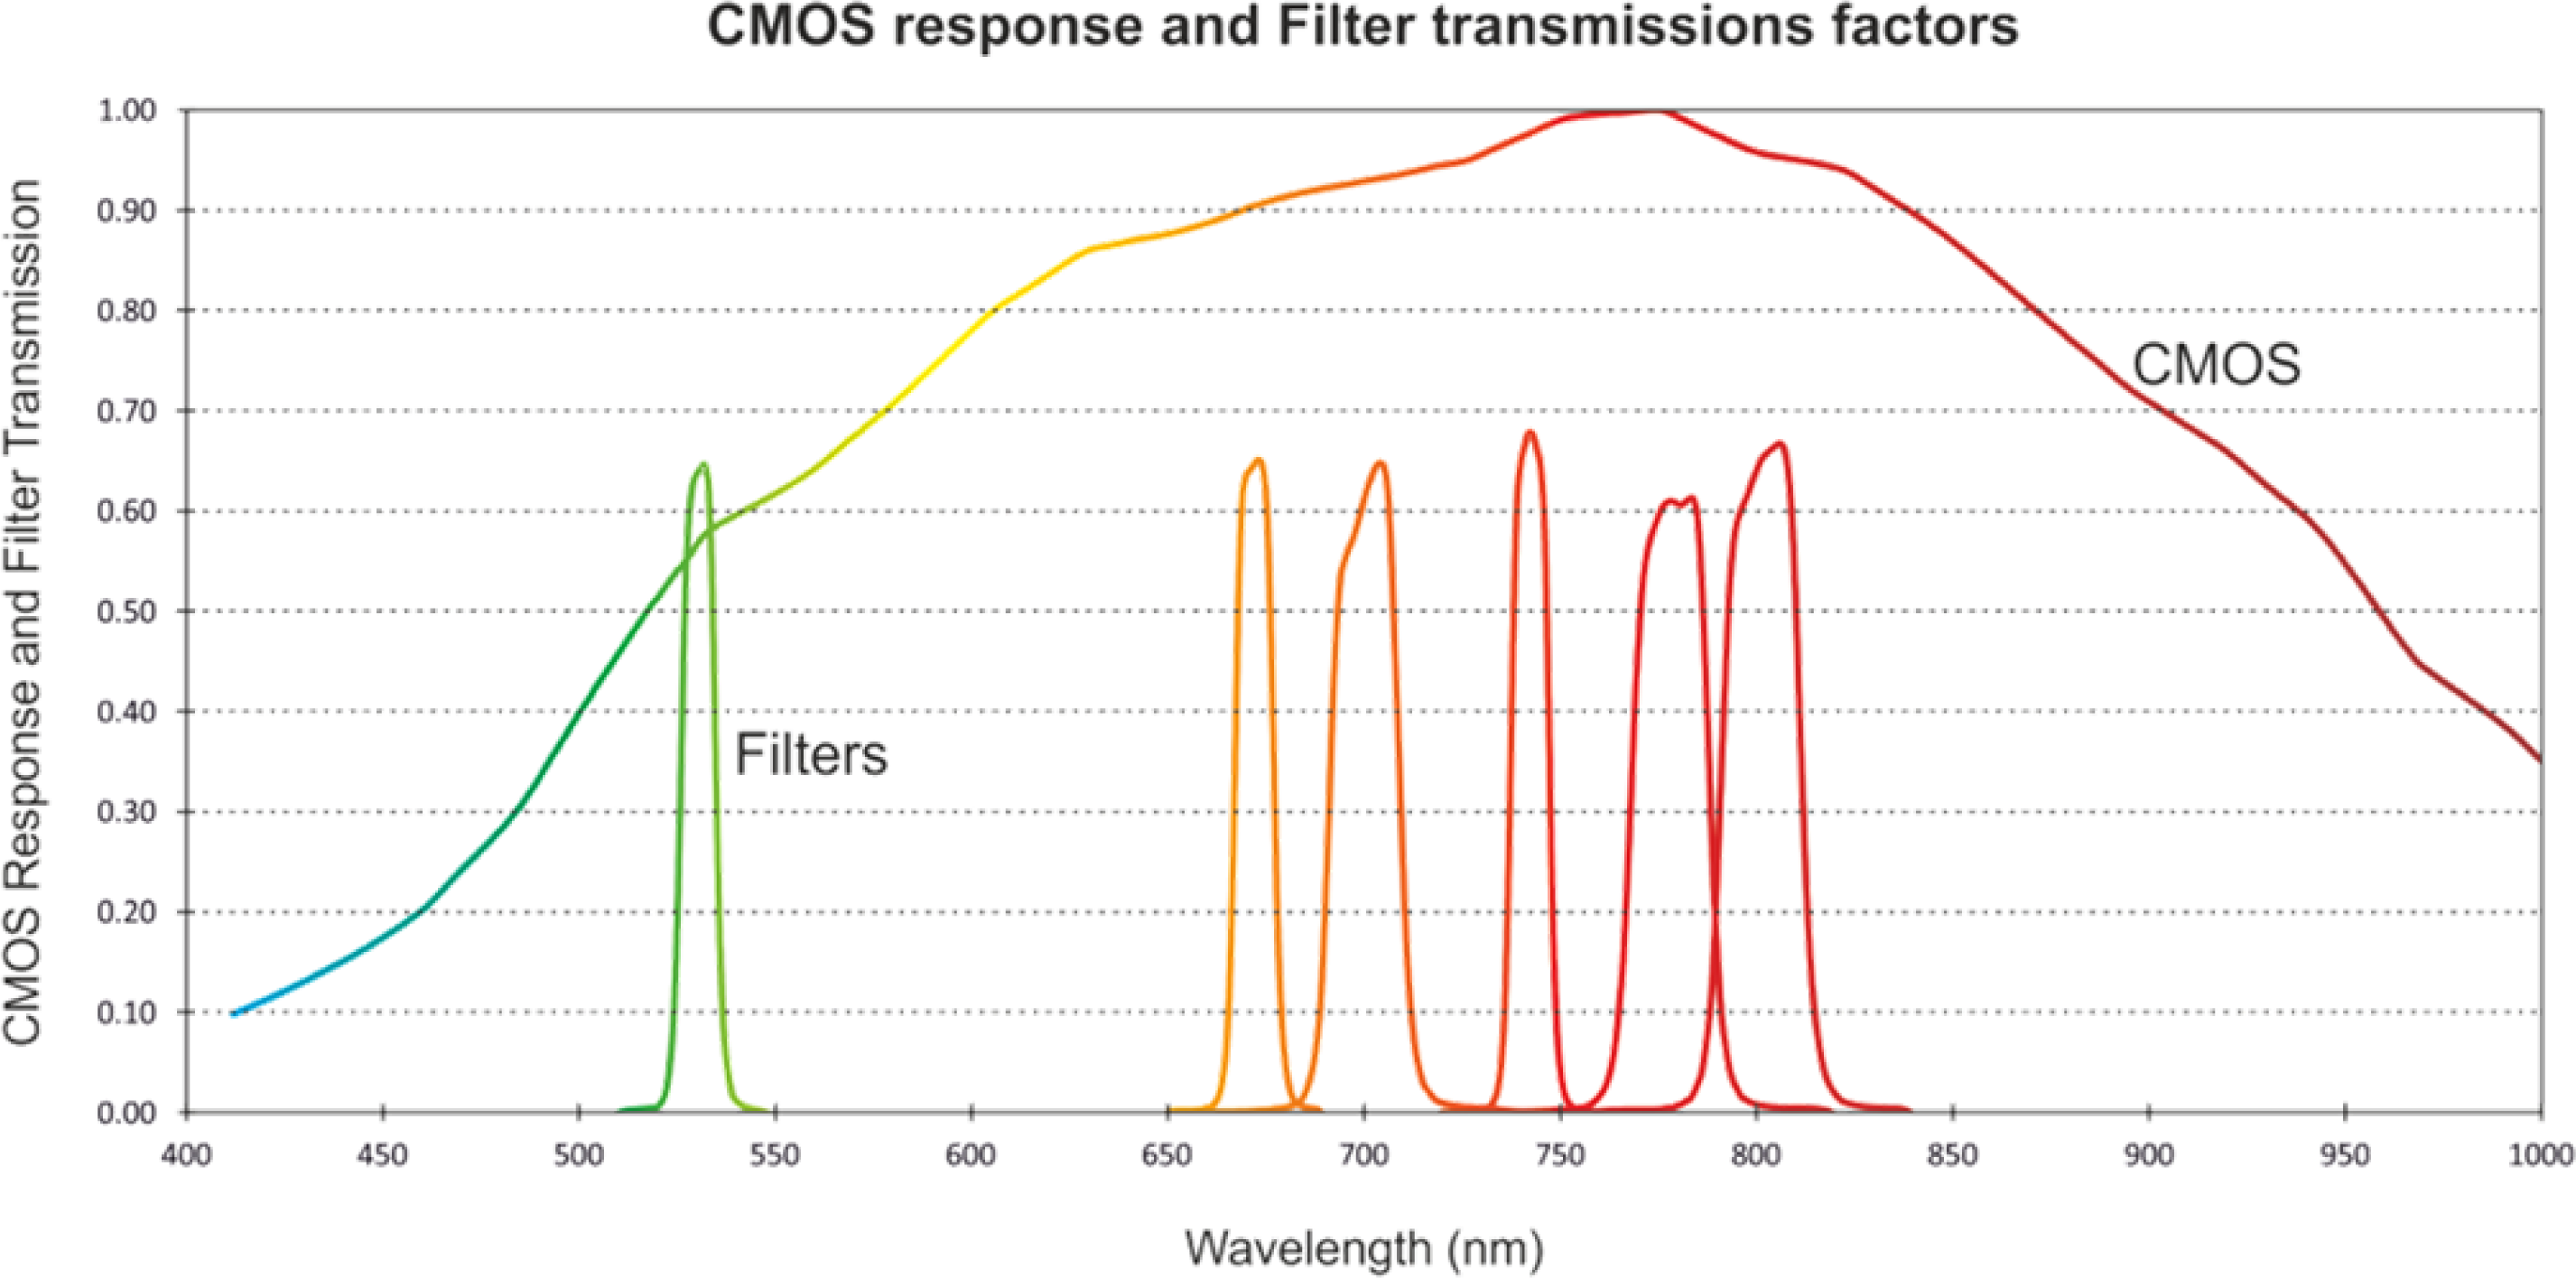
Each of the six channels of the camera is constituted by a CMOS (complementary metal-oxide-semiconductor) sensor and a filter with a pre-set performance against the spectral range. Such filters are characterized by a central wavelength in the range of 531 to 801 nm.
The spectral response of the CMOS is not uniform, due to quantum efficiency and sensitivity. In turn, filters do not have the same transmittance. The combination of CMOS and the 6 filters is reflected by a reduction in the radiance captured by the camera. These responses are defined in the following graphic (Figure 2), according to the manufacturer’s data (Andover Corporation; Salem, NH, USA and Tetracam Inc.; Chatsworth, CA, USA).
Figure 2 shows the spectral range covered by the camera (green, red and near-infrared). The exposure time of each filter is different for the same capture and has the following relationship (Table 2):
The unmanned aerial system was an eight-rotor Oktokopter [24] (Figure 3), which has a gimbal stabilized with two degrees of freedom. This multi-rotor has an IMU system with 10 degrees of freedom and a GNSS, thanks to which scheduled flight paths can be established. The most relevant characteristics are specified in Table 3.
The spectroradiometer used to carry out the calibration was the FieldSpec 3 ASD (Analytical Spectral Devices) spectroradiometer. This is a general-purpose spectroradiometer used in different areas of application that require reflectance, transmittance, radiance and irradiance measures, and it is especially designed to acquire spectral measurements in the visible to short-wave infrared range.
The spectroradiometer is a compact, portable instrument that allows one to capture spectral data in the region from 350 nm to 2500 nm, with a spectral resolution of 1 nm. The spectroradiometer is configured by three detectors, separated by appropriate filters to eliminate the light of lower orders. The electromagnetic radiation projected onto a holographic diffraction grating is captured through an optical fiber. This grid separates and reflects wavelength components, to be measured independently by detectors. The visible/near-infrared (350–1000 nm) portion of the spectrum is measured by a 512-channel silicon photodiode array overlaid with an order separation filter. The short-wave infrared (SWIR) portion of the spectrum is acquired with two scanning spectrometers: for wavelength ranges of 1000–1830 nm and 1830–2500 nm. Each SWIR spectrometer consists of a concave holographic grating and a single thermo-electrically cooled indium gallium arsenide (InGaAs) detector with a 2-nm sampling interval.
The incoming light to the device is captured through a 3-m optical fiber, whose field of view (FOV) is modified by various foreoptics.

2.2. Flight Planning

Proper planning of UAS flights is an important aspect in order to ensure that the data capture fits the theoretical parameters and user requirements pursued and optimizes the available resources. Furthermore, risks to humans are avoided, and higher quality images can be obtained.
This planning takes into account all the limitations and restrictions that are required by the final images themselves to meet the objectives of the study, acting as a guarantee in the photo capture process. The values that can be specified include the position and attitude of the camera, the flight path, the design of the different image blocks, the determination of the overlaps between the different images, the required camera angles, the scale (through the choice of the pixel size on the ground (GSD (Ground sampling distance)) and control of the time of flight, among others. The theoretical GSD value, which sets the geometric resolution of the study, is defined as:
GSD = h × S f
where h is the flight height, S the pixel size and f the camera focal length.
One of the most important factors is the overlap between images, since this will ensure greater robustness of the geometry captured, determining the image orientations and the reconstruction of the object with greater accuracy and reliability [25]. A UAS flight without the proper flight planning will merely lead to a waste of resources, since the local topography will modify the theoretical flight parameters (GSD, forward and side overlap, etc.), causing them to move away from optimal values. A local increase in height in the study area will lead to a higher spatial resolution (a decrease in h), but also decrease in image overlap, and gaps may appear between the strips.
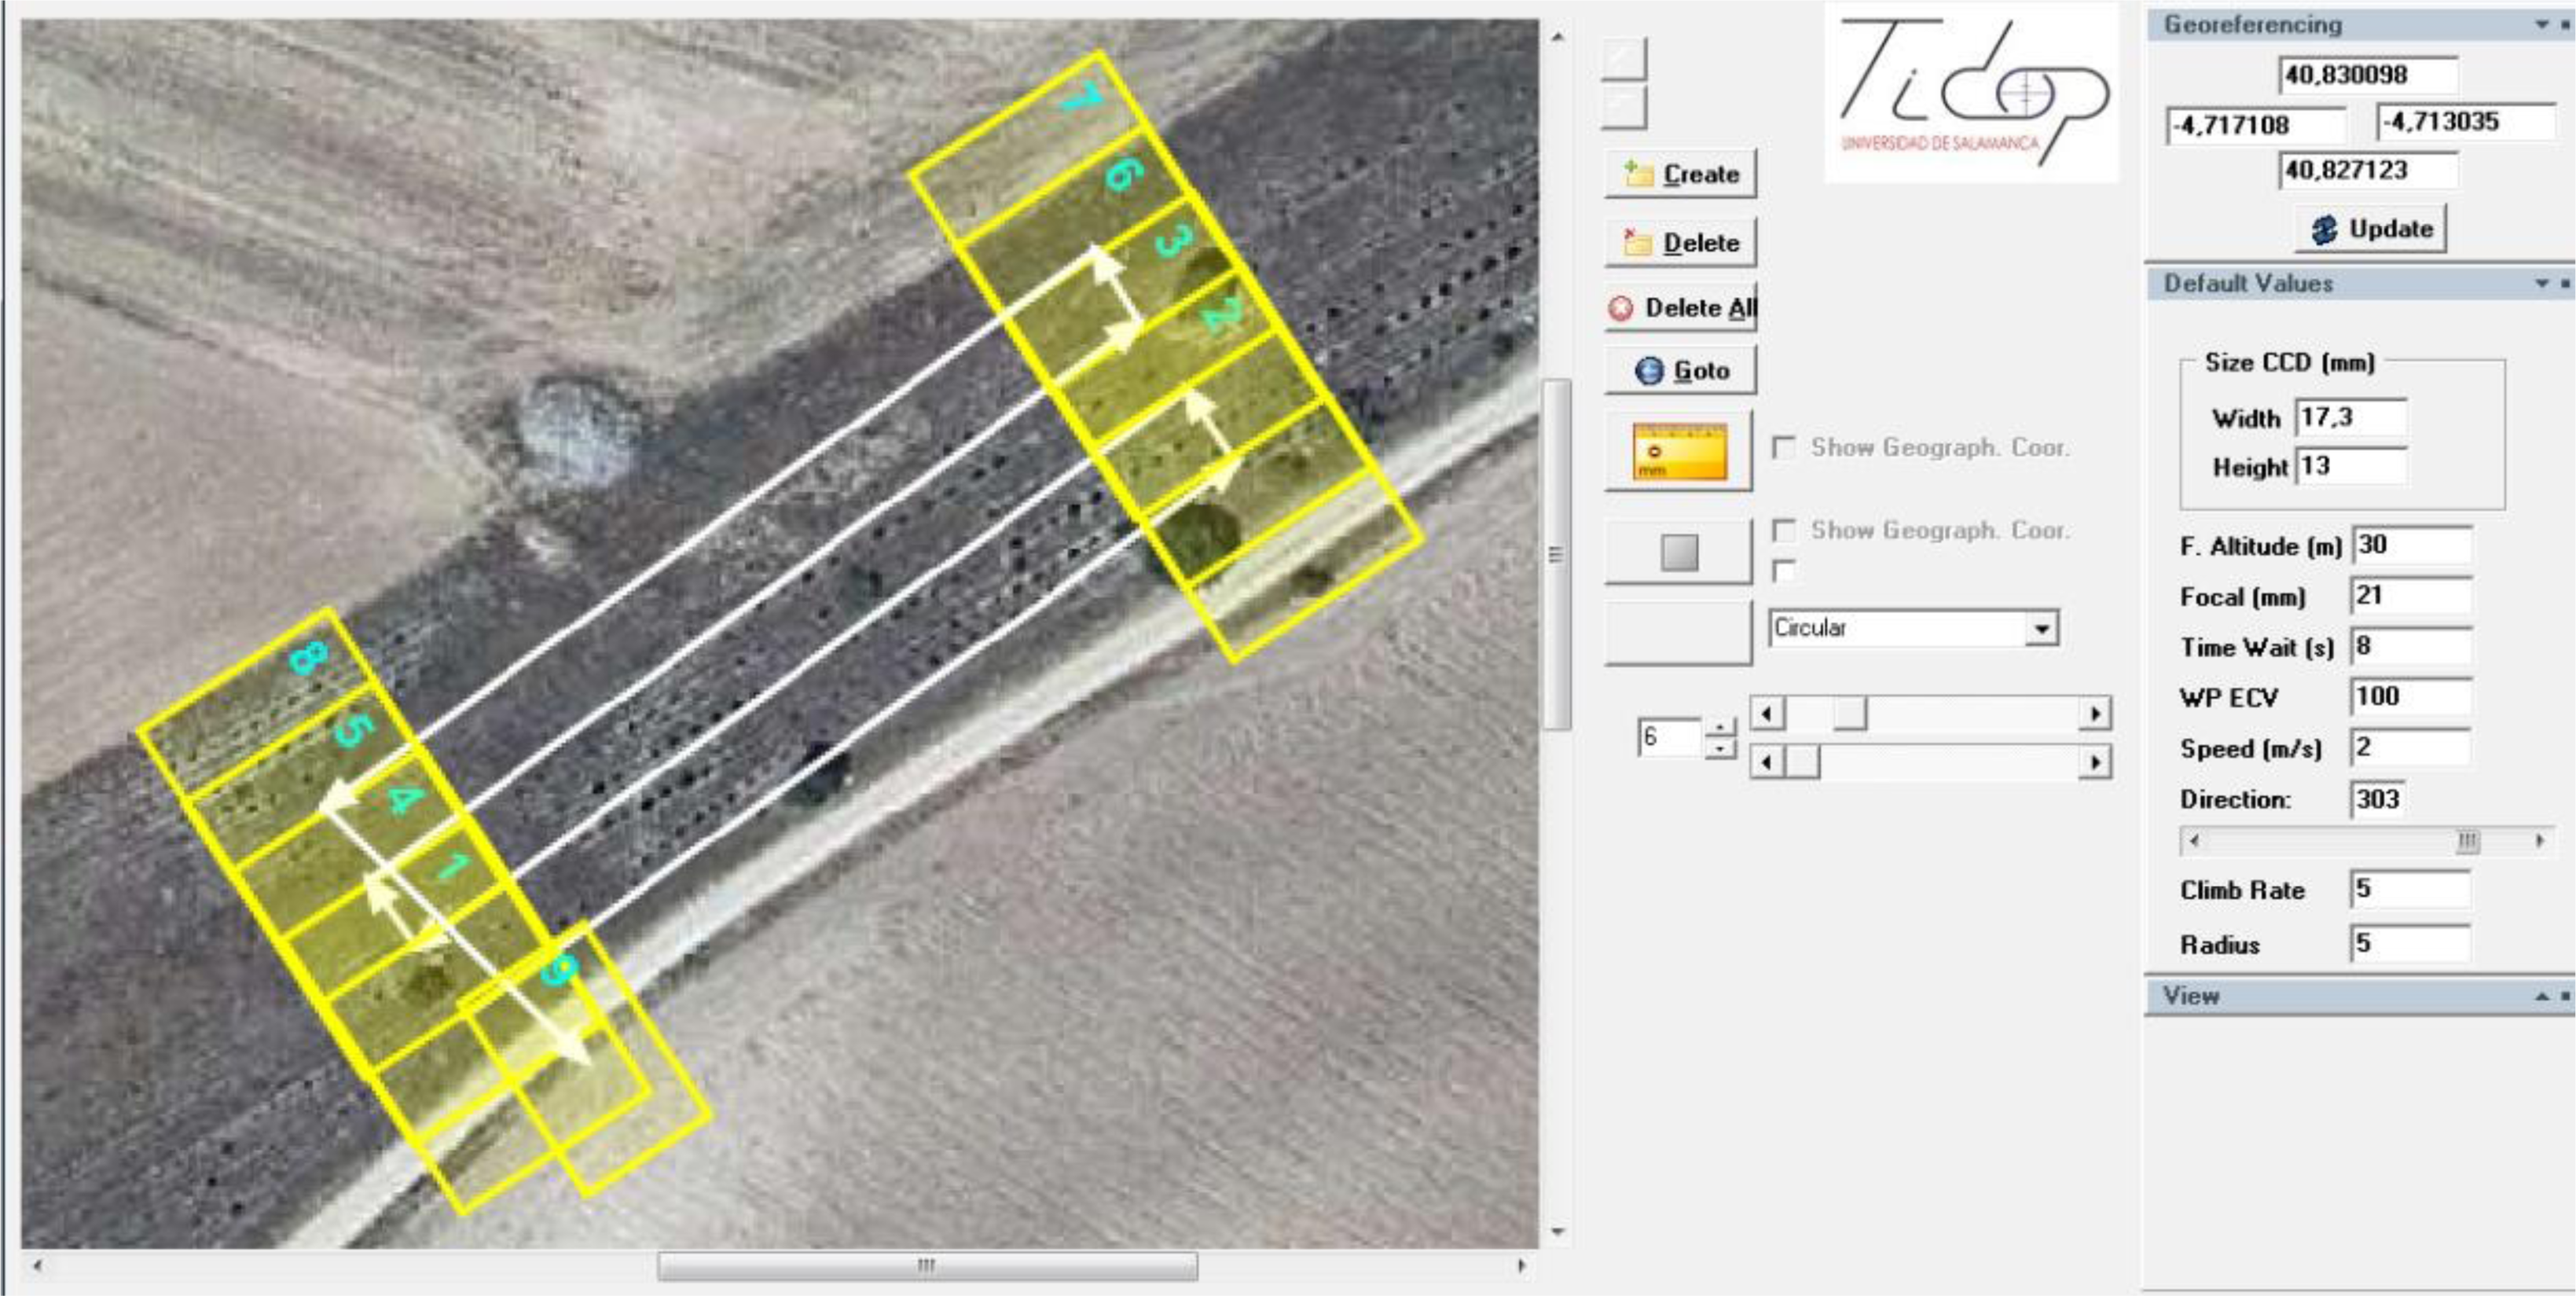
For this study, the planned flight was carried out (Figure 4) with a flight height of 30 m and a GSD of 16 mm, allowing the radiometric calibration of the camera to be resolved correctly. The flight path was calculated with the UFLIP (UAS Flight Planning) software (developed by the Tidop research group), which allows the above photogrammetric flight planning parameters to be taken into account.

3. Multispectral Camera Correction

The use of a multispectral sensor requires a series of corrections prior to the radiometric calibration process: background error and vignetting. Furthermore, an additional geometric correction (geometric calibration) necessary for correct channel fusion is considered. All these corrections are determined in a single laboratory analysis and only need to be checked periodically to ensure their stability or when the camera is modified.

3.1. Background Error Correction

Image noise sources can be classified as signal-dependent noise (photon shot noise) and signal-independent noise (dark current, amplifier noise, quantization error) [26]. Some of these noise sources, such as the quantization error, may be negligible, as long as the noise does not exceed the quantization interval of the ADC (Analog to Digital Converter). However, a multispectral camera may be affected by non-random errors [27], which will degrade the final image quality.
This study analyzed the background error recorded by the camera, whose bimodal behavior was different for each channel and more pronounced on high-reflectance surfaces and is not related to the random noise caused by the sensor electronics (dark current). The systematic error has two configurations: on the one hand, a series of periodic horizontal bands, due to the blockage of the diaphragm; and on the other hand, a pseudo-texture in the distribution of digital levels. This systematic error is assessable in a completely dark room in the absence of light, where only the random noise component is to be expected.
To eliminate both effects, a laboratory analysis was undertaken in the absence of light, evaluating the average response of the camera per channel under different exposure times. The maximum background error for this study involved a 0.49% increment in the digital level value.

3.2. Vignetting

The term vignetting refers to the effect of the brightness attenuation of an image as we depart from its principal point radially. This phenomenon occurs due to the effective size of the camera lens aperture. Vignetting is decreased proportionally to lens aperture (or inversely to the f-number). Furthermore, vignetting is related to the focal length, since the angle of the light incidence on the sensor causes a dimming, such that wider-angle lenses are more affected by this phenomenon.
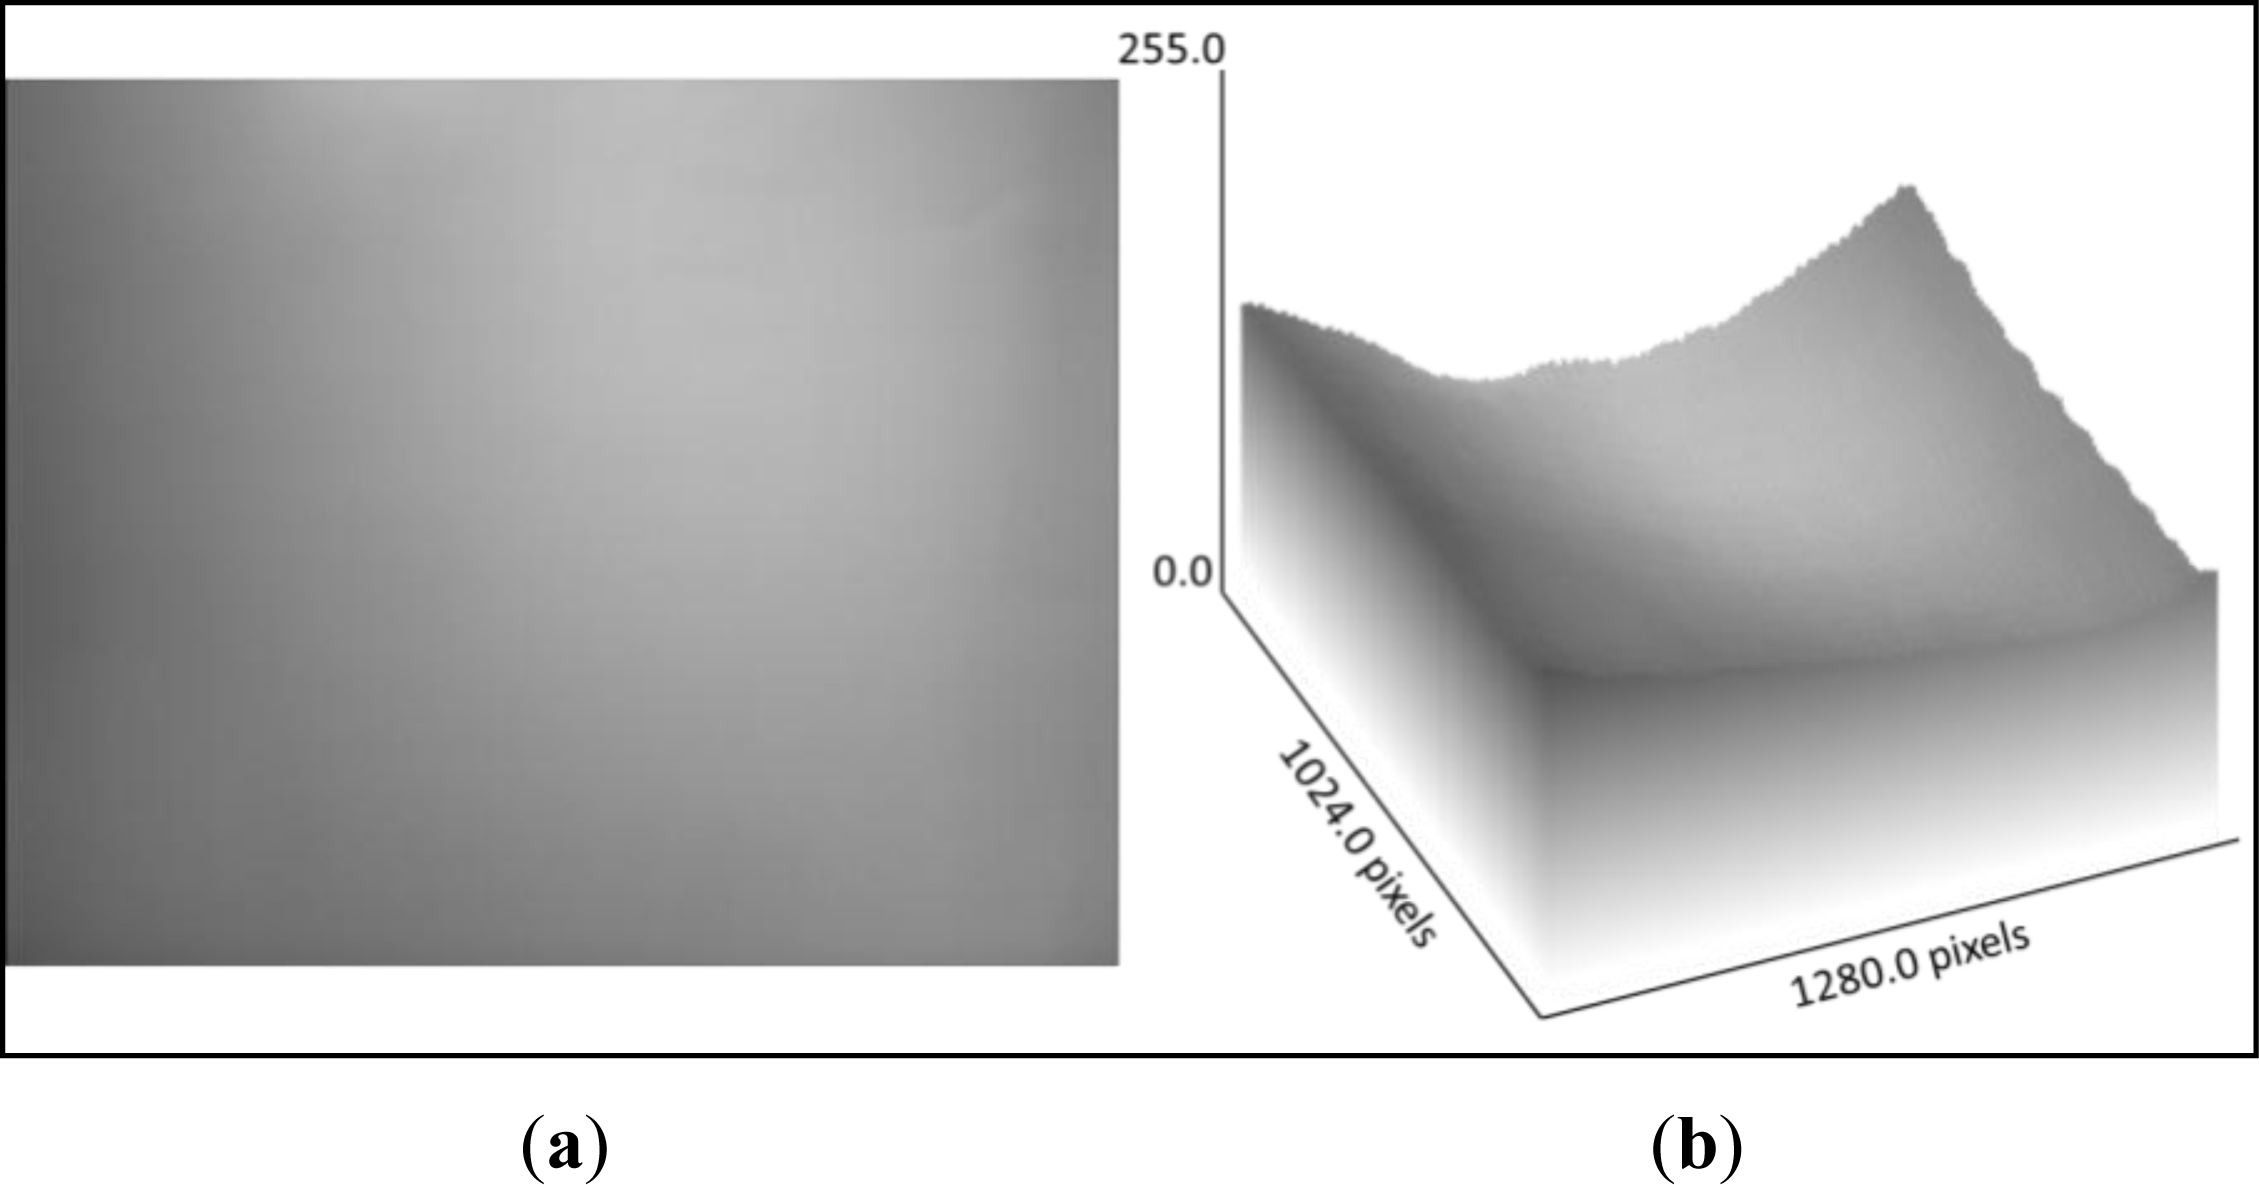
Since this condition affects the image radiometry, it was corrected to ensure that each pixel would contain the correct digital level. The study was conducted in a laboratory, with uniform illumination, acquiring a series of photographs of a white pattern with low-specular reflection [27,28] (Figure 5).

3.3. Geometric Distortion

Geometric distortion caused by the camera lens can be considered as a supplementary aspect to the radiometric calibration process. Moreover, the processing of geometric distortion involves an alteration of digital levels, due to the resampling process, and hence, its correction (direct or reverse) should be carried out in the final stage.
The goal is to determine the geometric (principal point coordinates, xp, yp, and principal distance, f) and physical (radial and tangential distortion) parameters that define the internal orientation of the camera, using a laboratory calibration.
This aim can be achieved thanks to a protocol in which image shots are convergent to a pattern or grid of known dimensions and by applying the collinearity, which relates image points with ground points. In particular, an open source tool, Bouguet [29], was used. More specifically, a set of images with a planar checkerboard pattern were acquired under different roll and pitch angles. The images ensured that the pattern covered the largest area of the image in order to model the geometric distortions without extrapolations.
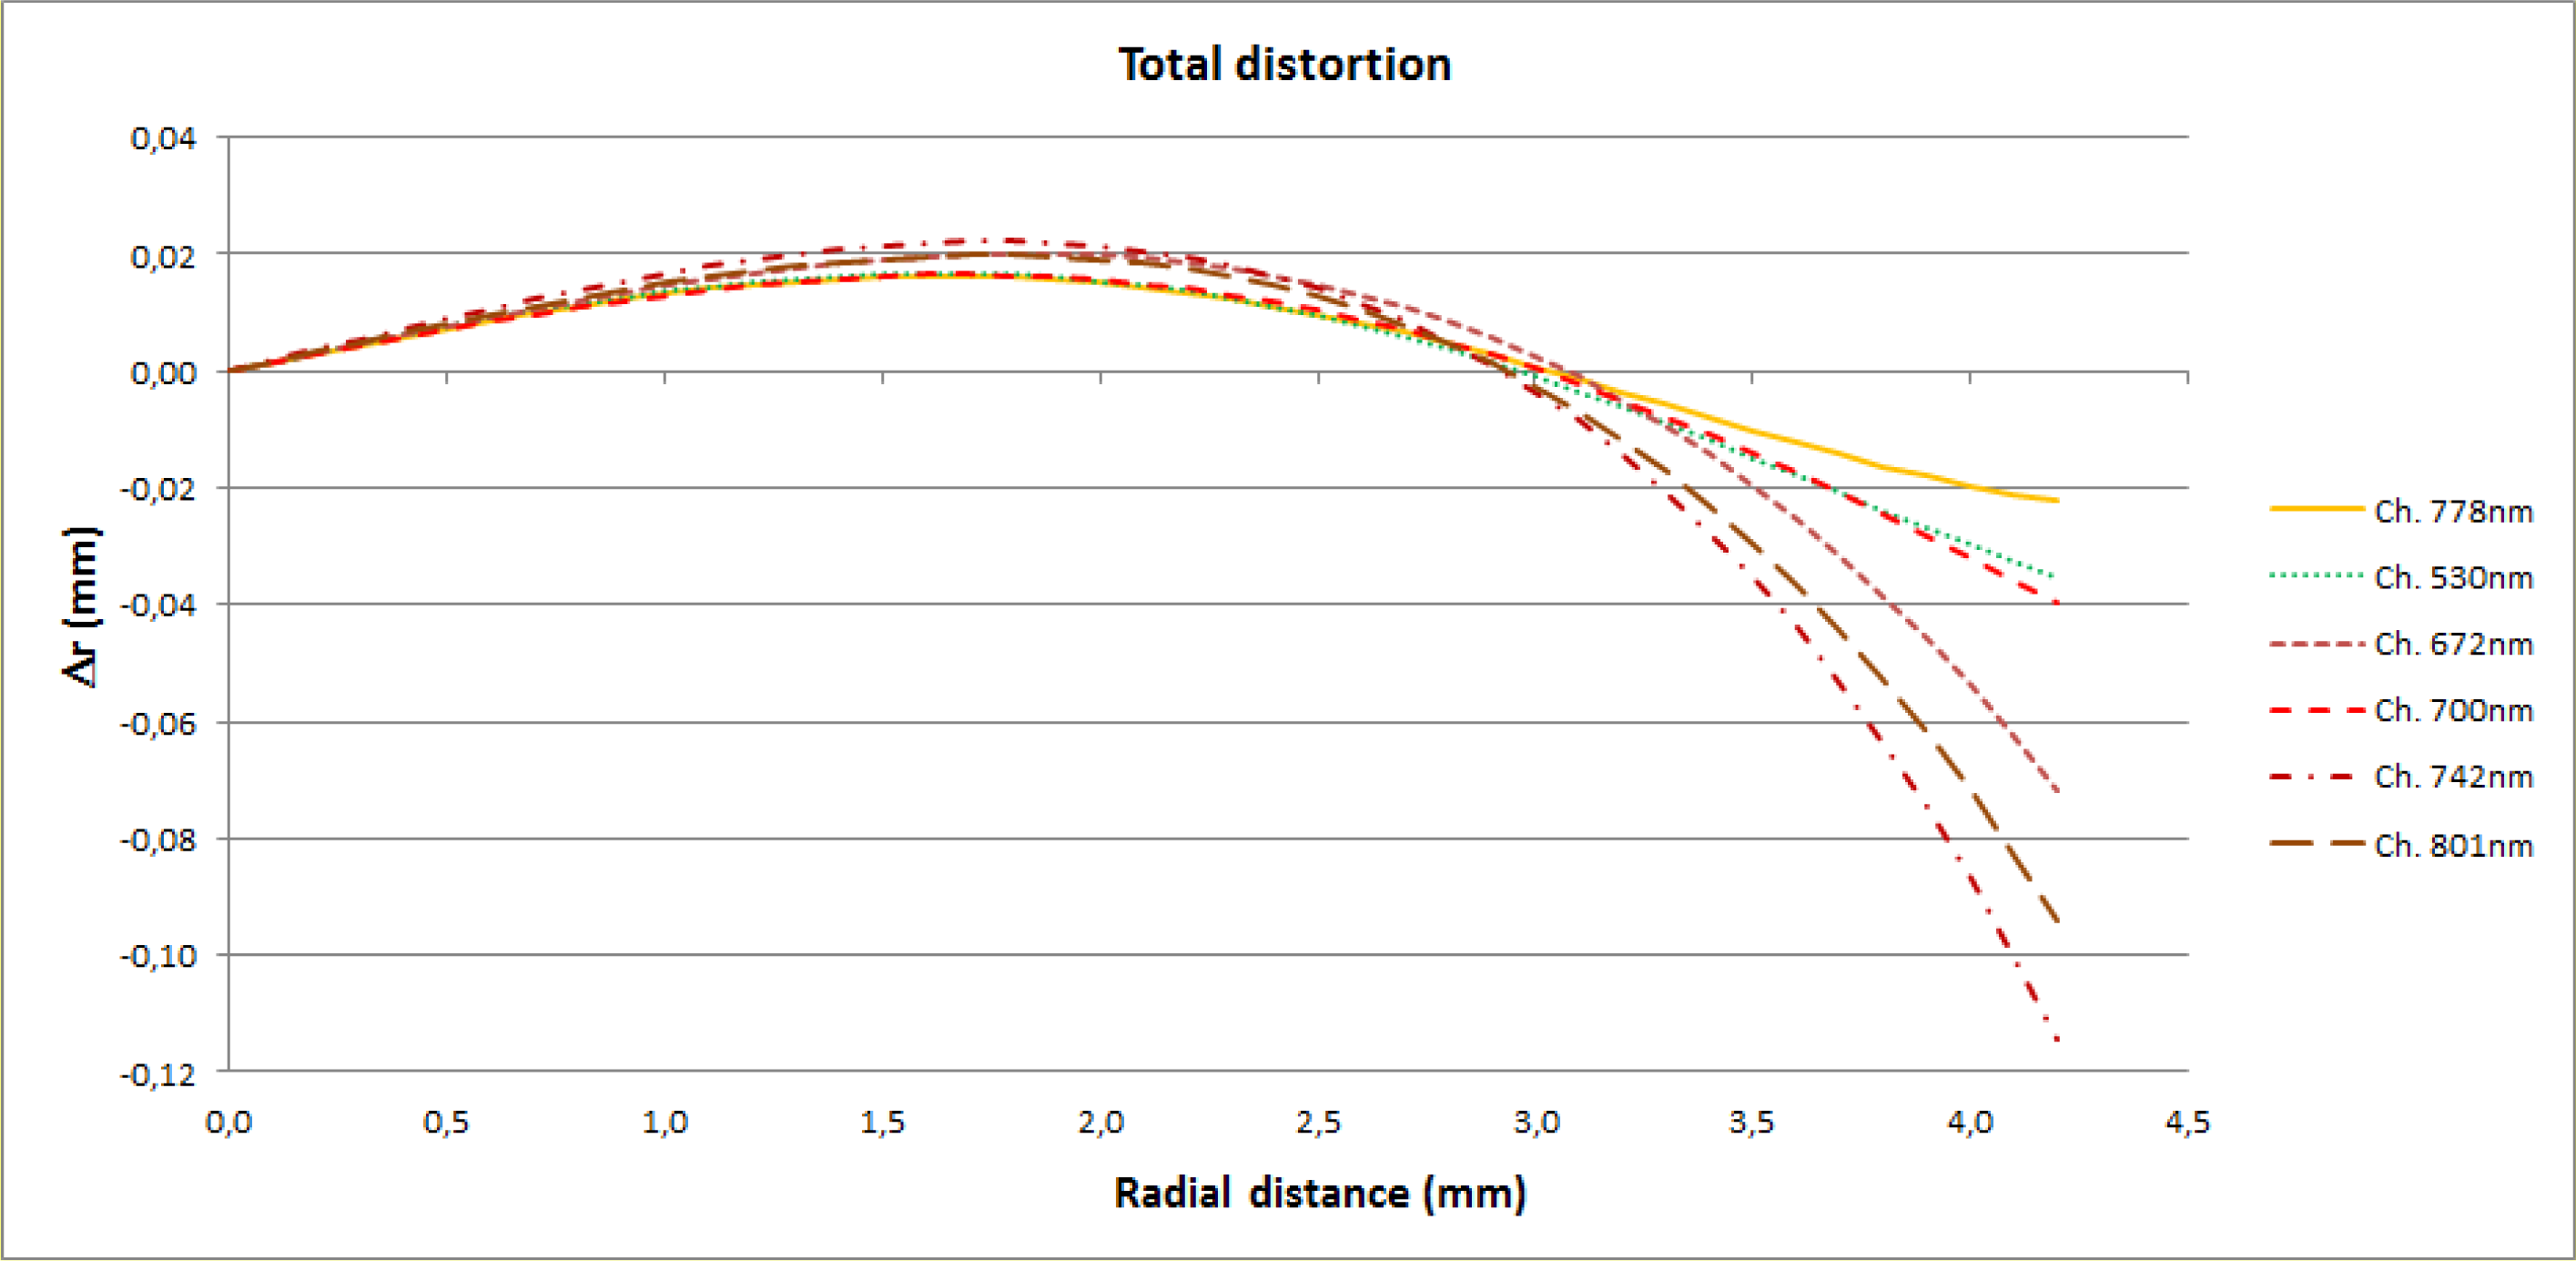
Table 4 shows the results of the 6-sensor camera (Tetracam Mini-MCA) calibration, expressed in the balanced model [30]. This distortion model fits the effect of radial distortion (Δr) through the coefficients, a0, a1 and a2, whereas the coefficients, P1 and P2, model the tangential component (Δt), according to the mathematical model of Equation (2):
Δ r = a 0 r + a 1 r 3 + a 2 r 5 Δ t x = P 1 ( r 2 + 2 ( x x p ) 2 ) + 2 P 2 ( x x p ) ( y y p ) Δ t y = P 2 ( r 2 + 2 ( y y p ) 2 ) + 2 P 1 ( x x p ) ( y y p )
where r′ stands for the radial distance of the real image (in contrast to the radial image of the ideal or undistorted image). The coefficients, a0, a1 and a2, are functions of the radial distance from the principal point of symmetry. Additional information about the geometric calibration can be found in [31].
The differences in construction between the sensors are also shown in Figure 6, where the maximum discrepancy reaches 18 pixels, illustrating the relevance of this geometric correction for individual image fusion.
Since the multispectral camera has six non-collinear objectives, the image fusion has to take into account, not only the calculated intrinsic camera parameters (specific for each sensor), but also the extrinsic parameters of the sensors; the three-axis orientation and spatial position. The distance, or baseline, among the optical centers of the sensors will cause a parallax [32] in the image fusion. This effect can usually be neglected in real applications (due to the height of the flight). However, for laboratory experiments or very low flights, this parallax can be considered by resampling the images according to the coefficients of the fundamental matrix [33].

4. Radiometric Calibration

4.1. Calibration Method

Analyses derived from data captured by multispectral cameras require previous knowledge of the radiometric calibration parameters of each channel. According to Dianguirard and Slater [34], radiometric calibration processes can be classified as:
  • Laboratory calibration before the flight (preflight calibration). This procedure involves a rigorous calibration of sensors.
  • Satellite or airborne calibration (onboard calibration), implementing checks during image acquisition. Lamps or solar-diffuser panels are used in this kind of calibration.
  • Calibration through in situ measurement campaigns (vicarious calibration). This entails an absolute radiometric calibration in flight conditions other than those found in the laboratory. Within this modality, the absolute method based on radiance or reflectance is included.
The radiance-based method is theoretically more accurate, and its uncertainty is approximately 2.8% versus 4.9% for the reflectance-based method [35]. This low value arises from the calibration and stability of the spectroradiometer required for calibration [34].
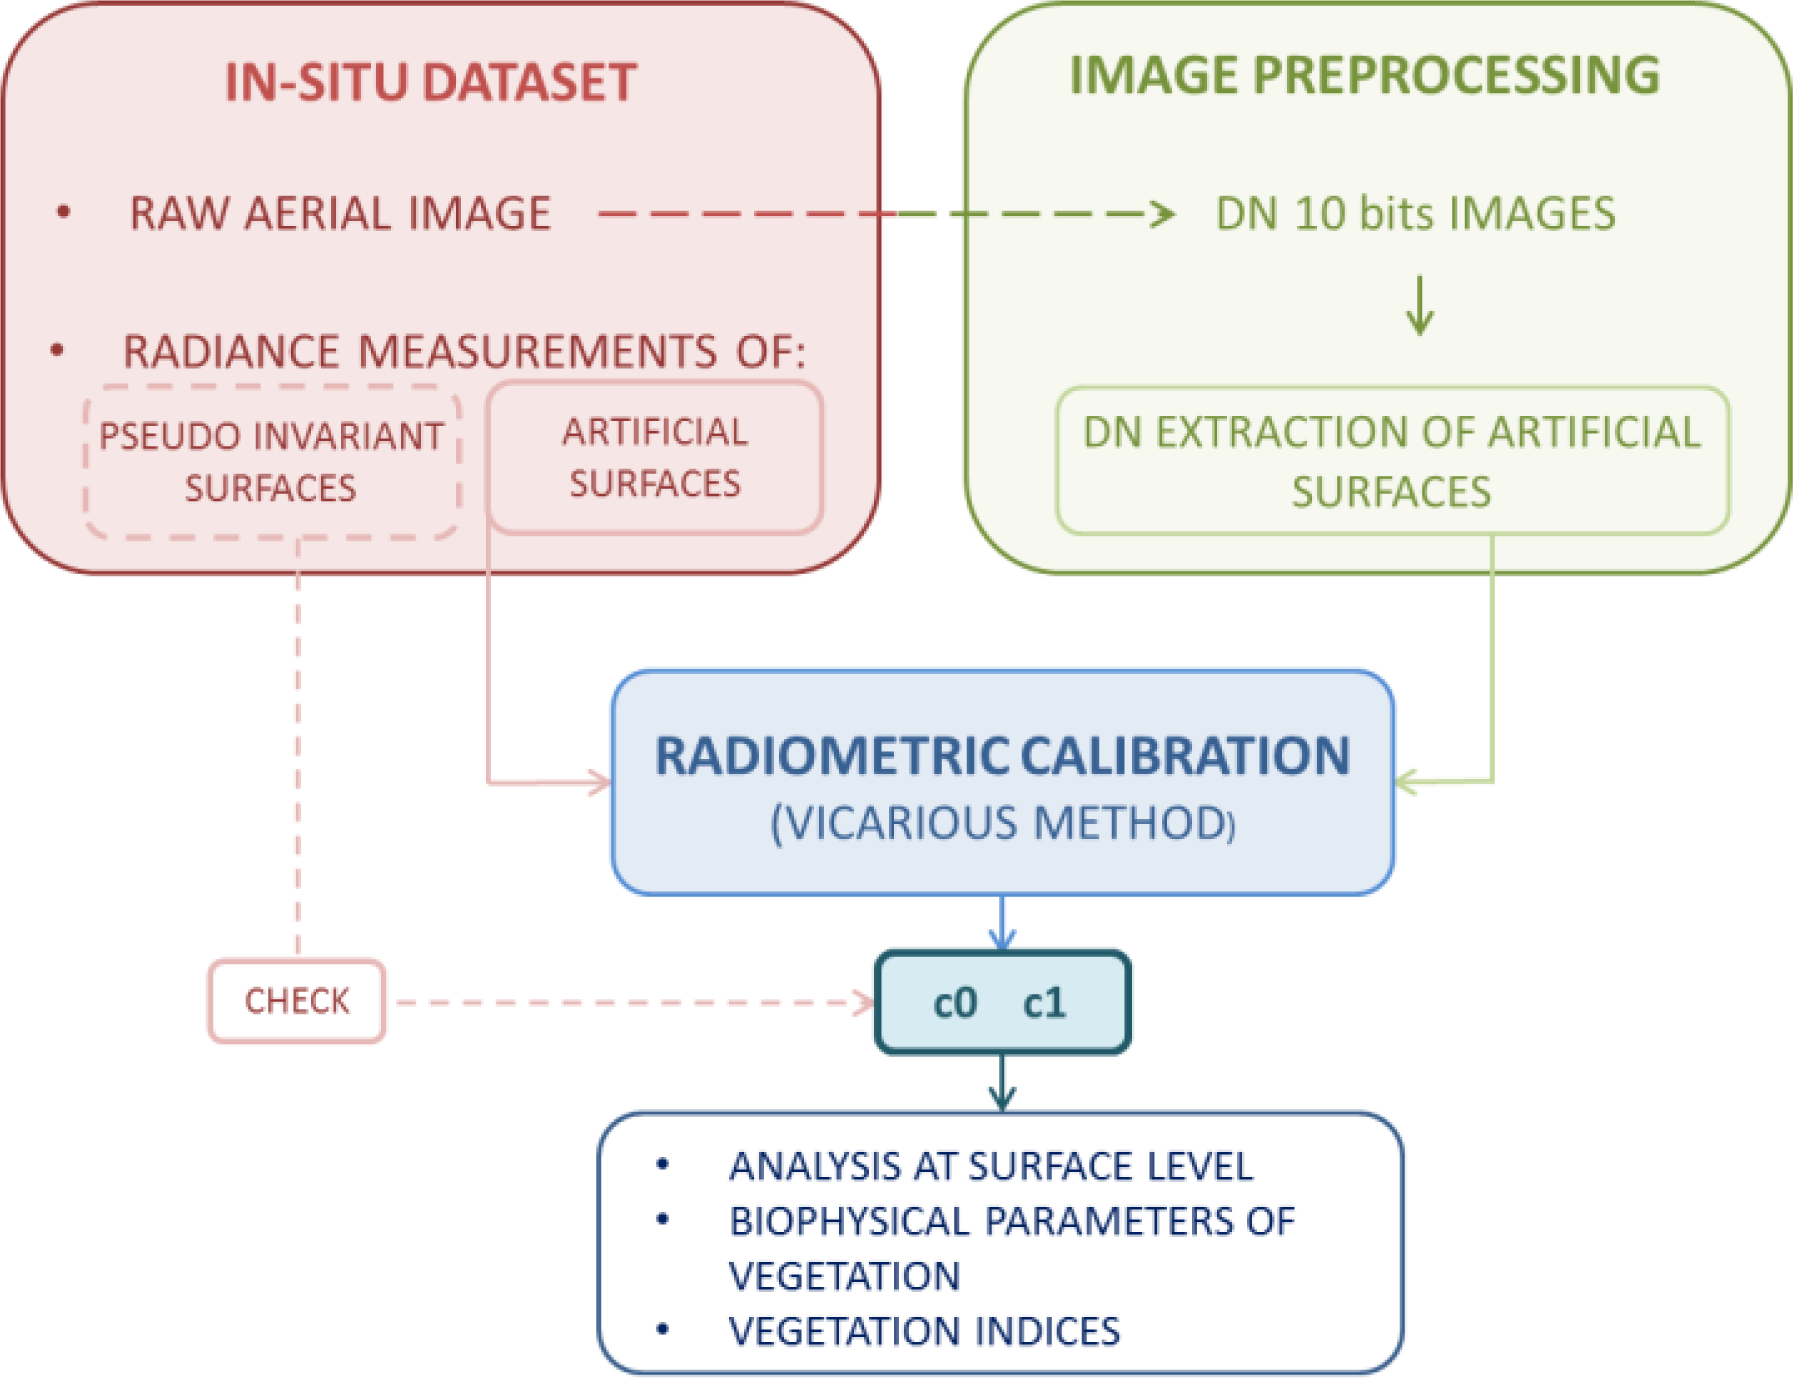
Among the different calibration methodologies, we chose a vicarious calibration based on the absolute radiance method (Figure 7), considering that the digital level that defines each pixel has a direct relationship with the radiance detected by the sensor [27,36].
Thus, for each spectral channel of the camera, a linear model is established that relates the digital level to the radiance captured by the sensor.
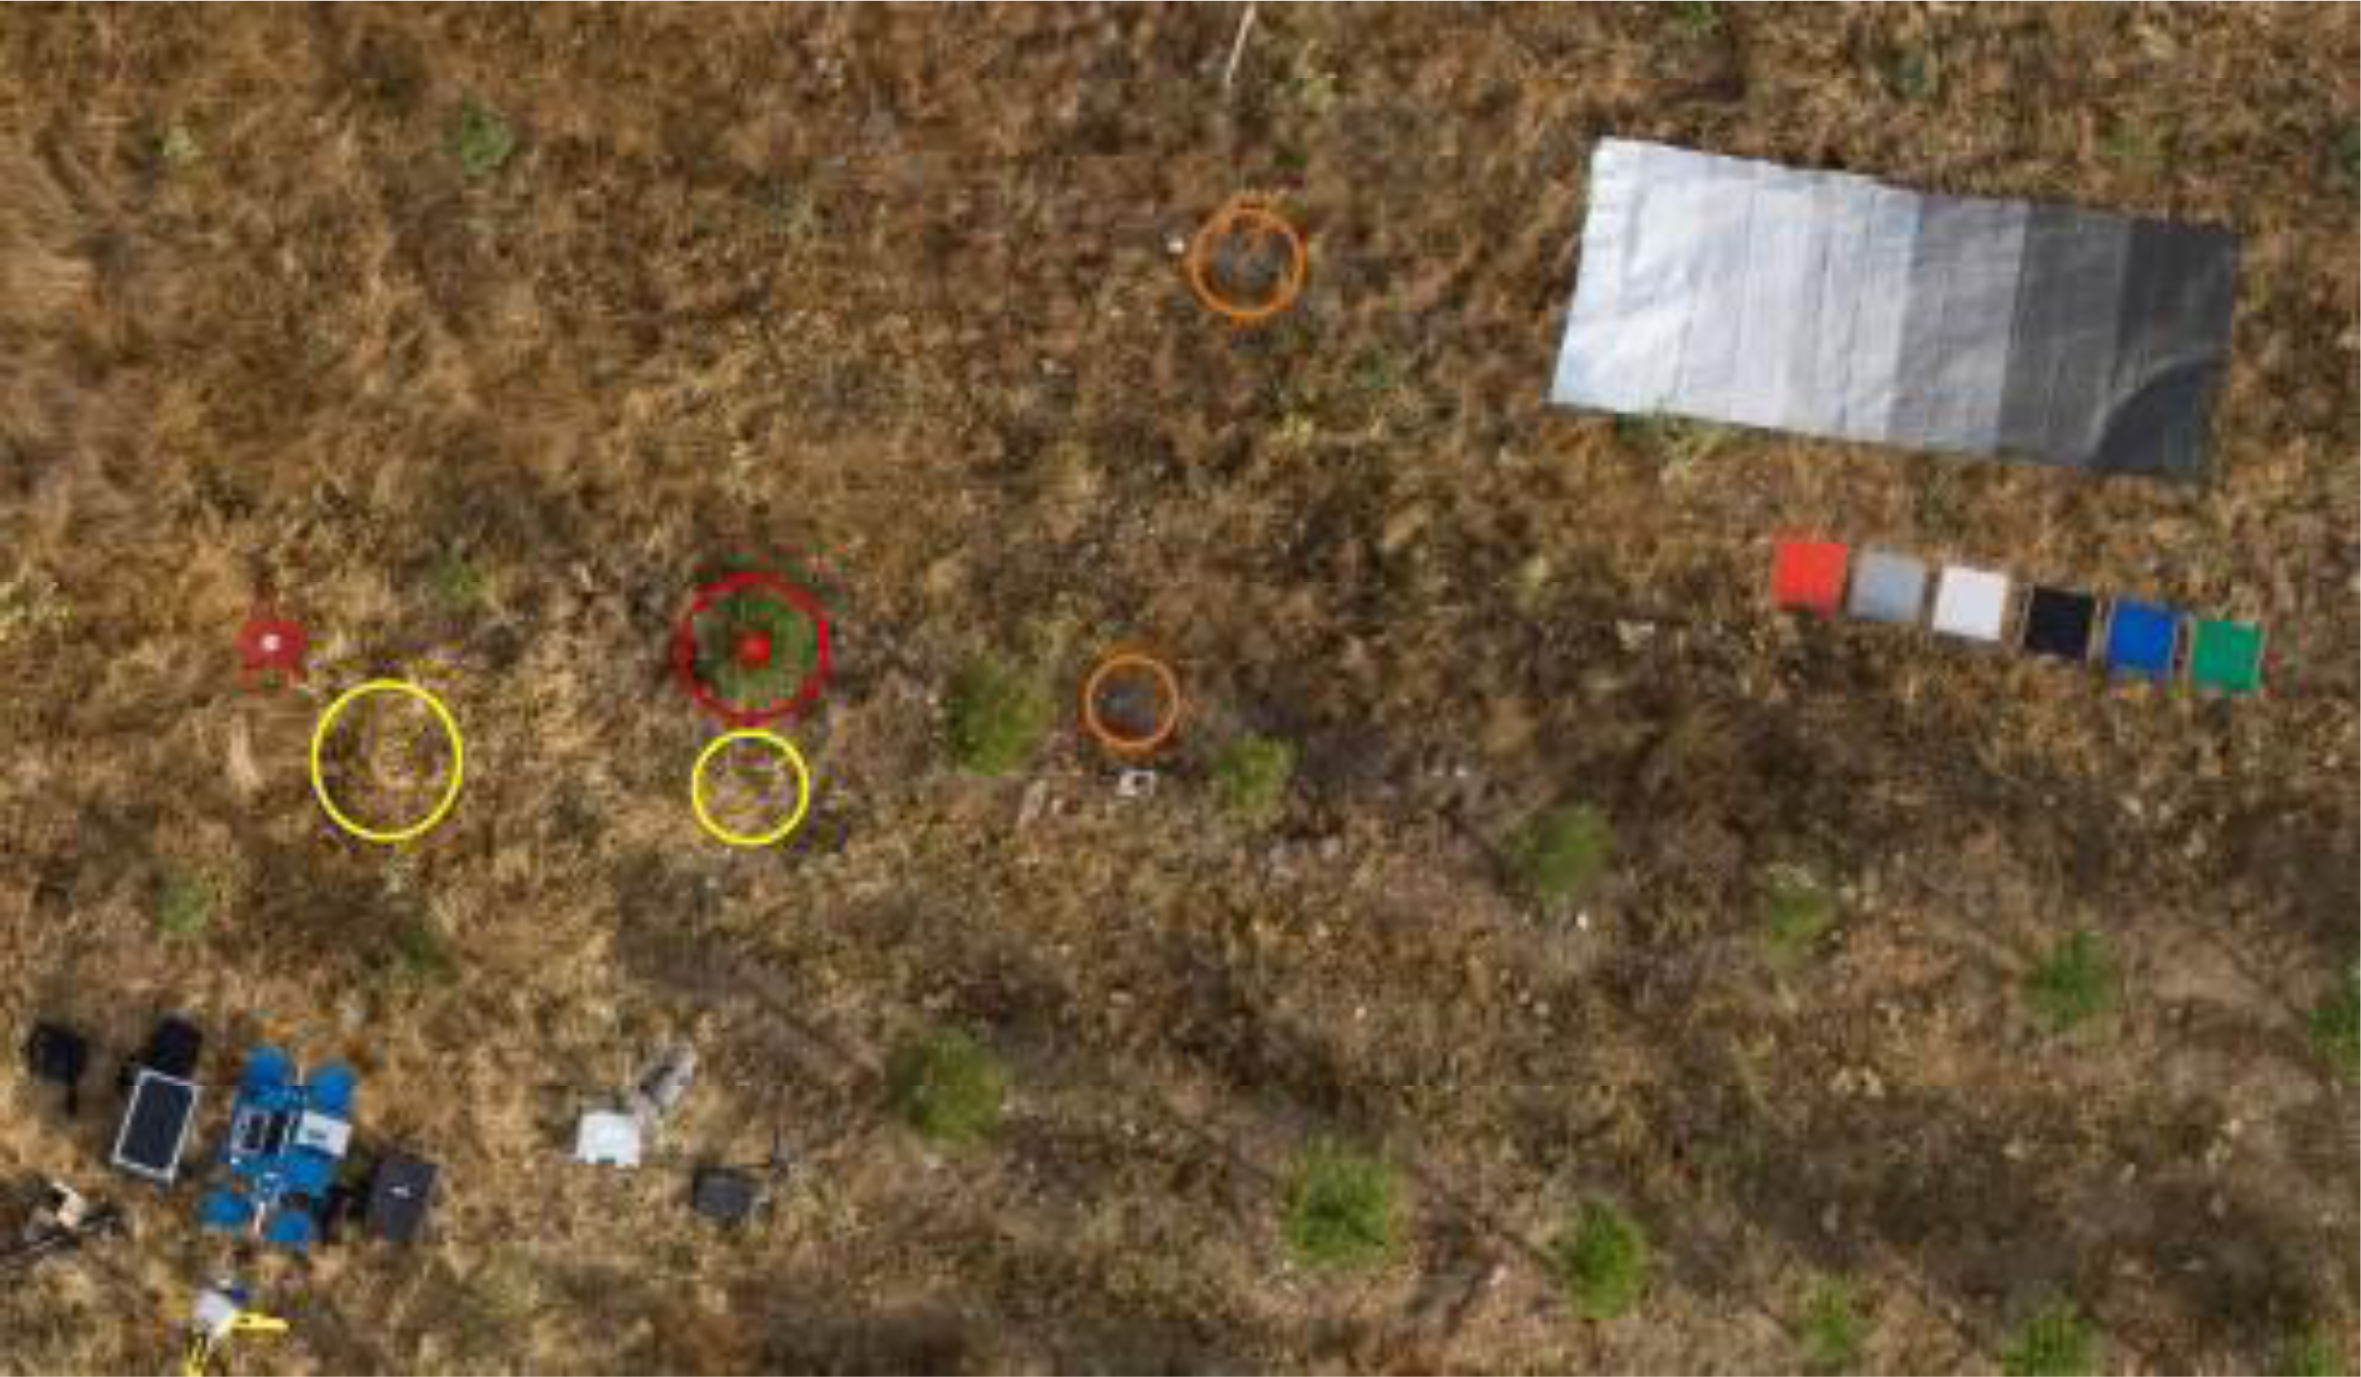
Radiometric calibration processes require homogeneous and Lambertian surfaces. Among the possible materials that could function as control surfaces, we chose low-cost elements: a canvas with 6 different tones of grey and 6 PVC (polyvinyl chloride) vinyl sheets with different colors.
For this calibration workflow, artificial targets were chosen instead of pseudo-invariant features, since they have proven to be more appropriate [18,37,38]. The critical factor for this selection is the requirement of uniform reflectivity with respect to the viewing direction and wavelength [38]. In the case of pseudo-invariant objects, these are not suitable, because their radiometric properties change over time [39,40]. Pseudo-invariant features were only employed as check surfaces.
Digital levels (DL) of artificial targets are extracted from the aerial images to calculate the relationship between them and the radiance of the surfaces (obtained with the spectroradiometer). The simplified radiative transfer model is defined according to the following equation:
L sensor = c 0 + c 1 × DL
Since several images are involved in the calibration adjustment, a luminance homogenization factor between photos was taken into account. This factor absorbs exposure differences (due to changes in lighting between different shots) and the inherent shutter time of each channel.
L sensor = c 0 + c 1 × DL × F h
where c0 and c1, offset and gain, are the calibration coefficients of each camera channel. The variable, Fh, is the homogenization factor of digital levels, defined as follows,
F h = F eq F v
where Feq is the exposure factor and Fv the shutter opening time factor.
Furthermore, because the images are affected by different types of radiometric distortion generated by the sensor (see Section 3), these corrections were taken into account in adjustment Equation (5), obtaining the final calibration model:
L sensor = c 0 + c 1 × D L × F h × R ( x , y ) × V ( x , y )
where R is the systematic background error correction and V the vignetting correction; both variables are functions of the pixel position in the image.
In classical aerial photogrammetry, aiming at the determination of physical parameters at the surface level and not at the sensor level, the 6S atmospheric model [41] has been applied. The modeling of the influence of the atmosphere on the propagation of radiation for a height of 1 m (spectroradiometer data captured) and 30 m (UAS flight height) shows no discrepancy. More specifically, the difference has an order of magnitude of <1 × 10⁻⁹ W·cm−2·sr−1·nm−1. Therefore, it could be suggested that in UAS photogrammetry, the influence of the surface to sensor component of the atmosphere is minimal, since radiation passes through a very small atmospheric column. Due to its reduced value, the relative atmospheric correction can be neglected in the adjustment model, as reported in [42].
Finally, the results of the radiometric calibration process were validated by checking the surface: natural covers, such as vegetation, soil-covered land and bare soil.

4.2. Fitting Model

From multiple artificial targets collected in several images, a least squares adjustment was applied.
A robust estimation was chosen instead of an ordinary least squares (OLS) method, since OLS is highly sensitive to outliers, because real measurements of error distributions have larger tails than the Gaussian distribution [43]. In our case, we chose the Danish Method proposed by Krarup [44], which, applied iteratively, gives a series of weights according to the residual values of the previous iteration.
In the first iteration, the weight matrix, W, is set as the identity matrix:
w i i = 1 ; w i j = 0 with i j x = ( A T W A ) 1 ( A T W K )
where x is the vector of calibration coefficients, A is the design matrix (digital levels) and K is the matrix of independent terms (radiance). The residual vector v is:
v = A × x K
whose a posteriori variance is:
σ ^ 2 = v T × W × v m n
where m is the number of equations and n the total number of unknowns.
From the first adjustment of residuals, new weights are calculated individually for each equation, based on the following weight function of the Danish estimator:
w ( v i ) = { 1 for   | v i | 2 σ ke cv i 2 for | v i | > 2 σ
where c is a constant that varies between 2 and 3, depending on the redundancy of the adjustment and data quality.
The convergence selection criterion of the iterative process is established based on the fulfillment of one of the following conditions:
  • Standard deviation estimator < 0.001;
  • Change in variance < 0.01;
  • When there are more than 20 iterations.
In the adjustment, an additional unknown was added per image to the x vector to absorb the heterogeneity regarding the possible variations in irradiance between images; this is more likely to occur in unstable weather conditions.

5. Experimental Results

5.1. Radiometric Campaign

The study area is located in Gotarrendura, a village close to Avila (Castilla y León, Spain). Data collection was carried out on 27 July 2012, on a pine plot of 2.52 ha, which was overflown at a height of 30 m. The pine species was Pinus pinaster, with a density of 1330 trees per hectare and a height between 1.5 and 2.1 m.
As control surfaces, a 5 m × 1 m greyscale canvas (GS) and six 0.55 m × 0.35 m vinyl sheets of different colors (red, gray, white, black, blue and green) were selected, similar to [42]. These artificial surface sizes guaranteed at least 21 pixels (up to 61 pixels), which exceeds the minimum of three times the GSD to rule out neighbor effects. The check surfaces, corresponding to natural covers (pseudo-invariant features), are highlighted with the yellow, orange and red circles in Figure 8.
The low-cost colored artificial targets provide a transportable test field as an alternative to a permanent radiometric calibration field. They also avoid the problems of painted targets associated with permanent test fields, caused by environmental conditions [45]. In the radiometric study, calibration surfaces were characterized using the spectroradiometer as a detector of the radiant flux that is reflected from such covers. During data acquisition, it was necessary to take into account that the incidence angle that the spectroradiometer gun formed with the surfaces was as orthogonal as possible, taking two spectral measurements per cover. Prior to each sample measurement, the calibrated white reference (Labsphere, Inc. Spectralon™, North Sutton, NH, USA) was measured. The spectra were measured in absolute radiance mode. Each spectral measurement is the average result of 120 individual spectra, following the protocol shown in [42].
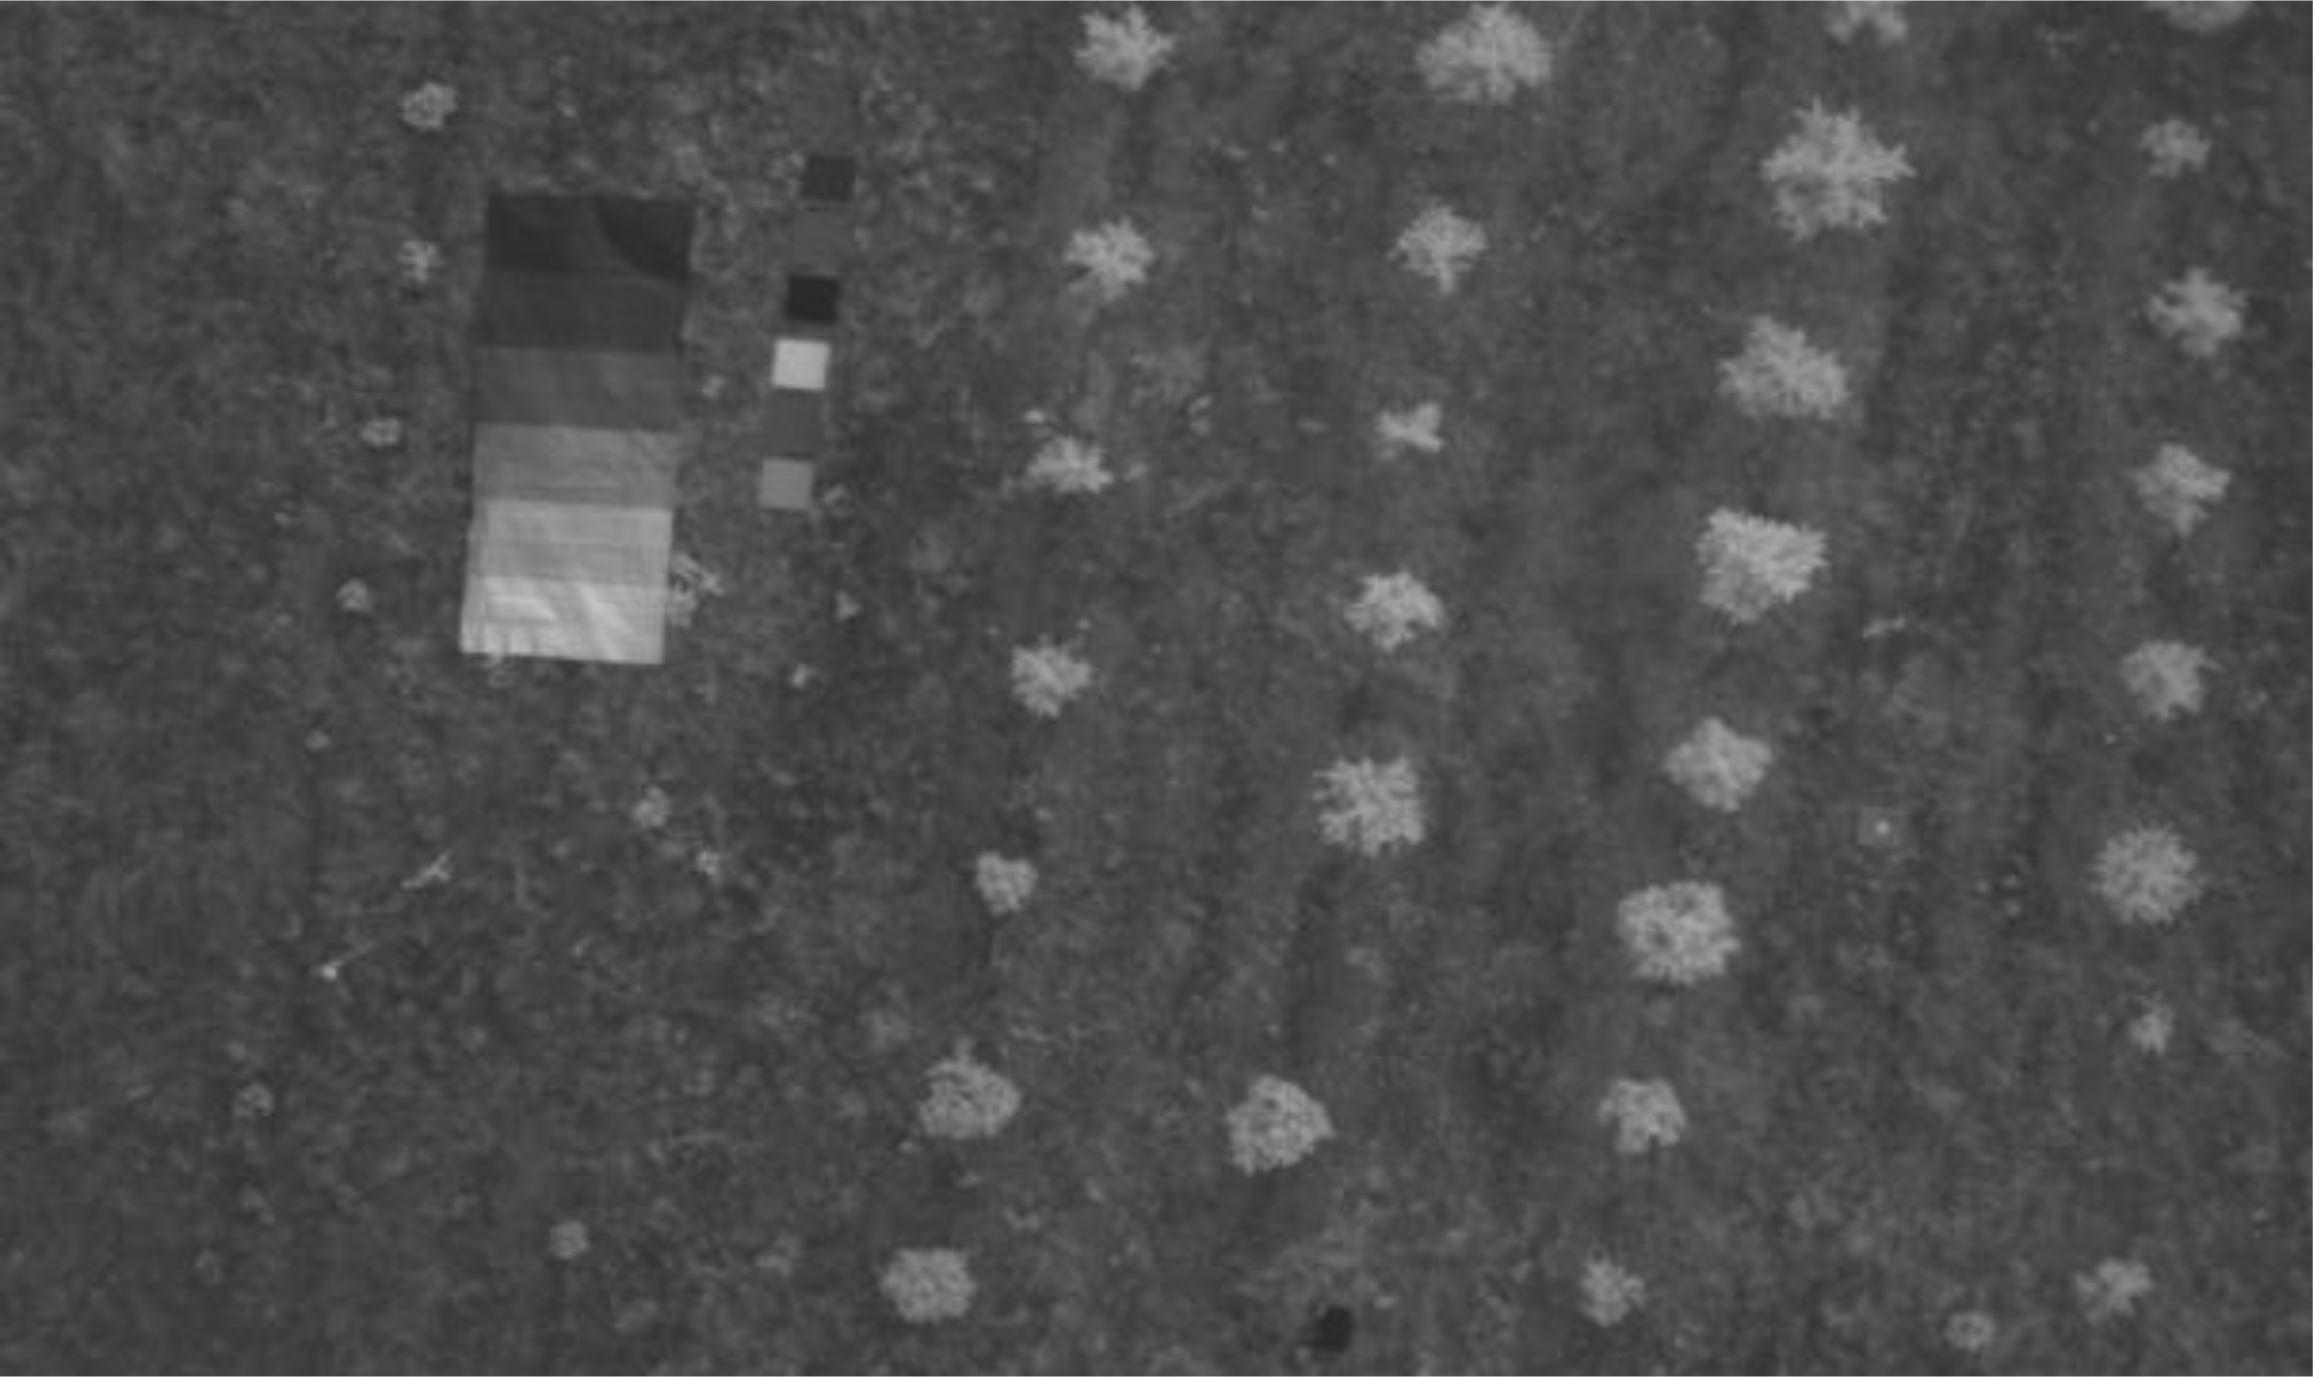
In parallel, a planned UAS flight was conducted over the study area, capturing multispectral images (Figure 9) and choosing those in which the maximum numbers of control and check surfaces were visible.
The selected radiance control surfaces were obtained from the spectroradiometer.
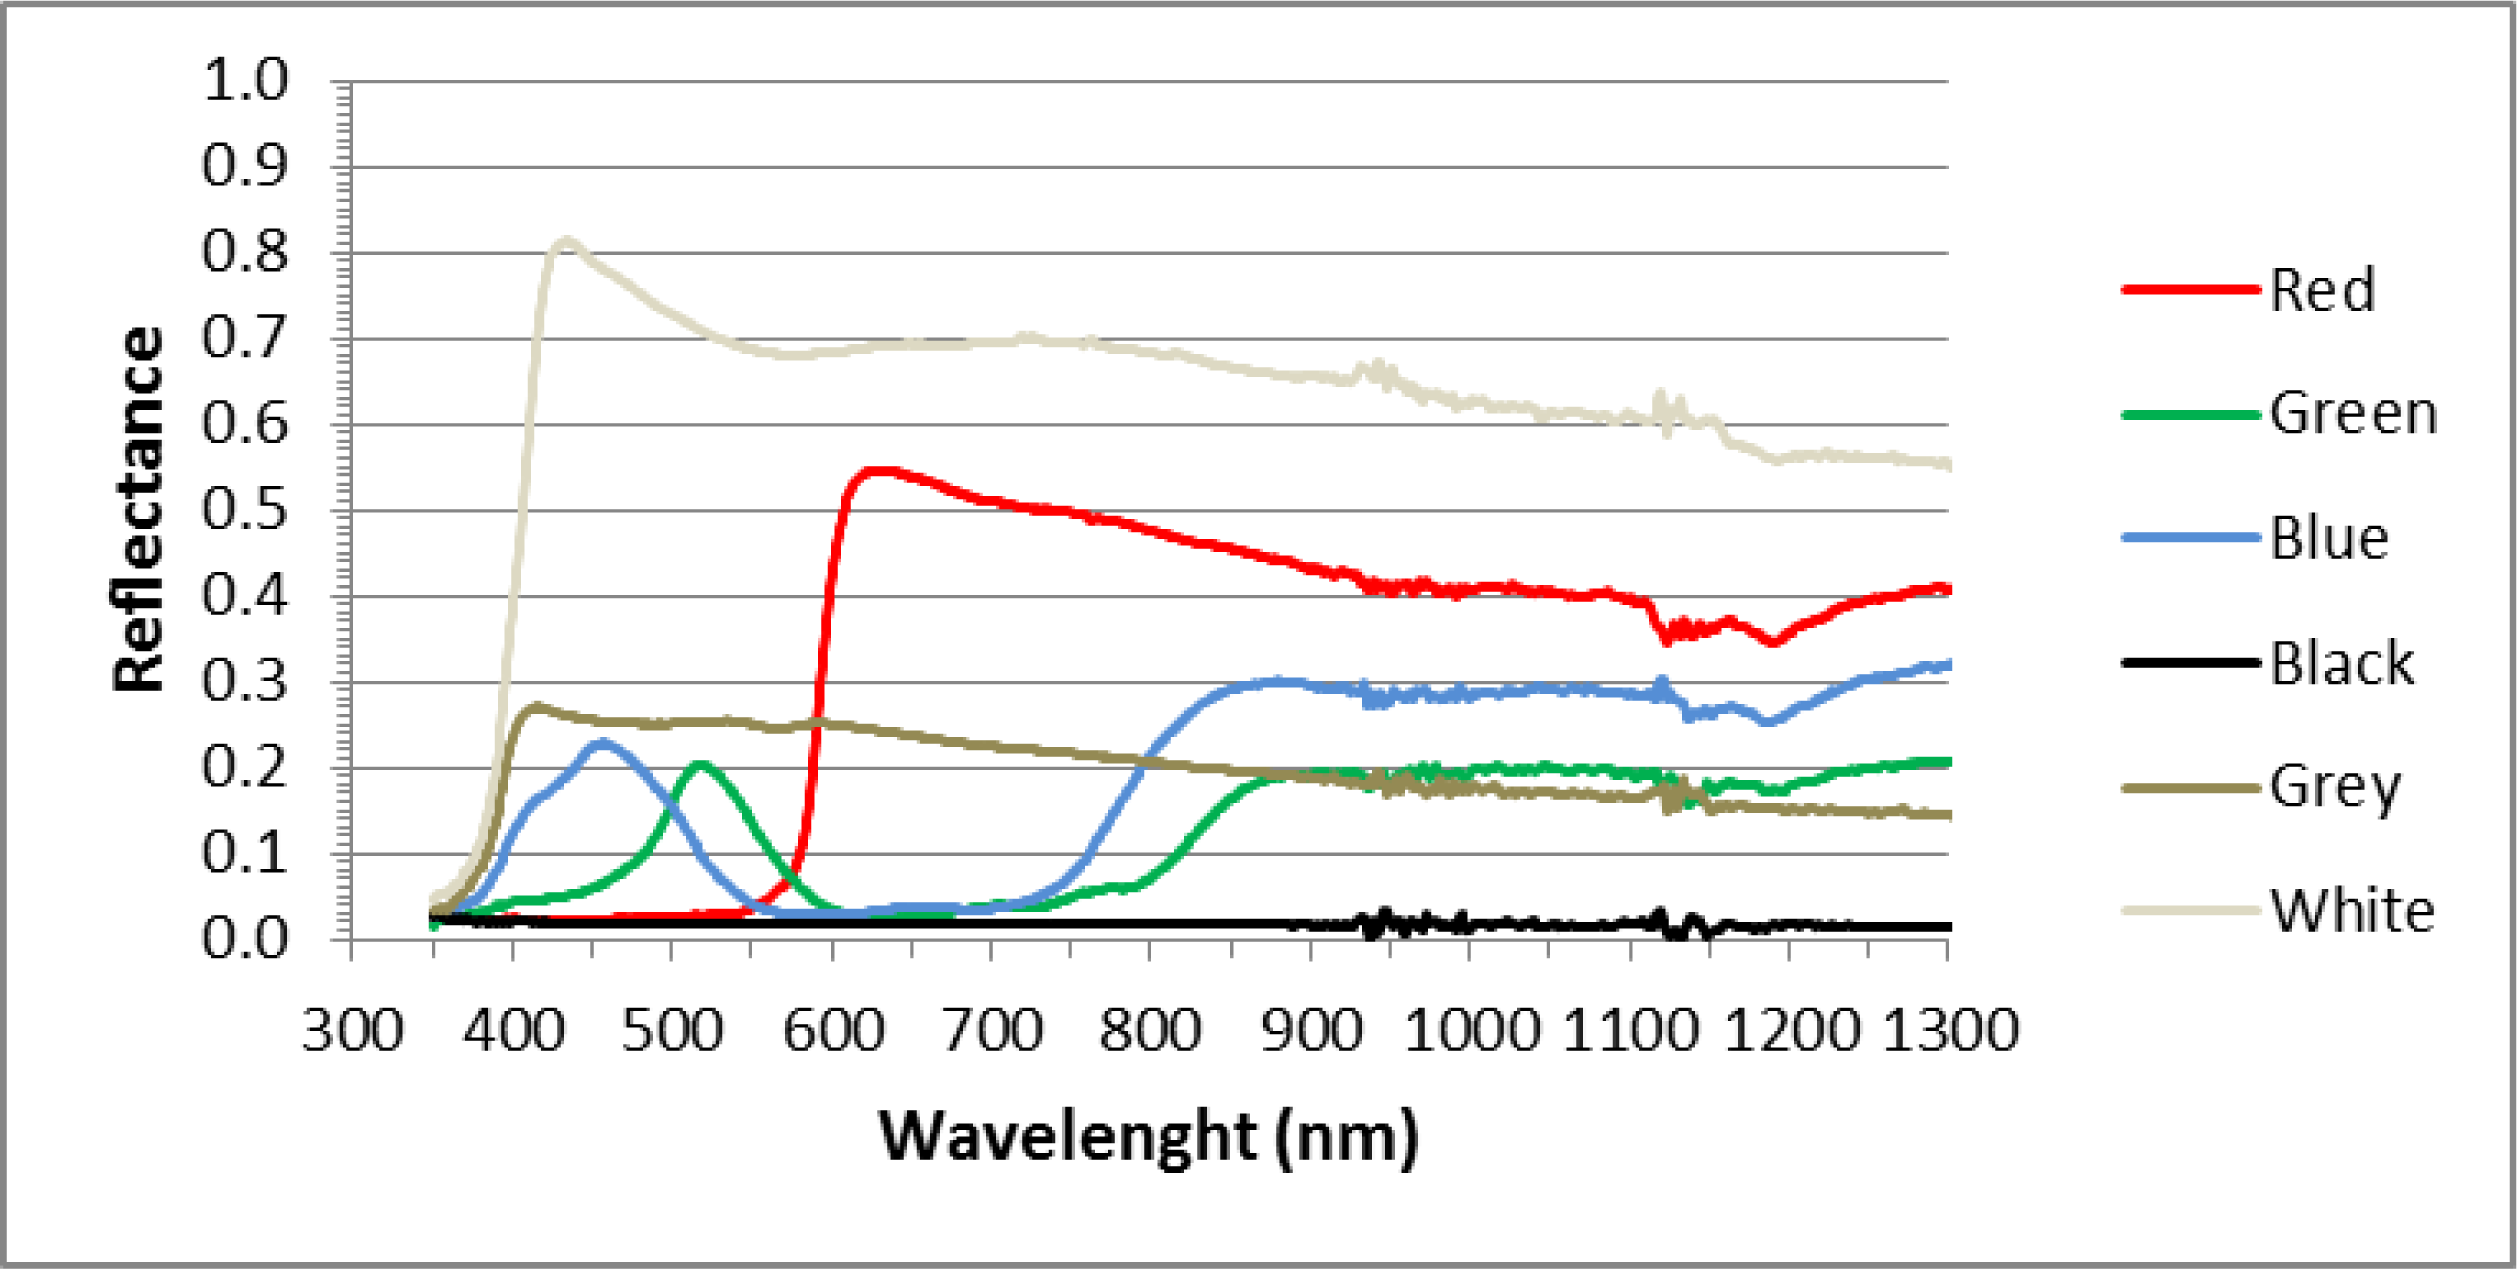
Figure 10 shows the spectral signatures of the vinyl sheets used in the radiometric calibration. The reflectance of these surfaces was obtained as the ratio between the reflected radiance of each cover and the radiance of a white reference target (Spectralon 99%), both measured with the spectroradiometer.
To compare the radiometric measurements with digital levels, it is important to note that the radiance obtained with the radiometer lies between the 350 and 2500 nm spectral range with a 1-nm resolution, whereas the Mini-MCA is capable of recording digital levels in its six channels, each one characterized by a particular response (Figure 2), due to the differential responses of the filter and CMOS at each wavelength. Therefore, it was necessary to adapt and standardize the radiometric measurements to the spectral resolution of the camera, together with the camera spectral response (RC). The spectral camera response includes the CMOS response, as well as the filter transmission function. Equation (11) shows the integration process for the measured reflectivity (ρ) of a target (t) with a white reference panel:
ρ t ( λ ) = λ 1 λ 2 ρ t ( λ ) R C ( λ ) d λ λ 1 λ 2 R C ( λ ) d λ
The equation was also applied to obtain the target radiance values involved in the calibration model (Equation (6)).

5.2. Analysis and Validation of Results

The Radiometric Calibration was resolved with the support of software developed for this purpose in MATLAB.
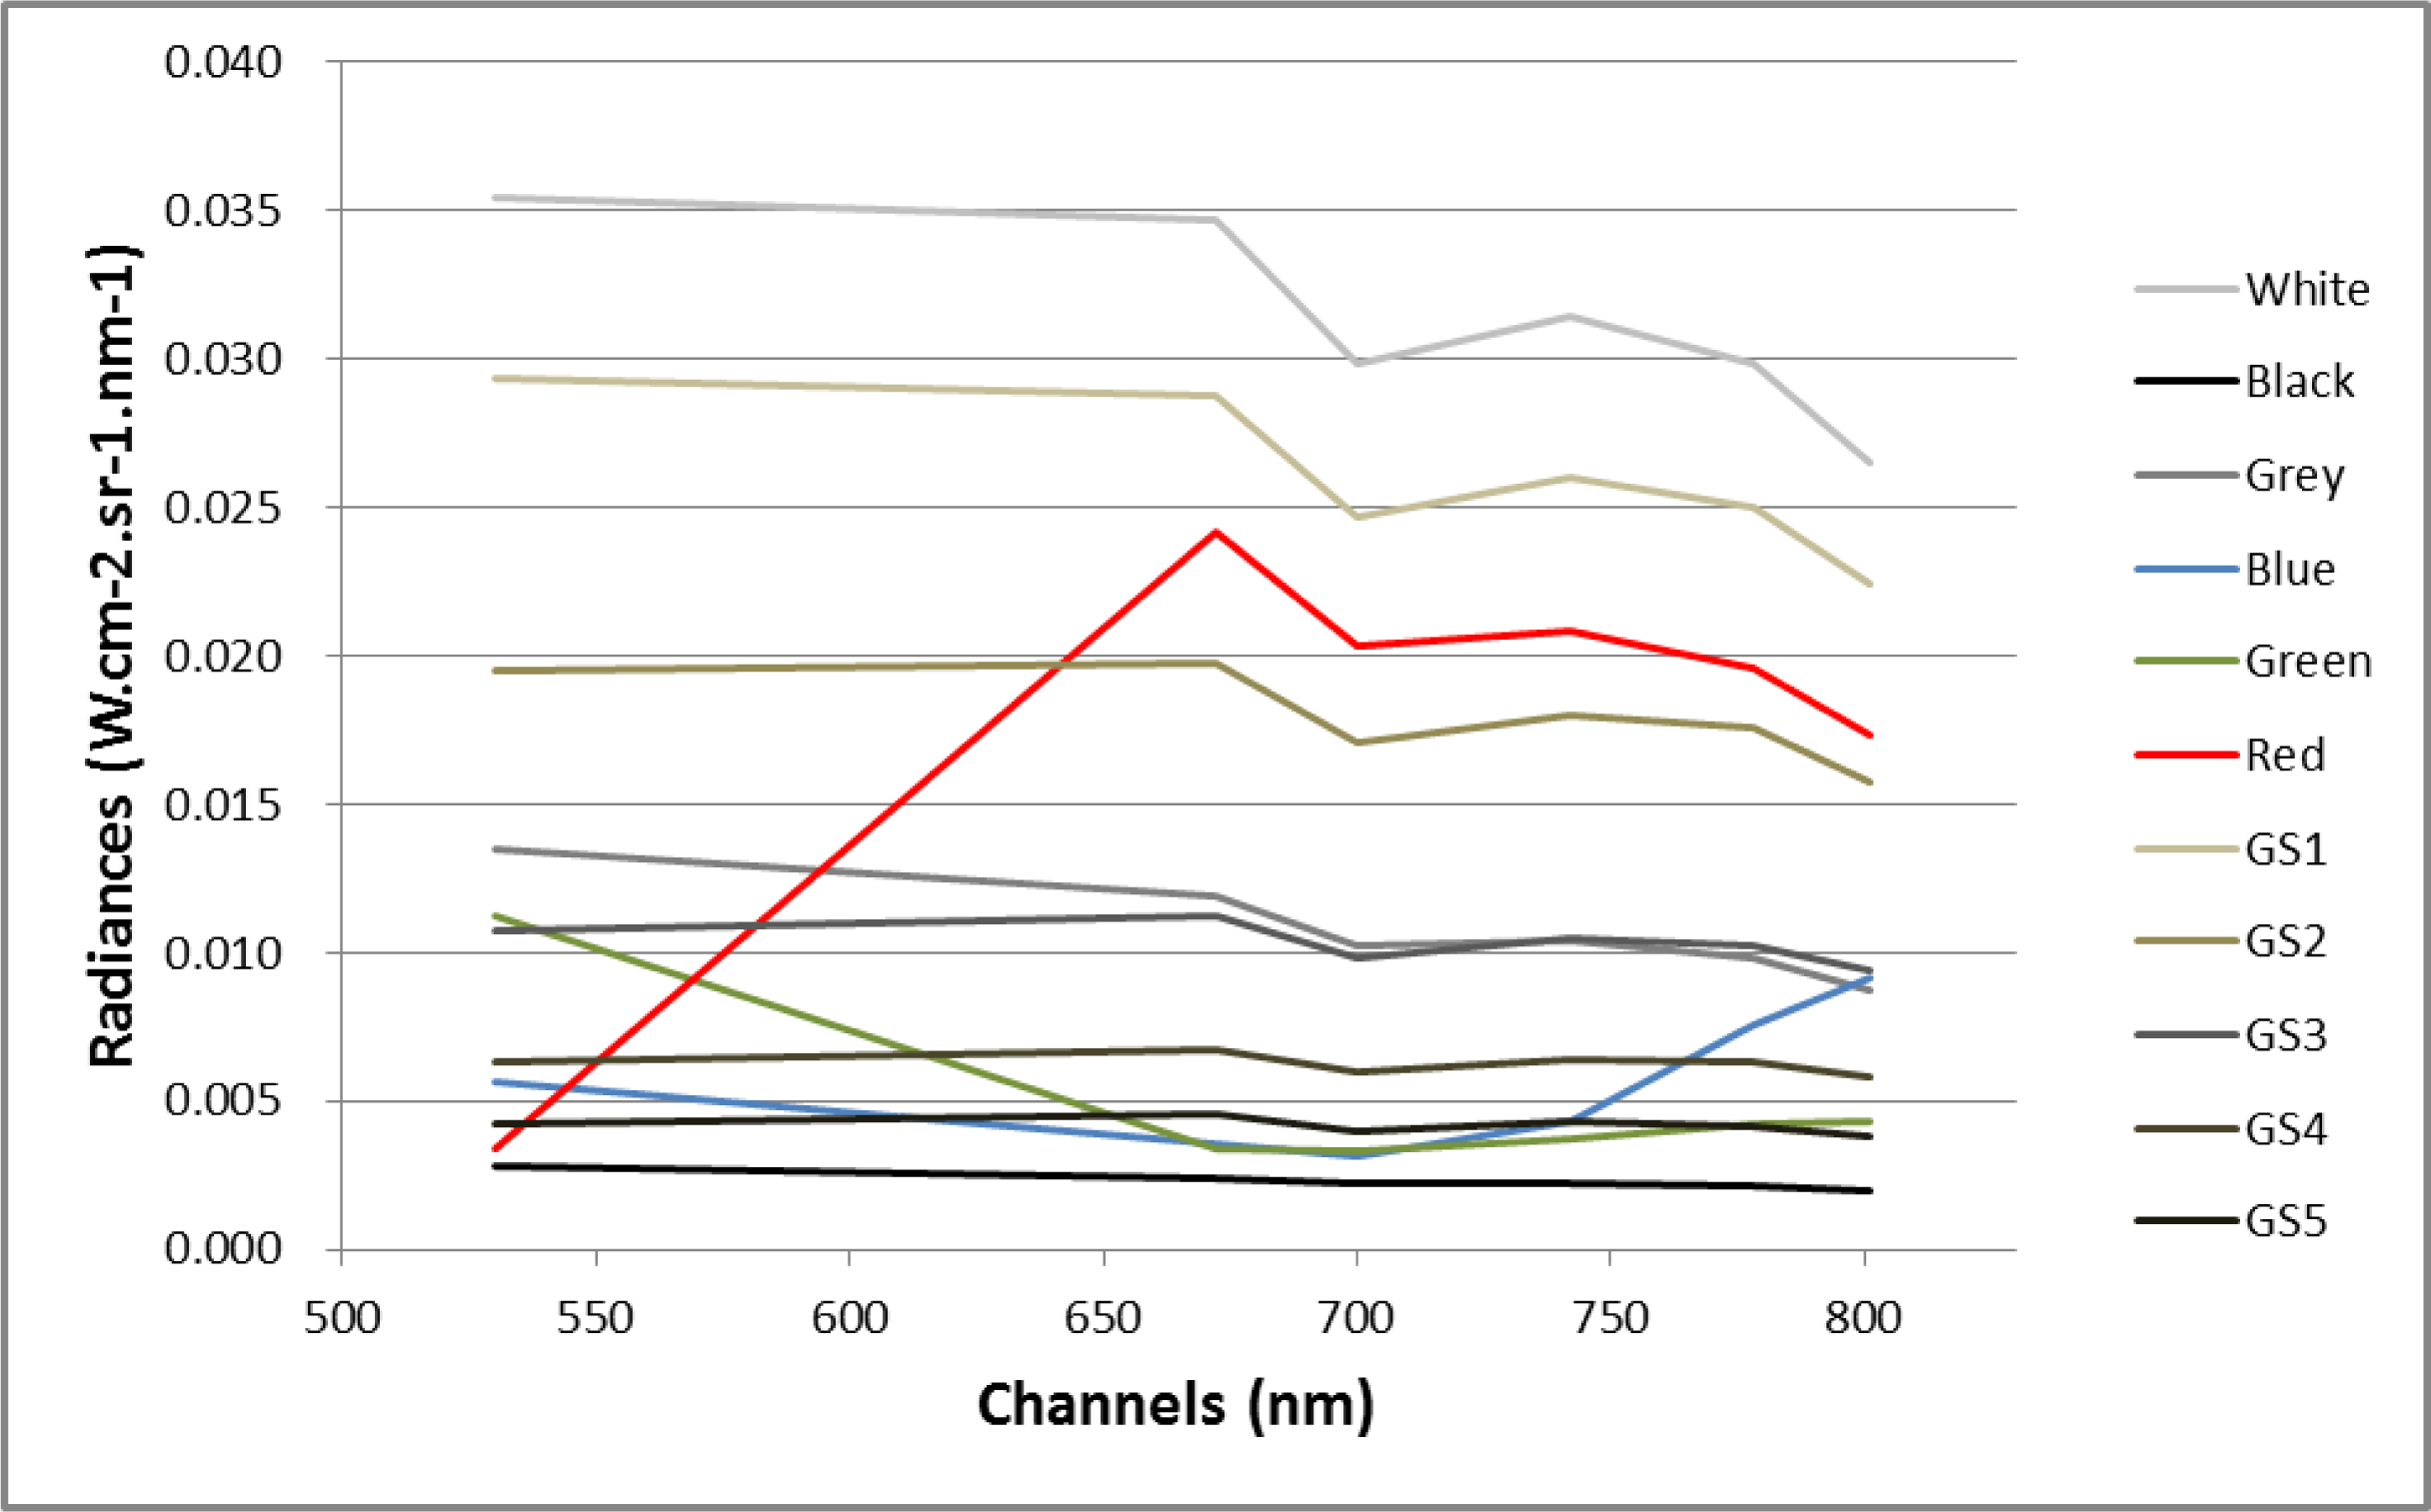
The control surfaces used have a typical radiance response for each of the multispectral camera channels, and based on these, the vicarious calibration relationship was established. The following figure (Figure 11) shows this feature for each of the control surfaces used in the calibration process.
Regarding the radiometric calibration parameters for an altitude of 30 m for each of the six channels of the Mini-MCA onboard the UAS, Table 5 shows the final results of this study. The R2 fitting coefficient was 0.9833 for a simultaneous block adjustment of six channels. Table 5 also shows the coefficients for the same fitting model, but with an individual channel adjustment. In this second case, the results are fairly similar, as is the determination coefficient, with no significant discrepancies between the two fitting methodologies.
It should be noted that the C0 value (intercept) is very small (compatible with zero), such that it could be excluded from the calculation.
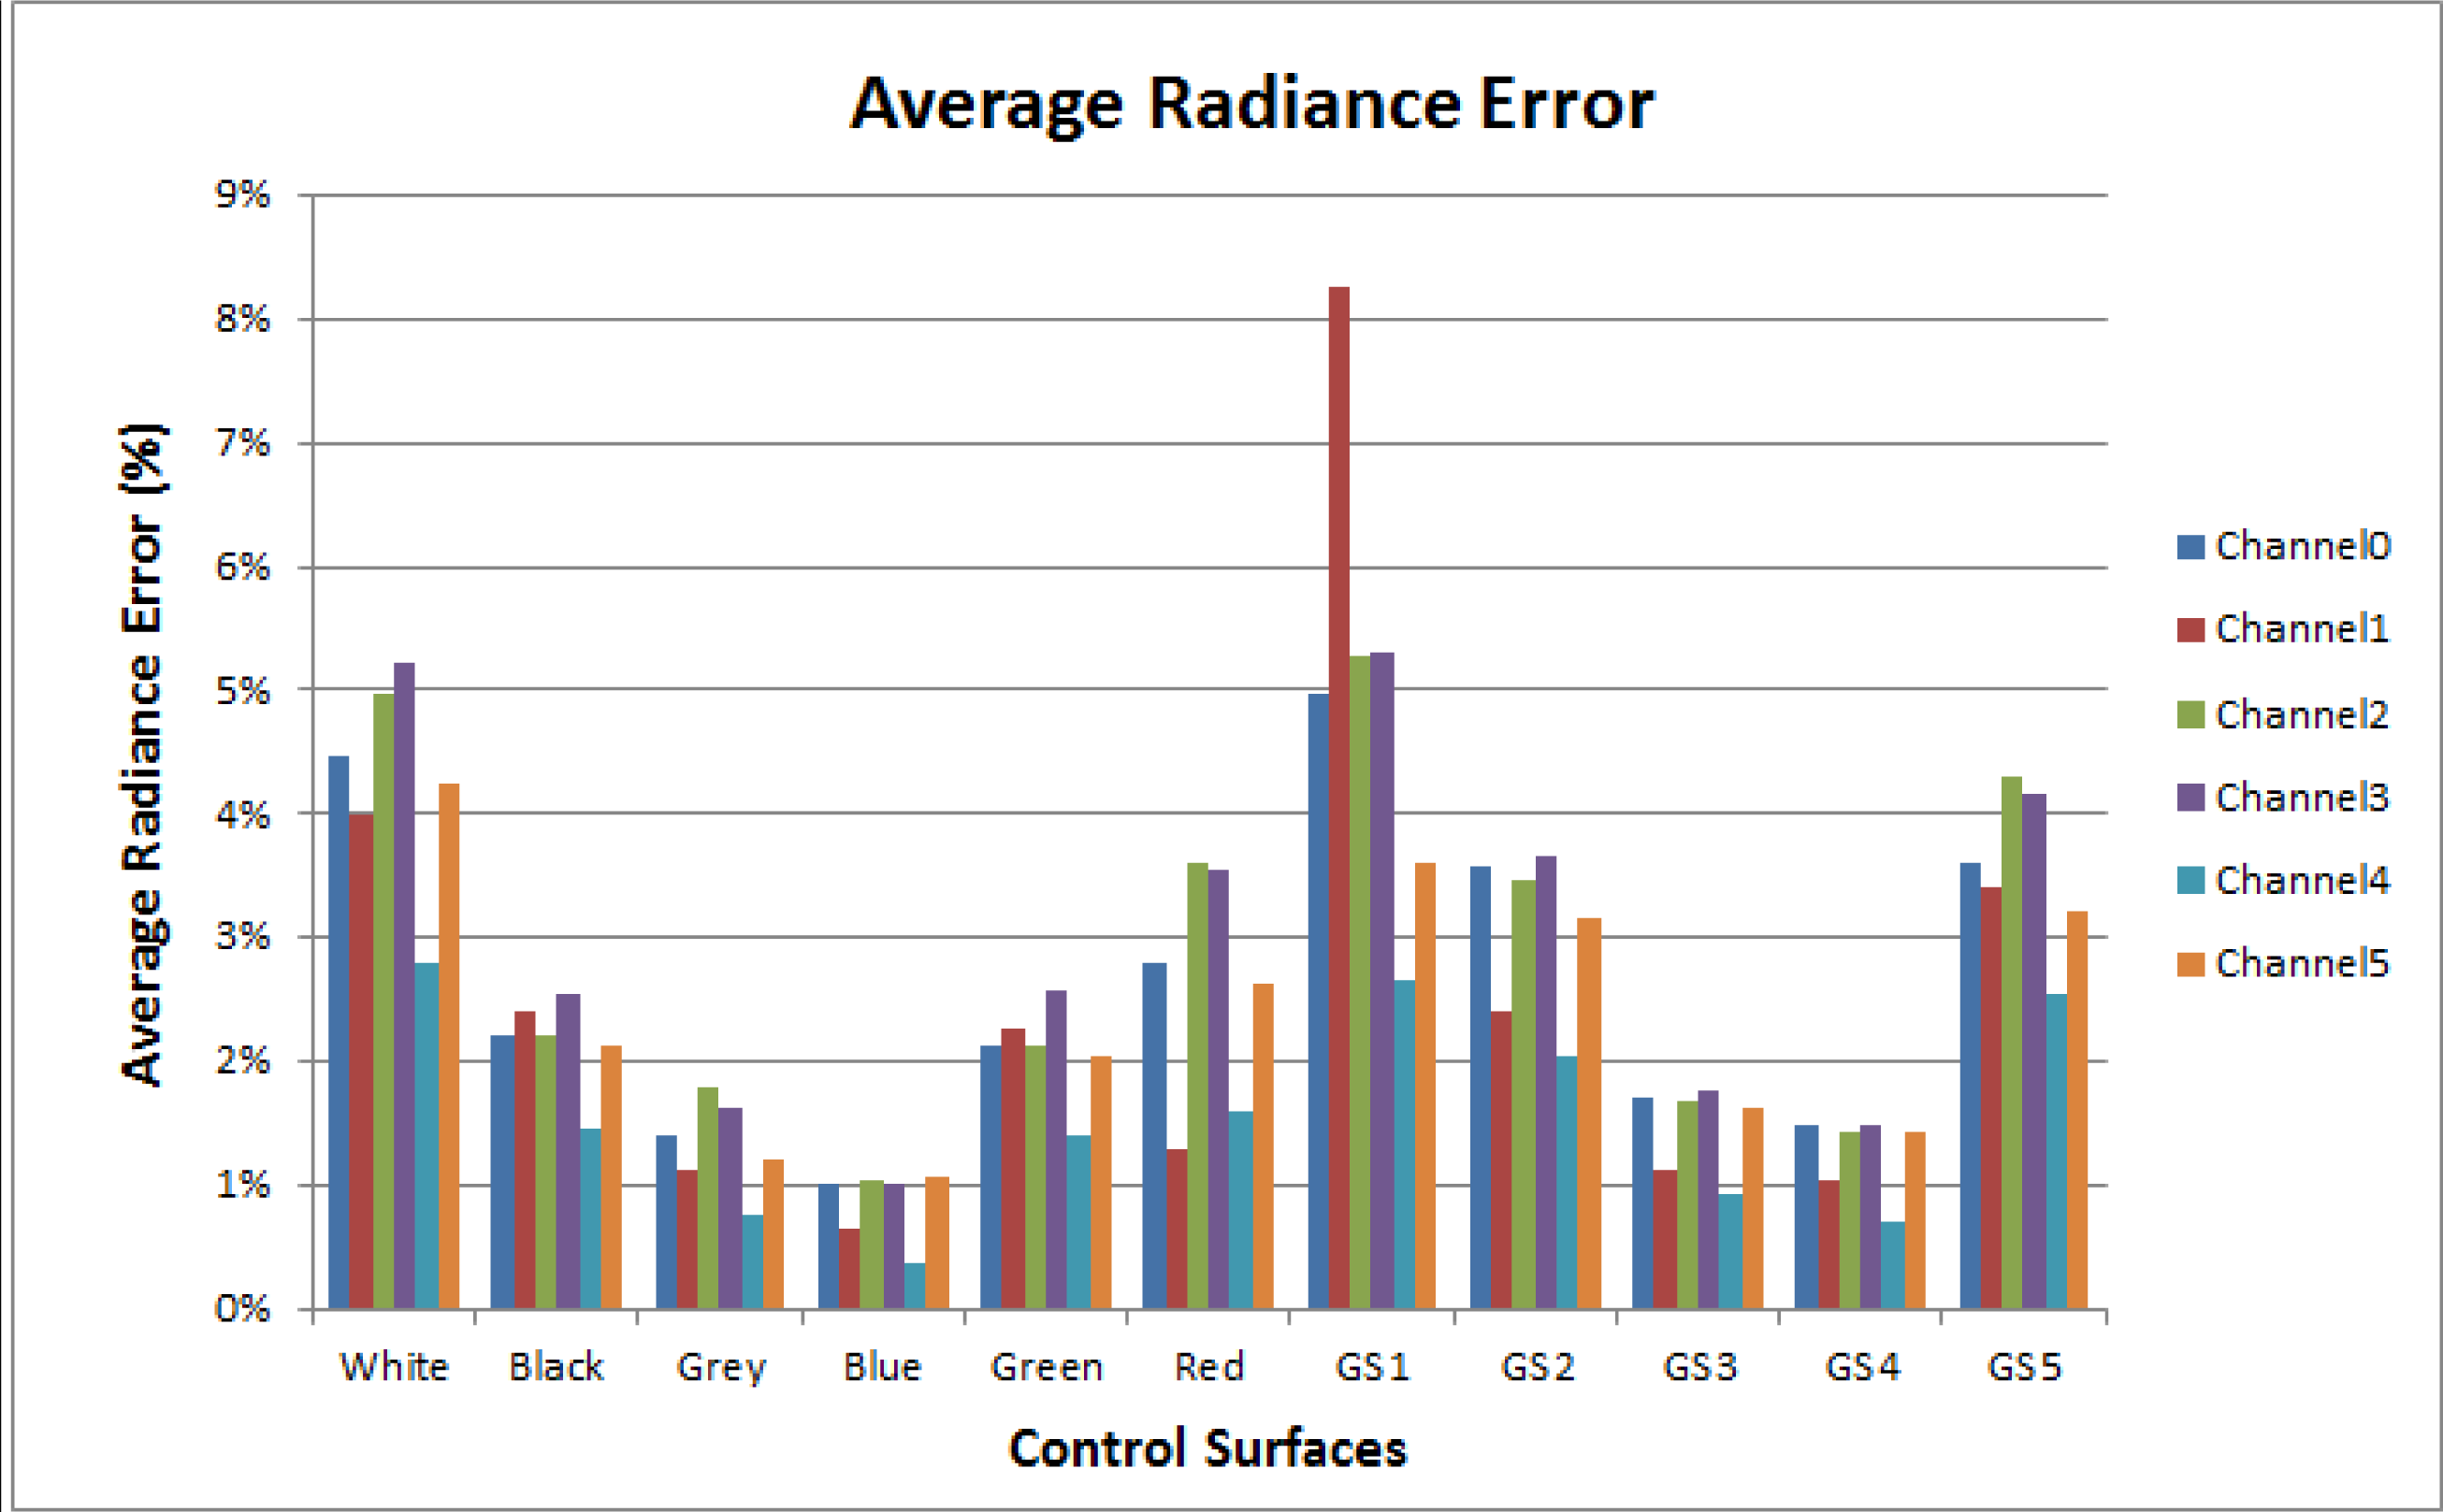
In this sense, the statistical test used for the validation of the results was the average of the errors in radiance, expressed as percentages (with respect to 10 bits) per control surfaces and per channel (Figure 12).
In the above figure, it may be seen that the control surfaces with the greatest error in their radiance estimation are those with the highest reflectance, i.e., the white vinyl and the second lightest color, the greyscale canvas. Furthermore, this error is noteworthy in channel 1 (530 nm), which has the lowest performance, due to the low CMOS response (Figure 2). However, this maximum error means an error of 8%, which can be considered acceptable, since it is an isolated value, as shown in Figure 13, the average residues (2.5%) remaining within the range of error estimated for this calibration mode.
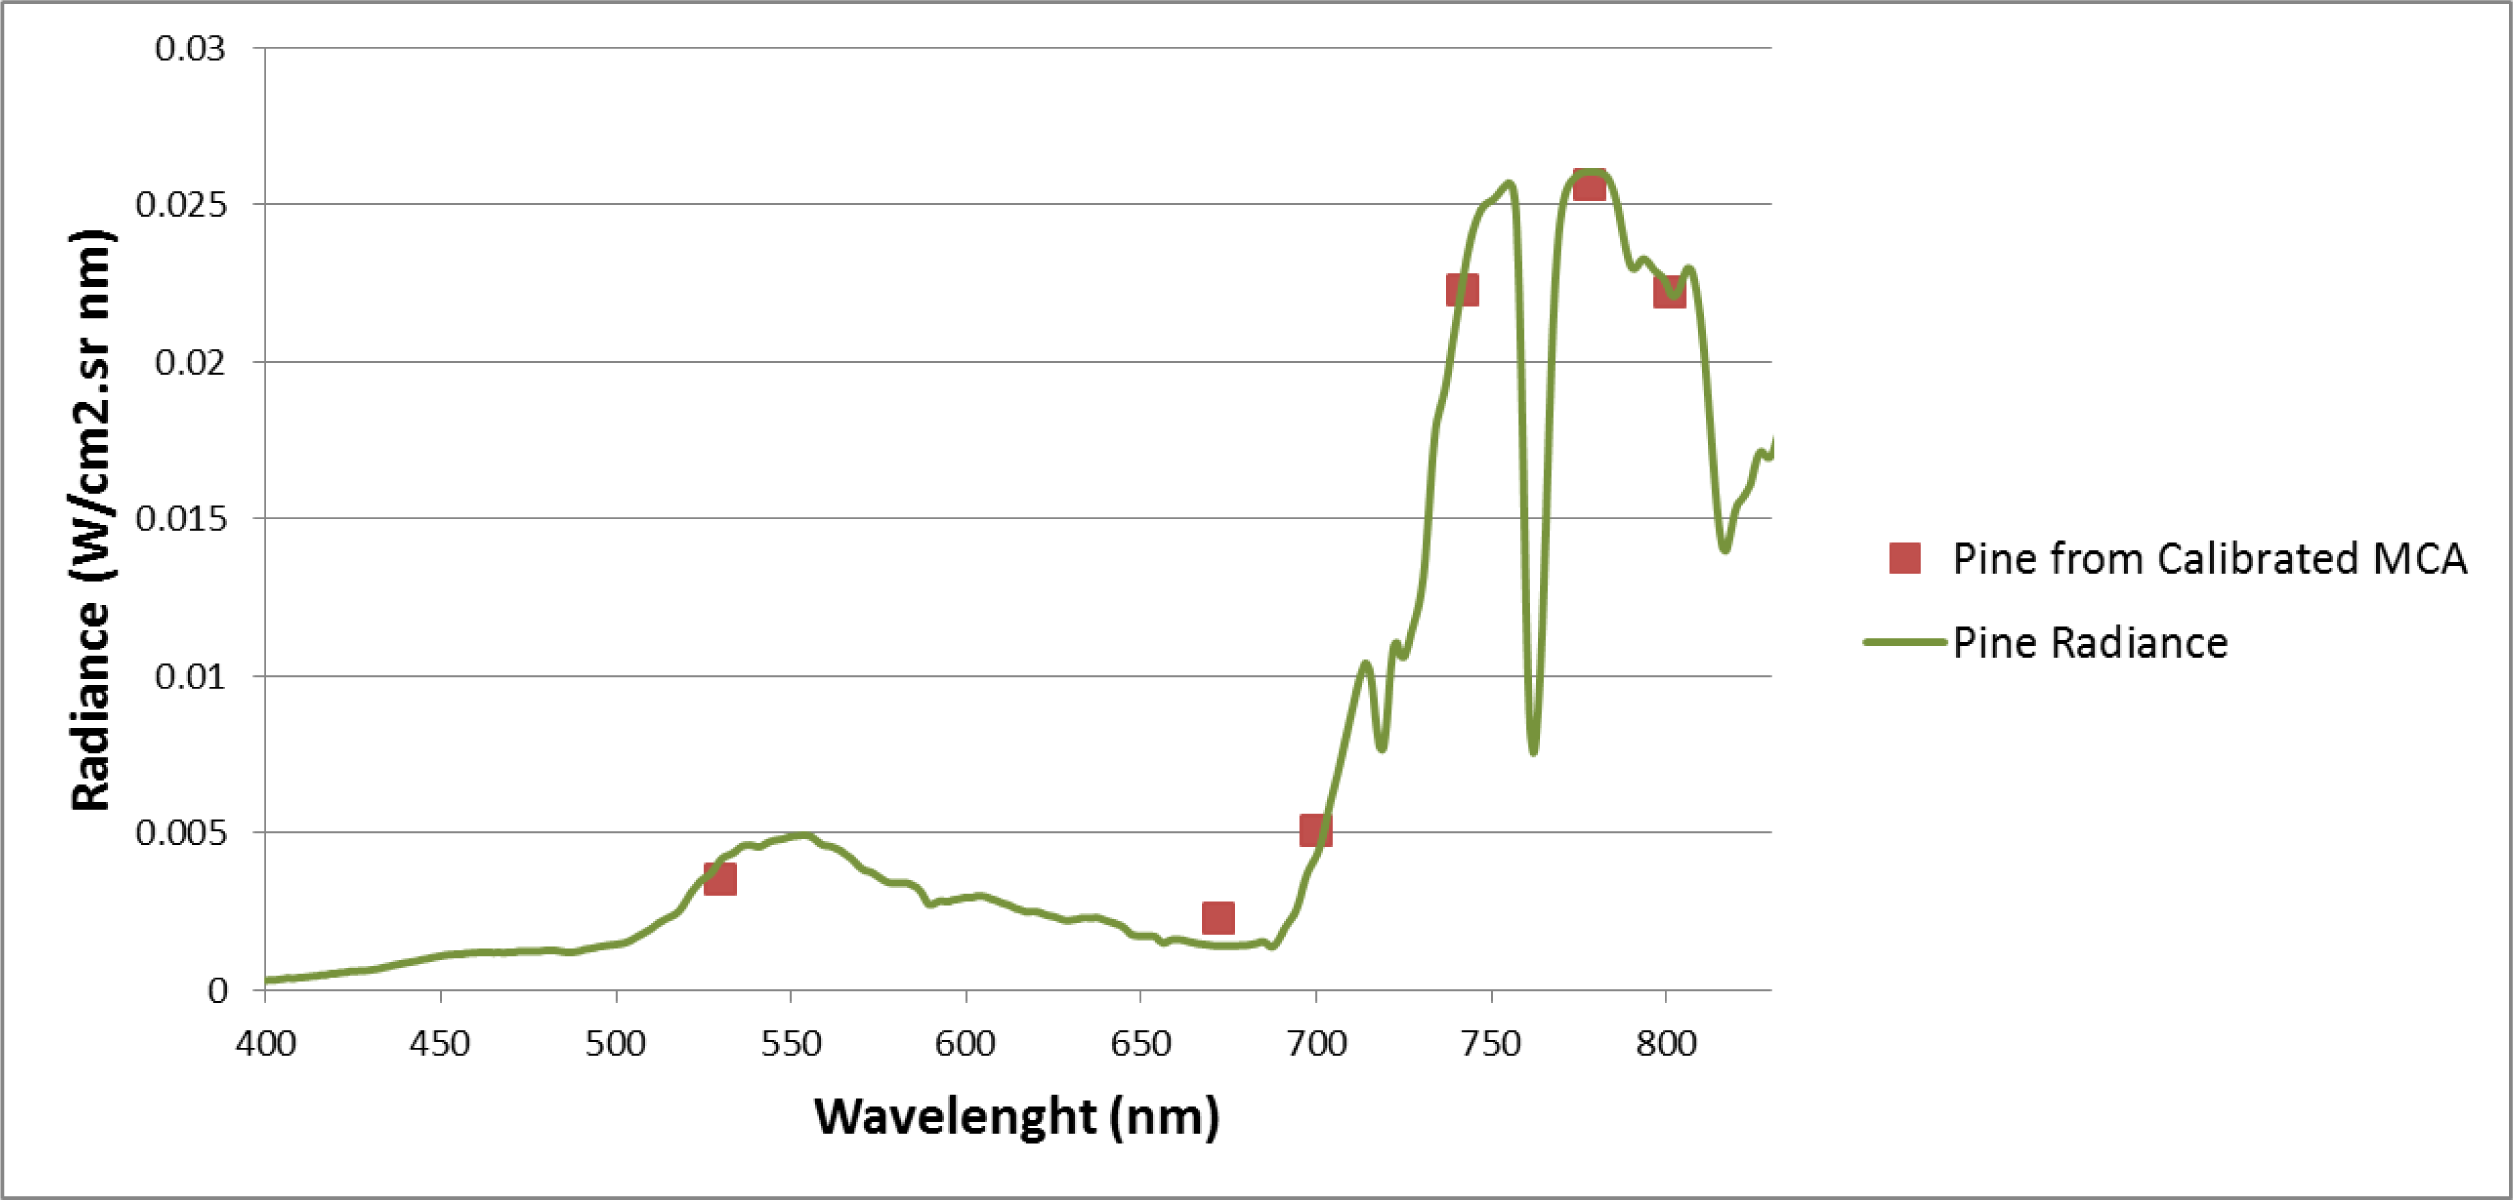
In order to validate the radiometric calibration process, calibration coefficients were applied to the digital levels of natural surfaces to obtain the radiance. The following figure (Figure 13) shows the setting of the radiance measurements considered as “ground truth” (spectroradiometer) for the case of a pine and their corresponding values obtained after applying calibration coefficients to the pine digital levels.
In this case, a strong correlation can be seen between the calculated radiances and in situ measurements, it being possible to calculate the pine radiance for each of the six camera channels with a relative error of only 1.8%.

6. Conclusions

This study shows the validity of a vicarious radiance-based calibration for the Mini-MCA onboard a UAS through the use of low-cost covers as control surfaces. The correlation of 0.98 between ground radiance and that derived from the digital level shows the degree of consistency achieved. Furthermore, despite the complexity of the data, the average error of 2.5% is very encouraging.
In addition, after several laboratory and field studies, the validity of using low-cost surfaces for the calibration process was confirmed. Moreover, low-cost covers show an invariant reflectivity for a certain period of time in which they remain unaffected by deterioration.
Another important contribution of high-spatial resolution remote sensing at low flight heights, as provided by this study, is that the relative surface-sensor atmospheric effects on UAS versus ground truth measurements are negligible, thus simplifying the workflow.
Finally, in view of the high spatial, spectral and temporal resolution achieved for UAS remote sensors, these platforms can generate high value products at reduced costs as compared to satellite or manned aerial platforms. UAS remote sensing is proving to be a valuable non-invasive technique for the recognition and analysis of different types of strata, crops and rocks, among others. Furthermore, not only qualitative results are obtained, physically relevant quantitative results derived from the digital levels of UAS images can be obtained, as well, and are most relevant.

Acknowledgments

The financial support of SARGIS Protect and Research of the Spanish Ministry of Science and Education (grants no. BIA2012-15145) is gratefully acknowledged. The authors thank Jesús Fernández-Hernández for kindly providing the UFLIP software.
Furthermore, the authors would like to thank the reviewers for their helpful comments.

Author Contributions

Susana Del Pozo, Pablo Rodríguez-Gonzálvez, David Hernández-López and Beatriz Felipe-García acquired the data in the radiometric field campaign. David Hernández-López and Beatriz Felipe-García aided with the research design and results interpretation. Susana Del Pozo processed the data, implemented the mathematical model and interpreted the results. Susana Del Pozo and Pablo Rodríguez-Gonzálvez carried out the camera corrections. Susana Del Pozo, Pablo Rodríguez-Gonzálvez and David Hernández-López wrote the manuscript.

Conflicts of Interest

The authors declare no conflict of interest.

References

  1. Herwitz, S.R.; Dunagan, S.; Sullivan, D.; Higgins, R.; Johnson, L.; Jian, Z.; Slye, R.; Brass, J.; Leung, J.; Gallmeyer, B.; et al. Solar-Powered UAV Mission for Agricultural Decision Support. Proceedings of the 2003 IEEE International Geoscience and Remote Sensing Symposium (IGARSS), Worcester, MA, USA, 21–25 July 2003; pp. 1692–1694.
  2. Herwitz, S.R.; Johnson, L.F.; Dunagan, S.E.; Higgins, R.G.; Sullivan, D.V.; Zheng, J.; Lobitz, B.M.; Leung, J.G.; Gallmeyer, B.A.; Aoyagi, M.; et al. Imaging from an unmanned aerial vehicle: Agricultural surveillance and decision support. Comput. Electron. Agric 2004, 44, 49–61. [Google Scholar]
  3. Johnson, L.; Herwitz, S.; Dunagan, S.; Lobitz, B.; Sullivan, D.; Slye, R. Collection of Ultra High Spatial and Spectral Resolution Image Data over California Vineyards with a Small UAV. Proceedings of the 30th International Symposium on Remote Sensing of Environment, Honolulu, HI, USA, 10–14 November 2003.
  4. Dunford, R.; Michel, K.; Gagnage, M.; Piégay, H.; Trémelo, M.L. Potential and constraints of Unmanned Aerial Vehicle technology for the characterization of Mediterranean riparian forest. Int. J. Remote Sens 2009, 30, 4915–4935. [Google Scholar]
  5. Scaioni, M.; Barazzetti, L.; Brumana, R.; Cuca, B.; Fassi, F.; Prandi, F. RC-Heli and Structure & Motion Techniques for the 3-D Reconstruction of a Milan Dome Spire. Proceedings of the 3rd ISPRS International Workshop 3D-ARCH, Trento, Italy, 25–28 February 2009.
  6. Hunt, E.R.; Hively, W.D.; Fujikawa, S.; Linden, D.; Daughtry, C.S.; McCarty, G. Acquisition of NIR-Green-Blue digital photographs from unmanned aircraft for crop monitoring. Remote Sens 2010, 2, 290–305. [Google Scholar]
  7. Berni, J.; Zarco-Tejada, P.J.; Suarez, L.; Fereres, E. Thermal and narrowband multispectral remote sensing for vegetation monitoring from an unmanned aerial vehicle. IEEE Trans. Geosci. Remote Sens 2009, 47, 722–738. [Google Scholar]
  8. Laliberte, A.S.; Rango, A.; Herrick, J.E.; Fredrickson, E.L.; Burkett, L. An object-based image analysis approach for determining fractional cover of senescent and green vegetation with digital plot photography. J. Arid Environ 2007, 69, 1–14. [Google Scholar]
  9. Everaerts, J. The Use of Unmanned Aerial Vehicles (UAVs) for Remote Sensing and Mapping. Proceedings of the International Archives of the Photogrammetry, Remote Sensing and Spatial Information Sciences, Beijing, China, 5–7 July 2008; pp. 1187–1192.
  10. Pastor, E.; Lopez, J.; Royo, P. UAV payload and mission control hardware/software architecture. IEEE Aerosp. Electron. Syst. Mag 2007, 22, 3–8. [Google Scholar]
  11. Zhao, H.; Lei, Y.; Gou, Z.; Zhang, L. The Characteristic Analyses of Images from the UAV Remote Sensing System. Proceedings of the 2006 IEEE International Conference on Geoscience and Remote Sensing Symposium (IGARSS), Denver, CO, USA, 31 July–4 August 2006; pp. 3349–3351.
  12. Esposito, F.; Rufino, G.; Moccia, A. 1st Mini-UAV Integrated Hyperspectral/Thermal Electro-Optical Payload for Forest Fire Risk Management. Proceedings of the AIAA InfotechAerosp Conference, Rohnert Park, CA, USA, 7–10 May 2007; pp. 653–665.
  13. Lambers, K.; Eisenbeiss, H.; Sauerbier, M.; Kupferschmidt, D.; Gaisecker, T.; Sotoodeh, S.; Hanusch, T. Combining photogrammetry and laser scanning for the recording and modelling of the Late Intermediate Period site of Pinchango Alto, Palpa, Peru. J. Archaeol. Sci 2007, 34, 1702–1712. [Google Scholar]
  14. Nebiker, S.; Annen, A.; Scherrer, M.; Oesch, D. A. Light-Weight Multispectral Sensor for Micro UAV—Opportunities for Very High Resolution Airborne Remote Sensing. Proceedings of the XXIst ISPRS Congress, Beijing, China, 3–11 July 2008; pp. 1193–2000.
  15. Xiang, H.; Tian, L. Development of a low-cost agricultural remote sensing system based on an autonomous unmanned aerial vehicle (UAV). Biosyst. Eng 2011, 108, 174–190. [Google Scholar]
  16. Turner, D.; Lucieer, A.; Watson, C. Development of an Unmanned Aerial Vehicle (UAV) for Hyper Resolution Vineyard Mapping Based on Visible, Multispectral, and Thermal Imagery. Proceedings of the 34th International Symposium on Remote Sensing of Environment, Hobart, Australia, 28–29 June 2011.
  17. Biggar, S.F.; Thome, K.J.; Wisniewski, W. Vicarious radiometric calibration of EO-1 sensors by reference to high-reflectance ground targets. IEEE Trans. Geosci. Remote Sens 2003, 41, 1174–1179. [Google Scholar]
  18. Hernández López, D.; Felipe García, B.; González Piqueras, J.; Alcázar, G.V. An approach to the radiometric aerotriangulation of photogrammetric images. ISPRS J. Photogramm. Remote Sens 2011, 66, 883–893. [Google Scholar]
  19. Moran, M.S.; Bryant, R.; Thome, K.; Ni, W.; Nouvellon, Y.; Gonzalez-Dugo, M.P.; Qi, J.; Clarke, T.R. A refined empirical line approach for reflectance factor retrieval from Landsat-5 TM and Landsat-7 ETM+. Remote Sens. Environ 2001, 78, 71–82. [Google Scholar]
  20. Chuvieco, E.; Huete, A. Fundamentals of Satellite Remote Sensing; CRC Press Inc: Boca Raton, FL, USA, 2009. [Google Scholar]
  21. Honkavaara, E.; Arbiol, R.; Markelin, L.; Martinez, L.; Cramer, M.; Bovet, S.; Chandelier, L.; Ilves, R.; Klonus, S.; Marshal, P.; et al. Digital airborne photogrammetry—A new tool for quantitative remote sensing?—A state-of-the-art review on radiometric aspects of digital photogrammetric images. Remote Sens 2009, 1, 577–605. [Google Scholar]
  22. Hefele, J. Calibration Expierence with the DMC. Proceedings of the International Calibration and Orientation Workshop EuroCOW 2006, Castelldefels, Spain, 25–27 January 2006.
  23. Tetracam Inc. Digital Camera and Imaging Systems Design—Mini Multiple Camera Array. Available online: http://www.tetracam.com/Products-Mini_MCA.htm (accessed on 6 December 2013).
  24. HiSystems GmbH. Mikrokopter. Available online: http://www.mikrokopter.com/en/home (accessed on 6 December 2013).
  25. Fernández-Hernandez, J.; González-Aguilera, D.; Rodríguez-Gonzálvez, P.; Mancera-Taboada, J. A new trend for reverse engineering: Robotized aerial system for spatial information management. Appl. Mech. Mater 2012, 152, 1785–1790. [Google Scholar]
  26. Li, F.; Barabas, J.; Mohan, A.; Raskar, R. Analysis on Errors Due to Photon Noise and Quantization Process with Multiple Images. Proceedings of the 44th Annual Conference on Information Sciences and Systems (CISS), Princeton, NJ, USA, 17–19 March 2010; pp. 1–6.
  27. Kelcey, J.; Lucieer, A. Sensor correction of a 6-band multispectral imaging sensor for UAV remote sensing. Remote Sens 2012, 4, 1462–1493. [Google Scholar]
  28. Zheng, Y.; Lin, S.; Kambhamettu, C.; Yu, J.; Kang, S.B. Single-image vignetting correction. IEEE Trans. Pattern Anal. Mach. Intell 2009, 31, 2243–2256. [Google Scholar]
  29. Bouguet, J.-Y. Camera Calibration Toolbox for Matlab. Available online: http://www.vision.caltech.edu/bouguetj/calib_doc/ (accessed on 6 December 2013).
  30. Light, D.L. The new camera calibration system at the US Geological Survey. Photogramm. Eng. Remote Sens 1992, 58, 185–188. [Google Scholar]
  31. Gonzalez-Aguilera, D.; Gomez-Lahoz, J.; Rodriguez-Gonzalvez, P. An Automatic approach for Radial Lens distortion correction from a single image. IEEE Sens. J 2011, 11, 956–965. [Google Scholar]
  32. Kraus, K.; Jansa, J.; Kager, H. Advanced Methods and Applications; Dümmler: Bonn, Germany, 1997. [Google Scholar]
  33. Hartley, R.; Zisserman, A. Multiple View Geometry in Computer Vision; Cambridge University Press: Cambridge, UK, 2003. [Google Scholar]
  34. Dinguirard, M.; Slater, P.N. Calibration of space-multispectral imaging sensors: A review. Remote Sens. Environ 1999, 68, 194–205. [Google Scholar]
  35. Biggar, S.F.; Slater, P.N.; Gellman, D.I. Uncertainties in the in-flight calibration of sensors with reference to measured ground sites in the 0.4–1.1 μm range. Remote Sens. Environ 1994, 48, 245–252. [Google Scholar]
  36. Hiscocks, P.D.; Eng, P. Measuring Luminance with a Digital Camera. Available online: http://www.ee.ryerson.ca/∼phiscock/astronomy/light-pollution/luminance-notes.pdf (accessed on 6 February 2014).
  37. Moran, M.S.; Bryant, R.B.; Clarke, T.R.; Qi, J. Deployment and calibration of reference reflectance tarps for use with airborne imaging sensors. Photogramm. Eng. Remote Sens 2001, 67, 273–286. [Google Scholar]
  38. Pagnutti, M.; Holekamp, K.; Ryan, R.; Blonski, S.; Sellers, R.; Davis, B.; Zanoni, V. Measurement Sets and Sites Commonly Used for Characterizations. Proceedings of the Integrated Remote Sensing at the Global, Regional and Local Scale Denver, Denver, CO, USA, 10–15 November 2002; pp. 159–164.
  39. Moran, M.; Clarke, T.; Qi, J.; Barnes, E.; Pinter, P.J., Jr. Practical Techniques for Conversion of Airborne Imagery to Reflectances. Proceedings of the 16th Biennial Workshop on Color Photography and Videography in Resource Assessment, Weslaco, TX, USA, 29 April–1 May 1997; pp. 82–95.
  40. Davranche, A.; Lefebvre, G.; Poulin, B. Radiometric normalization of SPOT-5 scenes: 6S atmospheric model versus pseudo-invariant features. Photogramm. Eng. Remote Sens 2009, 75, 723–728. [Google Scholar]
  41. Vermote, E.F.; Tanre, D.; Deuze, J.L.; Herman, M.; Morcette, J.J. Second simulation of the satellite signal in the solar spectrum, 6S: An overview. IEEE Trans. Geosci. Remote Sens 1997, 35, 675–686. [Google Scholar]
  42. Hernández-López, D.; Felipe-García, B.; Sánchez, N.; González-Aguilera, D.; Gomez-Lahoz, J. Testing the radiometric performance of digital photogrammetric images: Vicarious versus laboratory CALIBRATION on the Leica ADS40, a study in Spain. Photogramm. Fernerkund. Geoinf 2012, 2012, 557–571. [Google Scholar]
  43. Triggs, B.; McLauchlan, P.F.; Hartley, R.I.; Fitzgibbon, A.W. Bundle Adjustment—A Modern Synthesis. In Vision Algorithms: Theory and Practice; Springer: Berlin, Germany, 2000; pp. 298–372. [Google Scholar]
  44. Krarup, T.; Juhl, J.; Kubik, K. Götterdammerung over Least Squares Adjustment. Proceedings of the XIV Congress of International Society of Photogrammetry, Hamburg, Germany, 13–25 July, 1980; pp. 369–378.
  45. Honkavaara, E.; Peltoniemi, J.; Ahokas, E.; Kuittinen, R.; Hyyppa, J.; Jaakkola, J.; Kaartinen, H.; Markelin, L.; Nurminen, K.; Suomalainen, J. A permanent test field for digital photogrammetric systems. Photogramm. Eng. Remote Sens 2008, 74, 95–106. [Google Scholar]
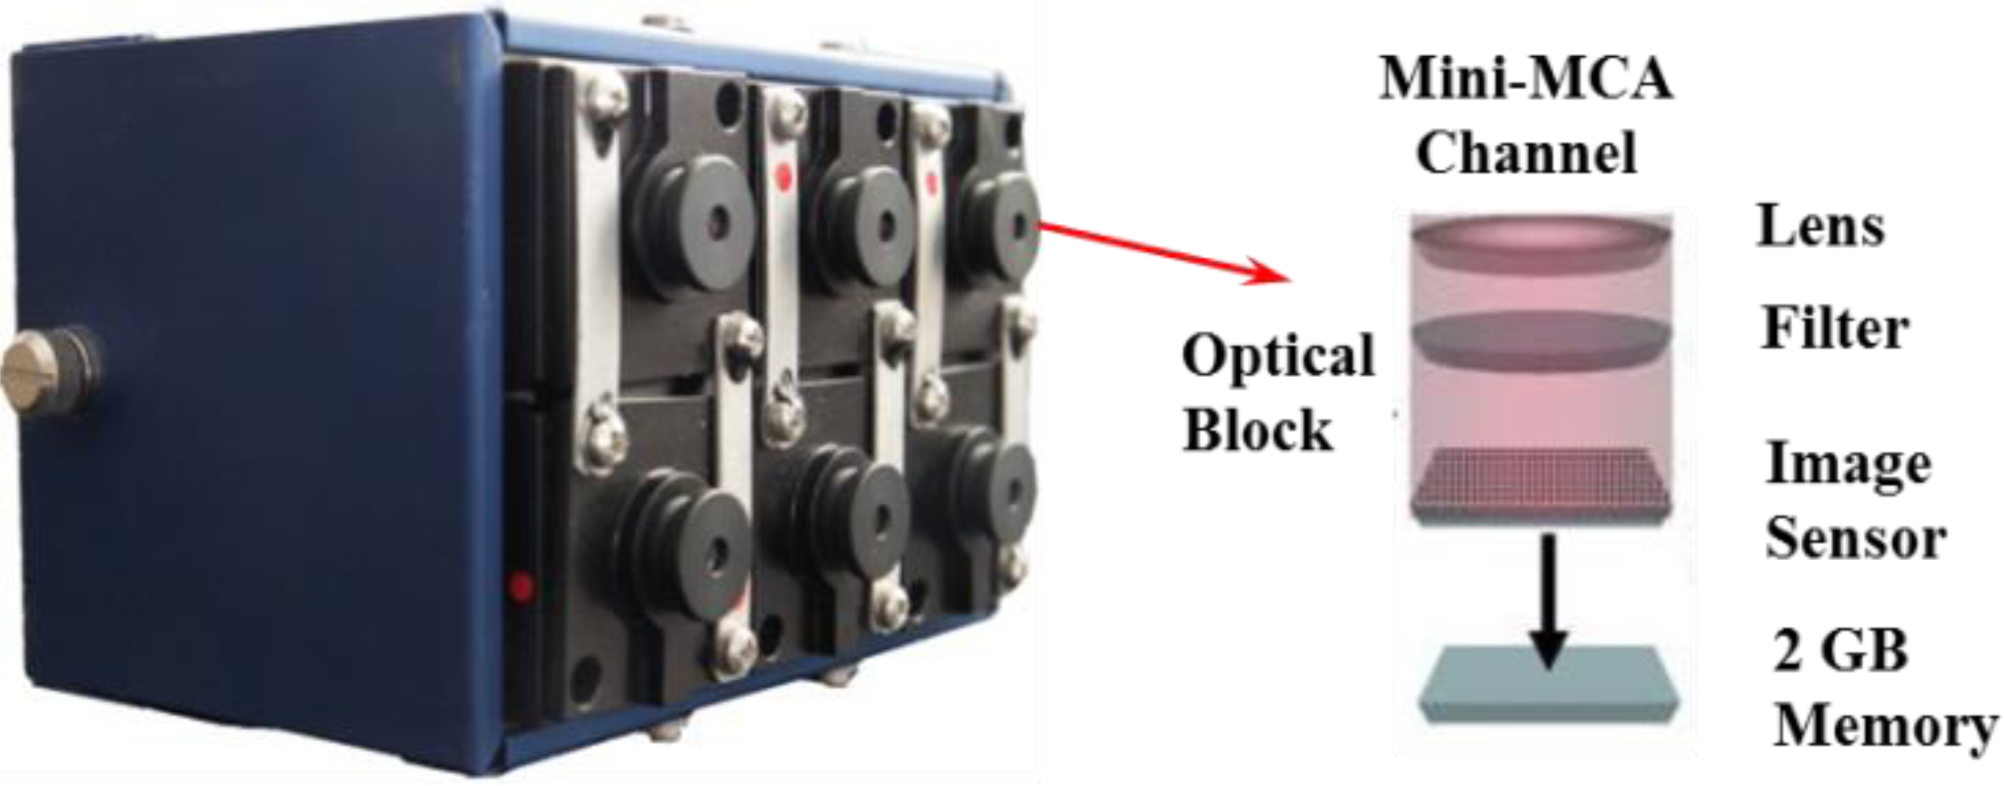
Figure 1. Mini-MCA multispectral camera.
Remotesensing 06 01918f1
Figure 2. Complementary metal-oxide-semiconductor (CMOS) and filter spectral performance of the Mini-MCA multispectral camera.
Remotesensing 06 01918f2
Figure 3. Oktokopter.
Remotesensing 06 01918f3
Figure 4. Photogrammetric flight planning using an orthoimage of the study area.
Remotesensing 06 01918f4
Figure 5. (a) NIR image of vignetting study; (b) 3D vignetting representation of Channel 6.
Remotesensing 06 01918f5
Figure 6. Graphic representation of geometric distortion of the six channels of the MCA.
Remotesensing 06 01918f6
Figure 7. Workflow of the radiometric calibration process.
Remotesensing 06 01918f7
Figure 8. Aerial image of the control and check surfaces.
Remotesensing 06 01918f8
Figure 9. An example of a multispectral 10-bit image (sixth channel image, 801 nm).
Remotesensing 06 01918f9
Figure 10. The spectral signature of the control surfaces (vinyl sheets) used in the radiometric calibration process.
Remotesensing 06 01918f10
Figure 11. Average radiance for artificial targets. GS, greyscale canvas.
Remotesensing 06 01918f11
Figure 12. Average radiance calibration error (percent).
Remotesensing 06 01918f12
Figure 13. Pine radiance from the spectroradiometer and from the calibrated Mini MCA.
Remotesensing 06 01918f13
Table 1. Characteristics of the Mini-MCA multispectral camera.
ParameterValue
Number of channels6
Weight700 g
Geometric resolution1280 × 1024
Radiometric resolution10 bits
Speed1.3 frames/s
Pixel size5.2 μm
Focal length9.6 mm
Table 2. Characteristics of the six channels of the camera and their corresponding exposures times.
Channelλmin (nm)λmax (nm)Band Width (nm)Exposure Time (%)
074082080100
151055040130
265069040125
366074080100
472076040100
576084080100
Table 3. Unmanned aerial systems (UAS) characteristics.
ParameterValue
Weight without batteries1880 g
Battery weight (5000 mAh-14.8 V)540 g
Multispectral camera weight1025 g
Full system weight3445 g
Maximum range transmission1000 m
Recommended range transmission750 m
Estimated flight time12 min
Maximum horizontal speed4 km/h
Table 4. Radial and tangential distortion parameters of the six MCA channels.
ChannelBalanced Principal Distance (mm)Radial DistortionTangential Distortion

a0a1a2P1P2
778 nm9.9710.01508−0.002346.16E–051.45E–04−2.74E–04
530 nm9.8490.01560−0.002315.01E–052:06E–05−1.31E–04
672 nm9.9610.01556−0.00177−1.55E–051.57E–04−4.82E–04
700 nm9.9450.01464−0.002063.35E–053:20E–04−2.44E–04
742 nm9.9740.01817−0.00184−4.55E–055.41E–05−1.79E–04
801 nm9.9550.01648−0.00178−2.85E–05−1.02E–05−1.37E–04
Table 5. Mini-MCA calibration coefficients.
ChannelBlock AdjustmentIndividual Channel Adjustment

C0C1R2C0C1R2
778 nm−0.0009920.0471750.9833−0.0015100.0472920.9846
530 nm0.0007040.0578020.0002640.0577180.9816
672 nm−0.0003070.049919−0.0007950.0500050.9823
700 nm−0.0003450.041242−0.0008610.0413530.9820
742 nm−0.0006880.074146−0.0012050.0743350.9843
801 nm−0.0003190.047655−0.0008340.0476560.9827