1. Introduction
Soil salinization is one of the most relevant and important processes affecting the environmental degradation of land, especially in more arid regions [
1]. This is a problem for global agricultural production, because salts slow the growth and development of crops, decreasing productivity. In more severe cases, soil salinization leads to the collapse of agricultural production [
2,
3]. This is due to the rise in the osmotic potential of the soil solution by the toxic effects of specific ions and by the change in the physical and chemical conditions of the soil [
4]. Approximately 30% of irrigated land is moderately or severely affected by salinization [
5]. The identification and monitoring of these areas are essential to improving farm management practices [
6].
Studies have demonstrated the potential of remote sensing data to detect and map the occurrence and concentration of salts in the soil [
1,
7,
8]. The presence of salts at the terrain surface can be remotely detected directly on bare soils (salt efflorescence and crust) or indirectly through effects on vegetation growth or crop yield [
9]. Constraints on the use of remote sensing data for mapping salt affected areas include factors, such as the spectral behavior of salts, the low spectral resolution of some sensor systems, the temporal changes in salinity, the interference of vegetation and the physical and chemical modifications in the soil surface due to salinization [
1]. In spite of that, salinity indices have been proposed and tested on images [
10,
11]. With the improvement in the spectral resolution of image sensors, several studies on reflectance spectroscopy have also been carried out in the laboratory in order to better understand the influence of salts on the spectral response of soils. For example, Howari
et al. [
12] examined the spectral reflectance of soils treated with saline solutions in the laboratory. They observed that the crusts from different salts had diagnostic absorption bands at different wavelengths, whose position did not change with the size of the crystals or the salt concentration. According to them, when gypsum occurred in the treatment solutions of multiple salts, its primary diagnostic features predominated in the spectra of salt crusts. Farifteh
et al. [
13] set up a laboratory experiment involving soils with three textures and six salt minerals to study the relationship between salt concentration in soil and its spectral response. Changes in the shape of absorption bands positioned at wavelengths longer than 1300 nm and in the overall reflectance were observed with increased salt concentration. Furthermore, analysis of continuum-removed spectra indicated a strong negative correlation between soil electrical conductivity (EC) and absorption bands parameters (depth, width and area).
In Brazil, the problems of salinity from irrigation are common in the semi-arid northeast region, but remote sensing studies addressing this topic are rare in the literature. Attempts to use data from the Moderate Resolution Imaging Spectroradiometer (MODIS/Terra) with coarse spatial resolution (250–500 m spatial resolution for Bands 1–7), which does not allow measurements of narrow absorption bands in saline soil spectra, presented only moderate correlation results between spectral indices and EC [
14]. Before using satellite sensors with better spatial and spectral resolutions than MODIS for mapping salinity, laboratory studies are still necessary to analyze the influence of salts on the spectral response of soils from the region.
Studies on the spectral effects of gypsum are also important. Many salinized areas in Brazil are chemically treated with gypsum (CaSO
4·2H
2O) [
15,
16], which may affect the spectral response of the other types of salts present on the soil surface [
12], but little is known about this. The use of agricultural gypsum as a corrective measure for saline-sodic soils is due to the good solubility of this salt, which reduces aluminum saturation and adds calcium [
17]. It is essential in the replacement of sodium, which precipitates as a sulfate and is easily leached with the drainage of water [
15].
In this study, samples of
Neossolo Flúvico (fluvent soil in the American soil classification system) with irrigation-induced salinization problems for rice cultivation were collected from salinized areas in the semi-arid region of northeast Brazil (
Figure 1). Adopting the general strategy of the experiments by Howari
et al. [
12] and Farifteh
et al. [
18], a laboratory study was carried out to examine variations in spectral reflectance and the depth of the major absorption bands in the salinized-soil spectra. The soils were treated with different saline solutions of sodium chloride (NaCl), magnesium chloride (MgCl
2) and calcium chloride (CaCl
2), whose relative concentrations (non-saline to extremely saline) were measured using the EC of the salt solutions. We focused our analysis on the spectral effects of gypsum on local saline soils using principal components analysis and the continuum-removal techniques to observe variations in the spectral reflectance, brightness and depth of the major absorption bands. The implications of the results to mapping and monitoring soil salinization using hyperspectral remote sensing in the region are discussed, in which gypsum may be an indirect indicator of the salinization process, which may affect locally irrigated rice yield.
2. Materials and Methods
2.1. Soil Sample Collection
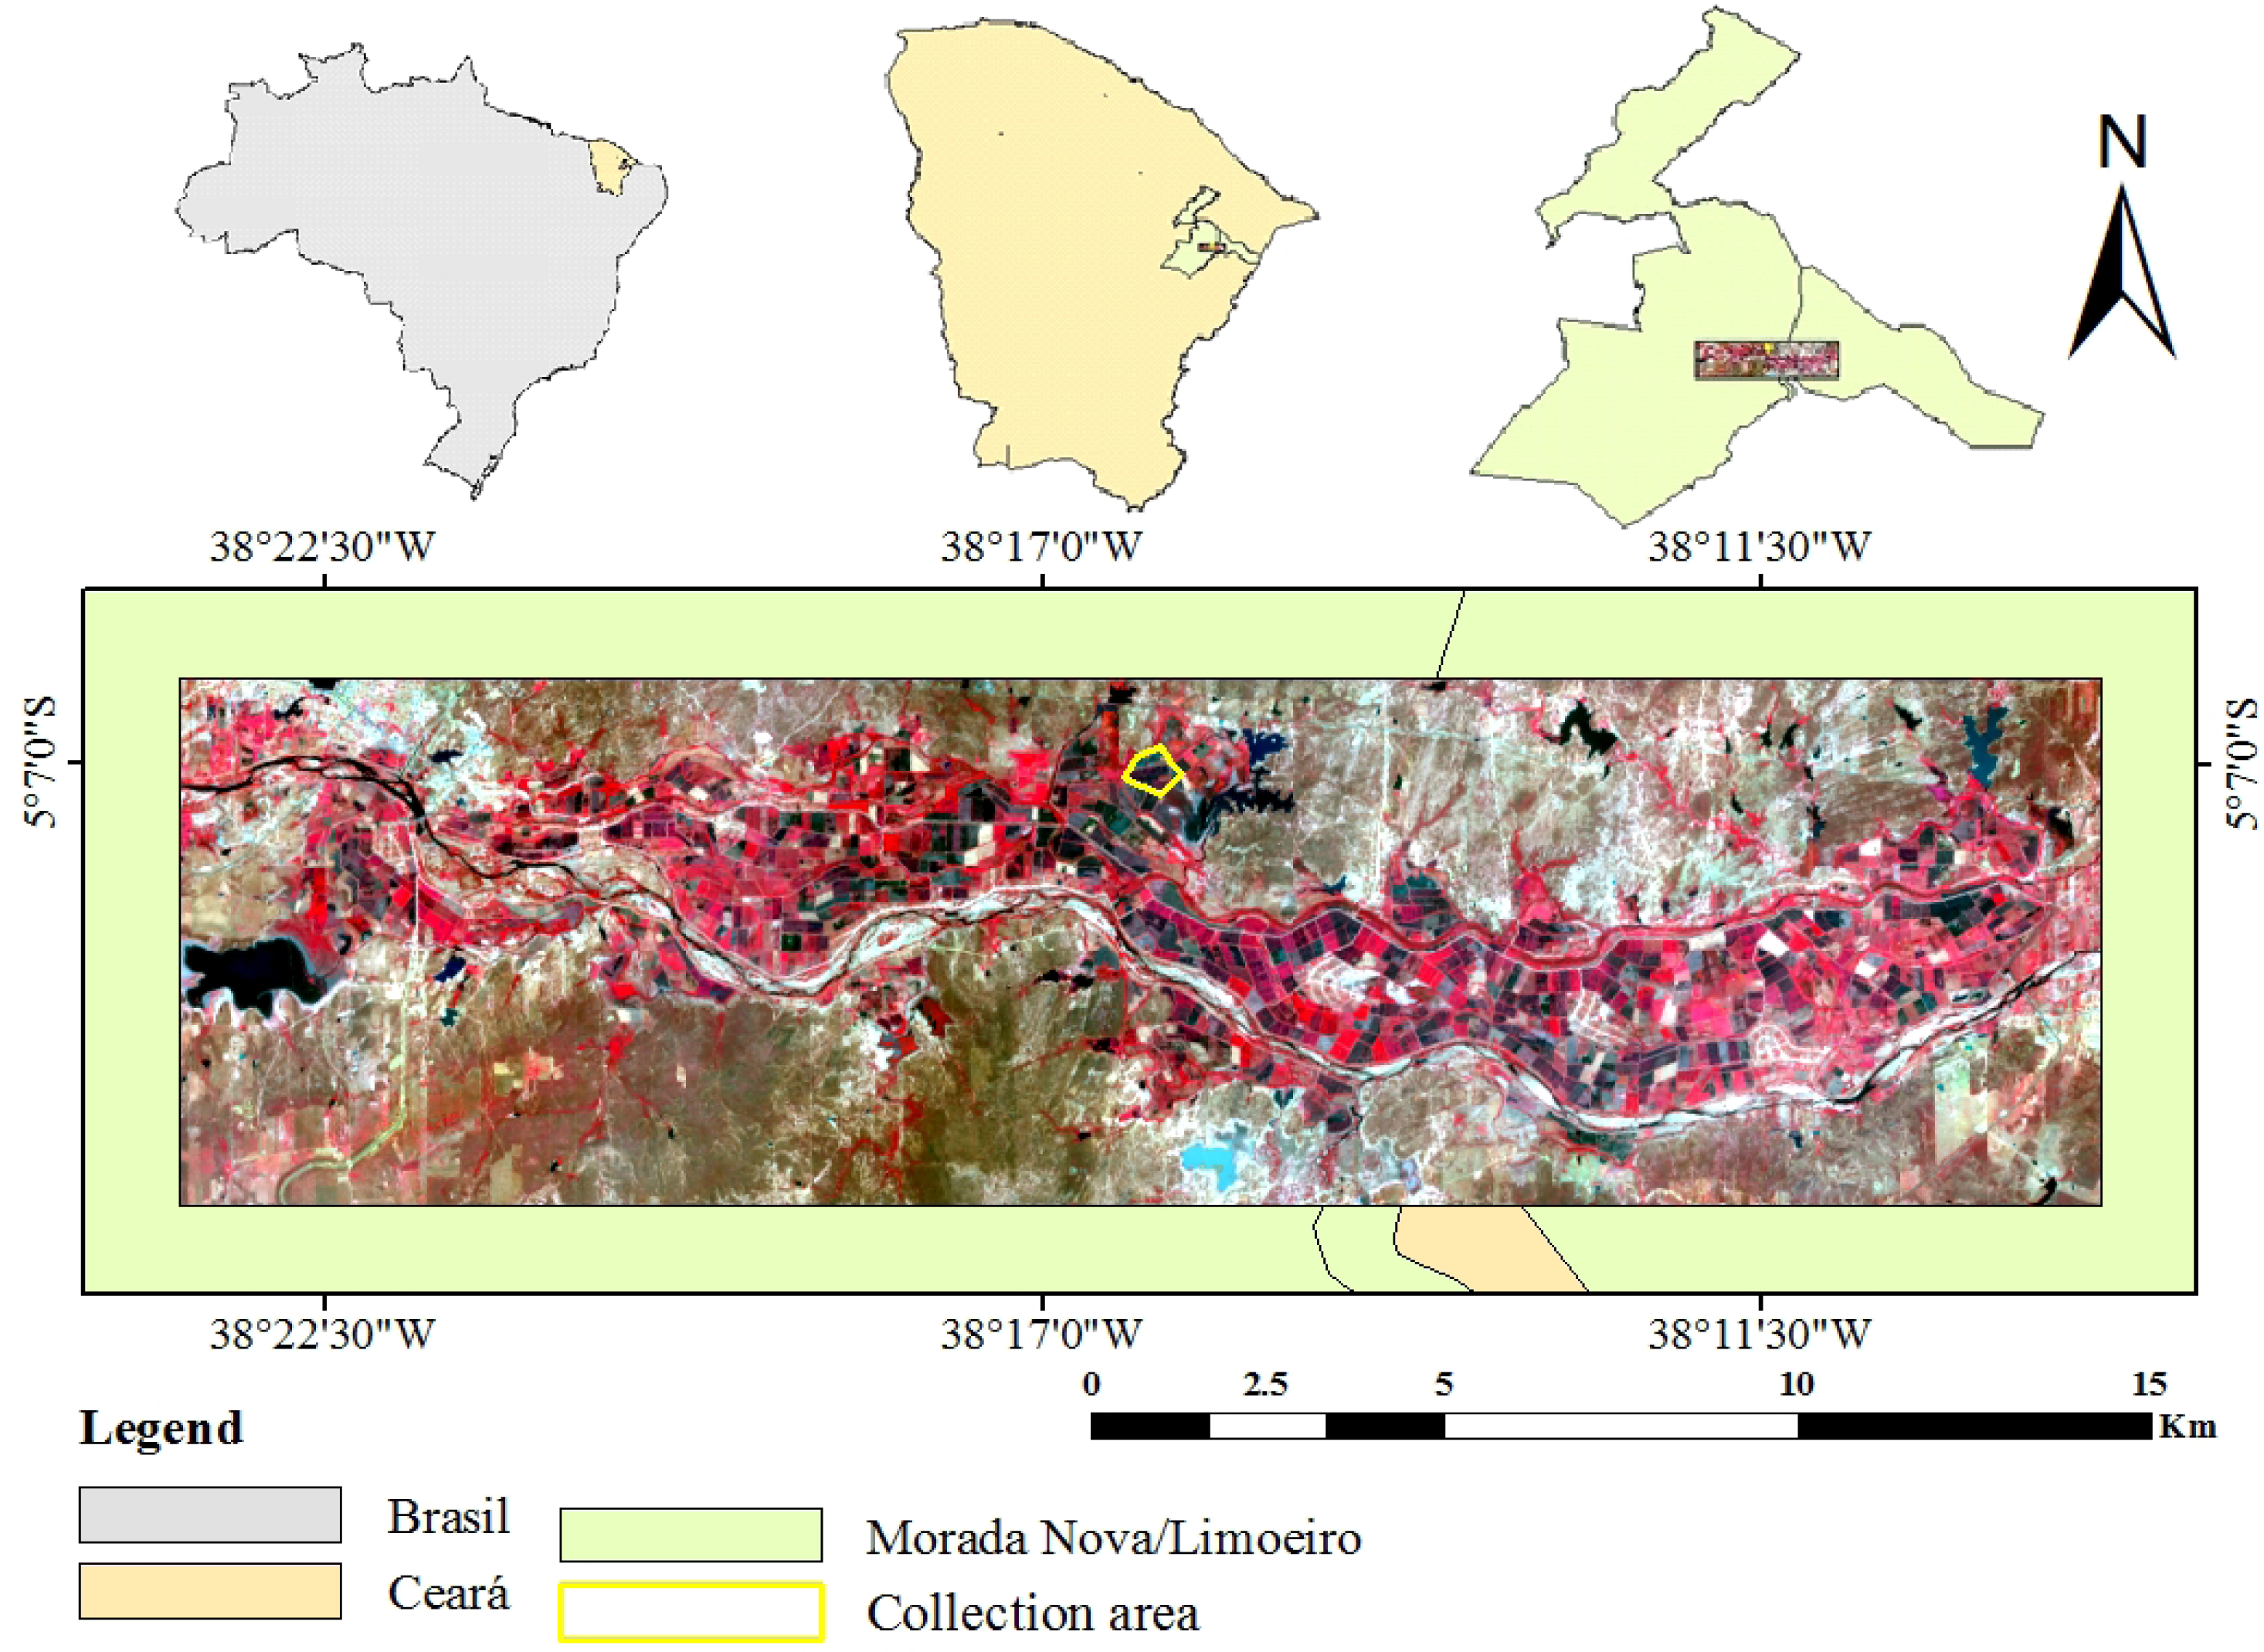
Soil samples were collected in the less salinized area of the Morada Nova Irrigation district, which is located in the municipalities of Morada Nova and Limoeiro do Norte, in the Brazilian state of Ceará (
Figure 1). The natural vegetation of the region is locally known as “Caatinga”, which consists primarily of small trees that shed their leaves seasonally. Riparian forest predominates along the main rivers. The relief is relatively flat, with the geology composed mainly of gneisses, migmatites and plutonic rocks of granitic composition. Alluvial soils occur over these rock substrata along the rivers [
19]. This area was selected, because it presents many problems of salinization that affect the productivity of irrigated rice [
20]. According to the Köppen classification, the climate in the region corresponds to very hot and semi-arid (BSW’h’) with average annual rainfall of 600 mm, a mean annual temperature of 27.5 °C and a potential evapotranspiration greater than 2000 mm [
21]. The rainy season ranges from January to June, with most of the precipitation concentrated between March and April. Fluvent soils, found in 70% of the irrigated area, were selected for sample collection. These alluvial soils have a texture with typical values of 39% of sand, 33% of silt and 28% of clay [
22]. At one specific site of exposed soil (S 5°07′08″ and W 38°16′35″; the yellow polygon in
Figure 1), 180 samples were collected at a depth of 0 to 15 cm.
2.2. Soil Sample Preparation
An experiment was setup in the laboratory to simulate the accumulation of salts in the soil. Soil samples (180) were crushed and sieved with a 2 mm sieve to reduce the effect of soil particles on the spectra. Soil samples were divided into two sets, each with six replications. One of the six replications was stored for later use/reference, if required.
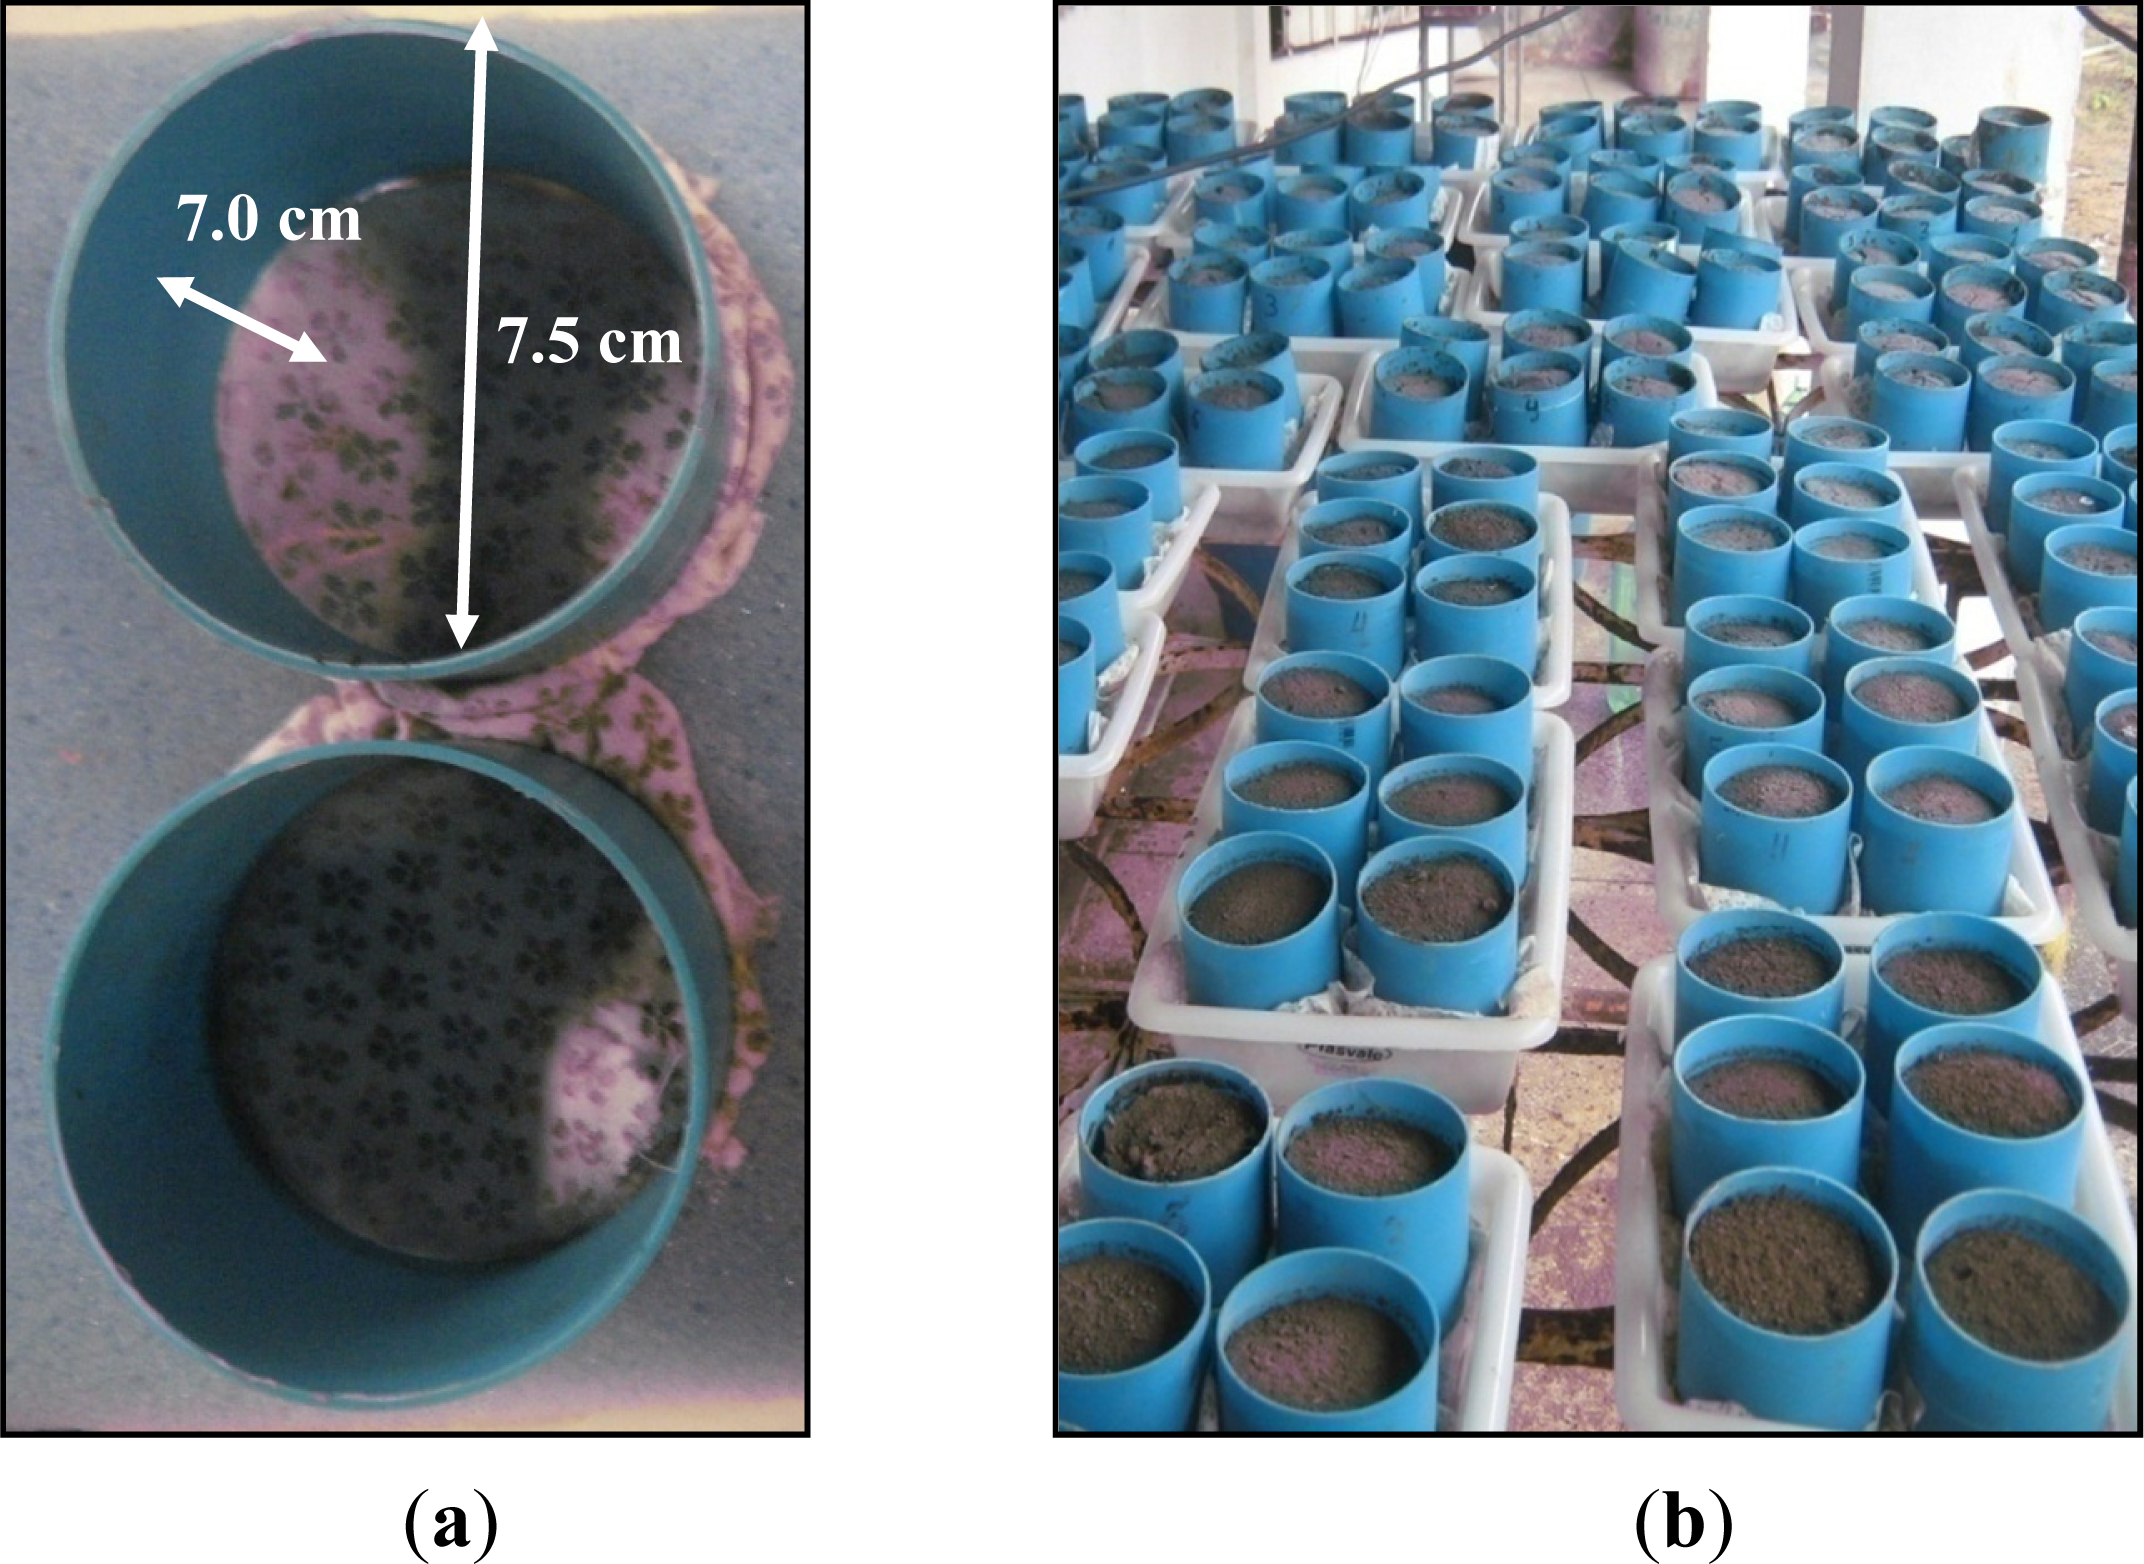
The first set of samples (“non-treated chemically with gypsum” (NTG)) was placed into polyvinyl chloride (PVC) cylinders, 7.5 cm in diameter by 7.0 cm high, giving a total volume of approximately 309 cm
3 of soil per sample (
Figure 2a). This set was treated with salinization by irrigation with distilled water in three saline solutions of NaCl, MgCl
2 and CaCl
2. Five increasing concentrations of salt or EC levels were used: EC1 (0 dS/m: solution with distilled water only); EC2 (up to 5.48 dS/m); EC3 (5.48 to 9.52 dS/m); EC4 (9.52 to 17.25 dS m); and EC5 (>17.25 dS/m). The EC data (dS/m at 25 °C) were measured with an HI2300 conductivity meter (Hanna Instruments).
The second set of soil samples (“treated chemically with gypsum” (TG)) was treated with 9.4 g/kg of gypsum (50 mesh particle size) and subsequently washed several times with distilled water before being transferred to the containers, following the procedures described by Duarte
et al. [
23]. A simulation of salinization was then carried out using the same procedure described in the previous paragraph.
Thus, each of the two sets involved a total of 75 samples (5 replications × 3 salts × 5 salt concentrations). Once prepared, the soil cylinders were grouped according to their treatment (type of salt and simulated concentration) and placed into plastic trays (
Figure 2a,b), where five processes of irrigation by capillarity until saturation were simulated using the saline solutions. A sponge was placed in each tray to ensure the rise of the water table (
Figure 2a). All samples were air-dried (natural process of evaporation).
In the soil chemical analyses, the concentration of calcium (Ca
2+), magnesium (Mg
2+) and sodium (Na
+) in Mmol/dm
3 was determined according to the procedures described by Embrapa [
24].
2.3. Spectral Data Measurement
To obtain the spectral data in the laboratory, the FieldSpec Pro FR 3 spectrometer was used (Analytical Spectral Devices Inc., Boulder, CO, USA) under a controlled environment (dark room). It has a spectral resolution of 3 nm in the visible and near-infrared region (VNIR = 350–1300 nm), and of 10 nm in the shortwave infrared spectral interval (SWIR = 1300–2500 nm). The sensor was positioned at nadir, 7 cm above the samples. The illumination source was a 250-W halogen lamp with a parabolic reflector, in which the beam was adjusted to a zenith angle of 30°. A calibrated white Spectralon panel was used as a reference. Each reflectance measurement was an average of three readings over the soil.
2.4. Data Analysis
Data analysis included two steps: one to characterize the variations in spectral reflectance and brightness and the other to evaluate the modifications in depth of the major absorption bands with increasing concentration of salts in the soil (or EC) for the NTG and TG samples.
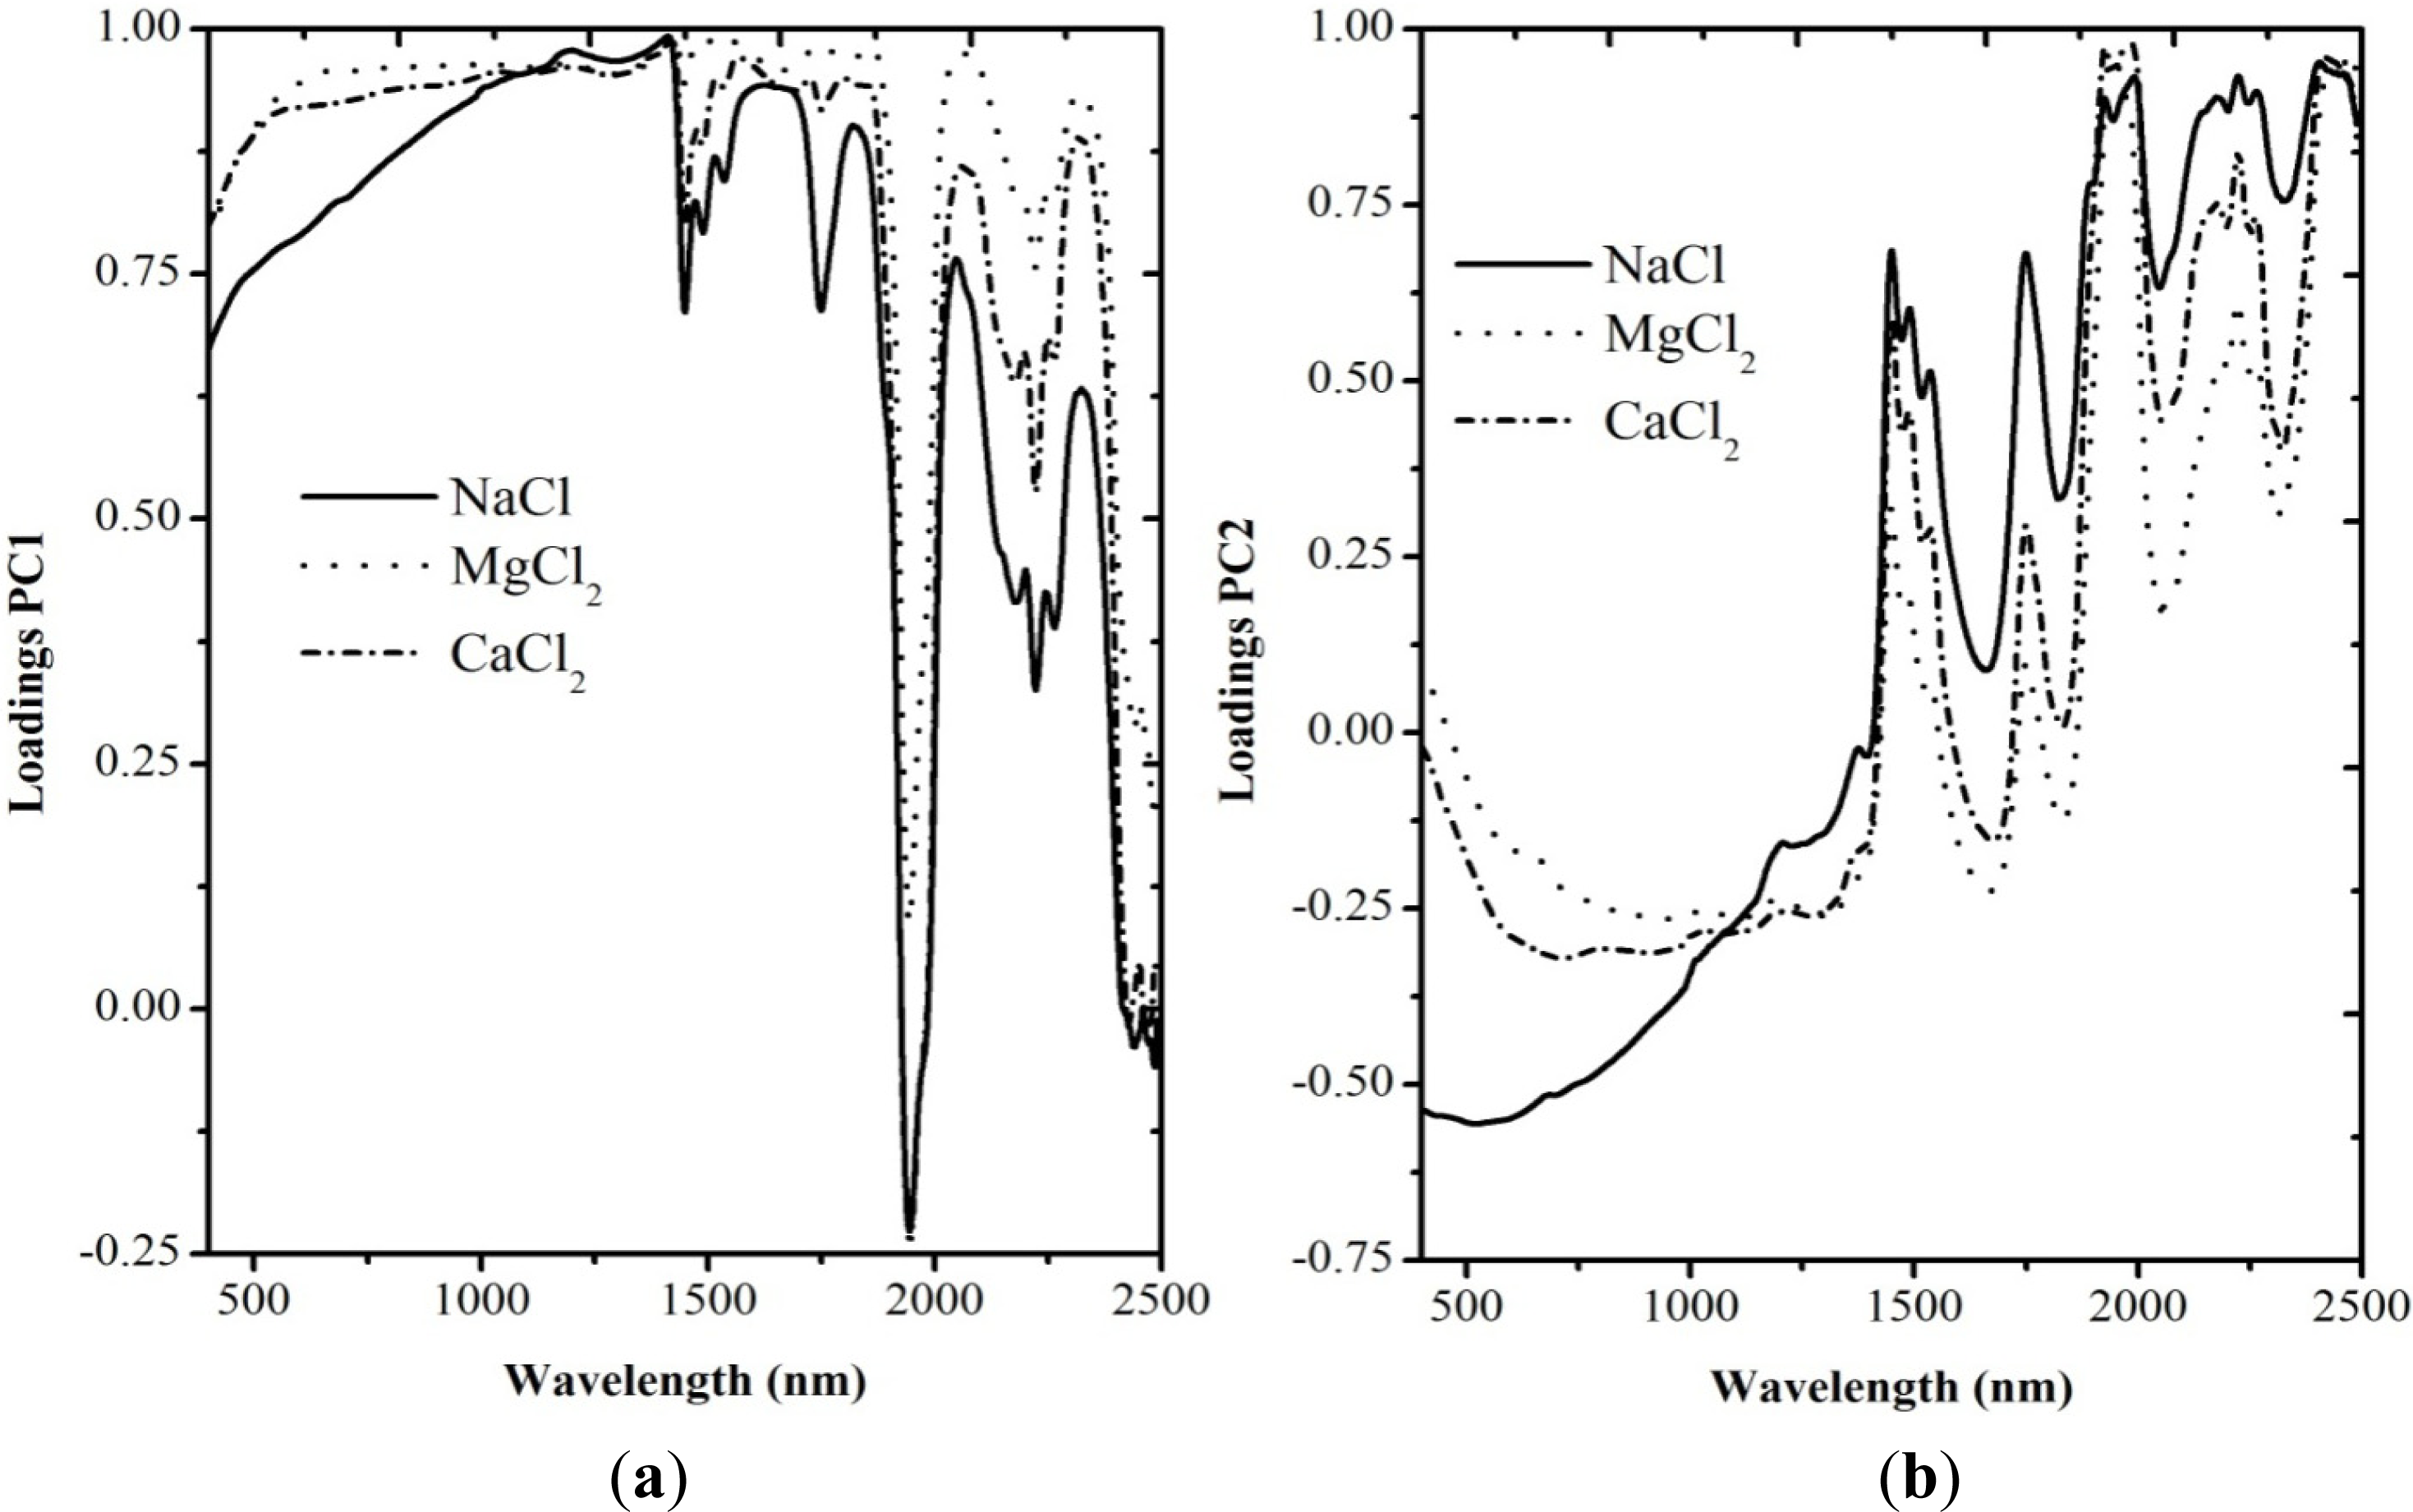
When applied to images, principal components analysis (PCA) is an interesting approach to deal, at the same time, with salt identification and change detection [
1]. When applied to laboratory spectra, it also allows a reduction in the data dimensionality and the determination of the factors responsible for the spectral variability in the datasets [
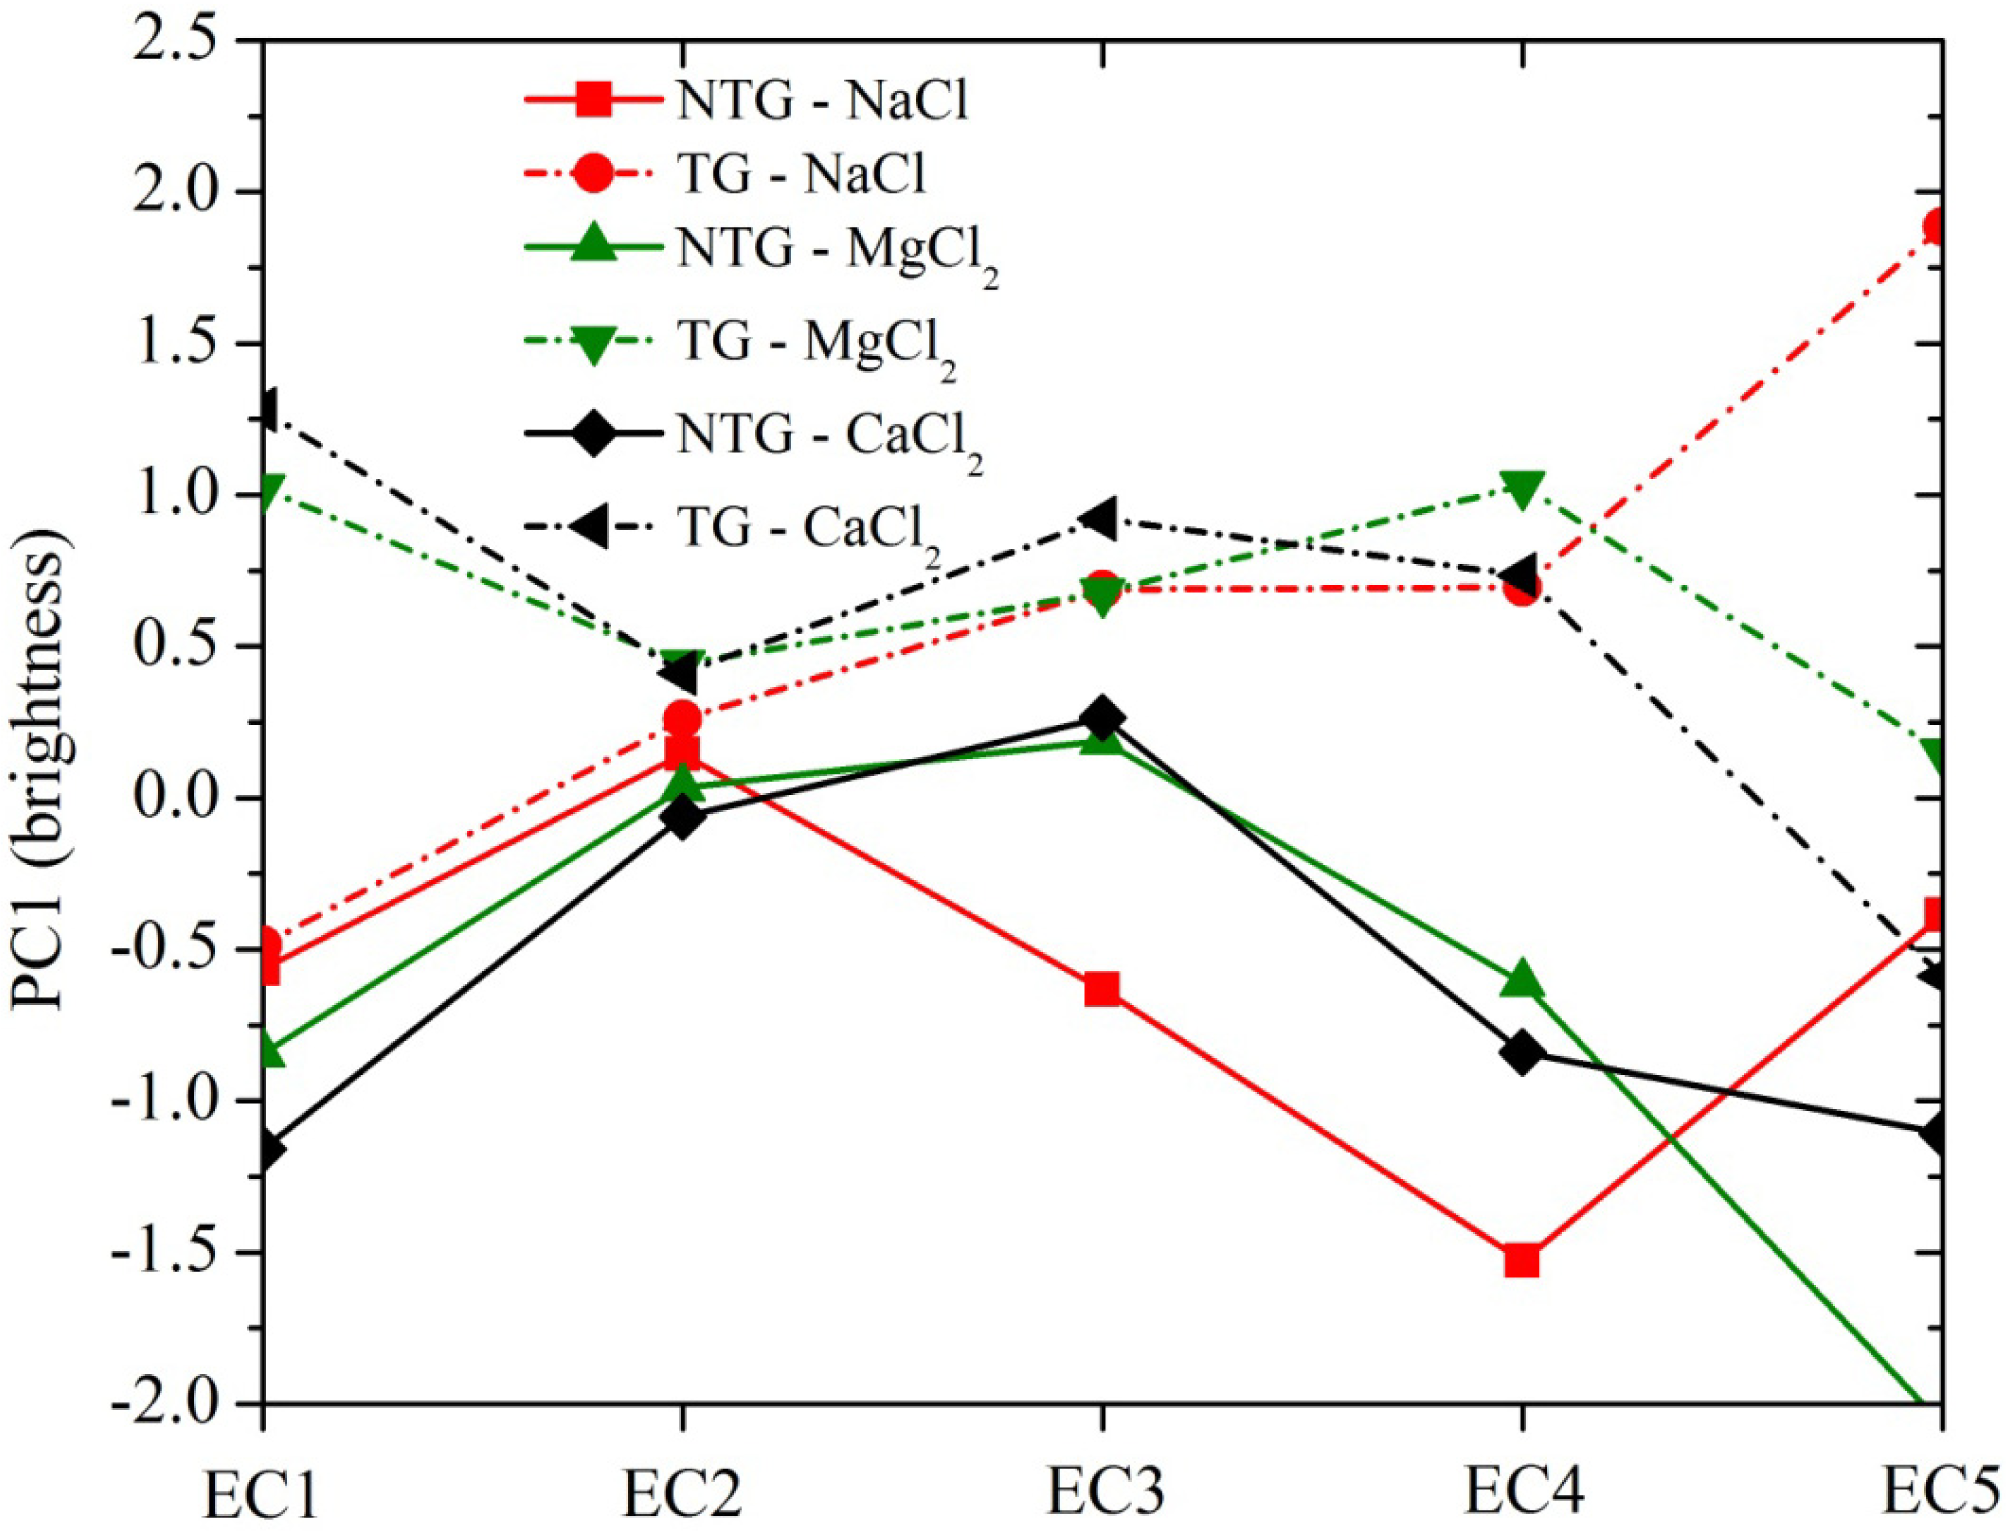
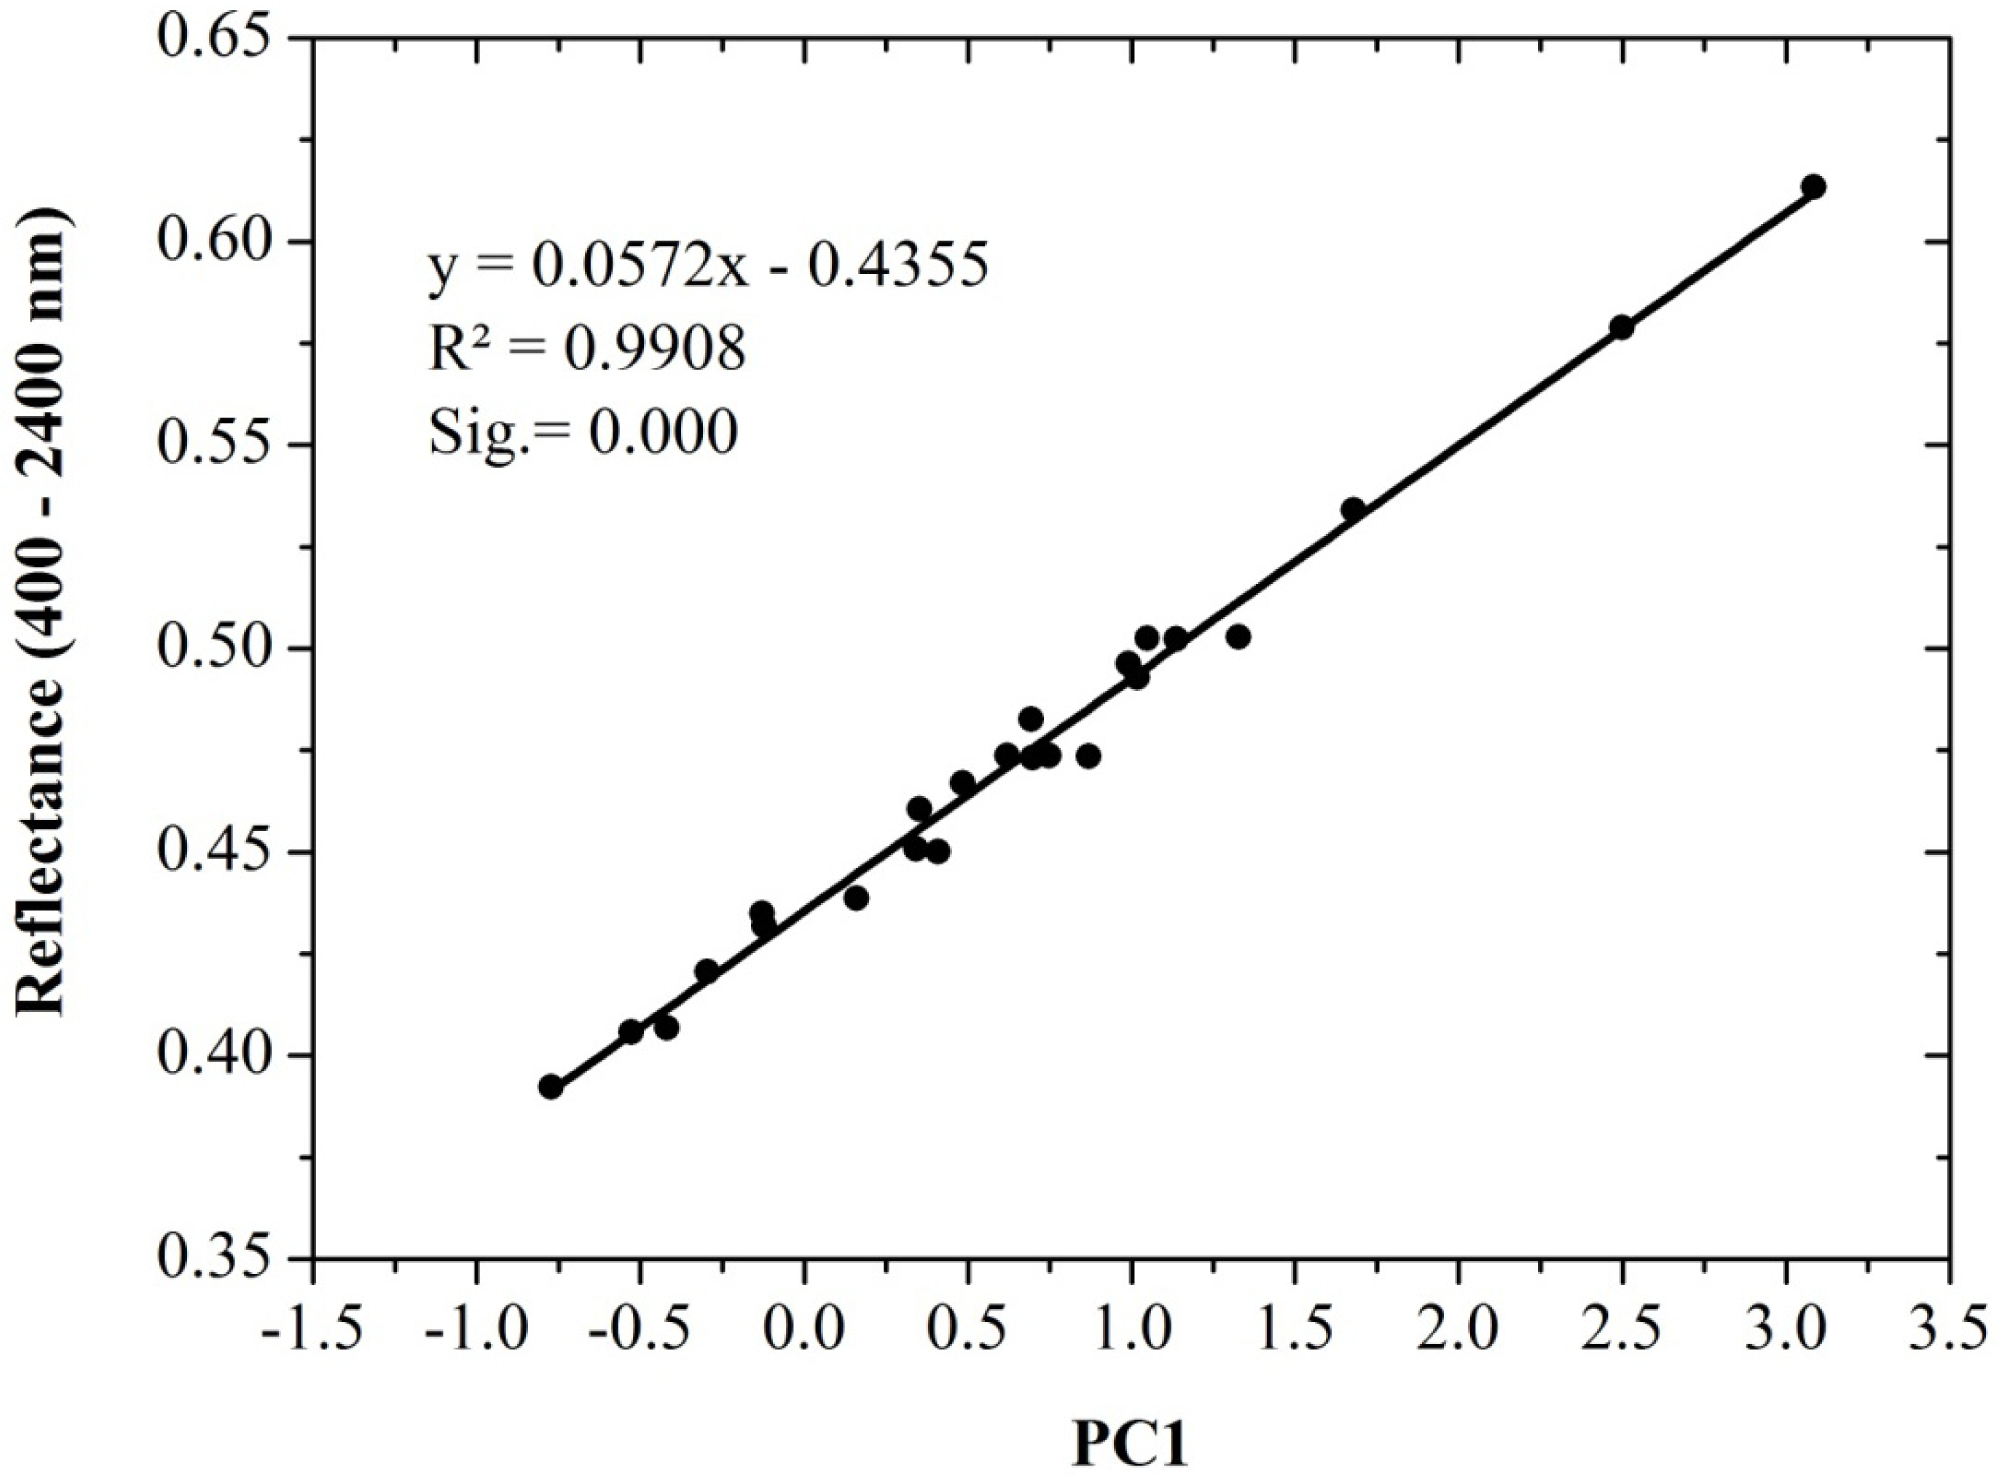
25]. The eigenvalues indicate the number of PCs responsible for most of the data variance, whereas the eigenvectors indicate the most important input variables to explain each component. As part of the first step in data analysis, PCA was applied separately for each salt to both datasets (NTG and TG). Reflectance values of the whole spectrum were used as input variables. Components with eigenvalues greater than one were retained and their eigenvectors analyzed in order to verify the contribution of each wavelength reflectance to explain each component. Principal components scores were plotted as a function of EC for the NTG and TG samples. Based on these scores and on the significance of the PCs, spectra were selected and compared to each other to show variations in reflectance with the increase in salt concentration. Pearson’s correlation coefficients between reflectance and EC were also obtained to establish the relationships with salinity.
In the second step, in order to filter out the absorption bands from spectra and to quantify the changes in depth of the major absorption bands, the continuum removal technique was used [
26]. This technique consists in the division of the original reflectance values (ρλoriginal) on each wavelength (λ) by the corresponding values projected on the straight line (ρλcontinuum) connecting the ends of a given absorption band. The depth of an absorption band (D) centered at a given wavelength, λ
c, is calculated by Equation (1) [
26]:
In principle, the larger D becomes for a given λ, the greater the amount of the absorber. The values of D for the major absorption bands were then plotted as a function of EC for the NTG and TG samples, and the correlations were analyzed.
4. Conclusions
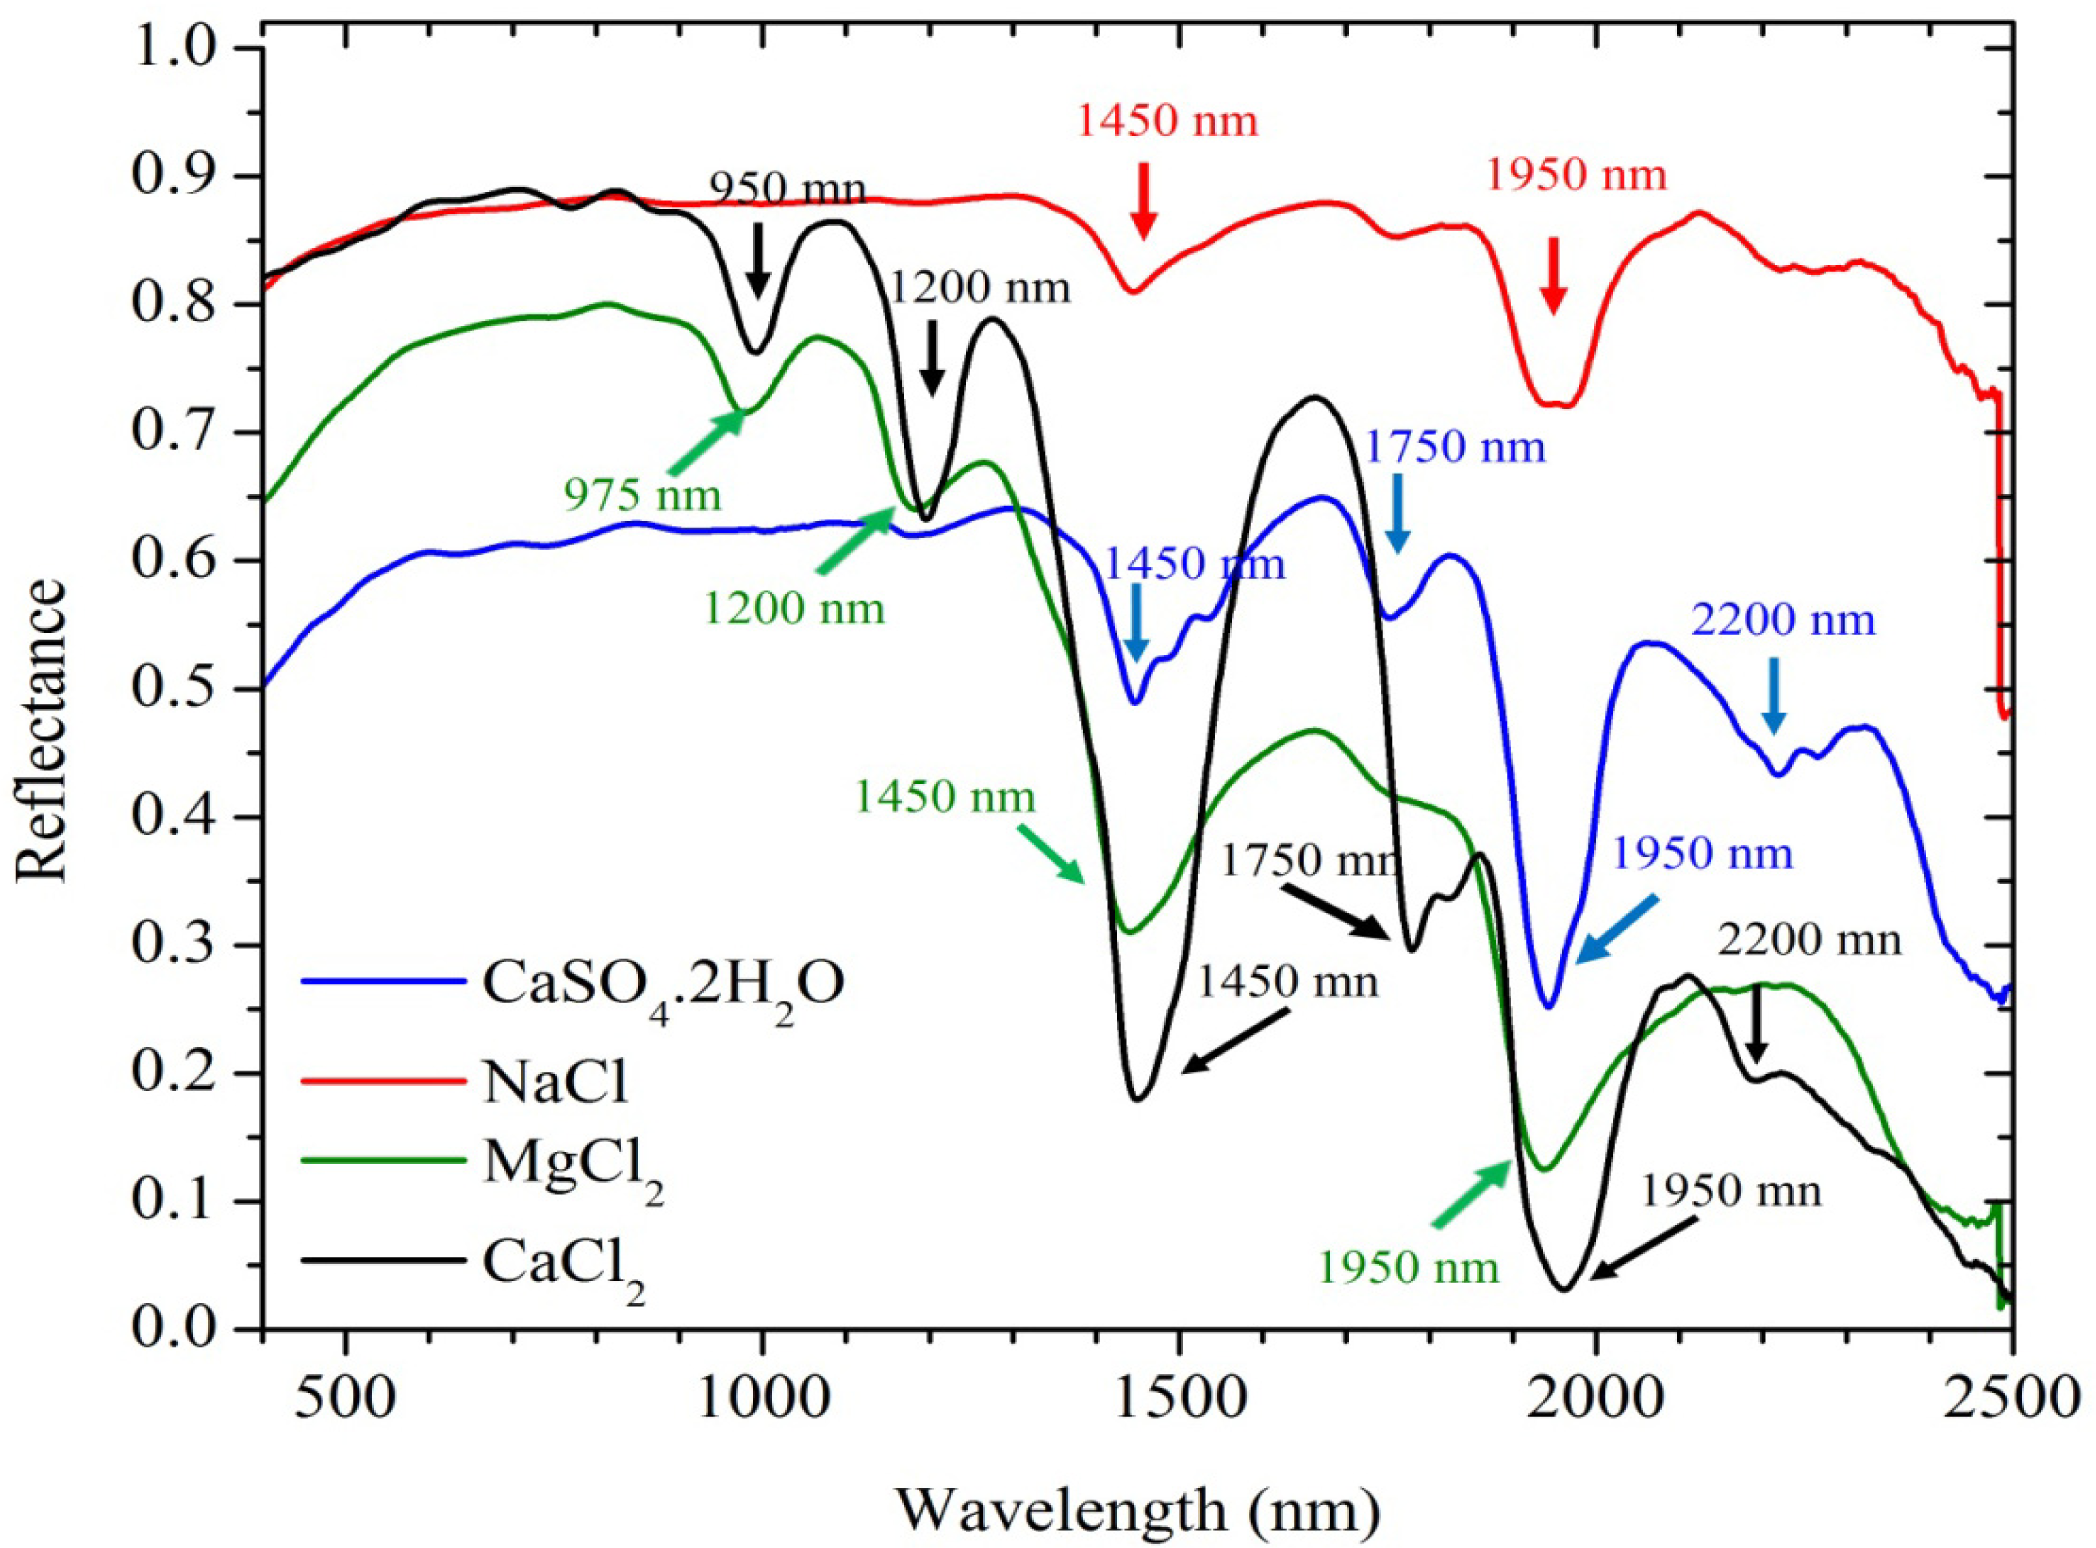
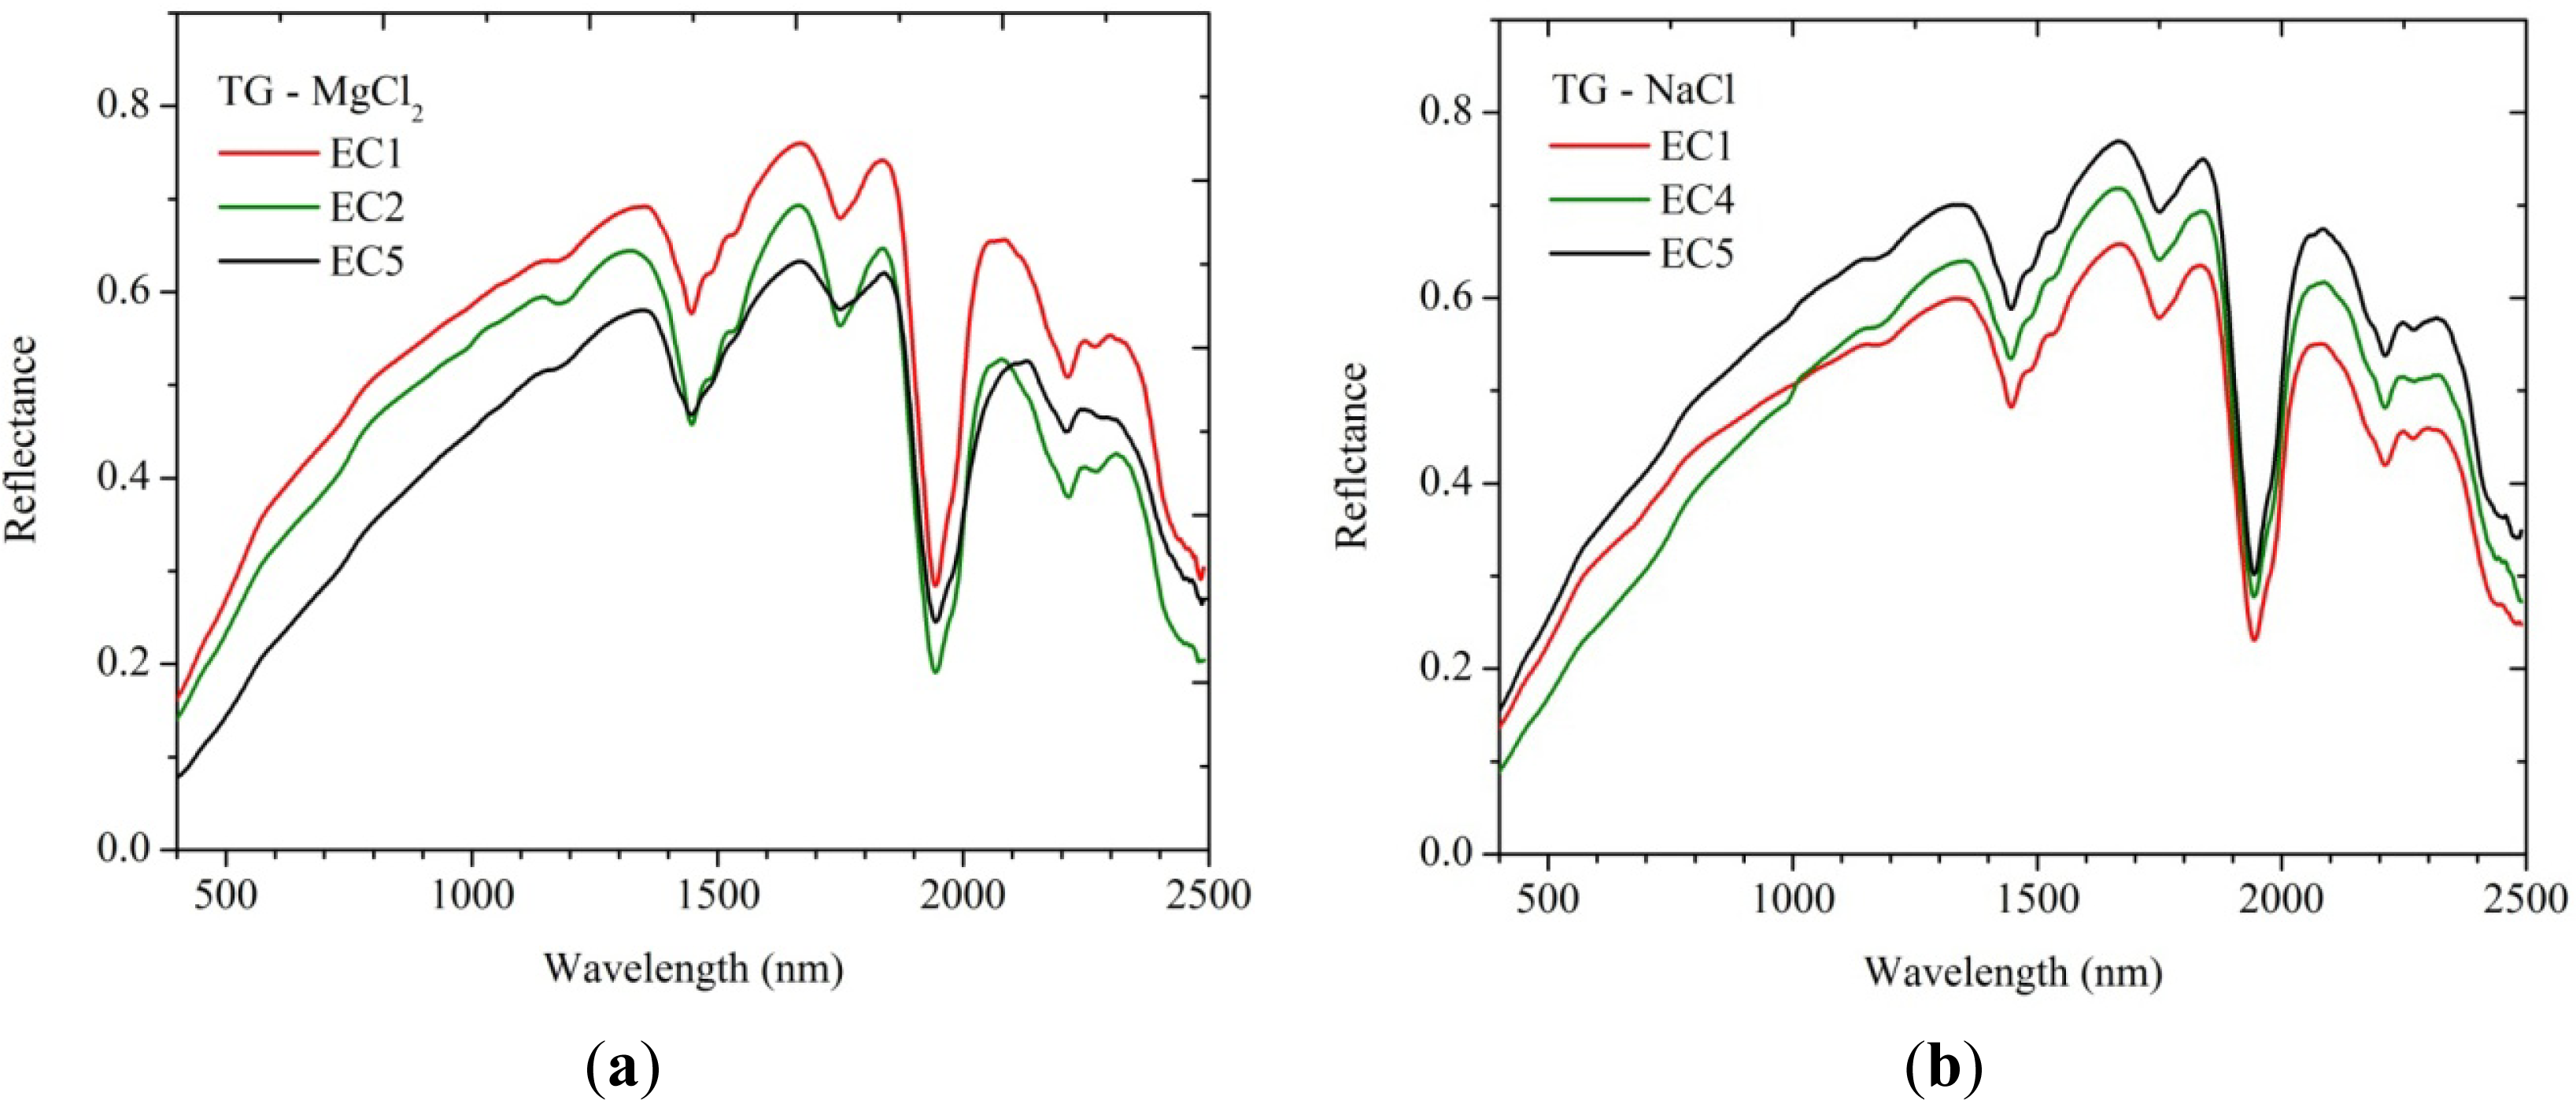
Brazilian alluvial soil samples were treated in the laboratory with increasing salinization levels of NaCl, MgCl2 and CaCl2, and the spectral effects of gypsum, a corrective for saline soils, were studied. Results showed that the spectral reflectance and brightness of the NTG samples of fluvent soil decreased from EC1 (non-saline solution with distilled water) to EC5 (extremely saline solution) for CaCl2 and MgCl2. The opposite was observed for NaCl. Under chemical treatment with gypsum, the brightness of the TG samples increased for all salts compared to the NTG samples.
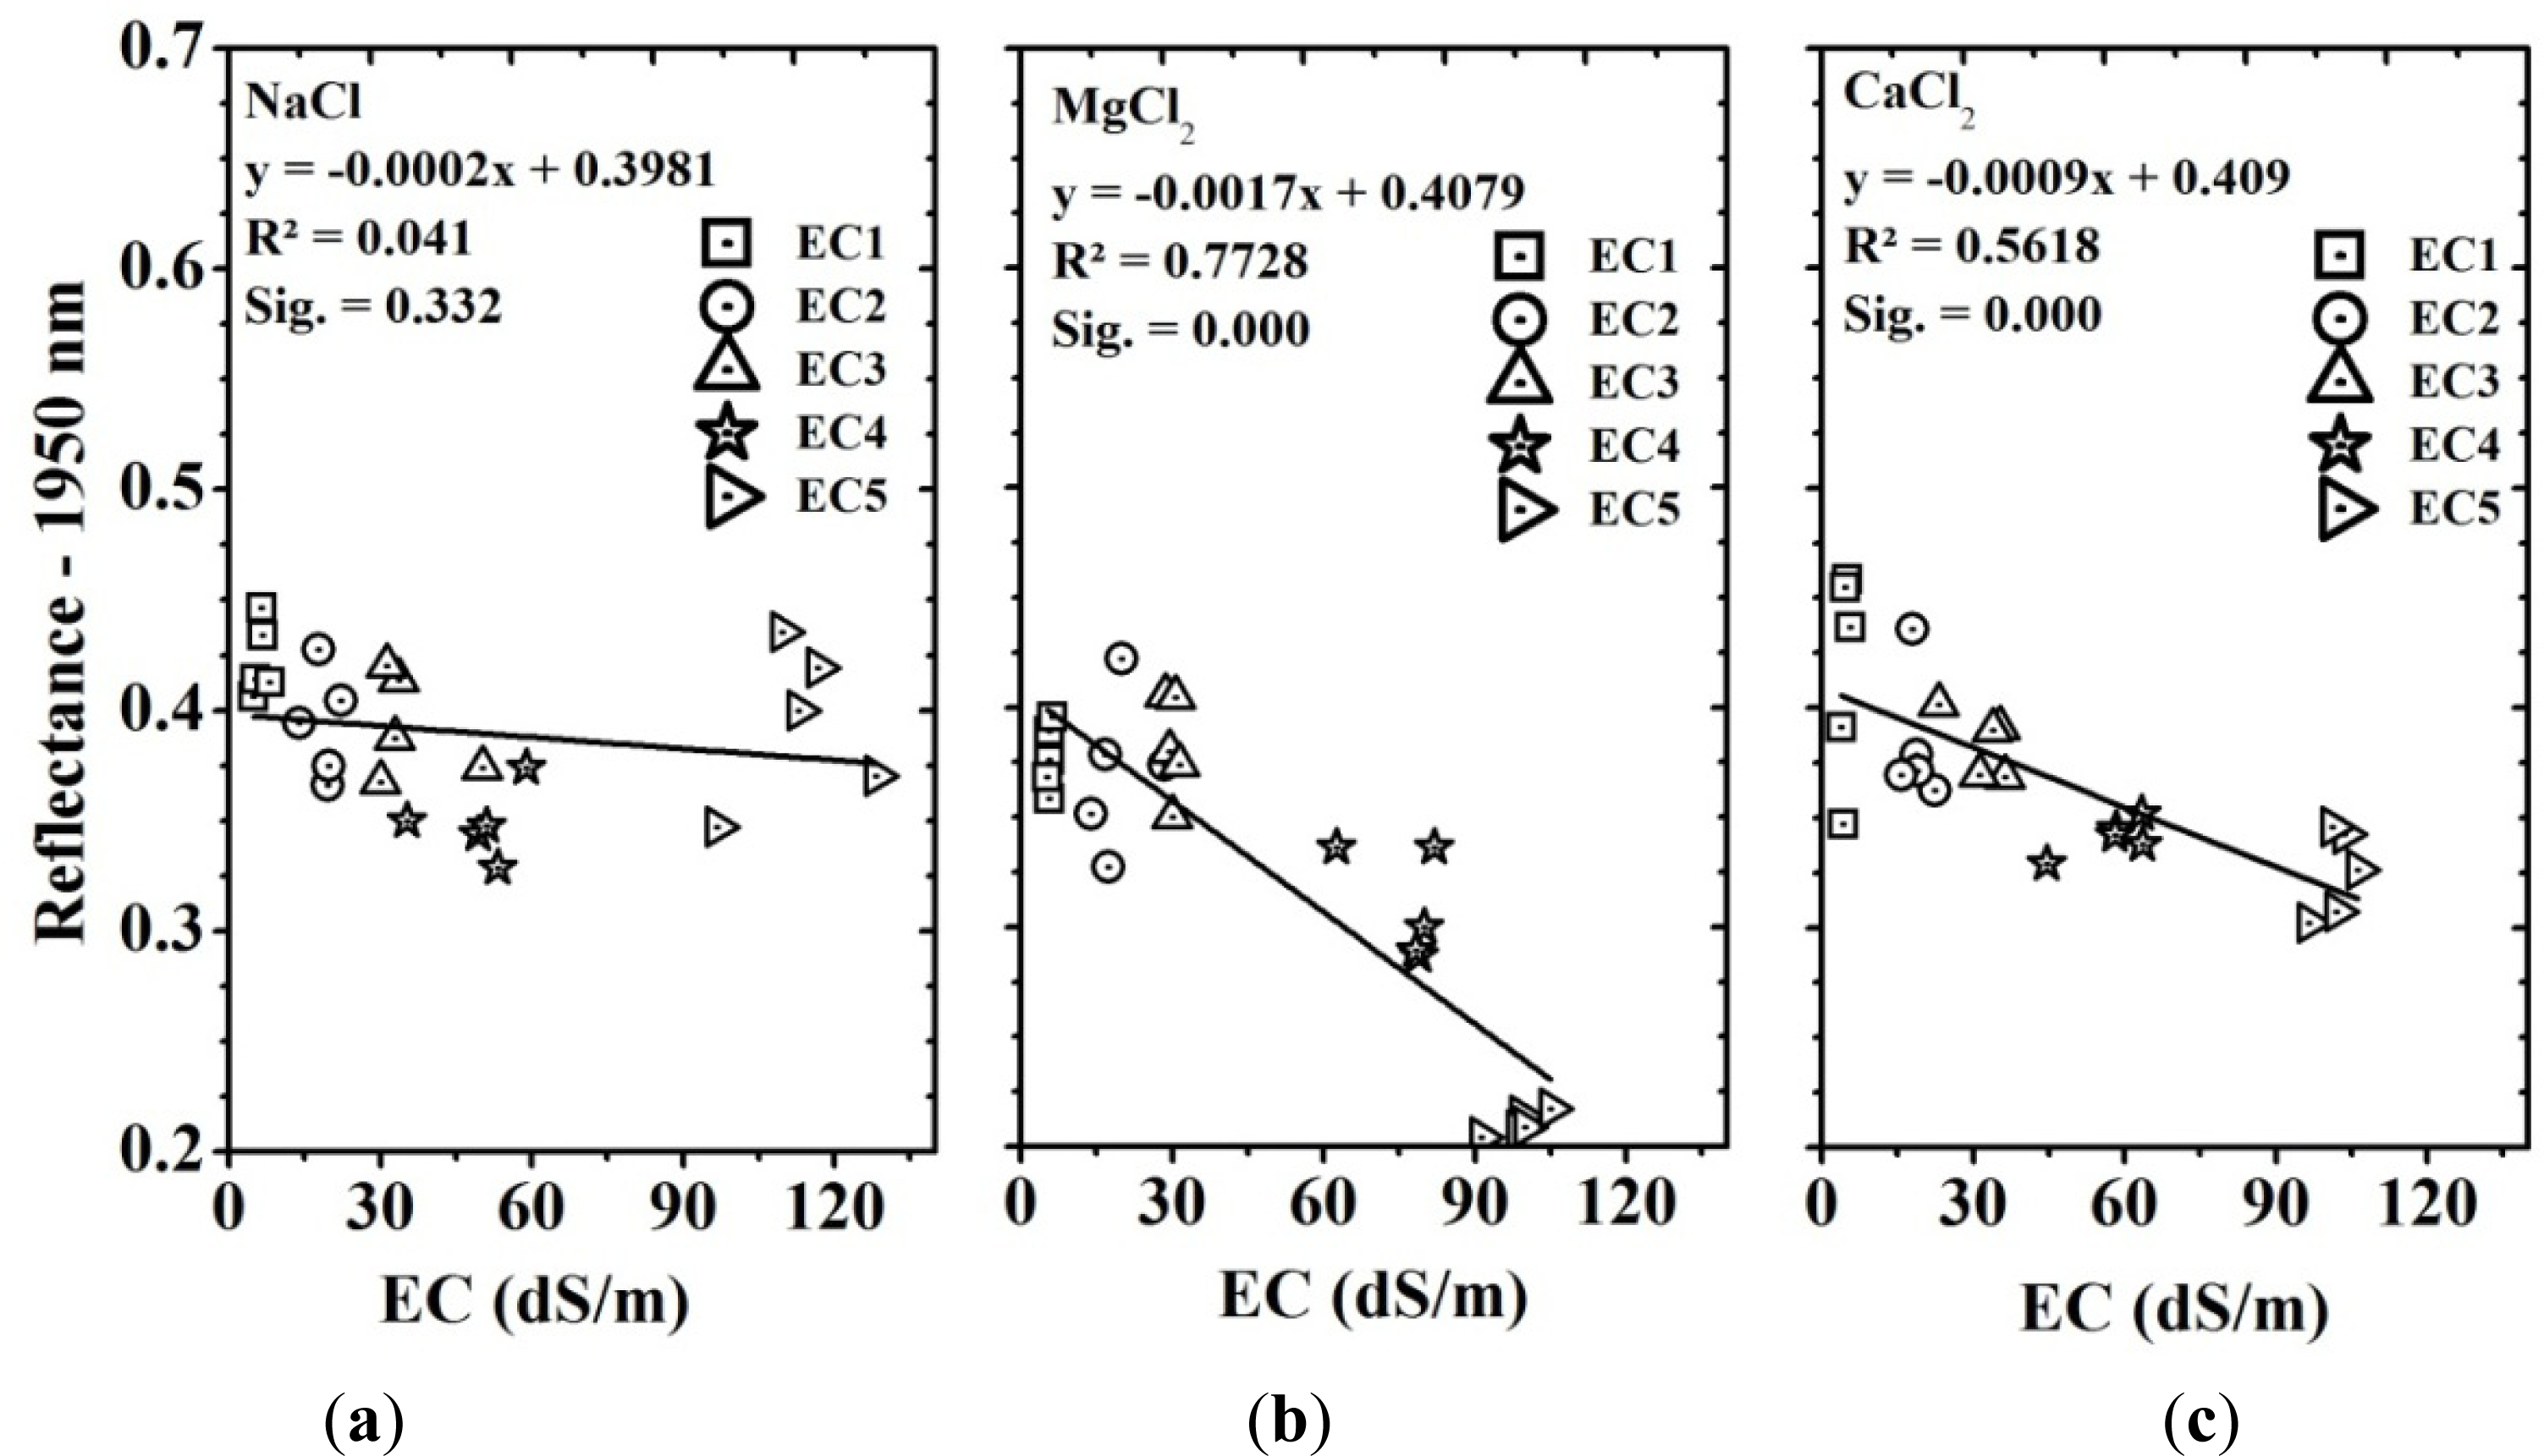
In the set of NTG samples, the best correlations between reflectance and soil salinity, expressed as EC values, were obtained for CaCl2 and MgCl2 in the 1500–2400 nm spectral interval. Chemical treatments with gypsum affected these relationships, reducing the SWIR correlation results.
For the absorption bands of the pure-salt spectra, the best-defined features seen in the spectra of the salinized fluvent soils were those at 1450 nm and 1950 nm. After treatment with gypsum, additional absorption features centered at 1750 nm for this constituent were also observed. Strong positive correlations between the depths of the absorption bands positioned at 1450 nm and 1950 nm and the EC values were only seen for the MgCl2, probably because this salt is much more hygroscopic than the others. The depth of the 2200 nm clay mineral absorption band present in soil spectra, which was approximately coincident with the gypsum feature, was inversely correlated with the EC values.
The results of this laboratory experiment have implications on salinization investigations in the study area with future hyperspectral sensors, such as the EnMAP (Environmental Mapping and Analysis Program) or HyspIRI (Hyperspectral Infrared Imager), with spatial resolutions of 30 m and 60 m, respectively, and more than 200 bands. The absorption bands at 1450 nm and 1950 nm coincide with spectral intervals of strong absorption by atmospheric water vapor, but the feature at 1750 nm can be detected in the pixel spectra of exposed salinized soils. This feature occurs in the spectra of gypsum, a corrective for saline soils that can be used indirectly to map salinization. Detection of modifications in the depth of the 2200 nm clay mineral absorption band due to salinization or the use of gypsum depends strongly on the instrumental signal-to-noise ratio (SNR) in the SWIR. Because gypsum and the other studied salts are much stronger absorbers in the SWIR due to their different hygroscopic nature, the use of VNIR/SWIR indices can be also helpful for mapping salinity.


