
Self-Adaptive Gradient-Based Thresholding Method for Coal Fire Detection Based on ASTER Data—Part 2, Validation and Sensitivity Analysis

Abstract
:
1. Introduction
2. Materials and Data
2.1. Regional Geographical and Geological Overviews

2.2. Land Use and Land Cover
2.3. Thermal Remote Sensing Data

| Sensor | Date and Time of Acquisition (Time is Local Time = UTC + 8) | Day/Night |
|---|---|---|
| ASTER | 22:54:22 21 September 2002 | Night |
| 11:54:17 29 November 2007 | Day | |
| 22:58:56 29 November 2007 | Night | |
| 11:54:35 26 March 2010 | Day | |
| 11:48:38 27 March 2013 | Day | |
| 22:53:17 27 March 2013 | Night | |
| 11:54:43 22 June 2013 | Day | |
| 22:59:22 22 June 2013 | Night | |
| 11:54:34 26 September 2013 | Day | |
| TIRS (Landsat 8) | 22:38:14 23 December 2013 | Day |
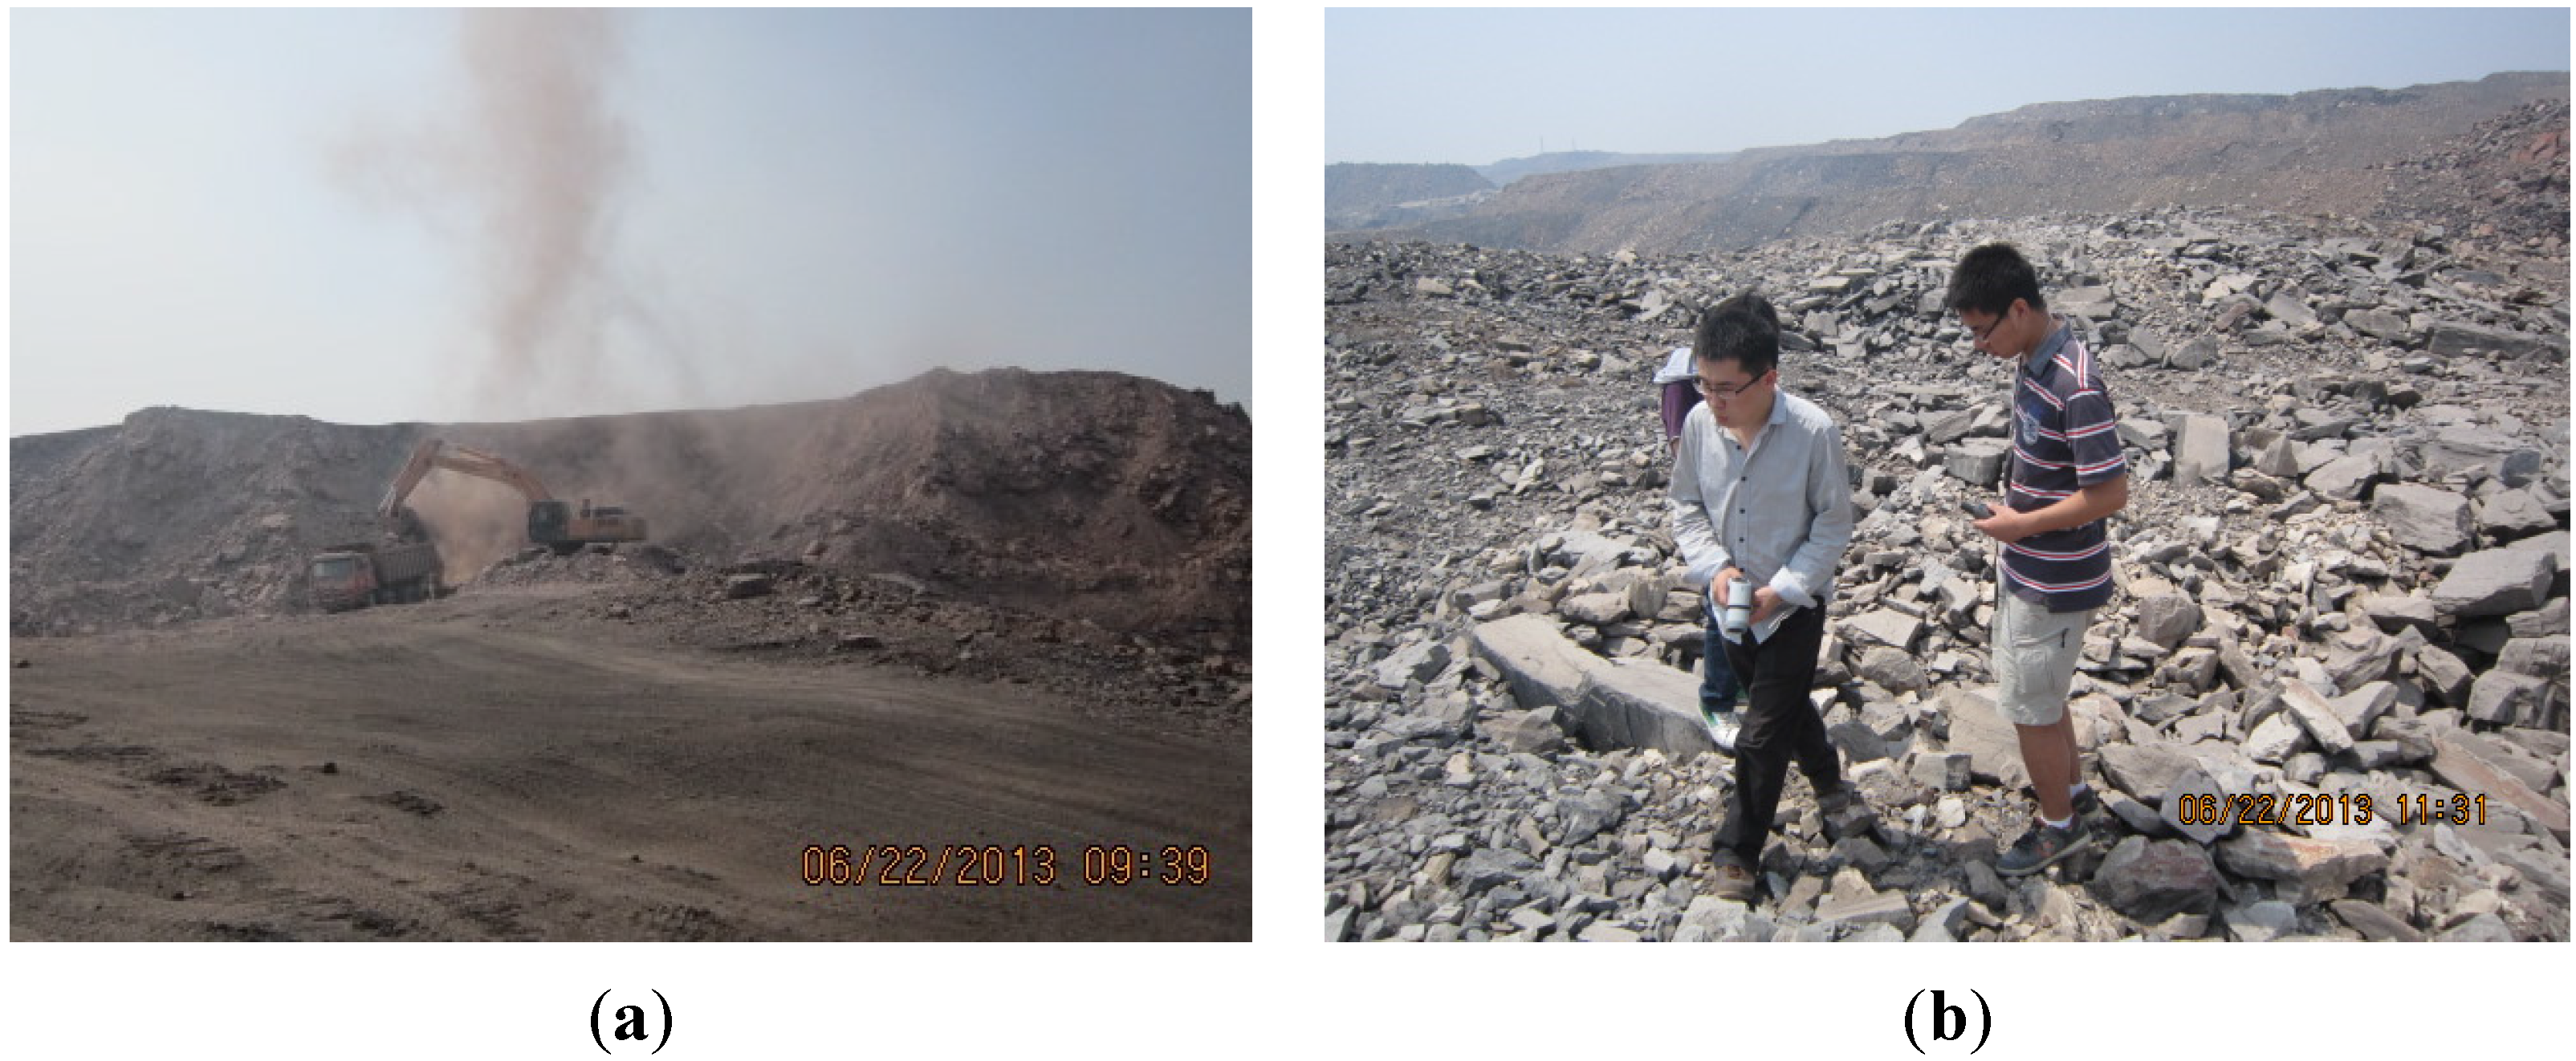
2.4. Field Data
3. Methods
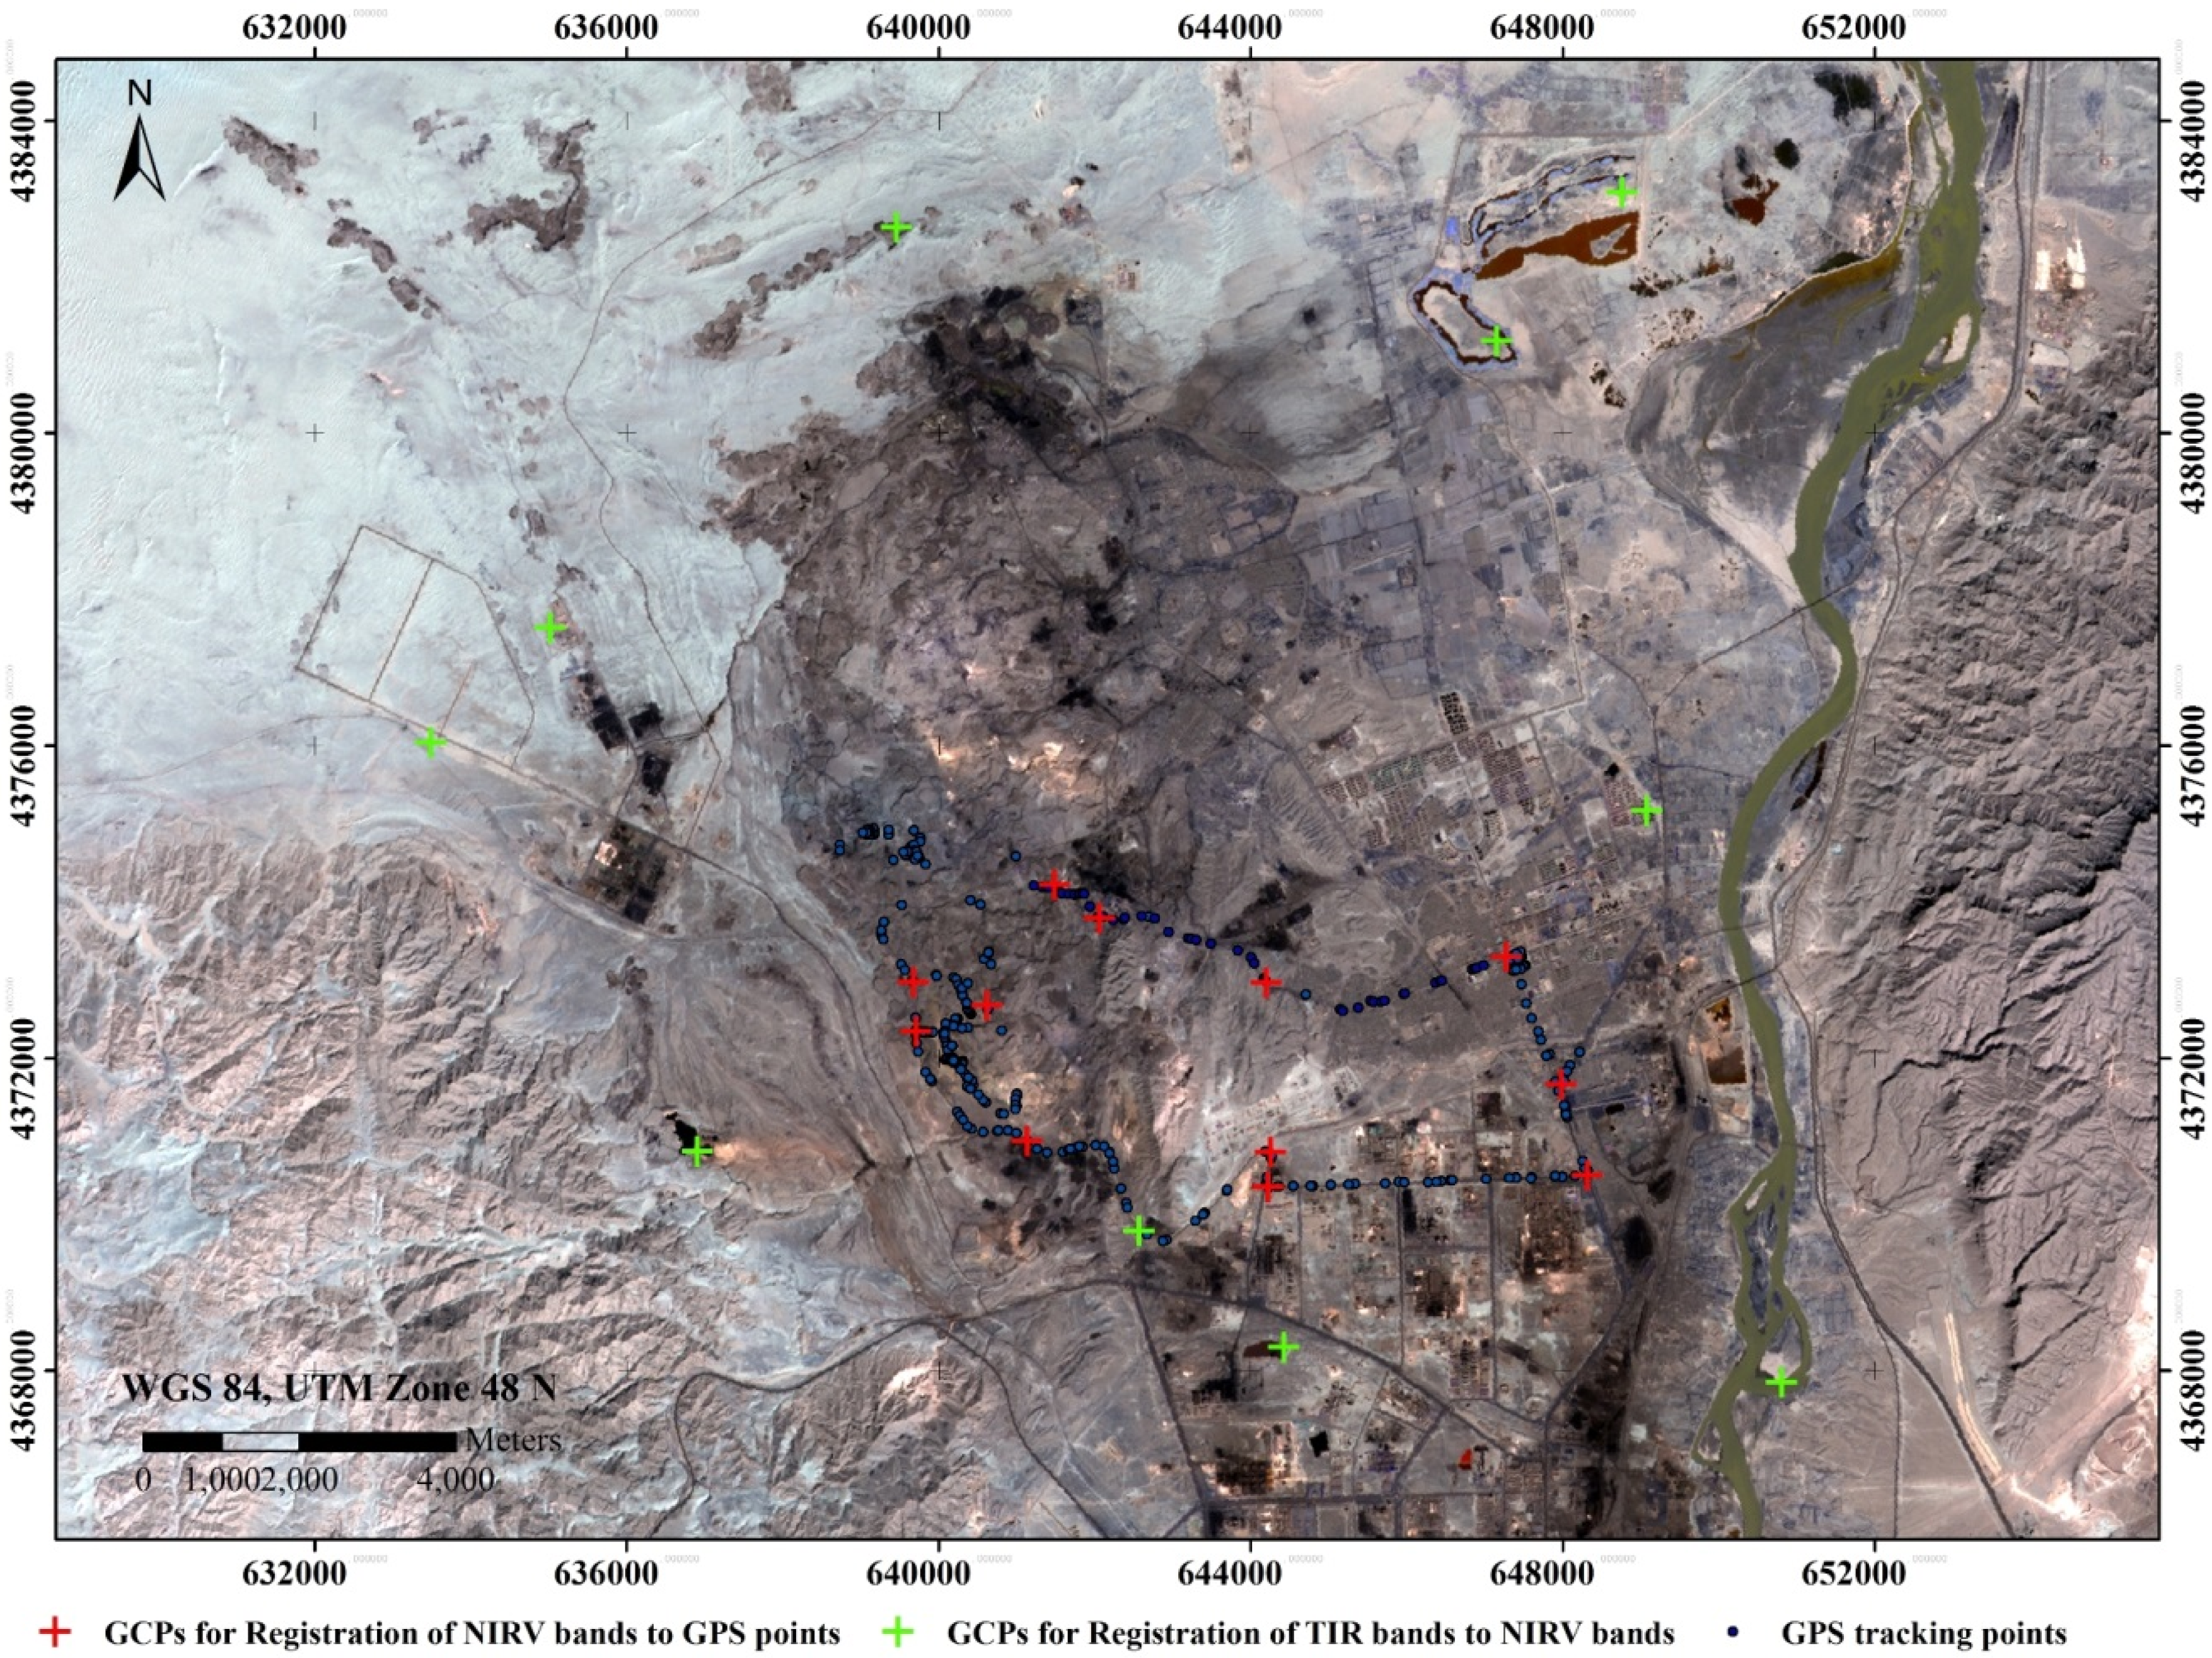
3.1. Geometric Correction

| Sensor | Date and Time of Acquisition (Time is Local Time = UTC + 8) | Day/Night | Error (m) |
|---|---|---|---|
| ASTER | 11:48:38 March 27, 2013 | Day | 14.85 |
| 22:53:17 March 27, 2013 | Night | 64.36 | |
| 11:54:43 June 22, 2013 | Day | -- 1 | |
| 22:59:22 June 22, 2013 | Night | 23.92 |
| Sensor | Date and Time of Acquisition (time is local time = UTC +8) | Day/Night | Error (m) |
|---|---|---|---|
| ASTER | 11:48:38 27 March 2013 | Day | 29.21 |
| 11:54:43 22 June 2013 | Day | 33.37 |
3.2. Coal Fire Detection

3.3. Experiment Design and Validation Strategy

4. Results and Discussion
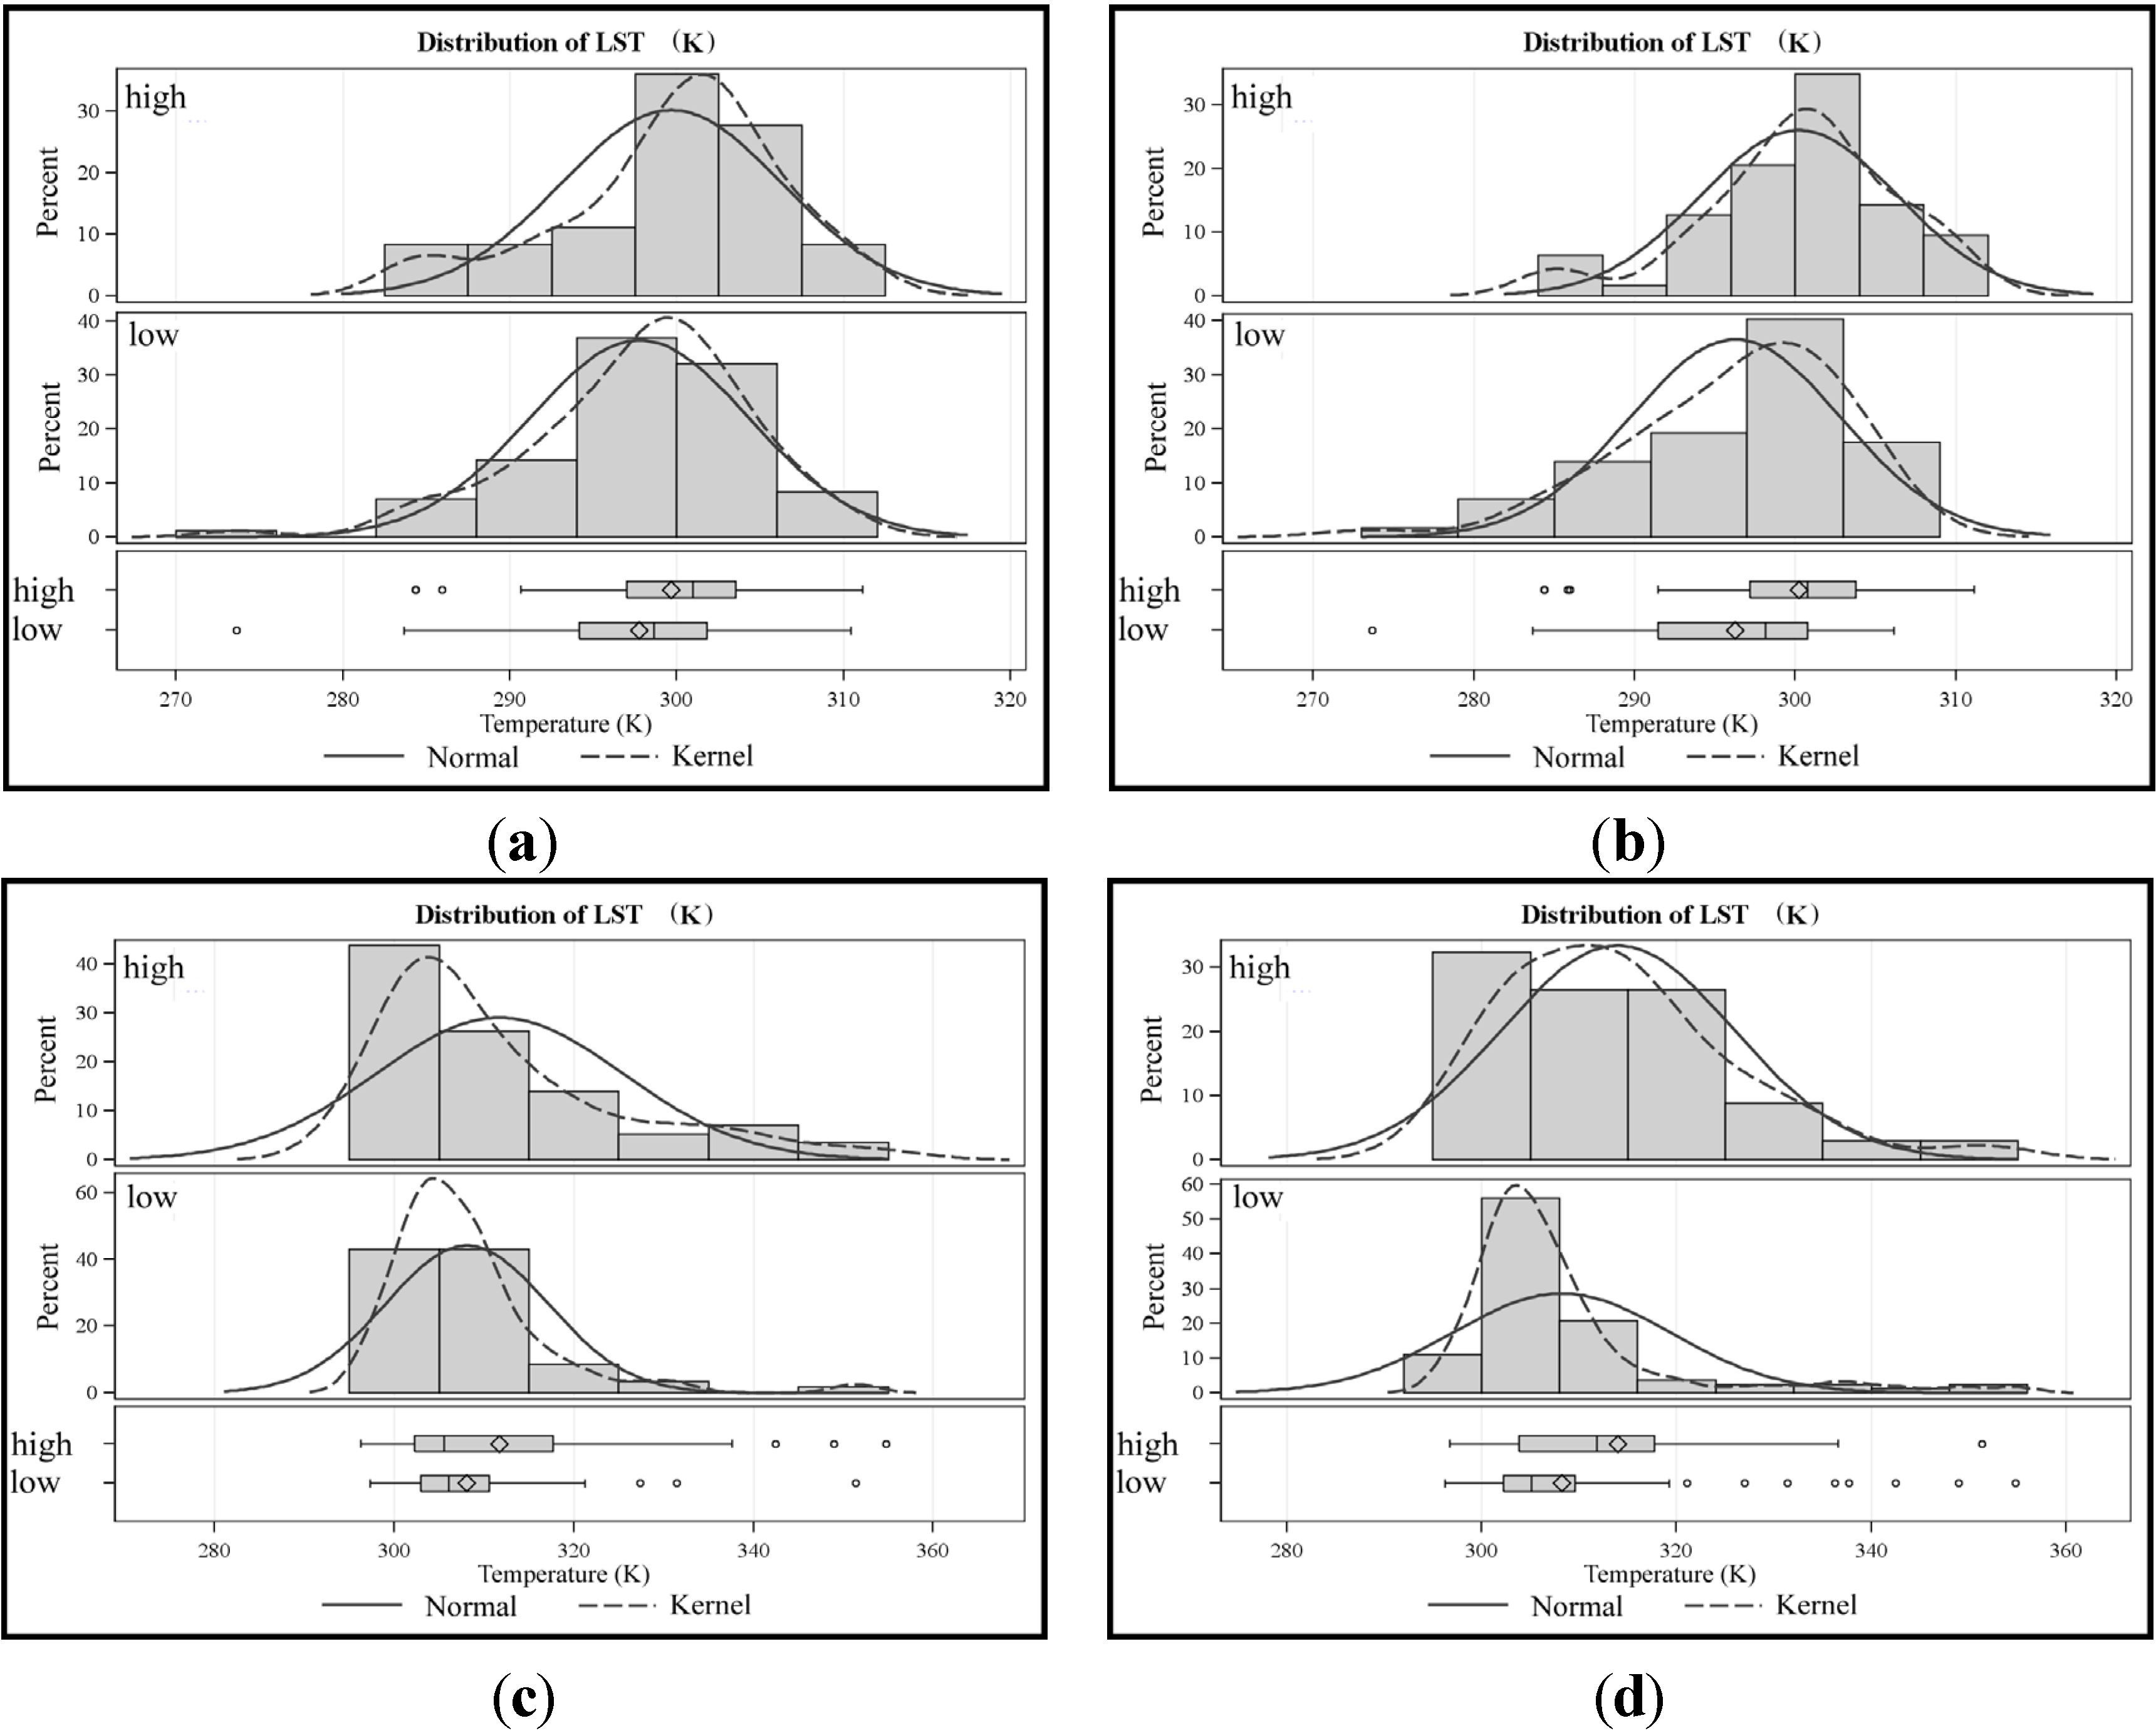
4.1. Hypothesis Test Result

| Season | Day/Night | Area | N | Mean | Std Dev | 95% CI | t-test Results | ||
|---|---|---|---|---|---|---|---|---|---|
| DF | t Value | Pr > |t| | |||||||
| Spring (27 March 2013) | Day | high | 36 | 299.7 | 6.5983 | (297.4, 301.9) | 118 | 1.47 | 0.144 |
| low | 84 | 297.8 | 6.555 | (296.3, 299.2) | |||||
| Night | high | 63 | 300.2 | 6.1205 | (308.1, 315.3) | 118 | 3.41 | 0.0009 | |
| low | 57 | 296.3 | 6.5394 | (305.7, 310.4) | |||||
| Summer (22 June 2013) | Day | high | 57 | 311.7 | 13.7217 | (308.1, 315.3) | 113 | 1.68 | 0.0964 |
| low | 58 | 308.1 | 9.0240 | (305.7, 310.4) | |||||
| Night | high | 34 | 313.9 | 11.9453 | (309.8, 318.1) | 114 | 2.48 | 0.0146 | |
| low | 82 | 308.2 | 11.1441 | (305.7, 310.6) | |||||

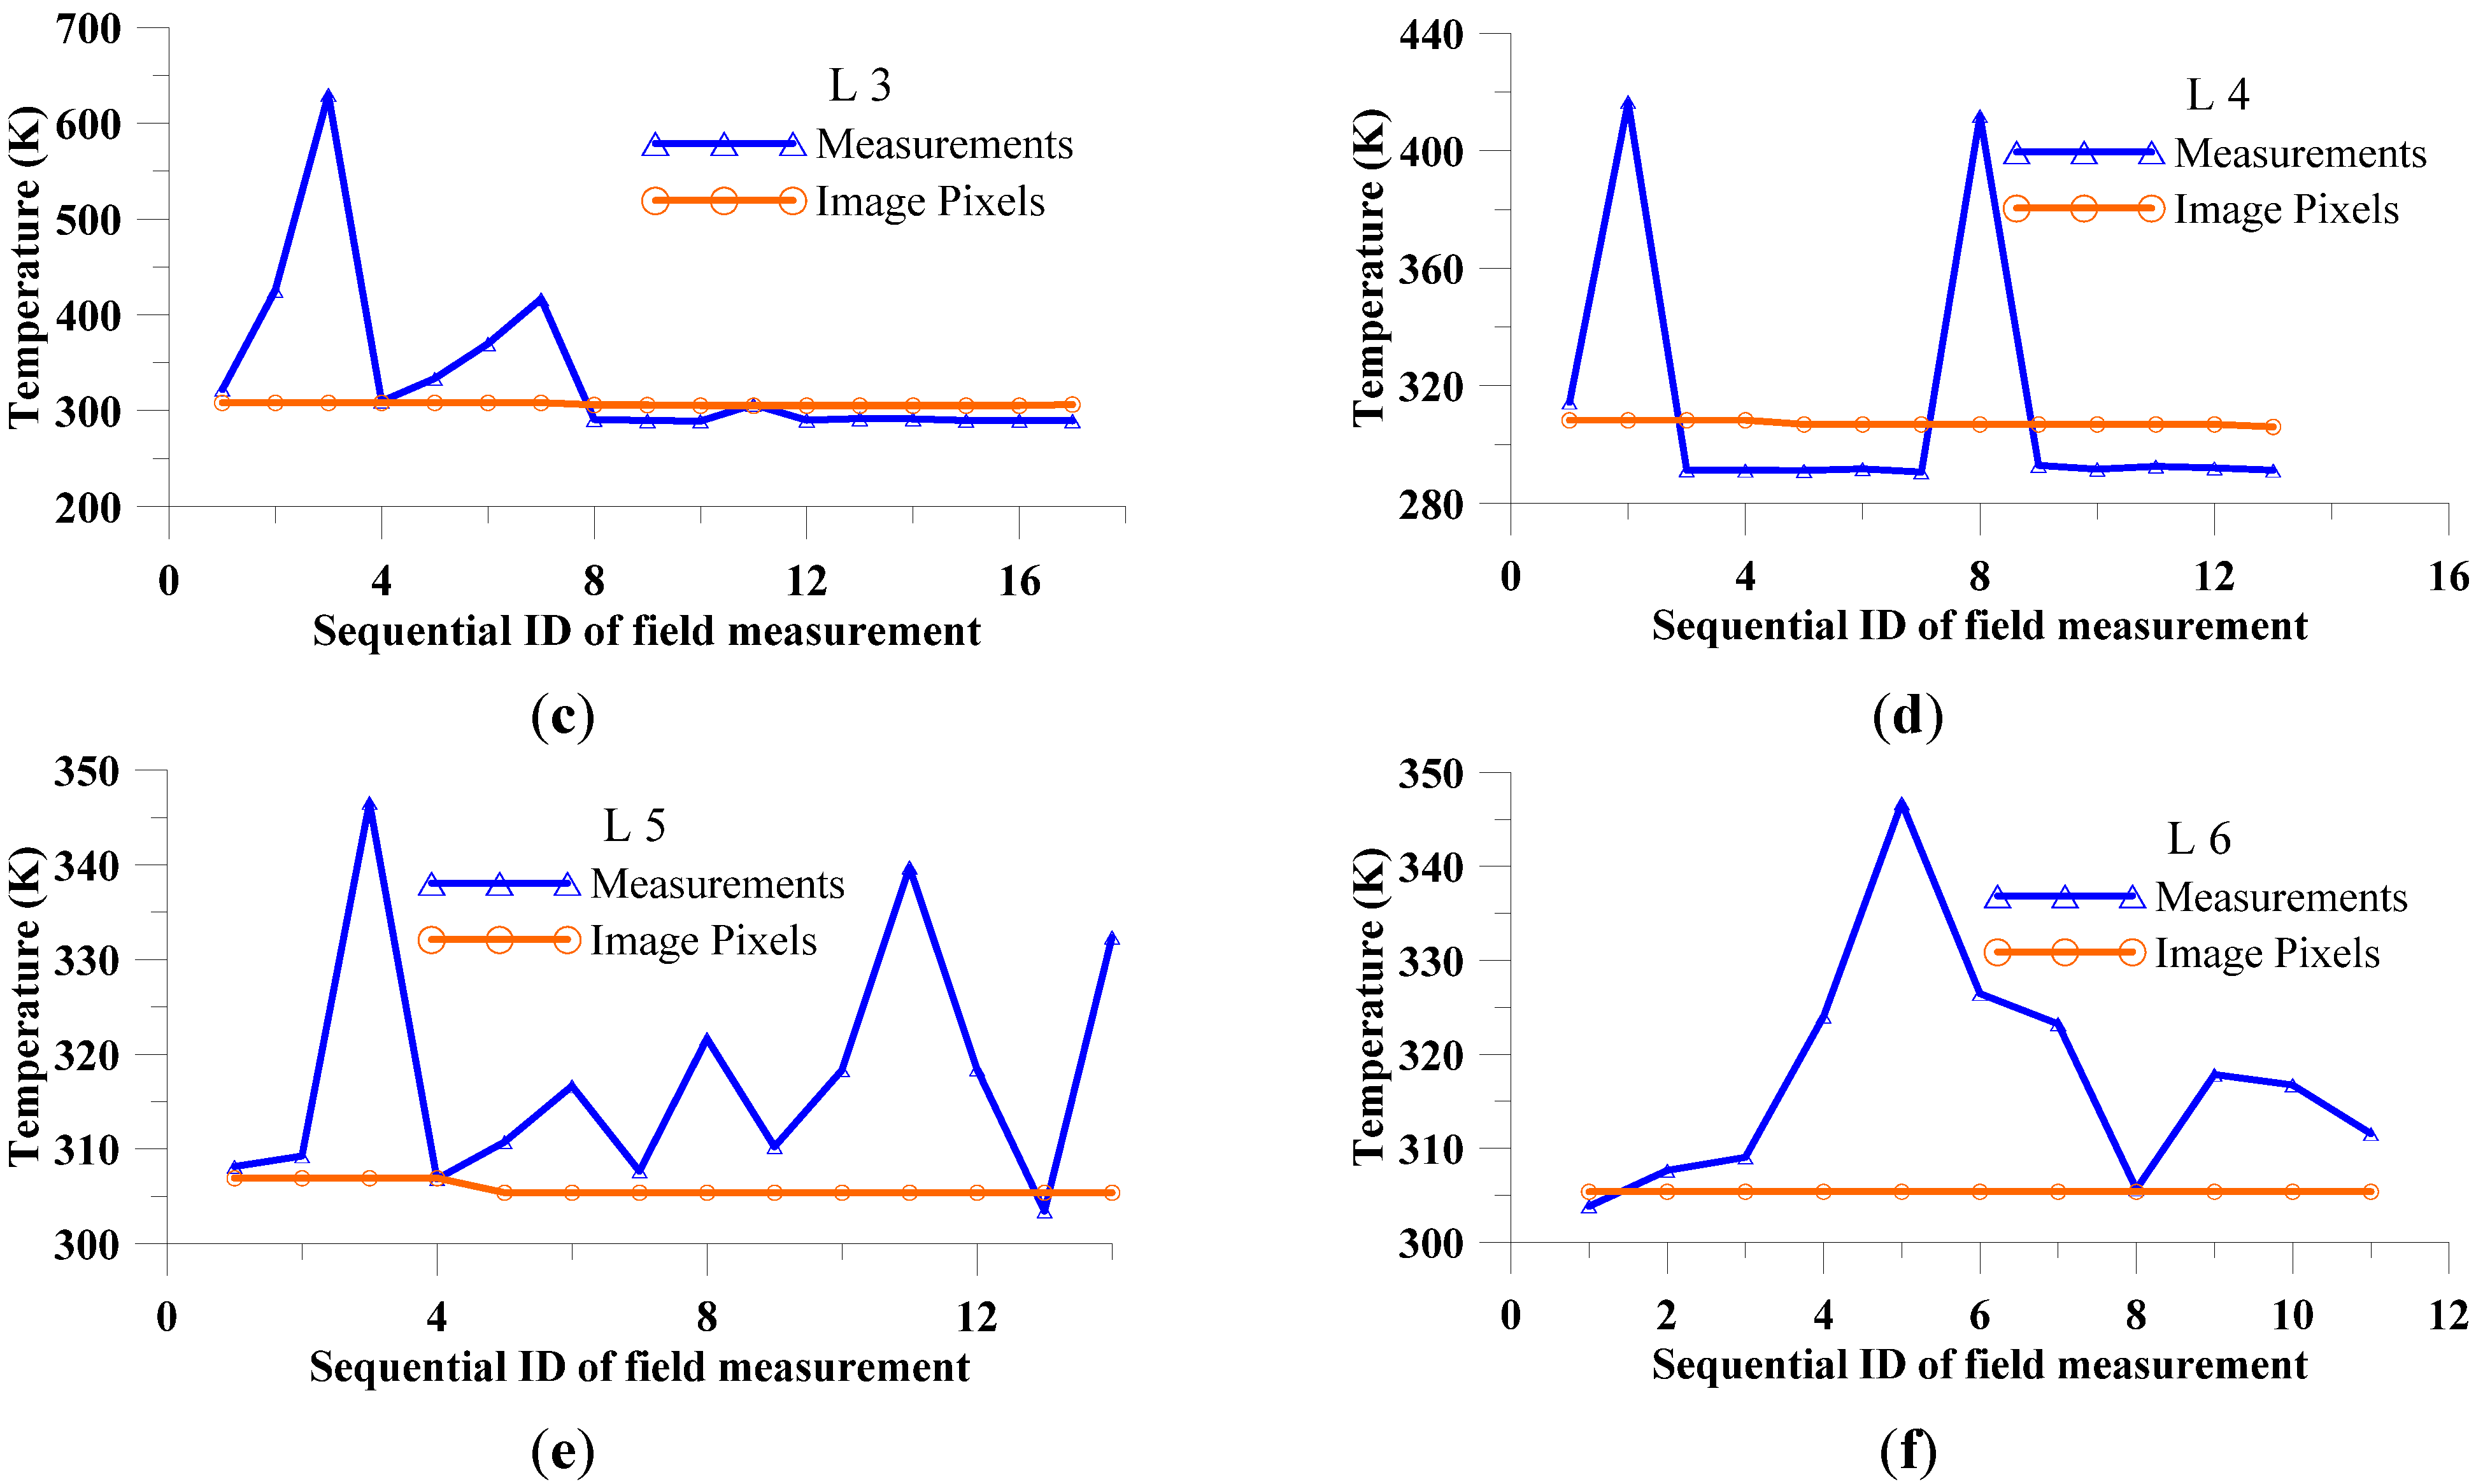
4.2. Comparisons Along Transects


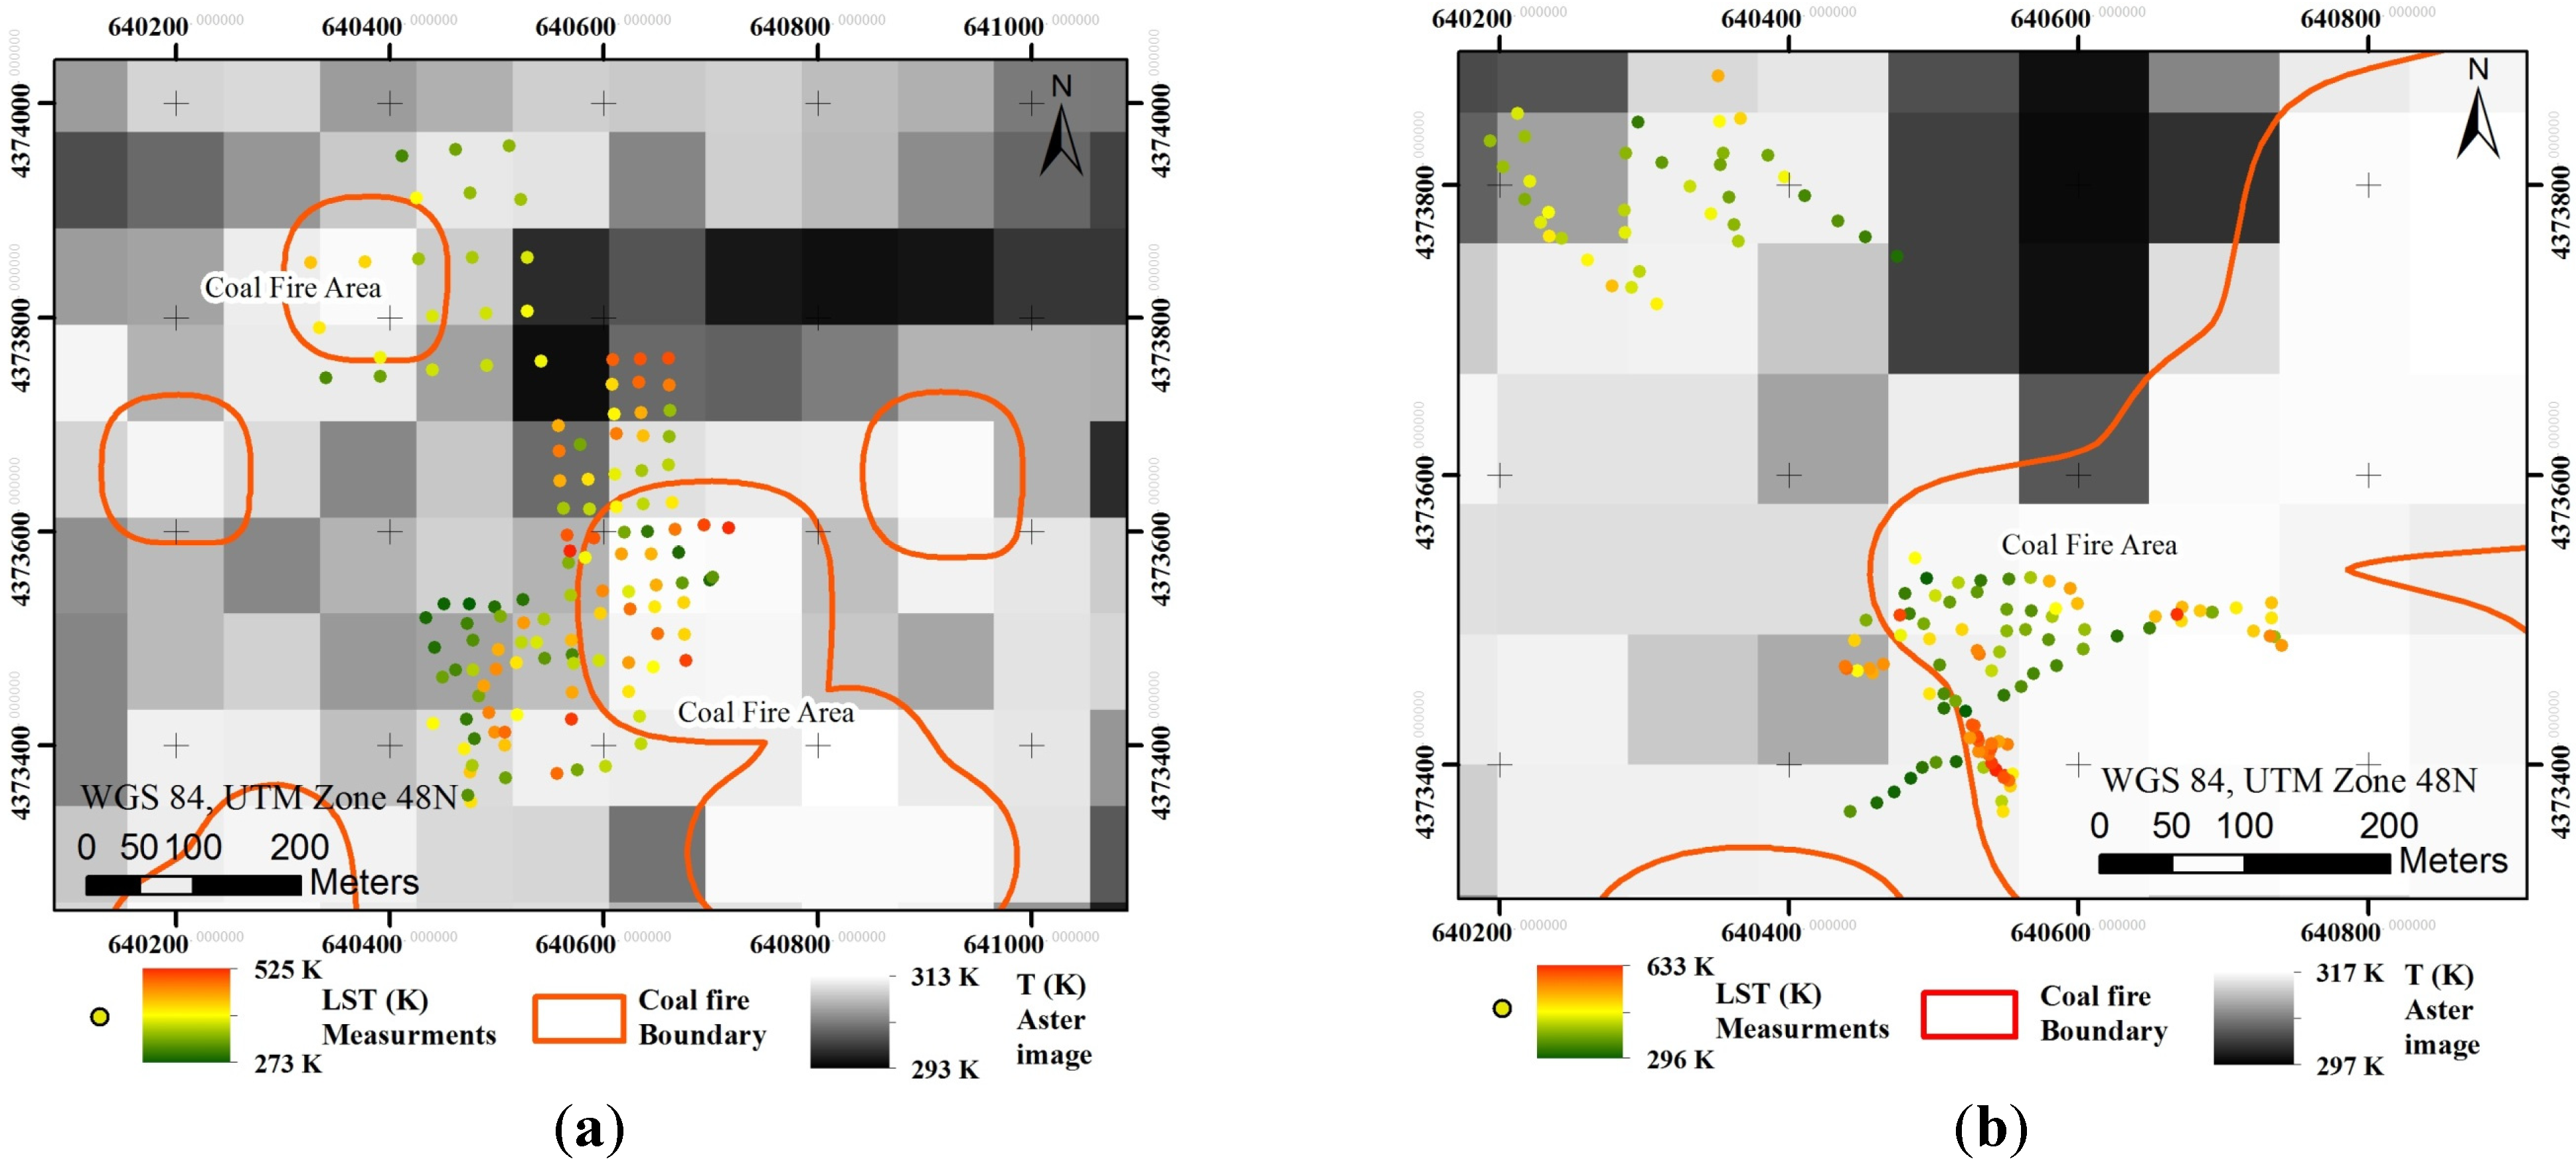
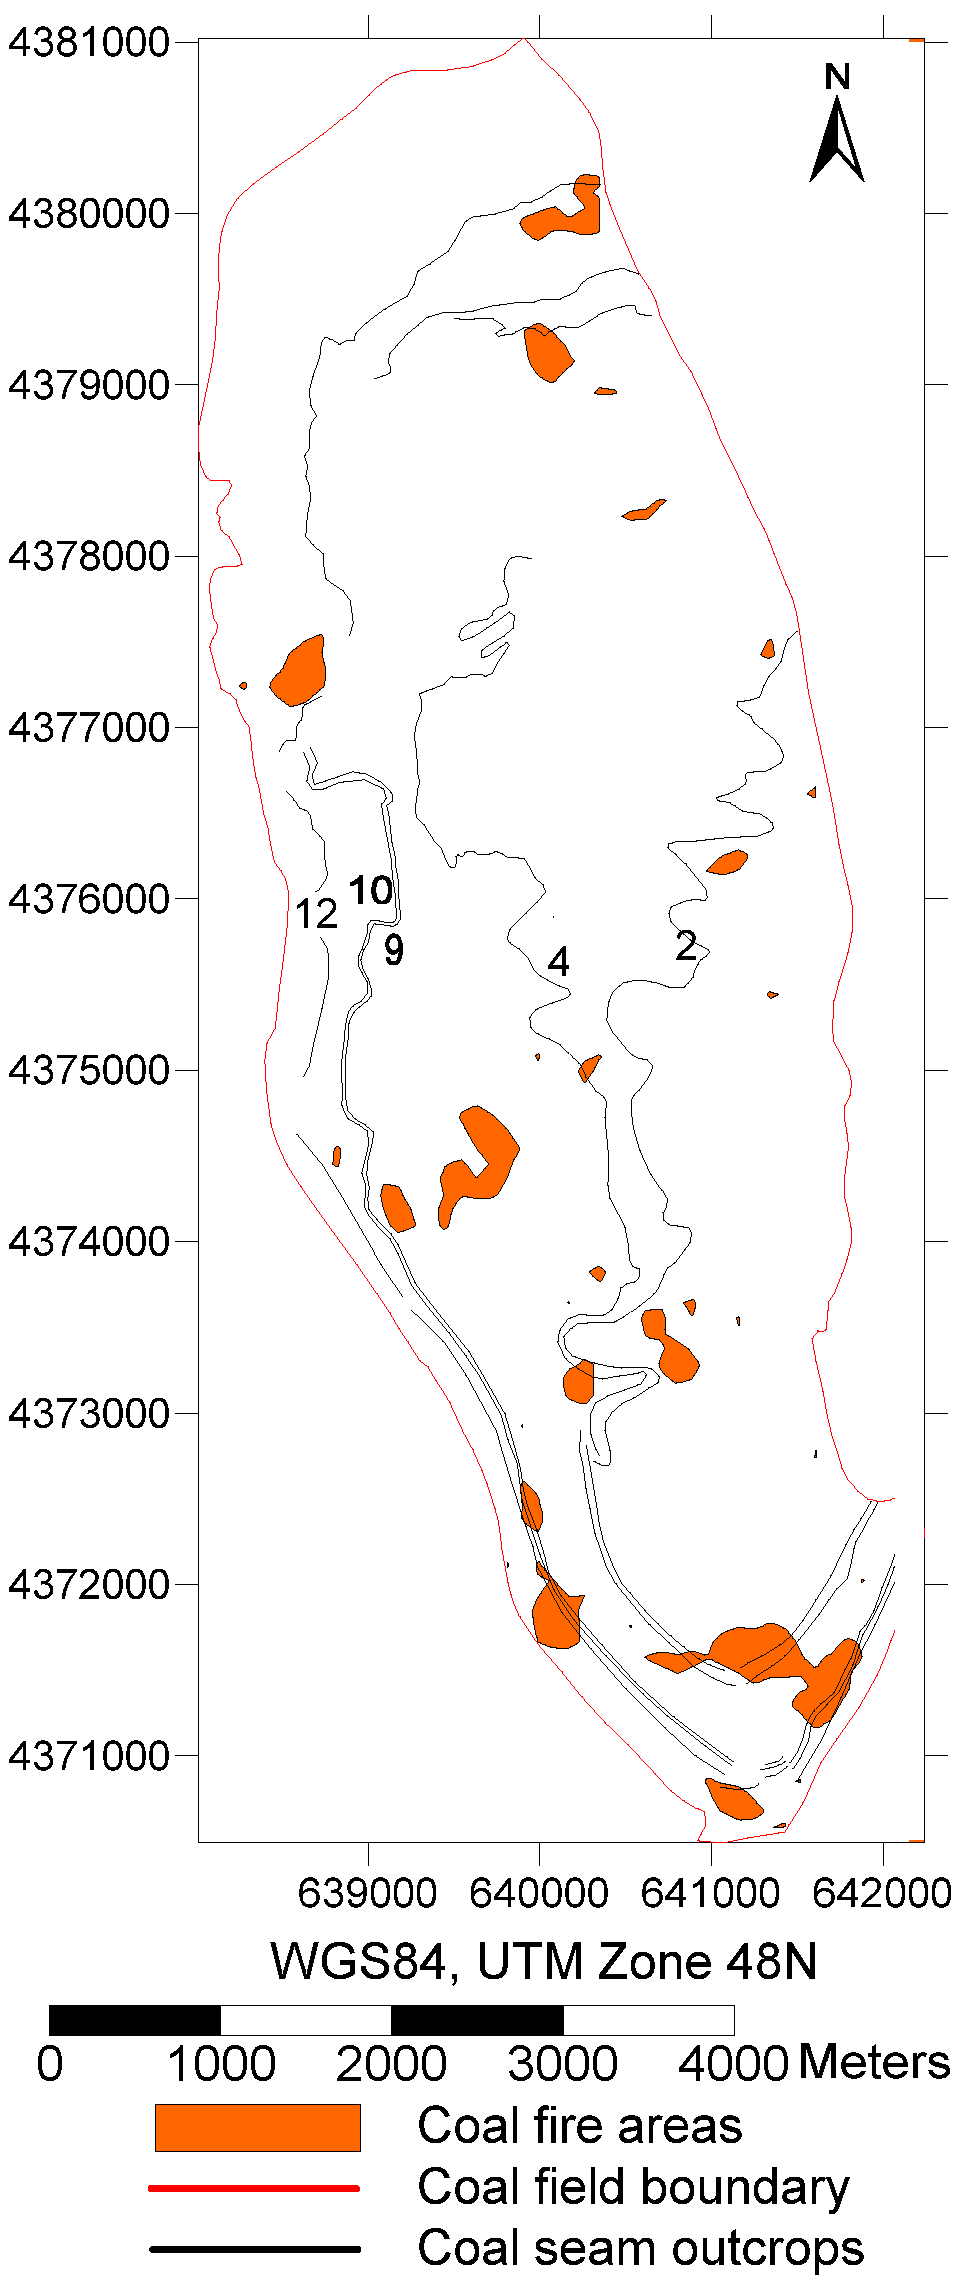
4.3. Comparisons between Measured Fire Spots and Coal Fire Areas


4.4. Comparisons between Optical Images and Coal Fire Areas


4.5. Comparison between Interpolated High-Resolution Thermal Images and Coal Fire Areas Retrieved from ASTER

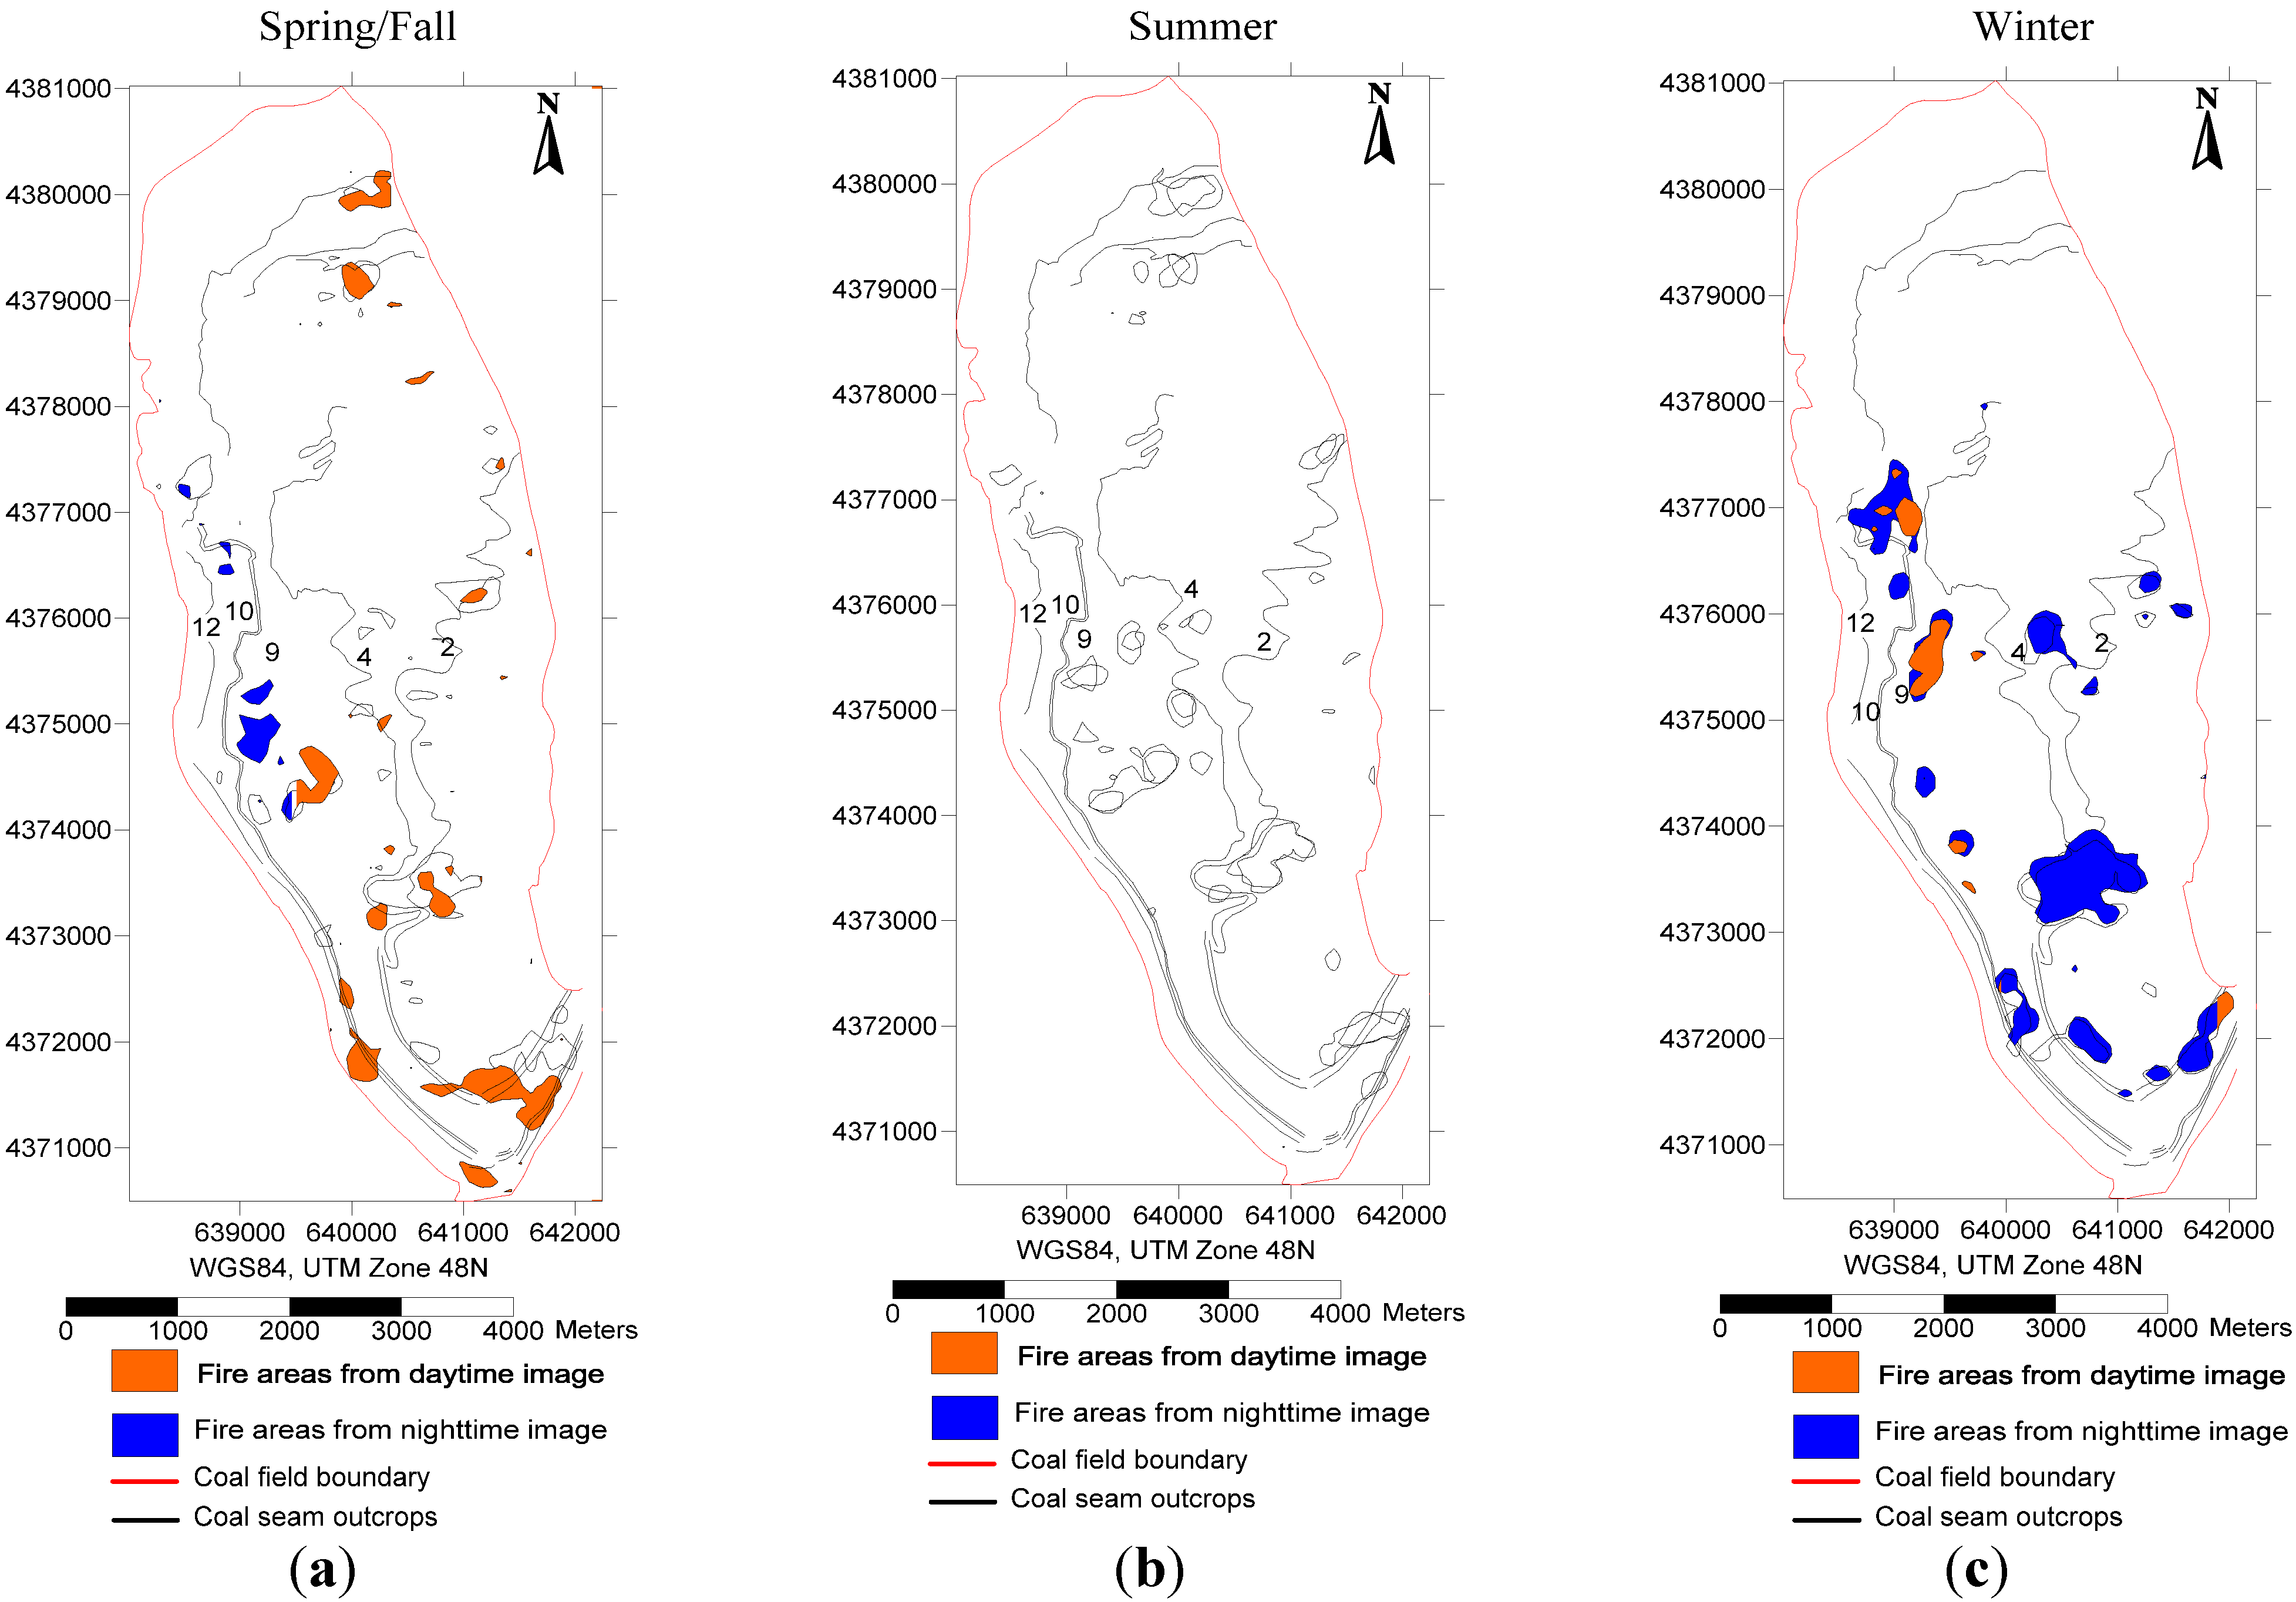
4.6. Comparison between Coal Fires Retrieved from Images Acquired During Daytime, Nighttime and in Different Seasons

4.7. Comparison with Other Non-Interactive and in-situ Based Methods

4.7. Uncertainty and Accuracy
5. Conclusions and Vision
- (1)
- Extremely high gradient lines delineated by SAGBT generally agreed with coal fire boundaries in the field.
- (2)
- A hypothesis test supported our prediction that coal fire boundaries can be used to segment the study site into a high-temperature coal fire area and a cold background, especially when coal fires from nighttime TIR images are used.
- (3)
- About 70%–85% of observed coal fire sites matched coal fire areas from SAGBT. The average distance between fire sites and the nearest retrieved fire boundary (32.44 m) was less than half the pixel dimension (45 m). Approximately 15% of the observed fire spots were not identified by SAGBT.
- (4)
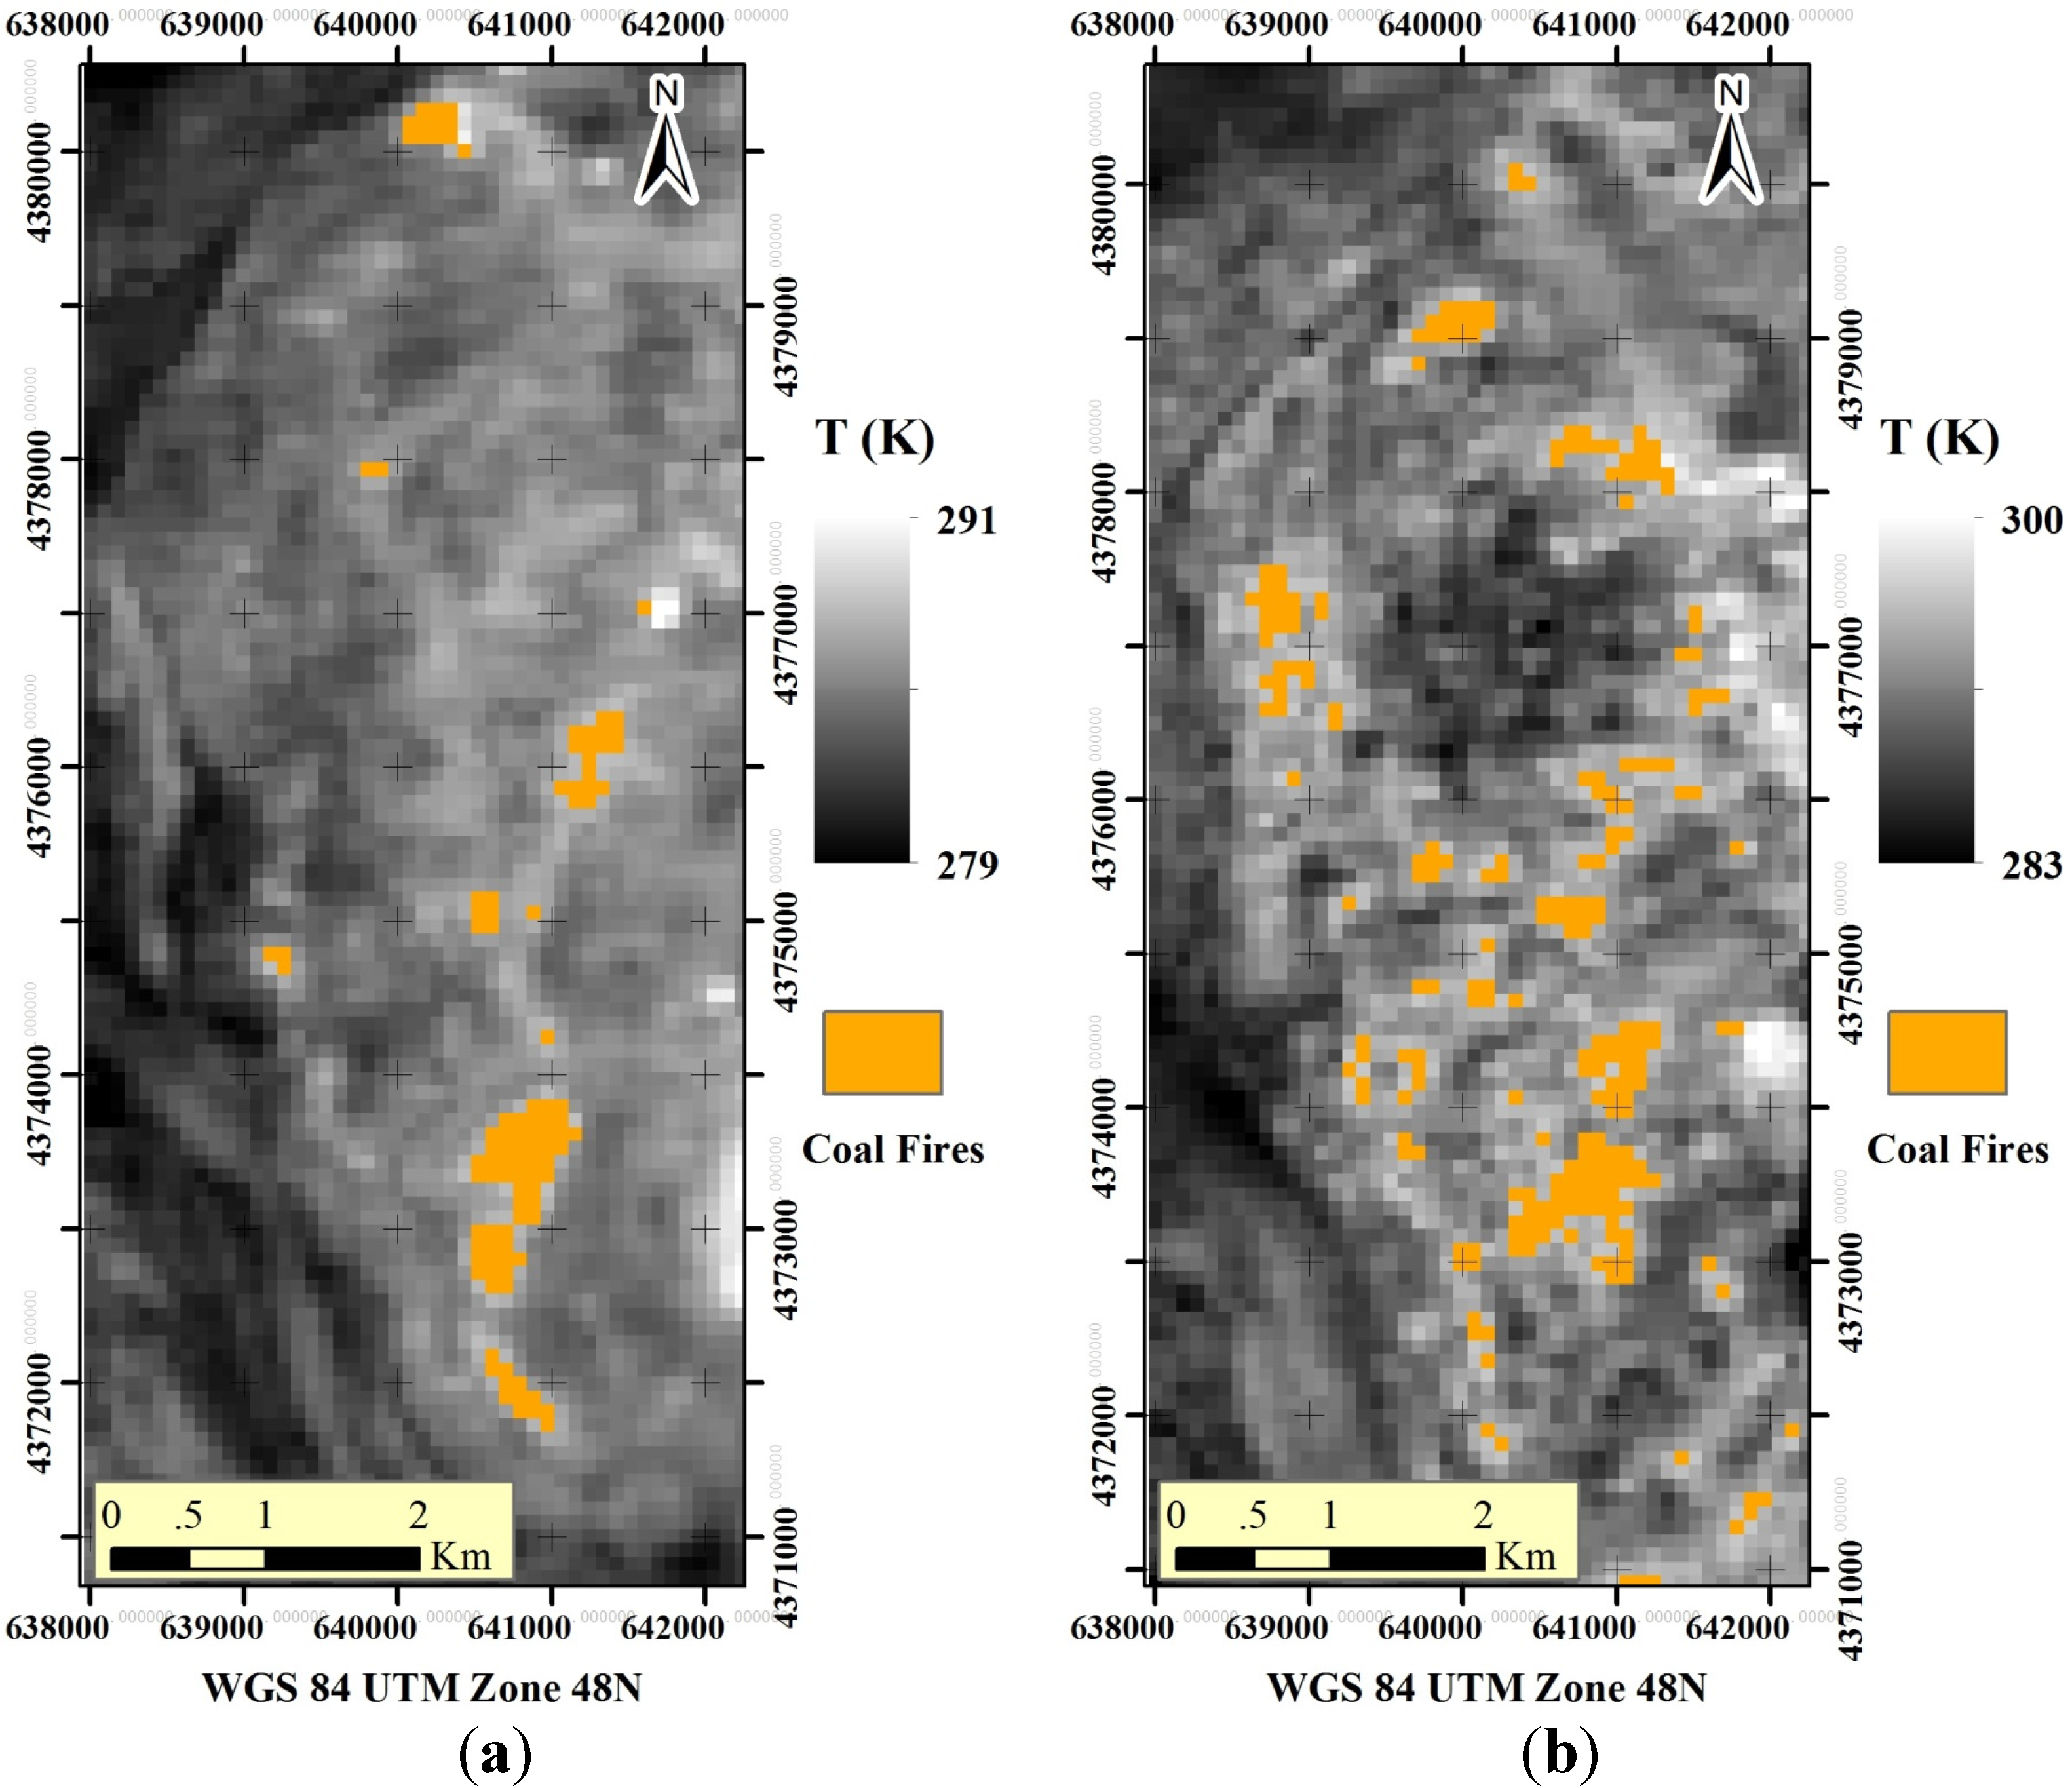
- Coal fire areas from SAGBT match high-temperature pixels in the ASTER image, and the areas include the major extreme high-temperature regions derived from field samples.
- (5)
- Similar spatial distribution in coal fire areas was observed for daytime and nighttime images, although differences in shape and size of areas occurred. Differences in area between daytime and nighttime acquisitions in spring were observed to be more dramatic than in the summer.
Acknowledgments
Author Contributions
Conflicts of Interests
References
- Gangopadhyay, P.K.; Maathuis, B.; Van Dijk, P. ASTER-derived emissivity and coal-fire related surface temperature anomaly: A case study in Wuda, North China. Int. J. Remote Sens. 2005, 26, 5555–5571. [Google Scholar] [CrossRef]
- Guney, M. Oxidation and spontaneous combustion of coal: Review of individual factors. Colliery Guard. 1968, 216, 105–110. [Google Scholar]
- Cao, D.; Fan, X.; Guan, H.; Wu, C.; Shi, X.; Jia, Y. Geological models of spontaneous combustion in the Wuda coalfield, Inner Mongolia, China. Rev. Eng. Geol. 2007, 18, 23–30. [Google Scholar]
- Zhang, J.; Kuenzer, C. Thermal surface characteristics of coal fires 1 results of in-situ measurements. J. Appl. Geophys. 2007, 63, 117–134. [Google Scholar] [CrossRef]
- Yan, G.; Mas, J.F.; Maathuis, B.; Xiangmin, Z.; Van Dijk, P. Comparison of pixel-based and object-oriented image classification approaches—A case study in a coal fire area, Wuda, Inner Mongolia, China. Int. J. Remote Sens. 2006, 27, 4039–4055. [Google Scholar] [CrossRef]
- Gautam, R.S.; Singh, D.; Mittal, A.; Sajin, P. Application of SVM on satellite images to detect hotspots in Jharia coal field region of India. Adv. Space Res. 2008, 41, 1784–1792. [Google Scholar] [CrossRef]
- Zhang, X.; Van Genderen, J.; Kroonenberg, S. A method to evaluate the capability of Landsat-5 TM band 6 data for sub-pixel coal fire detection. Int. J. Remote Sens. 1997, 18, 3279–3288. [Google Scholar]
- Du, X.; Cao, D.; Bernardes, S.; Jordan, J.; Yang, G.; Li, Z. Self-Adaptive gradient based thresholding method for coal fire detection using ASTER thermal infrared data, Part I: Methodology. Remote Sens. 2015. Submitted. [Google Scholar]
- Peng, S.; Zhang, J. Coal Bearing Strata Sedimentary Environment and its Influence in the Wuda Coal Mining Area; Mining Coal Industry Publishing House: Beijing, China, 1995. (In Chinese) [Google Scholar]
- Zhang, J. Underground Coal Fires in China: Origin, Detection, Fire-Fighting, and Prevention; China Coal Industry Publishing House: Beijing, China, 2008; pp. 3, 43, 383. (In Chinese) [Google Scholar]
- Gillespie, A.; Rokugawa, S.; Matsunaga, T.; Cothern, J.S.; Hook, S.; Kahle, A.B. A temperature and emissivity separation algorithm for advanced spaceborne thermal emission and reflection radiometer (ASTER) images. IEEE Trans. Geosci. Remote Sens. 1998, 36, 1113–1126. [Google Scholar] [CrossRef]
- Zhang, J. Spatial and Statistical Analysis of Thermal Satellite Imagery for Extraction of Coal Fire Related Anomalies. Ph.D. Thesis, Technical University Vienna, Vienna, Austria, 2004. [Google Scholar]
- Kuenzer, C.; Zhang, J.; Li, J.; Voigt, S.; Mehl, H.; Wagner, W. Detecting unknown coal fires: Synergy of automated coal fire risk area delineation and improved thermal anomaly extraction. Int. J. Remote Sens. 2007, 28, 4561–4585. [Google Scholar] [CrossRef]
- Kuenzer, C.; Zhang, J.; Hirner, A.; Bo, Y.; Jia, Y.; Sun, Y. Multitemporal in-situ mapping of the Wuda coal fires from 2000 to 2005—Assessing coal fire dynamics. In Spontaneous Coal Seam Fires: Mitigating a Global Disaster. ERSEC Ecological Book Series; UNESCO: Beijing, China, 2008; Volume 4, pp. 132–148. [Google Scholar]
- Wessling, S.; Kuenzer, C.; Kessels, W.; Wuttke, M.W. Numerical modeling for analyzing thermal surface anomalies induced by underground coal fires. Int. J. Coal Geol. 2008, 74, 175–184. [Google Scholar] [CrossRef]
- Kuenzer, C.; Hecker, C.; Zhang, J.; Wessling, S.; Wagner, W. The potential of multidiurnal MODIS thermal band data for coal fire detection. Int. J. Remote Sens. 2008, 29, 923–944. [Google Scholar] [CrossRef]
- Hecker, C.; Kuenzer, C.; Zhang, J. Remote-sensing—Based coal-fire detection with low-resolution MODIS data. Rev. Eng. Geol. 2007, 18, 229–238. [Google Scholar]
- Kuenzer, C.; Zhang, J.; Sun, Y.; Jia, Y.; Dech, S. Coal fires revisited: The Wuda coal field in the aftermath of extensive coal fire research and accelerating extinguishing activities. Int. J. Remote Sens. 2012, 102, 75–86. [Google Scholar]
- Chatterjee, R. Coal fire mapping from satellite thermal IR data—A case example in Jharia coalfield, Jharkhand, India. ISPRS J. Photogram. Remote Sens. 2006, 60, 113–128. [Google Scholar] [CrossRef]
- Du, X.; Cao, D.; Yang, G.; Bernardes, S.; Li, S.; Li, F. Estimating Typical Four-Season Thermal Distribution and Self-Adaptive Gradient Based Thresholding Parameters over Coal Fire Areas in China Using Aster and Ldcm Tirs-A Case Study in the Wuda Coal Field, China. In Proceedings of the ASPRS 2014, Louisville, USA, 26 March 2014.
- Kuenzer, C.; Guo, H.; Ottinger, M.; Zhang, J.; Dech, S. Spaceborne thermal infrared observation—An overview of most frequently used sensors for applied research. In Thermal Infrared Remote Sensing; Springer Science + Business Media: Dordrecht, Netherlands, 2013; pp. 131–148. [Google Scholar]
© 2015 by the authors; licensee MDPI, Basel, Switzerland. This article is an open access article distributed under the terms and conditions of the Creative Commons Attribution license (http://creativecommons.org/licenses/by/4.0/).
Share and Cite
Du, X.; Bernardes, S.; Cao, D.; Jordan, T.R.; Yan, Z.; Yang, G.; Li, Z. Self-Adaptive Gradient-Based Thresholding Method for Coal Fire Detection Based on ASTER Data—Part 2, Validation and Sensitivity Analysis. Remote Sens. 2015, 7, 2602-2626. https://doi.org/10.3390/rs70302602
Du X, Bernardes S, Cao D, Jordan TR, Yan Z, Yang G, Li Z. Self-Adaptive Gradient-Based Thresholding Method for Coal Fire Detection Based on ASTER Data—Part 2, Validation and Sensitivity Analysis. Remote Sensing. 2015; 7(3):2602-2626. https://doi.org/10.3390/rs70302602
Chicago/Turabian StyleDu, Xiaomin, Sergio Bernardes, Daiyong Cao, Thomas R. Jordan, Zhen Yan, Guang Yang, and Zhipeng Li. 2015. "Self-Adaptive Gradient-Based Thresholding Method for Coal Fire Detection Based on ASTER Data—Part 2, Validation and Sensitivity Analysis" Remote Sensing 7, no. 3: 2602-2626. https://doi.org/10.3390/rs70302602
APA StyleDu, X., Bernardes, S., Cao, D., Jordan, T. R., Yan, Z., Yang, G., & Li, Z. (2015). Self-Adaptive Gradient-Based Thresholding Method for Coal Fire Detection Based on ASTER Data—Part 2, Validation and Sensitivity Analysis. Remote Sensing, 7(3), 2602-2626. https://doi.org/10.3390/rs70302602