
Rice Fields Mapping in Fragmented Area Using Multi-Temporal HJ-1A/B CCD Images

 , , ,
, , ,
Abstract
:
1. Introduction
2. Data and Methods
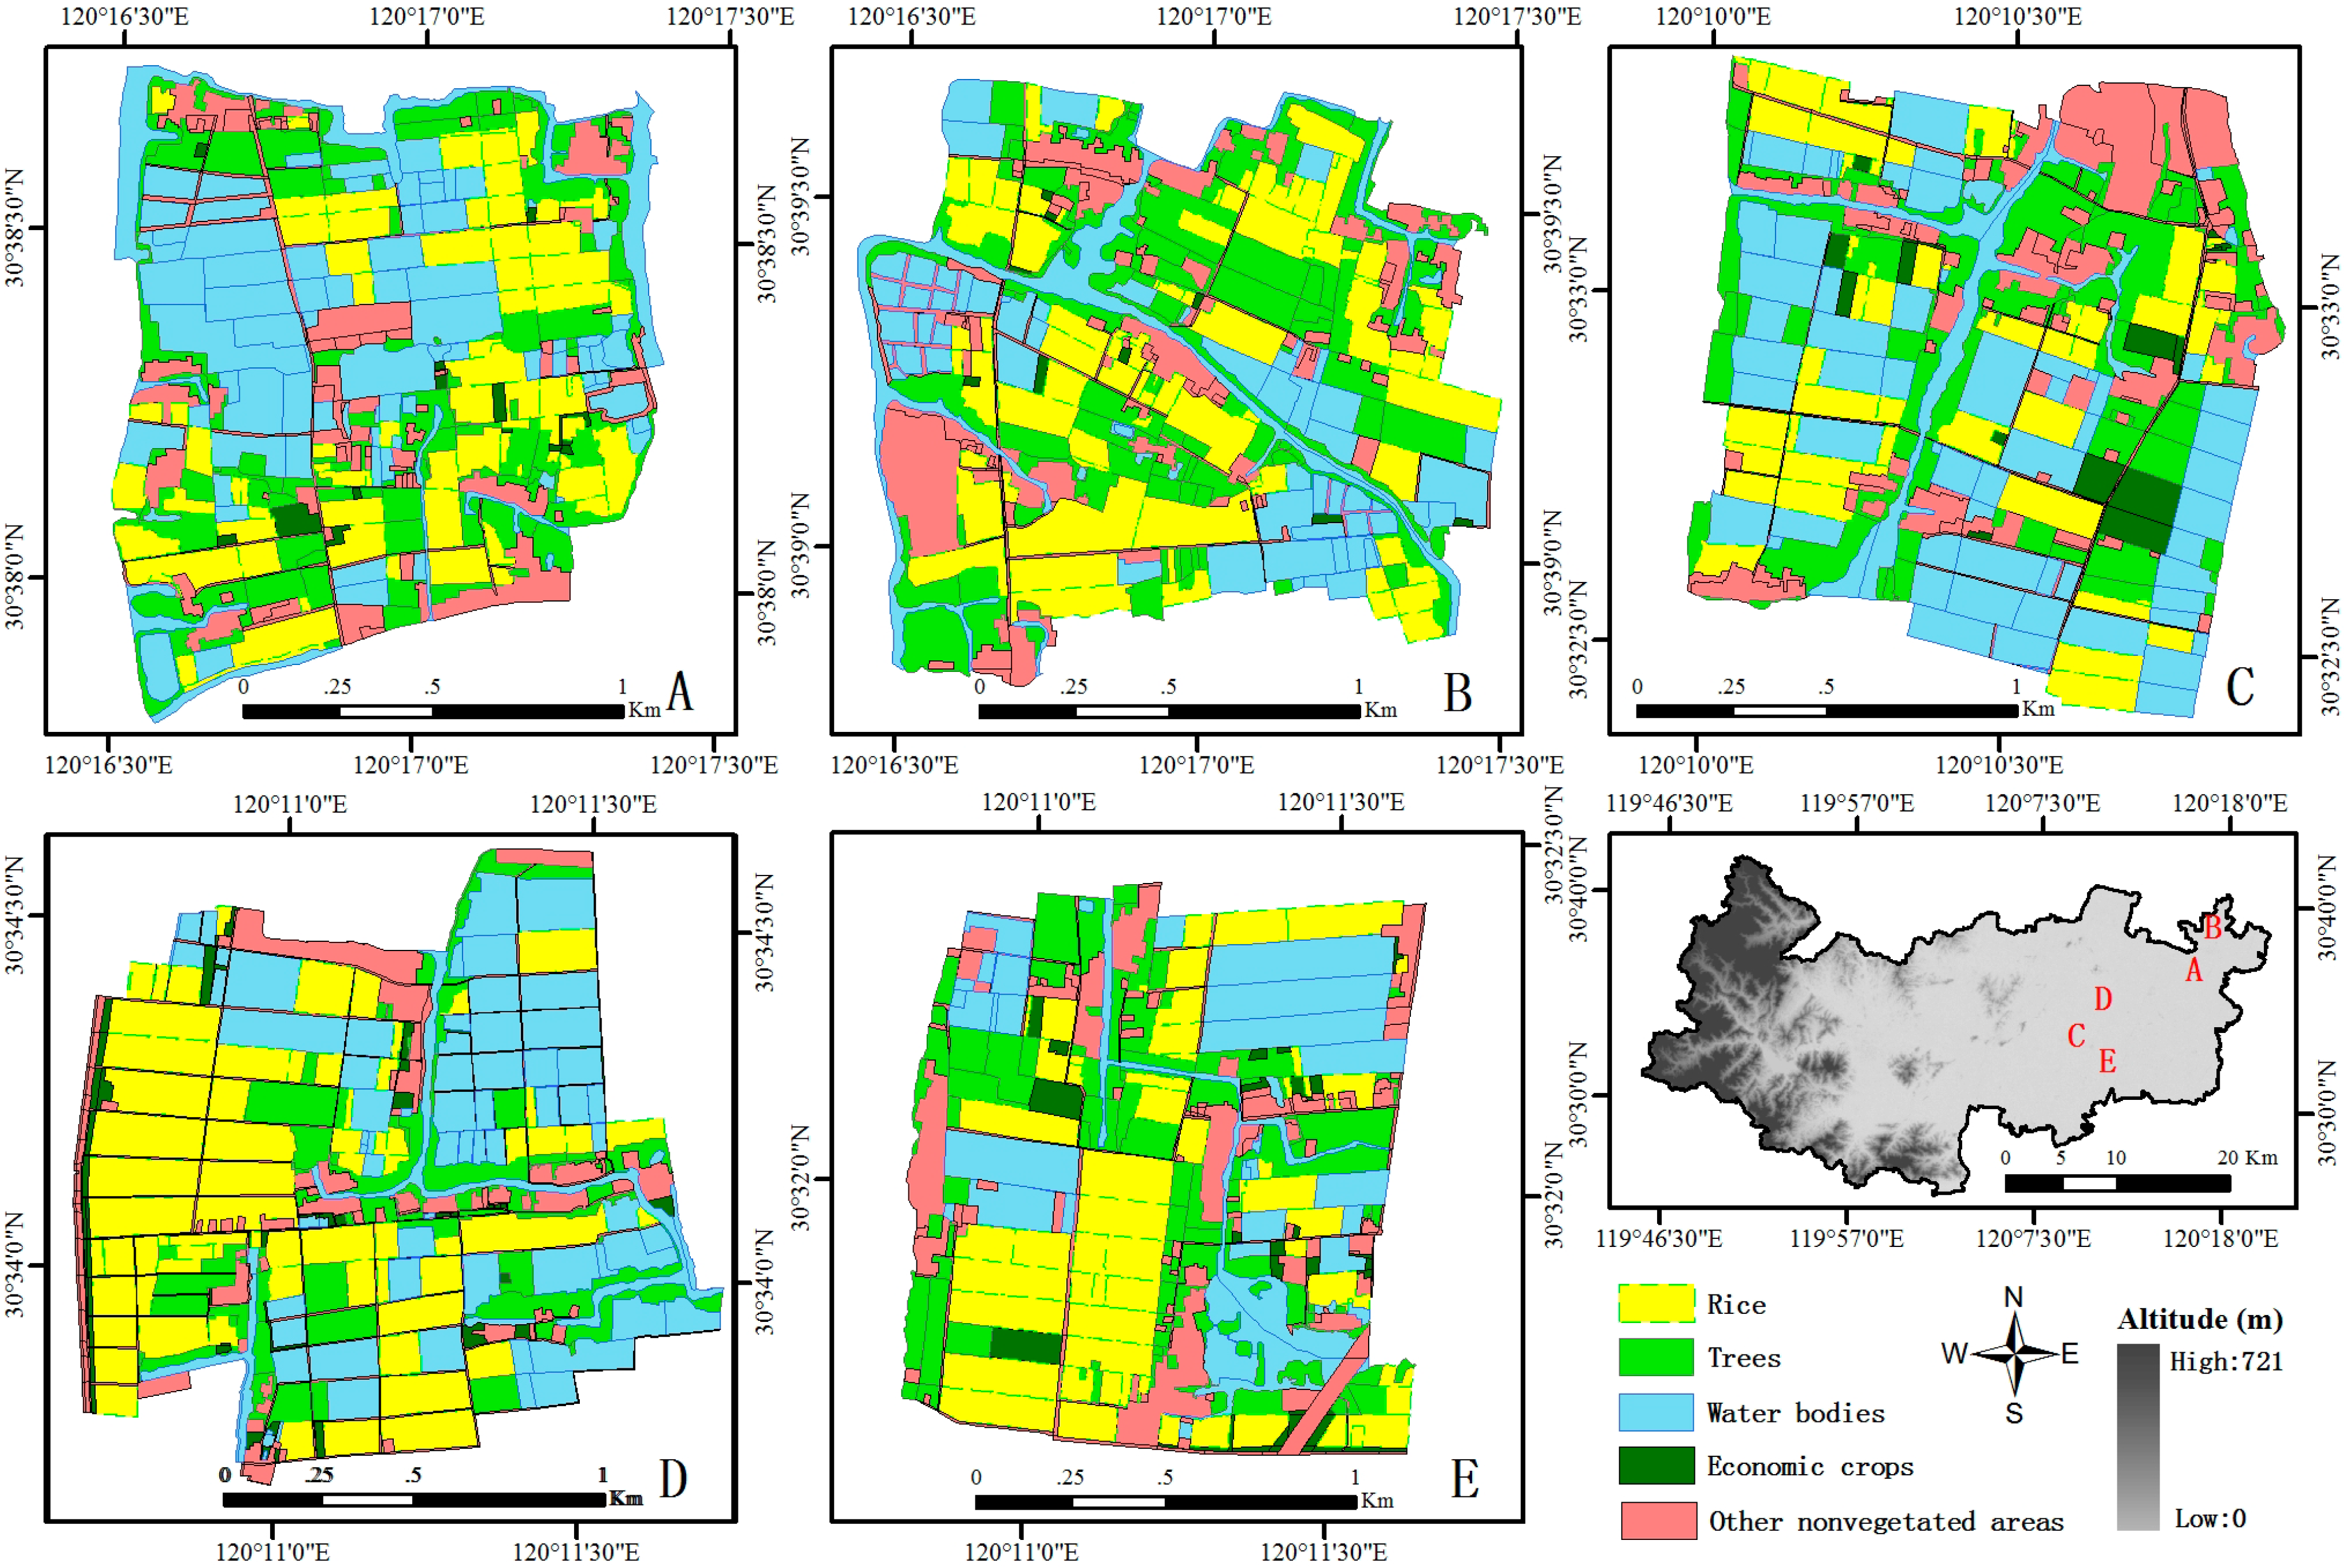
2.1. Study Area

2.2. Field Campaigns

2.3. Remote Sensing Data

| Satellite | Payload | Band No. | Spectral Range (µm) | Nadir Spatial Resolution (m) | Swath Width (km) | Repetition Cycle (day) |
|---|---|---|---|---|---|---|
| HJ-1A/B | Multispectral CCD camera | 1 | 0.43–0.52 | 30 | 360 (700 for two) | 4 |
| 2 | 0.52–0.60 | 30 | ||||
| 3 | 0.63–0.69 | 30 | ||||
| 4 | 0.76–0.90 | 30 | ||||
| ZY1-02C | P/MS camera | 1 | 0.51–0.85 | 5 | 60 | 3–5 |
| 2 | 0.52–0.59 | 10 | ||||
| 3 | 0.63–0.69 | 10 | ||||
| 4 | 0.77–0.89 | 10 |
| NO. | Satellite | Date | Field Campaign Date | Phenology Stage |
|---|---|---|---|---|
| 1 | HJ-1B | 2012/05/17 | / | Fallow |
| 2 | HJ-1B | 2012/05/28 | / | Site preparation |
| 3 | HJ-1A | 2012/06/29 | 2012/06/29 | Sowing-transplanting |
| 4 | HJ-1B | 2012/07/05 | / | Vegetative stage |
| 5 | HJ-1B | 2012/07/19 | 2012/07/20 | Vegetative stage (tillering) |
| 6 | HJ-1A | 2012/07/29 | 2012/07/30 | Vegetative stage (maximum tiller number) |
| 7 | HJ-1A | 2012/08/17 | 2012/08/15 | Reproductive stage (ear differentiation) |
| 8 | HJ-1B | 2012/09/02 | 2012/08/31 | Reproductive stage (heading) |
| 9 | HJ-1B | 2012/09/18 | 2012/09/16 | Reproductive stage (panicle initiation and flowering) |
| 10 | HJ-1B | 2012/09/29 | 2012/09/25 | Reproductive stage |
| 11 | HJ-1B | 2012/10/10 | 2012/10/13 | Ripening stage (grain filling) |
| 12 | HJ-1A | 2012/10/23 | 2012/10/27 | Ripening stage (milk) |
| 13 | HJ-1B | 2012/11/06 | / | Ripening stage |
| 14 | HJ-1A | 2012/11/19 | 2012/11/18 | Harvest/fallow |

2.4. Classification Methods
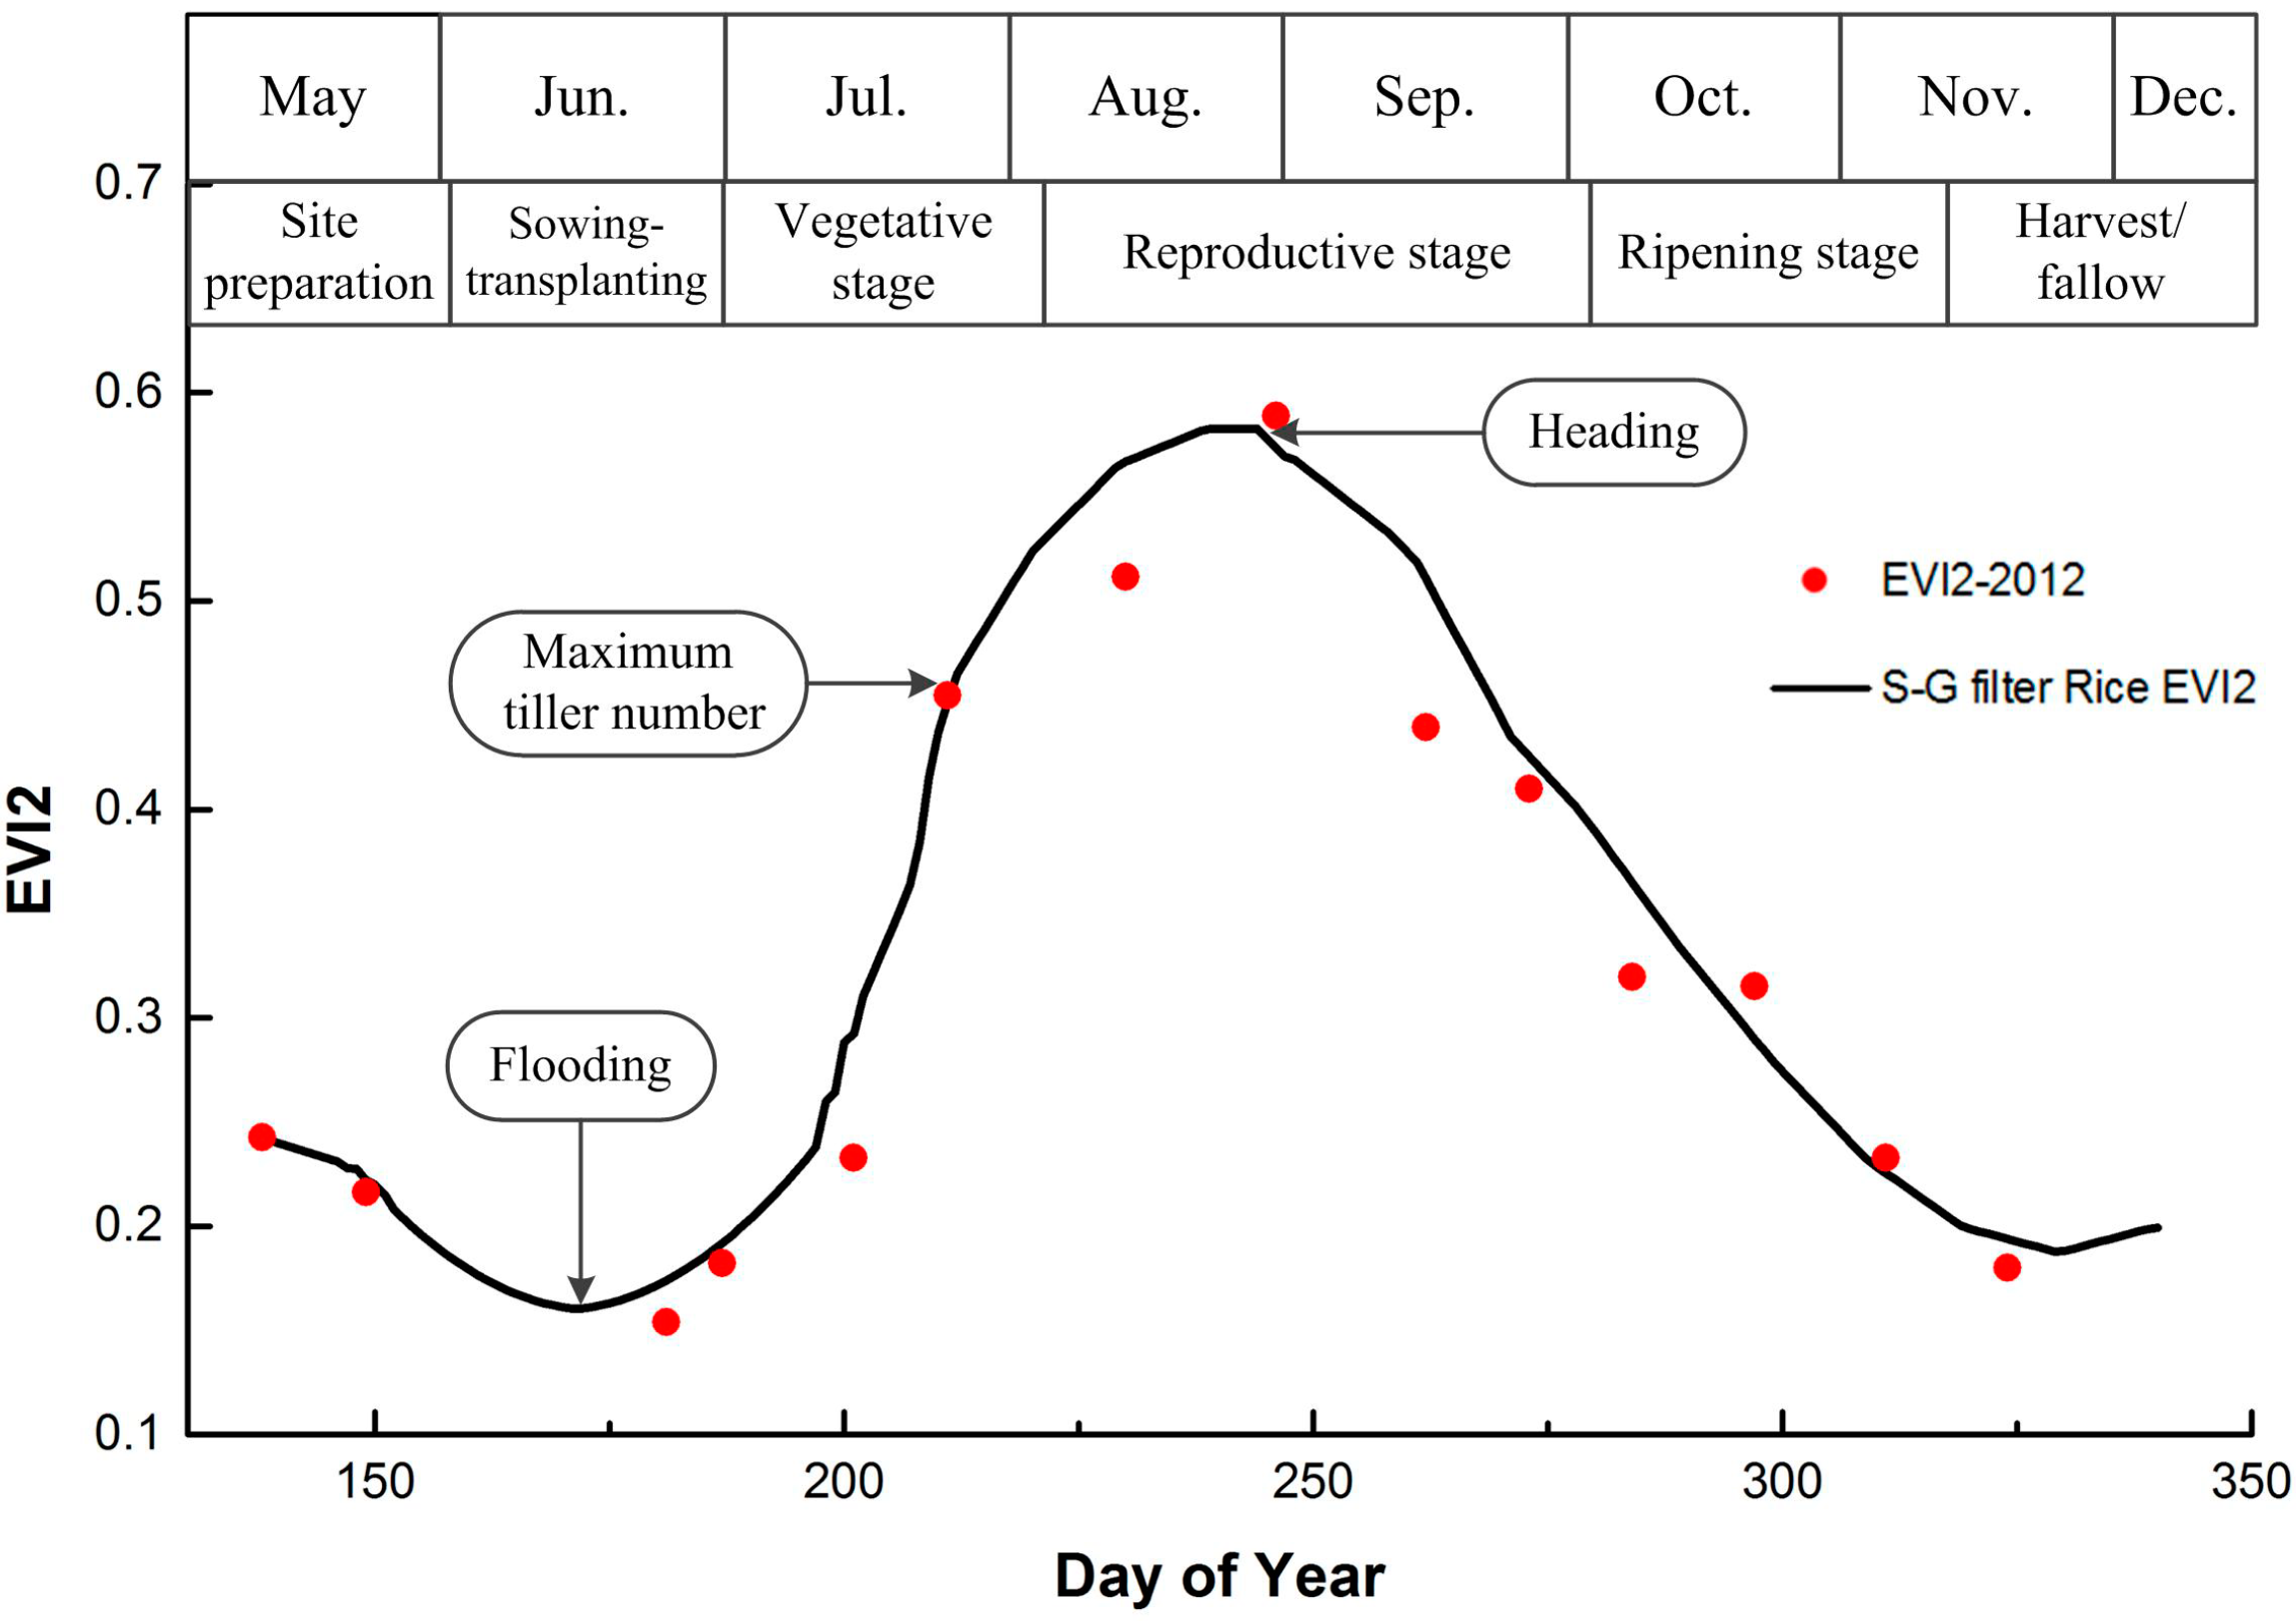
2.4.1. Characteristics of EVI2 Time-Series Data during SCR Growing Periods
2.4.2. Single-Cropped Rice Classification Method
2.4.3. Parametric and Nonparametric Classification Algorithms
2.4.4. Classification Accuracy Assessment
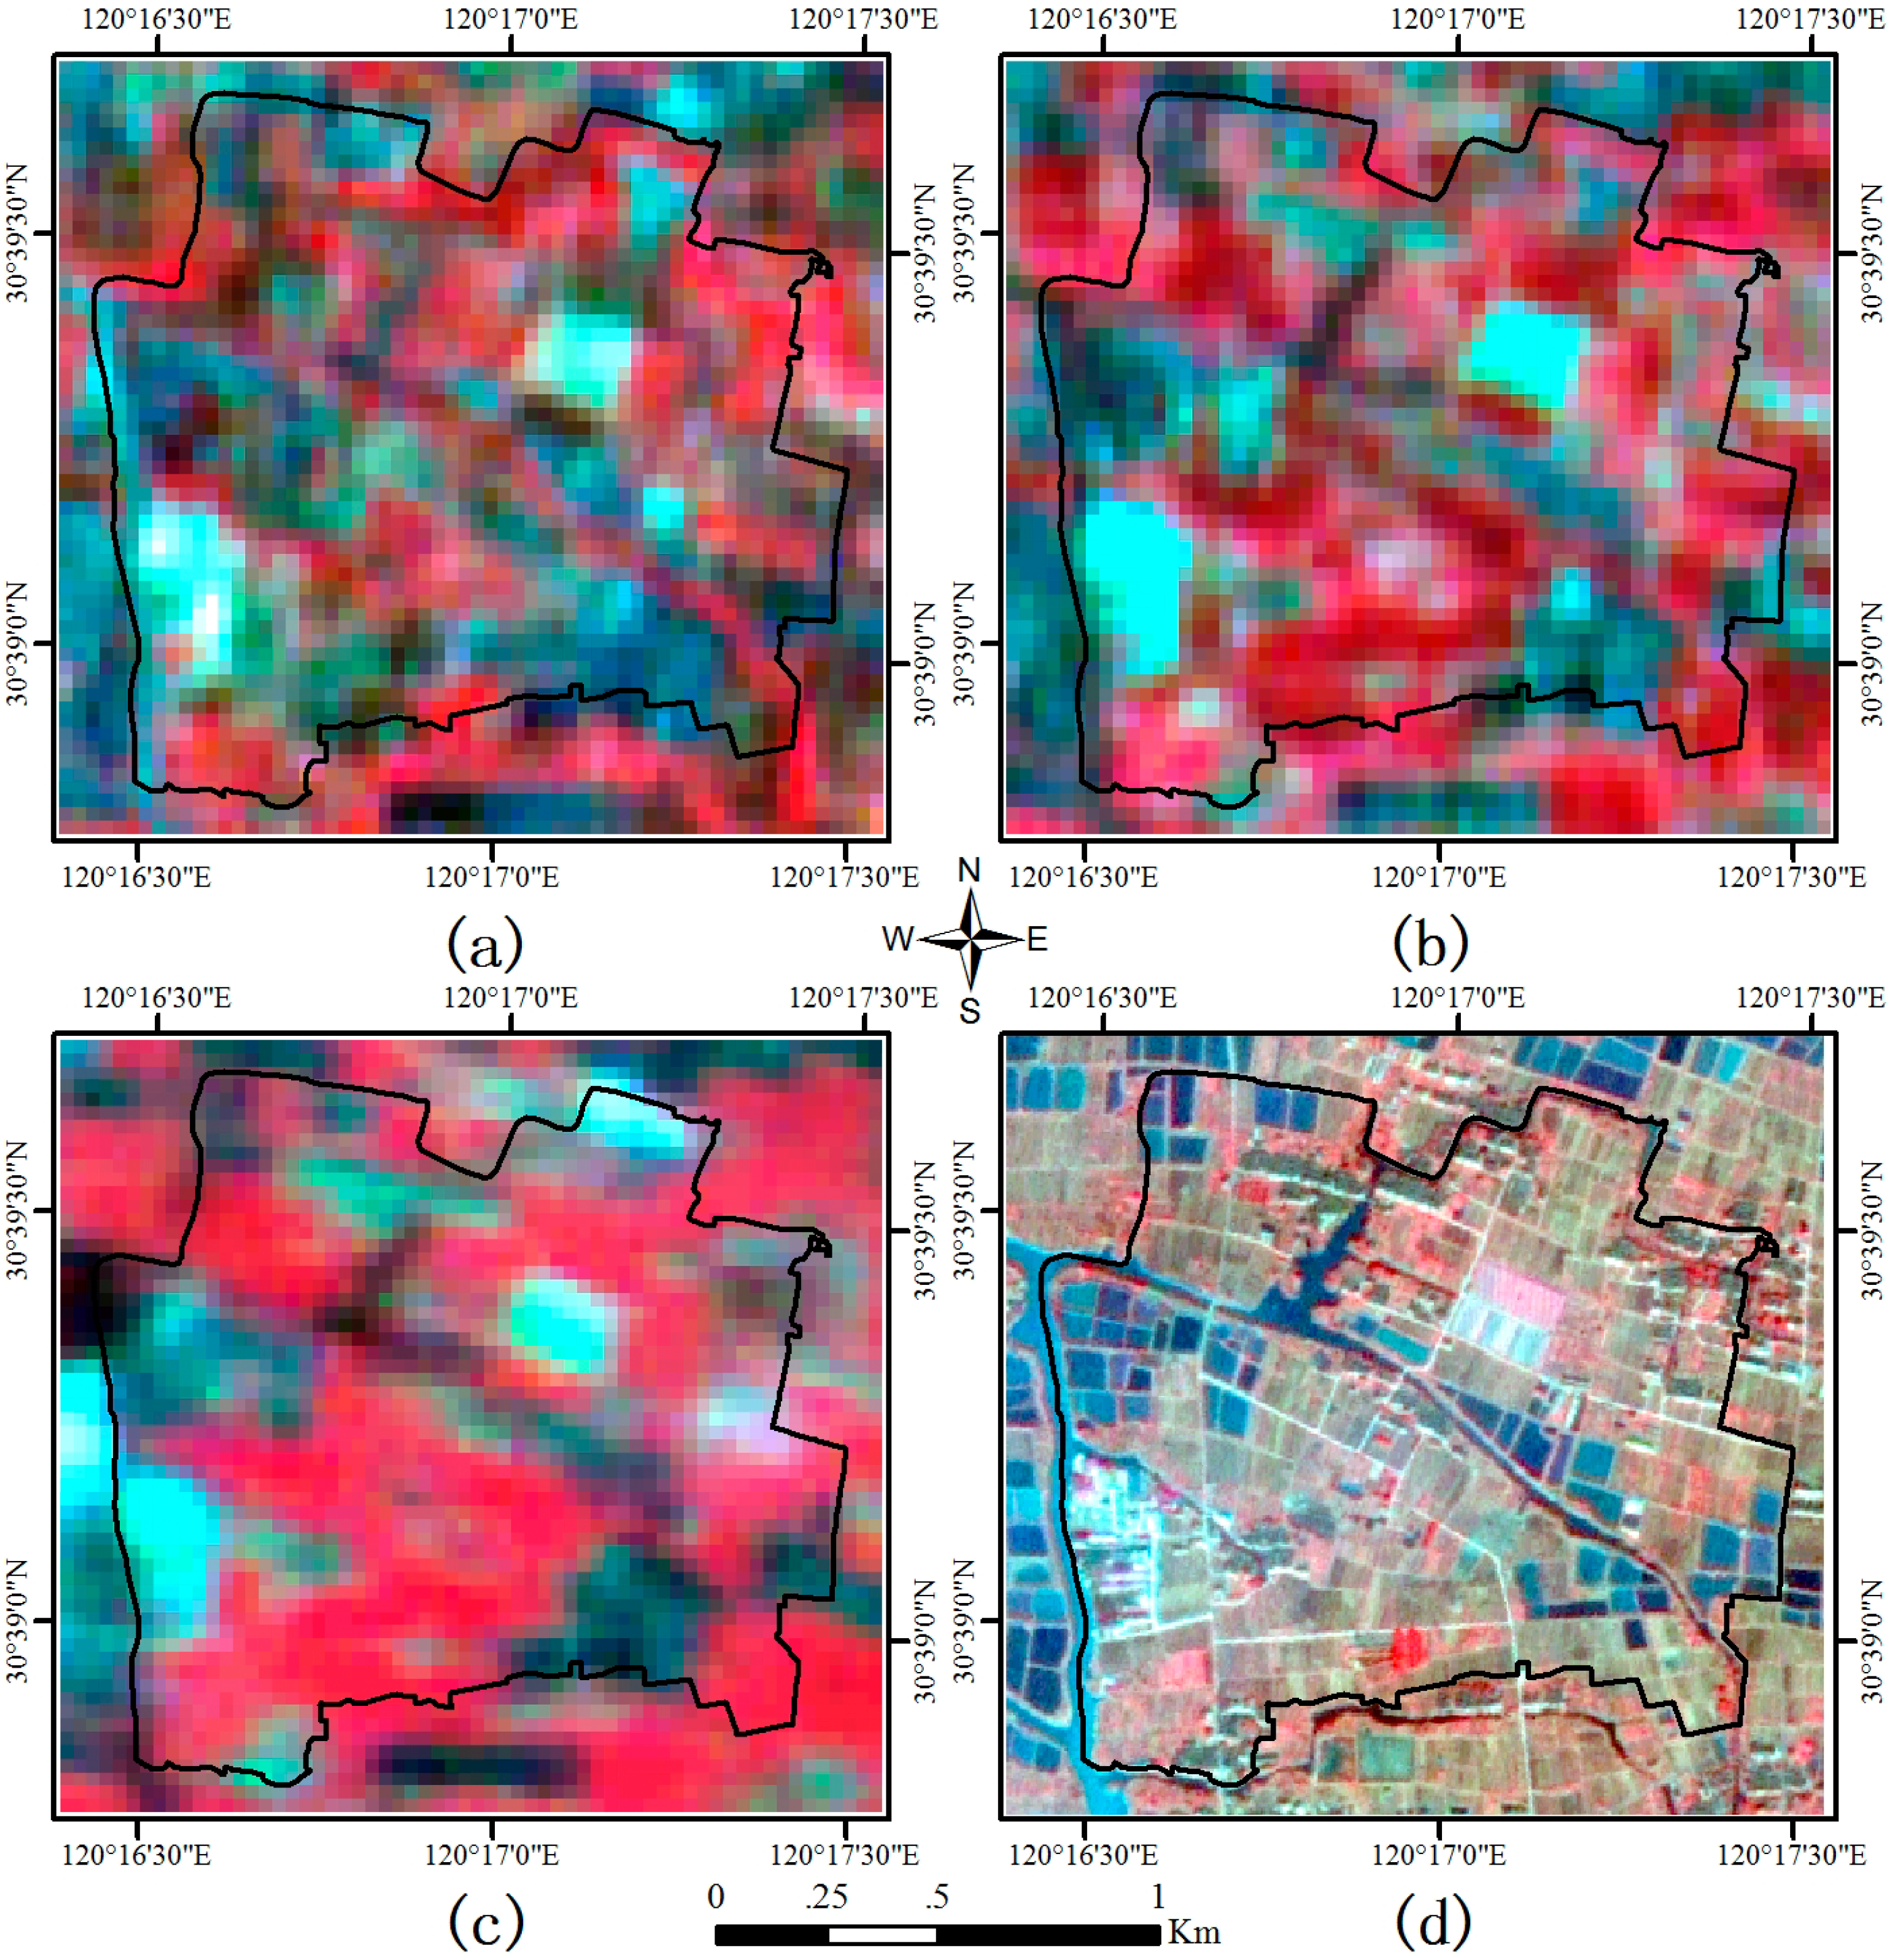
2.5. Influence of the Mixed-Pixel
3. Results
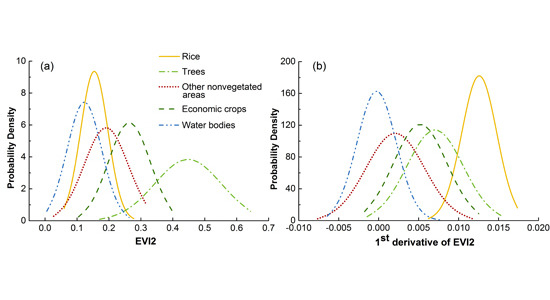
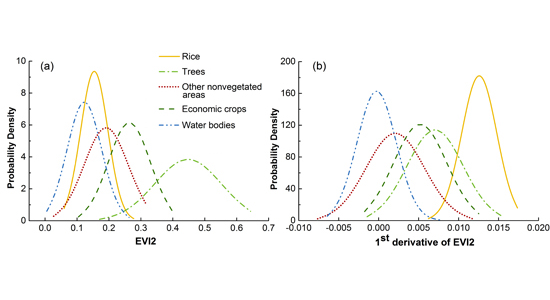
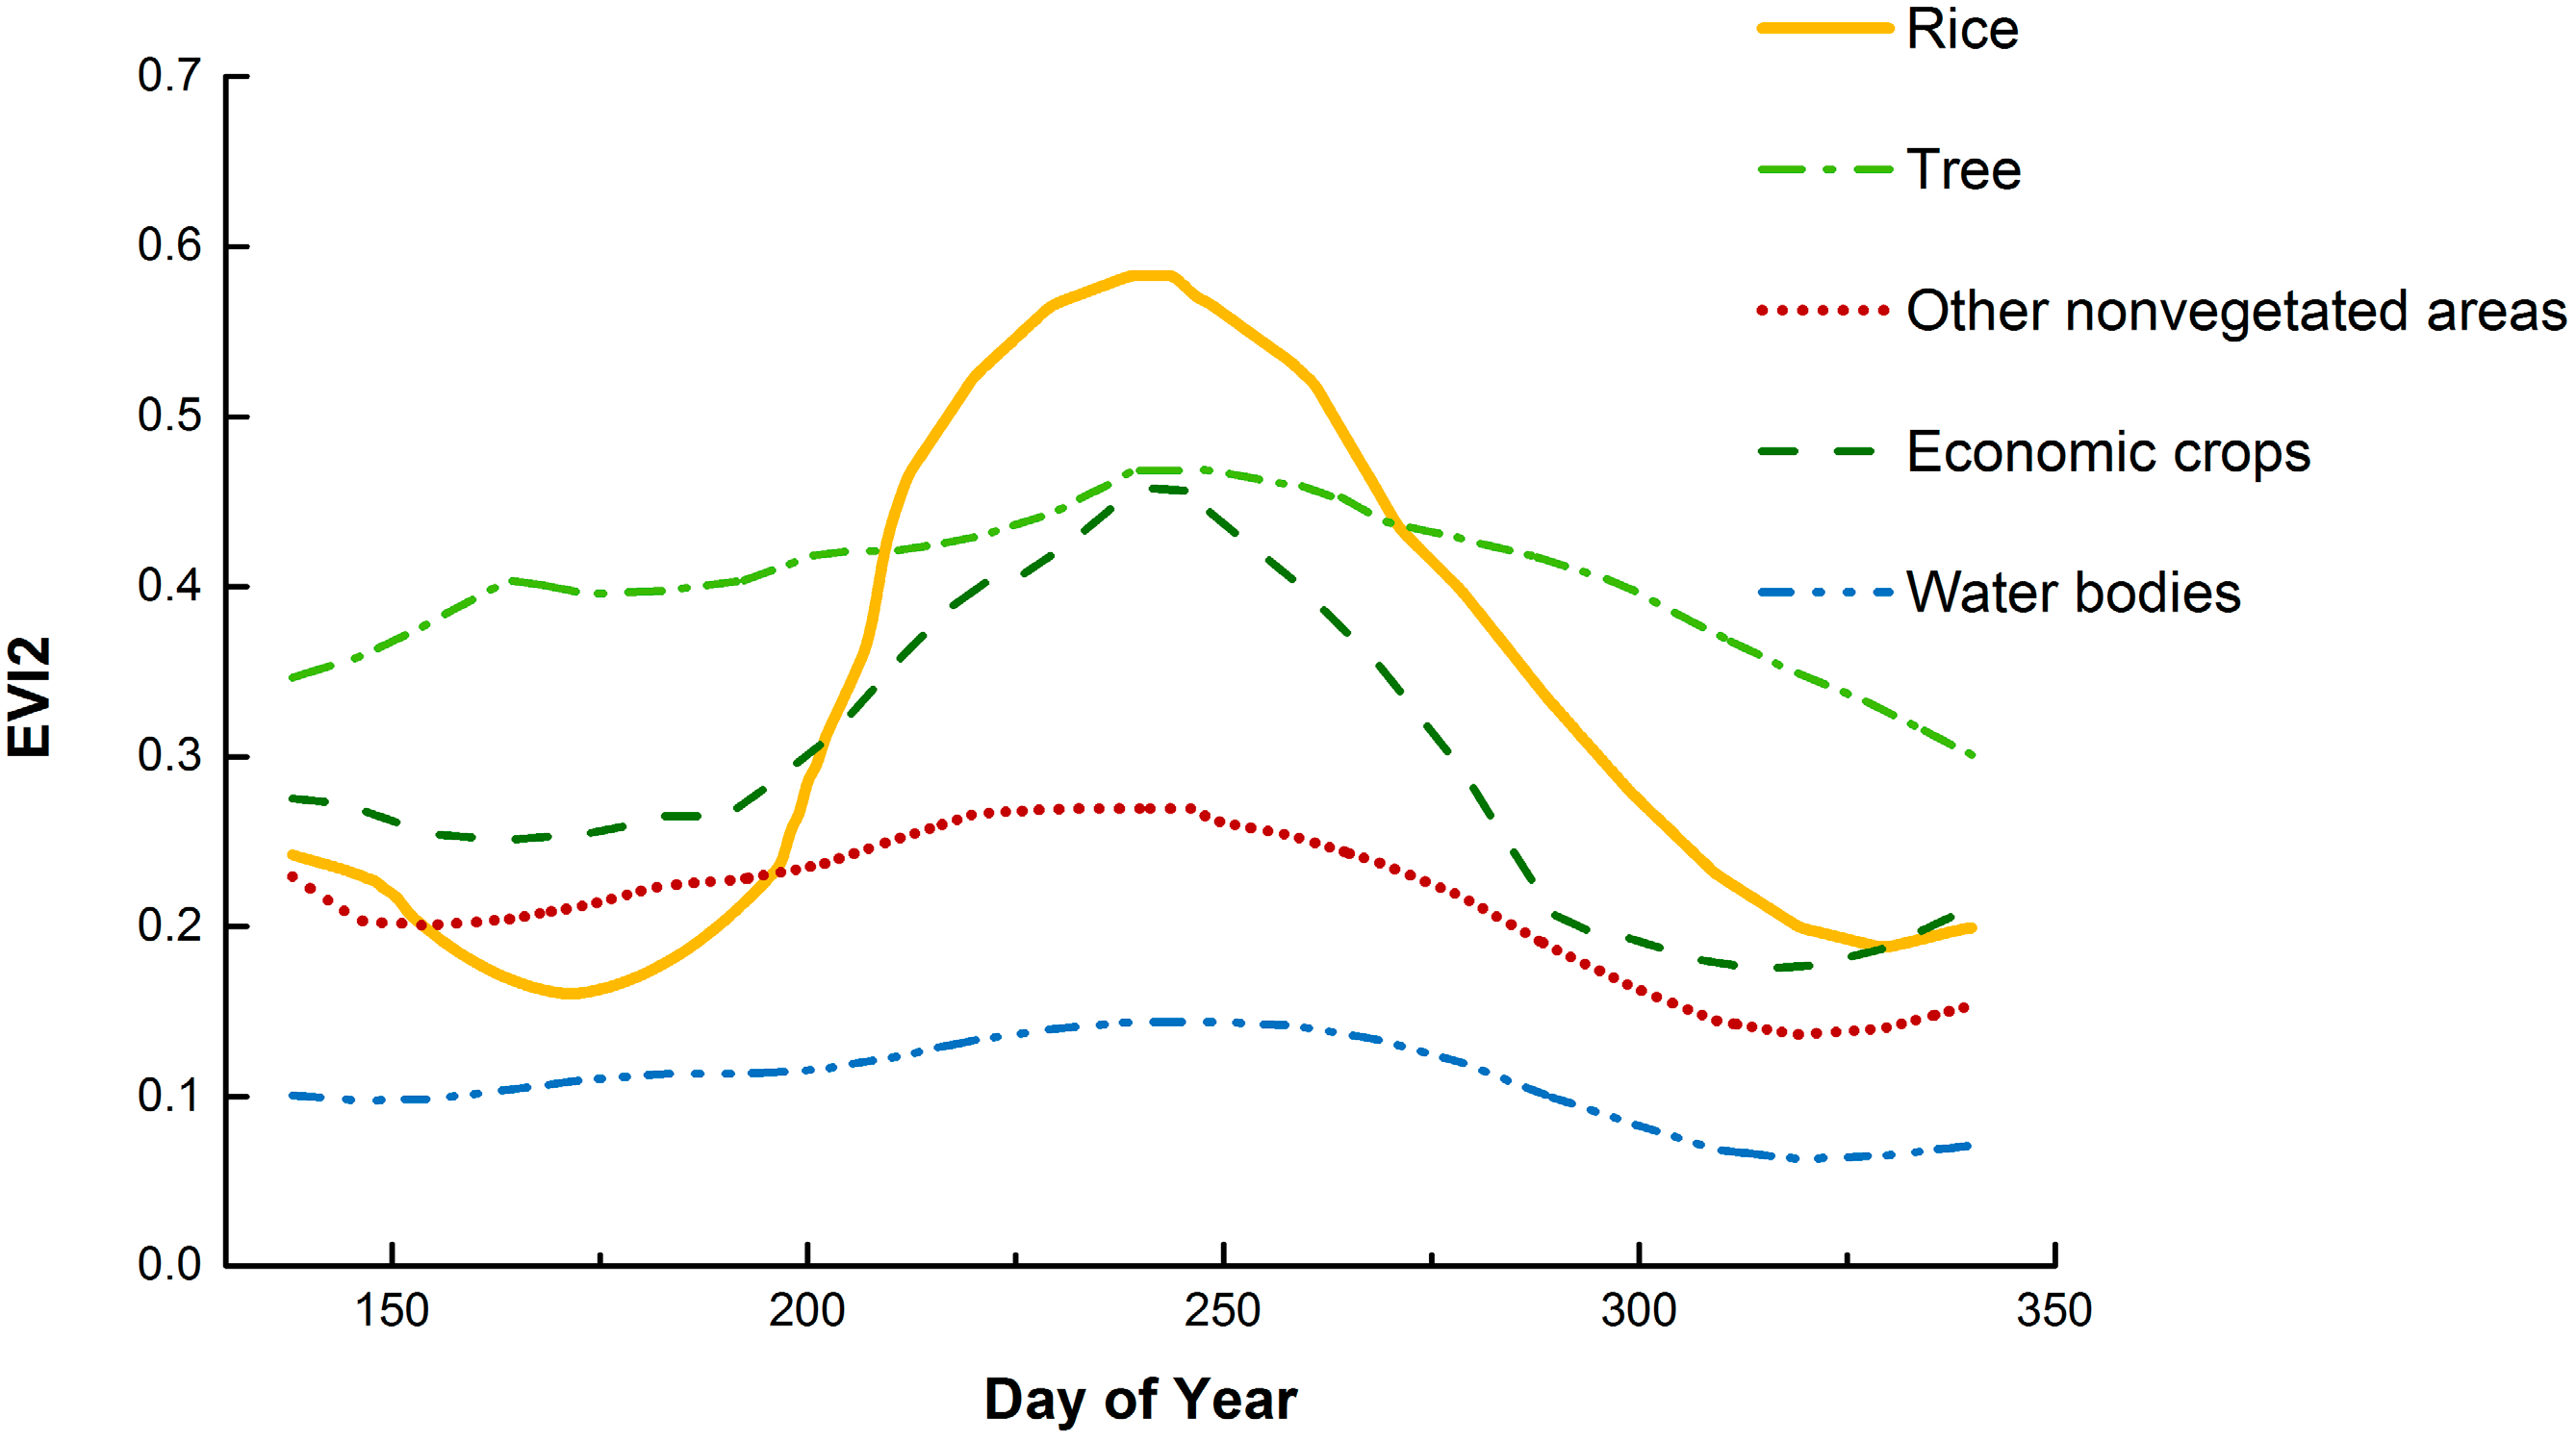
3.1. Time-Series EVI2 Characteristics


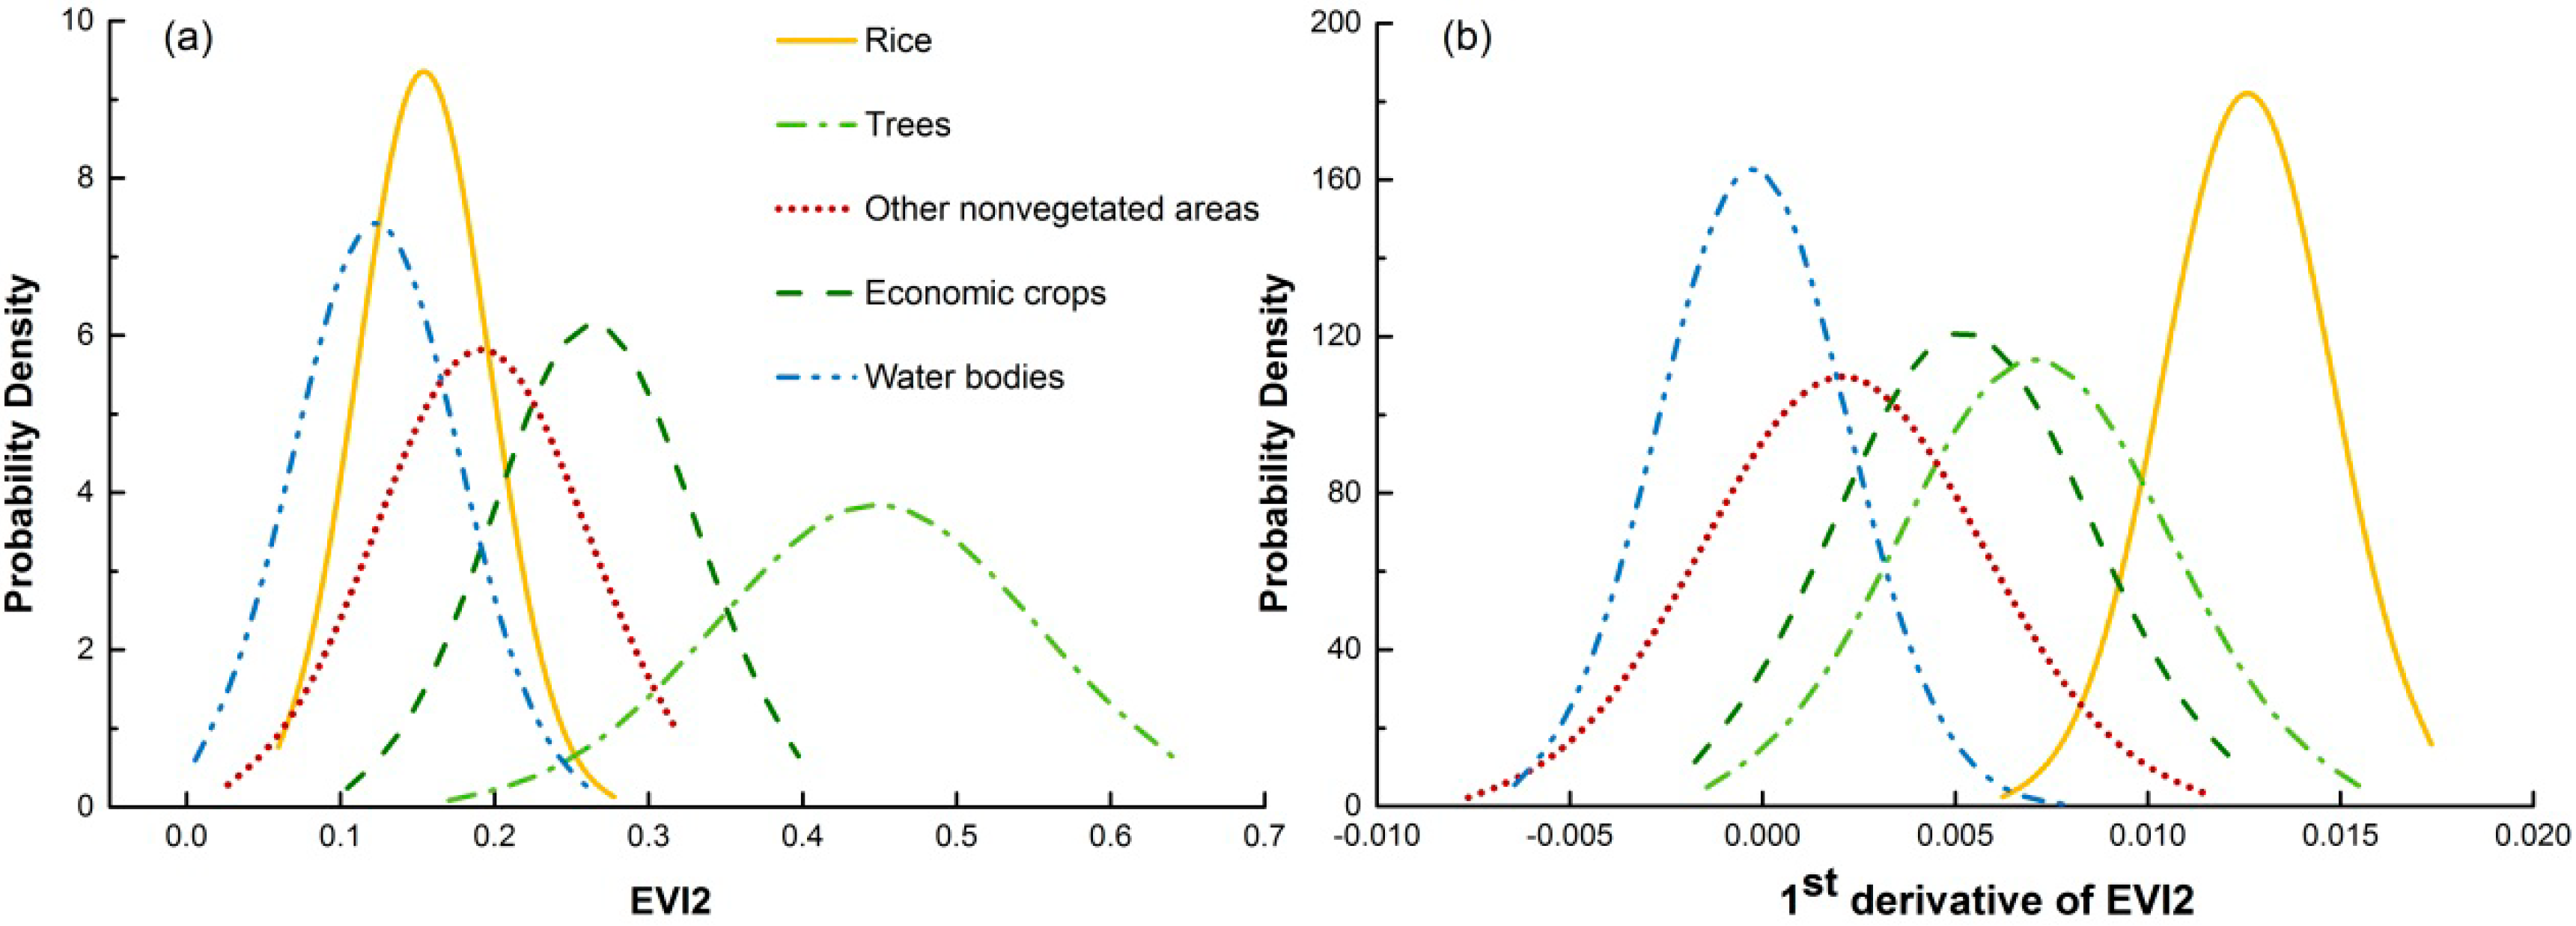
3.2. Classification Thresholds

3.3. Classification Accuracy Assessment

| Classification Accuracy | A | B | C | D | E | All |
|---|---|---|---|---|---|---|
| Producer’s accuracy (%) | 95.43 | 94.12 | 90.72 | 94.98 | 95.67 | 94.35 |
| User’s accuracy (%) | 75.1 | 77.29 | 69.17 | 86.31 | 83.42 | 78.70 |
| Overall accuracy (%) | 92.43 | 90.68 | 91.93 | 94.21 | 93.40 | 91.68 |
| Kappa coefficient | 0.76 | 0.75 | 0.71 | 0.85 | 0.83 | 0.79 |
3.4. Comparison of Classification Methods
| Classification Methods | Classification Accuracy | A | B | C | D | E | All |
|---|---|---|---|---|---|---|---|
| MLC-EVI2 | Producer’s accuracy (%) | 67.77 | 70.77 | 60.68 | 77.01 | 70.69 | 62.41 |
| User’s accuracy (%) | 67.08 | 63.83 | 61.43 | 73.25 | 73.68 | 60.58 | |
| Overall accuracy (%) | 88.85 | 85.10 | 84.03 | 89.17 | 87.81 | 84.88 | |
| Kappa coefficient | 0.71 | 0.68 | 0.68 | 0.60 | 0.74 | 0.65 | |
| MLC-Reflectance | Producer’s accuracy (%) | 68.60 | 66.48 | 52.97 | 79.93 | 70.27 | 62.55 |
| User’s accuracy (%) | 65.23 | 61.21 | 56.15 | 69.49 | 70.27 | 57.52 | |
| Overall accuracy (%) | 88.42 | 83.74 | 81.54 | 88.58 | 86.72 | 83.83 | |
| Kappa coefficient | 0.70 | 0.63 | 0.64 | 0.70 | 0.72 | 0.65 | |
| SVM-EVI2 | Producer’s accuracy (%) | 82.23 | 83.38 | 60.05 | 83.76 | 81.07 | 73.97 |
| User’s accuracy (%) | 50.90 | 52.43 | 50.90 | 59.14 | 61.16 | 54.33 | |
| Overall accuracy (%) | 83.46 | 80.17 | 76.96 | 85.37 | 85.34 | 81.09 | |
| Kappa coefficient | 0.63 | 0.62 | 0.57 | 0.55 | 0.69 | 0.61 | |
| SVM-Reflectance | Producer’s accuracy (%) | 84.30 | 85.82 | 60.96 | 85.40 | 79.10 | 74.80 |
| User’s accuracy (%) | 50.00 | 51.63 | 51.51 | 58.40 | 63.87 | 52.87 | |
| Overall accuracy (%) | 82.97 | 78.23 | 76.35 | 84.78 | 84.27 | 80.00 | |
| Kappa coefficient | 0.63 | 0.59 | 0.56 | 0.55 | 0.61 | 0.57 |
| Site | Class | CA (ha) | %LAND | PD | MPS (ha) | AWMSI | MNN (m) |
|---|---|---|---|---|---|---|---|
| A | Rice | 50.08 | 25.78 | 1.56 | 0.64 | 1.73 | 27.41 |
| Trees | 44.99 | 23.16 | 2.20 | 0.45 | 2.83 | 19.45 | |
| Water bodies | 69.12 | 35.58 | 1.22 | 0.82 | 2.54 | 18.03 | |
| Economic crops | 2.32 | 1.19 | 6.89 | 0.15 | 1.40 | 126.17 | |
| Other nonvegetated areas | 27.77 | 14.29 | 4.83 | 0.21 | 7.76 | 30.91 | |
| B | Rice | 60.85 | 30.25 | 1.25 | 0.80 | 2.11 | 21.90 |
| Trees | 56.73 | 28.20 | 1.73 | 0.58 | 3.23 | 21.38 | |
| Water bodies | 48.12 | 23.92 | 1.41 | 0.71 | 3.86 | 20.32 | |
| Economic crops | 3.75 | 1.86 | 5.33 | 0.19 | 5.67 | 80.80 | |
| Other nonvegetated areas | 31.72 | 15.77 | 4.48 | 0.22 | 4.55 | 17.64 | |
| C | Rice | 40.50 | 19.66 | 1.31 | 0.76 | 1.57 | 22.14 |
| Trees | 45.47 | 22.07 | 1.83 | 0.55 | 2.56 | 15.98 | |
| Water bodies | 74.08 | 35.95 | 0.90 | 1.11 | 2.10 | 20.15 | |
| Economic crops | 7.55 | 3.67 | 2.25 | 0.44 | 1.34 | 92.04 | |
| Other nonvegetated areas | 38.44 | 18.66 | 4.63 | 0.22 | 7.34 | 21.30 | |
| D | Rice | 70.31 | 36.03 | 0.95 | 1.05 | 1.25 | 13.85 |
| Trees | 32.12 | 16.46 | 1.96 | 0.51 | 2.20 | 13.24 | |
| Water bodies | 62.61 | 32.08 | 1.15 | 0.87 | 1.94 | 7.00 | |
| Economic crops | 5.95 | 3.05 | 15.12 | 0.07 | 4.38 | 21.55 | |
| Other nonvegetated areas | 24.15 | 12.38 | 8.49 | 0.12 | 18.53 | 13.50 | |
| E | Rice | 55.62 | 31.15 | 1.11 | 0.90 | 1.40 | 13.64 |
| Trees | 41.63 | 23.32 | 2.45 | 0.41 | 1.97 | 14.60 | |
| Water bodies | 43.74 | 24.50 | 0.78 | 1.29 | 2.60 | 22.36 | |
| Economic crops | 5.88 | 3.29 | 5.44 | 0.18 | 1.58 | 65.06 | |
| Other nonvegetated areas | 31.67 | 17.74 | 5.27 | 0.19 | 8.29 | 19.73 |
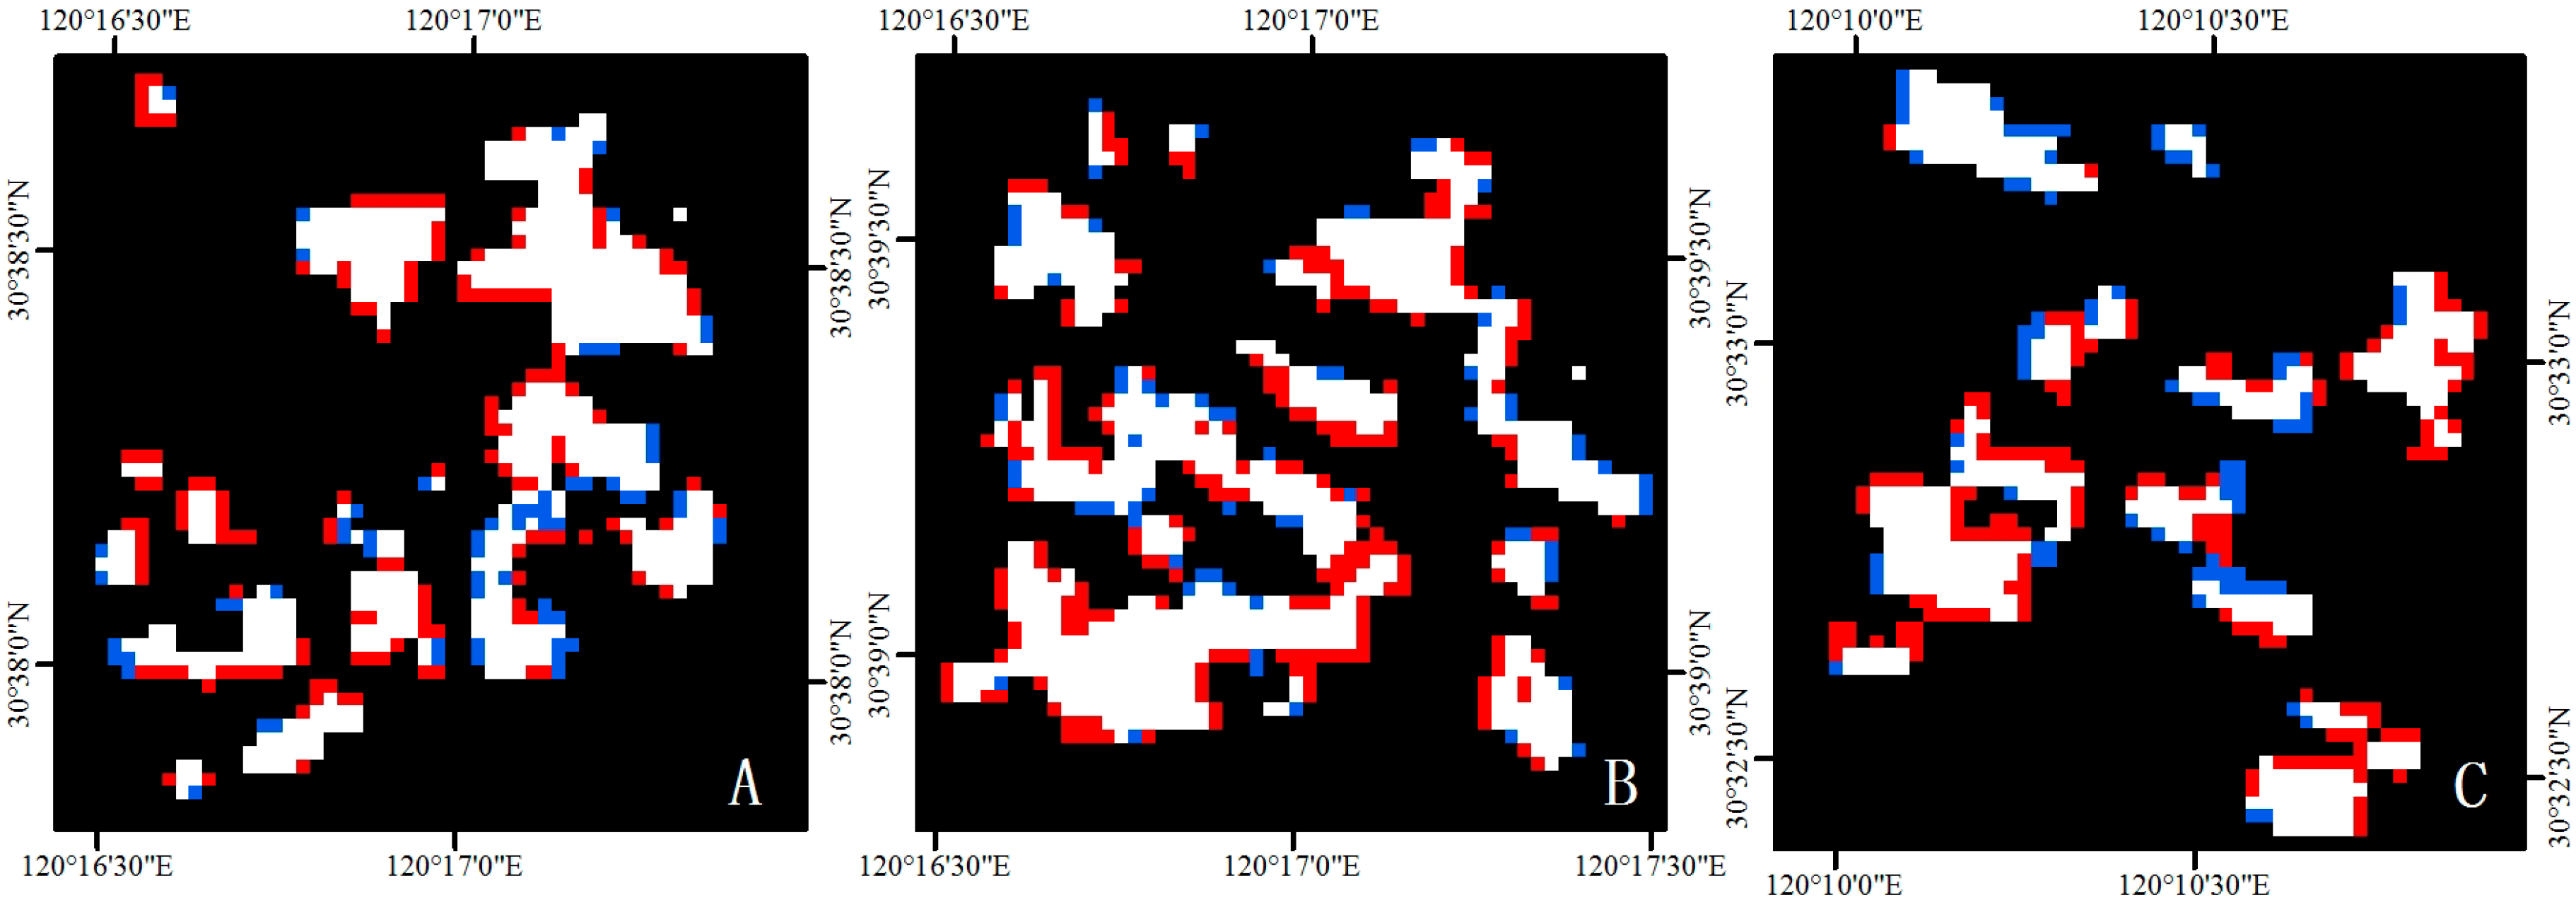
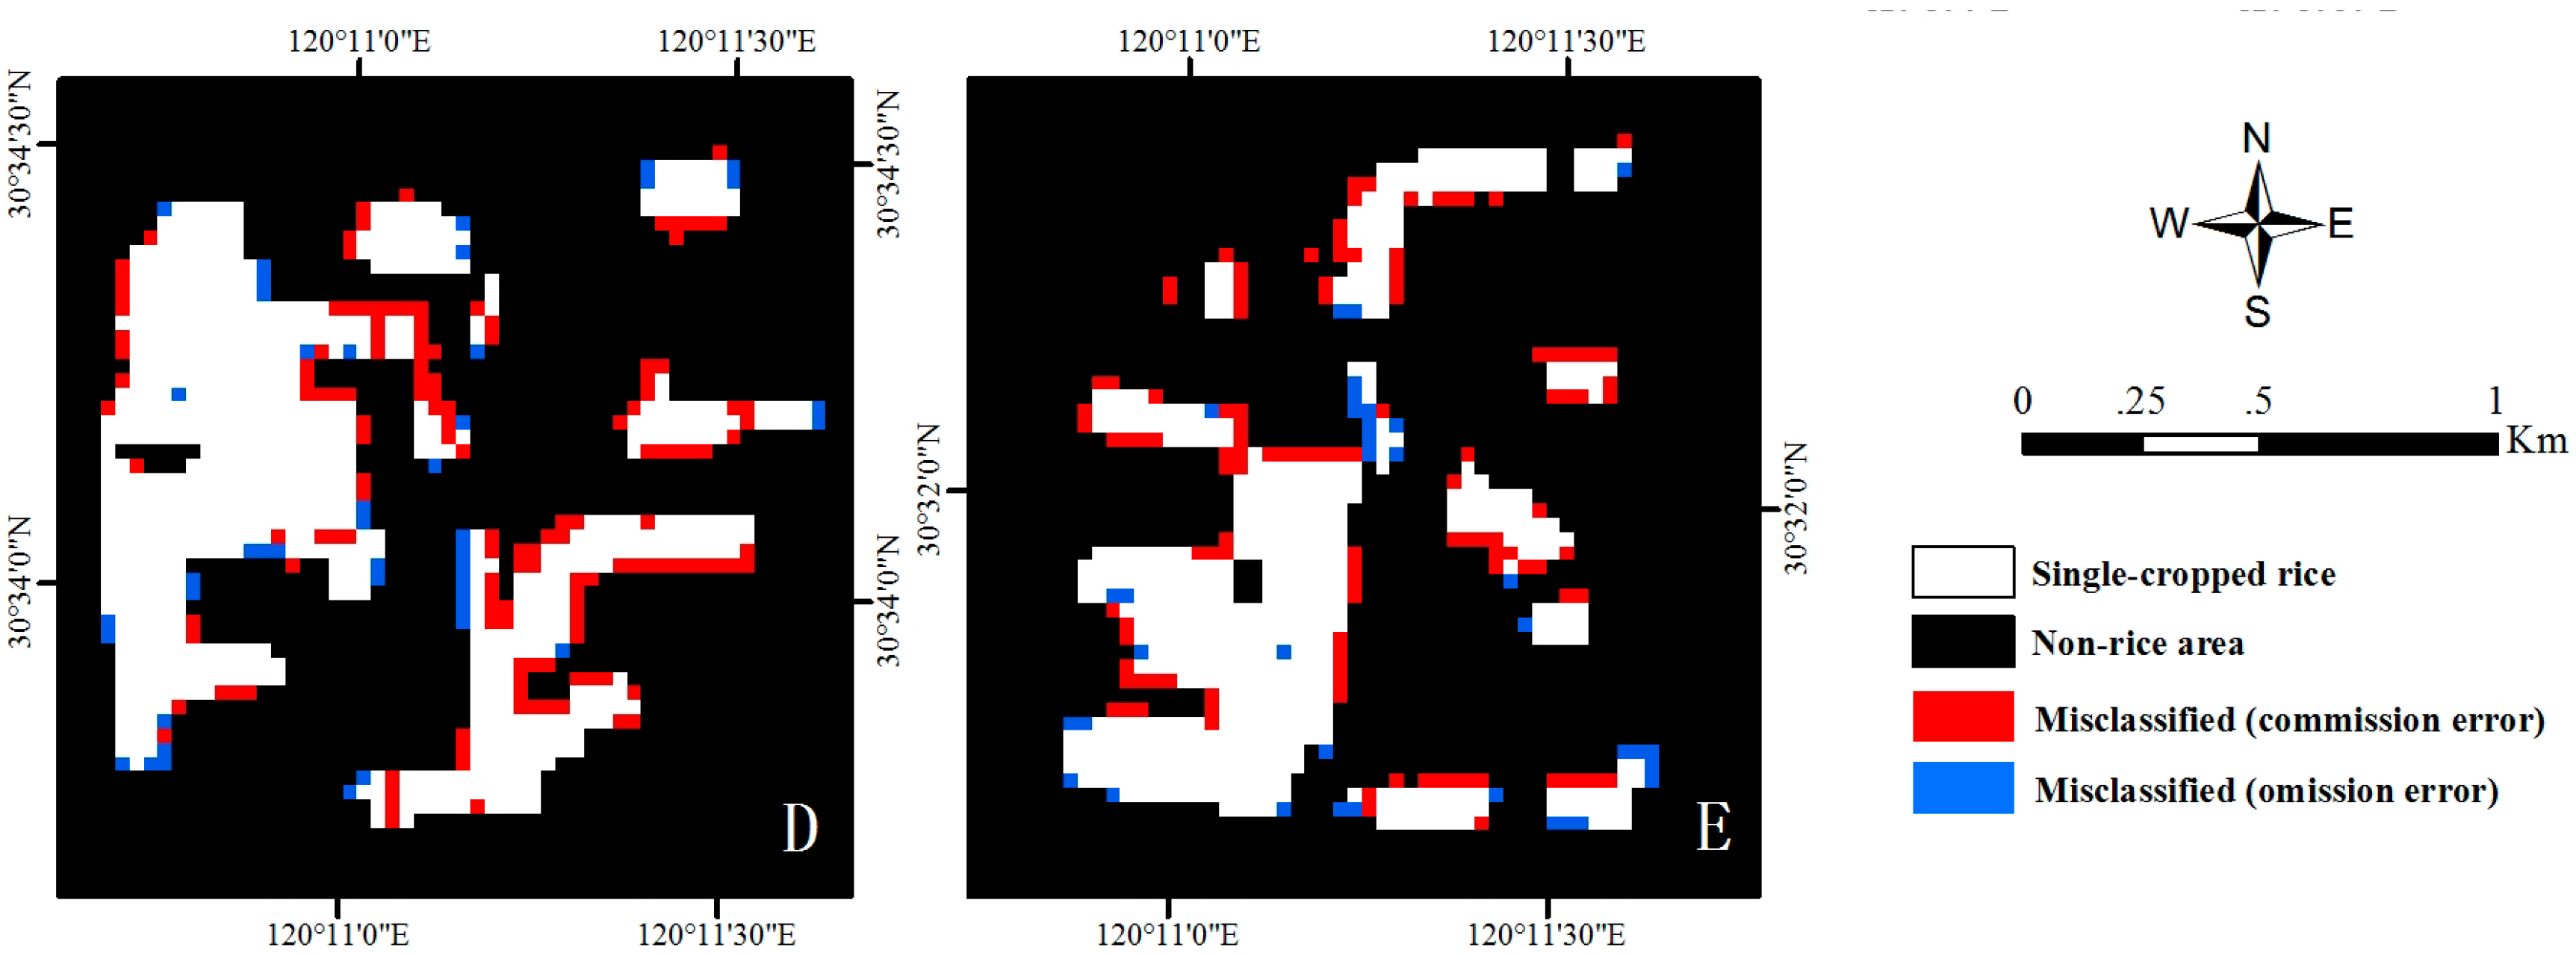
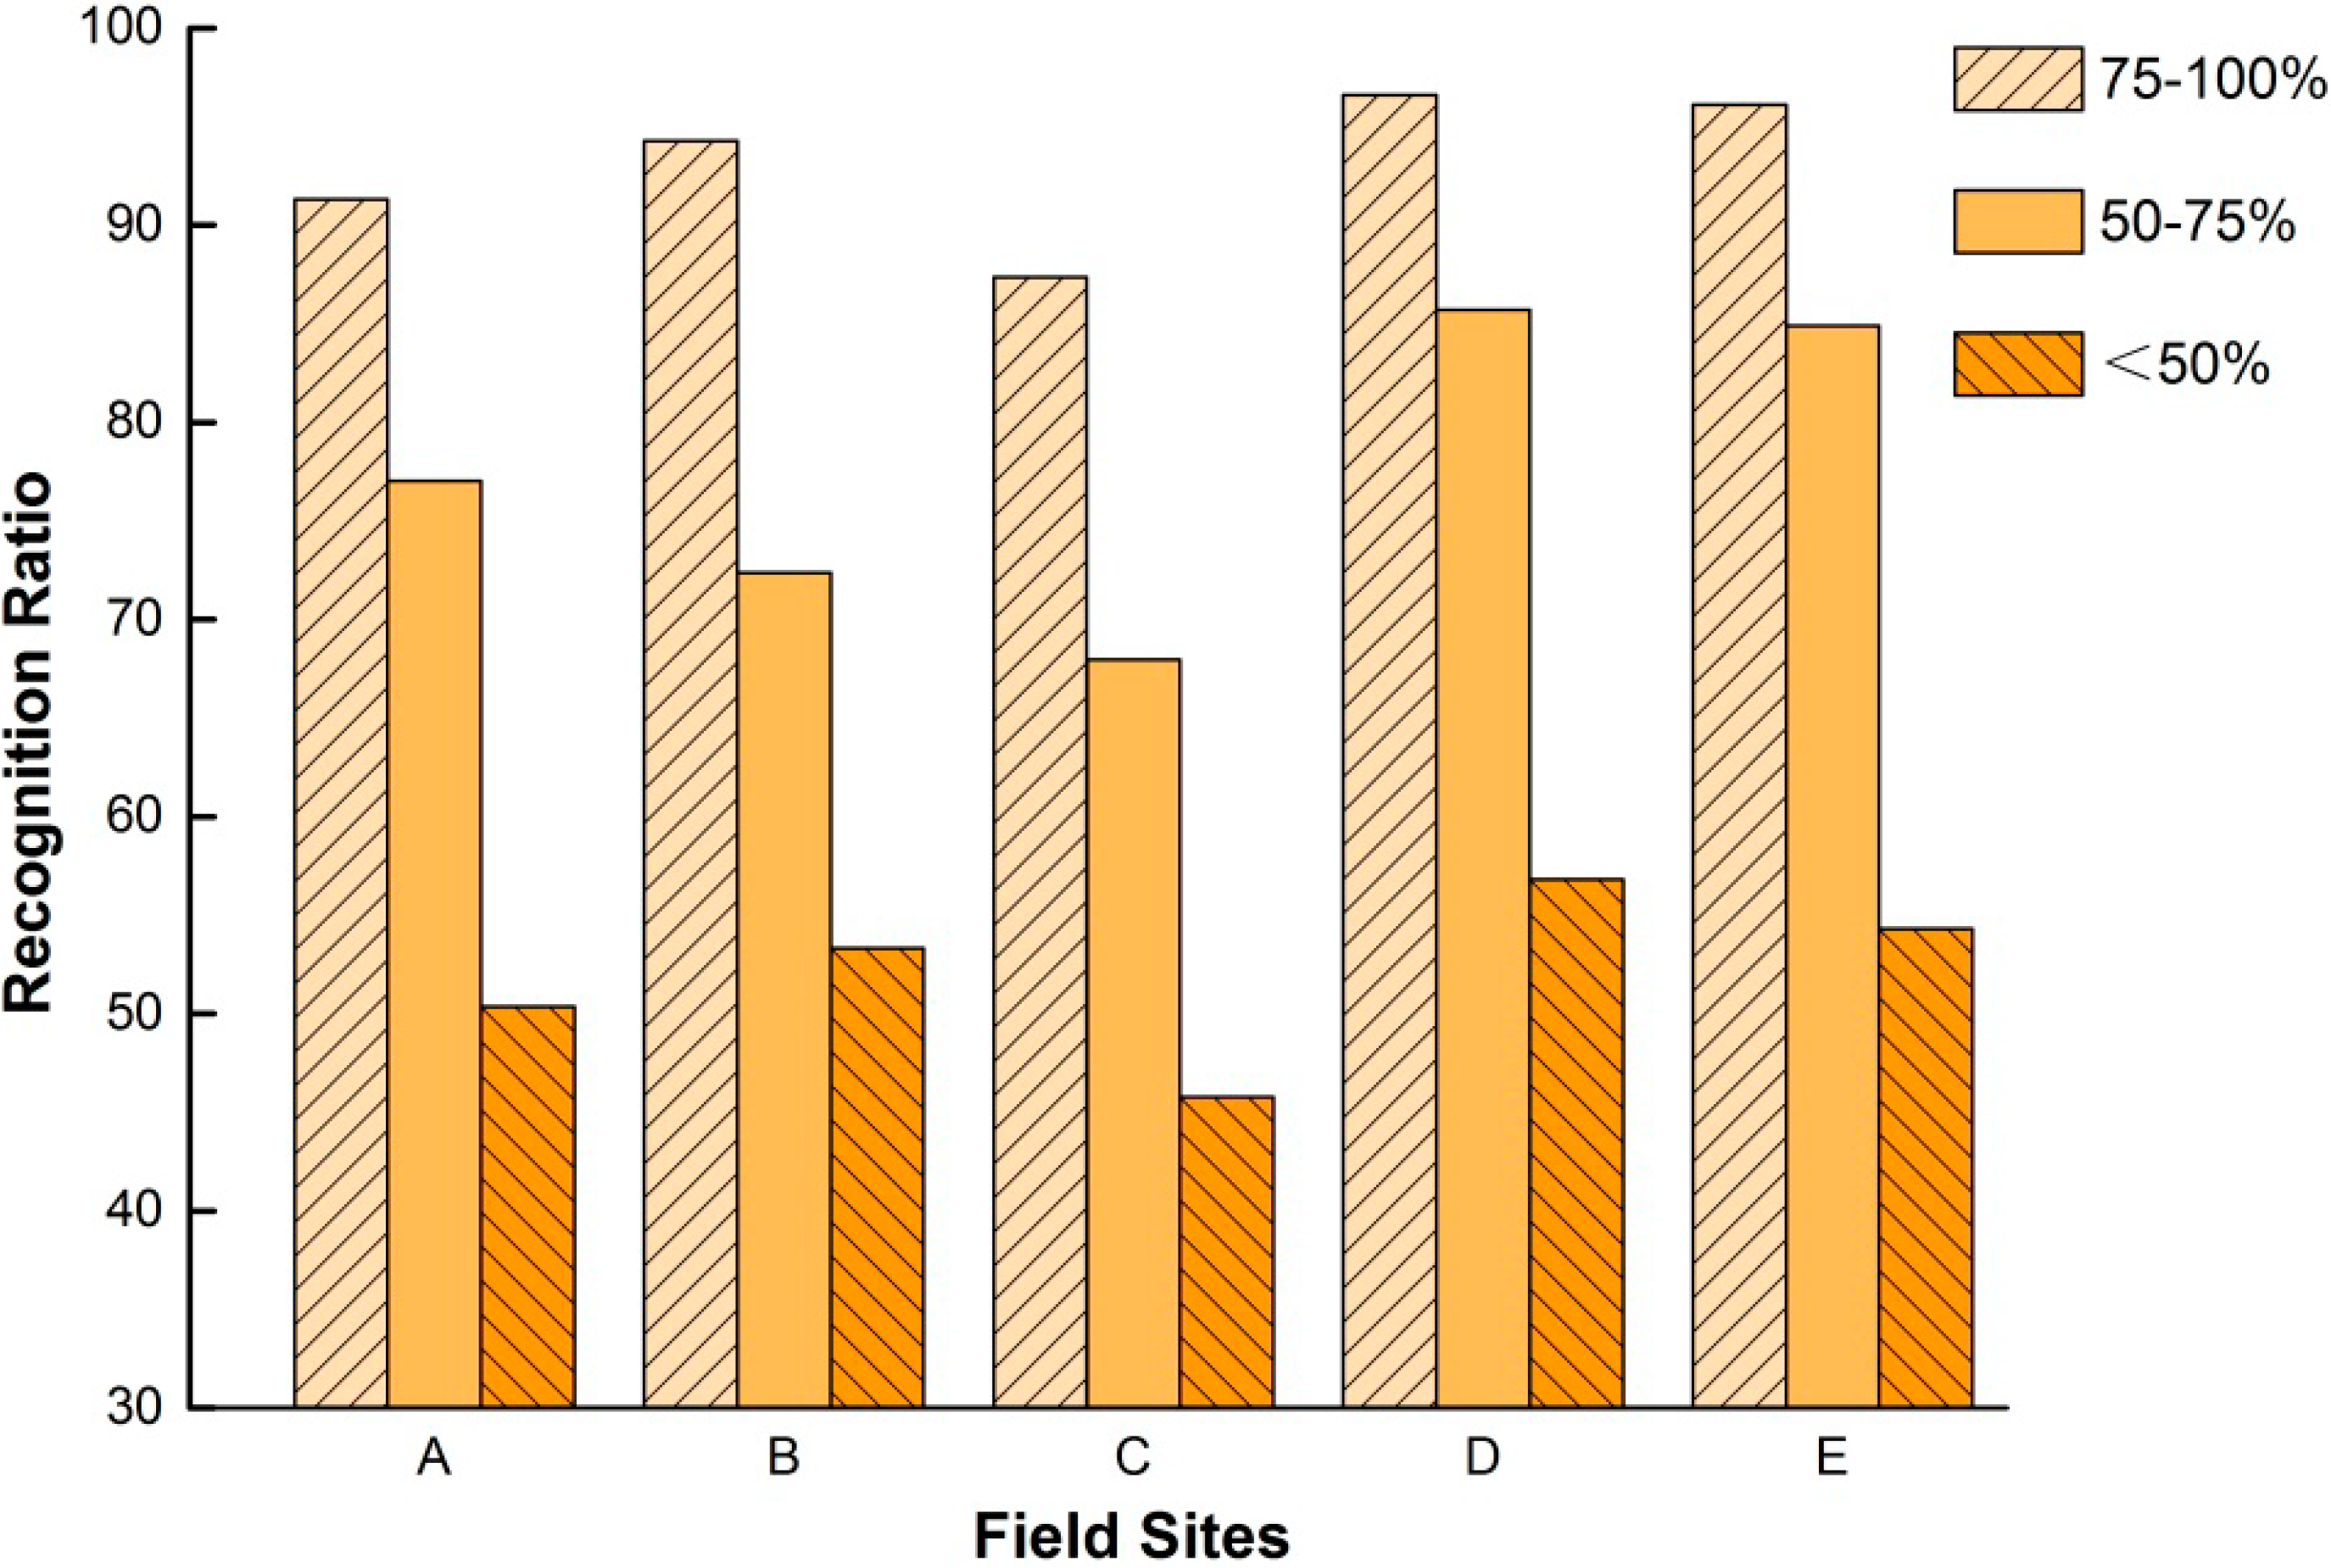
3.5. Influence of the Mixed-Pixel
| Statistics of Classification | A | B | C | D | E |
|---|---|---|---|---|---|
| Rice pixel number | 779 | 995 | 678 | 942 | 742 |
| Boundary pixel number | 476 | 594 | 433 | 542 | 369 |
| Commission pixel number | 150 | 217 | 155 | 144 | 119 |
| Commission pixels on boundary | 122 | 169 | 107 | 101 | 91 |
| Omission pixel number | 65 | 70 | 80 | 44 | 36 |
| Omission pixels on boundary | 47 | 57 | 53 | 40 | 23 |
| Classification error(%) 1 | 27.60 | 28.84 | 34.66 | 19.96 | 20.89 |


4. Discussion
5. Conclusions
Acknowledgements
Author Contributions
Conflicts of Interest
References
- Gnanamanickam, S.S. Rice and its importance to human life. In Rice and Its Importance to Human Life; Springer: Berlin, Germany, 2009; pp. 1–11. [Google Scholar]
- Gon, H.D. Changes in CH4 emission from rice fields from 1960 to 1990s: 1. Impacts of modern rice technology. Glob. Biogeochem. Cycles 2000, 14, 61–72. [Google Scholar] [CrossRef]
- Zhang, W.; Yu, Y.Q.; Huang, Y.; Li, T.T.; Wang, P. Modeling methane emissions from irrigated rice cultivation in China from 1960 to 2050. Glob. Change Biol. 2011, 17, 3511–3523. [Google Scholar] [CrossRef]
- FAOSTAT. Statistical Database of the Food and Agricultural Organization of the United Nations. Available online: http://faostat.fao.org/default.aspx?lang=en (accessed on 30 December 2014).
- Zhai, H. Prospects for grain demand and supply in the 21st century. In Proceedings of the 12th Toyota Conference: Challenge of Plant and Agricultural Sciences to the Crisis of the Biosphere on the Earth in the 21st Century, Shizuoka, Japan, 25–28 November 1998; pp. 29–37.
- Chen, C.F.; Huang, S.W.; Son, N.T.; Chang, L.Y. Mapping double-cropped irrigated rice fields in Taiwan using time-series Satellite Pour I’Observation de la Terre data. J. Appl. Remote Sens. 2011, 5. [Google Scholar] [CrossRef]
- Xiao, X.M.; Boles, S.; Frolking, S.; Li, C.S.; Babu, J.Y.; Salas, W.; Moore, B., III. Mapping paddy rice agriculture in South and Southeast Asia using multi-temporal MODIS images. Remote Sens. Environ. 2006, 100, 95–113. [Google Scholar] [CrossRef]
- Fang, H.L.; Wu, B.F.; Liu, H.Y.; Huang, X. Using NOAA AVHRR and Landsat TM to estimate rice area year-by-year. Int. J. Remote Sens. 1998, 19, 521–525. [Google Scholar] [CrossRef]
- Gumma, M.K.; Thenkabail, P.S.; Hideto, F.; Nelson, A.; Dheeravath, V.; Busia, D.; Rala, A. Mapping irrigated areas of Ghana using fusion of 30 m and 250 m resolution remote-sensing data. Remote Sens. 2011, 3, 816–835. [Google Scholar] [CrossRef]
- Yu, L.; Wang, J.; Clinton, N.; Xin, Q.C.; Zhong, L.H.; Chen, Y.L.; Gong, P. FROM-GC: 30 m global cropland extent derived through multisource data integration. Int. J. Digit. Earth 2013, 6, 521–533. [Google Scholar] [CrossRef]
- Kamthonkiat, D.; Honda, K.; Turral, H.; Tripathi, N.K.; Wuwongse, V. Discrimination of irrigated and rainfed rice in a tropical agricultural system using SPOT VEGETATION NDVI and rainfall data. Int. J. Remote Sens. 2005, 26, 2527–2547. [Google Scholar] [CrossRef]
- Sakamoto, T.; Van Nguyen, N.; Ohno, H.; Ishitsuka, N.; Yokozawa, M. Spatio–temporal distribution of rice phenology and cropping systems in the Mekong Delta with special reference to the seasonal water flow of the Mekong and Bassac Rivers. Remote Sens. Environ. 2006, 100, 1–16. [Google Scholar] [CrossRef]
- Sun, H.S.; Huang, J.F.; Huete, A.R.; Peng, D.L.; Zhang, F. Mapping paddy rice with multi-date moderate-resolution imaging spectroradiometer (MODIS) data in China. J. Zhejiang Univ-Sc. A. 2009, 10, 1509–1522. [Google Scholar] [CrossRef]
- Carfagna, E.; Gallego, F.J. Using remote sensing for agricultural statistics. Int. Stat. Rev. 2005, 73, 389–404. [Google Scholar] [CrossRef]
- Wu, B.F.; Li, Q.Z. Crop planting and type proportion method for crop acreage estimation of complex agricultural landscapes. Int. J. Appl. Earth Obs. 2012, 16, 101–112. [Google Scholar] [CrossRef]
- Asner, G.P. Cloud cover in Landsat observations of the Brazilian Amazon. Int. J. Remote Sens. 2001, 22, 3855–3862. [Google Scholar] [CrossRef]
- Pyongsop, R.I.; Zhangbao, M.A.; Qingwen, Q.I.; Gaohuan, L. Cloud and shadow removal from Landsat TM data. J. Remote Sens. 2010, 14, 534–545. [Google Scholar]
- Chen, J.S.; Huang, J.X.; Hu, J.X. Mapping rice planting areas in southern China using the China Environment Satellite data. Math. Comput. Model. 2011, 54, 1037–1043. [Google Scholar] [CrossRef]
- Jia, K.; Wu, B.F.; Li, Q.Z. Crop classification using HJ satellite multispectral data in the North China Plain. J. Appl. Remote Sens. 2013, 7. [Google Scholar] [CrossRef]
- Li, W.G.; Li, H.; Zhao, L.H. Estimating Rice Yield by HJ-1A Satellite Images. Rice Sci. 2011, 18, 142–147. [Google Scholar] [CrossRef]
- Xiao, X.M.; Boles, S.; Frolking, S.; Salas, W.; Moore, B., III; Li, C.; He, L.; Zhao, R. Observation of flooding and rice transplanting of paddy rice fields at the site to landscape scales in China using VEGETATION sensor data. Int. J. Remote Sens. 2002, 23, 3009–3022. [Google Scholar] [CrossRef]
- Le Toan, T.; Ribbes, F.; Wang, L.F.; Floury, N.; Ding, K.H.; Kong, J.A.; Fujita, M.; Kurosu, T. Rice crop mapping and monitoring using ERS-1 data based on experiment and modeling results. IEEE Trans. Geosci. Remote Sens. 1997, 35, 41–56. [Google Scholar] [CrossRef]
- Baret, F.; Guyot, G. Potentials and limits of vegetation indices for LAI and APAR assessment. Remote Sens. Environ. 1991, 35, 161–173. [Google Scholar] [CrossRef]
- Gitelson, A.A. Remote estimation of crop fractional vegetation cover: the use of noise equivalent as an indicator of performance of vegetation indices. Int. J. Remote Sens. 2013, 34, 6054–6066. [Google Scholar] [CrossRef]
- Meng, J.H.; Wu, B.F.; Chen, X.Y.; Du, X.; Niu, L.M.; Zhang, F.F. Validation of HJ-1 B charge-coupled device vegetation index products with spectral reflectance of Hyperion. Int. J. Remote Sens. 2011, 32, 9051–9070. [Google Scholar] [CrossRef]
- Rouse, J.W.; Haas, R.H.; Schell, J.A.; Deering, D.W.; Harlan, J.C. Monitoring the Vernal Advancement and Retrogradation of Natural Vegetation; NASA/GSFC, Type III, Final Report; Texas AM University: College Station, TX, USA, 1974. [Google Scholar]
- De Rosnay, P.; Calvet, J.-C.; Kerr, Y.; Wigneron, J.-P.; Lemaître, F.; Escorihuela, M.J.; Sabater, J.M.; Saleh, K.; Barrié, J.; Bouhours, G. SMOSREX: A long term field campaign experiment for soil moisture and land surface processes remote sensing. Remote Sens. Environ. 2006, 102, 377–389. [Google Scholar] [CrossRef]
- Gao, S.; Niu, Z.; Huang, N.; Hou, X. Estimating the Leaf Area Index, height and biomass of maize using HJ-1 and RADARSAT-2. Int. J. Appl. Earth Obs. 2013, 24, 1–8. [Google Scholar] [CrossRef]
- Hansen, P.M.; Schjoerring, J.K. Reflectance measurement of canopy biomass and nitrogen status in wheat crops using normalized difference vegetation indices and partial least squares regression. Remote Sens. Environ. 2003, 86, 542–553. [Google Scholar] [CrossRef]
- Lu, L.; Li, X.; Huang, C.L.; Ma, M.G.; Che, T.; Bogaert, J.; Veroustraete, F.; Dong, Q.H.; Ceulemans, R. Investigating the relationship between ground-measured LAI and vegetation indices in an alpine meadow, north-west China. Int. J. Remote Sens. 2005, 26, 4471–4484. [Google Scholar] [CrossRef]
- Huete, A.; Didan, K.; Miura, T.; Rodriguez, E.P.; Gao, X.; Ferreira, L.G. Overview of the radiometric and biophysical performance of the MODIS vegetation indices. Remote Sens. Environ. 2002, 83, 195–213. [Google Scholar] [CrossRef]
- Xiao, X.M.; Boles, S.; Liu, J.Y.; Zhuang, D.F.; Frolking, S.; Li, C.S.; Salas, W.; Moore, B., III. Mapping paddy rice agriculture in southern China using multi-temporal MODIS images. Remote Sens. Environ. 2005, 95, 480–492. [Google Scholar] [CrossRef]
- Jiang, Z.Y.; Huete, A.R.; Didan, K.; Miura, T. Development of a two-band enhanced vegetation index without a blue band. Remote Sens. Environ. 2008, 112, 3833–3845. [Google Scholar] [CrossRef]
- Kim, Y.; Miura, T.; Jiang, Z.; Huete, A.R. Spectral compatibility of vegetation indices across sensors: band decomposition analysis with Hyperion data. J. Appl. Remote Sens. 2010, 4. [Google Scholar] [CrossRef]
- DeFries, R.S.; Townshend, J. NDVI-derived land cover classifications on a global scale. Int. J. Remote Sens. 1994, 15, 3567–3586. [Google Scholar] [CrossRef]
- Hubert-Moy, L.; Cotonnec, A.; Le Du, L.; Chardin, A.; Perez, P. A comparison of parametric classification procedures of remotely sensed data applied on different landscape units. Remote Sens. Environ. 2001, 75, 174–187. [Google Scholar] [CrossRef]
- Yang, C.H.; Everitt, J.H.; Murden, D. Evaluating high resolution SPOT 5 satellite imagery for crop identification. Comput. Electron. Agr. 2011, 75, 347–354. [Google Scholar] [CrossRef]
- Chen, C.F.; Son, N.T.; Chen, C.R.; Chang, L.Y. Wavelet filtering of time-series moderate resolution imaging spectroradiometer data for rice crop mapping using support vector machines and maximum likelihood classifier. J. Appl. Remote Sens. 2011, 5. [Google Scholar] [CrossRef]
- Foody, G.M.; Mathur, A. Toward intelligent training of supervised image classifications: directing training data acquisition for SVM classification. Remote Sens. Environ. 2004, 93, 107–117. [Google Scholar] [CrossRef]
- Mountrakis, G.; Im, J.; Ogole, C. Support vector machines in remote sensing: A review. ISPRS J. Photogramm. Remote Sens. 2011, 66, 247–259. [Google Scholar] [CrossRef]
- Rao, T.V. Supervised classification of remote sensed data using support vector machine. Glob. J. Comput. Sci. Technol. 2014, 14, 71–76. [Google Scholar]
- Xu, H.W.; Wang, K. Regionalization for rice yield estimation by remote sensing in Zhejiang Province. Pedosphere 2001, 11, 175–184. [Google Scholar]
- Lobo, A.; Chic, O.; Casterad, A. Classification of Mediterranean crops with multisensor data: per-pixel versus per-object statistics and image segmentation. Int. J. Remote Sens. 1996, 17, 2385–2400. [Google Scholar] [CrossRef]
- Panigrahy, S.; Parihar, J.S.; Patel, N.K. Kharif rice acreage estimation in Orissa using NOAA-AVHRR data. J. Indian Soc. Remote Sens. 1992, 20, 35–42. [Google Scholar] [CrossRef]
- Congalton, R.G. A Review of Assessing the Accuracy of Classifications of Remotely Sensed Data. Remote Sens. Environ. 1991, 37, 35–46. [Google Scholar] [CrossRef]
- Wardlow, B.D.; Egbert, S.L.; Kastens, J.H. Analysis of time-series MODIS 250 m vegetation index data for crop classification in the US Central Great Plains. Remote Sens. Environ. 2007, 108, 290–310. [Google Scholar] [CrossRef]
- Pan, Z.; Huang, J.; Zhou, Q.; Wang, L.; Cheng, Y.; Zhang, H.; Blackburn, G.A.; Yan, J.; Liu, J. Mapping crop phenology using NDVI time-series derived from HJ-1 A/B data. Int. J. Appl. Earth Obs. 2015, 34, 188–197. [Google Scholar] [CrossRef]
- Sakamoto, T.; Wardlow, B.D.; Gitelson, A.A.; Verma, S.B.; Suyker, A.E.; Arkebauer, T.J. A Two-Step Filtering approach for detecting maize and soybean phenology with time-series MODIS data. Remote Sens. Environ. 2010, 114, 2146–2159. [Google Scholar] [CrossRef]
- Cong, N.; Piao, S.; Chen, A.; Wang, X.; Lin, X.; Chen, S.; Han, S.; Zhou, G.; Zhang, X. Spring vegetation green-up date in China inferred from SPOT NDVI data: A multiple model analysis. Agr. Forest Meteorol. 2012, 165, 104–113. [Google Scholar] [CrossRef]
- Hird, J.N.; McDermid, G.J. Noise reduction of NDVI time series: An empirical comparison of selected techniques. Remote Sens. Environ. 2009, 113, 248–258. [Google Scholar] [CrossRef]
- Jönsson, P.; Eklundh, L. TIMESAT—A program for analyzing time-series of satellite sensor data. Comput. Geosci. 2004, 30, 833–845. [Google Scholar] [CrossRef]
- Li, A.N.; Jiang, J.G.; Bian, J.H.; Deng, W. Combining the matter element model with the associated function of probability transformation for multi-source remote sensing data classification in mountainous regions. ISPRS J. Photogramm. Remote Sens. 2012, 67, 80–92. [Google Scholar] [CrossRef]
- Voisin, A.; Krylov, V.A.; Moser, G.; Serpico, S.B.; Zerubia, J. Supervised classification of multisensor and multiresolution remote sensing images with a hierarchical copula-based approach. IEEE Trans. Geosci. Remote Sens. 2013, 52, 3346–3358. [Google Scholar] [CrossRef]
- Zhang, D.X.; Zhang, C.R.; Li, W.D.; Cromley, R.; Hanink, D.; Civco, D.; Travis, D. Restoration of the missing pixel information caused by contrails in multispectral remotely sensed imagery. J. Appl. Remote Sens. 2014, 8. [Google Scholar] [CrossRef]
- Hu, L.H.; Yu, Z.F.; Liu, Y.F. An algorithm of decision-tree generating automatically based on classification. In Proceedings of the First International Workshop on Education Technology and Computer Science, Wuhan, China, 7–8 March 2009; Vol. I, pp. 823–827.
- Jonsson, P.; Eklundh, L. Seasonality extraction by function fitting to time-series of satellite sensor data. IEEE Trans. Geosci. Remote Sens. 2002, 40, 1824–1832. [Google Scholar] [CrossRef]
- Sakamoto, T.; Yokozawa, M.; Toritani, H.; Shibayama, M.; Ishitsuka, N.; Ohno, H. A crop phenology detection method using time-series MODIS data. Remote Sens. Environ. 2005, 96, 366–374. [Google Scholar] [CrossRef]
- Otukei, J.R.; Blaschke, T. Land cover change assessment using decision trees, support vector machines and maximum likelihood classification algorithms. Int. J. Appl. Earth Obs. 2010, 12S, S27–S31. [Google Scholar] [CrossRef]
- Li, X.; Lu, L.; Cheng, G.D.; Xiao, H.L. Quantifying landscape structure of the Heihe River Basin, north-west China using FRAGSTATS. J. Arid Environ. 2001, 48, 521–535. [Google Scholar] [CrossRef]
- Murthy, C.S.; Raju, P.V.; Badrinath, K. Classification of wheat crop with multi-temporal images: performance of maximum likelihood and artificial neural networks. Int. J. Remote Sens. 2003, 24, 4871–4890. [Google Scholar] [CrossRef]
- Shao, Y.; Fan, X.T.; Liu, H.; Xiao, J.H.; Ross, S.; Brisco, B.; Brown, R.; Staples, G. Rice monitoring and production estimation using multitemporal RADARSAT. Remote Sens. Environ. 2001, 76, 310–325. [Google Scholar] [CrossRef]
- Han, H.B.; Ma, M.B.; Wang, X.F.; Ma, S.C. Classifying cropping area of middle Heihe River Basin in China using multitemporal Normalized Difference Vegetation Index data. J. Appl. Remote Sens. 2014, 8. [Google Scholar] [CrossRef]
- Nuarsa, I.W.; Nishio, F.; Hongo, C.; Mahardika, I.G. Using variance analysis of multitemporal MODIS images for rice field mapping in Bali Province, Indonesia. Int. J. Remote Sens. 2012, 33, 5402–5417. [Google Scholar] [CrossRef]
- Mannel, S.; Price, M.; Hua, D. Impact of reference datasets and autocorrelation on classification accuracy. Int. J. Remote Sens. 2011, 32, 5321–5330. [Google Scholar] [CrossRef]
- Friedl, M.A.; Woodcock, C.; Gopal, S.; Muchoney, D.; Strahler, A.H.; Barker-Schaaf, C. A note on procedures used for accuracy assessment in land cover maps derived from AVHRR data. Int. J. Remote Sens. 2000, 21, 1073–1077. [Google Scholar] [CrossRef]
- Mannel, S.; Price, M.; Hua, D. A method to obtain large quantities of reference data. Int. J. Remote Sens. 2006, 27, 623–627. [Google Scholar] [CrossRef]
© 2015 by the authors; licensee MDPI, Basel, Switzerland. This article is an open access article distributed under the terms and conditions of the Creative Commons Attribution license (http://creativecommons.org/licenses/by/4.0/).
Share and Cite
Wang, J.; Huang, J.; Zhang, K.; Li, X.; She, B.; Wei, C.; Gao, J.; Song, X. Rice Fields Mapping in Fragmented Area Using Multi-Temporal HJ-1A/B CCD Images. Remote Sens. 2015, 7, 3467-3488. https://doi.org/10.3390/rs70403467
Wang J, Huang J, Zhang K, Li X, She B, Wei C, Gao J, Song X. Rice Fields Mapping in Fragmented Area Using Multi-Temporal HJ-1A/B CCD Images. Remote Sensing. 2015; 7(4):3467-3488. https://doi.org/10.3390/rs70403467
Chicago/Turabian StyleWang, Jing, Jingfeng Huang, Kangyu Zhang, Xinxing Li, Bao She, Chuanwen Wei, Jian Gao, and Xiaodong Song. 2015. "Rice Fields Mapping in Fragmented Area Using Multi-Temporal HJ-1A/B CCD Images" Remote Sensing 7, no. 4: 3467-3488. https://doi.org/10.3390/rs70403467
APA StyleWang, J., Huang, J., Zhang, K., Li, X., She, B., Wei, C., Gao, J., & Song, X. (2015). Rice Fields Mapping in Fragmented Area Using Multi-Temporal HJ-1A/B CCD Images. Remote Sensing, 7(4), 3467-3488. https://doi.org/10.3390/rs70403467