Review

Building Extraction from Airborne Laser Scanning Data: An Analysis of the State of the Art

1
Department of Geoinformatics (Z_GIS), University of Salzburg, Schillerstrasse 30, Salzburg 5020, Austria
2
Institute of Geography, Chair of GIScience, Heidelberg University, Heidelberg 69120, Germany
*
Author to whom correspondence should be addressed.
Remote Sens. 2015, 7(4), 3826-3862; https://doi.org/10.3390/rs70403826
Submission received: 12 January 2015 / Revised: 3 March 2015 / Accepted: 23 March 2015 / Published: 31 March 2015

Abstract

:
This article provides an overview of building extraction approaches applied to Airborne Laser Scanning (ALS) data by examining elements used in original publications, such as data set area, accuracy measures, reference data for accuracy assessment, and the use of auxiliary data. We succinctly analyzed the most cited publication for each year between 1998 and 2014, resulting in 54 ISI-indexed articles and 14 non-ISI indexed publications. Based on this, we position some built-in features of ALS to create a comprehensive picture of the state of the art and the progress through the years. Our analyses revealed trends and remaining challenges that impact the community. The results show remaining deficiencies, such as inconsistent accuracy assessment measures, limitations of independent reference data sources for accuracy assessment, relatively few documented applications of the methods to wide area data sets, and the lack of transferability studies and measures. Finally, we predict some future trends and identify some gaps which existing approaches may not exhaustively cover. Despite these deficiencies, this comprehensive literature analysis demonstrates that ALS data is certainly a valuable source of spatial information for building extraction. When taking into account the short civilian history of ALS one can conclude that ALS has become well established in the scientific community and seems to become indispensable in many application fields.

Graphical Abstract

1. Introduction

3D geoinformation plays a major role in today’s society. It contains high information potential, which could be used towards a variety of application fields in private and public sectors. Based on [1], overlooking the already well-known applications in the fields of architecture, urban and transport planning, surveying and mobile telecommunications, 3D models have become increasingly important in the field of city and regional marketing (tourism, telematics, civil protection, real estate management, and financial management). One of the technologies that can help us with the massive 3D data collection task fast is that of the Airborne Laser Scanning (ALS). In order to generate tangible and useful data from ALS point clouds, a series of methods need to be applied to the data source (ALS point cloud). Final derivatives from collected data include Digital Elevation Models (DEM), extracted man-made features (buildings, power lines, roads) and natural features (vegetation mask, single trees, vertical tree structures). In our paper we focus on methods for the extraction of buildings from ALS data.

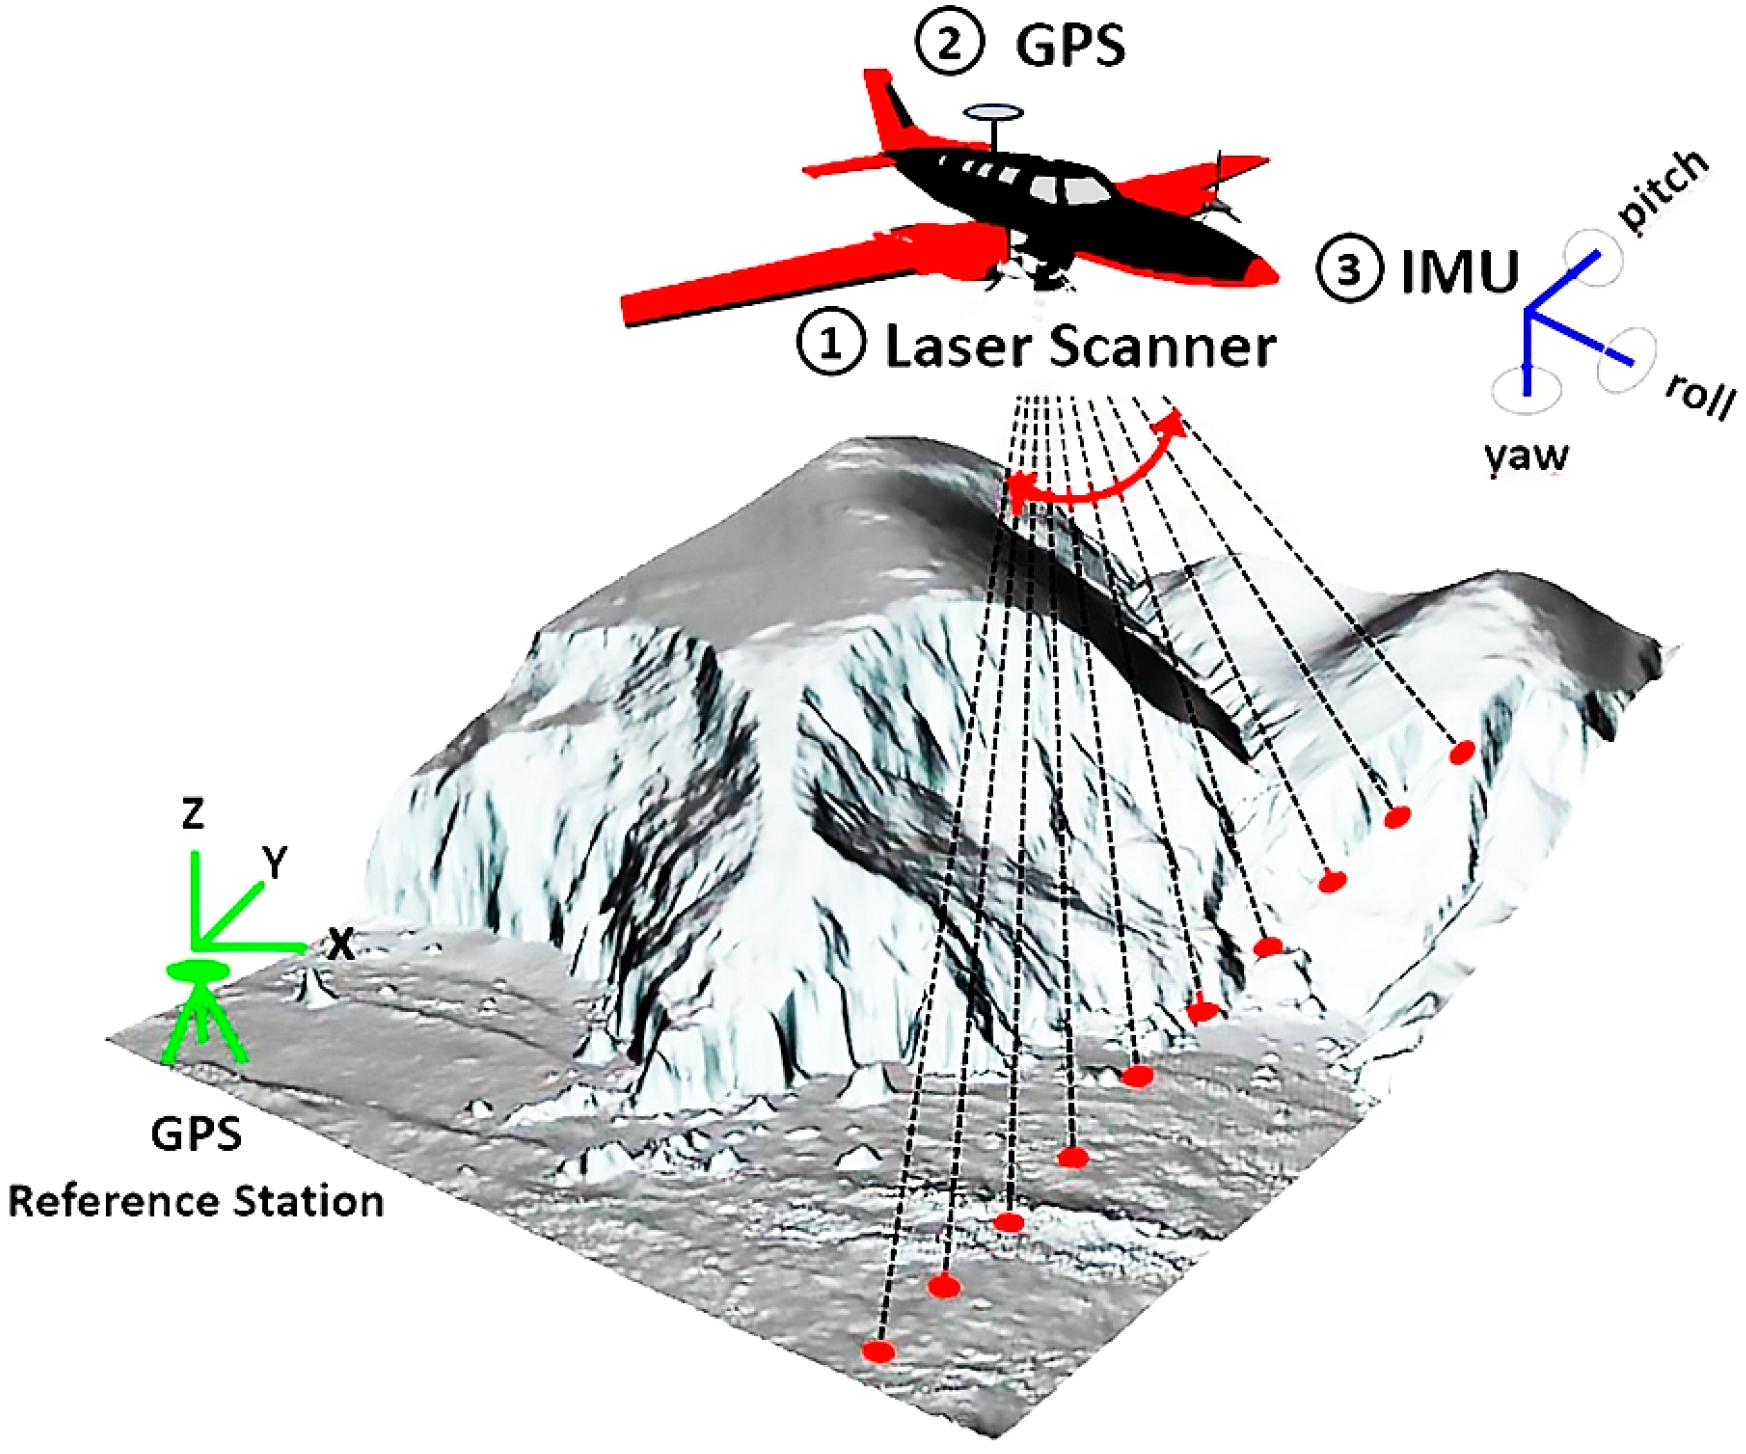
1.1. Short Overview of Airborne Laser Scanning

ALS is an active system that consists of more than one sensor used for positioning (Figure 1 [2]). ALS provides laser-based measurements of the distance between an aircraft carrying the platform and the ground [3]. The system delivers a 3D point cloud as a representation of the scanned surface from under 1 point per square meter (ppsm) upwards. One of the main strengths of ALS systems lies in the fact that the signal is able to penetrate the small gaps in vegetation and other semi-transparent objects on the terrain surface. This provides us with additional information about the physical properties of the object that has been scanned. In this paper we will focus only on the building extraction processes based on ALS obtained point clouds and, in some cases, fusion of ALS data with other data sources.
Figure 1. Basic principle of spatial positioning for ALS system (modified from [2]).
Remotesensing 07 03826 g001
Vosselman et al. [3] identify that ALS technology, as such, has many characteristics including (a) a very high speed data collection for large areas with each data point having three-dimensional positional information and signal backscatter information (e.g., signal intensity, or signal amplitude and echo width for full-waveform ALS systems [4,5]); (b) a high degree of spatial coverage which allows the use of the data at a later stage in order to look for other features which may have initially been missed in the field and accurate spatial data can be easily collected; (c) ALS elevation data are “directly measured”, the height of the terrain/man-made features are represented and not, like in case of imagery, reflectance values which are highly dependent on the area/atmosphere/weather; (d) multiple returns per laser shot from the ALS data are used as a great source of information in vegetated areas and subsequently in many forestry applications. Multiple returns can also provide us with insight into the vertical forest structure and complexity [6]. Many newer approaches use full-waveform measurements since they provide much better source of information. Three-dimensional coordinates of the laser beam reflections, the intensity, and the pulse width are extracted by a waveform decomposition, which fits a series of Gaussian pulses to the waveform. Since multiple reflections are detected, and even overlapping pulse reflections are distinguished, a much higher point density is achieved compared to the conventional discreet returns [7].
The primary product of ALS is a point cloud or more generally speaking as irregularly distributed points in 3D space [8]. Initially, 3D points are geometric features but do not have a meaning per se. The point cloud on its own does not represent a well-organized structure of separable and clearly delineated objects—it is simply a group of points fixed in an internal or real-world coordinate system. In some cases the original point cloud, which represents the 3D environment, can be presented as a 2D or a 2.5D structure (slope map vs. elevation map).

1.2. Problem Definition and Added Value of This Review Paper

To extract knowledge from a data source we need to structure the representation. This requires that points need to be assigned to a target object/class, which does not need to be homogenous in a strict sense (edge based segmentation does not cluster homogenous areas). Further, model based approaches in which a certain developed model is fitted into the, from the point cloud produced, result in order to find similar occurrence, do not segment but test for conformity with the template/model. ALS data analysis is time consuming and computer-intensive, depending on the data volume, which in return slows the modeling process in the chain from point to tangible data ready for use in GIS software or similar environments. Many of the approaches concentrate on domain specific solutions which range from DTM creation [9,10,11,12] and geomorphic features detection [2,13,14] to the automatic extraction of buildings [15,16,17,18,19,20,21,22,23], roads [24,25,26,27], and tree reconstruction/tree classification [6,7,28,29,30,31].
For this article the authors performed a comprehensive analysis of approaches to extracting buildings from ALS. The definition of building extraction in the literature is manifold. The authors of [16,21,32,33,34,35,36] and many other provide no explicit description for building extraction but a general mention of building, roof delineation, 3D shape extraction or 2D footprint delineation. Due to these various views on the building extraction, we identify building extraction as all of those approaches, which perform either of the following:
(a)
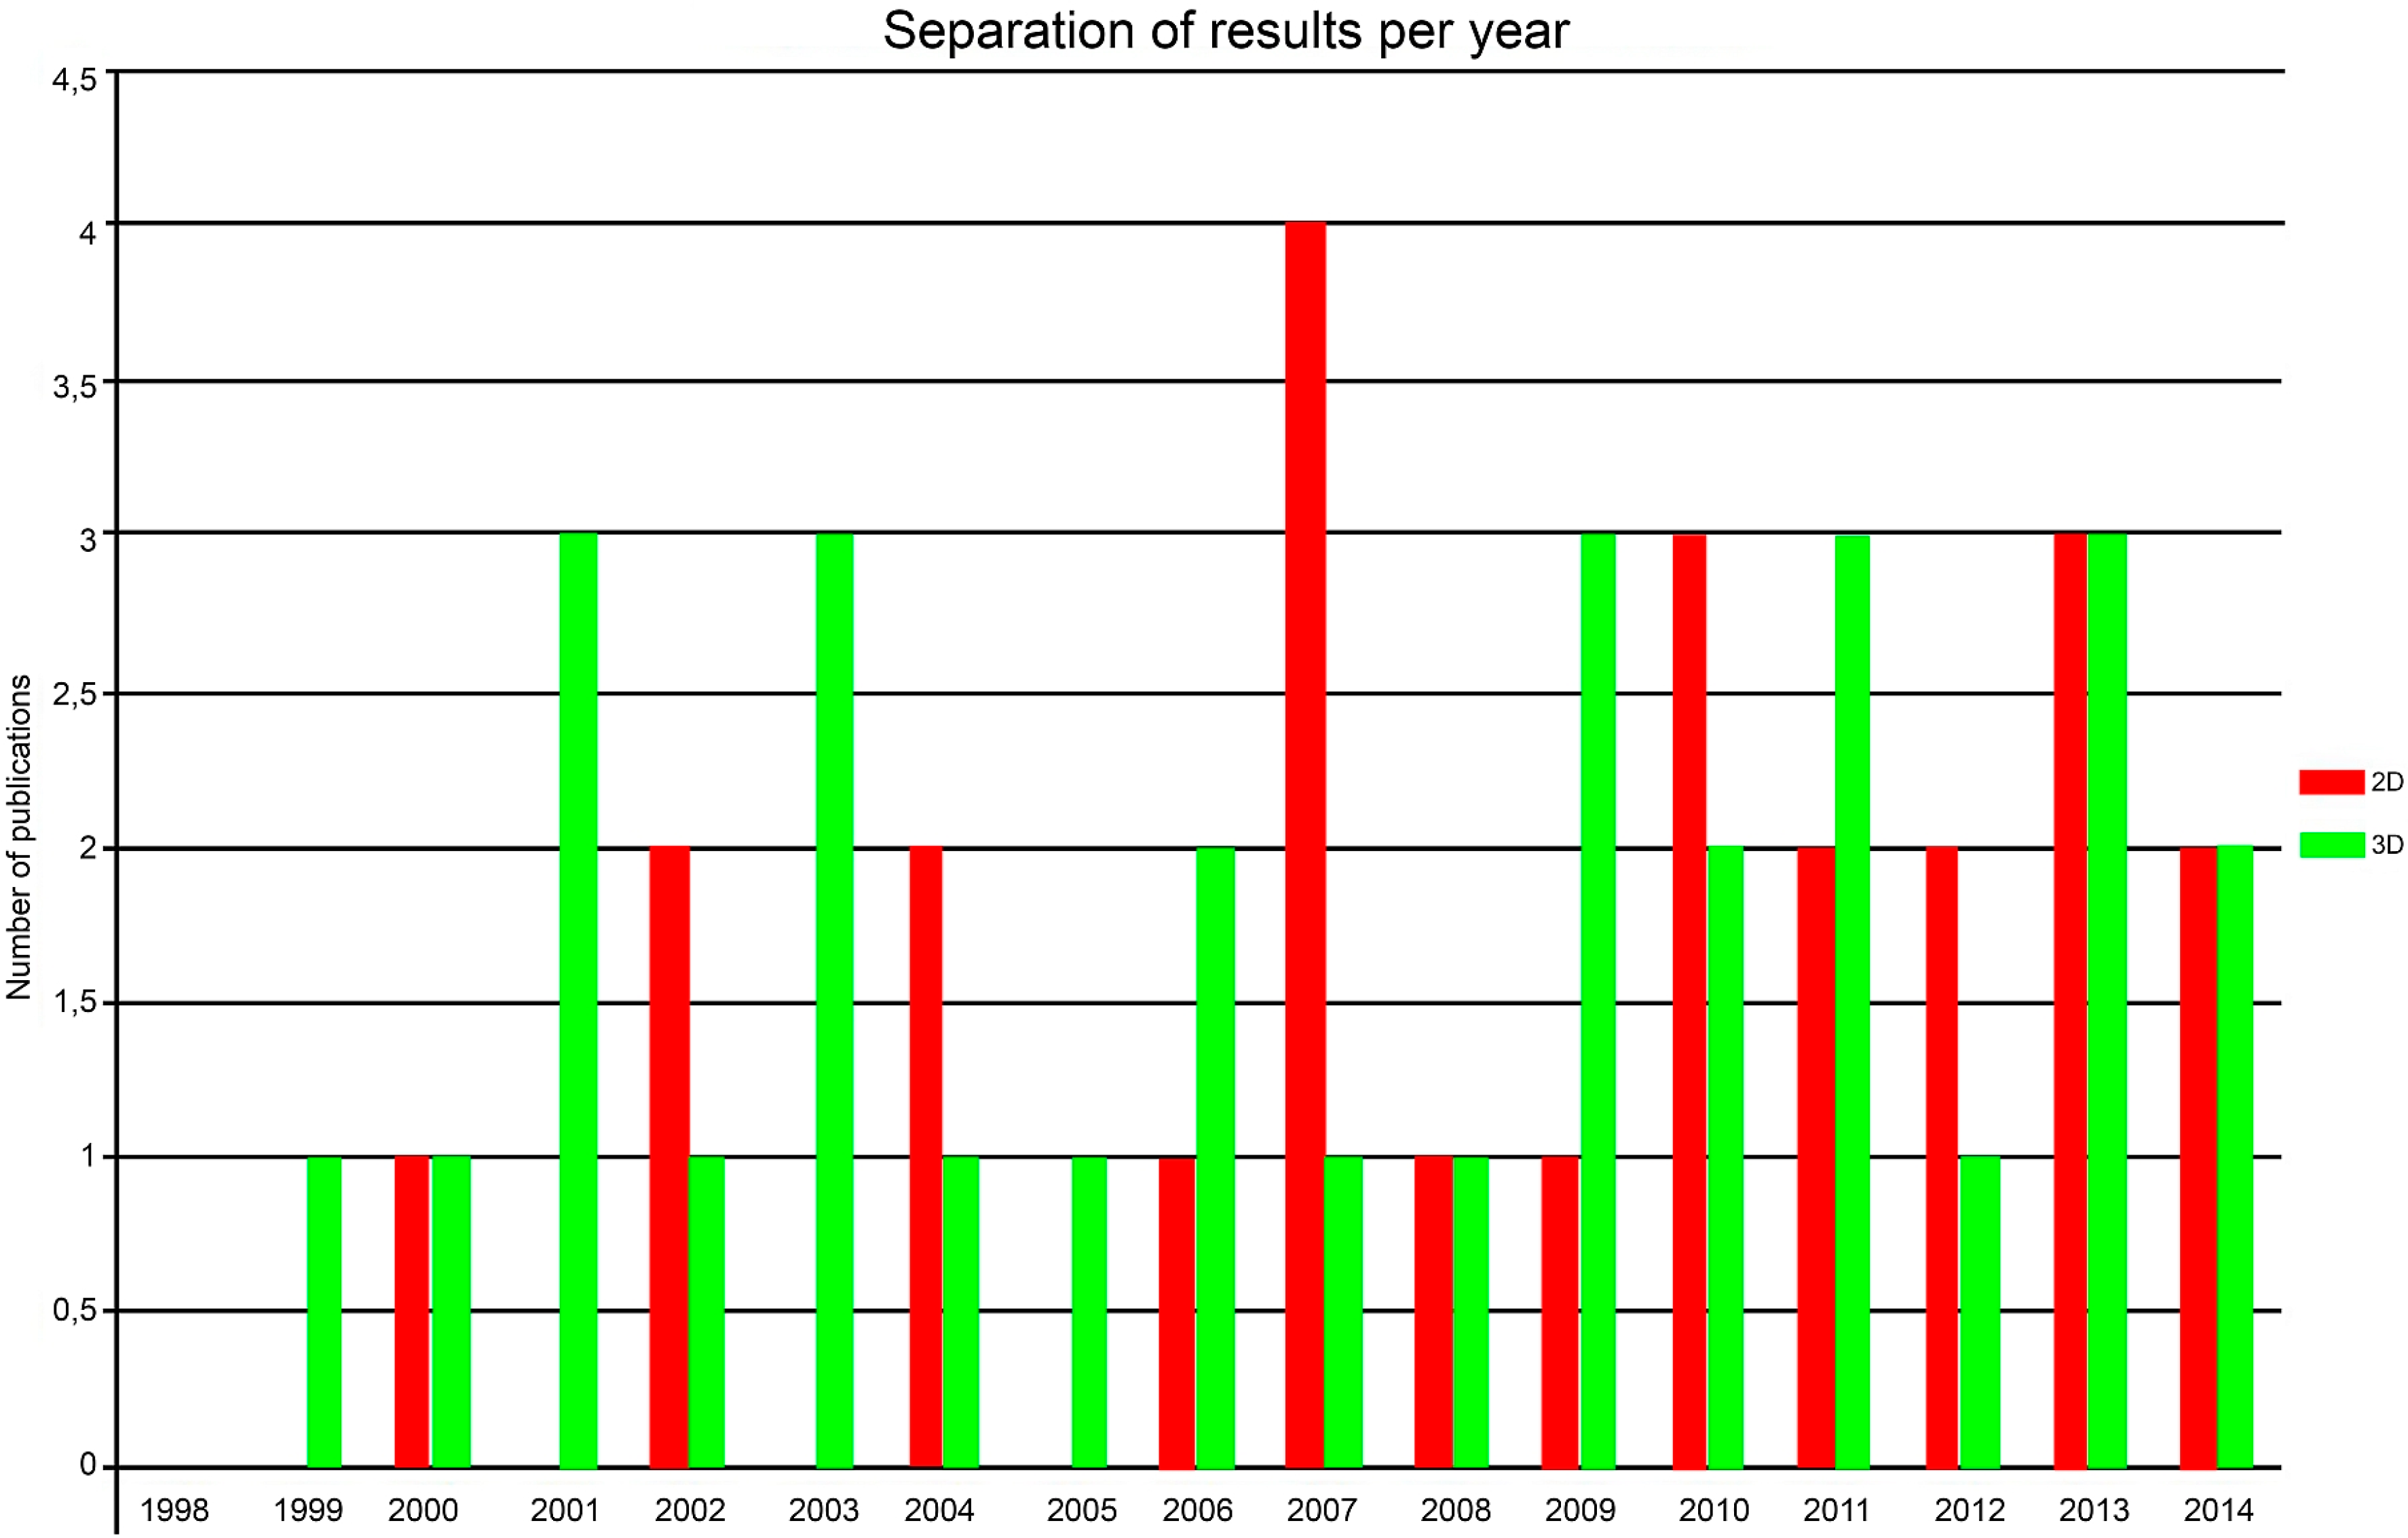
2D building polygon extraction describing the outlines of the building (roof outlines) from ALS based point cloud or fusion of ALS data with other data sources
(b)
3D model reconstruction which represent generalized, abstracted and scaled virtual representation of the real building [8] based on the ALS data only or fusion of ALS data and other data sources, or
(c)
extracted roof contours in 3D (classified point cloud, generated 3D model or delineated roof as a set of planes in 3D space) from ALS data or fusion of ALS data and other sources.
We include any of the above-mentioned forms of extraction into our review since we wish to represent a variety of approaches and solutions for the building extraction methodologies and methods and how they developed over the last decade.
Based on the insights from an initial screening of the ALS processing literature with a much wider scope, this paper outlines (a) the level of automation that can be reached in building extraction from ALS data; (b) the transferability of reviewed approaches; (c) the data set applicability with special interest in the size (area) of the data set; (d) various measures used in order to perform accuracy assessment along with the achieved values; (e) spatial dimension of the final result (2D vs. 3D generated output); (f) overview of grey literature (i.e., not ISI indexed, mainly conference proceedings) as an additional source of information (g) basic bibliometrics on the collected data; (h) use of auxiliary data along with ALS data, and finally; (i) a descriptive table with a summarized outline of all valued approaches from 1998 to 2014 (Table 3).
This review paper provides a comprehensive overview of existing approaches to building extraction from ALS data and additional data sources (imagery) used in combination with ALS data. We combine descriptions of methods used for building extraction along with the analysis of the data set size, achieved accuracies and use of additional sources used in combination with ALS data. This allows us to obtain insight into the current state-of-the art and to recognize some of the weak and strong points in today’s research, thus opening the possibility to predict future trends.
The paper is organized as follows: after the introductory part, Section 2 will define the selection method used in order to select papers for review and provide basic analysis of gathered results. Section 3 gives an in-depth analysis of several aspects relating to ALS data including the ALS data extraction approaches, data set morphological variability, diversity of extracted objects in regards to the spatial dimension (2D, 3D), obtained accuracies and an overview of types of processed signal (photon counting, discrete returns or full waveform pulses) that can be observed when working with ALS platforms. Section 4 will be based on the discussion about observed trends and problems along with future trend predictions. Finally, the concluding section summarizes the key aspects identified in the review process.

2. Paper Selection Process and Overview of Search Results

Our literature research provides an overview of state-of-the art for building extraction processes for a period from 1998 to July 2014. We begin by performing a selection of papers based on a set of predefined search strings. After the selection process is performed (as described in detail within the following text), we begin to describe methods based on what the publication authors reported on their own. The next step involves analysis of other features we mentioned in the previous section and it is all followed by discussion part, which involves prediction of future trends.

2.1. Analysis of Peer-Reviewed Literature

In order to perform a selection of publications that would be included into our analysis, a number of selection criteria were defined. The selection process was conducted by performing a search based on a combination of specific terms (Table 1) within the Web of Science (WoS) [37] and Scopus [38] environments. The WoS search was limited to only publication titles and concerned only peer reviewed journal papers. The Scopus search had a broader search environment (book chapters, conference proceedings, journal articles, etc.) and allowed for searches to be performed over publication title, keywords and abstracts. Our search included everything published between 1998 and July 2014.
Search and selection criteria for journal papers were based on three rules:
(a)
Papers were selected based on citation count with a lower limit set at three citations
(b)
In case of more recent publications (published between 2013 and 2014) we opted for those with lower citation level than previous limit (three citations) and from higher ranked journals since they perform—in theory—a more strict review processes, and
(c)
We tried to avoid conference proceedings that are not peer reviewed and can be considered as grey literature (for publications published between 2013 and 2014).
Table 1. Search term used within Web of Science (WoS) and Scopus.
OperatorSearch TermSearch location WoS/Scopus
Building* extraction* (LiDAR OR ALS)Title/Title, Abstract, Keywords
ORBuilding* extraction* Airborne Laser ScanningTitle/Title, Abstract, Keywords
ORBuilding* detection* (LiDAR OR ALS)Title/Title, Abstract, Keywords
ORBuilding* (LiDAR OR Airborne Laser Scanning)Title/Title, Abstract, Keywords
ORBuilding* delineation* from (LiDAR* OR Airborne Laser Scanning*)Title/Title, Abstract, Keywords
ORBuilding* LiDAR*Title/Title, Abstract, Keywords
ORBuilding* Airborne* Laser* Scanning*Title/Title, Abstract, Keywords
ORBuilding* reconstruction* from (LiDAR* OR Airborne laser scanning)Title/Title, Abstract, Keywords
ORBuilding* reconstruction* from point* cloud*Title/Title, Abstract, Keywords
ORRoof* Delineation* from (LiDAR OR Airborne Laser Scanning)Title/Title, Abstract, Keywords
ORRoof* Extraction* from (LiDAR OR Airborne Laser Scanning)Title/Title, Abstract, Keywords
ORRoof* Delineation* from Point* Cloud*Title/Title, Abstract, Keywords
Timespan: 1998–2014/Last time query was used: July 2014
These search criteria yielded 170 results for WoS and 1389 results for the Scopus search (both searches performed in July 2014). Figure 2 shows the distribution of the results for all publication outlets with 10 or more hits (top 22 results). One can see that the majority of publications are published within Proceedings of SPIE the International Society of Optical Engineering. From Figure 2 we can observe that the top five publication sources, based on the Scopus statistics, are (where n = number of publications related to topic and h = Hirsch index of the respective journal based on Scopus):
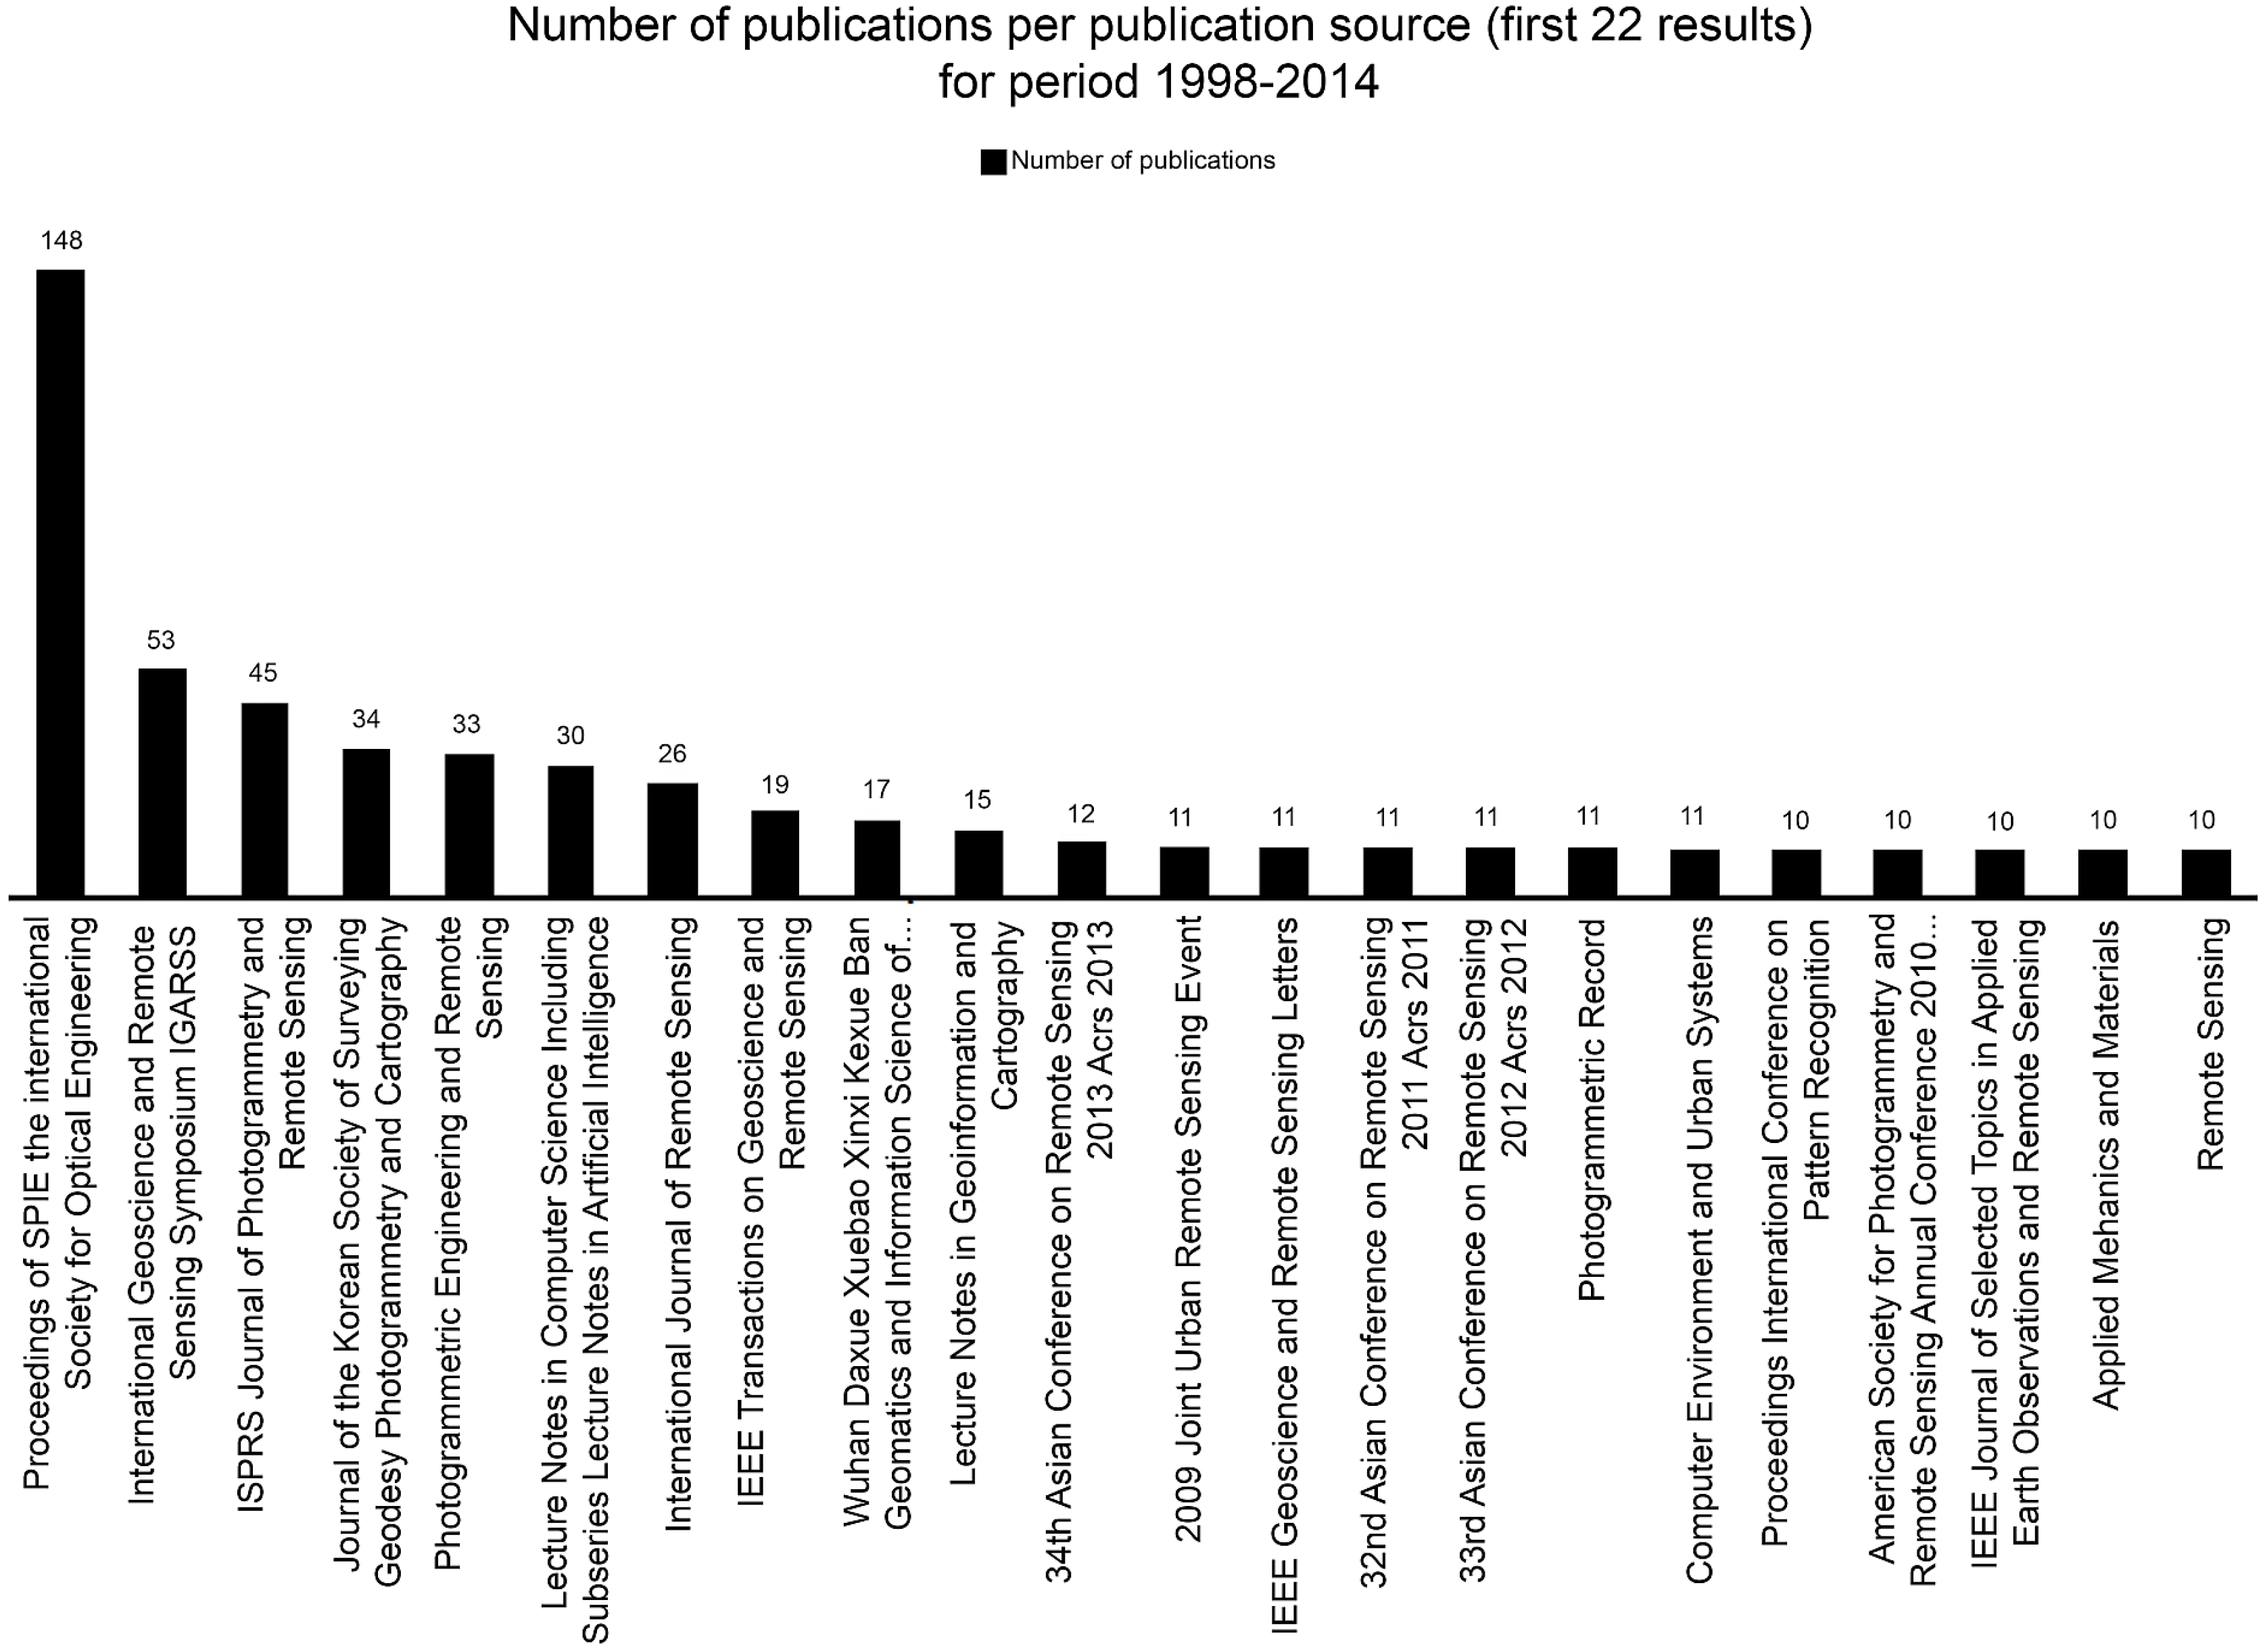
  • Proceedings of SPIE the International Society for Optical Engineering (n = 148, h = 96)
  • International Geoscience and Remote Sensing Symposium IGRASS (n = 53, h = 31)
  • ISPRS Journal of Photogrammetry and Remote Sensing (n = 45, h = 62)
  • Journal of the Korean Society of Surveying Geodesy Photogrammetry and Cartography (n = 34, h = 3).
  • Photogrammetric Engineering and Remote Sensing (n = 33, h = 78).
Figure 2. Number of publications per publishing source for period from 1998 to 2014 (first 22 results). Source: Scopus, July 2014.
Remotesensing 07 03826 g002
Figure 3 provides insight into publication types and Figure 4 depicts the number of topic related publications per author (top 26 authors). Figure 3 shows that conference proceedings yielded about half of total number (689) of all Scopus hits (1389) while journal publications yielded 584 publications. The remainder is split between conference reviews, reviews, and articles in press, book chapters, short surveys, notes, abstract reports, etc.
Figure 3. Number of publications per type of publication for period from 1998 to 2014 (source: Scopus, July 2014).
Remotesensing 07 03826 g003
Figure 4. Number of topic related publications per author for period from 1998 to 2014 (top 26 authors). Source: Scopus, July 2014.
Remotesensing 07 03826 g004
When investigating the authors with most publications fulfilling the search criteria, one person (L.-Ch. Chen) stands out in terms of number of publications while the H-Indices result in a more complex picture (Figure 4). The top 10 authors based on the number of publications (n) are:
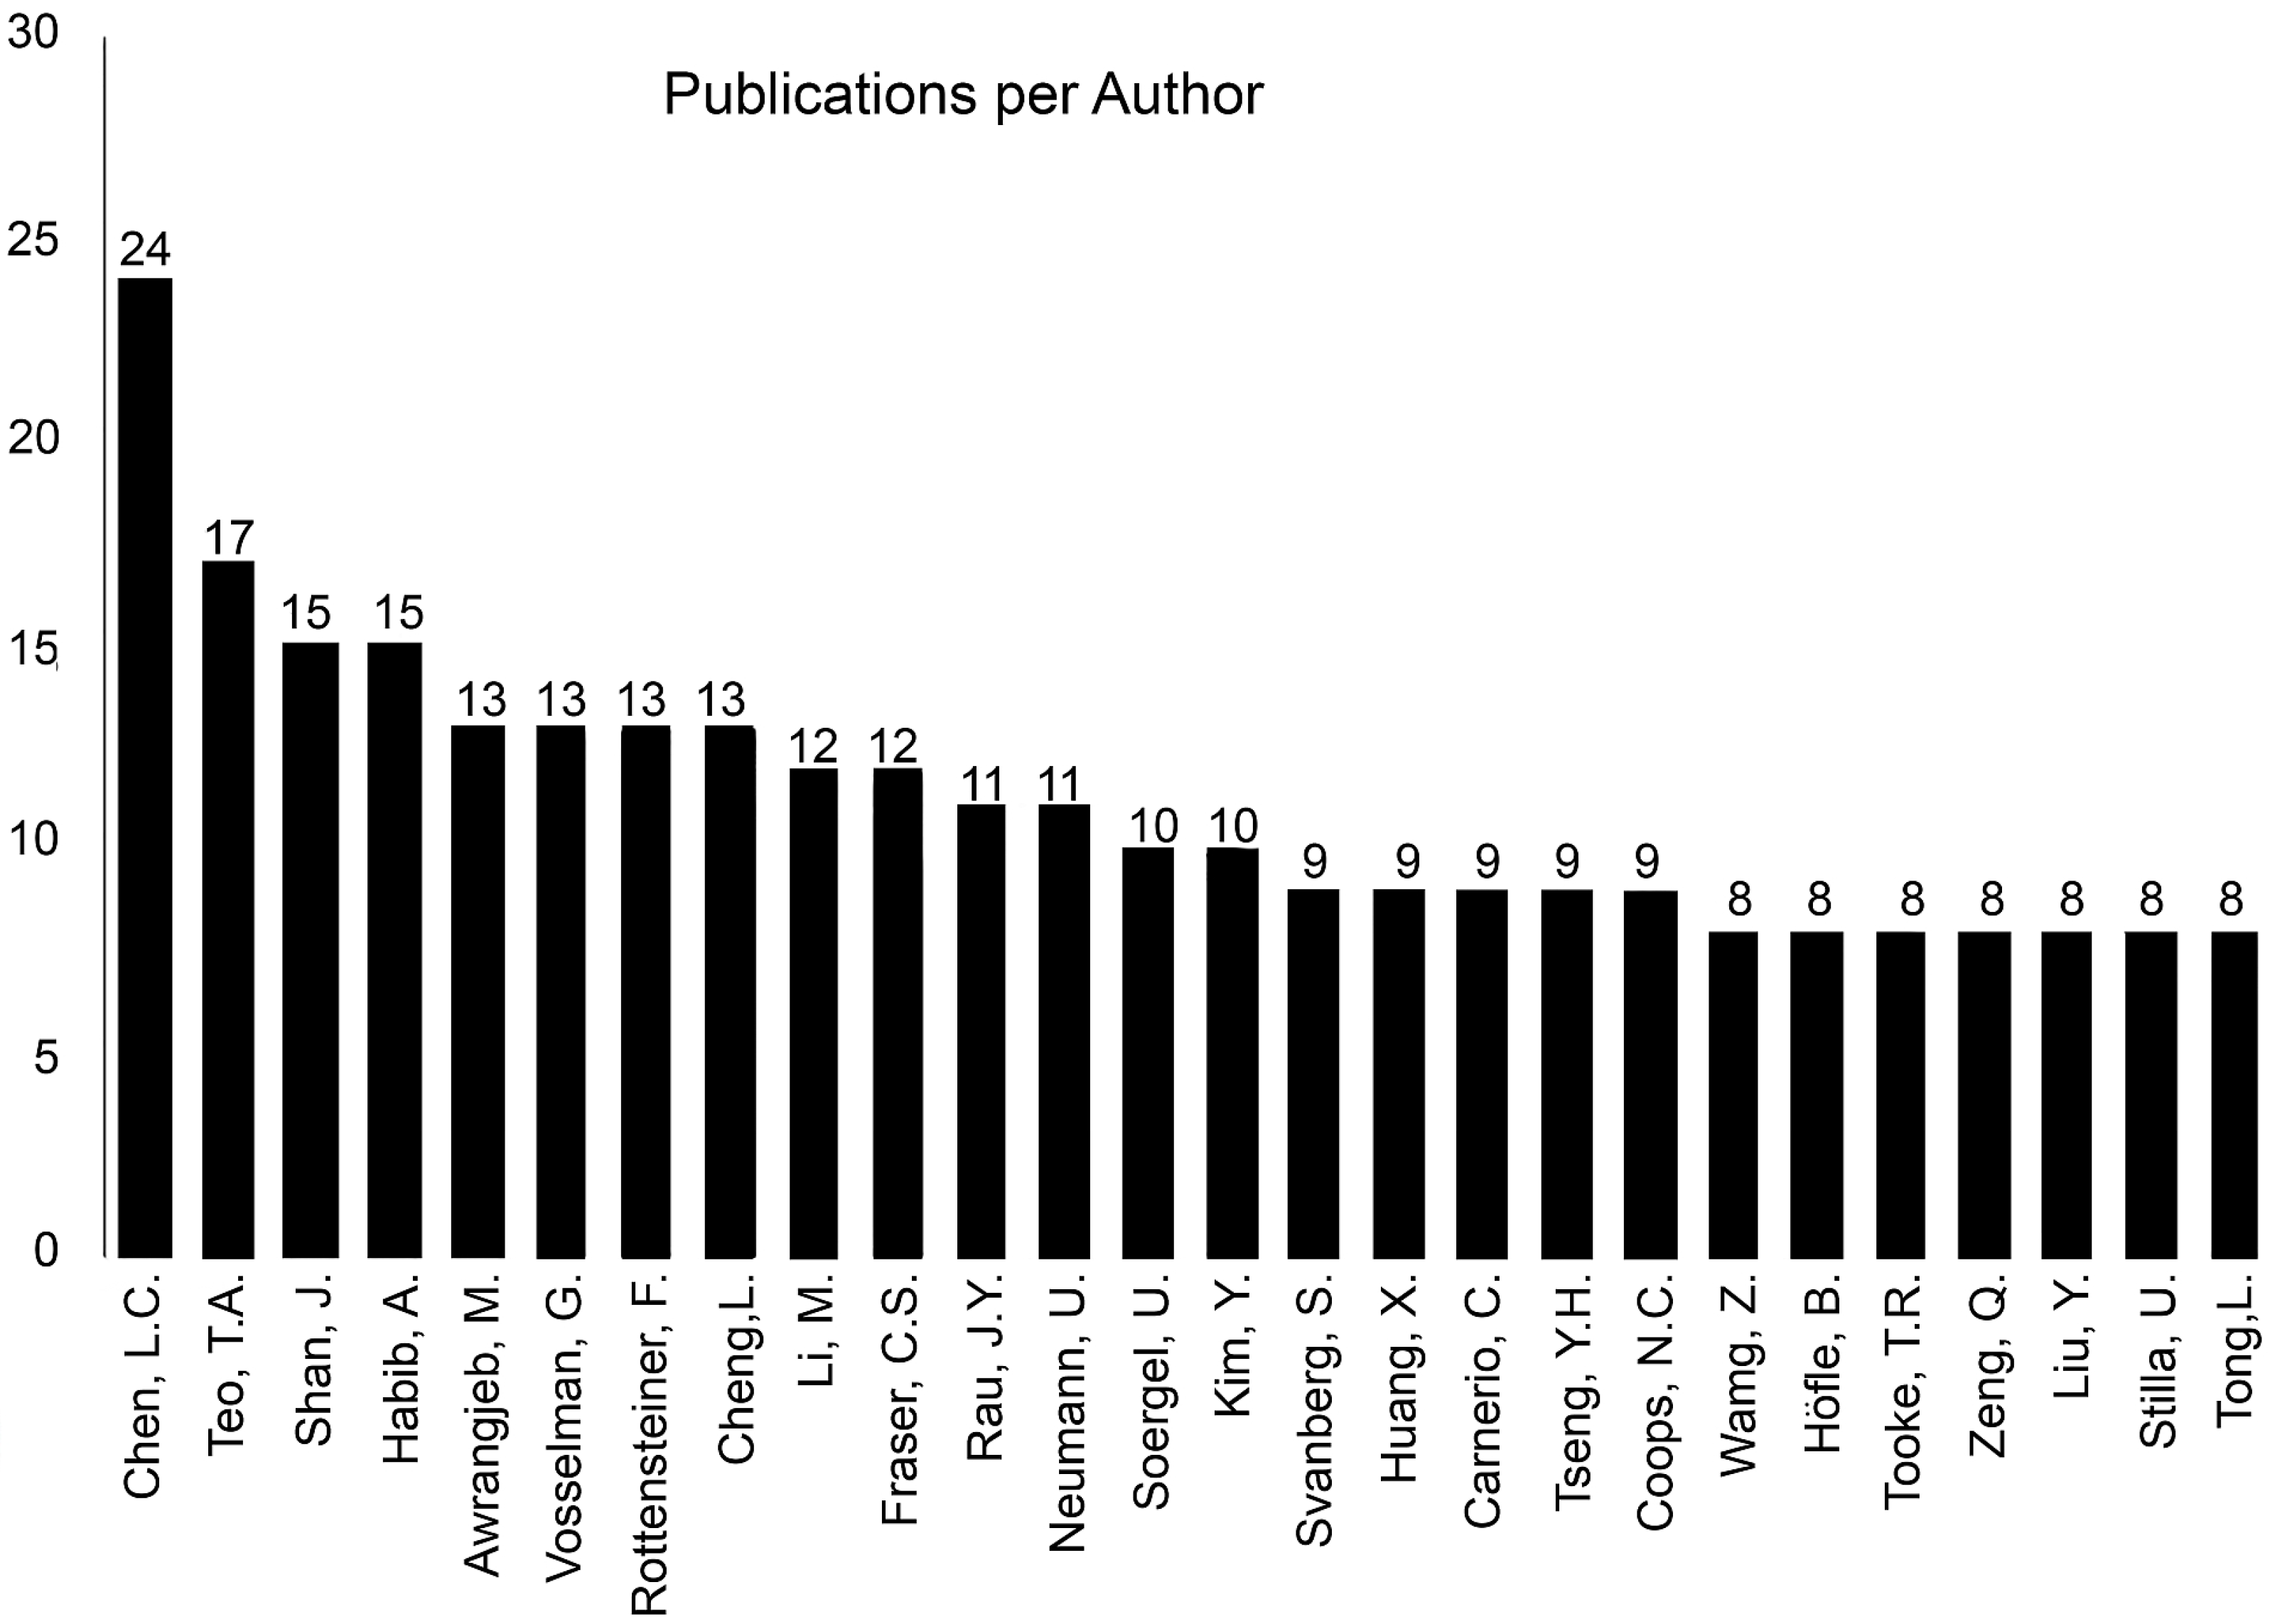
  • Liang-Chien Chen (n = 24, h = 10)
  • Tee-Ann Teo (n = 17, h = 7)
  • Jie Shan (n = 15, h = 11) and Ayman Habib (n = 15, h = 16)
  • Mohammad Awrangjeb (n = 13, h = 8), George Vosselman (n = 13, h = 16), Franz Rottensteiner (n = 13, h = 8) and Liang Cheng (n = 13, h = 5).
  • Manchun Li (n = 12, h = 7) and Clive S. Fraser (n = 12, h = 20)

2.2. Additional Analysis of Non-Indexed Literature through Google Scholar

In addition to the main search criteria performed on Web of Science and Scopus engines, we decided to perform a third, separate search on Google Scholar (GS) [39]. As the WoS search was very rigorous and covers predominantly journal papers, the additional search in Google Scholar was performed in order to investigate whether other forms of literature such as ISPRS or IEEE conferences may add additional aspects to the search results.
One intrinsic hypothesis regarding such conferences is that, particularly in technical domains, new trends or technical possibilities may eventually be mirrored faster in such publication outlets. This way, we wanted to make sure to not overlook significant (sub) topics in building extraction from ALS point clouds. In a bid to answer such question, a comprehensive literature search was conducted in GS with use of the previously described search terms adopted to the search engine provided by Google Scholar itself. The search criteria yielded 819 hits. When using the software Publish or Perish [40], 35 highly cited papers where predefined. Rather than ranking these articles by the number of citations the four authors qualitatively evaluated the abstracts and identified 14 articles as being important. These 14 articles were then analyzed based on the full texts and are very succinctly summarized at the end of the next chapter. The approaches are outlined and grouped based on a year they were published in order to paint a comprehensive picture of the research field in addition to the WoS-based discussion.

3. In-Depth Analysis of Gathered Literature

In this section, we provide an overview of building extraction methods, acquired accuracies, used datasets, and processed ALS signals. Each element will be presented in an individual subsection. The discussion on the presented elements will be formulated in the general discussion section at the end of the paper. Our selection process resulted in a total of 54 publications (Table 2), which were analyzed in detail and compiled into a table to provide an overview of the state of the art (Table 3). Selection processes were explained in the second section. Some of the selected publications do not only extract buildings but other classes in addition. In the case of such an occurrence, all analysis in this paper only takes into account the building extraction according to the above-mentioned definition.
Table 2. Overview of type of selected publications and final output classes used for extraction of data based on WoS and Scopus search results.
PublicationClasses ExtractedNumber of Publications
Conference proceedingsBuildings8
Ground/Vegetation/Man-Made1
Tree, Grass land, Bare soil, Buildings1
Journal articlesBuildings34
Ground, Tree, Roof edge, Rood ridge1
Ground/Buildings1
Roof6
Vegetation, Buildings, Art. Ground, Nat. Ground1
Buildings, Trees, Grass-covered areas1

3.1. Existing Methods for Building Extraction

There have been a vast amount (1389) of studies relating to the extraction of buildings from data obtained from ALS systems. These approaches vary from direct analysis of point cloud data [41] to analysis of interpolated grids generated from the point cloud data [17,18,42,43]. This subsection gives a brief description of a number of such studies, which are ordered chronologically. We mention the author(s) and the contribution to the field of interest plus the methods used and provided accuracy measure (where available). At the end of the section, a table (Table 3) is provided which gives an overview of the main aspects for the studies, with discussions taking place in later sections.
Table 3. List of the selected 54 ISI-indexed and 14 non ISI-indexed publications (Year: Year when the publication was published; Authors: The name/names of the author/authors; Type: Type of publication—JA (Journal Article) or CP (Conference Proceeding); Density: Density of the point cloud as reported by the author. In the case of several data sets an average value is used; Type of classes: Shows classes extracted by the described approach; ALS System: Name of the ALS system used to perform recording (if available); Additional data: Description of additional data source that was used to perform analysis; Test area: Geographic region which represents the data set, used to provide the insight into the variability of morphological features of used data sets; Area size: Size of the data set in square kilometers).
YearAuthorsPublication TypePoint Cloud DensityType of Extracted InformationALS System UsedType of Additional Data UsedData Set OriginData Set Size (km2)
2009Kim and HabibJA1.3BuildingsOptech ALTM 3100Aerial images--
2009Salah et al.JA16BuildingsOptech ALTM 1225Multi-SpectralUniversity of New South Wales campus (Sydney, Australia)<1
2010Sampath and ShanJA-Roof--Purdue University campus, Indianapolis-
2010Awranjeb et al.JA-BuildingsOptechMulti-SpectralFairfield, Australia<1
2010Matikainen et al.JA3BuildingsOptech ALTM 3100Aerial imagesEspoonlahti, Finland5
2010Kabolizade et al.JA-Buildings-Aerial imagesTaft, Iran-
2010Yu et al.JA0.44BuildingsTerra-Point LLC-Houston, USA1
2011Guo et al.JA2.5Vegetation, Building, Art. Ground, Nat. GroundRIEGL LMS Q560Multi-SpectralBiberach, Germany1
2011Elberink and VosselmanJA20Buildings--Netherlands-
2011Kim and ShanJA1RoofOptech ALTM 1210-Purdue University campus, Indianapolis-
2011Hermosilla et al.JA2BuildingsOptech ALTM 3025Aerial imagesValencia (Spain)-
2011Cheng et al.JA1Buildings-Aerial images-<1
2012Awranjeb et al.JA1Buildings-Aerial imagesAustralia: Fairfield, Moonee Ponds, Knox and Hobart<1
2012Aparecida dos Santos Galvanin and Dal PozJA2RoofLACTEC-Curitiba/Brazil10
2012Jochem et al.JA17RoofLeica ALS50-Feldkirch, Austria49
2013Sun and SalvaggioJA4Buildings--Greater Rochester, NY, USA<1
2013Liu et alJA6.7BuildingsLeica ALS50-Vaihingen, Germany-
2013Yu et al.JA6.7BuildingsLeica ALS50-“Downtown Toronto” and “Vaihingen”1.45
2013SusakiJA0.7Buildings-Aerial imagesHigashiyama ward of Kyoto, Japan<1
2013Cheng et al.JA1Buildings---4
2013Awranjeb et al.JA35Ground, Tree, Roof edge, Roof ridge-Multi-SpectralAitkevale, Queensland, Australia<1
2014Suyoung et al.JA1.02Buildings--Kyungpook National University campus in Daegu, South Korea<1
2014Kong et al.JA-Roof-Aerial images-<1
2014Niemeyer et al.JA6.7BuildingsLeica ALS50-Vaihingen, Germany-
2014Mongus et al.JA6.7Ground/Buildings--Vaihingen, Germany/Toronto Canada10
NON ISI-INDEXED ARTICLES
1998Wang and SchenkCP0.5Buildings--Airport/Place unknown-
2000Morgan and TempfliCP2-3BuildingsTopoSys-Haren/Netherlands-
2000Wang and SchenkCP0.2Buildings-Aerial images-0.4
2002Rottensteiner and BrieseCP0.1Buildings--Vienna/Austria0.1
2002Morgan and HabibCP1.5Buildings---<1
2002Elaksher and BethelCP-Buildings---<1
2003Sohn and DowmanCP0.3Buildings-IKONOS imageryGreenwich/London<1
2004Cho et al.CP0.2BuildingsOptech ALTM 1020-Chungjoo/Korea<1
2008Zhou and NeumannCP6-17Buildings--Denvor & Oakland / USA-
2008WeiCP6BuildingsOptech-Malaysia-
2008Ekhtari et al.CP9Buildings----
2008Sampath and ShanCP-----<1
2009Kada and McKinelyCP Buildings--East Berlin & Cologne>400
2009Höfle et al.CP3BuildingsOptech ALTM 2050Hohenems/Austria0.35

3.1.1. Building Extraction Methods Dealing with 3D Object Extraction

In this section we will describe the methods used within the top 15 publications (based on the previously defined selection method which is based on the top 15 cited papers) which deal with building delineation in a form of a 3D model, as described in the introduction, and 3D roof contour extraction. The two extraction methods have been merged since both deal with 3D spatial representation. In the following sub-chapter we perform the same analysis but with respect to those approaches that deal with extraction of results in 2D space (building outlines, roof outlines). The final sub-chapter discusses the most important elements of grey literature research as described in the previous section, Section 2.
The highest cited and also the oldest approach amongst the gathered research is that of [41]. In their approach the authors represented two techniques for the determination of building models from ALS data. Both deal with the original laser scanner data points. Additional data, such as ground plan information (cadastral data, OSM), may be used if available to initially segment the building region but this approach has a downfall of roof being usually larger than the building outlines. Additional segmentation approaches includes analysis of local maxima and region histogram to determine the building prototype or using reflectance for initial point cloud segmentation, but is not required in order to perform processing of the point cloud. They provided insight into 3D building extraction and in addition, they present closed solutions for the determination of the parameters of a standard gable roof type building models, based on invariant moments of 2.5D point clouds. The analysis of deviations between point cloud and model allowed them to model asymmetries, such as dorms on a gable roof. By intersecting planar faces, nonparametric buildings with more complex roof types could also be modeled. The authors of [44], presented a method for automated generation of 3D building models from point clouds generated by ALS. The data-driven generation of polyhedral building models from ALS data, in the author's opinion, only made sense if the point density was high enough to locate a sufficient number of data points at least in the most relevant planes of the roof. He also noted that ground plans can reduce search space for estimating the parameters of adjoining planar segments because the gradient direction of such planes is usually perpendicular to the adjacent polygon segment in the ground plan.
The authors of [45] proposed a comprehensive approach for automated determination of 3D city models from ALS data. They proposed an assumption that individual buildings can be modeled properly by a composition of a set of planar faces. They based their method on a 3D segmentation algorithm and detecting planar faces in a point cloud. The approach consisted of number of steps. In order to ensure completeness it was advisable to initialize the first step of coarse selection of building regions. The remaining steps consisted of outline extraction and regularization, planar face detection, building model generation and final intersection with DTM. The research (as stated by the authors) proved that it is possible to use their approach in order to generate a data model of a city in an automated manner. The majority of remaining buildings, which were not fully reconstructed, still had a proper roof shape reconstructed. The authors of [46] presented a method to detect and construct a 3D geometric model of an urban area with complex buildings using ALS data. They perform an automatic recognition and estimation of simple parametric shapes that can be combined to model very complex buildings from ALS data. The main elements of their approach consist of segmentation of roof and terrain points, roof topology inference, parametric roof composition, and terrain modeling. They introduced the concept of a roof-topology graph to represent the relationships between the various planar patches of a complex roof structure. They also use simple parametric roof shapes that can be combined in order to create a complex roof structure of a building by searching for sub-graphs in its roof-topology graph. Terrain is identified and modeled as a triangulated mesh. Using their approach cities and other urban areas can be modeled at the rate of about 10 minutes per sq. mile (3.8 min/km2) on a low-end PC.
The authors of [47] presented a solution framework for the segmentation and reconstruction of polyhedral building roofs from ALS data. An Eigen analysis is first carried out for each roof point of a building within its Voronoi neighborhood to obtain the surface normal for each ALS point and separate the ALS points into planar and non-planar ones. In the second step, the surface normals of all planar points were clustered with the fuzzy k-means method. In order to optimize their clustering process, a potential-based approach was used to estimate the number of clusters, while considering both geometry and topology for the cluster similarity. The final step of segmentation separates the parallel and coplanar segments based on their distances and connectivity. Building reconstruction started with the formation of an adjacency matrix that represented the connectivity of the planar segments. A roof interior vertex was determined by intersecting all planar segments that meet at one point, whereas constraints in the form of vertical walls or boundary were applied to determine the vertices on the building outline. In the final step, an extended boundary regularization approach was developed based on multiple parallel and perpendicular line pairs to achieve topologically consistent and geometrically correct building models. The authors of [48] performed a comparison along the building extraction process by analyzing the task of extracting built structure from DSM. The original data were obtained by means of interferometry SAR or ALS techniques and, as such, had different resolution and noise characteristics. Their work aimed at making a comparison between previously identified models in terms of what was possible to detect and extract by using them. During this, the authors took into account their differences but applied to them the same planar approximation approach. Their results showed that LIDAR data provides a better shape characterization of buildings. The less accurate results obtained from radar data were mainly due to shadowing/layover effects, which can be only partially corrected by means of the segmentation procedures.
The authors of [49] presented an approach to building roof modeling from ALS data, including roof plane segmentation and roof model reconstruction. Segmentation was performed by minimizing an energy function formulated as a multiphase level set. The roof ridges or step edges were then delineated by the union of the zero level contours of the level set functions. In the final step of segmentation, coplanar and parallel roof segments were separated into individual roof segments based on connectivity and homogeneity. To reconstruct a 3D roof model, roof structure points were determined by intersecting adjacent roof segments or line segments of a building boundary and then connecting them based on their topological relations inferred from the segmentation result. As a global solution to the segmentation problem, the proposed approach determined multiple roof segments at the same time, which leads to topological consistency among the segment boundaries. The authors of [50] developed a scheme for building detection and reconstruction by merging ALS data and aerial imagery. For the building detection part, a region-based segmentation and object-based classification were integrated. In the building reconstruction, they analyzed the co-planarity of the ALS point clouds to shape roofs. By integrating the edges extracted from aerial imagery and the plane derived from the ALS data they accurately positioned the building walls. The three-dimensional building edges are then used to reconstruct the building models. In the reconstruction, a patented Split-Merge-Shape (SMS) method was incorporated. Even when the 3D building lines were broken, the SMS method provided a stable solution.
The authors of [16] developed a multi-scale solution based on mathematical morphology for extracting the building features from remotely sensed elevation and spectral data. Elevation data were used as the primary data to delineate the structural information and were firstly represented on a morphological scale-space. The behaviors of elevation clusters across the scale-space were the cues for feature extraction. Based on this observation, a complex structure could have been extracted as a multi-part object in which each part is represented on a scale depending on its size. The building footprint was represented by the boundary of the largest part. Other object attributes include the area, height or number of stories. The spectral data was used as an additional source to remove vegetation and possibly classify the building roof material. Finally, the results can be stored in a multi-scale database, which was introduced in the same paper. The authors of [51] proposed an approach by integrating multi-view aerial imagery and ALS data to reconstruct 3D building models with accurate geometric position and fine details. A new algorithm was introduced for determination of principal orientations of a building, thus, improving the correctness and robustness of boundary segment extraction in aerial imagery. A new dynamic selection strategy based on ALS point density analysis and K-means clustering was proposed to identify boundary segments from non-boundary segments. 3D boundary segments were determined by incorporating ALS data and the 2D segments extracted from multi-view imagery. Finally, a new strategy for 3D building model reconstruction including automatic recovery of lost boundaries and robust reconstruction of rooftop patches was introduced.
The authors of [19] researched a methodology for the automated generation of polyhedral building models for complex structures whose rooftops are bounded by straight lines. The process started with utilization of ALS data for building hypothesis generation and derivation of individual planar patches constituting building rooftops. Initial boundaries of these patches were refined through the integration of ALS and photogrammetric data (aerial photo) and hierarchical processing of the planar patches. Building models for complex structures were finally produced using the refined boundaries. The performance of the developed methodology has been evaluated through qualitative and quantitative analysis of the generated building models from real data. The authors of [52] presented a 3D point segmentation algorithm which was initialized by clustering in parameter space. To reduce the time complexity of clustering, it was implemented sequentially resulting in a computation time, which was dependent of the number of segments and almost independent of the number of points given. The method was tested against various datasets determined by image matching and laser scanning. The advantages of the 3D approach against the restrictions introduced by 2.5D approaches were also discussed.
The authors of [53] proposed a new method for automatic 3D roof extraction through an effective integration of ALS data and multispectral orthoimagery. Using the ground height from a DTM, the raw ALS points are separated into two groups. The first group contained the ground points that are exploited to constitute a “ground mask”. The second group contained the non-ground points which were segmented using an innovative image line guided segmentation technique to extract the roof planes. The image lines were extracted from the grey-scale version of the orthoimage and then classified into several classes such as “ground”, “tree”, “roof edge” and “roof ridge” using the ground mask and color and texture information from the orthoimagery. During segmentation of the non-ground LiDAR points, the lines from the latter two classes were used as baselines to locate the nearby LiDAR points of the neighboring planes. For each plane a robust seed region was thereby defined using the nearby non-ground LiDAR points of a baseline and this region is iteratively grown to extract the complete roof plane. Finally, a newly proposed rule-based procedure was applied to remove planes constructed on trees. The authors of [35] presented two methods for data collection in urban environments. The first method combined multispectral imagery and laser altimeter data in an integrated classification for the extraction of buildings, trees and grass-covered areas. The second approach uses laser data and 2D ground plan information to obtain 3D reconstructions of buildings through separation of building elements based on the ground plan and reconstruction of the building’s roof by fitting surfaces to obtained DSM model.
These approaches are a selection of the top cited methodologies in the literature today. The next subsection will provide more information about the 2D extraction methodologies as mentioned in the first paragraph of this subsection.

3.1.2. Building Extraction Methods Dealing with 2D Object Extraction

In similarity to the previous sub-section, we will begin with the approach starting from the highest citation level. In the case of results that are generated in 2D, the highest cited approach is the one of [18]. In their approach the authors aimed to present a new approach for automatic extraction of building footprints using a combination of IKONOS imagery that has pan-sharpened multi-spectral bands and the low-sampled (0.1 ppsm) ALS data. In their approach, a laser point cluster in 3D object space is firstly recognized as an isolated building object if all the member points are similarly attributed as building points based on the height property of laser points and the normalized difference vegetation indices (NDVI) derived from the added data (imagery). In addition to the modeling process, rectilinear lines around building outlines collected by either a data-driven or model-driven manner were integrated to compensate for the weakness of both developed methods. In the final step, building outlines were obtained by merging convex polygons, which were generated in a process where each building region was hierarchically divided by the extracted lines using the Binary Space Partitioning (BSP) tree. The developed approach was evaluated through objective evaluation metrics in comparison to the UK Ordnance Survey’s MasterMap® data. The performance test showed up to 0.11 (the branching factor) and the detection percentage of 90.1% (the correctness) and the overall quality of 80.5%. Resultant buildings were presented as polygons in 2D space. The authors of [43] presented a framework which applies a series of algorithms to automatically extract building footprints from ALS data. In their proposed framework, the ground and non-ground ALS measurements are separated using a progressive morphological filter. In the next steps of their method, building measurements are identified from non-ground measurements using a region-growing algorithm based on the plane-fitting technique. Footprints of segmented building measurements are derived by connecting boundary points, and the initial footprints are further adjusted to remove noise caused by ALS irregularity within measurements. To test the proposed framework, datasets from urban areas including large institutional, commercial, and small residential buildings were used. A quantitative analysis showed that the total of omission and commission errors for extracted footprints for both institutional and residential areas was approximately 12%. The result was presented as a set of building polygons in 2D space.
Priestnall et al. [54] examined methods for extracting surface features from a Digital Surface Model (DSM) produced by ALS. They argue that for some applications the extracted surface feature layer can be of almost equal importance to the DEM. The potential for refining surface roughness estimates by classifying extracted surface features using both topographic and spectral (imagery) characteristics is considered using an Artificial Neural Network to discriminate between buildings and trees. Their final result is presented as 2D building polygons. The authors of [55] described the evaluation of a method for building detection by the Dempster-Shafer fusion of ALS data and multi-spectral images. For this purpose, ground truth data were digitized for two test sites with heterogeneous characteristics. Using these data sets, the heuristic models for the probability mass assignments were validated and improved, and rules for fine-tuning the parameters were discussed. They also performed the sensitivity analysis of the results to the most important control parameters. The contributions of the individual cues used in the classification process to determine the quality of the results were also evaluated. By applying their method with a standard set of parameters on two different ALS datasets with a spacing of about 1 ppsm, 95% of all buildings larger than 70 m2 could be detected and 95% of all detected buildings larger than 70 m2 were correct in both cases. Buildings smaller than 30 m2 could not be detected. The parameters used in the method have to be defined. All except one (which must be determined in a training phase) can be determined from meaningful physical entities. Their research also shows that adding the multi-spectral images to the classification process improves the correctness of the results for small residential buildings by up to 20%.
The authors of [56] presented an approach for the tracing and regularization of building boundary from raw ALS data (georeferenced point cloud obtained from the sensor). The process consisted of a sequence of four steps: separation of building and non-building ALS points; segmentation of ALS points that belong to the same building; tracing building boundary points; and regularization of the boundary. For separation, a slope-based ID bi-directional filter was used. The segmentation step is a region-growing approach. By modifying a convex hull formation algorithm, the building boundary points were traced and connected to form an approximate boundary. In the final step, all boundary points were included in a hierarchical least squares solution with perpendicular constraints to determine a regularized rectilinear boundary. Tests concluded that the uncertainty of regularized building boundaries tends to be linearly proportional to the ALS point spacing. It is shown that the regularization precision is at 18% to 21% of the ALS point spacing, and the maximum offset of the determined building boundary from the original ALS points is about the same as the ALS point spacing. Limitations of ALS data resolution and errors in previous filtering processes may cause artifacts in the final building boundary. In the same year, the authors of [17] presented a new method for the extraction of a buildings class from ALS DEMs on the basis of geomorphometric segmentation principles. In the first step they specified seed cells and region growing criteria. Then an object partition framework was defined on the basis of region growing segmentation. Size filtering was applied to objects and connected components while labeling identifies background and foreground objects that were parametrically represented on the basis of elevation and slope. K-means classification was used to derive a set of clusters. The interpretation of the spatial distribution of clusters assisted for the interpretation of cluster centroids, which allowed for the identification of the building class, as well as building sub-classes with different morphometric characteristics.
The authors of [57] presented an automatic building detection technique using ALS point data and multispectral imagery. Two masks were generated from the ALS data: a “primary building mask” and a “secondary building mask”. The primary building mask indicated the void areas where the laser did not reach below a certain height threshold. The secondary building mask indicated the filled areas, from where the laser reflects above a certain set threshold. Line segments were extracted from around the void areas in the primary building mask. Line segments around trees were removed using a NDVI derived from the orthorectified multispectral images. The initial building positions were obtained based on the remaining line segments. The complete buildings were detected from their initial positions using the two masks and multispectral images in the YIQ color system (also used by NTSC color television systems). They have experimentally shown that the proposed technique can successfully detect urban residential buildings, when assessed in terms of 15 indices including completeness, correctness and quality. The authors of [58] focus on a multi-source framework using ALS (multi-echo and full waveform) and aerial multispectral image data. They aimed to study the feature relevance for dense urban scenes. The Random Forests algorithm was chosen as a classifier that provided measures of feature importance for each class. The margin theory was used as a confidence measure of the classifier, and to confirm the relevance of input features for urban classification. The quantitative results confirmed the importance of the joint use of optical multispectral and ALS data. Moreover, the relevance of full-waveform ALS features was demonstrated for building and vegetation area discrimination.
The authors of [59] demonstrated that Building Coverage Ratio (BCR), Floor Area Ratio (FAR), and other building density indicators can be numerically and automatically derived from high-resolution airborne ALS data. An object-based method is proposed to process the ALS data for the building density information. Their method consists of a sequence of numerical operations: generating the normalized DSM (nDSM), extracting building objects, deriving object attributes, associating objects with the corresponding land lots and computing building density indicators at land lot and urban district scales. The algorithms for these operations were implemented as an ArcGIS extension module. Various attributes have been derived to quantify the building density, urban physical structure, and landscape morphological characteristics of the test area at three different spatial scales. The authors of [60] presented a three-step method for effective separation of buildings from trees using aerial imagery and ALS data. They used cues such as height to remove objects of low height (e.g., bushes) and width to exclude trees with small horizontal coverage. The height threshold was also used to generate a ground mask where buildings are found to be more separable than in nDSM. Image entropy and color information were jointly applied to remove easily distinguishable trees. Finally, a rule-based procedure was employed using the edge orientation histogram from the imagery to eliminate false positive candidates.
The authors of [61] proposed an improved snake model that focuses on building extraction from color aerial images and ALS data. A snake is defined as an energy minimizing spline guided by external constraint forces and influenced by image forces that pull it toward features such as lines or edges. Based on the radiometric and geometric behaviors of buildings, the snake model was modified in two areas: the criteria for the selection of initial seeds and the external energy function. The proposed snake model included a new height similarity energy factor and regional similarity energy as well as Gradient Vector Flow (GVF), which efficiently attracted the snake approaching the object contours. Compared with the traditional snake model, this algorithm could have converged to the true building contours quicker and in a more stable manner, especially in complex urban environments. Examination of the results showed that buildings extracted from a dense and complex suburban area using the GVF model had an 81% shape accuracy, whereas the improved model had a 96% shape accuracy. The authors of [62] presented the idea of a building detection method which firstly segments a laser scanner derived DSM into homogeneous regions using the height information and then classifies the segments on the basis of their properties in the laser scanner and aerial image data. The first classification step was conducted to distinguish high objects (i.e., buildings and trees) from the ground surface. The next task was to distinguish building segments from tree segments. Finally, neighboring building segments were merged to obtain one segment for each building. Post-processing of the classification results was possible (e.g., by eliminating small regions classified as buildings). A large majority of tall non-building objects are trees and for the purpose of building detection, other tall objects such as poles, are also included in the tree class. Similarly, all low areas are assigned to the ground class, even if there are objects such as cars or low vegetation in the data.
The authors of [20] explored two main approaches for automatic building detection and localization using high spatial resolution imagery and ALS data: threshold-based and object-based classification. The threshold-based approach was founded on the establishment of two threshold values: one refers to the minimum height considered as a building (defined using the ALS data) and the other refers to the presence of vegetation, which is defined according to the spectral response. The other approach follows the standard scheme of OBIA using decision trees: segmentation, feature extraction and selection, and classification. The effect of the inclusion in the building detection process of contextual relations with the shadows has been evaluated. Quality assessment was performed at two different levels: area and object. Area-level evaluation assessed the building delineation performance, whereas object-level evaluation assessed the accuracy in the spatial location of individual buildings. The authors of [63] presented work on the development of automatic feature extraction from multispectral aerial images and ALS data. A total of 22 feature attributes have been generated from the aerial image and the ALS data which contribute to the detection of the features. The attributes include those derived from the Grey Level Co-occurrence Matrix (GLCM), NDVI, and standard deviation of elevations and slope. A Self-Organizing Map (SOM) was used for fusing the aerial image, ALS data and the generated attributes for building detection. The classified images were then processed through a series of image processing techniques to separate the detected buildings.
The authors of [64] presented a method for building detection from ALS data and multi-spectral images, and have shown its applicability in a test site of heterogeneous building shapes. The method is based on the application of the Dempster-Shafer theory for data fusion. In some cases, buildings and trees could not be accurately separated, either because of shadows or because the resolution of the ALS data is not sufficient. Better results might have been achieved with different definitions of the probability masses in the second classification step. They wanted to use the results of their method to improve the quality of the DTM by eliminating points on the building roofs before applying robust linear prediction. The authors of [65] proposed a new framework for ground extraction and building detection in ALS data. The proposed approach constructs the connectivity of a grid over the ALS point cloud in order to perform multi-scale data decomposition. This is realized by forming a top-hat scale-space using differential morphological profiles (DMPs) on points’ residuals from the approximated surface. The geometric attributes of the contained features were estimated by mapping characteristic values from DMPs. Ground definition is achieved by using features’ geometry, whilst their surface and regional attributes are additionally considered for building detection. A new algorithm for local fitting surfaces (LoFS) is proposed for extracting planar points. Finally, transitions between planar ground and non-ground regions were observed in order to separate regions of similar geometrical and surface properties but different contexts (i.e., bridges and buildings). The methods were evaluated using ISPRS benchmark datasets [66].
This list could be stretched for additional sets of various approaches but we decided to show just a core approaches as to provide a general insight into what has been established up until now in the field of ALS systems and information extraction from point clouds and respective derivatives. A more detailed list of all approaches that were analyzed can be seen in Table 3. A selection of attributes has been given for each selected publication.

3.1.3. Methodologies Identified in Non-ISI Indexed Articles

As mentioned in Section 2, we decided to expand the horizon of our work by carefully selecting some of the non-ISI indexed articles. By performing our search with the use of the Publish or Perish software the search was narrowed down to 35 most important publications. By carefully screening the selected articles we selected the top 15 contributions (qualitatively selected) and considered them in our review. In the next few paragraphs we will give succinct descriptions of the developed methods. In order to follow a certain structure, the selected works are chronologically aligned and separated, as in previous section, into 2D and 3D based extraction methods. The following paragraph will contain 3D approach descriptions and after that we will provide a paragraph containing 2D approaches while at the same time preserving the chronological order. Almost all defined methods are evolving around 3D building extraction and only three deal with roof outline extraction in 2D space.
The authors of [67] presented a procedure for building detection and roof extraction from the DSM. Their approach consisted of re-sampling elevation from ALS data into a regular grid, the application of a morphological filter for distinguishing between terrain and non-terrain segments, and non-segment classification into building or vegetation. For a vector representation of buildings the roof faces were extracted by further segmentation of the building segments into sub-segments. The 3D geometrical properties of each face were obtained based on plane fitting using least squares adjustment. The reconstruction part of the procedure was based on adjacency among the roof faces. Primitive extraction and face intersections were used for roof reconstruction. The authors of [68] developed an approach based out of edge detection, edge classification, building points extraction, TIN model generation, and building reconstruction in order to extract and reconstruct buildings from ALS generated elevation models. They detected edges from the surface data and then classified them to distinguish building edges from other edges based on their geometry and shapes, including orthogonality, parallelism, circularity, and symmetry. The classified building edges were then used as boundaries to extract building points and TIN models were generated with the extracted points. Each building had its own TIN model and its surfaces were derived from the TIN model. The authors of [69] presented a new method for the automated generation of 3D building models from directly observed point clouds generated by ALS. By a hierarchic application of robust interpolation using a skew error distribution function, the ALS points being on the terrain were separated from points on buildings and other object classes, and a digital terrain model (DTM) was computed. Points on buildings had to be separated from other points classified as off-terrain points, which was accomplished by an analysis of the height differences of a digital surface model passing through the original ALS points and a DTM. This resulted in the generation of a building mask, and polyhedral building models were created in these candidate regions in a bottom-up procedure by applying curvature-based segmentation techniques. The authors of [70] developed a procedure for building detection and extraction from the DSM. In order to extract building facades they introduced a region-growing algorithm based on least-squares adjustment of laser data connected by a TIN. The variance components were used to estimate the quality and the validity of the extracted parameters. They also used a morphological filter to highlight the terrain and the non-terrain segments. The resulting classification was used for extraction of building parameters. The procedure was developed to work for all terrain types and for most building/roof types. The final results were represented as a 3D vector of the buildings. The authors of [71] presented an approach for building extraction from ALS data which utilizes the geometric properties of urban buildings for the reconstruction of the building wire-frames from the ALS data. They start by finding the candidate building points that are used to populate a plane parameter space. After filling the plane parameter space, they find the planes that can represent the building roof surfaces. Roof regions are then extracted and the plane parameters are refined using a robust estimation technique and the geometric constraint between adjacent roof facets. The region boundaries were extracted and used to form the building wire-frames. The authors of [72] described the development of an automated method for building extraction in which individual building objects were localized and boundaries of polyhedral building shapes were delineated with a less specific building model. Their technique focused on an exploitation of a synergy between Ikonos imagery combined with an ALS DEM. Individual buildings were localized with rectangle polygon by a hierarchical segmentation of ALS DEM and Ikonos multi-spectral information. This polygon is recursively partitioned by linear features extracted from Ikonos imagery and ALS space, which results in a set of convex polygons. Only polygons contributing to “significant” parts of building shape are verified and aggregated. The final step reconstructed polyhedral buildings. The authors of [73] proposed a practical method for building detection and extraction using ALS data which is designed out of two processes defined as low and high level processes. They introduced a concept of a pseudo-grid into raw ALS data, which avoided the loss of information and accuracy due to interpolation and defined the adjacency of neighboring laser point data as to speed up the processing time. The approach performs pseudo-grid generation, noise removal, segmentation, grouping for building detection, linearization and simplification of building boundaries, and finally building extraction in 3D vector format. For efficient processing, each step changes the domain of input data (point and pseudo-grid accordingly). The authors of [74] presented an automatic algorithm which reconstructs building models from ALS data in urban areas. Their algorithm contains several major distinct features which were developed to enhance efficiency and robustness: (1) they design a novel vegetation detection algorithm based on differential geometry properties and unbalanced Surface Vegetation Model (SVM); (2) the use of a boundary extraction method in order to produce topology-correct water tight boundaries; (3) the proposal of a data-driven algorithm which automatically learns the principal directions of roof boundaries and uses them in footprint production. Additionally, they showed the extendibility of their algorithm by supporting non-flat object patterns with the help of only a few user interactions. The authors of [75] presented an approach for creation of a polyhedral model of building roof from ALS data using clustering techniques. A building point cloud was first separated into planar and break line sections using the eigenvalues of the covariance matrix in a small neighborhood. The planar components from the point cloud were then grouped into small patches containing six to eight points and their normal vector parameters were determined. The normal vectors were then clustered together to determine the principal directions of the roof planes. Directly using a clustering algorithm on normal vectors was not possible due to the lack of a-priori information on approximate roof directions. As an alternative a potential based approach was used iteratively with the k-means algorithm. This generated the necessary planar parameters and segmented the ALS roof points. A plane adjacency matrix is created for the roof using the segmented roof points in order to be able to perform reconstruction. Planes that intersect each other were identified and break lines and roof vertices were generated by solving the intersecting planar equations. At the end, a vector polyhedral model of the roof was created. The authors of [76] presented a 3D building reconstruction approach, which produces Level of Detail 2 (LOD2) models from existing ground plans and ALS data. They developed an approach that constructs models by assembling building blocks from a library of parameterized standard shapes. The basis of their work is a 2D partitioning algorithm that splits a building’s footprint into nonintersecting, mostly quadrangular sections. In order to extract roof outlines each extracted piece is given a roof shape that best fits the LIDAR points in its area and integrates well with the neighboring pieces. An implementation of the approach was used practically in a production environment. The authors of [77] introduced a new GIS workflow for fully automated building detection from ALS data. They combined the strengths of both raster and point cloud based methods to derive reliable building candidate regions, which latter served as an input for 3D building outline extraction and modeling algorithms. Input data were an nDSM and a slope-adaptive echo ratio raster [78]. Potential building areas were detected in the raster domain using standard tools provided by GRASS GIS. Seed regions were identified through the use of a threshold on (i) object height >2.0 m and (ii) echo ratio >75%. The following growing of the seed regions provided that building walls, overhanging roof parts, and areas obstructed by high vegetation were included. Non-building regions were removed by an object-based classification using a threshold on average laser point surface roughness.
The authors of [79] presented a study using ALS data in order to extract building information. In their approach they used ALS data in order to generate a height raster, which an edge detection filter was applied to. In the final step they presume three basic building shapes (I, T and L) and based on them perform extraction of 2D outlines. The authors of [80] developed an algorithm named Alpha Shapes which is used in order to extract the building boundary. The algorithm on its own works effectively in inner and outer boundary extraction from ALS data with convex and concave polygon shape. It has the ability to preserve fine features of buildings adaptively and filter the footprints of non-building formations. In addition, an improved boundary-simplifying algorithm was suggested to refine the extracted building boundary. Two regularization algorithms were developed to make the refined boundary regular. The authors of [81] proposed an automatic system which detects buildings in urban and rural areas by the use of first and last pulse return ALS data. First and last pulse returns were interpolated to raster images in order to generate two DSM models and a differential DSM was computed from them. Rough and smooth regions of the DSM are found with use of a height criterion. Last pulse returns lying inside smooth regions were filtered using a simplified Sohn filtering method to find the so called ‘on-terrain’ points by which the DTM was generated. An nDSM was calculated using first pulse-derived DSM and the calculated DTM. Afterwards two separated classifications were applied on the nDSM. The final results of classifications were a set of nDSM pixels belonging to building roofs.
Even though separated from the main search result, which included only ISI-indexed articles, this additional list gives us a valuable additional overview of “what is out there”. By doing this, we make it possible to additionally “paint the picture” of achieved progress through time from end of the last century to today. In order to generate a simplified overview of the collected literature the non-ISI indexed papers were added to the end of Table 3. By doing this we allow even more direct comparison of results to the official sources (ISI-indexed literature).

3.2. Analysis of Gathered Building Extraction Accuracies

In order to gain better insight into the applicability and usability of a certain approach we need a measure (or set of measures), which describe quantitative and/or qualitative aspects of the obtained results. In our case, accuracy measures provide such an insight since accuracy is a measure that tells us how close the obtained result is to the actual, real-world value. In the next few lines we will look into the reported accuracy measures. This will give us crucial information on the quality of the applied approach. It is important to notice that there are several different accuracy measures used, depending on the choice of the publication author and thus it is not possible to perform direct comparisons of the given values. Additional reasoning behind not having a direct comparison of applied research results is the fact that each of the approaches is using a different study area, data set and reference data. This was dealt with a benchmarking approach developed and described by [66], which is discussed below.
The previous section already revealed a wide range of different approaches/methods and types of reference data and data representations within the various methodologies. With regards to accuracy reporting, a similar trend of diversity can be observed. Table 4 provides an insight into reported accuracies and the type of the accuracy analysis that was applied for those publications that contain such information. In a case when we have more than one data set used for the accuracy calculation, we report the highest value obtained by the applied method. Since, as mentioned before, we are not able to directly compare values we provide them as an orientation. In the case that the author used completeness and correctness measures, we report the value of correctness since it is closer to a real value than completeness itself.
Table 4. List of ISI-indexed publications that provide accuracy measures within the publication along with additional information derived from the articles on additional data sources and on the accuracy assessments.
YearAuthorAddition DataReference Data for Accuracy AssessmentAccuracyMethod for Accuracy Check
2001Haithcoat et al.N/AManually digitized air photography100%Completeness
2002Krishnamoorthy et al.N/AManually segmented and labeled DSM>82%Classification rate (%)
2003RottensteinerAerial imagesAerial images<0.40Distribution of RSME of the planar fit
2005Chen et al.Aerial imagesAerial images>81%Correctness
2006Zhang et al.N/AAerial images and building footprint map12%Omission/Commission
2007Sohn and DowmanIKONOSOrdnance Survey MasterMap90.01%Correctness
2007Rottensteiner et al.Multi-SpectralRasterized reference polygons from imagery87%Pixel detection level
2007Miliaresis and KokkasN/ADigitized building outlines0.097Mean square error
2008Dorninger and PfeiferN/APoint acquired by tacheometer75%Properly modeled buildings
2008Lee et al.Aerial imagesDigital ground truth map89.9%Overlapped pixel number
2009Vu et al.OrthoimageManually digitized building footprints82.98%Correctness
2009Alexander et al.N/AManually created building model from stereo images86.2%Overall users accuracy
2009Kim and HabibAerial imagesManually derived ground truth data95%Correctness
2009Salah et al.Multi-SpectralManually digitized buildings89.5%Correctness
2010Awrangjeb et al.Multi-SpectralManual building tracing from orthoimagery99.25%Correctness
2010Matikainen et al.Aerial imagesDigital map85%Correctness
2010Kabolizade et al.Aerial imagesAerial imagery96%Shape accuracy
2010Yu et al.N/ADigital cadastral map96%Random sampling
2011Guo et al.Multi-SpectralDigital ground truth data3.20%Omission error
2011Kim and ShanN/AOriginal LiDAR data90%Correctness
2011Hermosilla et al.Aerial imagesManually delineated buildings from imagery92.2%Correctness
2011Cheng et al.Aerial imagesTrue orthophoto and manually made 3D models95%Correctness
2012Awrangjeb et al.Aerial imagesBuilding polygons96%Correctness
2012Aparecida dos Santos Galvanin and Dal PozN/AManually extracted roof outlines from intensity91%Completeness
2012Jochem et al.DSM/DTMDigital Cadastral Map>88.4%Correctness
2013Liu et alN/AISPRS Benchmark data (2014)>96%Correctness
2013Yu et al.N/AISPRS Benchmark data (2014)>96%Correctness
2013SusakiAerial imagesManual interpretation of aerial imagery76%Correctness
2013Cheng et al.N/ATrue orthophoto5.7%/8.7%Commission/Omission
2013Awrangjeb et al.Multi-SpectralMonoscopic image measurement with Barista software>98%Correctness
2014Suyoung et al.N/ADSM in colour shaded mode0.65RMSE (m) X, Y and radial direction
2014Niemeyer et al.N/AISPRS Benchmark data (2014)>96%Correctness
2014Mongus et al.N/AISPRS Benchmark data (2014)>96%Correctness
Some authors [15,21,47,48,54,82,83,84,85,86,87,88] exclusively rely on visual comparisons or provide no explicit accuracy measure, thus making it difficult to quantitatively evaluate the quality of the developed approach based on the respective article only. We can observe that all of the approaches, which reported some kind of accuracy measure resulted in relatively high accuracies (>76%). Correctness and completeness are the most occurring measures. Authors also report various accuracy measures including error of commission and omission, shape accuracy, Root Mean Square Error (RMSE), precision, classification rate (as percentage), pixel detection level and kappa index. If we concentrate of the source of reference data, the vast majority is generated by manually digitalizing from imagery or ALS DTM.
The use of traditional accuracy assessments of building extraction methodologies could bias the results [89]. Building extraction usually aims for (a) the correct amount of buildings (each building should be represented by one object); (b) the delineation of the buildings should be sufficient (in the best case: cadastral compliant) and (c) simplified 3D building model generation. Providing multiple accuracy measures (one at object level and another one regarding the accuracy of the building outlines) is important for the evaluation of approaches. This also proves the usefulness of the developed methodology for a certain usage scenario. In order to generate a competing environment in which everyone could provide their own method for building extraction, [66,90] generated a benchmark environment which consisted of two separate datasets containing ALS data and satellite imagery. The goal was to collect results of various extraction procedures and cross compare them to the ground truth data they had for the presented data sets. They managed to evaluate the potential and usefulness of various approaches by performing evaluation using multiple datasets (in this case two datasets were used) compared to a single unique dataset. The given datasets cover the areas of downtown Toronto (Canada) and the old city core of Vaihingen (Germany). It has been noted that a high share of newer approaches use these data sets in order to perform additional accuracy evaluation thus allowing for a more transparent overview of achieved accuracies in the near future (first results were described in [66]).
All reported accuracy measures fell in the range of 75% to 100%. An in-depth analysis of the approaches achieving such accuracies reveals that most of them are built on derivations of height rasters from ALS data and, thus, are not performing direct analysis on the original ALS data. We exclude the accuracy analysis of the non-ISI indexed literature since their majority only reported visual comparisons of the obtained results.

3.3. Analysis of the Dataset Size in Respect to the Area of the Used Dataset

One important parameter in the studies on ALS-based building extraction analyzed herein is the size of the study area. Changing the spatial extent of the study area and reprocessing the data may lead to the inclusion of data that contains new geographical/morphological features which were not present in the original dataset and as such they may influence the results. Real use cases requiring spatial information do not generally need localized and small areas of data, but instead require data that covers large areas of land in order to be effective for a number of data processing tasks (land cover mapping, parcel surveying, seabed mapping, biomass estimation, state survey, etc.). Another challenge in object detection is the heterogeneity of the target object, and this is most often related to the size of the study area (assuming changing characteristics over larger areas). In order to process large data sets (especially in the ALS domain), users often have to break them down into smaller sub-parts. [13,91,92] perform the analysis and then stitch the results back together. Tiling and processing of subsets of the main data set could cause problems when stitching the final objects (i.e., a building being separated on the edge of the subsets). Jochem et al. The authors of [91] proved that this could be avoided by using a hierarchical schema by initial rough building detection in the LiDAR data on the overview level and then perform point cloud analysis for the detected seed areas individually on a detailed level. This approach makes it possible to analyze large areas using lower end computer hardware. On the other hand, the size of the chosen dataset should be carefully chosen in order to meet the application purpose.
Insights into the area extent of the used datasets in the studies reviewed for this article are shown in Table 5. This figure depicts the area extent of the datasets used for the analysis. The datasets are separated based on the country from which they originate in order to make it easier to observe approaches with similar morphometric signatures. We can notice that almost all of the datasets represent small portions of Earth’s surface. In fact, only in two cases the surface of the dataset was larger than 10 km2, all other datasets were smaller than 10 km2. We can notice that in the past two years (2013, 2014) the size of the datasets has increased when compared to the investigated areas before. This can be also associated to the increased availability of datasets and increase in computing power.
Table 5. Authors, location of the dataset and the size of the study area for both ISI and non-ISI indexed articles (only those where reported).
YearAuthorTest AreaArea Size sq km
1999Maas and VosselmanNetherlands1.25
1999Haala and BrennerKarlsruhe, Germany-
2000Priestnall et al.Trent floodplain at Newark-on-Trent, Nottinghamshire, UK-
2000Gamba and HoushmandLos Angeles2
2001Stilla et al.Frankfurt airport<1
2001Nardinocchi an ScaioniPavia/Italy-
2002Krishnamoorthy et al.Stockholm, Belgium, Ravensburg and Baltimore<1
2002Weed et al.Austin campus area / University of Texas<1
2003RottensteinerVienna/Austria<1
2003You et al.USC Campus/Los Angeles<1
2004Vu et al.Roppongi, Tokyo, Japan-
2004Rottensteiner et al.Memmingen / Germany4
2005Chen et al.Science-based Industrial Park, Taiwan-
2006Zhang et al.Campus, Florida International University6
2007Sohn and DowmanGreenwich, London, UK1.4
2007Rottensteiner et al.Fairfield, Australia and Memmingen, Germany4
2007Sampath and ShanBaltimore, Maryland Toronto, Canada Purdue Uni Campus, Indiana<1
2007Miliaresis and KokkasBloomsbury area, London1
2008Lee et al.Daejeon, Republic of Korea4
2009Vu et al.Roppongi, Tokyo, Japan<1
2009Alexander et al.Portbury, Bristol, UK<1
2009Salah et al.University of New South Wales campus (Sydney, Australia)<1
2010Sampath and ShanPurdue University campus, Indianapolis-
2010Awranjeb et al.Fairfield, Australia<1
2010Matikainen et al.Espoonlahti, Finland5
2010Kabolizade et al.Taft, Iran-
2010Yu et al.Houston, USA1
2011Guo et al.Biberach, Germany1
2011Elberink and VosselmanNetherlands-
2011Kim and ShanPurdue University campus, Indianapolis-
2011Hermosilla et al.Valencia (Spain)-
2012Awranjeb et al.Australia: Fairfield, Moonee Ponds, Knox and Hobart<1
2012Aparecida dos Santos Galvanin and Dal PozCuritiba/Brazil10
2012Jochem et al.Feldkirch, Austria49
2013Sun and SalvaggioGreater Rochester, New York, USA<1
2013Liu et alVaihingen, Germany-
2013Yu et al.“Downtown Toronto” and “Vaihingen”1.45
2013SusakiHigashiyama ward of Kyoto, Japan<1
2013Awranjeb et al.Aitkevale, Queensland, Australia<1
2014Suyoung et al.Kyungpook National University campus in Daegu, South Korea<1
2014Niemeyer et al.Vaihingen, Germany-
2014Mongus et al.Vaihingen, Germany/Toronto Canada10
NON-ISI Indexed Literature
1998Wang and SchenkAirport/Place unknown-
2000Morgan and TempfliHaren/Netherlands-
2000Wang and Schenk-0.4
2002Rottensteiner and BrieseVienna/Austria0.1
2002Morgan and Habib-<1
2002Elaksher and Bethel-<1
2003Sohn and DowmanGreenwich/London<1
2004Cho et al.Chungjoo/Korea<1
2008Zhou and NeumannDenver & Oakland/USA-
2008WeiMalaysia-
2008Sampath and Shan-<1
2009Kada and McKinelyEast Berlin and Cologne>400
2009Höfle et al.Hohenems/Austria0.35

3.4. Use of Auxiliary Data for Building Object Extraction

Out of 54 publications that were used for our data analysis, 25 used additional data in order to perform data extraction. Depending on the author and the developed methodology, the source of additional data varied. This additional data included aerial images [16,19,20,44,50,51,52,60,61,62,86,93,94,95], multi-spectral imagery [53,55,57,58,63], purely infrared spectral image [64] or 2D ground plans [35].
ALS data on its own is a rich source of information. In some cases, additional information is added through previously described data sources. By providing such fusion, the information pool is enriched and some of the drawbacks of the original data source can be overcome (lack of spectral values, geometric explicitness).
When using additional data authors report different use cases. For aerial imagery the additional value comes from the use of color information to remove vegetation or to eradicate false positive candidate building objects [60]. The authors of [50] used spectral information for segmentation purposes and calculation of a greenness index for vegetation masking along with extraction of texture information in order to separate building from vegetation in cases when they have similar spectral response. The authors of [51] used imagery in order to generate building images by cropping out regions based on the overlap of imagery with points from point cloud which represent buildings. The authors of [52] used the imagery as the additional source of points in order to densify the point cloud originating from the ALS system through stereoscopic matching. The authors of [20] used imagery as the source for a NDVI and texture calculation, and also as one of the data sources for segmentation. Hongjian et al. The authors of [86] used aerial imagery in order to determine the geometrical shape of a building and to extract the building edges based on the Laplacian sharpening operator and threshold segmentation. Kabolizade et al. [61] used the canny edge detection operator in order to extract building edges and as an input for the improved snake model. Kim et al. The authors of [19] fused imagery with ALS data in order to extract building edges and perform 3D reconstruction of building model. Other authors that include imagery in their processing steps use one or more of the methods described above. Unlike other approaches that used an imagery source, the authors of [35] incorporated 2D ground plan data in order to obtain 3D reconstructions of buildings. In the early research, ground plans were used in order to avoid the problem of roof outlining (low point cloud density) and nowadays integration with ground plans again is an important issue as cities want their 3D city models to be consistent with the available 2D ground plans.
An interesting observation is the fact that even though some approaches use auxiliary data in order to enhance the ALS data, the reported accuracy measures indicate that the achieved results are on par with the methods that use ALS data only for feature extraction (Table 3).

4. Discussion

When evaluating the presented methodologies and the quantitative results of the meta-analysis, the following discussion can be split into two distinct subtopics: (a) Observed trends and remaining problems; and (b) prediction of future trends.

4.1. Observed Trends and Remaining Challenges

When taking a closer look at the accumulated methodological approaches for the building extraction from ALS data that were presented in the second section of this paper, we can observe some distinct trends. The authors of the papers have shown a strong ability to adapt existing methodologies and develop new ones to include new data sources, and have managed to produce tangible outcomes with high (>80%) reported accuracies. At this point, it would be valuable to notice that the vast majority of approaches used their own reference data in order to perform the evaluation of accuracy. The reference data was primarily generated by self-performed hand digitalization of digital imagery or even ALS DSM data. Such an approach could be considered as a biased one since the outcome of the reference data lies in the hand of the person who is also performing the final test. It is the opinion of the authors that the reference data should be generated by a third party or respective authority whose job is to ensure accuracy of such digital sources for accuracy analysis (cadastre, surveying company, ISPRS Benchmark testing, etc.). Although a number of studies (40% of the reviewed publications) use additional datasets alongside ALS data [16,18,20,34,57,61,64,93,94,95], the majority of approaches concentrate solely on ALS as the main and only source of information. This trend of using only ALS data means it is possible to explore the true potential of using such a data source for the detection of buildings as it is used independently from other data sources. On the other hand, ALS proved itself to be a useful source of additional information for methods that use multiple datasets from varying sources (providing additional features in form of height or providing easier way to obtain various DEMs). Some of the approaches perform rasterization of ALS point clouds into separate (2D) maps based on recorder height, return number or recorded intensity. These derivatives become the main input for further analysis. Most of the already existing approaches and methodologies are, by their nature, oriented towards the analysis of rasterized data and as such are easily applicable to 2D ALS derivatives. With regards to dataset size, we can see that all of the reviewed approaches except one [91] use datasets with area smaller than 10 km2. ALS sensory platforms are systems that can observe large areas and generate vast amounts of data. As such there is a need for methods and approaches that will be able to operate on these massive datasets. As shown in [91] one of the solutions to the problem of big datasets is the use of a tiling strategy in order to generate smaller sections and then stitch these back together after the analysis has been performed. Some other solutions [96] use parallel processing and utilization of processing cores located on the Graphics Processing Unit (GPU). As stated by [97] with few exceptions (NOAA, Puget Sound LiDAR Consortium), there is a notable lack of standards regarding processing, deliverables, and data quality. Testing of the available approaches over bigger data sets is plausible today with open access to data through a website that offers data hosting (OpenTopography) which can be used for testing purposes, and additional testing should be done to observe the behavior of new approaches over larger areas. Similar observations can be made with regards to the transferability of developed approaches to different study sites and datasets in that little investigation has been conducted into the effects of implementing the same approach in more than one investigation. It would be of great value to know to what level are the developed approaches transferable to other use cases.
A recent study by [66] has addressed the aforementioned issue relating to transferability of methods between study sites. Since there are many building extraction algorithms, in order to make the results of such algorithms more comparable a benchmarking data set was required. They generated two separate data sets, which represented two different regions (urban areas in Toronto in Canada and Vaihingen in Germany). These data sets, which consist of airborne imagery and laser scanner data, have been made available to the scientific community via ISPRS Working Group III/4. Researchers were encouraged to submit their results of urban object detection and 3D building reconstruction, which were evaluated based on the reference data that was provided by the dataset providers. The outcomes were evaluated for building detection, tree detection, and 3D building reconstruction. The results achieved by different methods were compared and analyzed to identify strategies for automatic urban object extraction. Their results showed that, on average, all tested approaches satisfied the standards required for practical relevance according to [98]. It is important to note, that they conclude in their analysis that the task was satisfactorily solved for buildings larger than 50 m2 but that there is still room for improvement in detecting small building structures and delineation of the building boundaries since the represented methods were not able to pick up such structures in the highest manner. By taking a look at the objects of interest we can notice that some of the authors [53,58,65] did not focus only on buildings in their approach but they also tried to perform an extraction of additional entities. In general, a wall-to-wall solution would be a valuable goal to achieve.
Point cloud densities represent one area that varies significantly (Table 3) and in the majority of cases it is under 5 ppsm, although in some cases it is higher [22,23,42,45,46,52,53,63,65,87,91,99]. Based on the recent research by [100] it has been identified that a point cloud density of below 5 ppsm influences the accuracy of the final results (outline of building polygon) and that higher densities generate higher accuracies. This observation might be used as an indication to use higher point cloud densities if higher accuracy is needed. In some cases the analysis is performed using the raw point cloud data [53,91,101] as opposed to a derivative of it such as elevation maps. This shows us that it is possible to utilize the original 3D point cloud data without the need to interpolate it into a variety of different height or intensity (or similar) maps. Our research revealed that around 50% of methods result in a 3D representation of buildings.
Figure 5 provides a distinction of methods based on the dimension they use for the period of 1998 to 2014 along with trend lines. We can notice an increase of 2D resulting methods for the past few years, but this is not to show that there is more approaches being developed in the 2D domain but rather to indicate that availability of higher point cloud densities has resulted in increased potential for use of 2D raster representations generated from such dense point clouds.
Figure 5. Separation of the amount of type of result (2D/3D) per year (ISI-indexed articles).
Remotesensing 07 03826 g005

4.2. Prediction of Future Trends

Based on our general literature analysis and the in-depth analysis of the 54 articles on ALS-based building extraction for the period from 1998 to 2014, we can define some needs based on findings from previous sections that should be addressed in future research. These include:
  • Generation of automated approaches for building delineation from ALS data sources in 2D (polygon representation) and 3D models.
  • Full transition from 2D to 3D approaches and thus preserving all the valuable data within the 3D data source.
  • Generation of methods, which are applicable to datasets which incorporate large areas. (emergency response, derivation of change detection within hours not days).
  • Formation of transferable methods, which will be exempt from parameter modification – the generation of a “One-Click” solution for object extraction.
  • Deeper integration of ALS data with other sensors (imagery, terrestrial + airborne + mobile laser scanning, point clouds from dense image matching) in order to improve the temporal, spectral and spatial resolution of the data.
  • Formation of standards regarding processing and deliverables of ALS systems.
  • Formation of standards for quality assessment of derived outputs from ALS data source. Increase in interdisciplinary development and research (e.g., between photogrammetry/LiDAR community, satellite image remote sensing, group GEOBIA, GIScience, computer vision, etc.)
  • Developed system solution for building inventory updating from different ALS data sets over time.
This list of identified trends is far from exhaustive. The needs may evolve over time and they will most likely become part of existing workflows for data extraction. One major question that could be asked is “Should existing methods be developed further or should we (as researchers) actively search for new approaches?” As often in life (and the general process of innovation), the reality will most likely be a mixture of the two strategies. New approaches are constantly being published but we may also identify a number of incremental improvements to methods, in most cases provided by the same research groups who initially developed them. Based on the literature review undertaken, observations include that (a) there is a strong and ever growing population of approaches that deal with building extraction from ALS data; (b) transferability of the existing approaches has not been performed explicitly but some steps have been taken towards the analysis of this aspect as it is described in [66]; (c) dataset size (area taken under processing) is still relatively small but newer approaches have provided solutions for larger areas [91]; (d) reported accuracies for developed extraction processes are high but a standardized set of accuracy assessments, not only one measure, is needed so that each algorithm can be evaluated from more than one aspect (thematic vs. topologic accuracy) and (e) many solutions require an expert’s input in order to adjust parameters—the development of a fully automated process would negate the need for constant input and modification thus improving the calculation speed and increase reactivity in emergency responses where time is of the essence [102]. Additionally, in relation to this last point, the implementation of automated processes would be beneficial to use cases such as property monitoring by local governments. In that case, automatic 3D building reconstruction could be used for automatically monitoring building stability and the influence of natural phenomenon on the structures (earthquakes, flooding). One of the future aspects could also go towards combination of absolutely new data sources like Volunteered Geographic Information (VGI) and ALS data [103].

5. Conclusions

ALS techniques for remote sensing have developed substantially over the past 30 years, particularly over the last 15 years. Along with technologies to gather the data in the form of 3D point clouds, methods for the extraction of objects of interest in the form of tangible output data have also increased. It is highly likely that the progress will increase in the upcoming years. This article reveals that the most recent advances with regards to building extraction algorithms from ALS initiated a wide variety of approaches for information extraction. Some approaches utilize ALS data as the source for the generation and interpolation of various 2D and 2.5D spatial representations (height, intensity, slope or return maps), which are, in turn, used for building extraction, while others work directly on the point cloud itself.
Accuracies of the reviewed approaches indicate a high level of success (>85%) for building extraction, although not all investigated publications declare accuracies. One important aspect to mention is the lack of standards and the lack of widely accepted sets of pre-defined metrics that everyone should use for accuracy assessment. Additionally, resources used as a basis for accuracy assessments are very often generated by the person who also developed the approach, e.g., by digitizing maps or ALS derived DSM rasters. This should be avoided and reference data from trust worthy sources should be utilized (cadastral maps, OSM data where applicable, etc.). In addition, it is important to clearly state that the use of just one single accuracy assessment measure is not enough. There should be a specified set of metrics according to which one should compare the results. Somewhat surprisingly, transferability is hardly tackled in the investigated articles. An alternative approach to the ISPRS benchmark has for such investigations has been provided by [66].
One major result of this article is that the study areas of the datasets used are all relatively small (<10 km2) with the exception of two studies [76,91]. ALS is becoming more and more available to an even broader community due to the reduction of costs for acquisition and processing. The quantitative publication assessment in this article has shown a constant increase of publications that investigate building extraction. Exploitation of ALS data as an important source of information has become evident beyond a surveying and engineering community and has reached many application domains.
Further progress is needed in order to completely unravel the 3D domain. This seems imperative to fully utilize the potential of ALS data. By combining the ALS data with other sources some of the investigated publications overcome smaller issues that are dependent on the technological restrictions (i.e., temporal, spectral and spatial resolution). This is expected to be less critical with future developments. Finally, we may identify a small but precise group of elements that are still missing in the research:
  • Fully automated extraction of either building models (3D) or building outlines (2D).
  • Transferable methods which are applicable to any point cloud data obtained from ALS systems
  • A set of well-defined accuracy metrics which is needed to establish a cross comparable measure of accuracy.
  • High quality reference data sets for accuracy assessment should make manually (self-)digitized reference data sets redundant.
  • Use of large area data sets in order to fully proof solutions to real world problems in many applications.
One may conclude that in general ALS data provides a rich source of information that allows experts to further develop and enrich their existing data models. There are already a variety of approaches that utilize ALS data for building extraction and this number will significantly increase through time, thus, addressing and at least partially solving some of the problems recognized and described in this paper.

Acknowledgments

The presented work is framed within the Doctoral College GIScience (DK W 1237N23), funded by the Austrian Science Fund (FWF).

Author Contributions

The concept of the research-questions driven literature review approach was jointly developed by all authors. Ivan Tomljenovic collected and prepared all data and carried out the analyses. Dirk Tiede and Bernhard Höfle contributed to the interpretation of the results and the discussion section. Most parts of the manuscript were written by Ivan Tomljenovic under the supervision of Thomas Blaschke and with contributions from all authors. Thomas Blaschke contributed to the formulation of the abstract, discussion and conclusion sections, respectively.

Conflicts of Interest

The authors declare no conflict of interest.

References

  1. Altmaier, A.; Kolbe, T. Applications and solutions for interoperable 3D geo-visualization. In Proceedings of the Photogrammetric Week, Stuttgart, Germany, 1–5 September 2003; pp. 1–15.
  2. Höfle, B.; Rutzinger, M. Topographic airborne LiDAR in geomorphology: A technological perspective. Zeitschrift für Geomorphol. 2011, 55, 1–29. [Google Scholar] [CrossRef]
  3. Vosselman, G.; Maas, H.G. Airborne and Terrestrial Laser Scanning; Whittles Publishing: Dunbeath, UK, 2010. [Google Scholar]
  4. Höfle, B.; Pfeifer, N. Correction of laser scanning intensity data: Data and model-driven approaches. ISPRS J. Photogramm. Remote Sens. 2007, 62, 415–433. [Google Scholar] [CrossRef]
  5. Wagner, W. Radiometric calibration of small-footprint full-waveform airborne laser scanner measurements: Basic physical concepts. ISPRS J. Photogramm. Remote Sens. 2010, 65, 505–513. [Google Scholar] [CrossRef]
  6. Yao, W.; Krzystek, P.; Heurich, M. Tree species classification and estimation of stem volume and DBH based on single tree extraction by exploiting airborne full-waveform LiDAR data. Remote Sens. Environ. 2012, 123, 368–380. [Google Scholar] [CrossRef]
  7. Reitberger, J.; Krzystek, P.; Stilla, U. Analysis of full waveform LIDAR data for the classification of deciduous and coniferous trees. Int. J. Remote Sens. 2008, 29, 1407–1431. [Google Scholar] [CrossRef]
  8. Straub, C.; Wang, Y.; Iercan, O. Airborne laser scanning: Methods for processing and automatic feature extraction for natural artificial objects. In Laser Scanning for the Environmental Sciences; Heritage, G., Large, A., Eds.; John Wiley & Sons: Hoboken, NJ, USA, 2009; pp. 115–133. [Google Scholar]
  9. Raber, G.T.; Jensen, J.R.; Schill, S.R.; Schuckman, K. Creation of digital terrain models using an adaptive lidar vegetation point removal process. Photogramm. Eng. Remote Sens. 2002, 68, 1407–1431. [Google Scholar]
  10. Sithole, G.; Vosselman, G. ISPRS test on extracting DEMs from point clouds: A comparison of existing automatic filters. Available online: http://www.itc.nl/isprswgiii-3/filtertest/report.html (accessed on 31 March 2015).
  11. Kraus, K.; Pfeifer, N. Advanced DTM generation from LIDAR data. Int. Arch. Photogramm. Remote Sens. Spat. Inf. Sci. 2001, XXXIV-3/W4, 23–30. [Google Scholar]
  12. Kraus, K.; Pfeifer, N. Determination of terrain models in wooded areas with airborne laser scanner data. ISPRS J. Photogramm. Remote Sens. 1998, 53, 193–203. [Google Scholar] [CrossRef]
  13. Dorninger, P.; Székely, B. Automated detection and interpretation of geomorphic features in LiDAR point clouds. Vermessung Geoinf. 2011, 99, 60–69. [Google Scholar]
  14. Seijmonsbergen, A.C.; Anders, N.S.; Bouten, W. Geomorphological change detection using object-based feature extraction from multi-temporal lidar data. In Proceedings of the 4th GEOBIA, Rio de Janeiro, Brazil, 7–9 May 2012; pp. 484–489.
  15. Laycock, R.; Day, A. Automatically generating large urban environments based on the footprint data of buildings. In Proceedings of the Symposium on solid modeling and applications, Seattle, WA, USA, 16–20 June 2003; pp. 346–351.
  16. Vu, T.T.; Yamazaki, F.; Matsuoka, M. Multi-scale solution for building extraction from LiDAR and image data. Int. J. Appl. Earth Obs. Geoinf. 2009, 11, 281–289. [Google Scholar] [CrossRef]
  17. Miliaresis, G.; Kokkas, N. Segmentation and object-based classification for the extraction of the building class from LIDAR DEMs. Comput. Geosci. 2007, 33, 1076–1087. [Google Scholar] [CrossRef]
  18. Sohn, G.; Dowman, I. Data fusion of high-resolution satellite imagery and LiDAR data for automatic building extraction. ISPRS J. Photogramm. Remote Sens. 2007, 62, 43–63. [Google Scholar] [CrossRef]
  19. Kim, C.; Habib, A. Object-based integration of photogrammetric and LiDAR data for automated generation of complex polyhedral building models. Sensors 2009, 9, 5679–5701. [Google Scholar] [CrossRef] [PubMed]
  20. Hermosilla, T.; Ruiz, L.A.; Recio, J.A.; Estornell, J. Evaluation of automatic building detection approaches combining high resolution images and LiDAR data. Remote Sens. 2011, 3, 1188–1210. [Google Scholar] [CrossRef]
  21. Sun, S.; Salvaggio, C. Aerial 3D building detection and modeling from airborne LiDAR point clouds. IEEE J. Sel. Top. Appl. Earth Obs. Remote Sens. 2013, 6, 1440–1449. [Google Scholar] [CrossRef]
  22. Yu, Y.; Li, J.; Guan, H.; Wang, C. A marked point process for automated building detection from lidar point-clouds. Remote Sens. Lett. 2013, 4, 1127–1136. [Google Scholar] [CrossRef]
  23. Niemeyer, J.; Rottensteiner, F.; Soergel, U. Contextual classification of lidar data and building object detection in urban areas. ISPRS J. Photogramm. Remote Sens. 2014, 87, 152–165. [Google Scholar] [CrossRef]
  24. Zhao, J.; You, S.; Huang, J. Rapid extraction and updating of road network from airborne LiDAR data. In Proceedings of IEEE Applied Imagery Pattern Recognition Workshop (AIPR), Washington, DC, USA, 11–13 October 2011; pp. 1–7.
  25. Han, J.; Kim, D.; Lee, M.; Sunwoo, M. Enhanced road boundary and obstacle detection using a downward-looking LIDAR sensor. IEEE Trans. Vehicular Technol. 2012, 61, 971–985. [Google Scholar] [CrossRef]
  26. Clode, S.; Kootsookos, P.; Rottensteiner, F. The automatic extraction of roads from lidar data. Int. Arch. Photogramm. Remote Sens. Spat. Inf. Sci. 2004, 35, 231–236. [Google Scholar]
  27. Hu, X.; Tao, C.V. Automatic road extraction from dense urban area by integrated processing of high resolution imagery and lidar data. Int. Arc. Photogramm. Remote Sens. Spat. Inf. Sci. 2004, 35, 288–292. [Google Scholar]
  28. Livny, Y.; Yan, F.; Olson, M.; Chen, B. Automatic reconstruction of tree skeletal structures from point clouds. ACM Trans. Graph. 2007, 29, 151–158. [Google Scholar]
  29. Park, H.; Russeltsfnswgovau, R.T. 3D modelling of individual trees using full-waveform lidar. Available online: http://www.sage.unsw.edu.au/snap/publications/park_etal2009a.pdf (accessed on 31 March 2015).
  30. Swatantran, A.; Dubayah, R.; Roberts, D.; Hofton, M.; Blair, J.B. Mapping biomass and stress in the Sierra Nevada using lidar and hyperspectral data fusion. Remote Sens. Environ. 2011, 115, 2917–2930. [Google Scholar] [CrossRef]
  31. Wallace, A.; Nichol, C.; Woodhouse, I. Recovery of forest canopy parameters by inversion of multispectral LiDAR data. Remote Sens. 2012, 4, 509–531. [Google Scholar] [CrossRef]
  32. Krishnamoorthy, P.; Boyer, K.L.; Flynn, P.J. Robust detection of buildings in digital surface models. In Proceedings of the International Conference on Pattern Recognition, Quebec City, QC, Canada, 11–15 August 2002; pp. 159–163.
  33. Cheng, L.; Zhao, W.; Han, P.; Zhang, W.; Shan, J.; Liu, Y.; Li, M. Building region derivation from LiDAR data using a reversed iterative mathematic morphological algorithm. Opt. Commun. 2013, 286, 244–250. [Google Scholar] [CrossRef]
  34. Stilla, U.; Soergel, U.; Thoennessen, U.; Michaelsen, E. Segmentation of LIDAR and InSAR elevation data for building reconstruction. In Automatic Extraction of Man-Made Objects from Aerial and Space Images (iii); Lisse, Balkema: Leiden, The Netherlands, 2001; pp. 297–307. [Google Scholar]
  35. Haala, N.; Brenner, C. Extraction of buildings and trees in urban environments. ISPRS J. Photogramm. Remote Sens. 1999, 54, 130–137. [Google Scholar] [CrossRef]
  36. Tian, P.; Sui, L. Building contours extraction from light detect and ranging data. In Proceedings of the 2011 IEEE Symposium on Photonics and Optoelectronics (SOPO), Wuhan, China, 16–18 May 2011; pp. 1–3.
  37. Reuters, T. Web of Science. Available online: http://scientific.thomson.com/isi/ (accessed on 26 March 2015).
  38. Elsevier Scopus. Available online: http://www.scopus.com/ (accessed on 26 March 2015).
  39. Google Google Scholar. Available online: http://scholar.google.at/ (accessed on 26 March 2015).
  40. Harzing, A.W. Publish or Perish. Available online: http://www.harzing.com/pop.htm (accessed on 26 March 2015).
  41. Maas, H.-G.; Vosselman, G. Two algorithms for extracting building models from raw laser altimetry data. ISPRS J. Photogramm. Remote Sens. 1999, 54, 153–163. [Google Scholar] [CrossRef]
  42. Liu, C.; Shi, B.; Yang, X.; Li, N.; Wu, H. Automatic buildings extraction from LiDAR data in urban area by neural oscillator network of visual cortex. IEEE J. Sel. Top. Appl. Earth Obs. Remote Sens. 2013, 6, 2008–2019. [Google Scholar] [CrossRef]
  43. Zhang, K.; Yan, J.; Chen, S. Automatic construction of building footprints from airborne LIDAR data. IEEE Trans. Geosci. Remote Sens. 2006, 44, 2523–2533. [Google Scholar] [CrossRef]
  44. Rottensteiner, F. Automatic generation of high-quality building models from lidar data. IEEE Comput. Graph. Appl. 2003, 23, 42–50. [Google Scholar] [CrossRef]
  45. Dorninger, P.; Pfeifer, N. A comprehensive automated 3D approach for building extraction, reconstruction, and regularization from airborne laser scanning point clouds. Sensors 2008, 8, 7323–7343. [Google Scholar] [CrossRef]
  46. Verma, V.; Kumar, R.; Hsu, S. 3D building detection and modeling from aerial lidar data. Comput. Vis. Pattern 2006, 2, 2213–2220. [Google Scholar]
  47. Sampath, A.; Shan, J. Segmentation and reconstruction of polyhedral building roofs from aerial lidar point clouds. IEEE Trans. Geosci. Remote Sens. 2010, 48, 1554–1567. [Google Scholar] [CrossRef]
  48. Gamba, P.; Houshmand, B. Digital surface models and building extraction: A comparison of IFSAR and LIDAR data. IEEE Trans. Geosci. Remote Sens. 2000, 38, 1959–1968. [Google Scholar] [CrossRef]
  49. Kim, K.; Shan, J. Building roof modeling from airborne laser scanning data based on level set approach. ISPRS J. Photogramm. Remote Sens. 2011, 66, 484–497. [Google Scholar] [CrossRef]
  50. Chen, L.; Teo, T.; Rau, J. Building reconstruction from LIDAR data and aerial imagery. In Proceedings 2005 IEEE International Geoscience and Remote Sensing Symposium, Seoul, Korea, 25–29 July 2005; Volume 4, pp. 2846–2849.
  51. Cheng, L.; Gong, J.; Li, M.; Liu, Y. 3D building model reconstruction from multi-view aerial imagery and lidar data. Photogramm. Eng. Remote Sens. 2011, 77, 125–139. [Google Scholar] [CrossRef]
  52. Dorninger, P.; Nothegger, C. 3D segmentation of unstructured point clouds for building modelling. Photogramm. Image Anal. Proc. 2007, 36, 191–196. [Google Scholar]
  53. Awrangjeb, M.; Zhang, C.; Fraser, C. S. Automatic extraction of building roofs using LIDAR data and multispectral imagery. ISPRS J. Photogramm. Remote Sens. 2013, 83, 1–18. [Google Scholar] [CrossRef]
  54. Priestnall, G.; Jaafar, J.; Duncan, a. Extracting urban features from LiDAR digital surface models. Comput. Environ. Urban Syst. 2000, 24, 65–78. [Google Scholar] [CrossRef]
  55. Rottensteiner, F.; Trinder, J.; Clode, S.; Kubik, K. Building detection by fusion of airborne laser scanner data and multi-spectral images: Performance evaluation and sensitivity analysis. ISPRS J. Photogramm. Remote Sens. 2007, 62, 135–149. [Google Scholar] [CrossRef]
  56. Sampath, A.; Shan, J. Building boundary tracing and regularization from airborne LiDAR point clouds. Photogramm. Eng. Remote Sens. 2007, 73, 805–812. [Google Scholar] [CrossRef]
  57. Awrangjeb, M.; Ravanbakhsh, M.; Fraser, C.S. Automatic detection of residential buildings using LIDAR data and multispectral imagery. ISPRS J. Photogramm. Remote Sens. 2010, 65, 457–467. [Google Scholar] [CrossRef]
  58. Guo, L.; Chehata, N.; Mallet, C.; Boukir, S. Relevance of airborne lidar and multispectral image data for urban scene classification using Random Forests. ISPRS J. Photogramm. Remote Sens. 2011, 66, 56–66. [Google Scholar] [CrossRef]
  59. Yu, B.; Liu, H.; Wu, J.; Hu, Y.; Zhang, L. Automated derivation of urban building density information using airborne LiDAR data and object-based method. Landsc. Urban Plan. 2010, 98, 210–219. [Google Scholar] [CrossRef]
  60. Awrangjeb, M.; Zhang, C.; Fraser, C.S. Building detection in complex scenes thorough effective separation of buildings from trees. Photogramm. Eng. Remote Sens. 2012, 78, 729–745. [Google Scholar] [CrossRef]
  61. Kabolizade, M.; Ebadi, H.; Ahmadi, S. An improved snake model for automatic extraction of buildings from urban aerial images and LiDAR data. Comput. Environ. Urban Syst. 2010, 34, 435–441. [Google Scholar] [CrossRef]
  62. Matikainen, L.; Hyyppä, J.; Ahokas, E.; Markelin, L.; Kaartinen, H. Automatic detection of buildings and changes in buildings for updating of maps. Remote Sens. 2010, 2, 1217–1248. [Google Scholar] [CrossRef]
  63. Salah, M.; Trinder, J.; Shaker, A. Evaluation of the self-organizing map classifier for building detection from lidar data and multispectral aerial images. J. Spat. Sci. 2009, 54, 15–34. [Google Scholar] [CrossRef]
  64. Rottensteiner, F.; Trinder, J.; Clode, S.; Kubik, K.; Lovell, B.C. Building detection by Dempster-Shafer fusion of LIDAR data and multispectral aerial imagery. In Proceedings of the International Conference on Pattern Recognition, Cambridge, UK, 24–26 August 2004; pp. 339–342.
  65. Mongus, D.; Lukač, N.; Žalik, B. Ground and building extraction from LiDAR data based on differential morphological profiles and locally fitted surfaces. ISPRS J. Photogramm. Remote Sens. 2014, 93, 145–156. [Google Scholar] [CrossRef]
  66. Rottensteiner, F.; Sohn, G.; Gerke, M.; Wegner, J.D.; Breitkopf, U.; Jung, J. Results of the ISPRS benchmark on urban object detection and 3D building reconstruction. ISPRS J. Photogramm. Remote Sens. 2014, 93, 256–271. [Google Scholar] [CrossRef]
  67. Morgan, M.; Tempfli, K. Automatic building extraction from airborne laser scanning data. Arch. Photogramm. Remote Sens. 2000, 33, 616–623. [Google Scholar]
  68. Wang, Z.; Schenk, T. Building extraction and reconstruction from LiDAR data. Int. Arch. Photogramm. Remote Sens. Spat. Inf. Sci. 2000, XXXIII, 958–964. [Google Scholar]
  69. Rottensteiner, F.; Briese, C. A new method for building extraction in urban areas from high-resolution LIDAR data. Int. Arc. Photogramm. Remote Sens. Spat. Inf. Sci. 2002, 34, 295–301. [Google Scholar]
  70. Morgan, M.; Habib, A. Interpolation of lidar data and automatic building extraction. Available online: http://twiki.cis.rit.edu/twiki/pub/Main/FengAndSteveSIMG786/interpolationoflidardataandautomaticbuildingextraction.pdf (accessed on 31 March 2015).
  71. Elaksher, A.F.; Bethel, J.S. Building extraction using LiDAR data. In Proceedings of the ASPRS-ACSM Annual Conference and FIG XXII Congress, Washington, DC, USA, 22–26 April 2002.
  72. Sohn, G.; Dowman, I. Building extraction using Lidar DEMs and Ikonos images. Available online: http://www.isprs.org/proceedings/XXXIV/3-W13/papers/Sohn_ALSDD2003.pdf (accessed on 31 March 2015).
  73. Cho, W.; Jwa, Y.; Chang, H.; Lee, S. Pseudo-Grid based building extraction using airborne LIDAR data. In Proceedings of the ISPRS Congress Istanbul 2004, Istanbul, Turkey, 12–23 July 2004; pp. 3–6.
  74. Zhou, Q.-Y.; Neumann, U. Fast and extensible building modeling from airborne LiDAR data. In Proceedings of the 16th ACM SIGSPATIAL International Conference on Advances in Geographic Information Systems—GIS ’08, Irvine, CA, USA, 5–7 November 2008.
  75. Sampath, A.; Shan, J. Building roof segmentation and reconstruction from LiDAR point clouds using clustering techniques. Int. Arch. Photogramm. Remote Sens. Spat. Inf. Sci. 2008, 37, 279–284. [Google Scholar]
  76. Kada, M.; McKinley, L. 3D building reconstruction from LiDAR based on a cell decomposition approach. Int. Arch. Photogramm. Remote Sens. Spat. Inf. Sci. 2009, 38, W4. [Google Scholar]
  77. Höfle, B.; Mücke, W.; Dutter, M.; Rutzinger, M.; Dorninger, P. Detection of building regions using airborne LiDAR—A new combination of raster and point cloud based GIS methods. Available online: http://www.agit.at/php_files/myagit/papers/2009/7504.pdf (accessed on 31 March 2015).
  78. Höfle, B.; Vetter, M. Water surface mapping from airborne laser scanning using signal intensity and elevation data. Earth Surf. Process. Landforms 2009, 34, 1635–1649. [Google Scholar] [CrossRef]
  79. Wang, Z.; Schenk, T. Extracting building information from lidar data. In Proceedings of the ISPRS Commission III Symposium on Object Recognition and Scene Classification from Multispectral and Multisensor Pixels, Columbus, OH, USA, 6–10 July 1998; pp. 279–284.
  80. Wei, S. Building boundary extraction based on lidar point clouds data. Available online: http://www.isprs.org/proceedings/XXXVII/congress/3b_pdf/37.pdf (accessed on 31 March 2015).
  81. Ekhtari, N.; Sahebi, M. Automatic building detection from LIDAR point cloud data. Available online: http://www.isprs.org/proceedings/XXXVII/congress/4_pdf/84.pdf (accessed on 31 March 2015).
  82. Nardinocchi, C.; Scaioni, M. Building extraction from LIDAR data. In Proceedings of the IEEE/ISPRS Joint Workshop on Remote Sensing and Data Fusion over Urban Areas, Rome, Italy, 8–9 November 2001; pp. 79–83.
  83. Weed, C.; Crawford, M.; Neuenschwander, A.; Gutierrez, R. Classification of LIDAR data using a lower envelope follower and gradient-based operator. In Proceedings of the International Geoscience and Remote Sensing Symposium (IGARSS), Toronto, ON, Canada, 24–28 June 2002; pp. 1384–1386.
  84. Peternell, M.; Steiner, T. Reconstruction of piecewise planar objects from point clouds. Comput. Des. 2004, 36, 333–342. [Google Scholar]
  85. Mitra, V.; Wang, C.-J.; Banerjee, S. Lidar detection of underwater objects using a neuro-SVM-based architecture. IEEE Trans. Neural Netw. 2006, 17, 717–731. [Google Scholar] [CrossRef] [PubMed]
  86. Hongjian, Y.; Shiqiang, Z. 3D building reconstruction from aerial CCD image and sparse laser sample data. Opt. Lasers Eng. 2006, 44, 555–566. [Google Scholar] [CrossRef]
  87. Oude Elberink, S.; Vosselman, G. Quality analysis on 3D building models reconstructed from airborne laser scanning data. ISPRS J. Photogramm. Remote Sens. 2011, 66, 157–165. [Google Scholar] [CrossRef]
  88. Zhuang, Y.; Liu, X.; Nguyen, T.; He, Q.; Hong, S. Global remote sensing research trends during 1991–2010: A bibliometric analysis. Scientometrics 2012, 96, 203–219. [Google Scholar] [CrossRef]
  89. Rutzinger, M.; Rottensteiner, F.; Pfeifer, N. Extraction from airborne laser scanning. IEEE J. Sel. Top. Appl. Earth Obs. Remote Sens. 2009, 2, 11–20. [Google Scholar] [CrossRef]
  90. Rottensteiner, F.; Sohn, G.; Jung, J. The ISPRS benchmark on urban object classification and 3D building reconstruction. ISPRS Ann. Photogramm. Remote Sens. Spat. Inf. Sci. 2012, I-3, 293–298. [Google Scholar] [CrossRef]
  91. Jochem, A.; Höfle, B.; Wichmann, V.; Rutzinger, M.; Zipf, A. Area-wide roof plane segmentation in airborne LiDAR point clouds. Comput. Environ. Urban Syst. 2012, 36, 54–64. [Google Scholar] [CrossRef]
  92. O’Neil-Dunne, J.P.M.; MacFaden, S.W.; Royar, A.R.; Pelletier, K.C. An object-based system for LiDAR data fusion and feature extraction. Geocarto Int. 2012, 28, 1–16. [Google Scholar]
  93. Vosselman, G. Fusion of laser scanning data, maps, and aerial photographs for building reconstruction. In Proceedings of the International Geoscience and Remote Sensing Symposium (IGARSS), Toronto, ON, Canada, 24–28 June 2002; pp. 85–88.
  94. Susaki, J. Knowledge-Based modeling of buildings in dense urban areas by combining airborne LiDAR data and aerial images. Remote Sens. 2013, 5, 5944–5968. [Google Scholar] [CrossRef] [Green Version]
  95. Kong, D.; Xu, L.; Li, X.; Li, S. K-plane-based classification of airborne LiDAR data for accurate building roof measurement. IEEE Trans. Instrum. Meas. 2014, 63, 1200–1214. [Google Scholar] [CrossRef]
  96. Peinecke, N.; Lueken, T.; Korn, B.R. Lidar simulation using graphics hardware acceleration. In Proceedings of the AIAA/IEEE Digital Avionics Systems Conference, St. Paul, MN, USA, 26–30 October 2008; pp. 4D41–4D48.
  97. Evans, J.S.; Hudak, A.T.; Faux, R.; Smith, A.M.S. Discrete return lidar in natural resources: Recommendations for project planning, data processing, and deliverables. Remote Sens. 2009, 1, 776–794. [Google Scholar] [CrossRef]
  98. Mayer, H.; Hinz, S.; Bacher, U.; Baltsavias, E. A test of automatic road extraction approaches. Int. Arch. Photogramm. Remote Sens. Spat. Inf. Sci. 2006, 36, 209–214. [Google Scholar]
  99. Alexander, C.; Smith-Voysey, S.; Jarvis, C.; Tansey, K. Integrating building footprints and LiDAR elevation data to classify roof structures and visualise buildings. Comput. Environ. Urban Syst. 2009, 33, 285–292. [Google Scholar] [CrossRef]
  100. Tomljenovic, I.; Rousell, A. Influence of point cloud density on the results of automated Object-Based building extraction from ALS data. In Proceedings of the AGILE 2014 International Conference on Geographic Information Science, Castellon, Spain, 3–6 June 2014.
  101. Cheng, L.; Tong, L.; Chen, Y.; Zhang, W.; Shan, J.; Liu, Y.; Li, M. Integration of LiDAR data and optical multi-view images for 3D reconstruction of building roofs. Opt. Lasers Eng. 2013, 51, 493–502. [Google Scholar] [CrossRef]
  102. Farris, G.S.; Smith, G.J.; Crane, M.P.; Demas, C.R.; Robbins, L.L.; Lavoie, D.L. Science and the storms : The USGS response to the hurricanes of 2005. U.S. Geol. Surv. Circ. 2007, 1306, 283–295. [Google Scholar]
  103. Klonner, C.; Barron, C.; Neis, P.; Höfle, B. Updating digital elevation models via change detection and fusion of human and remote sensor data in urban environments. Int. J. Digit. Earth 2014, 8, 1–19. [Google Scholar]

