
A Sharable and Efficient Metadata Model for Heterogeneous Earth Observation Data Retrieval in Multi-Scale Flood Mapping


Abstract
:
1. Introduction

| Data System | NASA ECHO | NOAA CLASS | USGS Landsat | INPE CBERS |
|---|---|---|---|---|
| Name of EO data system | NASA Earth Observing System Clearing House | NOAA Comprehensive Large Array-data Stewardship System | USGS Landsat data system | INPE China-Brazil Earth Resources Satellite data system |
| Producer | NASA (America) | NOAA (America) | USGS (America) | INPE (China) |
| Access protocol | ECHO WSDL | NEAAT API | Http web method | Http web method |
| Metadata model | Granule/collection | Inventory/Catalog | Federal Geographic Data Committee (FGDC) Content Standard for Digital Geospatial Metadata | FGDC Content Standard for Digital Geospatial Metadata |
| Response dataset | GranuleURMetadata | InventoryDataset | FGDC Metadata | FGDC Metadata |
| Particular features | Open | Open | None | None |
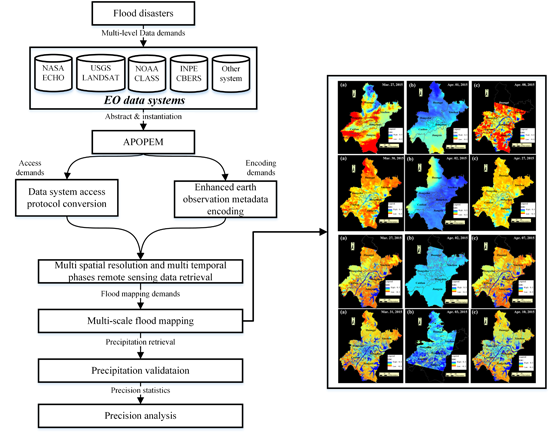
2. Methodology

| Parts in the Model | Explanations or Meaning |
|---|---|
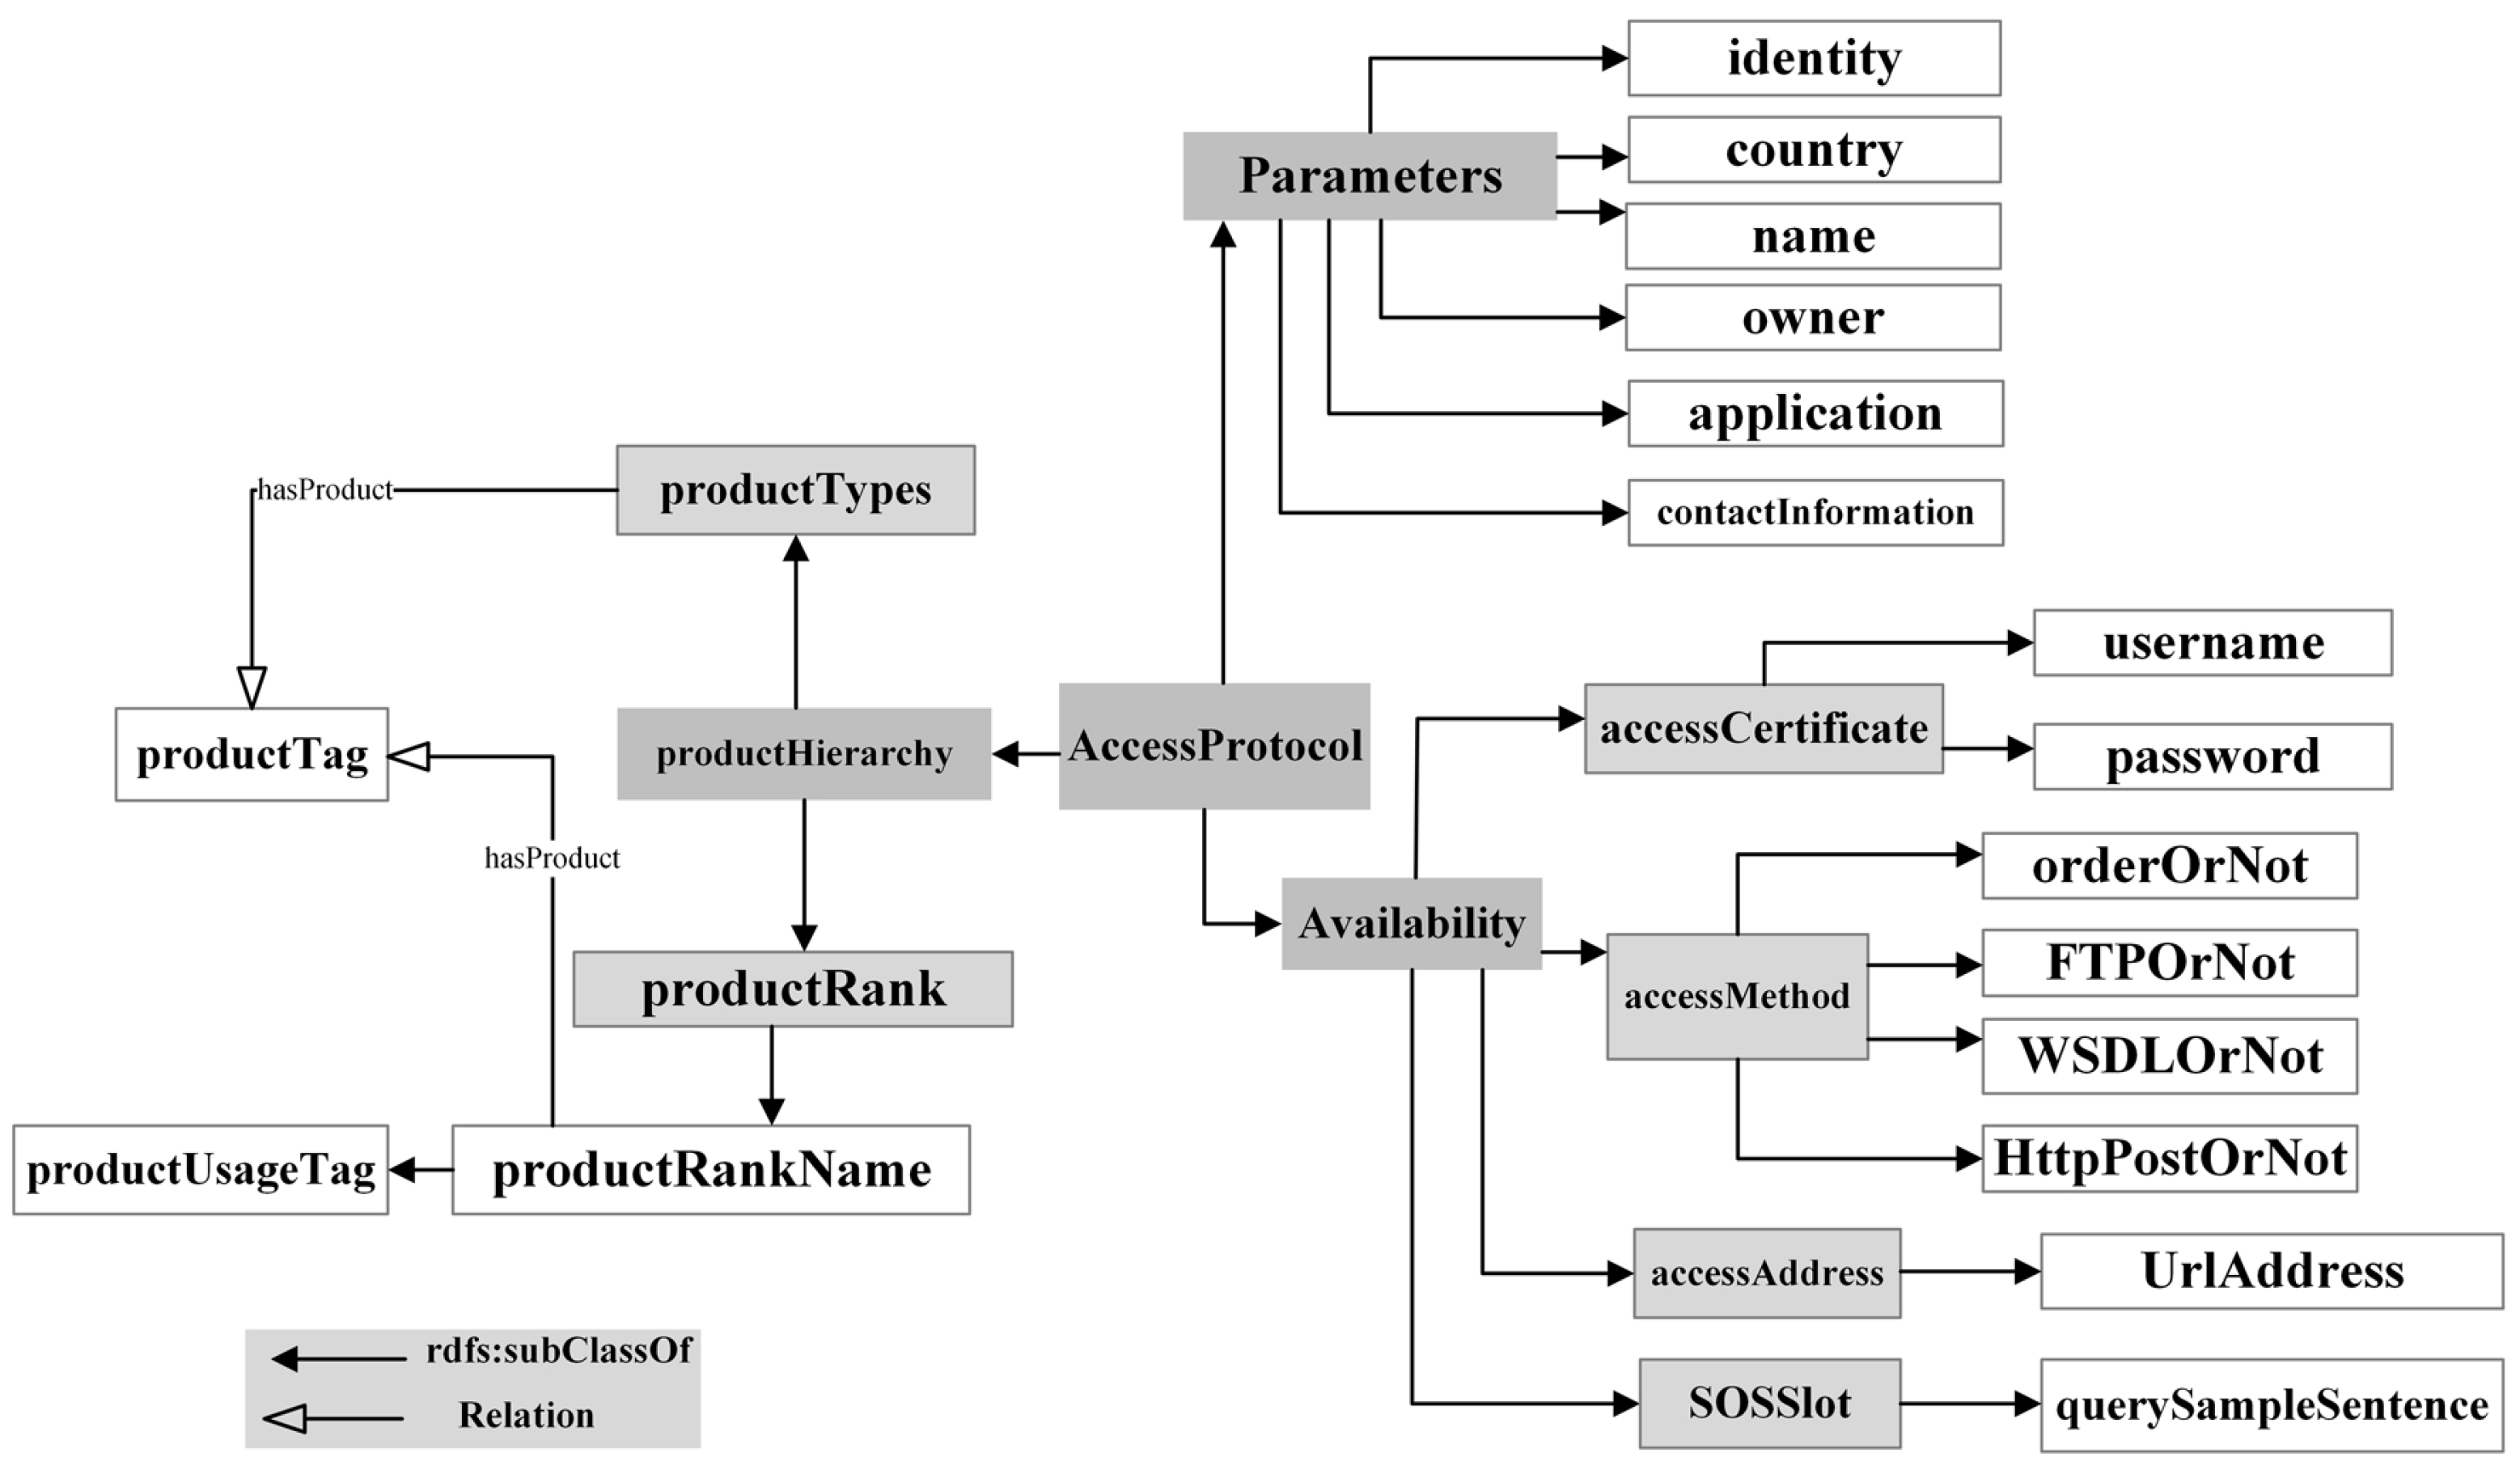
| AccessProtocol | The access protocol of heterogeneous EO data system |
| Availability | The necessary parameters while accessing EO data system, such as the username and password |
| productHierarchy | The product levels’ classification system |
| ProductTypes | The type of product |
| productRank | Which level the product belongs to |
| productRankName | The level name of the product |
| productTag | The tag name of the product |
| SOSSlot | The extension designed to be the access protocol for SOS |
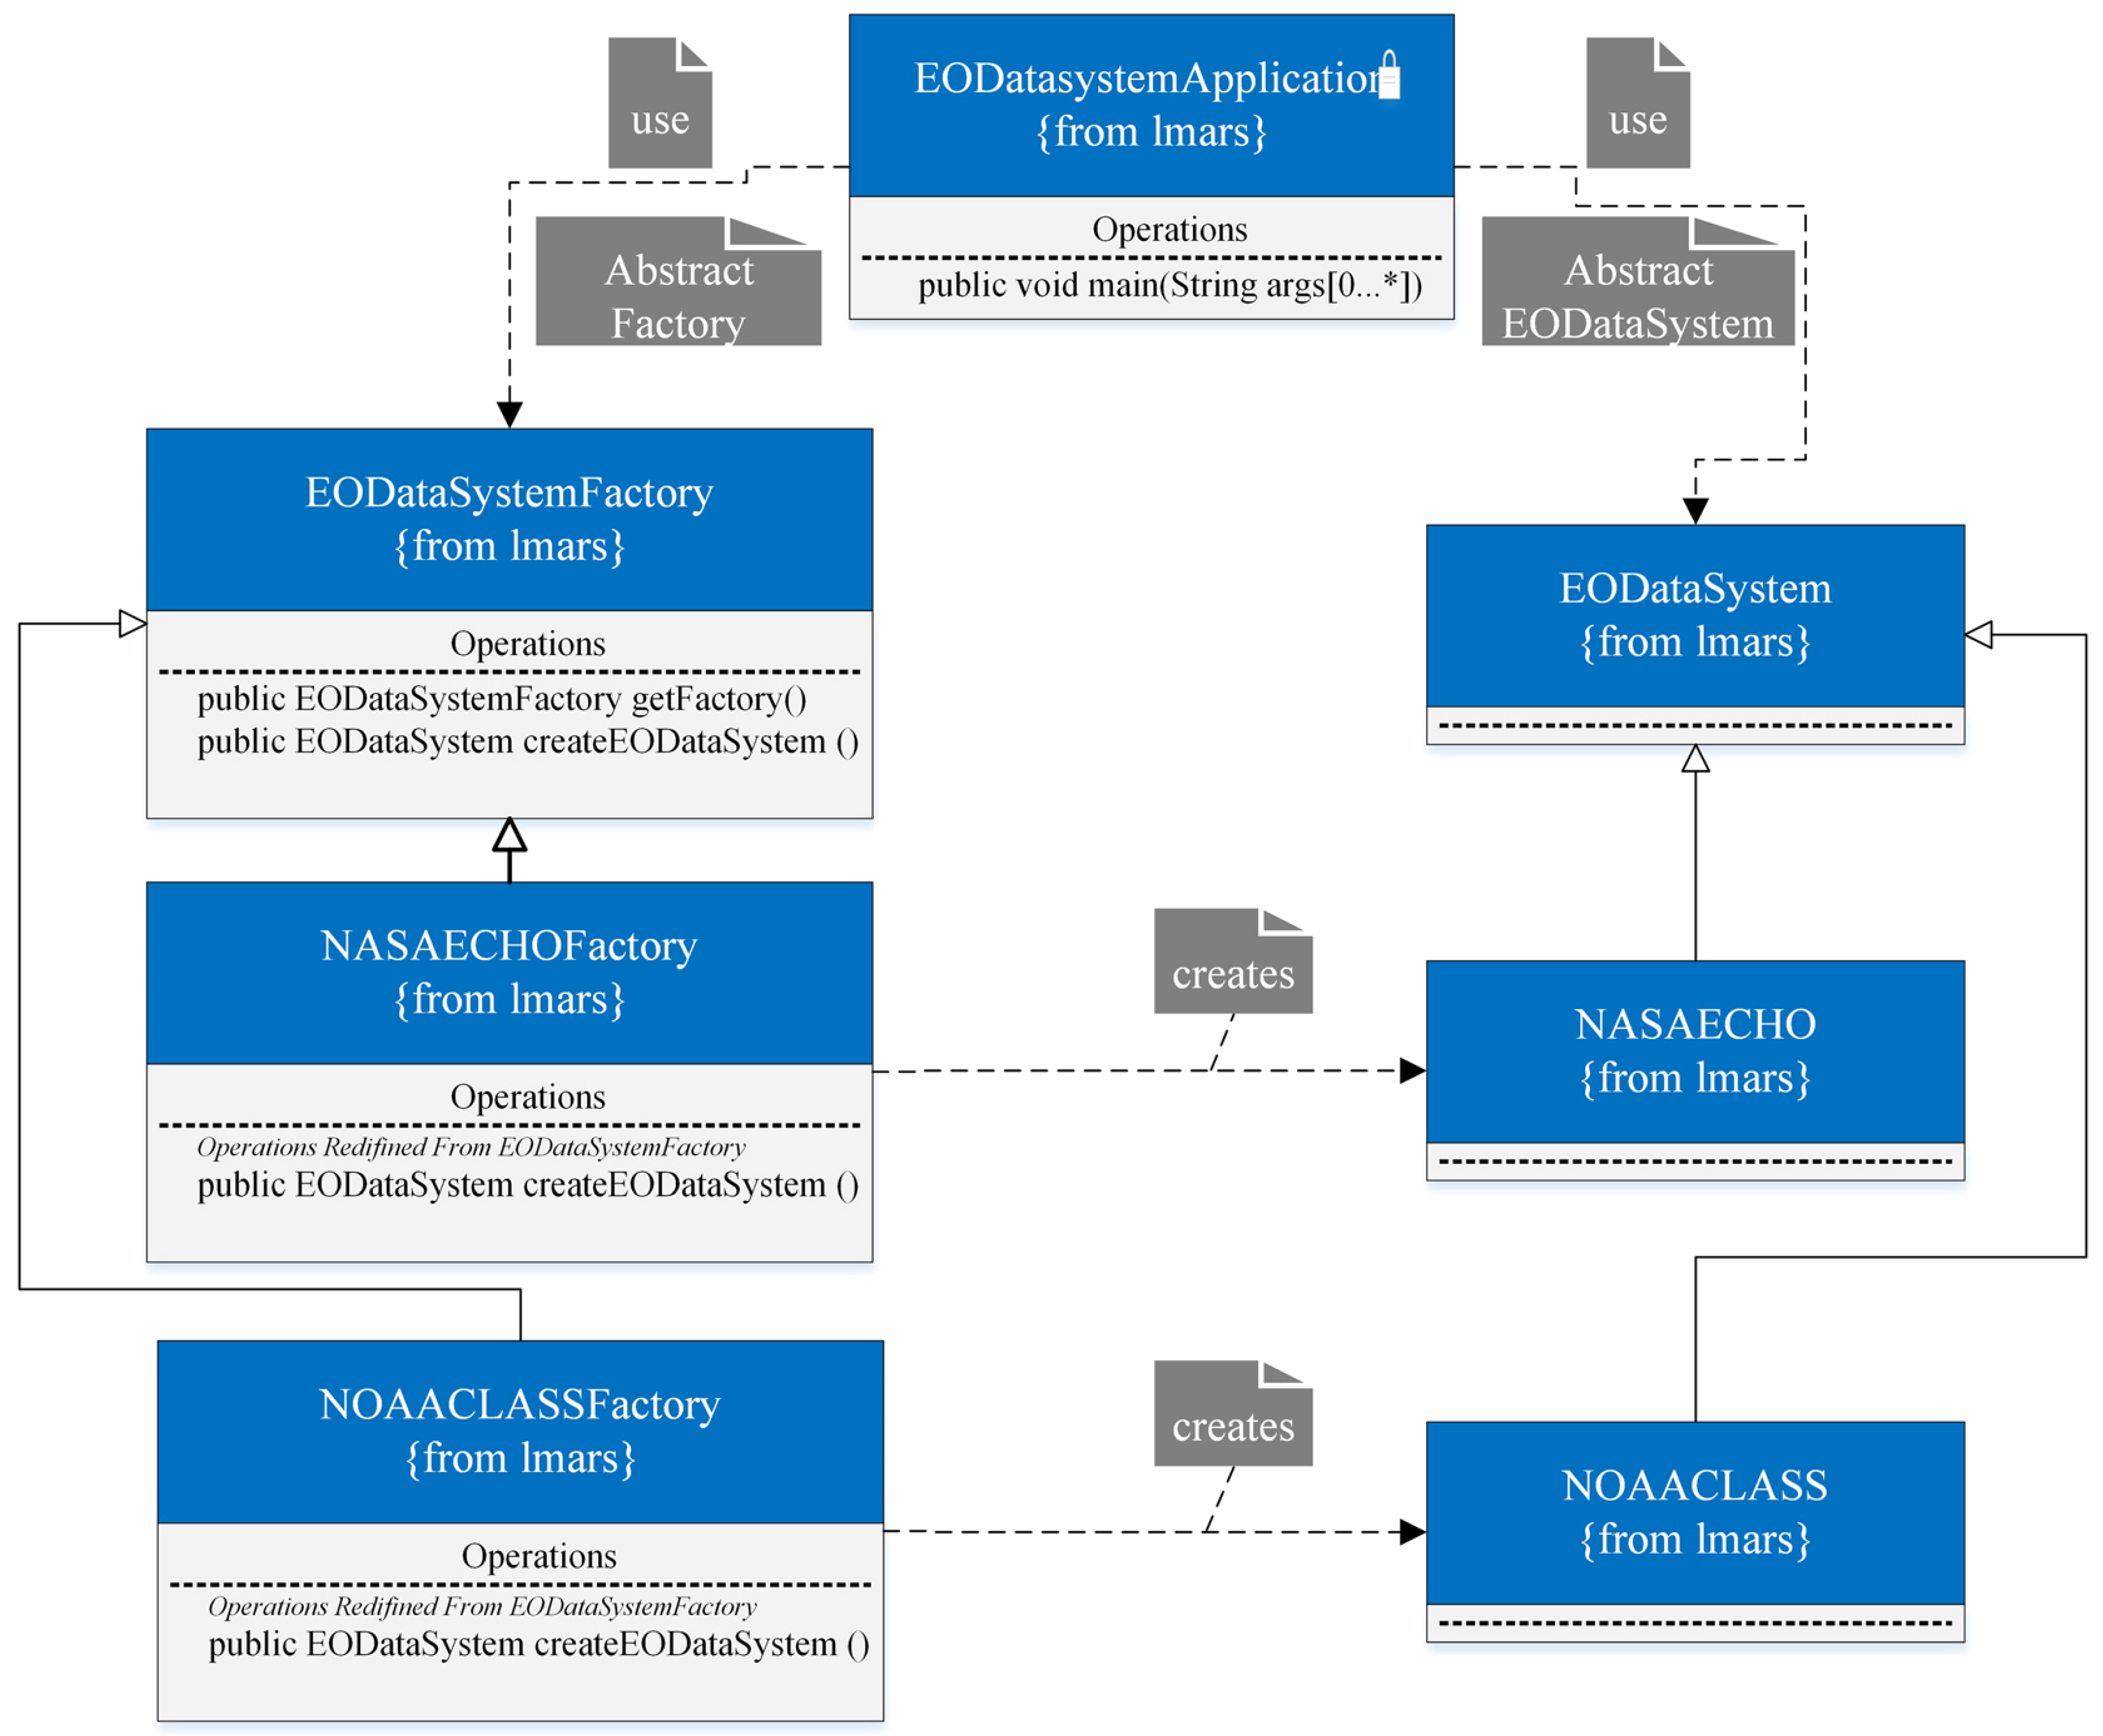
| EODataSystemFactory | Class of the EO data system abstract factory |
| createEODataSystem | Class of the instantiated EO data system |
| EODataSystem | Class of the EO data system |
| NOAACLASSFactory | Object of the EO data system instantiated by NOAA CLASS |
| NASAECHOFactory | Object of the EO data system instantiated by NASA ECHO |
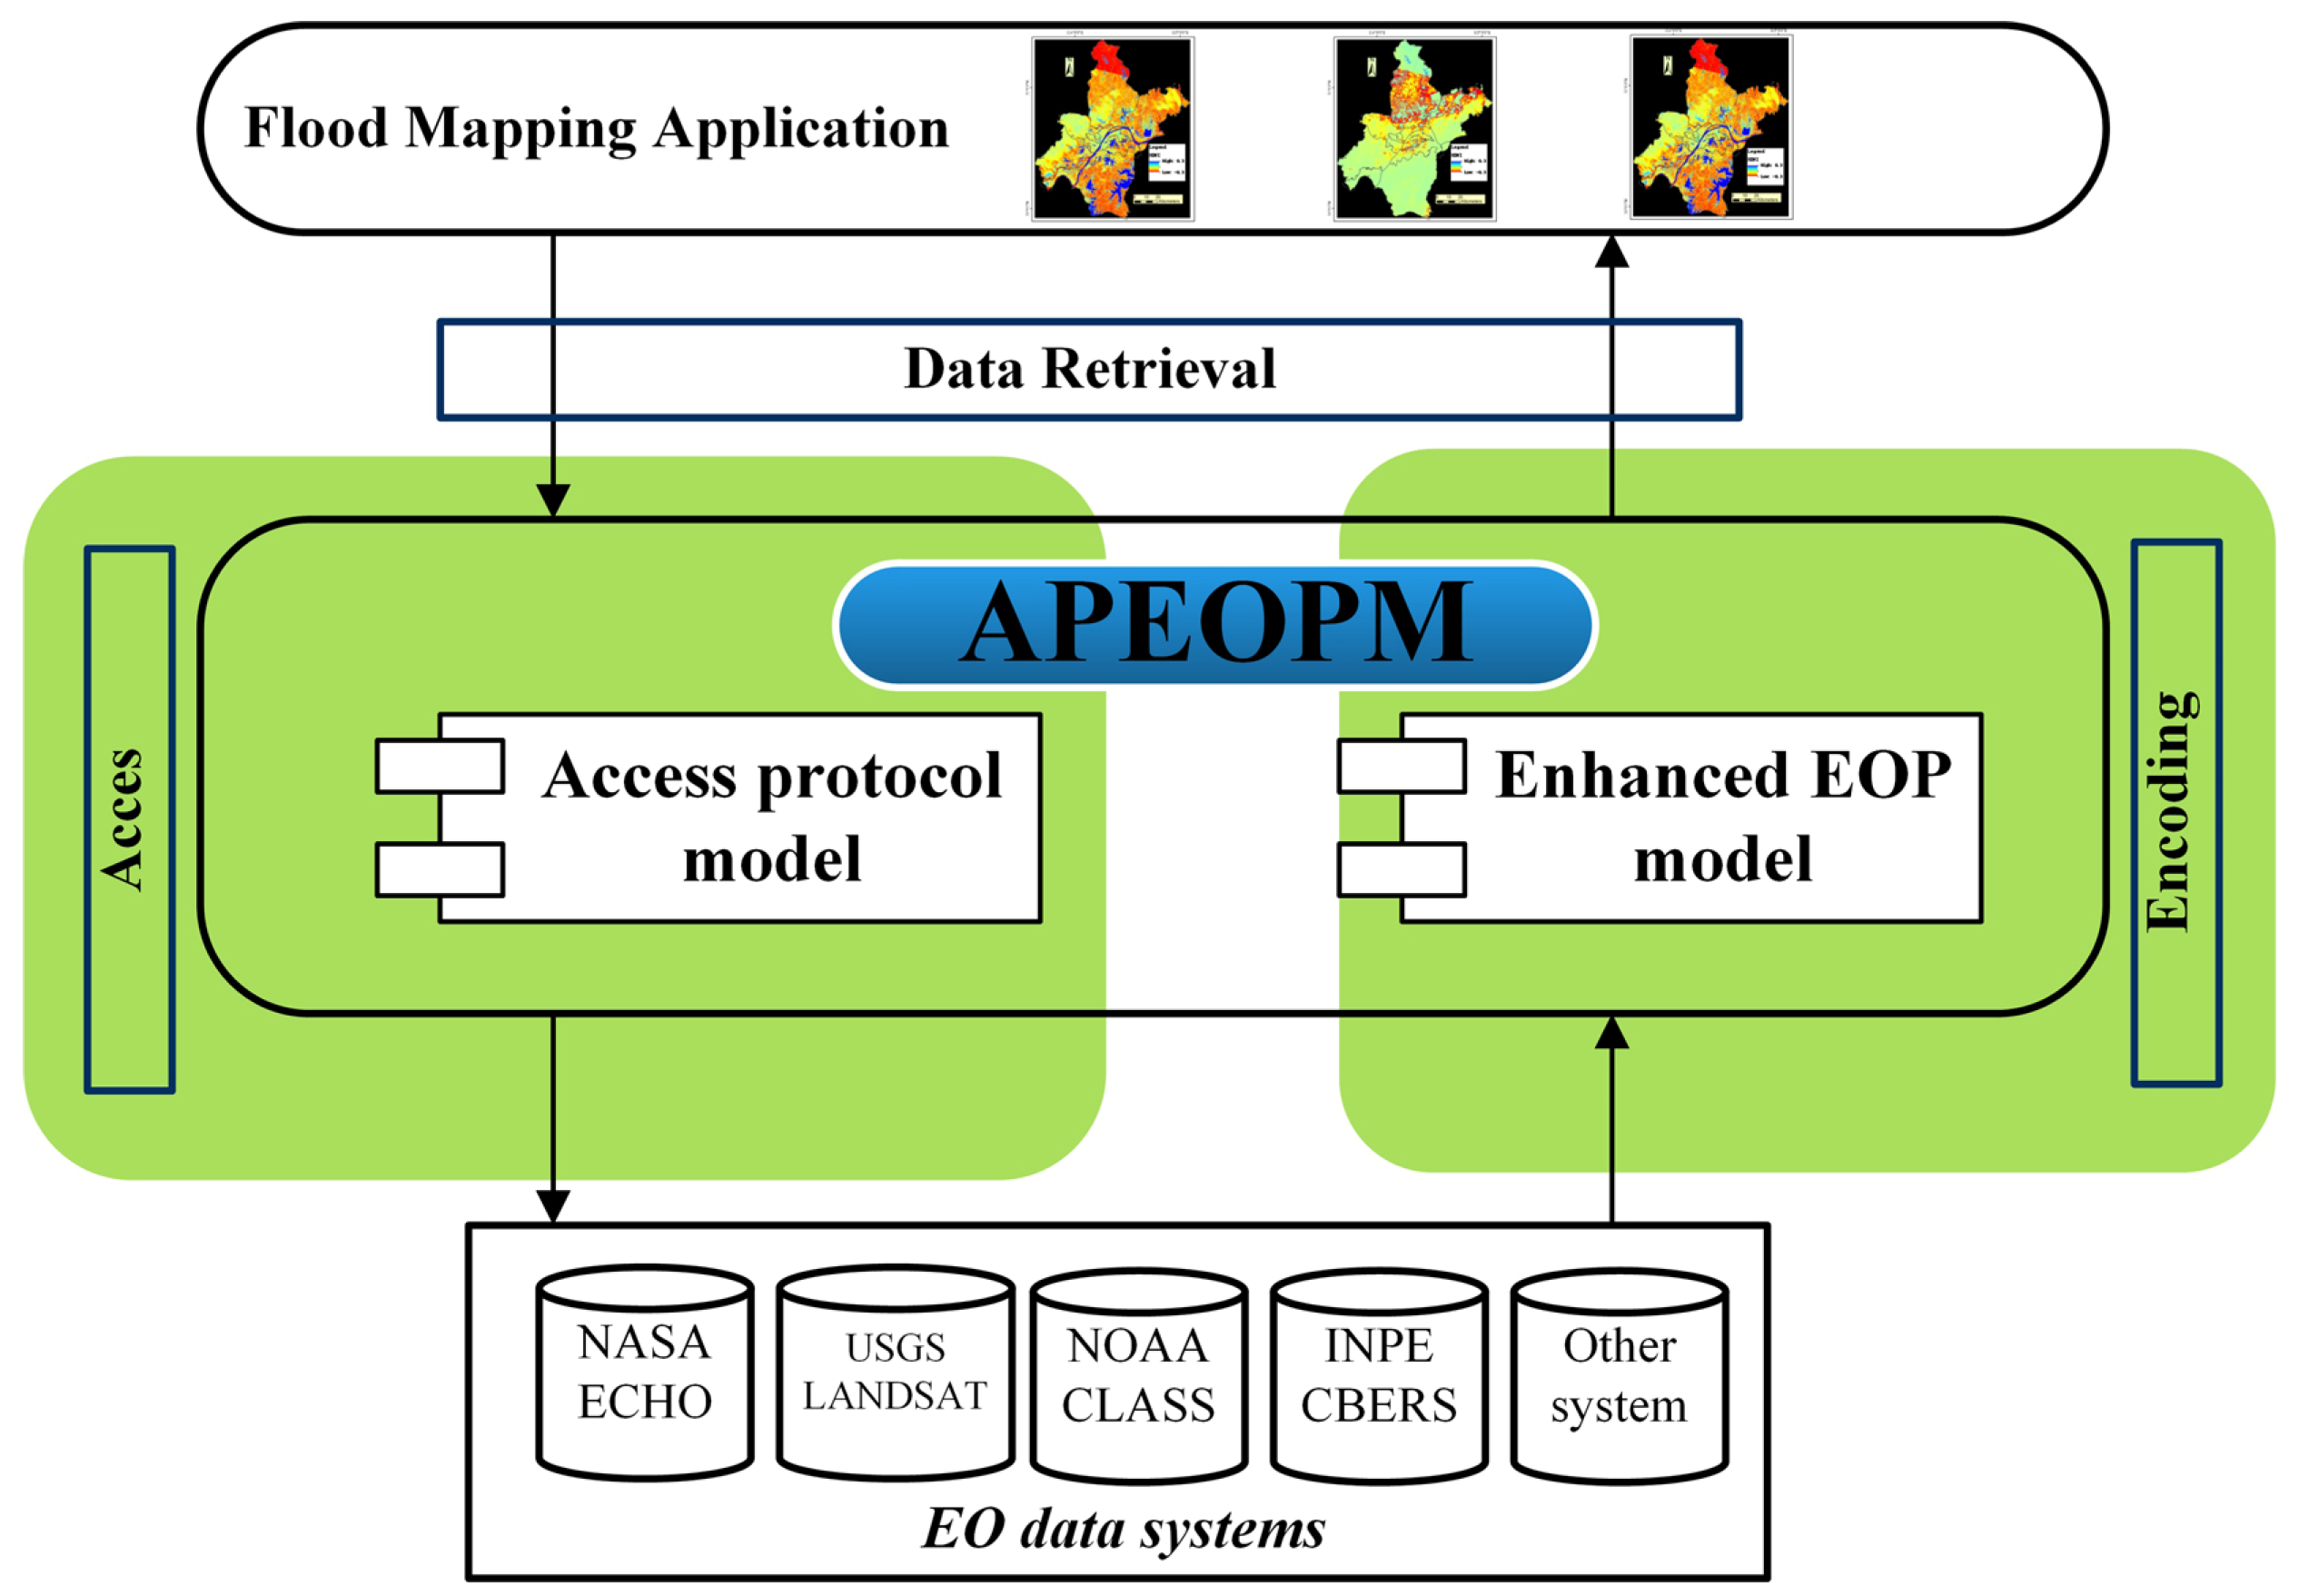
2.1. Access Protocol Model for the Heterogeneous EO Data System

- (1)
- The model helps the user or application search the EO data system access protocols more precisely when the data type and data hierarchy are rich in semantics. If a user searches the product name, such as “MODIS Level 3 ice and snow cover product”, the semantic model will search the MOD33, MOD40, MOD42 and MOD43 product by resolving the EO data system access protocol instantiation file. Then, the single result searched for in a single data system will be assembled into a complete result and returned to the user or application [30].
- (2)
- The model helps the user or application search the EO data system access protocol completely when the different data systems and data types are rich in semantics. Different data systems have different data products. The data stored in ECHO MODIS include different grades of MODIS data products, such as Level 0 to 4 data. The data stored in NOAA CLASS consist of different types of AVHRR data and other types of data. The data stored in USGS Landsat include Enhanced Thematic Mapper (ETM+) data, Thematic Mapper data, Multispectral Scanner data, elevation data, Landsat products (e.g., forest and tree data), specified MODIS data (e.g., 32-day composite product and 16-day vegetation index product), AVHRR data (e.g., global land cover product and continuous-field tree cover product), ETM+ mosaics products and TM mosaics products. The resolved data types in a specified data system allow the model to search the data system that contains the requested data product. Then, the single result searched in a single data system is assembled into a complete result and returned to the user or application.
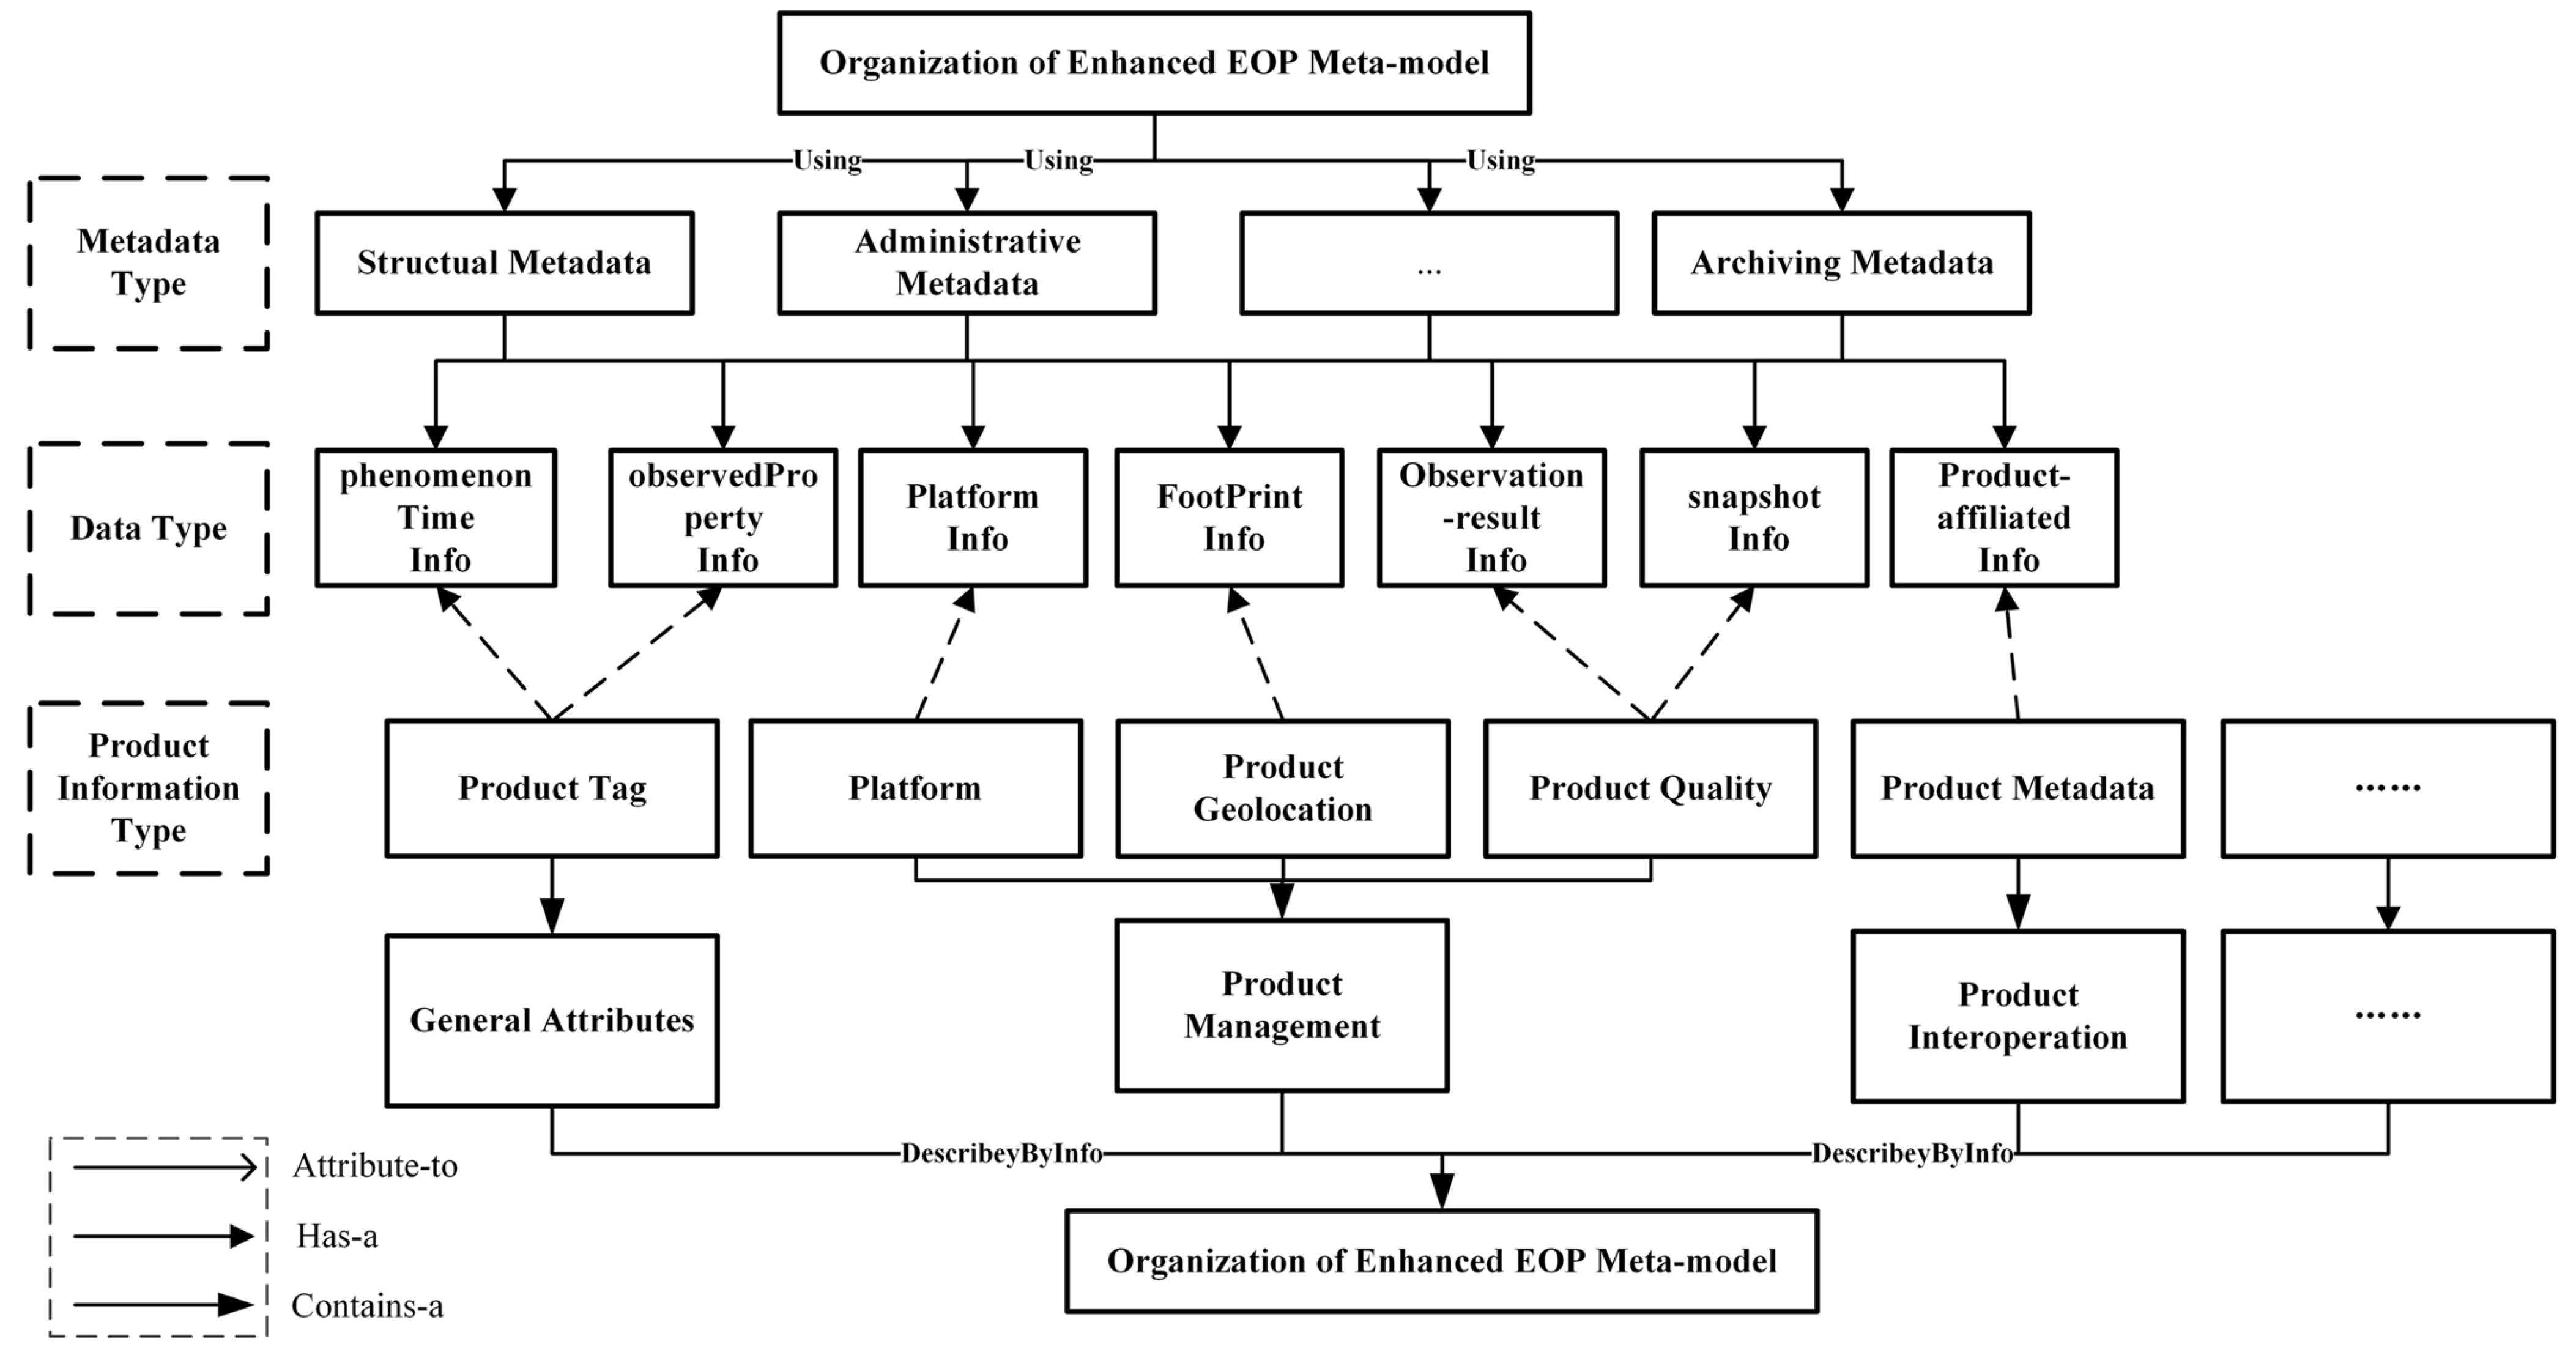
2.2. Enhanced EOP Model for Abundant EO Metadata
| Features | ISO19115 | Geographical Data Description Directory | GB/Z 24357-2009 | EOP Encoding Model | OGC CSW Application Profile for EO Products |
|---|---|---|---|---|---|
| Main aspects | |||||
| PlatformShortName | √ | √ | √ | √ | √ |
| PlatformType | √ | √ | √ | √ | √ |
| SensorShortName | √ | O | O | √ | √ |
| SensorResolution | √ | × | √ | √ | √ |
| temporalDomain | √ | √ | √ | √ | √ |
| spatialDomain | √ | √ | √ | √ | √ |
| FootPrint | × | × | × | √ | √ |
| Snapshot | × | × | × | √ | √ |
| DataSize | √ | O | O | √ | √ |
| DataFormat | √ | O | O | √ | √ |
| DataCenter | √ | √ | √ | √ | √ |
| DayNightFlag | × | × | × | × | × |
| DataSetId | × | × | × | × | × |
| Orderable | × | × | × | × | × |
| Focus | Geographic Metadata | Spatial data | Spatial data formulation | EO metadata | EO metadata |
| Usage | Datasets | Datasets | Datasets | Datasets | Datasets |
| Encoding schema | XML | N/A | XML | XML | XML |

- (1)
- PhenomenonTime information: This information includes the start and end times of observation, which provide temporal information for the product.
- (2)
- ObservedProperty information: This information includes the observational properties obtained during the observation process.
- (3)
- Platform information: Such information includes the name, the type of the platform and the name, type and resolution of the instrument carried on the platform.
- (4)
- FootPrint information: This information includes the coordinates of the boundary points of the observation range and the coordinates of the center point of the observation range. FootPrint information is unique in EO products, which are important for describing the spatial range of EO products.
- (5)
- ObservationResult information: This information includes a space referencing framework, file names and the coverage link address of the specified product.
- (6)
- SnapShot information: This information includes the quick look image of the observation result, followed by the format description of the image. The quick look image can be helpful for identifying the correctness of the image and for previewing EO data.
- (7)
- Result-affiliated information: This information includes the product type, the size of the data pool for a specified product, the name of the product archived at the data center, the data archiving time and the product processing level.
2.3. Adapter for Heterogeneous EO Data Systems

3. Experiment
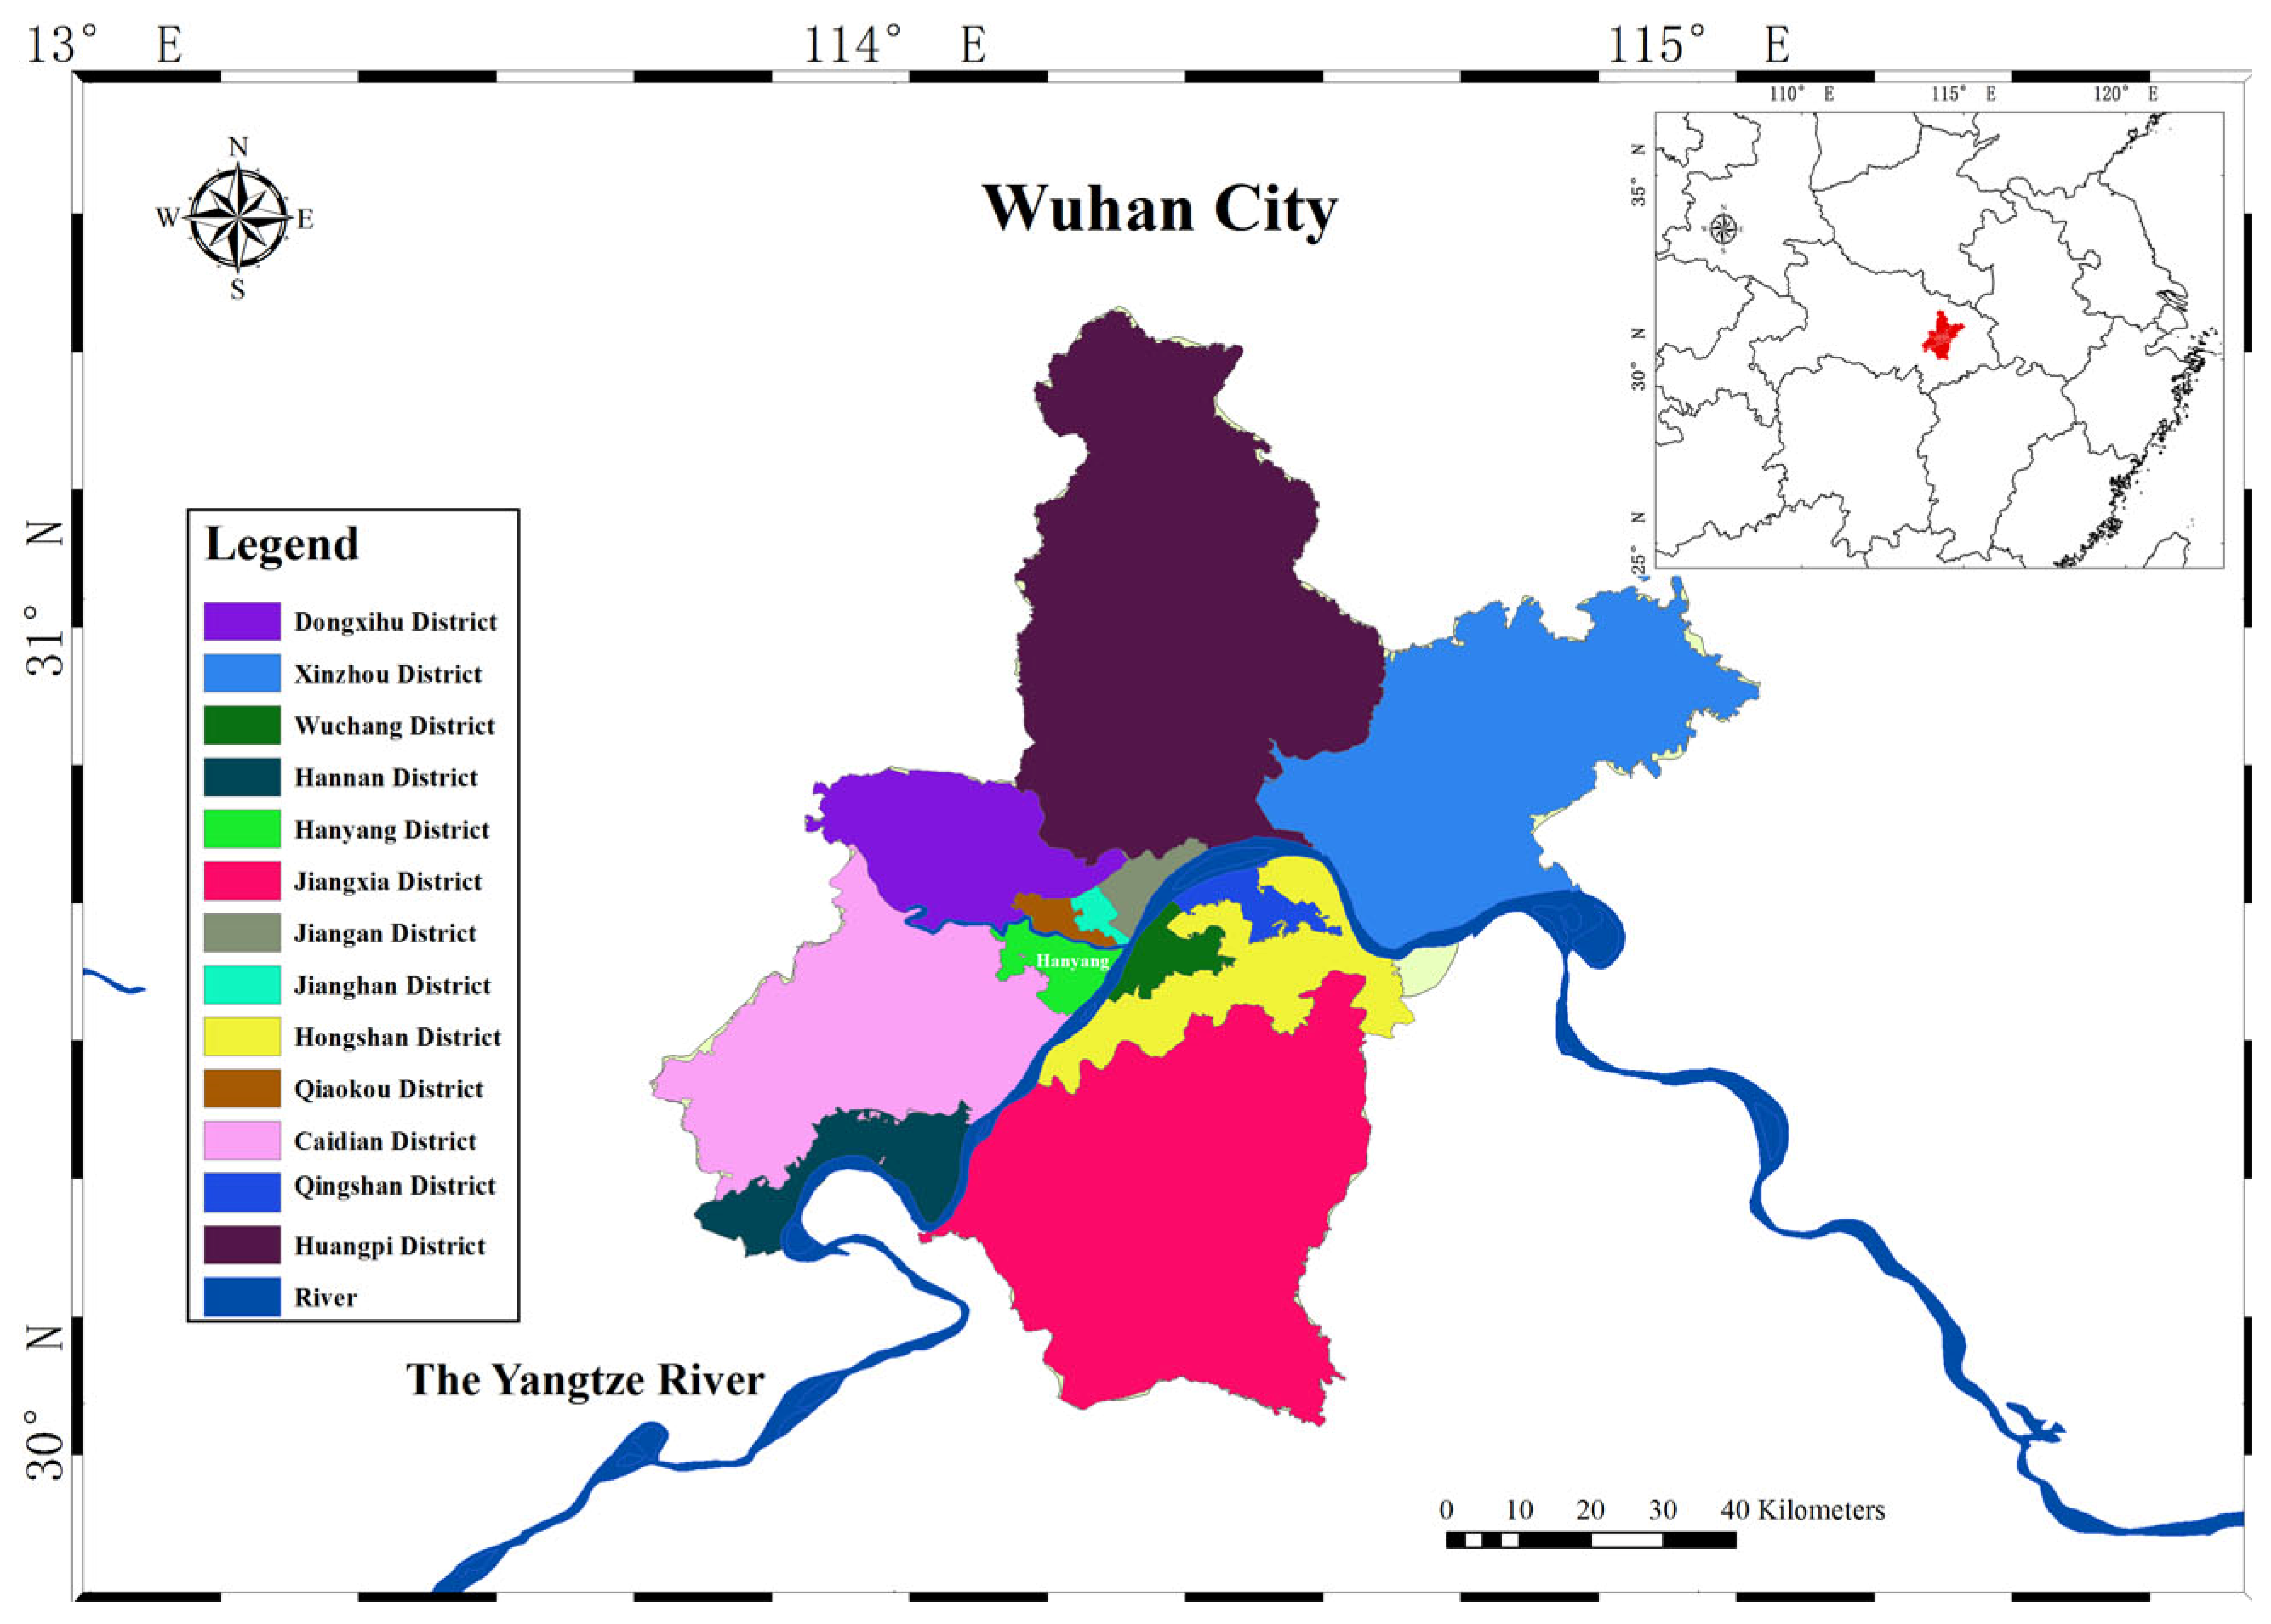
3.1. Study Area

3.2. Data Retrieval
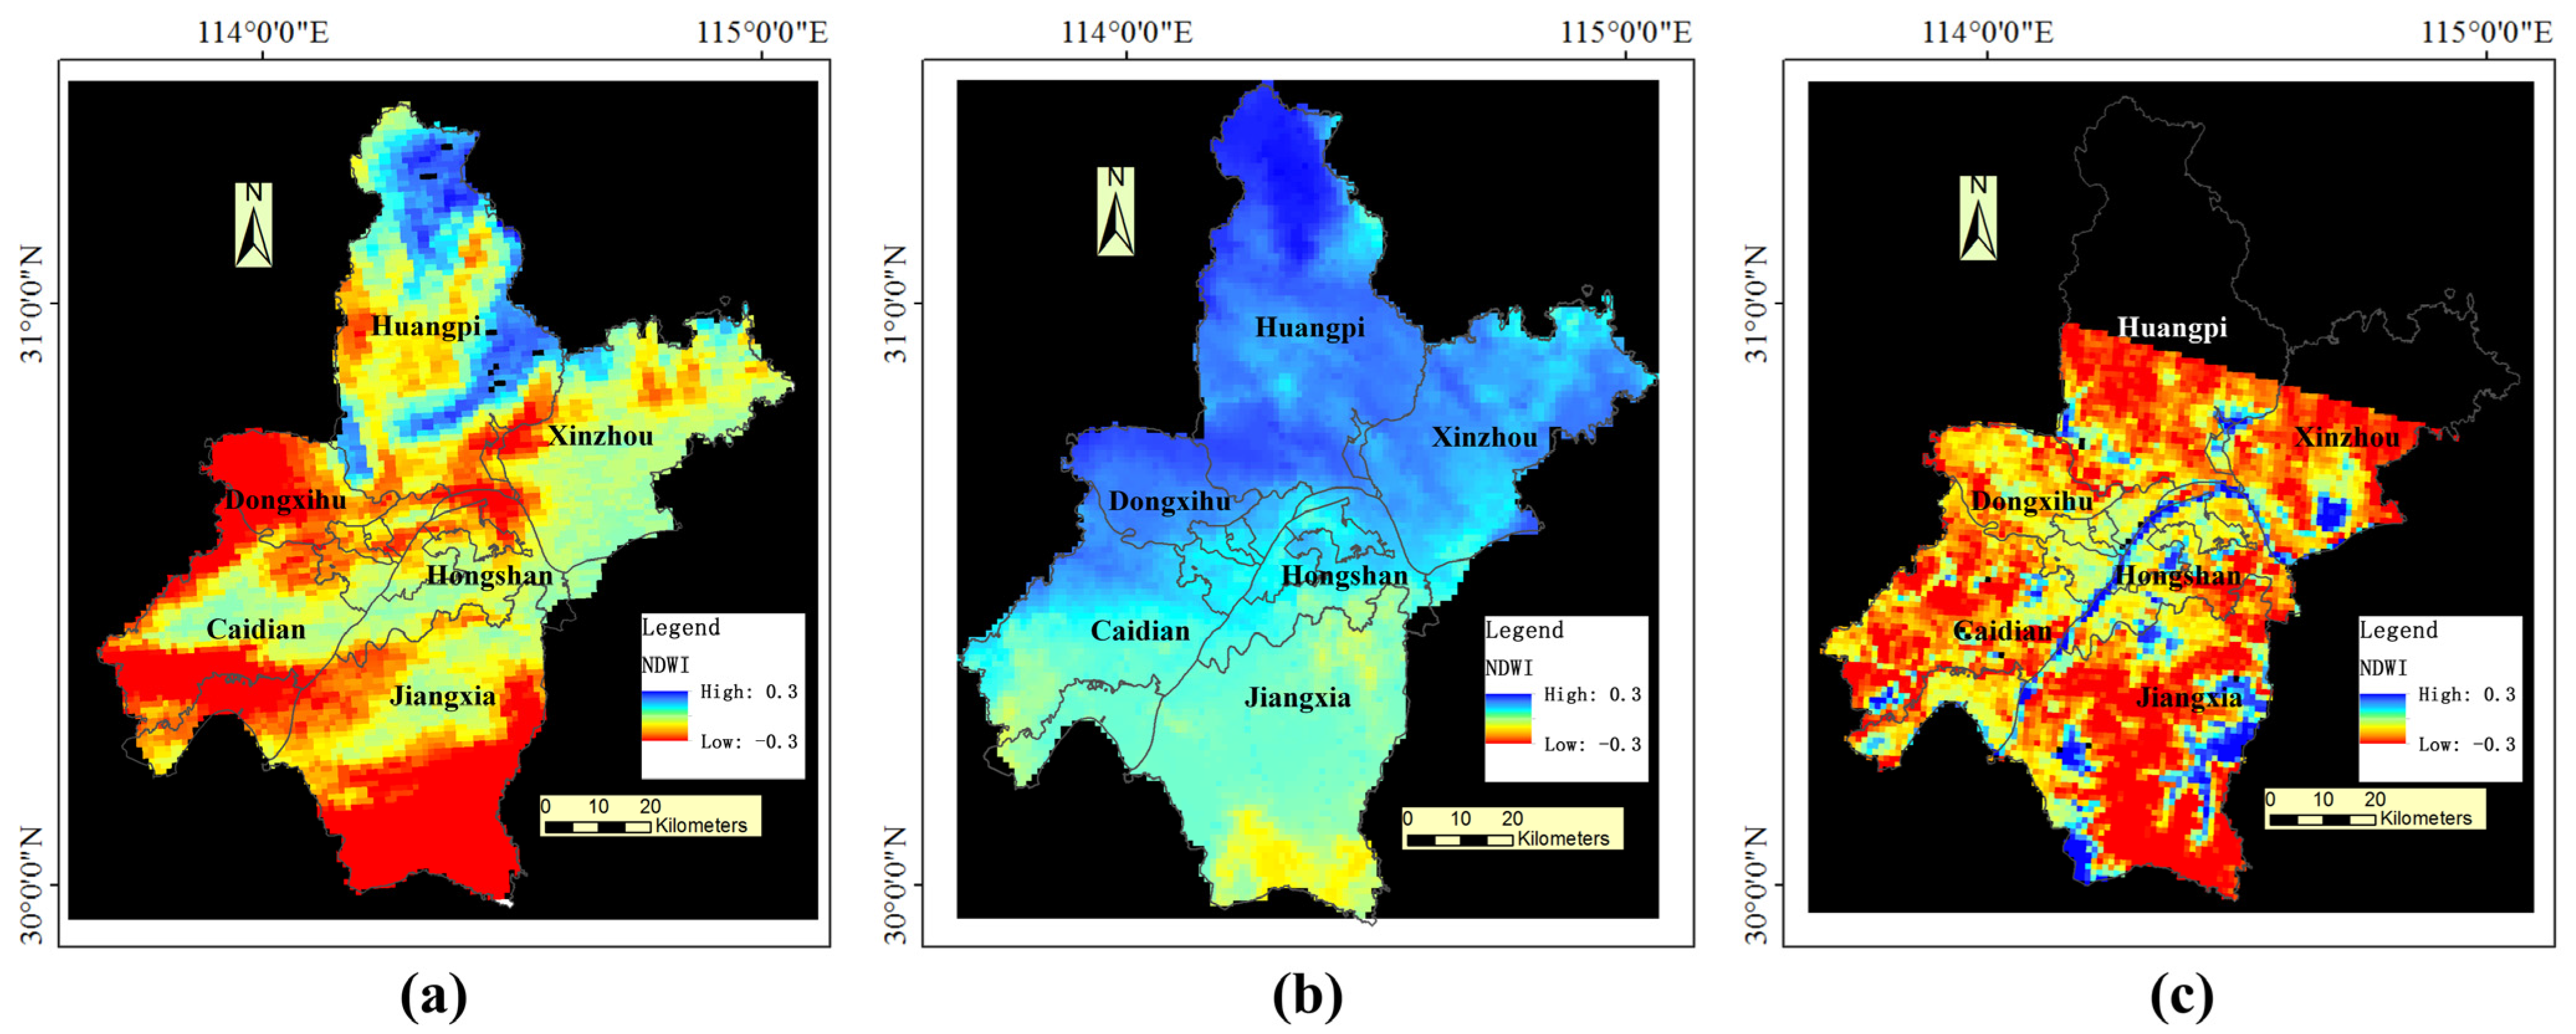
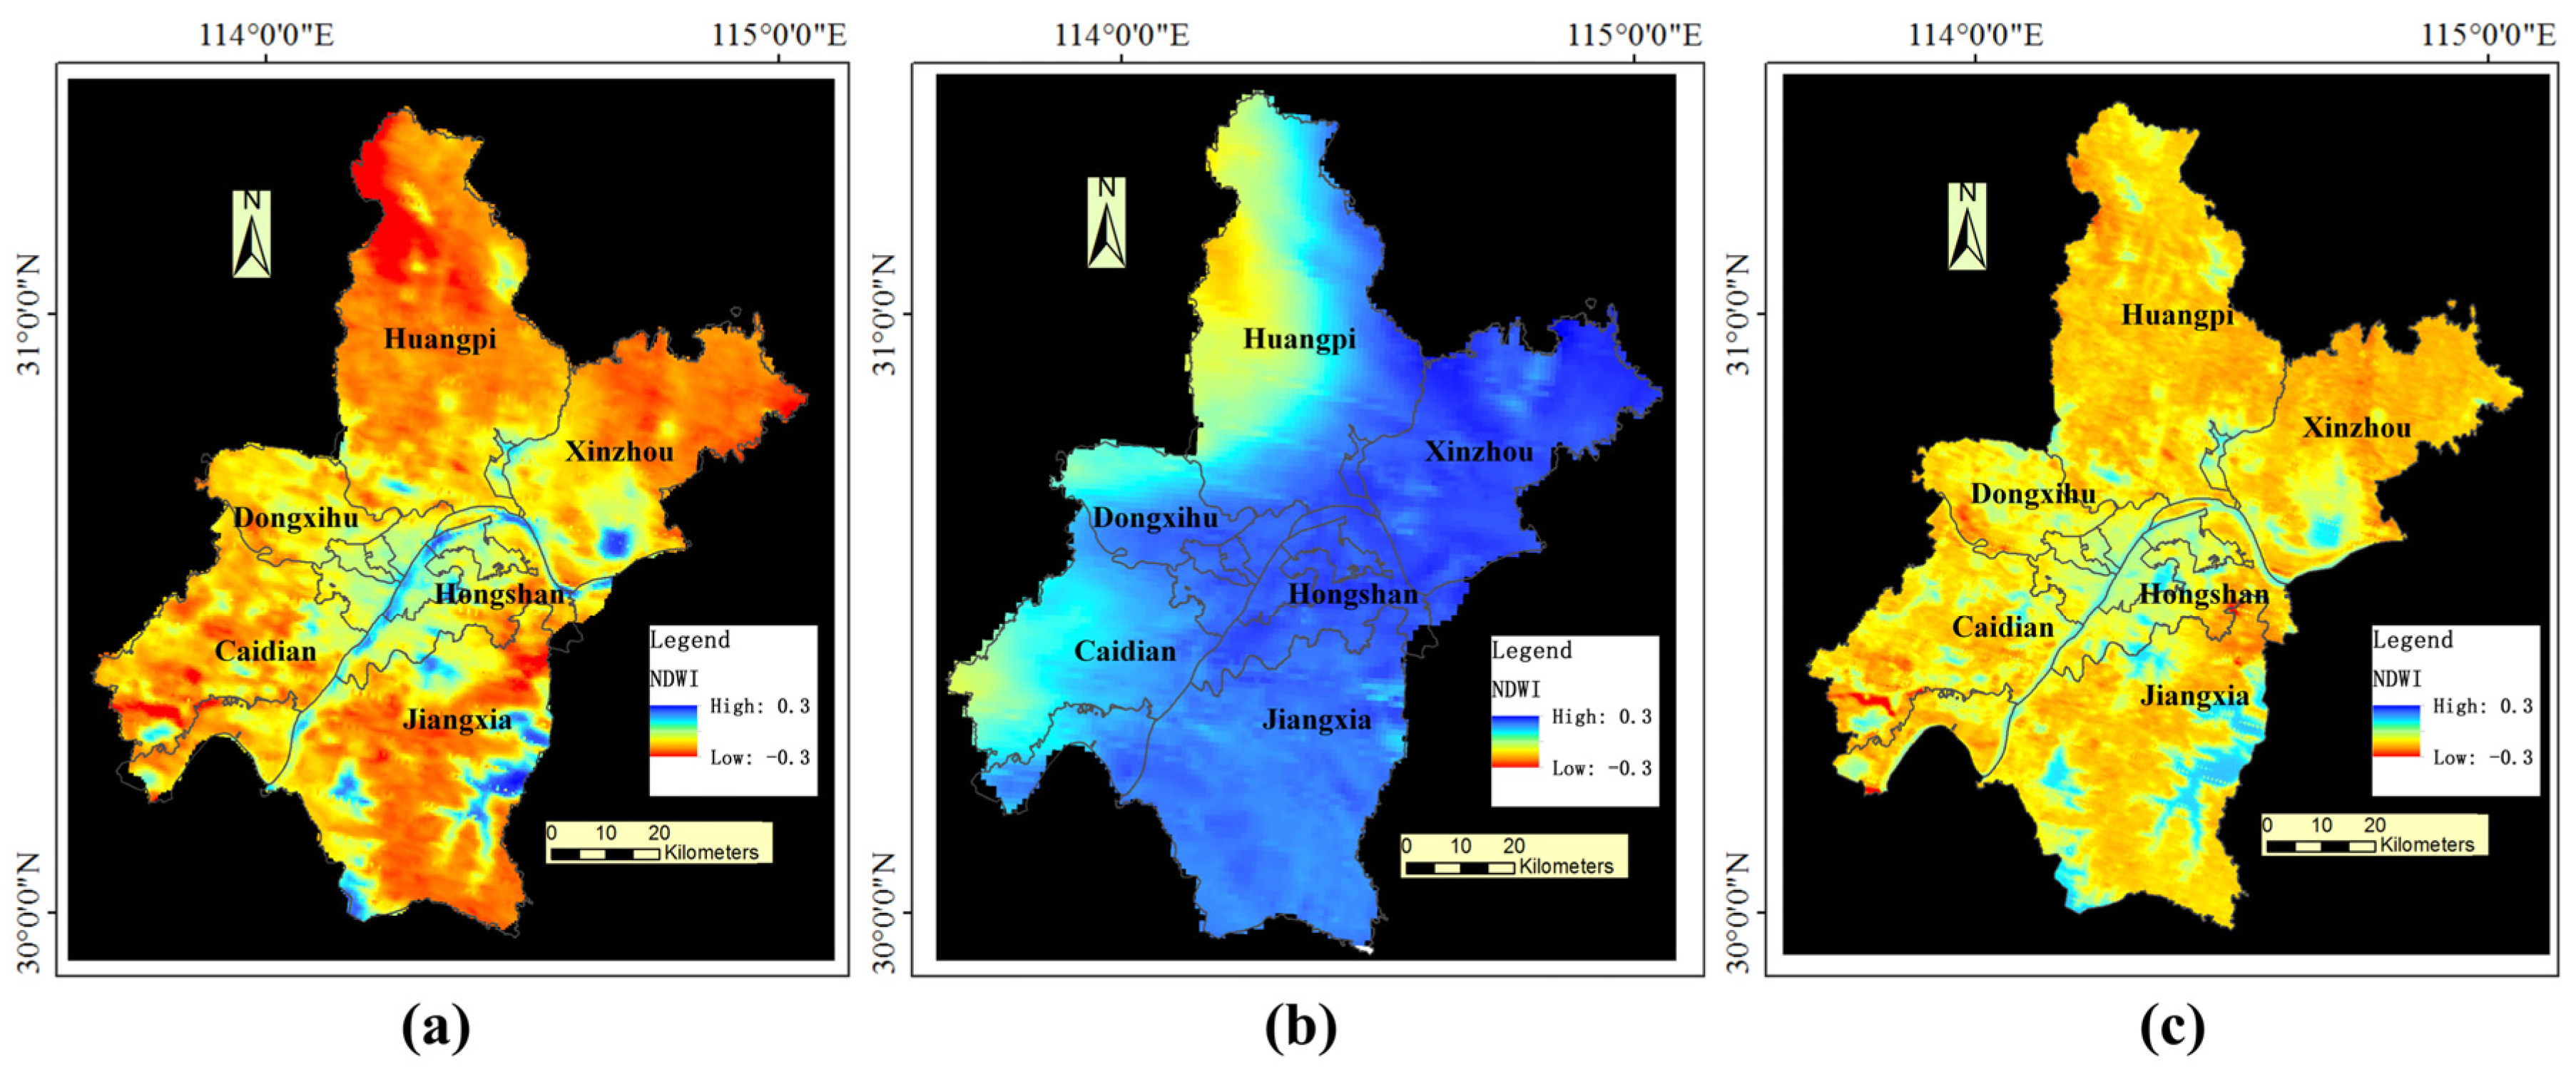
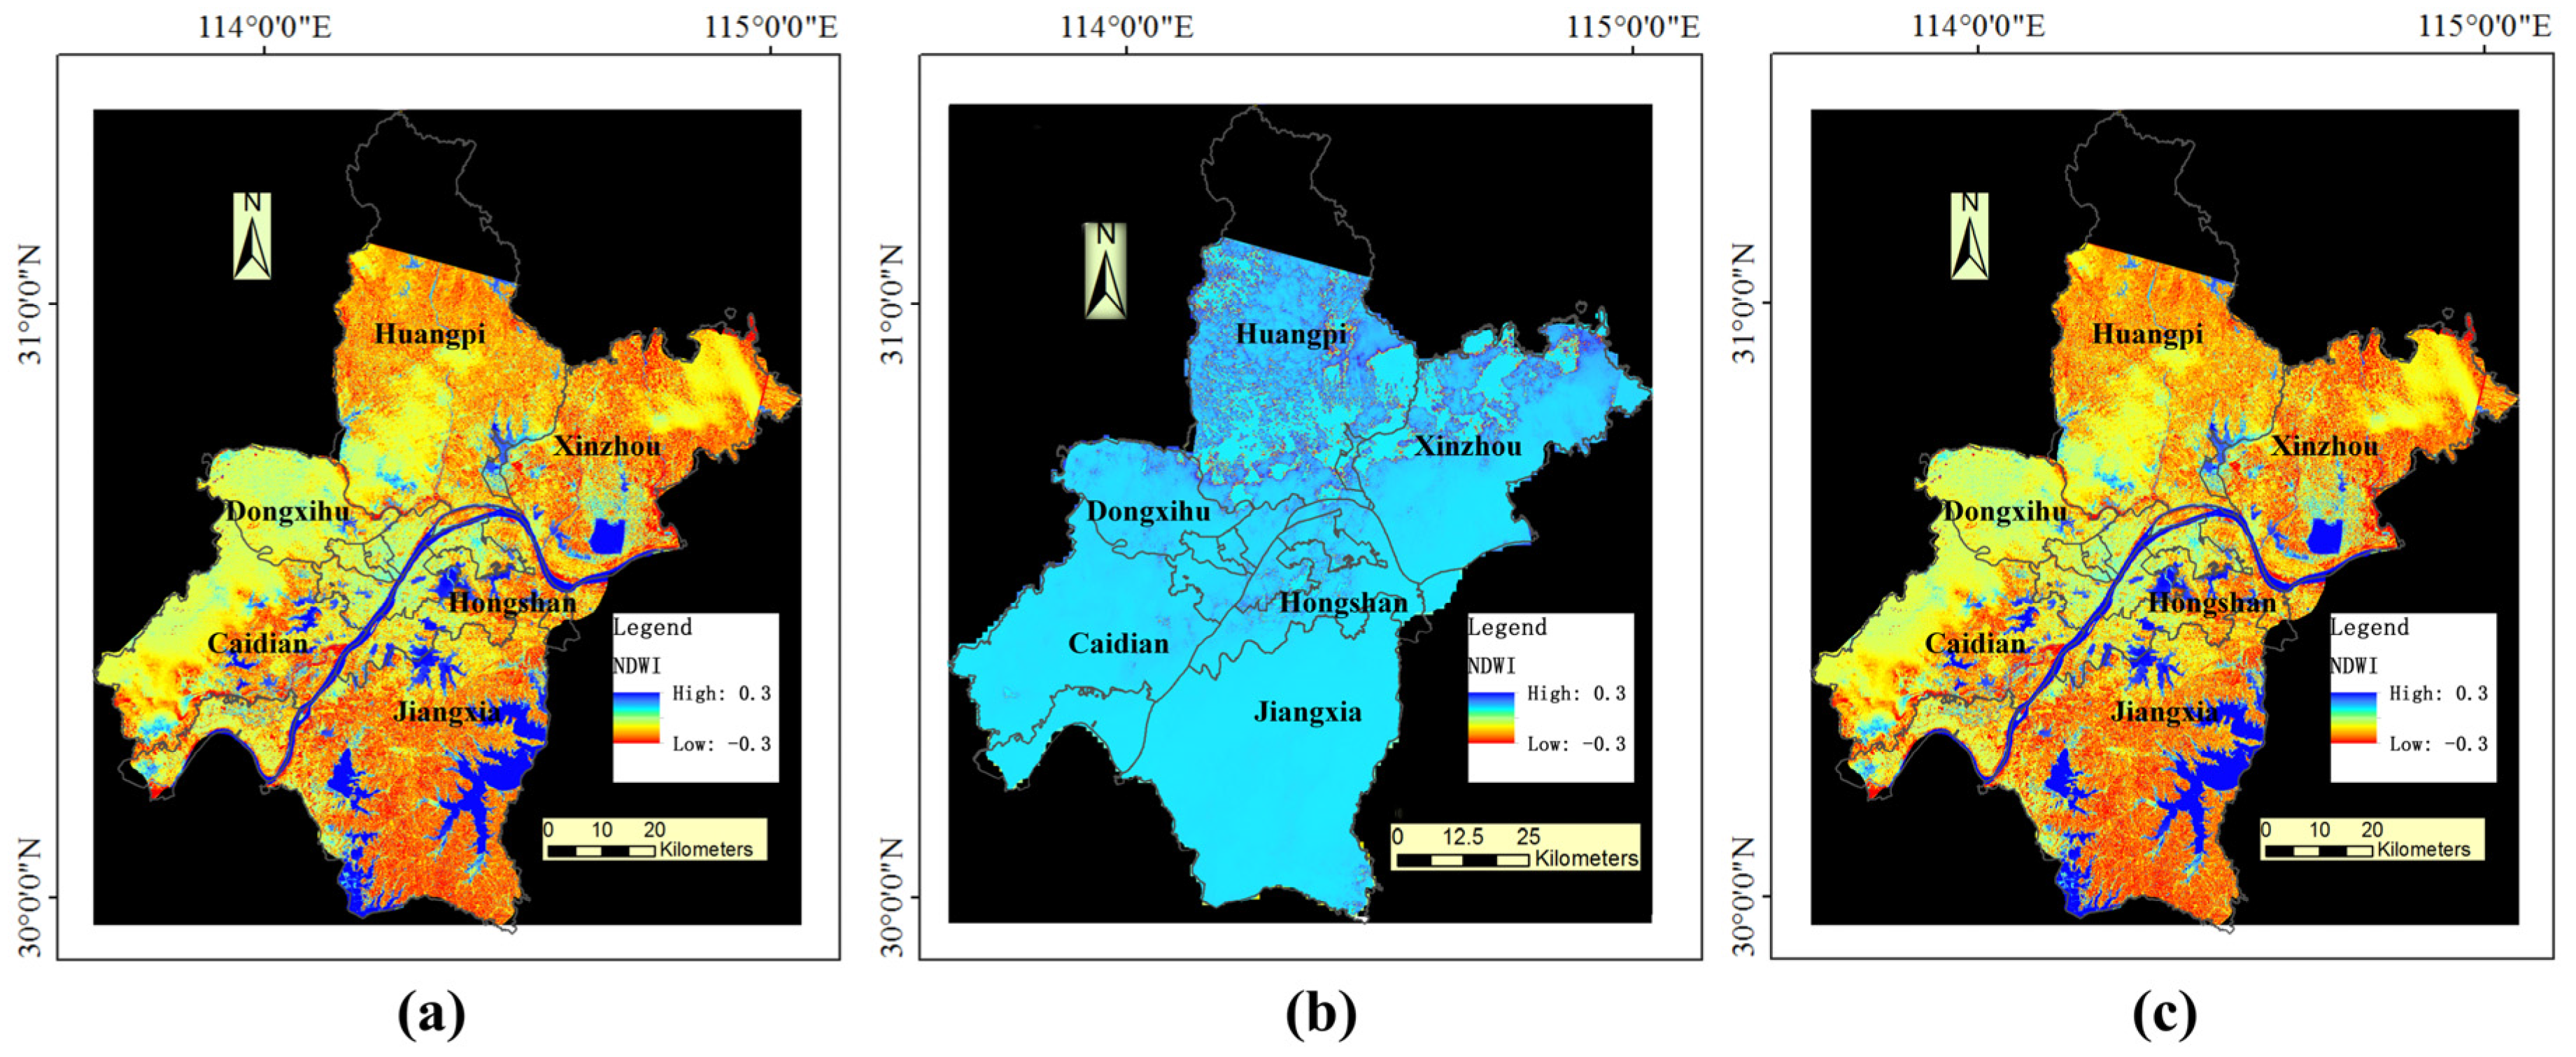
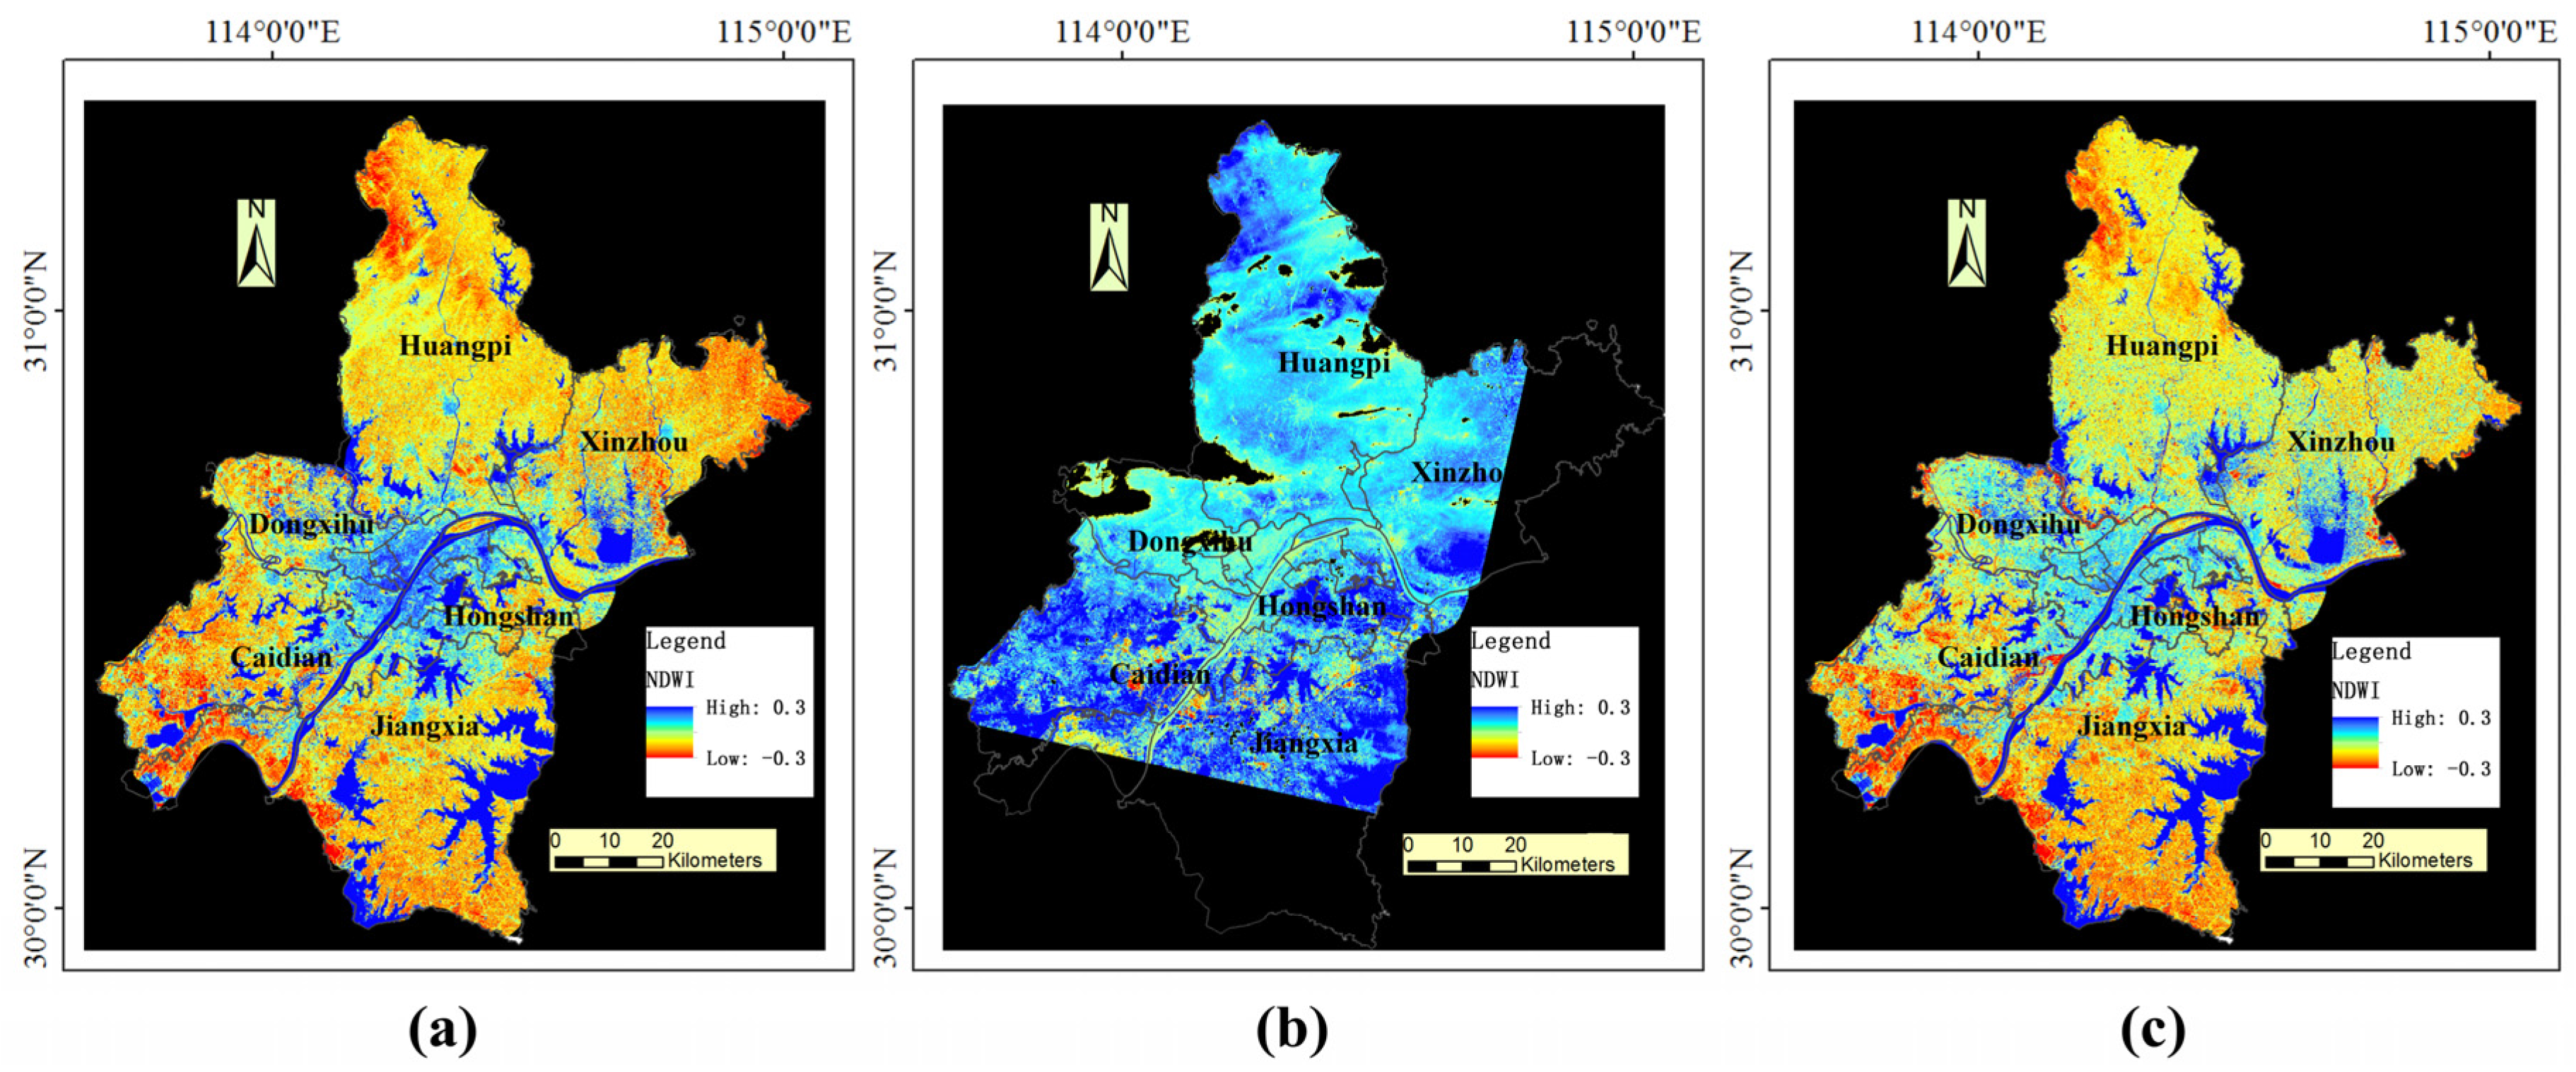
3.3. Flood Mapping


3.4. Precision Analysis

3.5. Flood Map Validity

4. Discussion
4.1. Comparisons with Other Related Methods
| Models or Methods | Features | |||
|---|---|---|---|---|
| Support Heterogeneous EO Data System’ Access Protocol Conversion | Support Encoding of Metadata Archived in the EO Data System | Precision of Data Retrieval | Strong Extendibility | |
| APEOPM | ● | ● | 85%~100% | ● |
| CGDC | ● | ○ | 58%~85% | ○ |
| GEOSS | ● | ○ | 79%~89% | ● |
4.2. Supporting Data for the All-Stage Multi-Scale Flood Map
5. Conclusions and Future Work
Supplementary Files
Supplementary File 1Acknowledgments
Author Contributions
Conflicts of Interest
References
- Jonkman, S.N. Global perspectives on loss of human life caused by floods. Nat. Hazards 2005, 34, 151–175. [Google Scholar] [CrossRef]
- Long, N.T.; Trong, B.D. Flood monitoring of Mekong River Delta, Vietnam using ERS SAR data. In Proceedings of the 22nd Asian Conference on Remote Sensing, Singapore, 5–9 November 2001.
- Ghoshal, S.; James, L.A.; Singer, M.B.; Aalto, R. Channel and floodplain change analysis over a 100-year period: Lower Yuba River, California. Remote Sens. 2010, 2, 1797–1825. [Google Scholar] [CrossRef] [Green Version]
- Khan, S.; Hong, Y.; Gourley, J.; Khattak, M.U.; Groeve, T.D. Multi-sensor imaging and space-ground cross-validation for 2010 flood along Indus River, Pakistan. Remote Sens. 2014, 6, 2239–2254. [Google Scholar] [CrossRef]
- Schumann, G.; Hostache, R.; Puech, C.; Hoffmann, L. High-resolution 3-D flood information from radar imagery for flood hazard management. IEEE Trans. Geosci. Remote Sens. 2007, 45, 1715–1725. [Google Scholar] [CrossRef]
- Ticehurst, C.; Guerschman, J.P.; Chen, Y. The strengths and limitations in using the daily MODIS open water likelihood algorithm for identifying flood events. Remote Sens. 2014, 6, 11791–11809. [Google Scholar] [CrossRef]
- NASA ECHO data system. National Aeronautics and Space Administration EOS Clearing House (ECHO). Available online: http://earthdata.nasa.gov/echo (accessed on 8 January 2015).
- NASA ECHO data system. NOAA Comprehensive Large Array-data Stewardship System. Available online: http://www.class.noaa.gov (accessed on 8 January 2015).
- USGS Landsat data system. United States Geological Survey Landsat. Available online: http://www.glcf.umiacs.umd.edu/index.shtml (accessed on 8 January 2015).
- INPE CBERS data system. Instituto Nacional de Pesquisas Espaciais China Brazil Earth Resources Satellite program. Available online: http://www.cbers.inpe.br/ (accessed on 6 January 2015).
- DeLaurentis, D. Role of humans in complexity of a system of systems. Digit. Hum. Model. Lect. Notes Comput. Sci. 2007, 4561, 363–371. [Google Scholar]
- Zyl, T.V.; Simonis, I.; McFerren, G. The sensor web: Systems of sensor systems. Int. J. Digit. Earth 2009, 2, 16–30. [Google Scholar] [CrossRef]
- Maier, M.W. Architecting principles for systems of systems. Syst. Eng. 1988, 1, 267–284. [Google Scholar] [CrossRef]
- Liu, S. Employing system of systems engineering in China’s emergency management. IEEE Syst. J. 2011, 5, 298–308. [Google Scholar] [CrossRef]
- Mostafavi, A.; Abraham, D.M.; DeLaurentis, D.A.; Sinfield, J. Exploring the dimensions of systems of innovation analysis: A system of systems framework. IEEE Syst. J. 2011, 5, 256–265. [Google Scholar] [CrossRef]
- Guzinski, R.; Kass, S.; Huber, S.; Bauer-Gottwein, P.; Jensen, I.H.; Naeimi, V.; Doubkova, M.; Walli, A.; Tottrup, C. Enabling the use of earth observation data for integrated water resource management in Africa with the water observation and information system. Remote Sens. 2014, 6, 7819–7839. [Google Scholar] [CrossRef] [Green Version]
- Global Earth Observation System of Systems (GEOSS). Available online: http://www.geoportal.org/web/guest/geo_home_stp (accessed on 6 January 2015).
- Copernicus Programme. Available online: http://copernicus.eu/ (accessed on 6 January 2015).
- Committee on Earth Observation Satellites. CWIC. CEOS WGISS Integrated Catalog website. Available online: http://cwictest.wgiss.ceos.org/testpage.html (accessed on 6 January 2015).
- CGCD. Chinese geospatial data cloud data system. Available online: http://www.gscloud.cn (accessed on 6 January 2015).
- Othman, S.H.; Beydoun, G.; Sugumaran, V. Development and validation of a disaster management metamodel. Inf. Process. Manag. 2014, 50, 235–271. [Google Scholar] [CrossRef]
- Simonovic, S.P. Social criteria for evaluation of flood control measures: Winnipeg case study. Urban Water J. 1999, 1, 167–175. [Google Scholar] [CrossRef]
- Gasperi, J.; Houbie, F.; Woolf, A.; Smolders, S. Earth Observation Metadata Profile of Observations & Measurements, Version 1.0.0; Open Geospatial Consortium: Wayland, MA, USA, 2012. [Google Scholar]
- Bröring, A.; Stasch, C.; Echterhoff, J. OGC Sensor Observation Service Interface Standard, Version 2.0; Open Geospatial Consortium: Wayland, MA, USA, 2012. [Google Scholar]
- Botts, M. OpenGIS Sensor Model Language (SensorML) Implementation Specification; Open Geospatial Consortium: Wayland, MA, USA, 2007. [Google Scholar]
- Bröring, A.; Echterhoff, J.; Jirka, S.; Simonis, I.; Everding, T.; Stasch, C.; Liang, S.; Lemmens, R. New generation sensor web enablement. Sensors 2011, 11, 2652–2699. [Google Scholar] [CrossRef] [PubMed]
- Henson, C.A.; Pschorr, J.K.; Sheth, A.P.; Thirunarayan, K. SemSOS: Semantic sensor observation service. In Proceedings of the 2009 International Symposium on Collaborative Technologies and Systems, CTS’09, 2009, Baltimore, MD, USA, 18–22 May 2009; pp. 44–53.
- Cox, S. OGC Implementation Specification 07–022r1: Observations and Measurements—Part 1—Observation Schema; Open Geospatial Consortium: Wayland, MA, USA, 2007. [Google Scholar]
- Cox, S. OGC Implementation Specification 07–022r3: Observations and Measurements—Part 2—Sampling Features; Open Geospatial Consortium: Wayland, MA, USA, 2007. [Google Scholar]
- MODIS product classification and hierarchy Introduction. Available online: http://modis.gsfc.nasa.gov/data/dataprod/index.php (accessed on 6 January 2015).
- Apache Jena API. Available online: http://jena.apache.org/ (accessed on 6 August 2015).
- Ancillary Description Writer’s Guide, Global Change Master Directory. Available online: http://gcmd.nasa.gov/add/ancillaryguide/index.html (accessed on 6 January 2015).
- Content Standard for Digital Geospatial Metadata: Extensions for Remote Sensing Metadata; Document Number: FGDC-STD-012e2002; Federal Geographic Data Committee: Washington, DC, USA, 2002.
- ISO 19115: Geographic Information_Metadata; International Organization for Standardization: Geneva, Switzerland, 2003; p. 140.
- ISO19115–2: Geographic Information_Metadata_Part 2: Extensions for Imagery and Gridded Data; International Organization for Standardization: Geneva, Switzerland, 2007; p. 54.
- ISO 19130: Geographic Information_Imagery Sensor Models for Geopositioning; International Organization for Standardization: Geneva, Switzerland, 2008; p. 156.
- GB/Z 24357–2009: Geographic Information Metadata XML Implementation; Chinese Geographic Information Committee: Beijing, China, 2009.
- Di, L.; Moe, K.; Yu, G. Metadata requirements analysis for the emerging sensor web. Int. J. Digit. Earth 2009, 2, 3–17. [Google Scholar] [CrossRef]
- Gamma, E.; Helm, R.; Johnson, R.; Vlissides, J. Design Patterns, 1st ed.; Addison Wesley: Boston, MA, USA, 1995; p. 395. [Google Scholar]
- SosSystem prototype. Available online: http://gsw.whu.edu.cn:8080/SosSystem/ (accessed on 22 July 2015).
- Gao, B.C. NDWI—A normalized difference water index for remote sensing of vegetation liquid water from space. Remote Sens. Environ. 1996, 58, 257–266. [Google Scholar] [CrossRef]
- McFeeters, S.K. The use of the normalized difference water index (NDWI) in the delineation of open water features. Int. J. Remote Sens. 1996, 17, 1425–1432. [Google Scholar] [CrossRef]
- Chen, D.; Jackson, T.J.; Li, F.; Cosh, M.H.; Walthall, C.; Anderson, M. Estimation of vegetation water content for corn and soybeans with a normalized difference water index (NDWI) using Landsat Thematic Mapper data. IEEE Int. Geosci. Remote Sens. Symp. 2003, 4, 2853–2856. [Google Scholar]
- Webster, T.L. Flood risk mapping using LiDAR for Annapolis Royal, Nova Scotia, Canada. Remote Sens. 2010, 2, 2060–2082. [Google Scholar] [CrossRef]
- Egghe, L. The measures precision, recall, fallout and miss as a function of the number of retrieved documents and their mutual interrelations. Inf. Process. Manag. 2008, 44, 856–876. [Google Scholar] [CrossRef]
- Toté, C.; Patricio, D.; Boogaard, H.; Wijngaart, R.V.D.; Tarnavsky, E.; Funk, C. Evaluation of satellite rainfall estimates for drought and flood monitoring in Mozambique. Remote Sens. 2015, 7, 1758–1776. [Google Scholar] [CrossRef]
- Tan, M.L.; Ibrahim, A.L.; Duan, Z.; Cracknell, A.P.; Chaplot, V. Evaluation of six high-resolution satellite and ground-based precipitation products over Malaysia. Remote Sens. 2015, 7, 1504–1528. [Google Scholar] [CrossRef]
- Yong, B.; Hong, Y.; Ren, L.; Gourley, J.J.; Huffman, G.J.; Chen, X. Assessment of evolving TRMM-based multisatellite real-time precipitation estimation methods and their impacts on hydrologic prediction in a high latitude basin. J. Geophys. Res.: Atmos. 2012, 117. [Google Scholar] [CrossRef]
- Su, F.; Hong, Y.; Lettenmaier, D.P. Evaluation of TRMM Multisatellite Precipitation Analysis (TMPA) and its utility in hydrologic prediction in the La Plata Basin. J. Hydrometeorol. 2008, 9, 622–640. [Google Scholar] [CrossRef]
© 2015 by the authors; licensee MDPI, Basel, Switzerland. This article is an open access article distributed under the terms and conditions of the Creative Commons Attribution license (http://creativecommons.org/licenses/by/4.0/).
Share and Cite
Chen, N.; Zhou, L.; Chen, Z. A Sharable and Efficient Metadata Model for Heterogeneous Earth Observation Data Retrieval in Multi-Scale Flood Mapping. Remote Sens. 2015, 7, 9610-9631. https://doi.org/10.3390/rs70809610
Chen N, Zhou L, Chen Z. A Sharable and Efficient Metadata Model for Heterogeneous Earth Observation Data Retrieval in Multi-Scale Flood Mapping. Remote Sensing. 2015; 7(8):9610-9631. https://doi.org/10.3390/rs70809610
Chicago/Turabian StyleChen, Nengcheng, Lianjie Zhou, and Zeqiang Chen. 2015. "A Sharable and Efficient Metadata Model for Heterogeneous Earth Observation Data Retrieval in Multi-Scale Flood Mapping" Remote Sensing 7, no. 8: 9610-9631. https://doi.org/10.3390/rs70809610