Abstract
Accurate information of urban surface water is important for assessing the role it plays in urban ecosystem services under the content of urbanization and climate change. However, high-resolution monitoring of urban water bodies using remote sensing remains a challenge because of the limitation of previous water indices and the dark building shadow effect. To address this problem, we proposed an automated urban water extraction method (UWEM) which combines a new water index, together with a building shadow detection method. Firstly, we trained the parameters of UWEM using ZY-3 imagery of Qingdao, China. Then we verified the algorithm using five other sub-scenes (Aksu, Fuzhou, Hanyang, Huangpo and Huainan) ZY-3 imagery. The performance was compared with that of the Normalized Difference Water Index (NDWI). Results indicated that UWEM performed significantly better at the sub-scenes with kappa coefficients improved by 7.87%, 32.35%, 12.64%, 29.72%, 14.29%, respectively, and total omission and commission error reduced by 61.53%, 65.74%, 83.51%, 82.44%, and 74.40%, respectively. Furthermore, UWEM has more stable performances than NDWI’s in a range of thresholds near zero. It reduces the over- and under-estimation issues which often accompany previous water indices when mapping urban surface water under complex environmental conditions.
1. Introduction
Urban surface water, which consists of both natural and man-made water bodies, is a vital part of urban aquatic ecosystems [1]. It plays a significant role in ecosystem health and services. It also contributes to the water balance which not only benefits the urban environment, but also enhances the livability of the urban landscape [2]. Changes in urban surface water may result in disasters, such as urban waterlogging, water shortage, and even outbreaks of waterborne diseases, with consequences to human health and life. Therefore, timely monitoring the distributions and dynamics of urban surface water is essential for many applications including flood protection [3], public health [4], food security [5], biodiversity protection [6], and water use and management policy [7].
With the rapid development of satellite techniques, remote sensing is able to provide an aerial view of ongoing processes on the Earth’s surface at multiple scales. It can also address the intricate nature of surface water [8] and allow an assessment of the risks placed on aquatic ecosystems [9]. There have been ample investigations about the spatiotemporal distribution of surface water using moderate resolution imagery [8,10,11,12,13]. However, these studies have not reliably detected small water bodies (SWB) due to the limited spatial resolution [14]. The frequency distribution of urban water body sizes is generally similar to the Pareto distribution, with many small water bodies and a few of large rivers and lakes [15]. In addition, urbanization impacts on small urban water bodies occur at disproportionate levels [15,16]. Therefore, high-resolution imagery should be used to monitor urban surface water to improve the precision. With a spatial resolution of 5.8 m and a swath width of 52 km, Ziyuan-3 (ZY-3) multi-spectral imagery is an ideal data source for landscape-scale urban surface water analysis.
Many algorithms have been proposed for identifying water bodies with remote sensing imagery. These methods can be generally categorized into four classes: supervised or unsupervised classification method [17,18], linear un-mixing model [19], single-band or multiple-band thresholding method [20,21], and spectral water index method [11,22,23]. Among them, the spectral water index method is widely used because it is easy to apply with relative good accuracy [24]. The formulation of water indices has been steadily progressing over time. McFeeters [22] proposed the first water index named the Normalized Difference Water Index (NDWI) to delineate open water features using the near-infrared band and green band. Then, Xu [23] found the NDWI cannot efficiently suppress the signal of building, and proposed an alternative called Modified Normalized Difference Water Index (MNDWI), which achieved better performances in urban areas. Although MNDWI can remove the bias caused by buildings, accuracy problems still exist due to the low albedo surfaces. Researches [11] thus developed the Automated Water Extraction Index (AWEI) using multiple bands (1,2,4,5 and 7) of Landsat 5 TM images. It enabled the formulation of the water index in different backgrounds, and thus achieved higher accuracy in urban backgrounds and mountainous areas than MNDWI. Despite the obvious advantages of the water indices in expressing spectral reflectance pattern differences, if only a single cut-off threshold is used for water extraction, and the accuracy may degrade in some situations where water is mixed with objects that have similar spectral patterns, such as dark shadow. In order to address the shadow problem, some researchers have combined water indices with additional shadow detection methods, such as using DEM data to detect the shadow units [25], digital image processing techniques to remove the shadow noises [24] and manual shadow mask [26].
Considering the available water indices for high resolution images, NDWI is still the only choice for mapping urban water bodies because most high-resolution images only have visible and NIR bands, like IKONOS, RapidEye, and ZY-3. However, problems stand out when applying NDWI to high-resolution imagery. For example, the shadow problem, especially dark building shadow, is much more serious in high-resolution imagery (such as IKONOS with the spatial resolution of 4 m) than that of images with a medium resolution (such as TM with the spatial resolution of 30 m) [27]. Water bodies and dark shadows cannot be easily separated by their spectra [28]. Some researchers have used an object-based approach to detect the shadows with the help of additional characteristics such as texture, but this is very time-consuming and provides limited improvement to the problems [29]. On the other hand, urban environments pose specific challenges for mapping water bodies with remote sensing imagery [30]. The typical symptoms of urban surface water include: suspended solids, high levels of nutrients, and various pollutants ranging from heavy metals to personal care products, making the optical properties of urban surface water quite different from those of natural unpolluted one [7]. In addition, urban areas have increased levels of spatial heterogeneity, creating many small water bodies with complex morphologies. When facing these challenges, no method can provide automated water detection with considerable accuracy for high-resolution imagery. Thus, an improved urban water extraction method should be designed.
In this study, we introduced a simple and automated urban water extraction method (UWEM), based on the idea of making full use of the spectral information of different objects in the visible and near-infrared bands (VNIR). As one water index may not address the whole problem, the UWEM combines a new water index, called High Resolution Water Index (HRWI), together with a building shadow detection method. The objectives of this study are to: (a) improve accuracy of urban surface water mapping by automatically suppressing the noises from artificial construction land and shadow; and (b) achieve stable thresholds under different water conditions with a high accuracy.
2. Study Areas and Data
2.1. Study Area
Considering the complex terrain and significant difference in climates over China, five urban areas (Qingdao, Aksu, Wuhan, Fuzhou and Huainan) with variable environmental conditions (e.g., precipitation, humidity, and elevation) were selected as the study sites. Table 1 shows the basic characteristics of these study sites. Due to their range of variability, it is a great challenge to extract urban water bodies quickly, automatically and accurately using remote sensing imagery.
The test site in Qingdao consists of abundant diverse water bodies located within a complex urban background. It was deliberately selected for algorithm development, while five sub-scenes with representative water types in other four cities were chosen for algorithm validation. The validation sites were selected to test the accuracy and robustness of the new algorithm. Water bodies in all five sub-scenes exhibit complex features, including classic symptoms of urban water, such as turbidity, eutrophication and pollution. The initial four validation sub-scenes (Aksu, Fuzhou, Hanyang and Huainan) also have many dark shadows caused by tall buildings. The fifth validation sub-scene (Huangpo) consists of a large number of small water bodies in an urban background, but few dark shadows.

Table 1.
The characteristics of the study sites.
| City’s Name and Location | Image Size (pixels) | Water Types | Topography | Climate | Color Infrared Composite | |
|---|---|---|---|---|---|---|
| Qingdao (36.2°N, 120.5°E) | 4574 × 5992 (922.0 km2) | Rivers Lakes Sea Harbors Reservoirs Ponds Aquatic parks | Basin, plain, hills, etc. | Warm temperate monsoon climate | 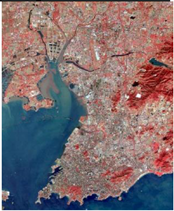 | |
| Aksu (41.4°N, 80.2°E) | 894 × 661 (19.9 km2) | Narrow clear river Narrow turbid river | Basin | Temperate continental arid climate | 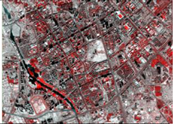 | |
| Fuzhou (25.9°N, 119.3°E) | 1437 × 983 (47.5 km2) | Clear reservoirs Eutrophic reservoirs Clear man-made lake | Basin and hill | Subtropical monsoon climate | 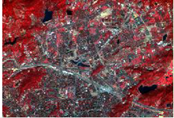 | |
| Wuhan (30.7°N, 114.4°E) | Hanyang | 1135 × 658 (25.1 km2) | Polluted lakes | Plain | Subtropical monsoon humid climate | 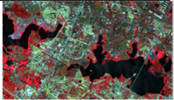 |
| Huangpo | 1430 × 1112 (50.1 km2) | Clear ponds Eutrophic ponds Big clear river Big clear lake | 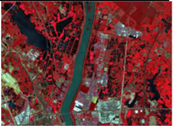 | |||
| Huainan (32.7°N, 116.9°E) | 1037 × 659 (23.0 km2) | Clear aquatic parks | Plain | Temperate monsoon climate | 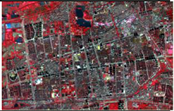 | |
2.2. ZY-3 Multi-Spectral Imagery
Launched in January 2012, ZiYuan-3 (ZY-3) is the first civilian high-resolution stereo mapping satellite launched by China (http://sjfw.sasmac.cn/en/ZY-3.html). Besides the panchromatic sensor designed for stereo mapping, ZY-3 is also equipped with a multispectral sensor (IRMSS), collecting visible (blue, green, red) and near infrared bands with a 5.8-m nadir resolution. Having four spectral bands similar to Landsat5 TM bands 1-4, ZY-3 imagery is a good candidate for applying previous methods to extract urban water bodies. With a revisit cycle of five days, IRMSS provides high-resolution imagery with a swath width of 52 km and a maximum acquisition capacity of 1,000,000 km2 per day, making it an ideal data for urban remote sensing applications.
In this study, all ZY-3 images used in this study are of product type Level 1A acquired from IRMSS sensor. These images contain enough information about radiometric correction and geometric correction. The sub-scenes used are all free of clouds. The descriptions of the ZY-3 multi-spectral images are presented in Table 2.

Table 2.
Description of ZY-3 scenes and corresponding reference data.
| Experiment Sites | ZY-3 Scene | Reference Data and Sources | |||
|---|---|---|---|---|---|
| Acquisition Date | Path | Row | Solar Azimuth | ||
| Water bodies in Qingdao, Shandong | 17 October 2012 | 885 | 133 | 47.1 | Google Earth™ image acquired on 5–19 September. 2012 ©CNES/Astrium |
| Rivers in Aksu, Xinjiang | 22 October 2013 | 93 | 120 | 36.7 | Google Earth™ image acquired on 2 October 2013 ©CNES/Astrium |
| Reservoirs in Fuzhou, Fujian | 9 May 2013 | 881 | 159 | 42.6 | Google Earth™ image acquired on 16 Janaury 2013 © DigitalGlobe |
| Polluted lakes, fishponds in Wuhan, Hubei | 12 August 2013 | 897 | 147 | 67.6 | Google Earth™ image acquired on 16 August and 29 September 2013 © DigitalGlobe |
| Water bodies in Huainan, Anhui | 4 November 2013 | 892 | 142 | 40.7 | Google Earth™ image acquired on 2 October 2013 © DigitalGlobe |
2.3. Reference Data
Table 2 shows the reference data used for accuracy assessment. When water boundaries could not be accurately determined by visual interpretation, images with high spatial resolution from Google Earth were used for reference.
3. Method
3.1. Image Preprocessing
The ZY-3 images (Level 1A products) were orthorectified to improve the spatial accuracy using Geomatica-PCI 2013 commercial software. In this study, nine ground control points (GCPs) for each image were used in the relief displacement correction with the average root mean square (RMS) value less than 0.5 pixels for each image in the test sites. After that, each image was resampled to a spatial resolution of 5.8 m and projected to UTM, Zone *N (WGS-84 ellipsoid) (* depends on the imagery’s location).
The images were then calibrated from raw digital number (DN) to surface reflectance values. Atmospheric correction was applied using the Fast Line-of-Sight Atmospheric Analysis of Spectral Hypercubes (FLAASH) module in ENVI v. 5.0. Feyisa, Meilby, Fensholt and Proud [11] summarized the retrieval method of Aerosol Optical Depth (AOD) and total Column Water Vapor data used in the FLAASH module (see [11] for details). If the AOD value was invalid with the method mentioned above, the initial visibility was estimated using observational data from a nearby meteorological station.
3.2. Formulation of the High Resolution Water Index (HRWI)
3.2.1. Index Model Selection
Generally, there are two types of index formulation models: ratio model and coefficient model. Ratio models for water index begin with NDWI [22]. NDWI is a normalized ratio index between green and NIR bands, and is based on the fact that pure water can absorb more infrared energy than that of green light. However, the ratio model cannot significantly show the characteristics that water’s reflectance in visible and NIR bands is normally lower than that of other land objects. It will import bias when extracting un-pure or polluted water bodies which skew water index values in VNIR images. Therefore, in this study, the coefficient model was chosen to build the High Resolution Water Index (HRWI) formulation.
3.2.2. Band Selection
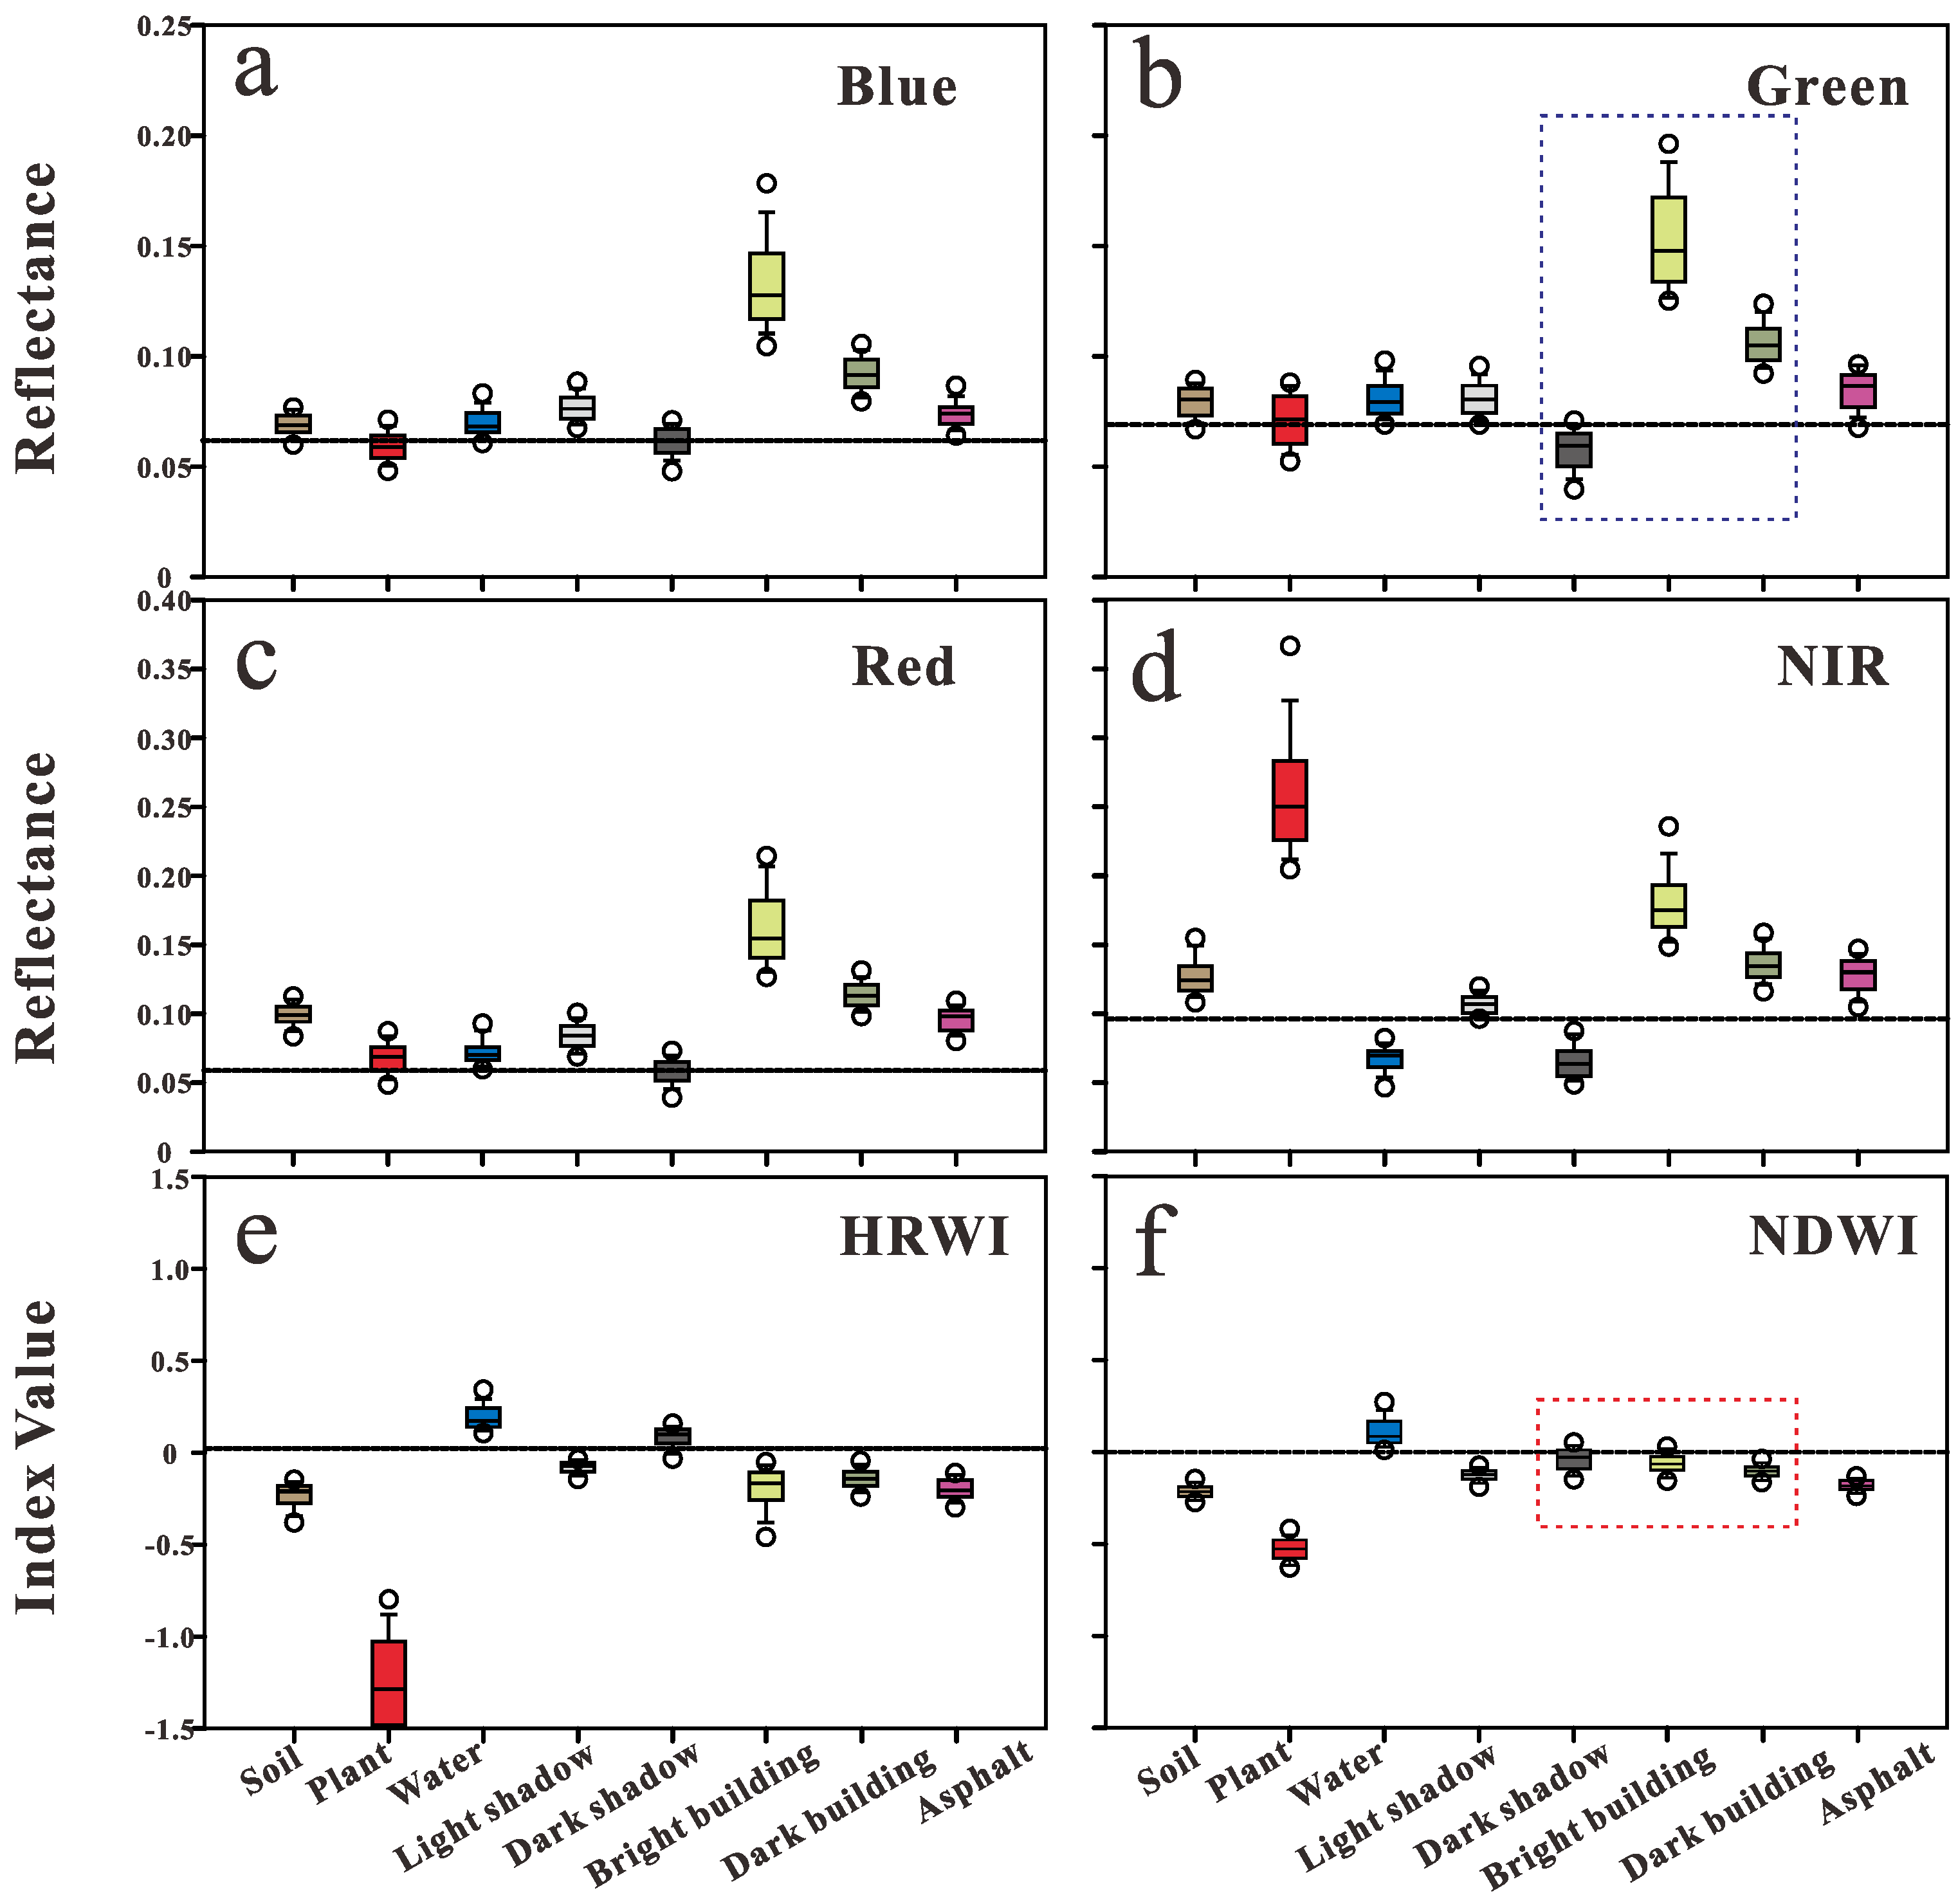
Water index was designed to enhance the contrast between water and non-water pixels [11]. The optimal bands combination should be determined to accurately and robustly discriminate water from other land cover types. In order to study the spectral difference between water and other land cover types, a dataset of pure pixel (the pixel which is covered by a single land cover type) [31] reflectance values were sampled from the ZY-3 image covering eight land cover types at the study site of Qingdao. This site includes all the primary features influencing the water extraction accuracy like shadows, dark building structures, and other low albedo surfaces. A total of 300 pure pixels were selected from the ZY-3 imagery for each land cover type. These pure pixels were collected through manual selection using high-resolution Google Earth images as reference dataset. Figure 1a,d show the statistical results of pure pixel reflectance values over eight land cover types for blue, green, red, and NIR bands, respectively. Each band has certain separability between water and other types. However, the blue band is vulnerable to scattered light disturbance [32]. Its value is unstable and may cause obvious variations in the optimal threshold values of the coefficient index. Therefore, green, red, and NIR bands were chosen to formulate the HRWI.
3.2.3. Coefficient Calculation
The optimal coefficients of the HRWI formula was determined using Support Vector Machine (SVM). The SVM is a non-parametric statistical learning technique, which is also a large-margin classifier. Its motivation is to find the best hyperplane which represents the largest separation between two class types. The advantages of the SVM over traditional methods in formulating water index are: first, SVM not only separates the training data sets with minimum error, but also enhances the stability by producing the optimum hyperplane maximizing the margin [33]; second, it shows promising performances even if the number of samples is limited [34]; third, SVM performs well in heterogeneous urban areas [35].
The SVM is formulated as solving the constrained quadratic optimization problem (see Equations (1) and (2)) [36].
where,
- are the training sample vectors,
- stands for the corresponding class label,
- is the kernel function,
- C is a constant.
Kernel functions play an important role in SVM to solve the linear and non-linear problems. Here, creating a water index is a linear problem so that we choose a linear kernel function, which means . The hyperplane can be expressed as Equation (3).
where,
- w is the normal vector which is perpendicular to the hyperplane,
- x is a three-dimensional vector composed of reflectance values from green, red and NIR bands,
- b is the intercept term.
The value of w and b can be obtained by training the input vectors from the sample data. For a test pixel, it will be labeled as water if its value in the expression is positive or labeled as non-water if its value is negative. Obviously, the expression can be used as the water index which default value is zero.
However, dark shadows and water were often misidentified by water indices [24]. And thus we used a shadow detection method (which will be discussed in Section 3.4.) to remove dark shadows. HRWI was designed to separate water from other land cover types except dark shadows. All land cover types except dark shadows were used for SVM training, where water is labeled as water while other types are labeled as non-water. After training, we obtained the coefficients for the optimal hyperplane. The coefficients were rounded for ease of use (the coefficients were round at 1 decimal because we also tested with the data rounding at the 2 decimal, but didn’t observe increased accuracy), and then the new water index HRWI (Function 1) was created.
where,G is the reflectance in green band,R is the reflectance in red band,NIR is the reflectance in NIR band.
Figure 1e,f shows the statistical results of the HRWI and NDWI for each land cover type. The separability of HRWI and NDWI was measured using the M-statistic test which measures the separation between the histograms produced by the frequency distribution of all the pixel values within two classes (see Equation (5) and Table 3). M > 1.0 implies good separability, while M < 1.0 are considered to contain significant class overlap [37].
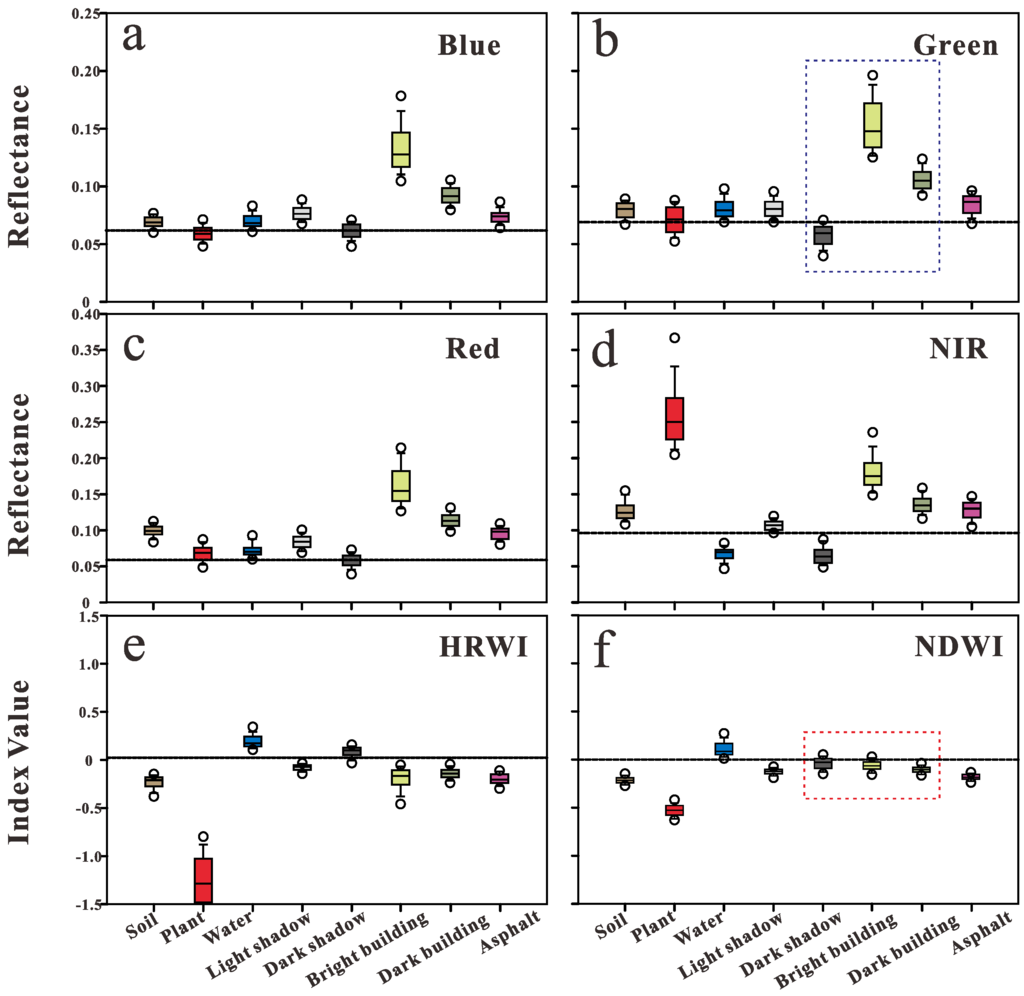
Figure 1.
Reflectance and water index value distributions of major land cover types from pure pixels. Each box plot shows the location of the 10th, 25th, 50th, 75th, and 90th percentiles with horizontal lines (boxes and whiskers) and the circles are 5th and 95th percentiles (The dashed boxes show the spectral contrast between building and dark shadow).(a–d): the reflectance distributions of major land cover types in blue, green, red, NIR bands, respectively; e: the HRWI value distributions of major land cover types; f: the NDWI value distributions of major land cover types.
- is the difference in the means of the water and other land cover type,
- is the sum of the standard deviations.
For the separability tests in Table 3, HRWI can achieve very good separability between water and vegetation. It also improves the separability between water and other land cover types, including bright building, dark building, asphalt, light shadow and soil. However, HRWI can not effectively suppress the dark shadows. The separability between water and dark shadow of HRWI is lower than that of NDWI (see Table 3).

Table 3.
Separability tests of HRWI and NDWI using the M-statistic test.
| Pair Comparison | M | ||
|---|---|---|---|
| HRWI | NDWI | Difference (HRWI-NDWI) | |
| Water vs. Bright building | 1.91 | 1.28 | 0.63 |
| Water vs. Dark building | 2.26 | 0.50 | 1.76 |
| Water vs. Asphalt | 2.56 | 2.08 | 0.48 |
| Water vs. Light shadow | 2.23 | 1.72 | 0.52 |
| Water vs. Dark shadow | 1.08 | 1.11 | −0.03 |
| Water vs. Soil | 2.55 | 2.16 | 0.39 |
| Water vs. Vegetation | 3.30 | 3.43 | −0.13 |
3.3. Automated Building Shadow Detection Method
In this section, we proposed an automated dark building shadow detection method which combines the spatial and spectral features of a building and its shadow.
3.3.1. Spatial Relationship between a Building and Its Shadow
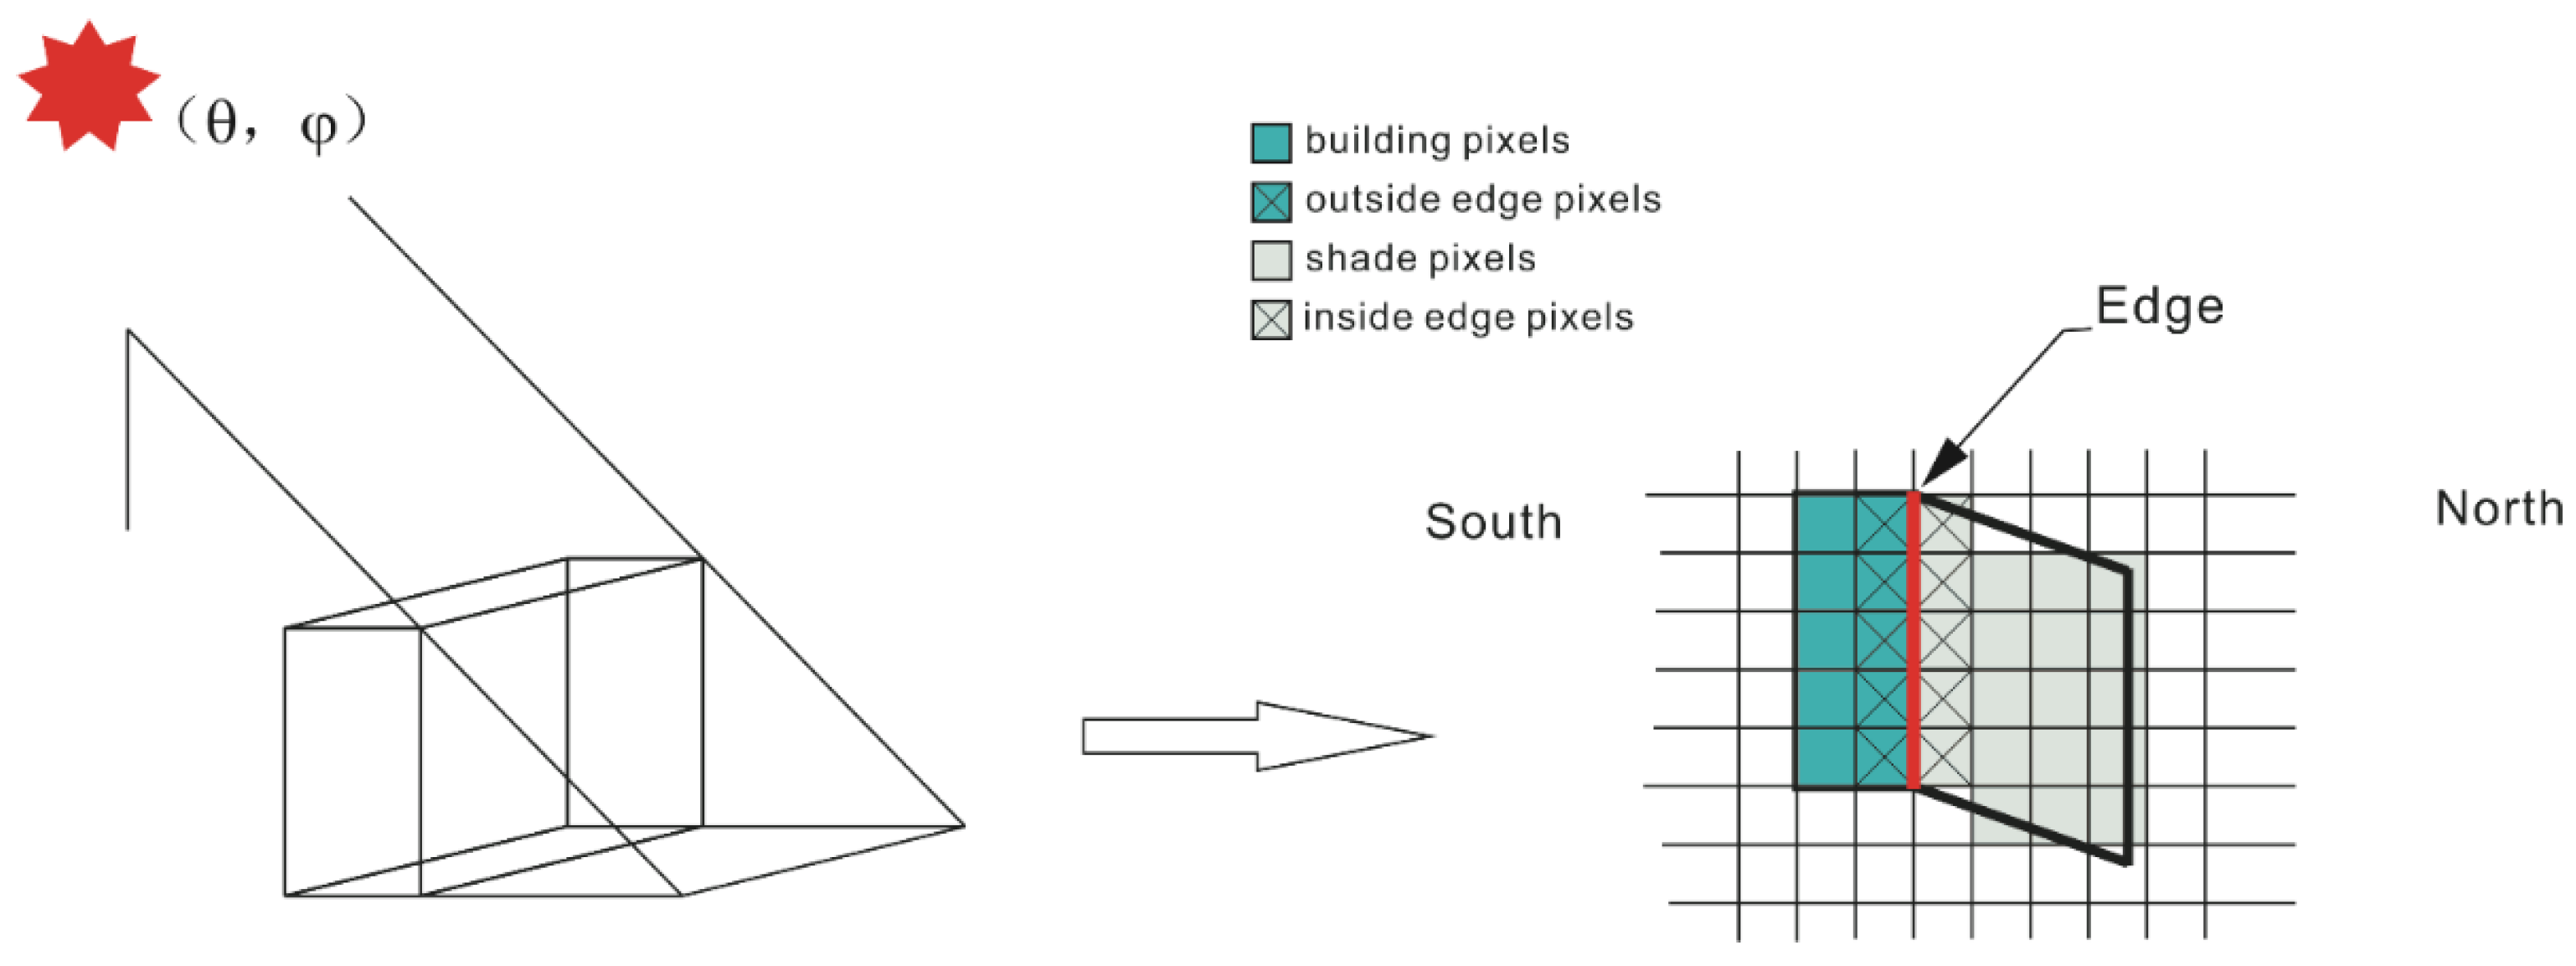
Figure 2 shows the spatial relationship between a building and its shadow. The shadow is adjacent to the building on the edge between sun side and shade side. The solar azimuth in the metadata is used to determine whether the edge is located on the south or north side of shadows.
3.3.2. Spectral Characteristics of Buildings and Shadows
Figure 1 shows the spectral characteristics of buildings and shadows: first, the dark building shadow pixels’ reflectance in green band is much lower than their adjacent building pixels’, whereas the water’s reflectance in green band is close to that of its background like vegetation and soil (see the blue dashed square in Figure 1b); second, the dark building shadow pixels’ NDWI is close to or even smaller than their adjacent building pixels’, whereas the NDWI of water is much higher than that of vegetation and soil (see the red dashed square in Figure 1f).
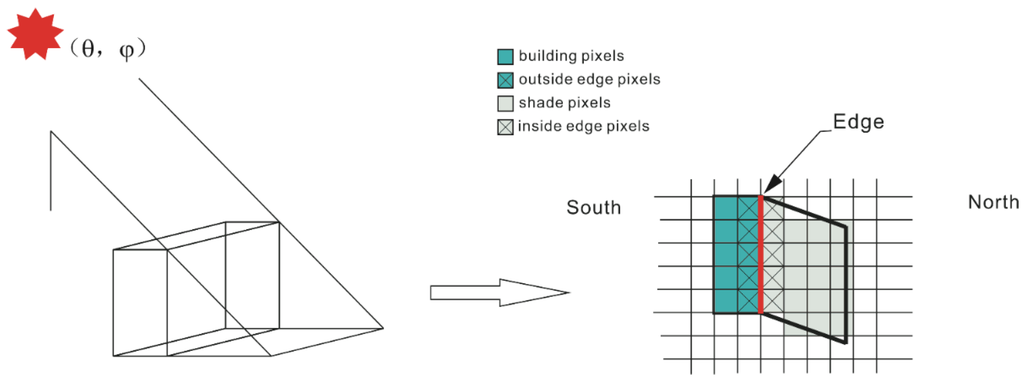
Figure 2.
Sketch maps of the building and its building shadow (Edge stands for the edge between sun side and shade side, inside edge pixels stand for the shaded pixels which are adjacent to the Edge, outside edge pixels stand for the building pixels which are adjacent to the Edge).
Figure 2.
Sketch maps of the building and its building shadow (Edge stands for the edge between sun side and shade side, inside edge pixels stand for the shaded pixels which are adjacent to the Edge, outside edge pixels stand for the building pixels which are adjacent to the Edge).
3.3.3. Generating a Dark Building Shadow Prediction Model
The NIR band can well separate dark shadow from other land cover types except water [38]. In the NIR band, we used an initial T (here, T = 0.1) to get a global mask including almost all “pure” dark shadow pixels. Then the “global-local” scheme [25,39] was used, applying it to each unit in an iterative way to get a local mask with high sub-pixel accuracy. With the above steps, we were able to get enough samples of dark shadows and water bodies. The SVM was used to generate a dark building shadow prediction model which uses the spectral differences between inside edge pixels and outside edge pixels in green band and NDWI as inputs (see Figure 2). A Gaussian radial basis function was chosen due to its superior performance compared with other kernel functions [40]. The Qingdao site was used to train the parameters of the model because it has many small water bodies with various backgrounds and numerous dark building shadows. 70% of the sample units were randomly selected for training and the rest of the units (30%) were used for verification. The sub-scenes of Fuzhou, Wuhan, and Huainan were further tested for validating the model’s robustness in other areas. The model has a high accuracy in all sites (see Table 4), indicating the model can separate small water bodies from dark building shadows accurately and automatically.

Table 4.
Accuracy assessments on dark building shadow prediction model (NSWB stands for the number of small water bodies, NDSB stands for the number of dark shadow bodies, NCPB stands for the number of correctly predict bodies, OA stands for the overall accuracy).
| City | NSWB | NDSB | NCPB | OA (%) | Kappa |
|---|---|---|---|---|---|
| Qingdao | 82 | 106 | 181 | 96.28 | 0.92 |
| Fuzhou | 71 | 168 | 223 | 93.31 | 0.85 |
| Huainan | 105 | 136 | 228 | 94.61 | 0.89 |
| Wuhan | 73 | 202 | 262 | 95.27 | 0.88 |
3.3.4. Automated Dark Building Shadow Detection Method
Figure 3 shows the flowchart of the automated dark building shadow detection method. First, binary segmentation in NIR band is performed to get the preliminary mask using an initial Tnir (here Tnir = 0.1). Then each initial unit is taken individually and delineated by a local segmentation to get a more precise boundary. For each unit, the spectral differences between inside edge pixels and outside edge pixels in green band and NDWI are calculated, respectively. The type of an unit (SWB or shadow bodies) is determined by the dark building shadow prediction model. Finally, the dark building shadow mask is obtained by removing the water bodies.

Figure 3.
Flowchart of automated dark building shadow detection method.
Figure 3.
Flowchart of automated dark building shadow detection method.

3.4. Urban Water Extraction Method and Accuracy Assessment
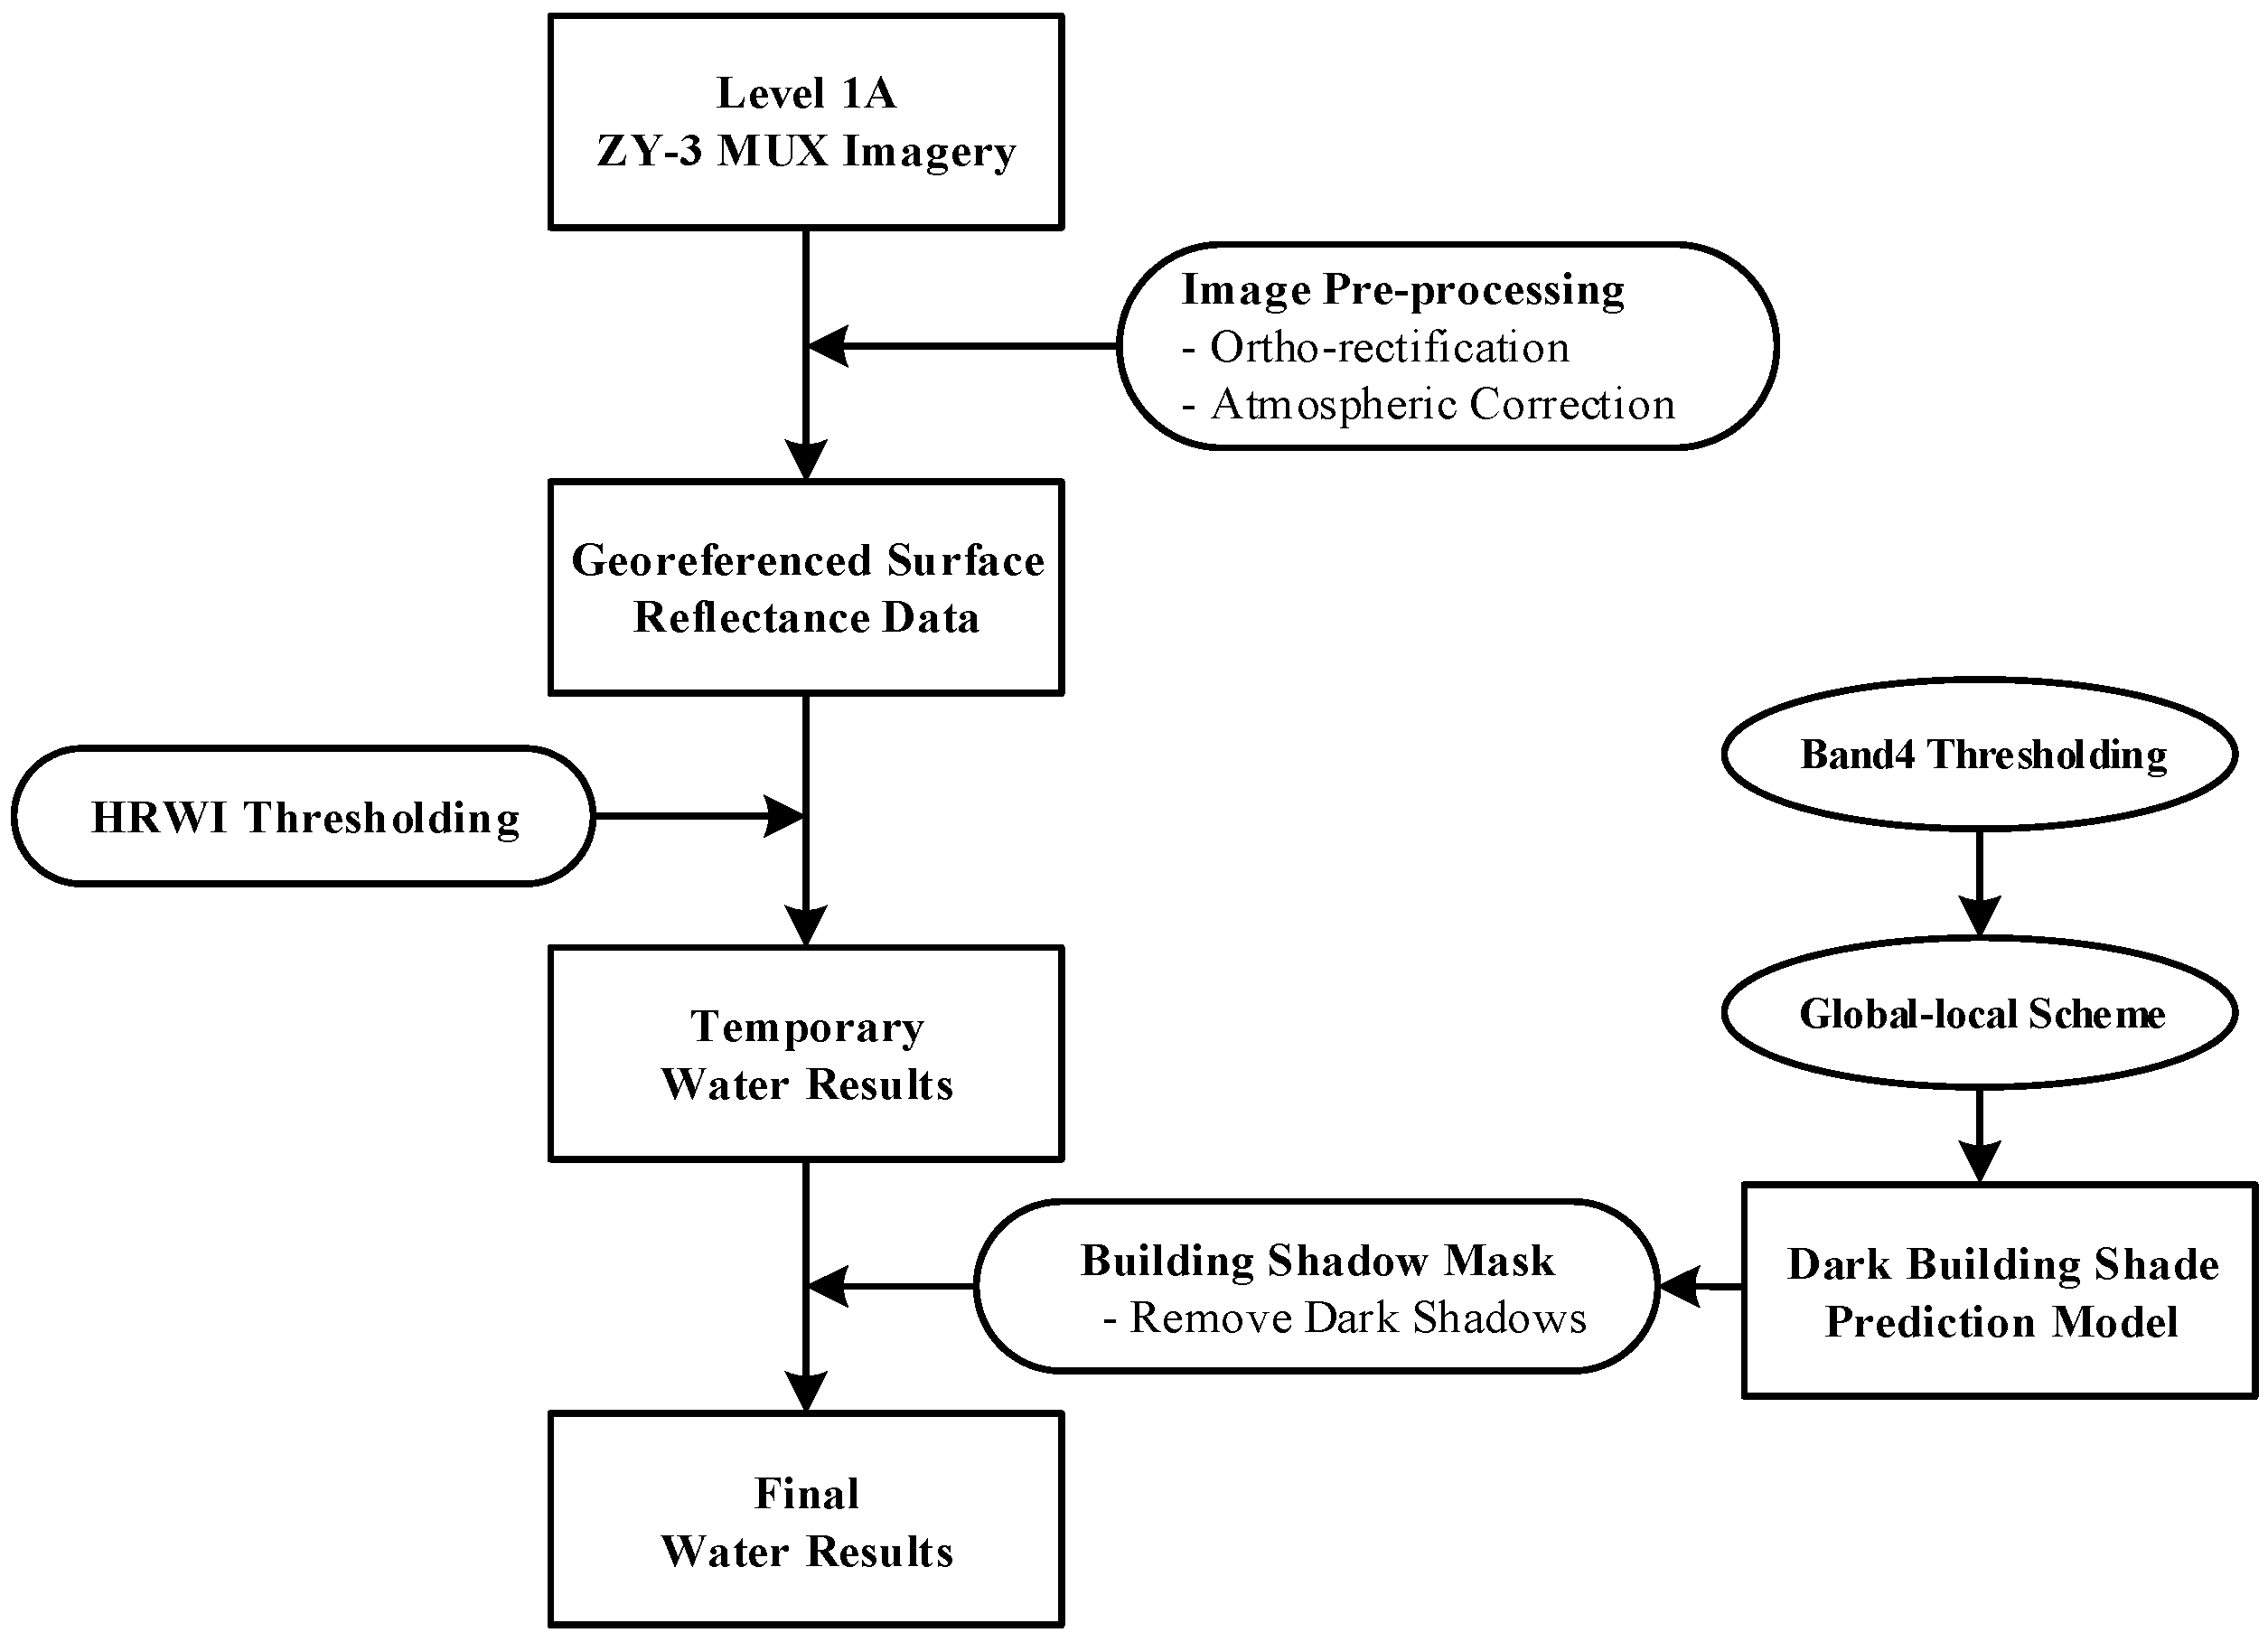
Figure 4 describes the flowchart of UWEM. First, we used a HRWI cut-off threshold to get a temporary water mask. Then, we used the method mentioned in Section 3.3.4. to automatically produce a dark building shadow mask. After that, we removed dark shadow noises in the temporary water mask and got the final water extraction results.
The widely used NDWI in VNIR imagery was chosen to compare the accuracy of UWEM. Both kappa coefficients and error matrices were used for accuracy assessment. The comparison between UWEM and NDWI was made at their optimal thresholds by using independent validation pixels generated with a random sampling scheme. The number of verification pixels (see Table 5) were chosen based on the percentage of water and water body area.

Table 5.
The number of verification pixels used in accuracy assessment at each test site.
| Test Site | Aksu | Fuzhou | Hanyang | Huangpo | Huainan |
|---|---|---|---|---|---|
| Number of verification pixels | 29,988 | 20,000 | 5000 | 10,000 | 30,000 |
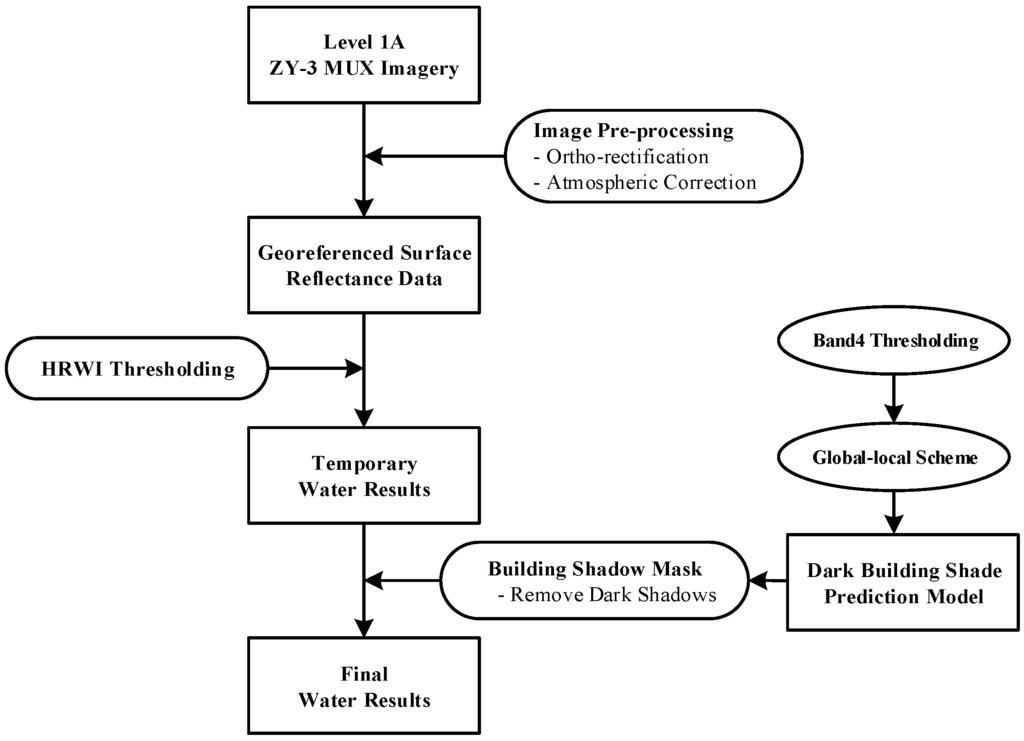
Figure 4.
Flowchart of urban water extraction method.
Figure 4.
Flowchart of urban water extraction method.
4. Results
4.1. Water Extraction Maps
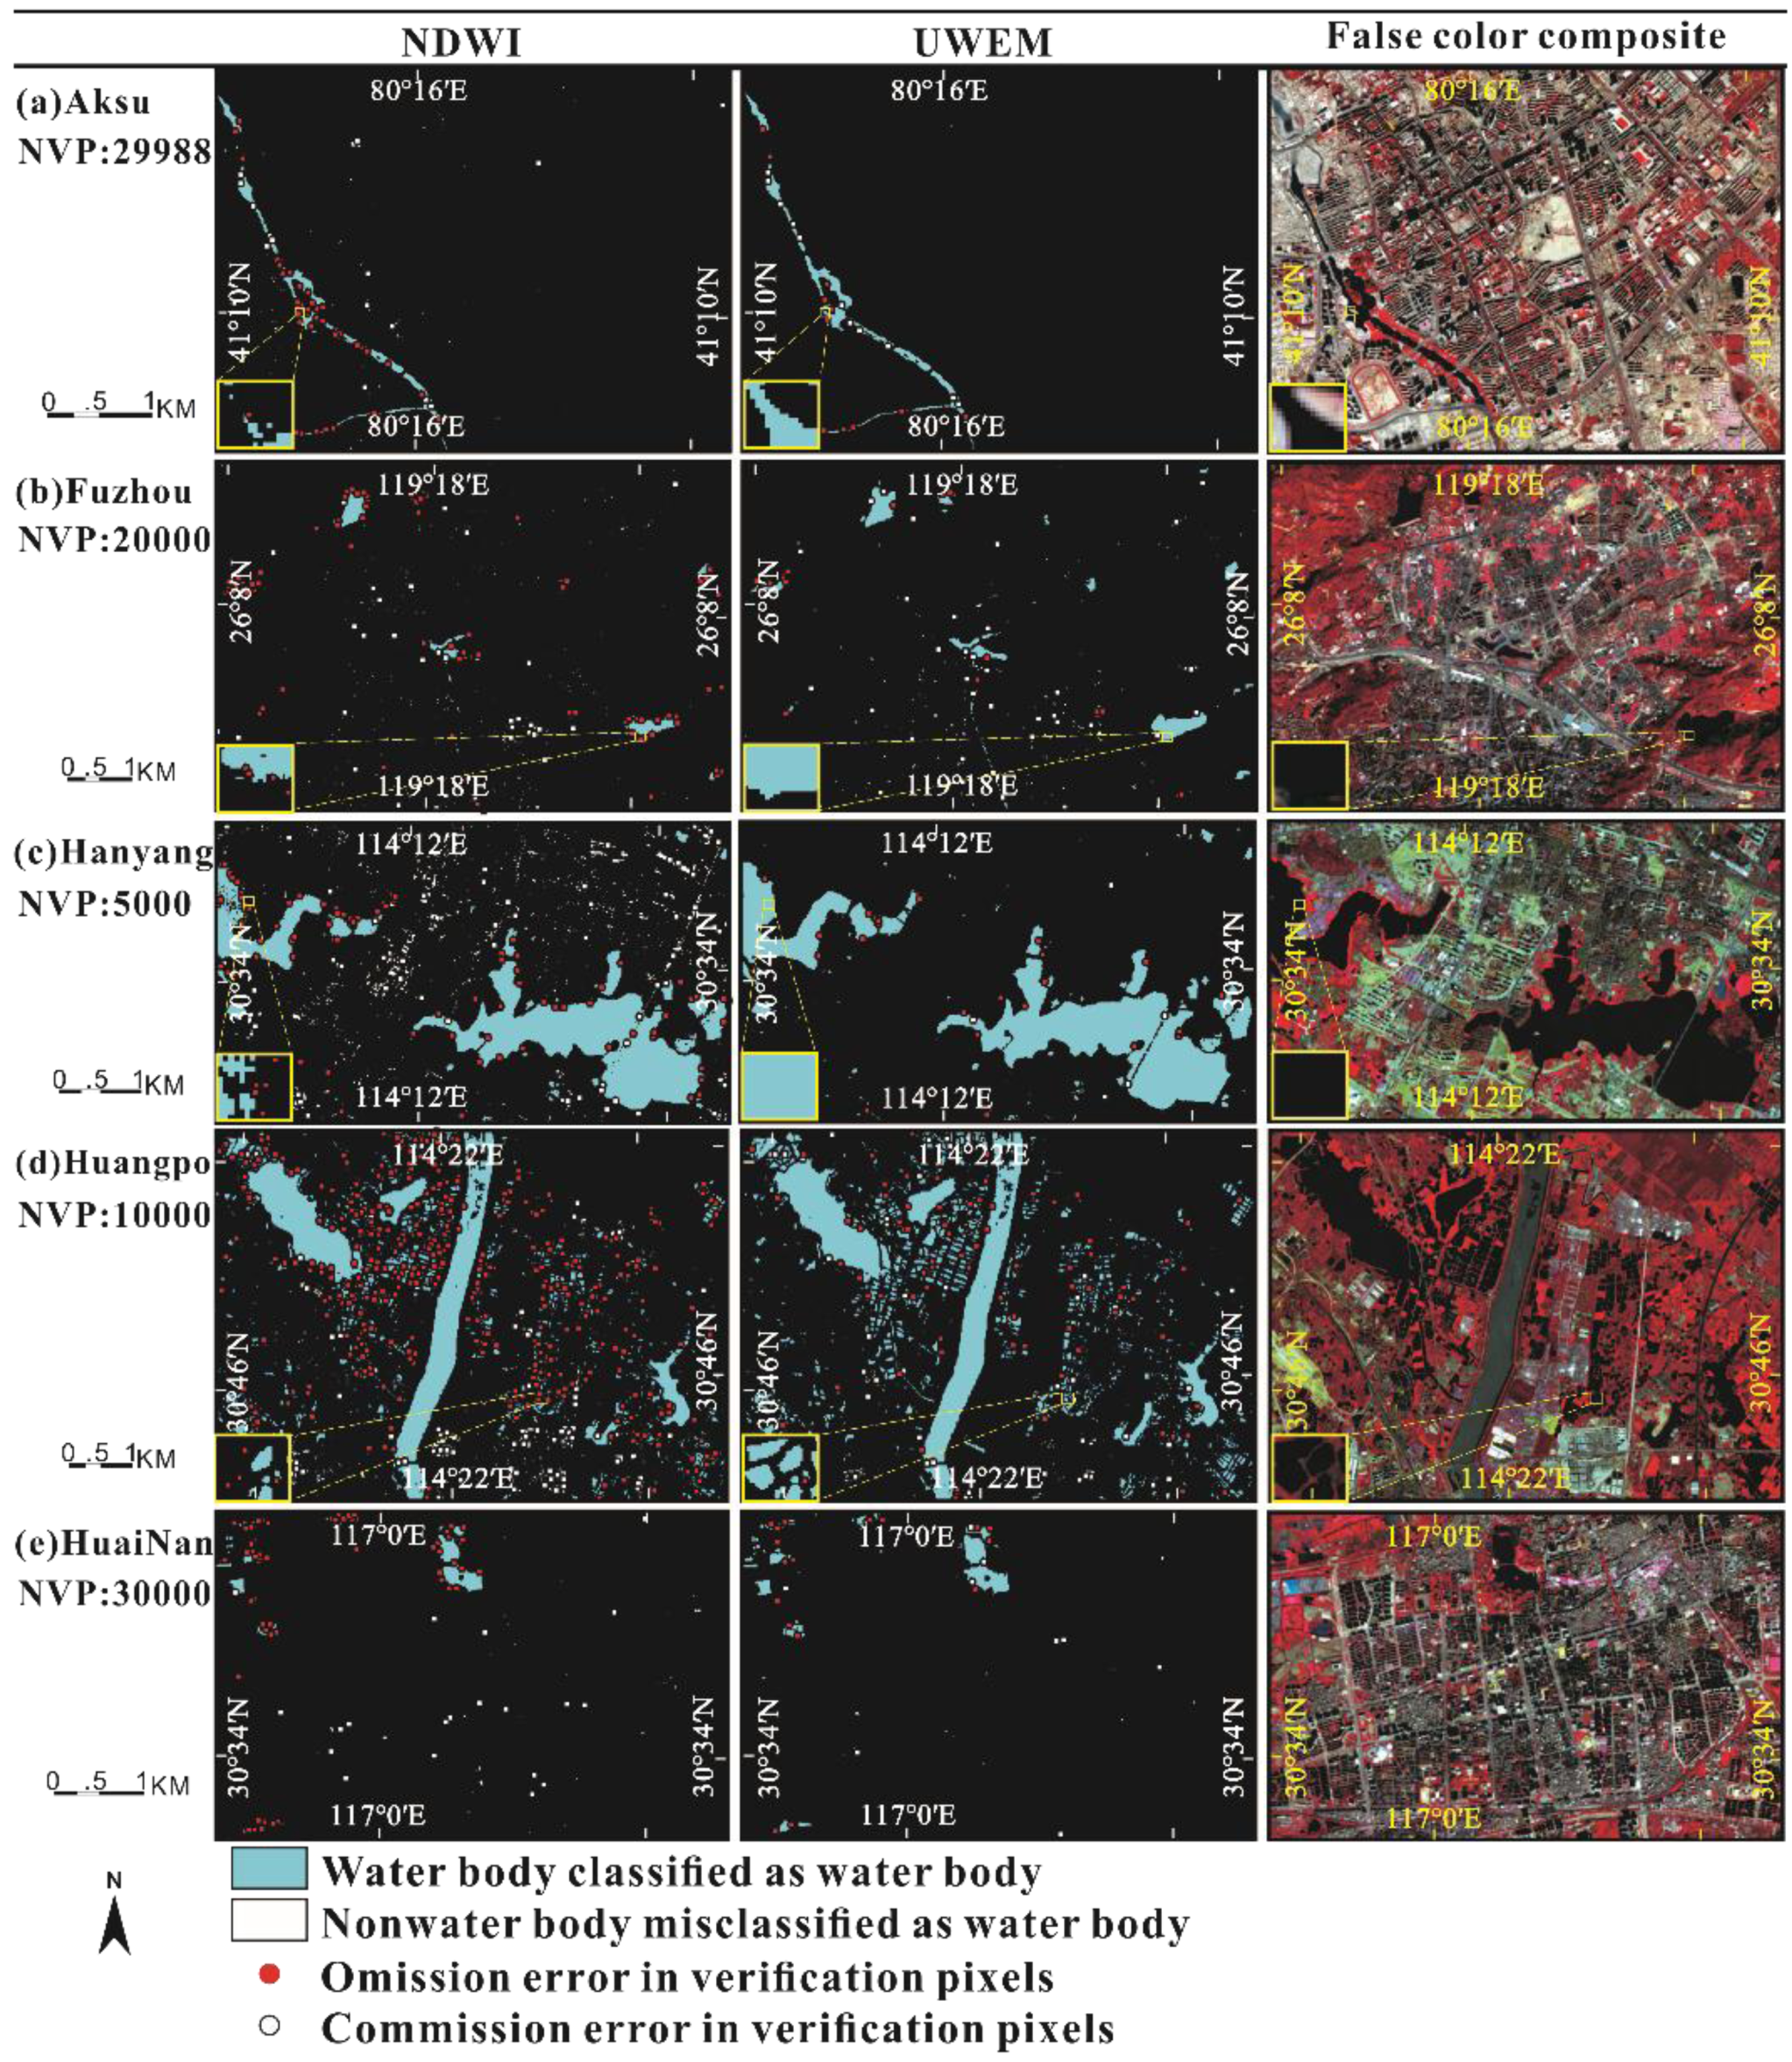
Figure 5 shows the water extraction results using NDWI and UWEM at the five test sites. Visual inspection of Figure 5 indicated that the UWEM successfully extracted most of the urban water bodies with complete shapes, while the extracted results by NDWI were incomplete. For example, UWEM extracted narrow rivers in Aksu with complete shapes, whereas the extracted rivers in NDWI’s result were discontinuous (Figure 5a); Small ponds in Huainan were well detected by UWEM, whereas NDWI partially detected or even completely omitted them (see Figure 5e). At test sites Fuzhou, Hanyang, and Huangpo where water bodies were dominated by un-pure or polluted water bodies, such as eutrophic reservoirs, polluted lakes and eutrophic ponds, NDWI completely omitted some of eutrophic water bodies (see Figure 5d) and had many omission errors near the polluted water bodies’ boundaries (see Figure 5b,c), but UWEM well detected most of these kinds of water bodies. What’s more, UWEM can effectively suppress the artificial construction land noises (see the white points in Figure 5) which were easily misidentified by NDWI.
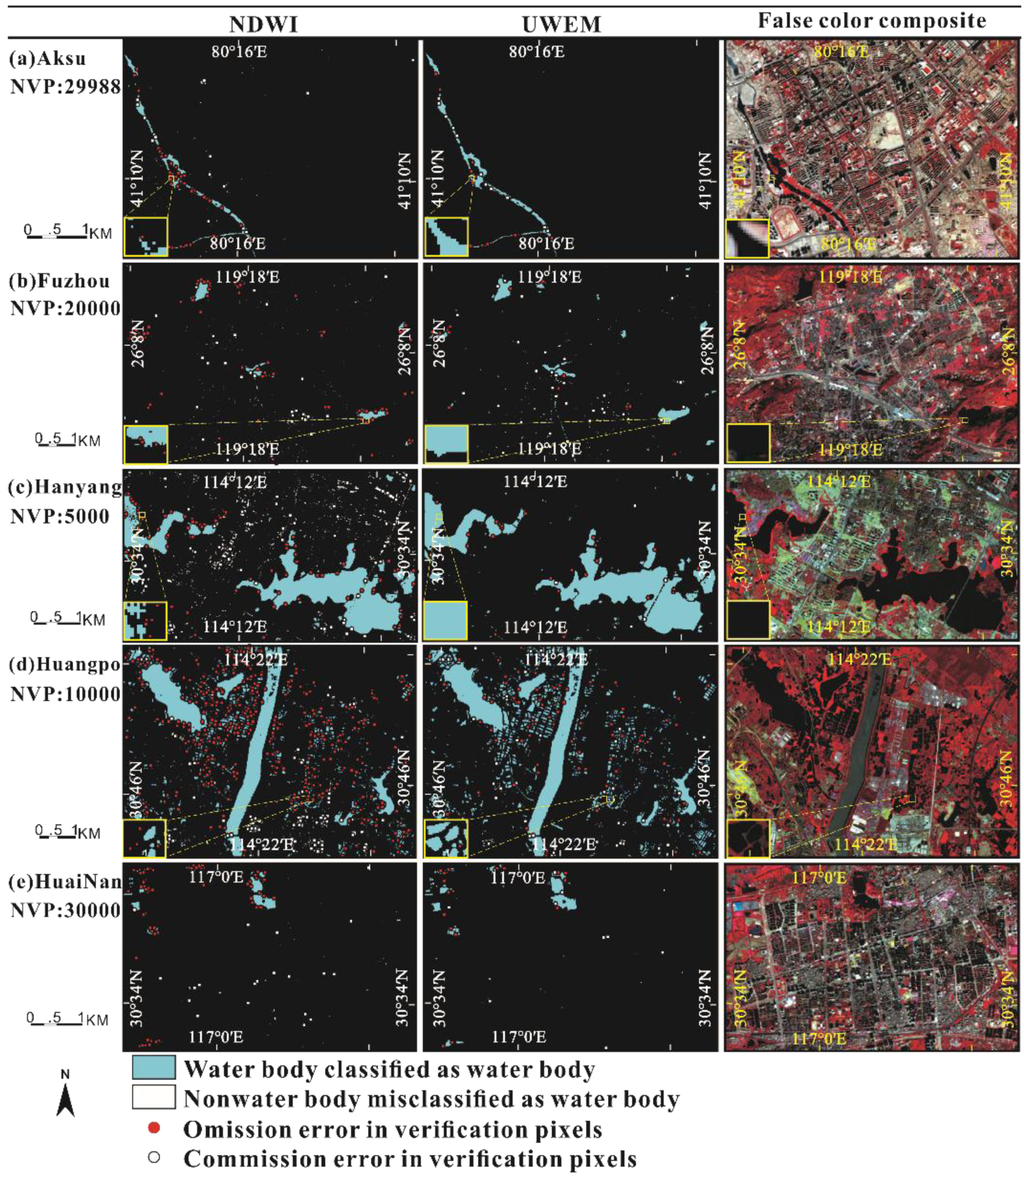
Figure 5.
Comparison of water extraction results using NDWI and UWEM at the five test sites (NVP stands for the number of verification pixels).
Figure 5.
Comparison of water extraction results using NDWI and UWEM at the five test sites (NVP stands for the number of verification pixels).
4.2. Water Extraction Accuracy
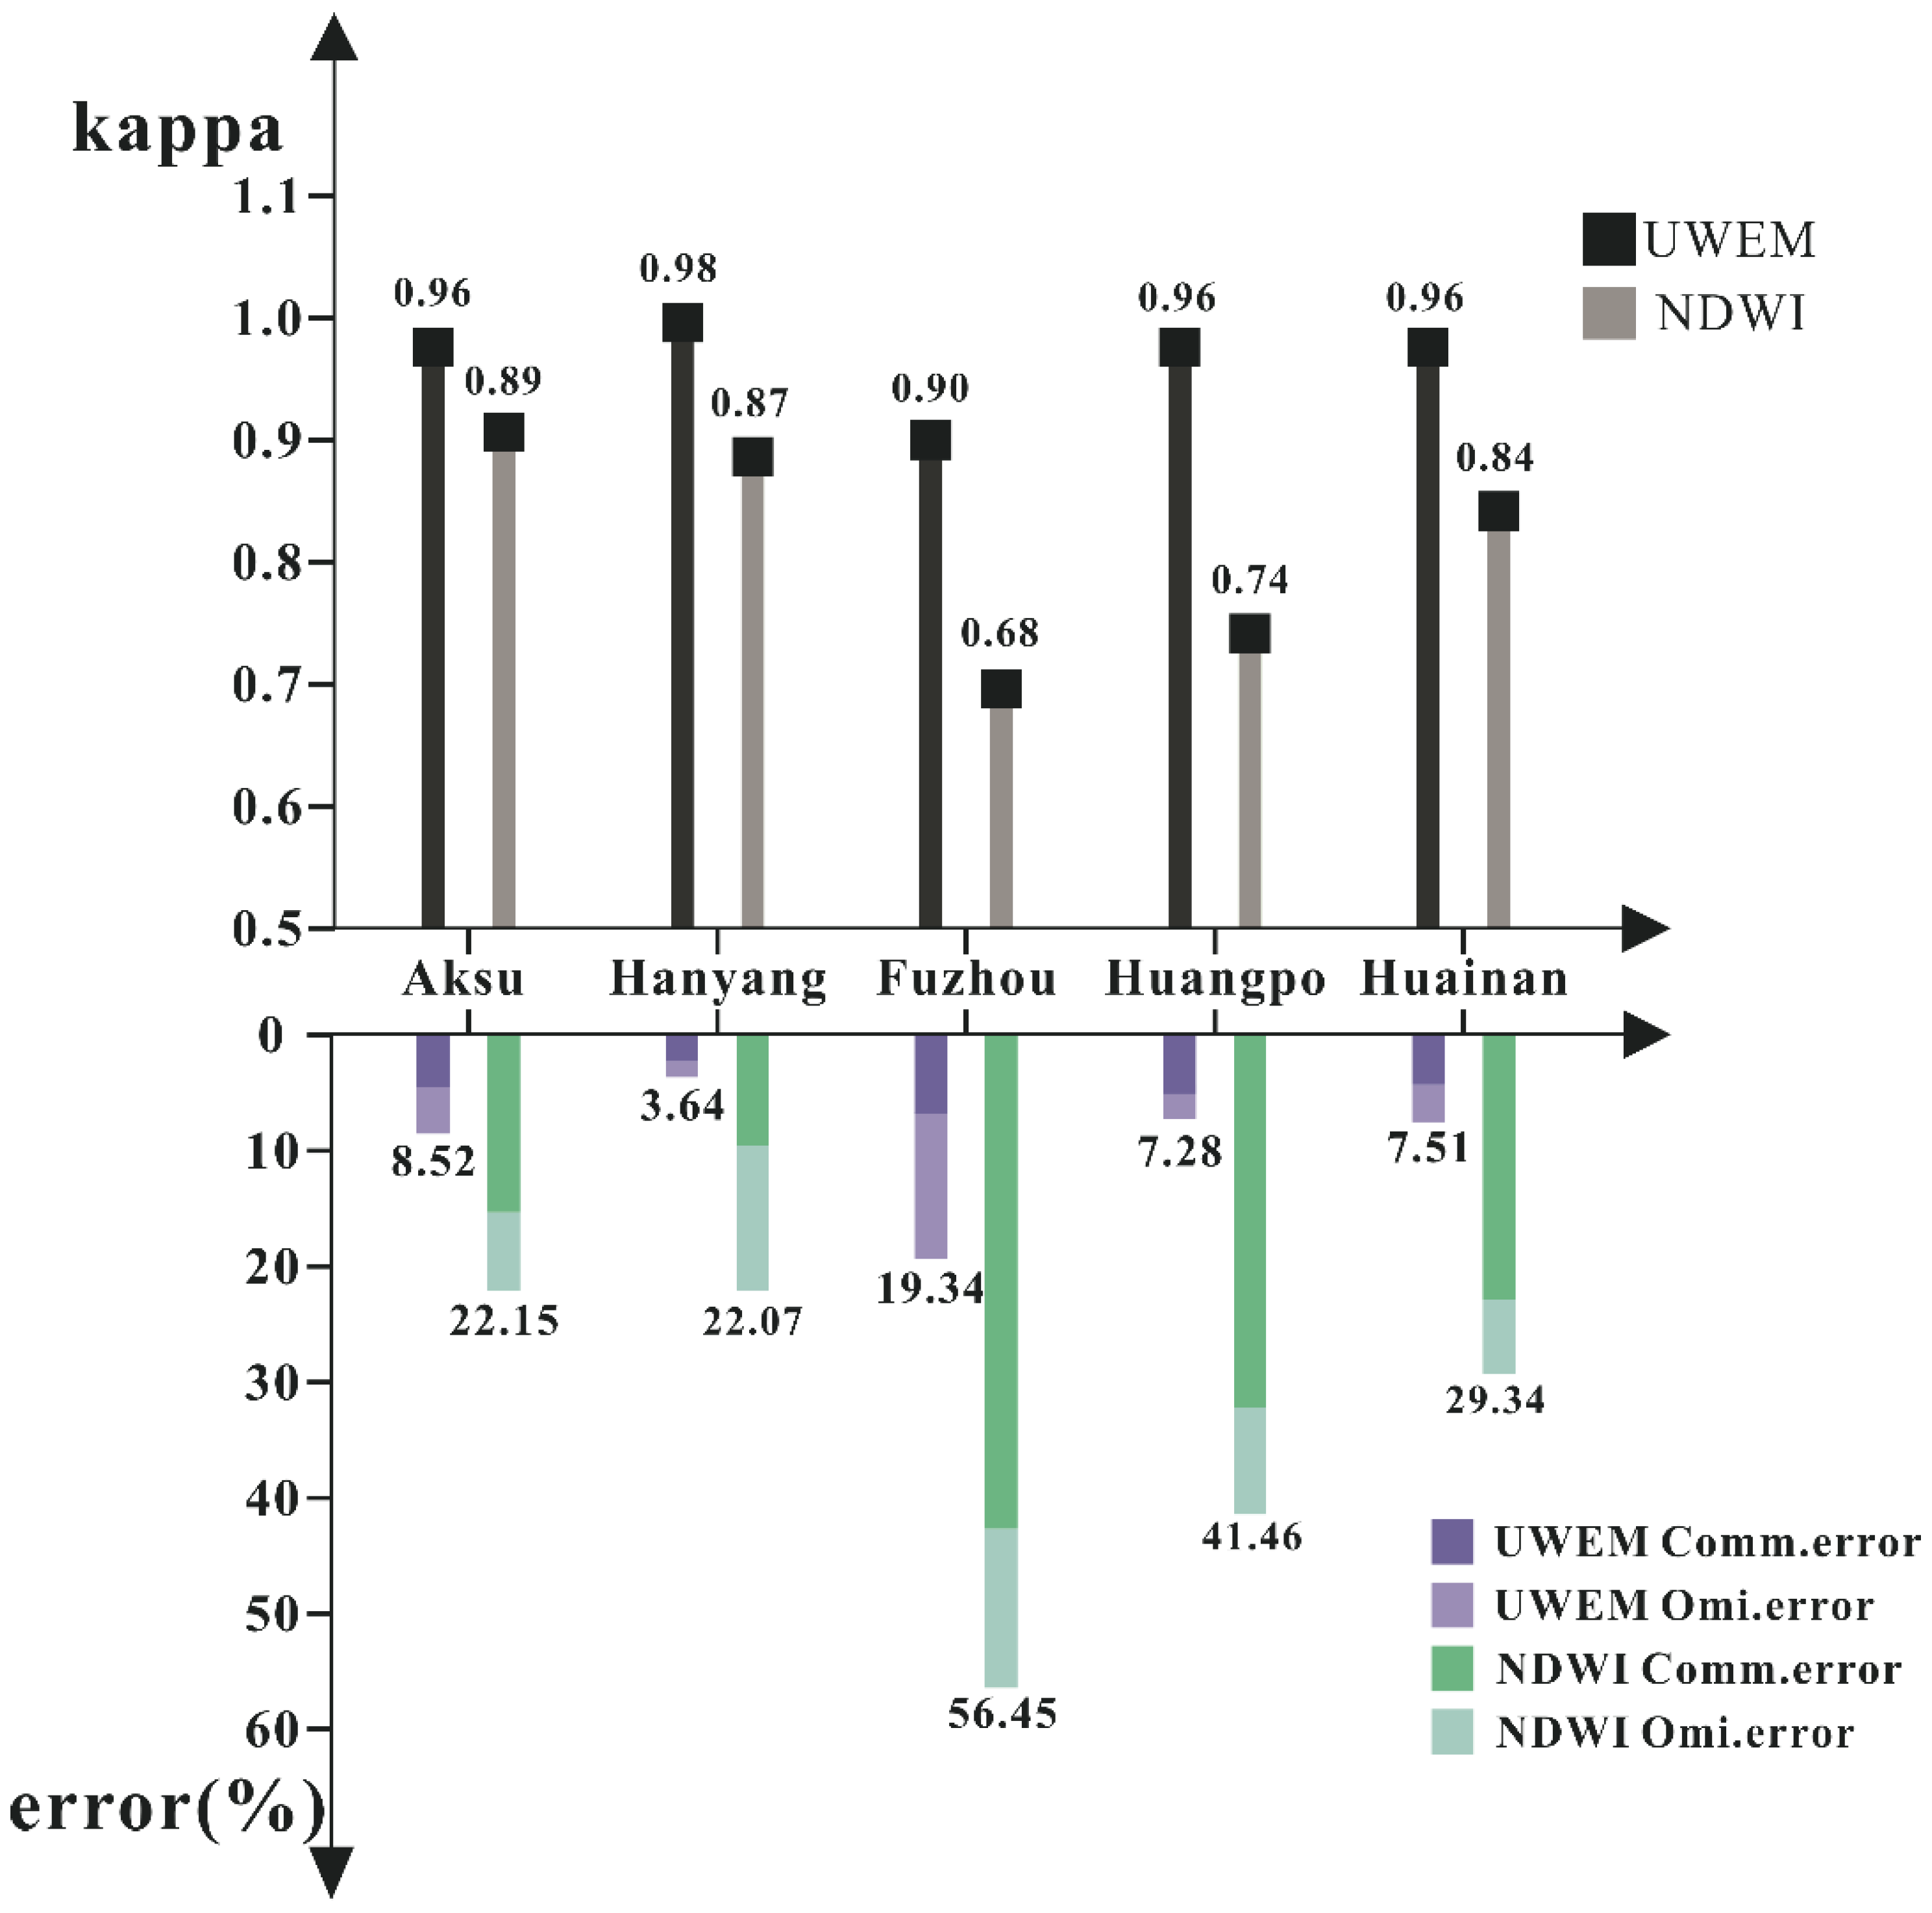
Accuracy assessments (see Figure 6) indicate that the UWEM has a promising accuracy when extracting urban water bodies, with an average kappa of 0.95 and an average total commission and omission error of 9.26%. In comparison to the UWEM, the NDWI has a much lower average kappa (0.80) and a much higher average total commission and omission error (34.29%). The average total commission and omission error of UWEM was only 27.00% of that of NDWI. The UWEM significantly improved the accuracy at all test sites. At the test site in Aksu where water bodies were dominated by narrow rivers, NDWI achieved the highest accuracy with kappa coefficient of 0.89. However, it was still 0.07 lower than that of the UWEM. Compared with NDWI, the total omission and commission error of HRWI was reduced by 61.53%. At the test in Huainan where water bodies were dominated by small ponds, NDWI’s performance was not very well with kappa value of 0.84, while UWEM performed very well with kappa value of 0.96. At test sites in Fuzhou, Huangpo, and Hanyang where water bodies were dominated by un-pure or polluted reservoirs, ponds, and lakes, NDWI’s performances were poor, with kappa coefficients of 0.68, 0.74 and 0.87, respectively. By contrast, UWEM performed very well at these three test sites with kappa coefficients of 0.90, 0.96, and 0.98, respectively. The total omission and commission errors were reduced by 65.74%, 82.44%, and 83.51%, respectively.
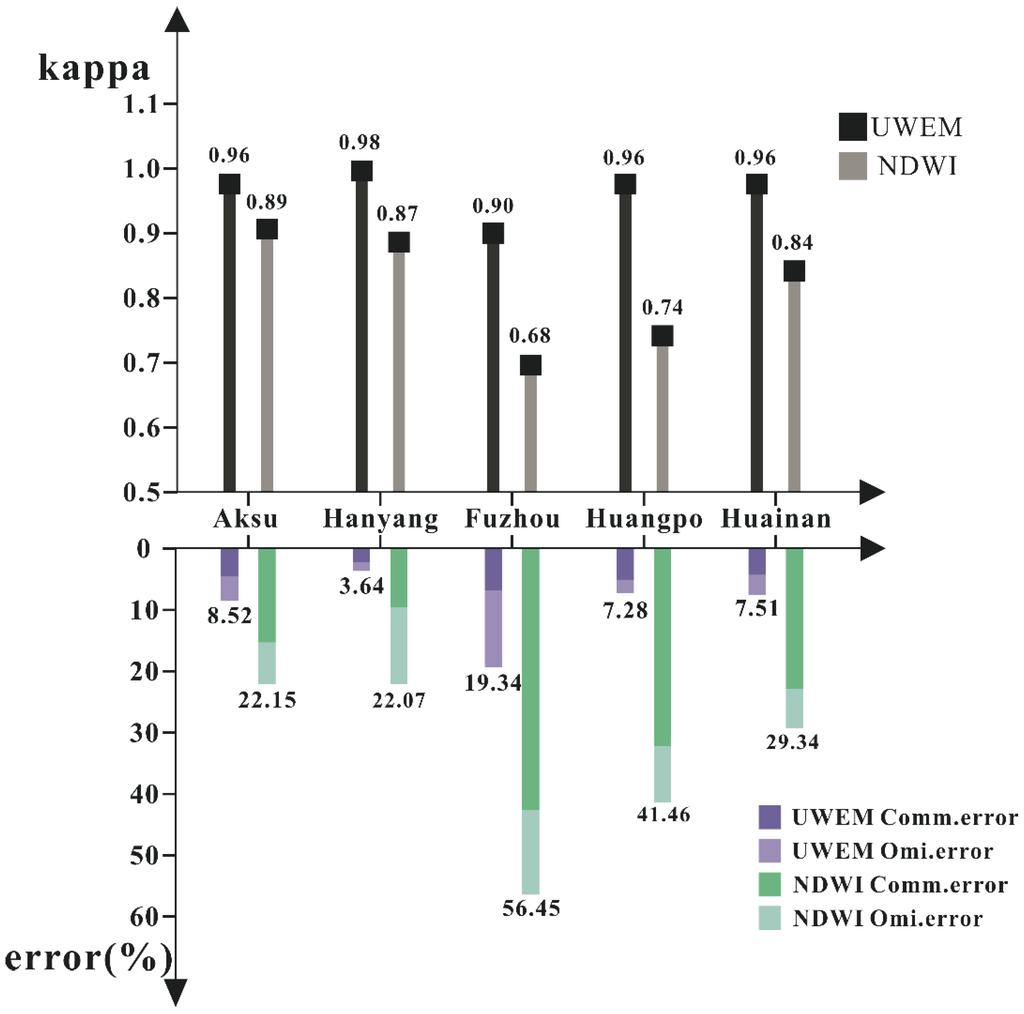
Figure 6.
The accuracy of UWEM and NDWI at each optimal threshold.
Figure 6.
The accuracy of UWEM and NDWI at each optimal threshold.
4.3. Threshold’s Stability
The default threshold cannot always provide a high accuracy result because of the tempo-spatial variations in heterogeneous urban areas. To reduce the trial-and-error time in adjusting the threshold, the thresholding method need to keep good performance in a range of thresholds near the default value. Figure 7 shows the accuracy of UWEM and NDWI in the neighborhood of the default threshold value including each optimal value. The accuracy variation of UWEM is more stable than that of NDWI in terms of both the range [−0.05, 0.05] and the range [−0.1, 0.1] (see Table 6). Moreover, the UWEM can provide good performance at default values (e.g., the minimum kappa value is 0.9) (see Figure 7). Therefore, the UWEM alleviates the manual trial-and-error issue which is often normal and serious in water indices [41].
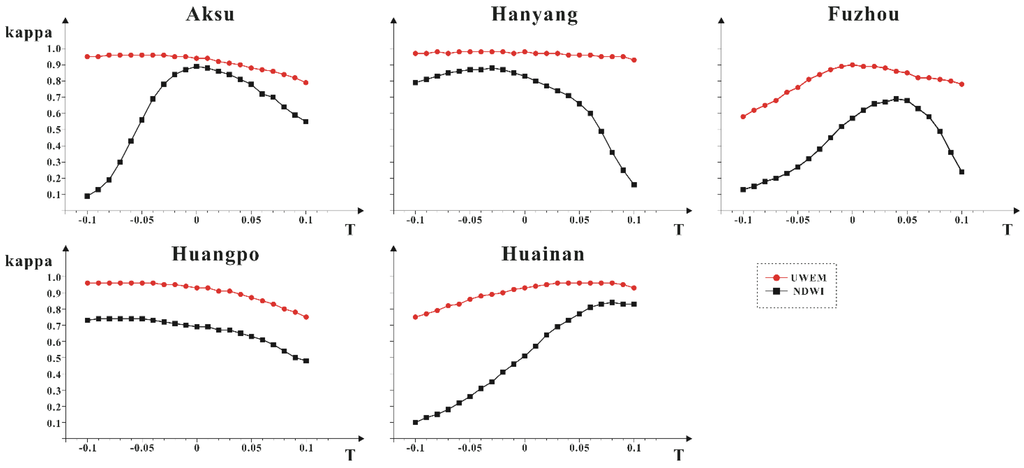
Figure 7.
The accuracy of the UWEM and NDWI at five test sites in a range of thresholds near zero.
Figure 7.
The accuracy of the UWEM and NDWI at five test sites in a range of thresholds near zero.
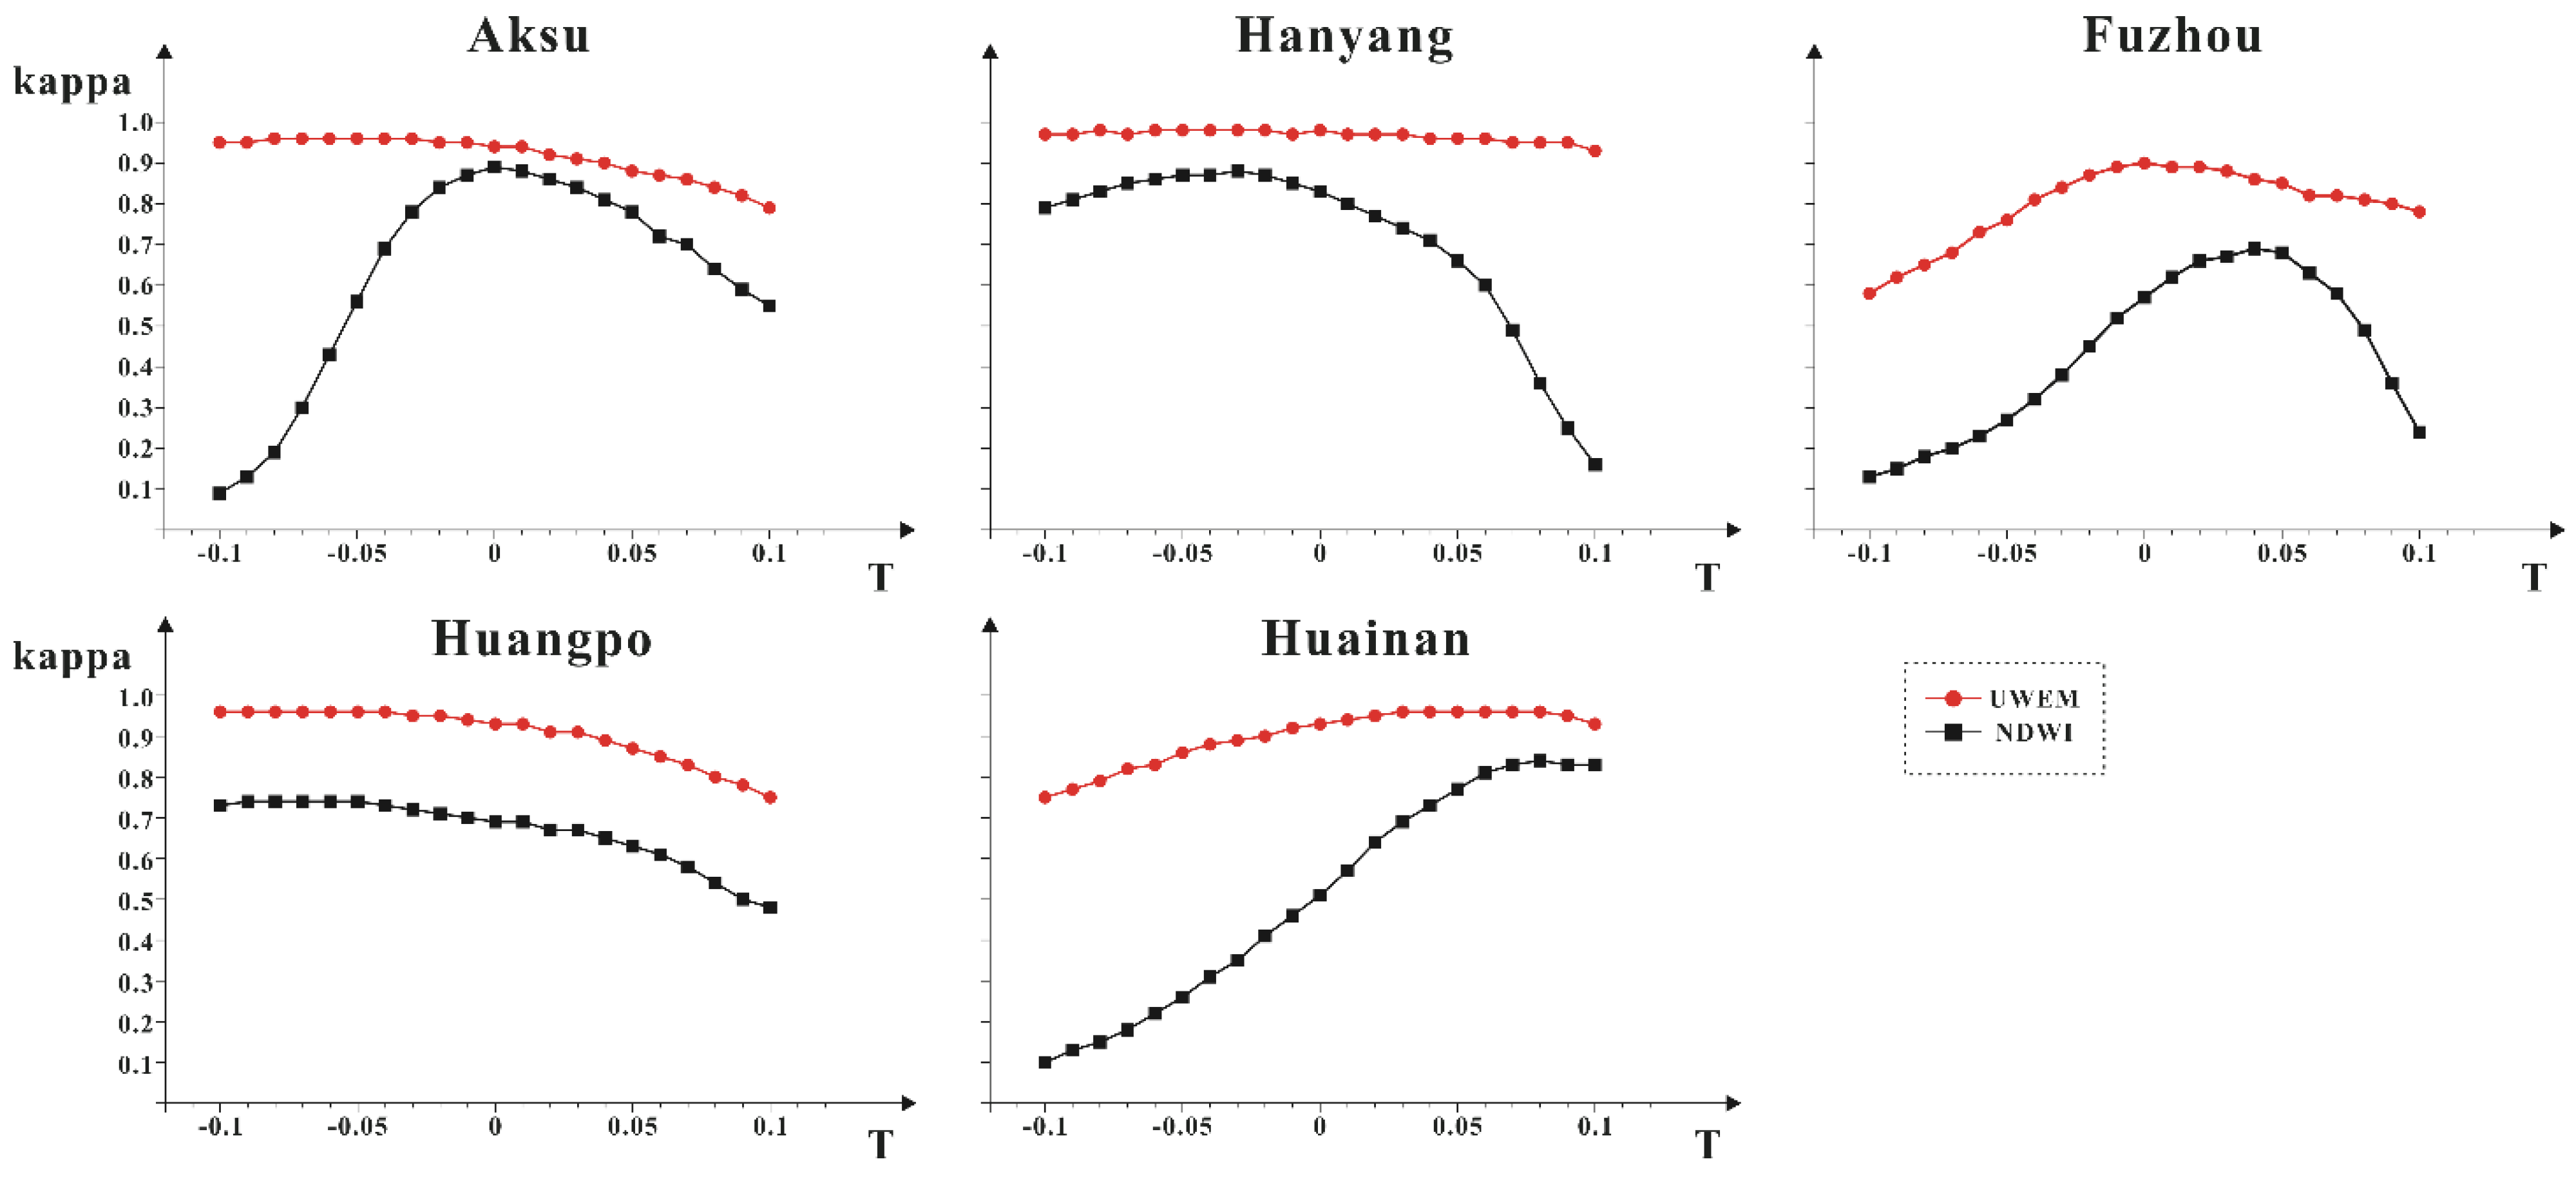

Table 6.
Standard Deviation of Kappa values in a range of thresholds near zero using UWEM and NDWI (the step in each range is 0.01).
| Method | Range | Aksu | Hanyang | Fuzhou | Huangpo | Huainan |
|---|---|---|---|---|---|---|
| STD(Kappa) | STD(Kappa) | STD(Kappa) | STD(Kappa) | STD(Kappa) | ||
| UWEM | [−0.05, 0.05] | 0.027 | 0.008 | 0.042 | 0.029 | 0.036 |
| NDWI | [−0.05, 0.05] | 0.098 | 0.075 | 0.153 | 0.034 | 0.176 |
| UWEM | [−0.1, 0.1] | 0.052 | 0.013 | 0.095 | 0.067 | 0.069 |
| NDWI | [−0.1, 0.1] | 0.257 | 0.215 | 0.197 | 0.082 | 0.269 |
5. Discussion
The performances of UWEM are better than that of NDWI in terms of accuracy and stability under various urban backgrounds using high-resolution ZY-3 multi-spectral images. The UWEM combined a new water index (HRWI) with an automated building shadow detection method. SVM model was used to optimize the UWEM parameters from training sets at Qingdao. The parameters were verified to be robust at different test sites (see Figure 6). The good performance can be explained as follows:
- For the shortcomings of ratio model, the coefficient model is a better choice to develop a water index, because it can better reflect the differences of spectral characteristics between water and other surface features.
- Unlike the general empirical algorithms [11], there are two prominent advantages in the coefficient model developed with SVM: the inherent default threshold of the index is zero; the index can achieve the largest separation between water and other land cover types. Therefore, SVM is an outstanding method for training coefficient index. This study provides a potential method for remote sensing researchers to develop a suitable water index using the coefficient model, which is of great significance to relative studies in the future.
- To reduce the commission errors caused by dark shadow, a dark building shadow prediction model was proposed using two spectral variables as inputs. These two variables combine the spectral characteristics of a building and its shadow, making the model keep both good separation and stability.
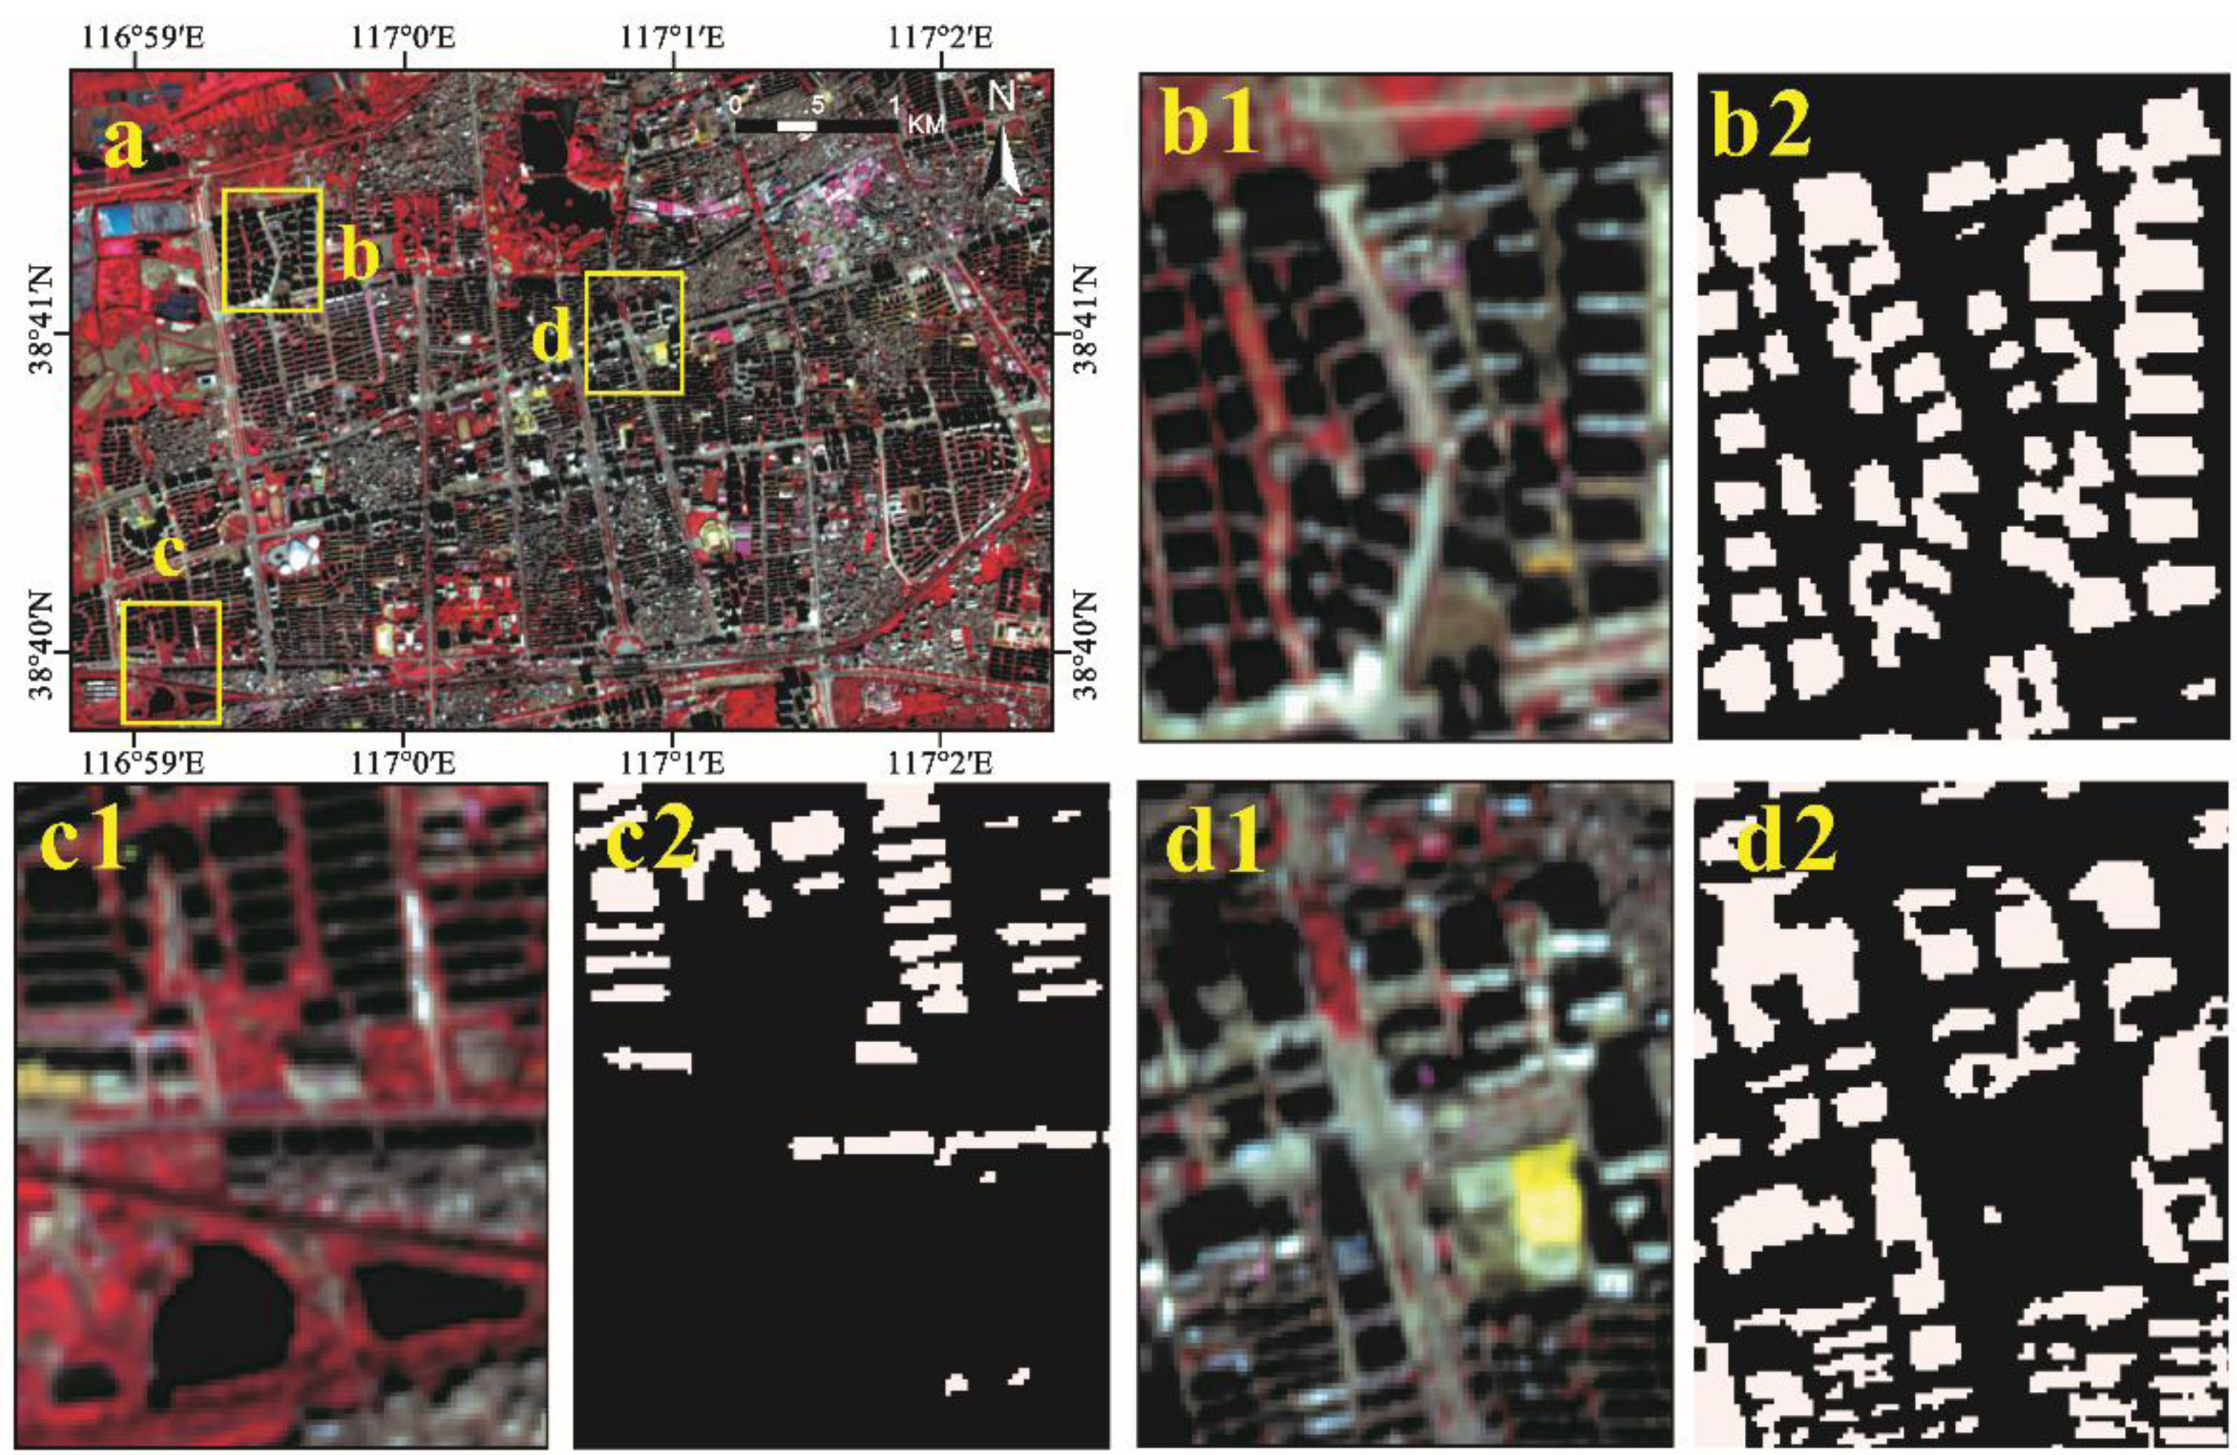
- The automated building shadow detection method in UWEM was used to address the misidentification caused by dark building shadows. Figure 8 shows the extracted shadow mask at the test site in Huainan where background has abundant dark shadows. Visual inspection of Figure 8 indicated good performance of the automated shadow detection method. For example, the method well detected shadows of different kinds of buildings (Figure 8b2). It can also well detect the shadows of tall buildings (Figure 8d2). What’s more, it performs well in the scenes where backgrounds have water bodies (Figure 8c2).
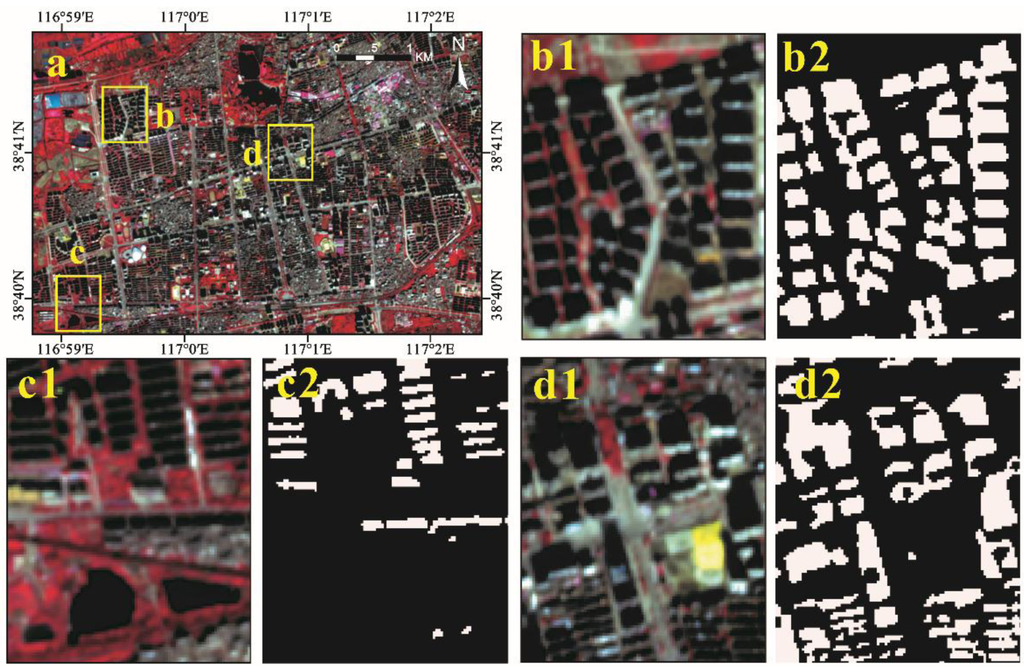
Figure 8.
The extracted shadow mask at the test site in Huainan using the method proposed in Section 3.3.4.a: the ZY-3 color composite (NIR, Red, and Green); b1: enlarged view of the highlighted region b in a; b2: the extracted shadow results of b1; c1: enlarged view of the highlighted region c in a; c2: the extracted shadow results of c1; d1: enlarged view of the highlighted region d in a; d2: the extracted shadow results of d1.
In order to show the role of the proposed shadow detection method, we compared the accuracy results of HRWI, NDWI, HRWI with shadow detection method (SDM), and NDWI with SDM (NDWIS) at each optimal threshold (see Table 7). UWEM, which combines HRWI with SDM, showed the best performance with the highest accuracy in detecting urban water bodies in all cases. The NDWIS did not achieve a high accuracy in each test site even though it had higher accuracy than NDWI in Hanyang and Huainan, with the help of SDM. The reason is that SDM cannot remove the noises caused by buildings, and NDWI in NDWIS has to raise the threshold to suppress the signal of the buildings (such as bright building and dark building, see Table 3) at the cost of increasing the omission error. Using only HRWI cannot guarantee high accuracy in test sites where backgrounds have many dark shadows, such as Huainan and Fuzhou. The reason is that only HRWI has to raise the threshold to suppress the signal of dark shadows (see Table 3) at the cost of increasing the omission error. Therefore, we can conclude that HRWI and shadow detection method should be applied together in order to extract urban water bodies with high accuracy and robustness.

Table 7.
Summary of the accuracy using HRWI, NDWI, UWEM, and NDWI with shadow detection method at each optimal threshold. (OE stands for omission error, CE stands for commission error, NDWIS stands for NDWI with shadow detection method).
| Method | Aksu | Hanyang | Fuzhou | Huangpo | Huainan | ||||||||||
|---|---|---|---|---|---|---|---|---|---|---|---|---|---|---|---|
| Kappa | OE% | CE% | Kappa | OE% | CE% | Kappa | OE% | CE% | Kappa | OE% | CE% | Kappa | OE% | CE% | |
| HRWI | 0.91 | 15.58 | 1.97 | 0.97 | 3.04 | 1.90 | 0.78 | 30.37 | 11.33 | 0.96 | 5.07 | 2.21 | 0.83 | 28.94 | 0.60 |
| NDWI | 0.89 | 15.3 | 6.85 | 0.87 | 12.47 | 9.60 | 0.68 | 42.67 | 13.78 | 0.74 | 32.2 | 9.26 | 0.84 | 22.86 | 6.48 |
| UWEM | 0.96 | 4.53 | 3.99 | 0.98 | 1.42 | 2.22 | 0.90 | 6.81 | 12.53 | 0.96 | 5.07 | 2.21 | 0.96 | 4.27 | 3.24 |
| NDWIS | 0.89 | 15.3 | 6.85 | 0.88 | 11.75 | 8.94 | 0.68 | 42.67 | 13.78 | 0.74 | 32.2 | 9.26 | 0.88 | 20.89 | 1.59 |
Although high-resolution images have been available for a few decades, urban environment studies still lack automated methods to characterize urban water extent with adequate detail. The UWEM is a simple and automated method based on high-resolution imagery that fills this gap. Urbanization makes land cover in general, and water-related features in particular, change more rapidly [1]. Small water bodies are the most susceptible [15,16]. The UWEM performed well when extracting small water bodies, thereby providing a useful and efficient tool with which man-made urban surface water change can be easily monitored.
Despite a number of improved methods on water mapping [11,23,24,25] have been proposed, few tests have been undertaken on various water conditions. On the other hand, testing in various environments with enough number of test sites is particularly important when extracting urban water bodies. The proposed algorithm provides consistent and accurate water detection results for a variety of water conditions with respect to turbidity, eutrophication and pollution. Thus, the extracted urban surface water is reliable for urban surface water change analysis and can also serve as basic information for further analyses of water quality.
Here, three points should be noted when applying UWEM in other urban areas. First, it is suggested that atmospheric correction should be applied. If the HRWI is just calculated using top-of-atmosphere (TOA) reflectance, the accuracy and optimal threshold values may differ slightly from those observed in this study. Second, those water bodies whose surfaces are totally covered by phytoplankton or aquatic vegetation cannot be extracted correctly and need to be dealt with using alternative methods. Third, the dark building shadow prediction model helps effectively suppress dark shadows, making the UWEM more accurate and stable. However, if the dark shadows are connected to SWB, the model may degrade accuracy. It is a difficult problem, yet can be remedied by editing to produce an accurate building shadow mask, and then combine it with the HRWI to accurately map water bodies in urban areas.
6. Conclusions
We developed a water extraction scheme to delineate urban surface water with high-resolution imagery for urban environmental studies and applications. Using ZY-3 multi-spectral imagery, we proposed a new water index named High Resolution Water index (HRWI) designed for high-resolution remote sensing imagery. A building shadow detection method, which combines the spatial and spectral features, was introduced to remove dark building shadows often existing in urban areas. With four cities having different climate and topography in China, accuracy assessment results showed that this algorithm had a good performance with average kappa coefficient of 0.95 and average total commission and omission error of 9.26%. Compared with NDWI, this algorithm significantly improved accuracy by lessening commission and omission errors by 73.00%. What’s more, this algorithm has good performances in a range of thresholds near default value, which means that this algorithm can keep good performance with high accuracy, stability, robustness irrespective of different environment conditions in different test sites.
It is believed that this algorithm, which combines a new water index with a building shadow detection method, can significantly improve the urban surface water detection accuracy, and should promote high resolution remote sensing imagery’s integration in urban hydrological applications.
Acknowledgments
The research was supported by the National Disaster Reduction “Gaofen 973” Project (grant No. 03-Y30B06-9001-13/15-01), the CAS Important Directional Program (KZZD-EW-07-02) and the International Science & Technology Cooperation Program of China (grant No. 2010DFA92720-25). The ZY-3 imagery data set was obtained from the “China Centre for Resources Satellite Data and Application”. Thanks to our friends (Aaron Hogan and Christopher Nytch) for proofreading the draft.
Author Contributions
Fangfang Yao was responsible for the research design, experiment and analysis, and drafting of the manuscript. Chao Wang reviewed the manuscript and was responsible for the analysis of data and main technical guidance. Di Dong was responsible for drafting and revising the manuscript and took part in the discussion of experiment design. Jiancheng Luo supported the data collection and experiment design. Zhanfeng Shen took part in the discussion of method. Kehan Yang was responsible for data preprocessing and validation of the results. All authors read and approved the manuscript.
Conflicts of Interest
The authors declare no conflict of interest.
References
- Du, N.; Ottens, H.; Sliuzas, R. Spatial impact of urban expansion on surface water bodies—A case study of Wuhan, China. Landsc. Urban Plan. 2010, 94, 175–185. [Google Scholar] [CrossRef]
- Fletcher, T.D.; Andrieu, H.; Hamel, P. Understanding, management and modelling of urban hydrology and its consequences for receiving waters: A state of the art. Adv. Water Res. 2013, 51, 261–279. [Google Scholar] [CrossRef]
- Dewan, A.M.; Islam, M.M.; Kumamoto, T.; Nishigaki, M. Evaluating flood hazard for land-use planning in greater dhaka of bangladesh using remote sensing and GIS techniques. Water Res. Manag. 2006, 21, 1601–1612. [Google Scholar] [CrossRef]
- Lacaux, J.P.; Tourre, Y.M.; Vignolles, C.; Ndione, J.A.; Lafaye, M. Classification of ponds from high-spatial resolution remote sensing: Application to rift valley fever epidemics in Senegal. Remote Sens. Environ. 2007, 106, 66–74. [Google Scholar] [CrossRef]
- Viala, E. Water for food, water for life a comprehensive assessment of water management in agriculture. Irrig. Drain. Syst. 2008, 22, 127–129. [Google Scholar] [CrossRef]
- Eppink, F.V.; van den Bergh, J.C.; Rietveld, P. Modelling biodiversity and land use: Urban growth, agriculture and nature in a wetland area. Ecol. Econ. 2004, 51, 201–216. [Google Scholar] [CrossRef]
- Gessner, M.O.; Hinkelmann, R.; Nützmann, G.; Jekel, M.; Singer, G.; Lewandowski, J.; Nehls, T.; Barjenbruch, M. Urban water interfaces. J. Hydrol. 2014, 514, 226–232. [Google Scholar] [CrossRef]
- Pekel, J.F.; Vancutsem, C.; Bastin, L.; Clerici, M.; Vanbogaert, E.; Bartholomé, E.; Defourny, P. A near real-time water surface detection method based on HSV transformation of MODIS multi-spectral time series data. Remote Sens. Environ. 2014, 140, 704–716. [Google Scholar] [CrossRef]
- Goetz, S.; Gardiner, N.; Viers, J. Monitoring freshwater, estuarine and near-shore benthic ecosystems with multi-sensor remote sensing: An introduction to the special issue. Remote Sens. Environ. 2008, 112, 3993–3995. [Google Scholar] [CrossRef]
- Castañeda, C.; Herrero, J.; Auxiliadora Casterad, M. Landsat monitoring of playa-lakes in the spanish monegros desert. J. Arid Environ. 2005, 63, 497–516. [Google Scholar] [CrossRef]
- Feyisa, G.L.; Meilby, H.; Fensholt, R.; Proud, S.R. Automated water extraction index: A new technique for surface water mapping using landsat imagery. Remote Sens. Environ. 2014, 140, 23–35. [Google Scholar] [CrossRef]
- Frazier, P.S.; Page, K.J. Water body detection and delineation with Landsat TM data. Photogramm. Eng. Remote Sens. 2000, 66, 1461–1468. [Google Scholar]
- Haas, E.M.; Bartholomé, E.; Lambin, E.F.; Vanacker, V. Remotely sensed surface water extent as an indicator of short-term changes in ecohydrological processes in sub-saharan western Africa. Remote Sens. Environ. 2011, 115, 3436–3445. [Google Scholar] [CrossRef]
- Verpoorter, C.; Kutser, T.; Tranvik, L. Automated mapping of water bodies using Landsat multispectral data. Limnol. Oceanogr. Methods 2012, 10, 1037–1050. [Google Scholar] [CrossRef]
- Steele, M.K.; Heffernan, J.B. Morphological characteristics of urban water bodies: Mechanisms of change and implications for ecosystem function. Ecol. Appl. 2014, 24, 1070–1084. [Google Scholar] [CrossRef] [PubMed]
- Sawaya, K. Extending satellite remote sensing to local scales: Land and water resource monitoring using high-resolution imagery. Remote Sens. Environ. 2003, 88, 144–156. [Google Scholar] [CrossRef]
- Kingsford, R.; Wales, N.S. GIS Database for Wetlands of the Murray-Darling Basin; Murray-Darling Basin Commission: Sydney, Australia, 1997. [Google Scholar]
- Olmanson, L.G.; Bauer, M.E.; Brezonik, P.L. A 20-year Landsat water clarity census of Minnesota’s 10,000 lakes. Remote Sens. Environ. 2008, 112, 4086–4097. [Google Scholar] [CrossRef]
- Rogers, A.; Kearney, M. Reducing signature variability in unmixing coastal marsh thematic mapper scenes using spectral indices. Int. J. Remote Sens. 2004, 25, 2317–2335. [Google Scholar] [CrossRef]
- Jain, S.K.; Singh, R.; Jain, M.; Lohani, A. Delineation of flood-prone areas using remote sensing techniques. Water Res. Manag. 2005, 19, 333–347. [Google Scholar] [CrossRef]
- Sun, F.; Sun, W.; Chen, J.; Gong, P. Comparison and improvement of methods for identifying waterbodies in remotely sensed imagery. Int. J. Remote Sens. 2012, 33, 6854–6875. [Google Scholar] [CrossRef]
- McFeeters, S. The use of the Normalized Difference Water Index (NDWI) in the delineation of open water features. Int. J. Remote Sens. 1996, 17, 1425–1432. [Google Scholar] [CrossRef]
- Xu, H. Modification of Normalized Difference Water Index (NDWI) to enhance open water features in remotely sensed imagery. Int. J. Remote Sens. 2006, 27, 3025–3033. [Google Scholar] [CrossRef]
- Jiang, H.; Feng, M.; Zhu, Y.; Lu, N.; Huang, J.; Xiao, T. An automated method for extracting rivers and lakes from Landsat imagery. Remote Sens. 2014, 6, 5067–5089. [Google Scholar]
- Li, J.; Sheng, Y. An automated scheme for glacial lake dynamics mapping using Landsat imagery and digital elevation models: A case study in the Himalayas. Int. J. Remote Sens. 2012, 33, 5194–5213. [Google Scholar] [CrossRef]
- Fisher, A.; Danaher, T. A water index for spot 5 HRG satellite imagery, New South Wales, Australia, determined by linear discriminant analysis. Remote Sens. 2013, 5, 5907–5925. [Google Scholar] [CrossRef]
- Dare, P.M. Shadow analysis in high-resolution satellite imagery of urban areas. Photogramm. Eng. Remote Sens. 2005, 71, 169–177. [Google Scholar] [CrossRef]
- Li, Y.; Gong, P.; Sasagawa, T. Integrated shadow removal based on photogrammetry and image analysis. Int. J. Remote Sens. 2005, 26, 3911–3929. [Google Scholar] [CrossRef]
- Zhou, W.; Huang, G.; Troy, A.; Cadenasso, M.L. Object-based land cover classification of shaded areas in high spatial resolution imagery of urban areas: A comparison study. Remote Sens. Environ. 2009, 113, 1769–1777. [Google Scholar] [CrossRef]
- Tigges, J.; Lakes, T.; Hostert, P. Urban vegetation classification: Benefits of multitemporal rapideye satellite data. Remote Sens. Environ. 2013, 136, 66–75. [Google Scholar] [CrossRef]
- Brown, M.; Gunn, S.R.; Lewis, H.G. Support vector machines for optimal classification and spectral unmixing. Ecol. Model. 1999, 120, 167–179. [Google Scholar] [CrossRef]
- Fensholt, R.; Sandholt, I.; Stisen, S. Evaluating MODIS, MERIS, and VEGETATION vegetation indices using in situ measurements in a semiarid environment. IEEE Trans. Geosci. Remote Sens. 2006, 44, 1774–1786. [Google Scholar] [CrossRef]
- Mountrakis, G.; Im, J.; Ogole, C. Support vector machines in remote sensing: A review. ISPRS J. Photogramm. Remote Sens. 2011, 66, 247–259. [Google Scholar] [CrossRef]
- Foody, G.M.; Mathur, A. The use of small training sets containing mixed pixels for accurate hard image classification: Training on mixed spectral responses for classification by a SVM. Remote Sens. Environ. 2006, 103, 179–189. [Google Scholar] [CrossRef]
- van der Linden, S.; Waske, B.; Eiden, M.; Hostert, P.; Janz, A. Classifying segmented hyperspectral data from a heterogeneous urban environment using support vector machines. J. Appl. Remote Sens. 2007, 1. [Google Scholar] [CrossRef]
- Cao, X.; Chen, J.; Imura, H.; Higashi, O. A SVM-based method to extract urban areas from DMSP-OLS and SPOT VGT data. Remote Sens. Environ. 2009, 113, 2205–2209. [Google Scholar] [CrossRef]
- Kaufman, Y.J.; Remer, L. Detection of forests using mid-IR reflectance: An application for aerosol studies. IEEE Trans. Geosci. Remote Sens. 1994, 32, 672–683. [Google Scholar] [CrossRef]
- Adeline, K.R.M.; Chen, M.; Briottet, X.; Pang, S.K.; Paparoditis, N. Shadow detection in very high spatial resolution aerial images: A comparative study. ISPRS J. Photogramm. Remote Sens. 2013, 80, 21–38. [Google Scholar] [CrossRef]
- Luo, J.; Sheng, Y.; Shen, Z.; Li, J.; Gao, L. Automatic and high-precise extraction for water information from multispectral images with the step-by-step iterative transformation mechanism. J. Remote Sens. 2009, 13, 604–615. [Google Scholar]
- Kavzoglu, T.; Colkesen, I. A kernel functions analysis for support vector machines for land cover classification. Int. J. Appl. Earth Obs. Geoinf. 2009, 11, 352–359. [Google Scholar] [CrossRef]
- Ji, L.; Zhang, L.; Wylie, B. Analysis of dynamic thresholds for the normalized difference water index. Photogramm. Eng. Remote Sens. 2009, 75, 1307–1317. [Google Scholar] [CrossRef]
© 2015 by the authors; licensee MDPI, Basel, Switzerland. This article is an open access article distributed under the terms and conditions of the Creative Commons Attribution license (http://creativecommons.org/licenses/by/4.0/).
