1. Introduction
Protected Areas (PAs) are essential for conserving biodiversity and are our main hope for meeting ambitious global conservation targets, such as preventing species extinctions [
1]. However, in order to sustain biodiversity, PA’s need to be managed as a coherent network rather than isolated habitat islands, particularly in the face of climate change [
2]. Isolation of natural areas, protected or non-protected, is the first step towards fragmentation of habitats, the destruction of ecosystems and consequent loss of biodiversity [
2].
PAs need to be assessed systematically according to biodiversity values and threats in order to support decision making and fund allocation processes [
3]. Characterizing PAs according to their species assemblages, ecosystem type, and threats posed to them is therefore crucial. While species-based conservation approaches are the most commonly used, assessment of natural habitats is also important. Among other ecosystem services, natural habitats offer refuge for species and can be mapped on a global scale in a harmonized way by means of remote sensing, which is less biased by sampling efforts related to study location or taxa [
4].
The Democratic Republic of Tanzania (hereafter “Tanzania”) ranks among the top five biologically rich countries in Africa [
5,
6]. The role and importance of the country’s biological diversity and richness—both from a conservation point of view and from a social and economic perspective—is highly recognized by the Tanzanian government, proven by the fact that, proportionately, Tanzania has one of the highest land surface areas devoted to resource conservation (28%) compared to other countries worldwide [
7]. However, this area under protection does not include the critically important wildlife corridors (here defined as an area with no legally protected status between two or more PA’s) which ensure animal movements and migration and help to maintain genetic variation among protected species. In fact, a 2009 assessment on wildlife corridors in Tanzania reported that the 31 major corridors in the country are under severe threat [
8]; a later assessment which focused on monitoring corridor functions confirmed the loss of some corridors [
9,
10,
11].
Urbanization, infrastructure development and agriculture practices are the main anthropogenic activities on the land and represent the main pressures on PAs and their connecting corridors. Population increased nearly exponentially in Tanzania in the last decades, increasing from around 12 million inhabitants in 1967 to 38 million in 2005 and 49 million in 2013 [
12]. In order to react to the increasing population needs and the competing human and ecosystem services, in 2011 the government of Tanzania developed a “Greenprint” for accelerating sustainable agricultural development in the SAGCOT (Southern Agricultural Growth Corridor of Tanzania) region. The defined area extends from the Indian Ocean to the Zambian border. This initiative incorporates the needs of smallholder farmers to embrace modern technologies and management systems in order to produce “Agriculture Green Growth” to sustainably intensify agriculture, while simultaneously conserving natural resources to reduce pressures on forest, water and biodiversity [
13].
The need to monitor the different habitats and the associated species diversity in and around PAs is an essential component of conservation and effective PA management, as it allows managers to identify and assess problems, prioritize and develop solutions and use resources effectively [
14]. Geospatial data and remote sensing images especially have been identified as key solutions for monitoring of sites since satellite data have the capability to capture information at various spatial, spectral, and temporal scales across extensive areas in an objective and repeatable manner. In particular, LULCC as assessed from remote sensing, is one of the most evident and detectable indicators of land surface characteristics. Monitoring LULCC over time provides important information on issues such as compliance with land management schemes, predicting threats to biodiversity and PAs from shifting human population distribution and changes in agricultural practices. Another benefit of remote sensing is its capacity to support quantification of possible fragmentation and loss of remaining habitats, and calculation of economic metrics such as carbon storage [
15].
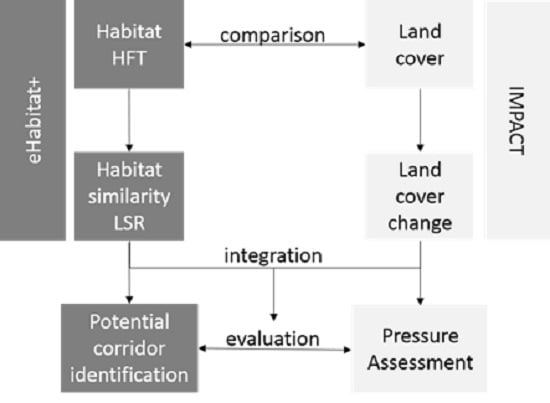
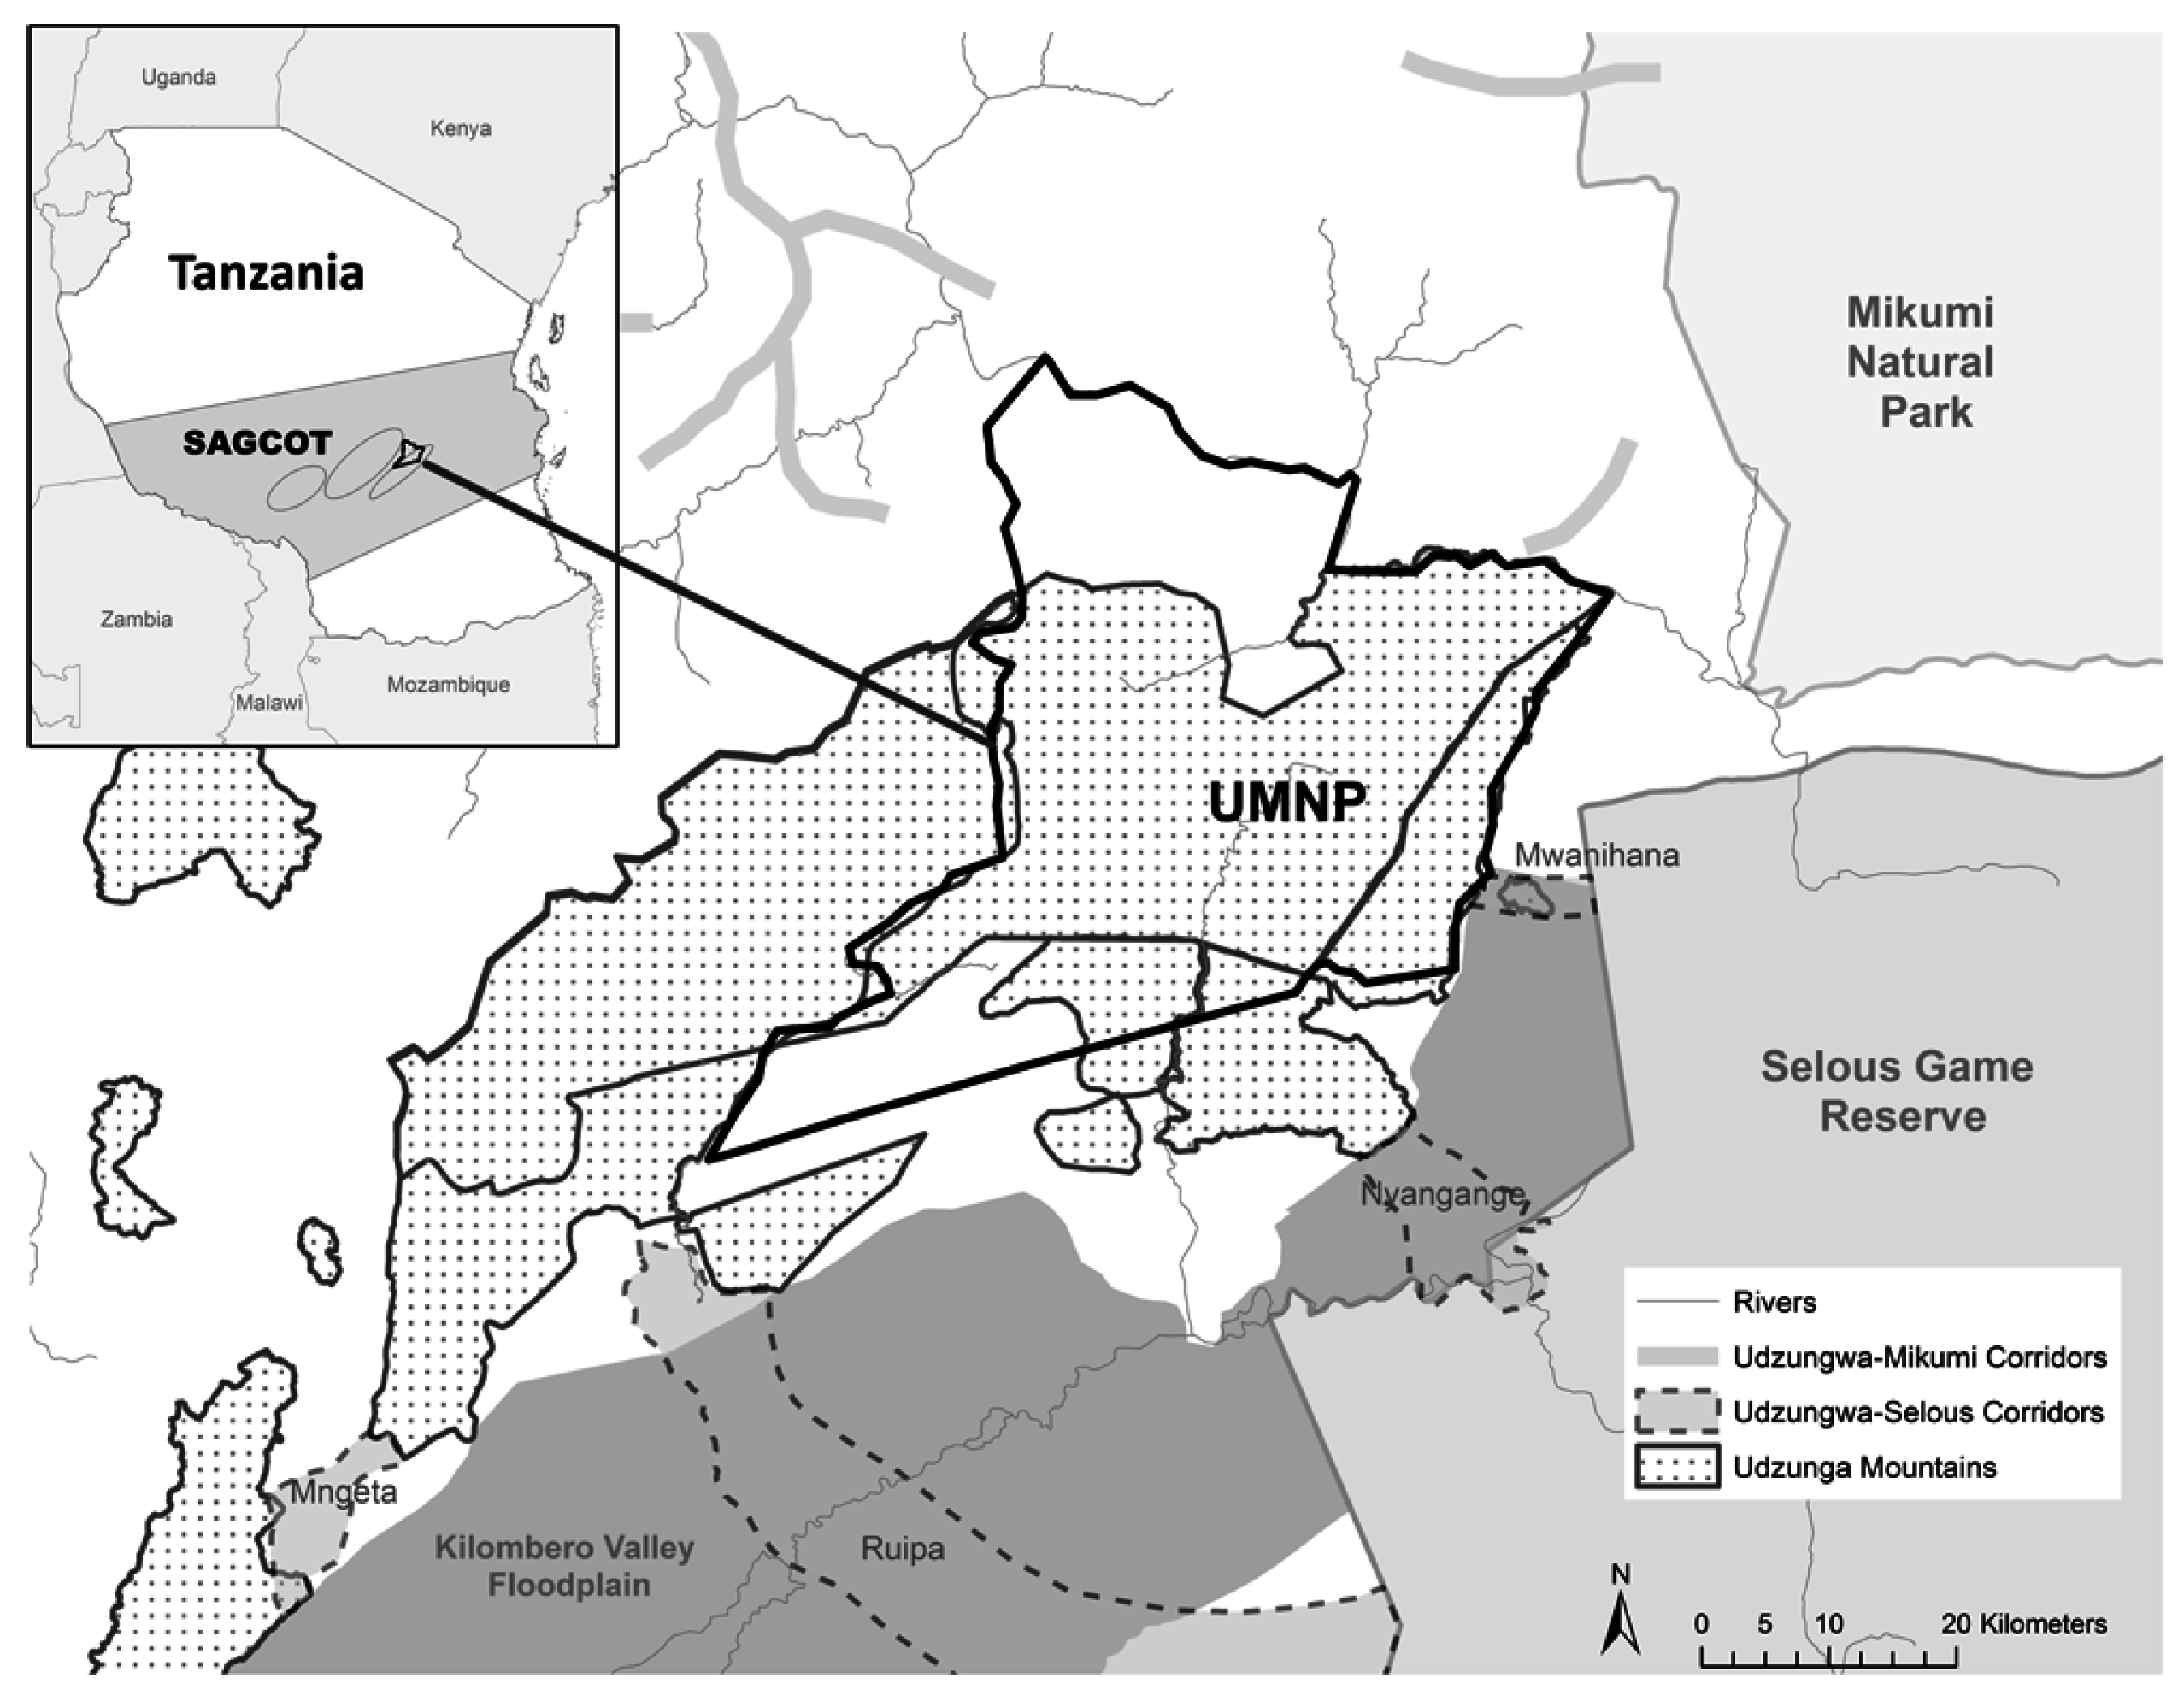
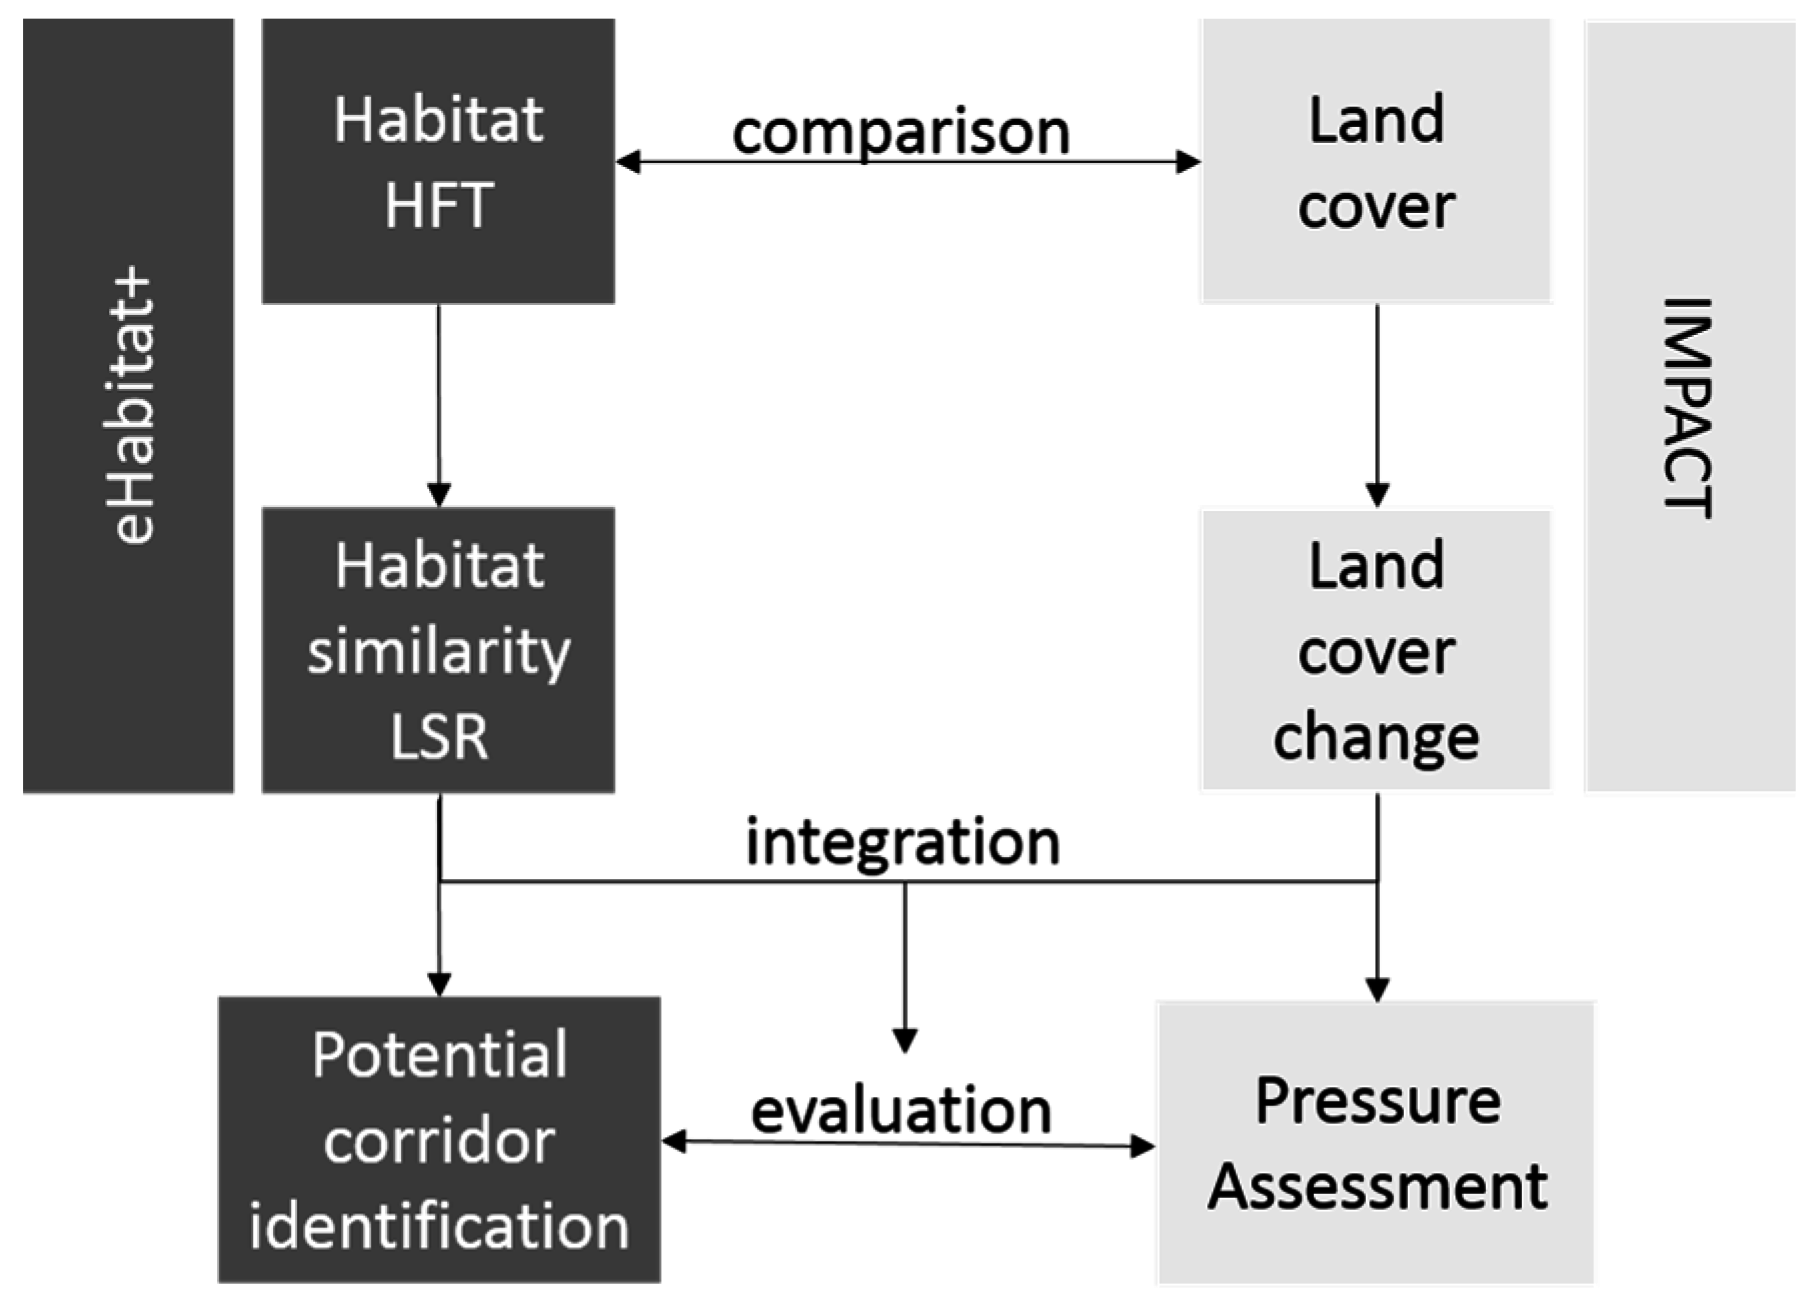
The aim of this paper is to study the potential impact of development projects such as the SAGCOT initiative on the Udzungwa Mountains National Park (UMNP) and its surrounding buffer zone (20 km) with particular attention to the wildlife corridors which connect the PA to other conservation areas [
16]. This was addressed in three ways: (1) application of an existing methodology to identify habitats and existing ecologically similar areas outside the UMNP, which are potentially useful for wildlife and their movements [
17,
18]; (2) assessment of the impact of human activities over time through land use/land cover (LULC) conversions inside the UMNP and especially in the surroundings, including non-protected areas and defined wildlife corridors through the analysis of satellite image time series [
19]; (3) integration of the habitat similarity maps with the LULCC data to detect anthropogenic pressure caused by agriculture and urbanization to existing corridors and potentially new corridors. The importance and uniqueness of this study lies in the combination of existing methods and tools to automatize the identification of habitats with potentially high biodiversity and the assessment of pressures to these. This was accomplished by combining datasets that measure human activities (i.e., urban uses, agricultural uses) and their impacts (i.e., deforestation, loss of natural vegetation) with ecological, climatic and geographic datasets. The integration of the presented methods for the specific case study in the UMNP can potentially be replicated over any PA in the world.
4. Discussion
The LULCC analysis shows that the interior of the UMNP has not suffered from relevant human activities during the study period. Some touristic activities have developed inside the park (e.g., trekking routes) but these do not show any major damage or threat to the conservation of the park and its biodiversity [
24]. The proximity of settlements surrounding PAs is often associated with timber cutting, pole cutting, fuel wood and wood harvesting and agriculture encroachment [
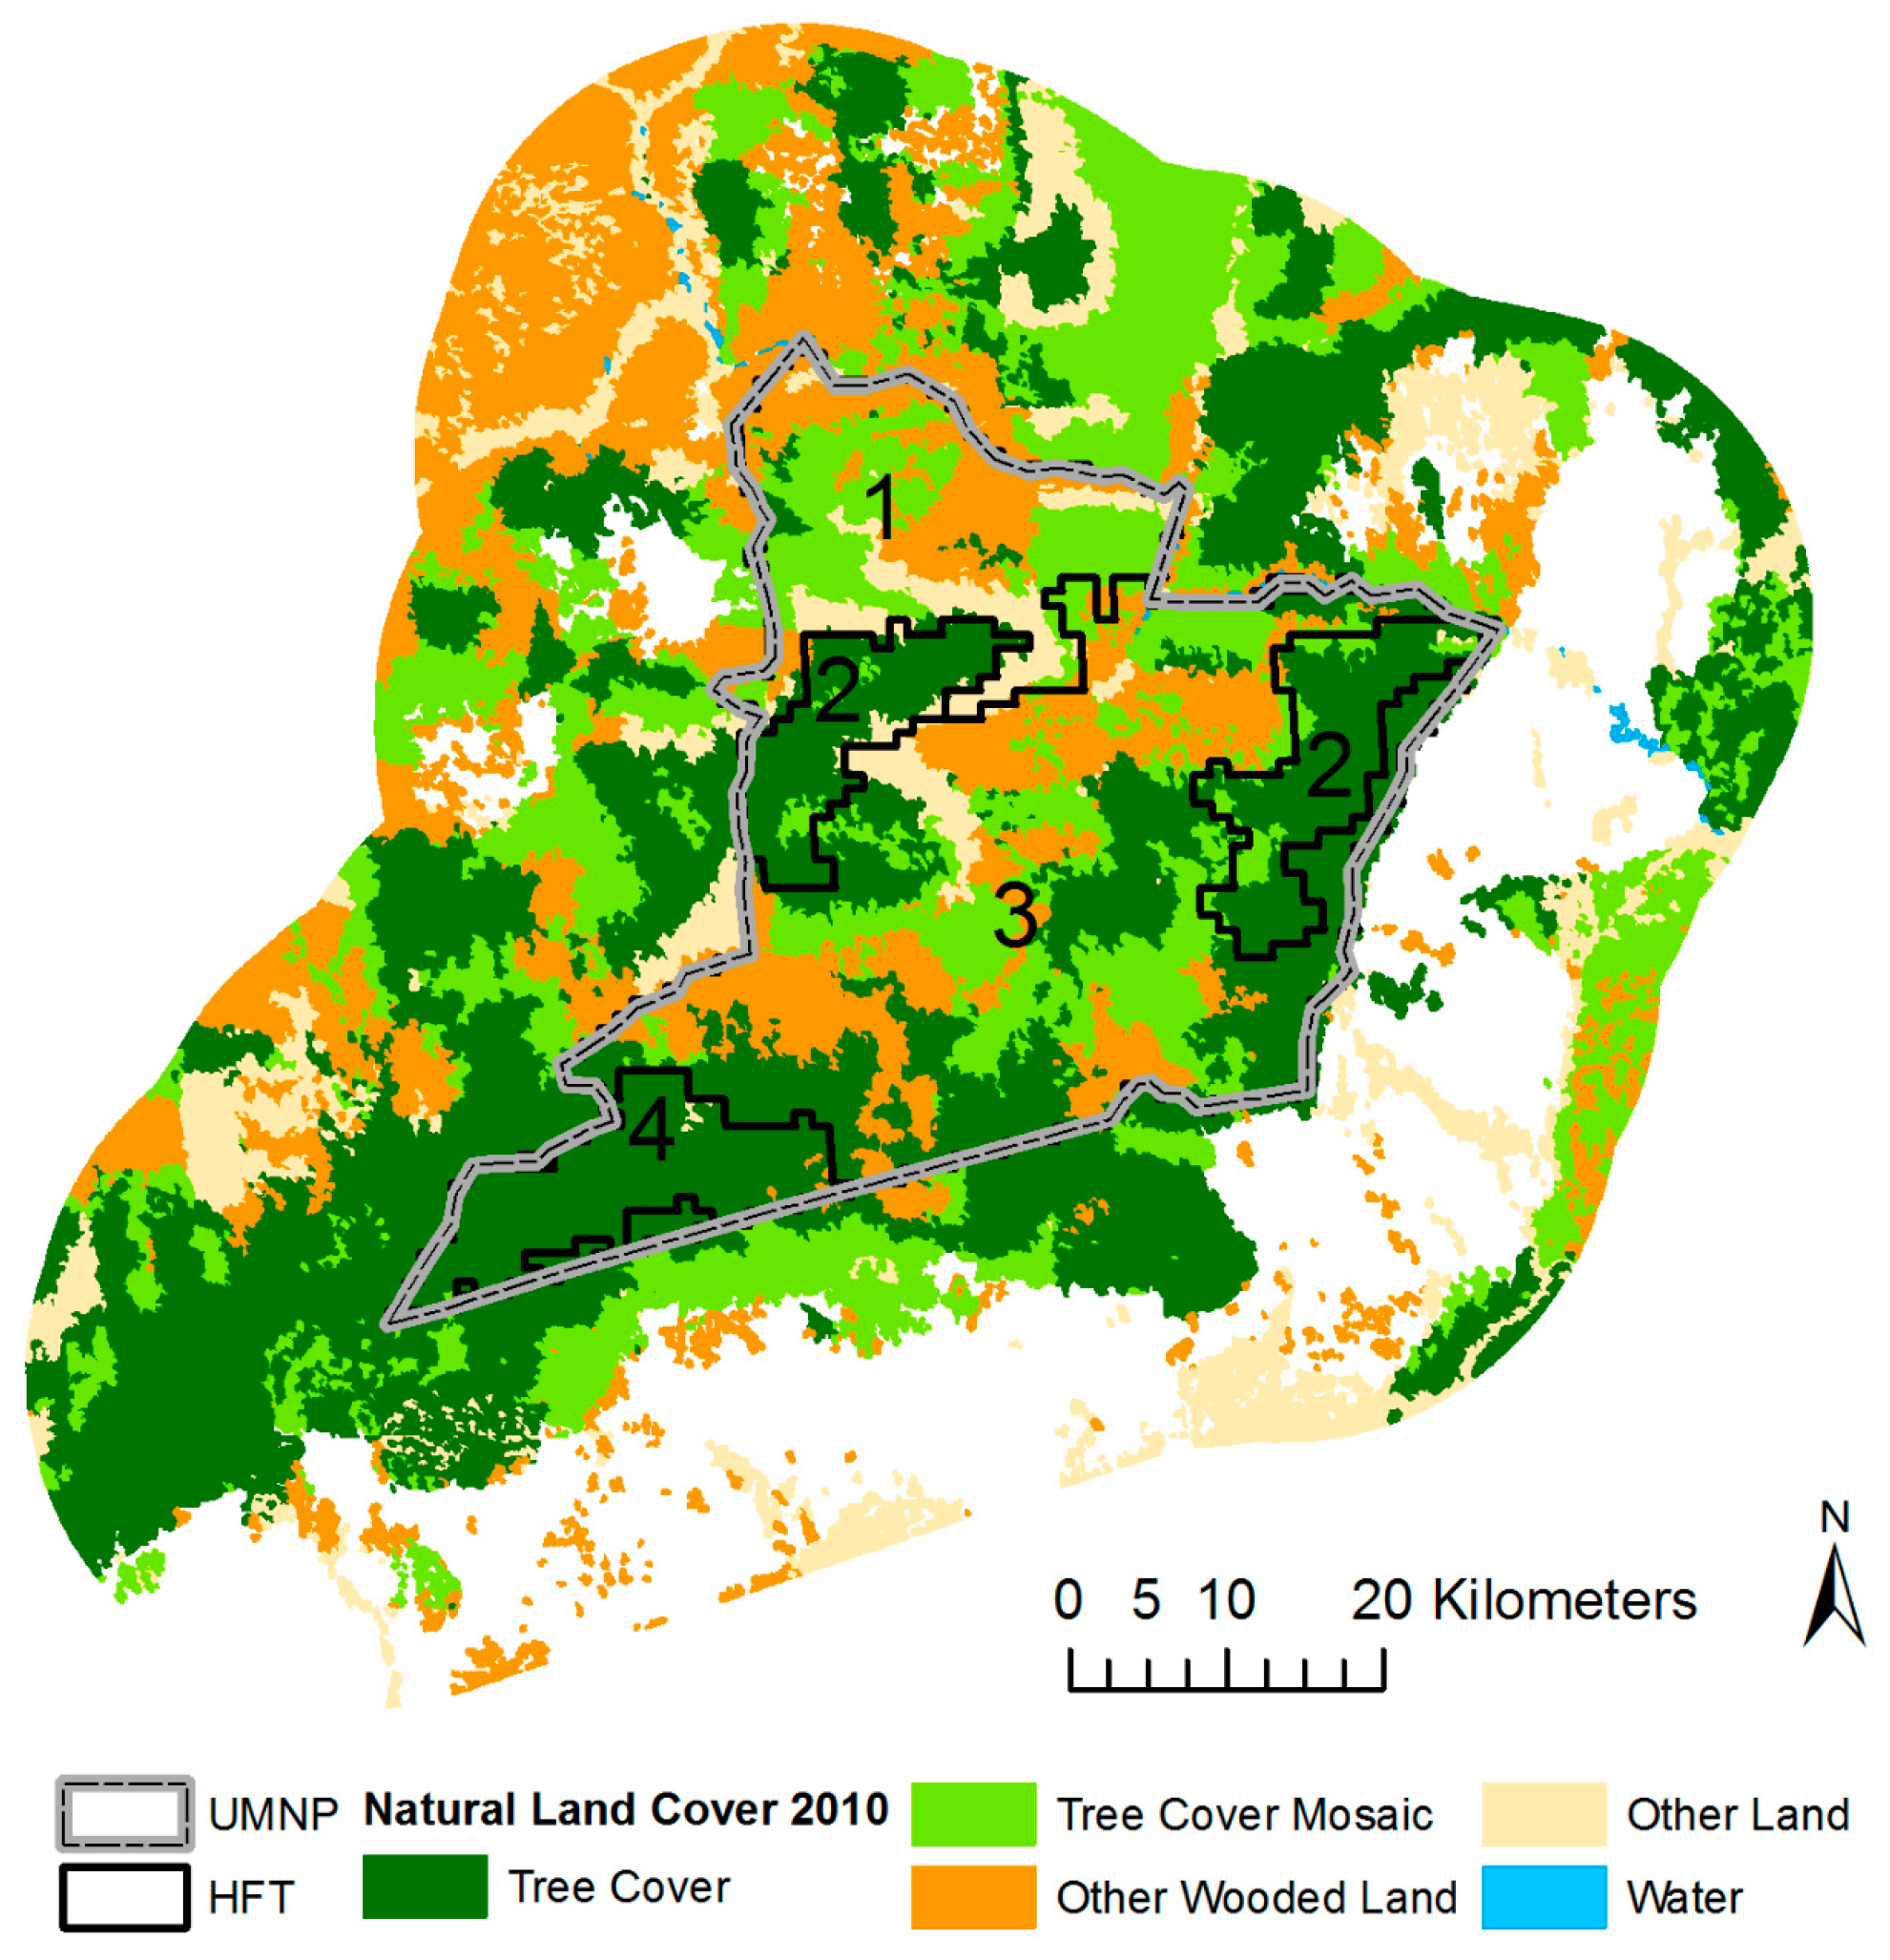
52] inside PAs. However this is not the case for the UMNP as no significant disturbance along the border of the PA has been detected by the proposed methodology. As shown, the natural vegetation which covers around 93% of the UMNP remained nearly stable at 1780 km
2. Fire occurs regularly in the central and northern parts of the park in the period between September till November [
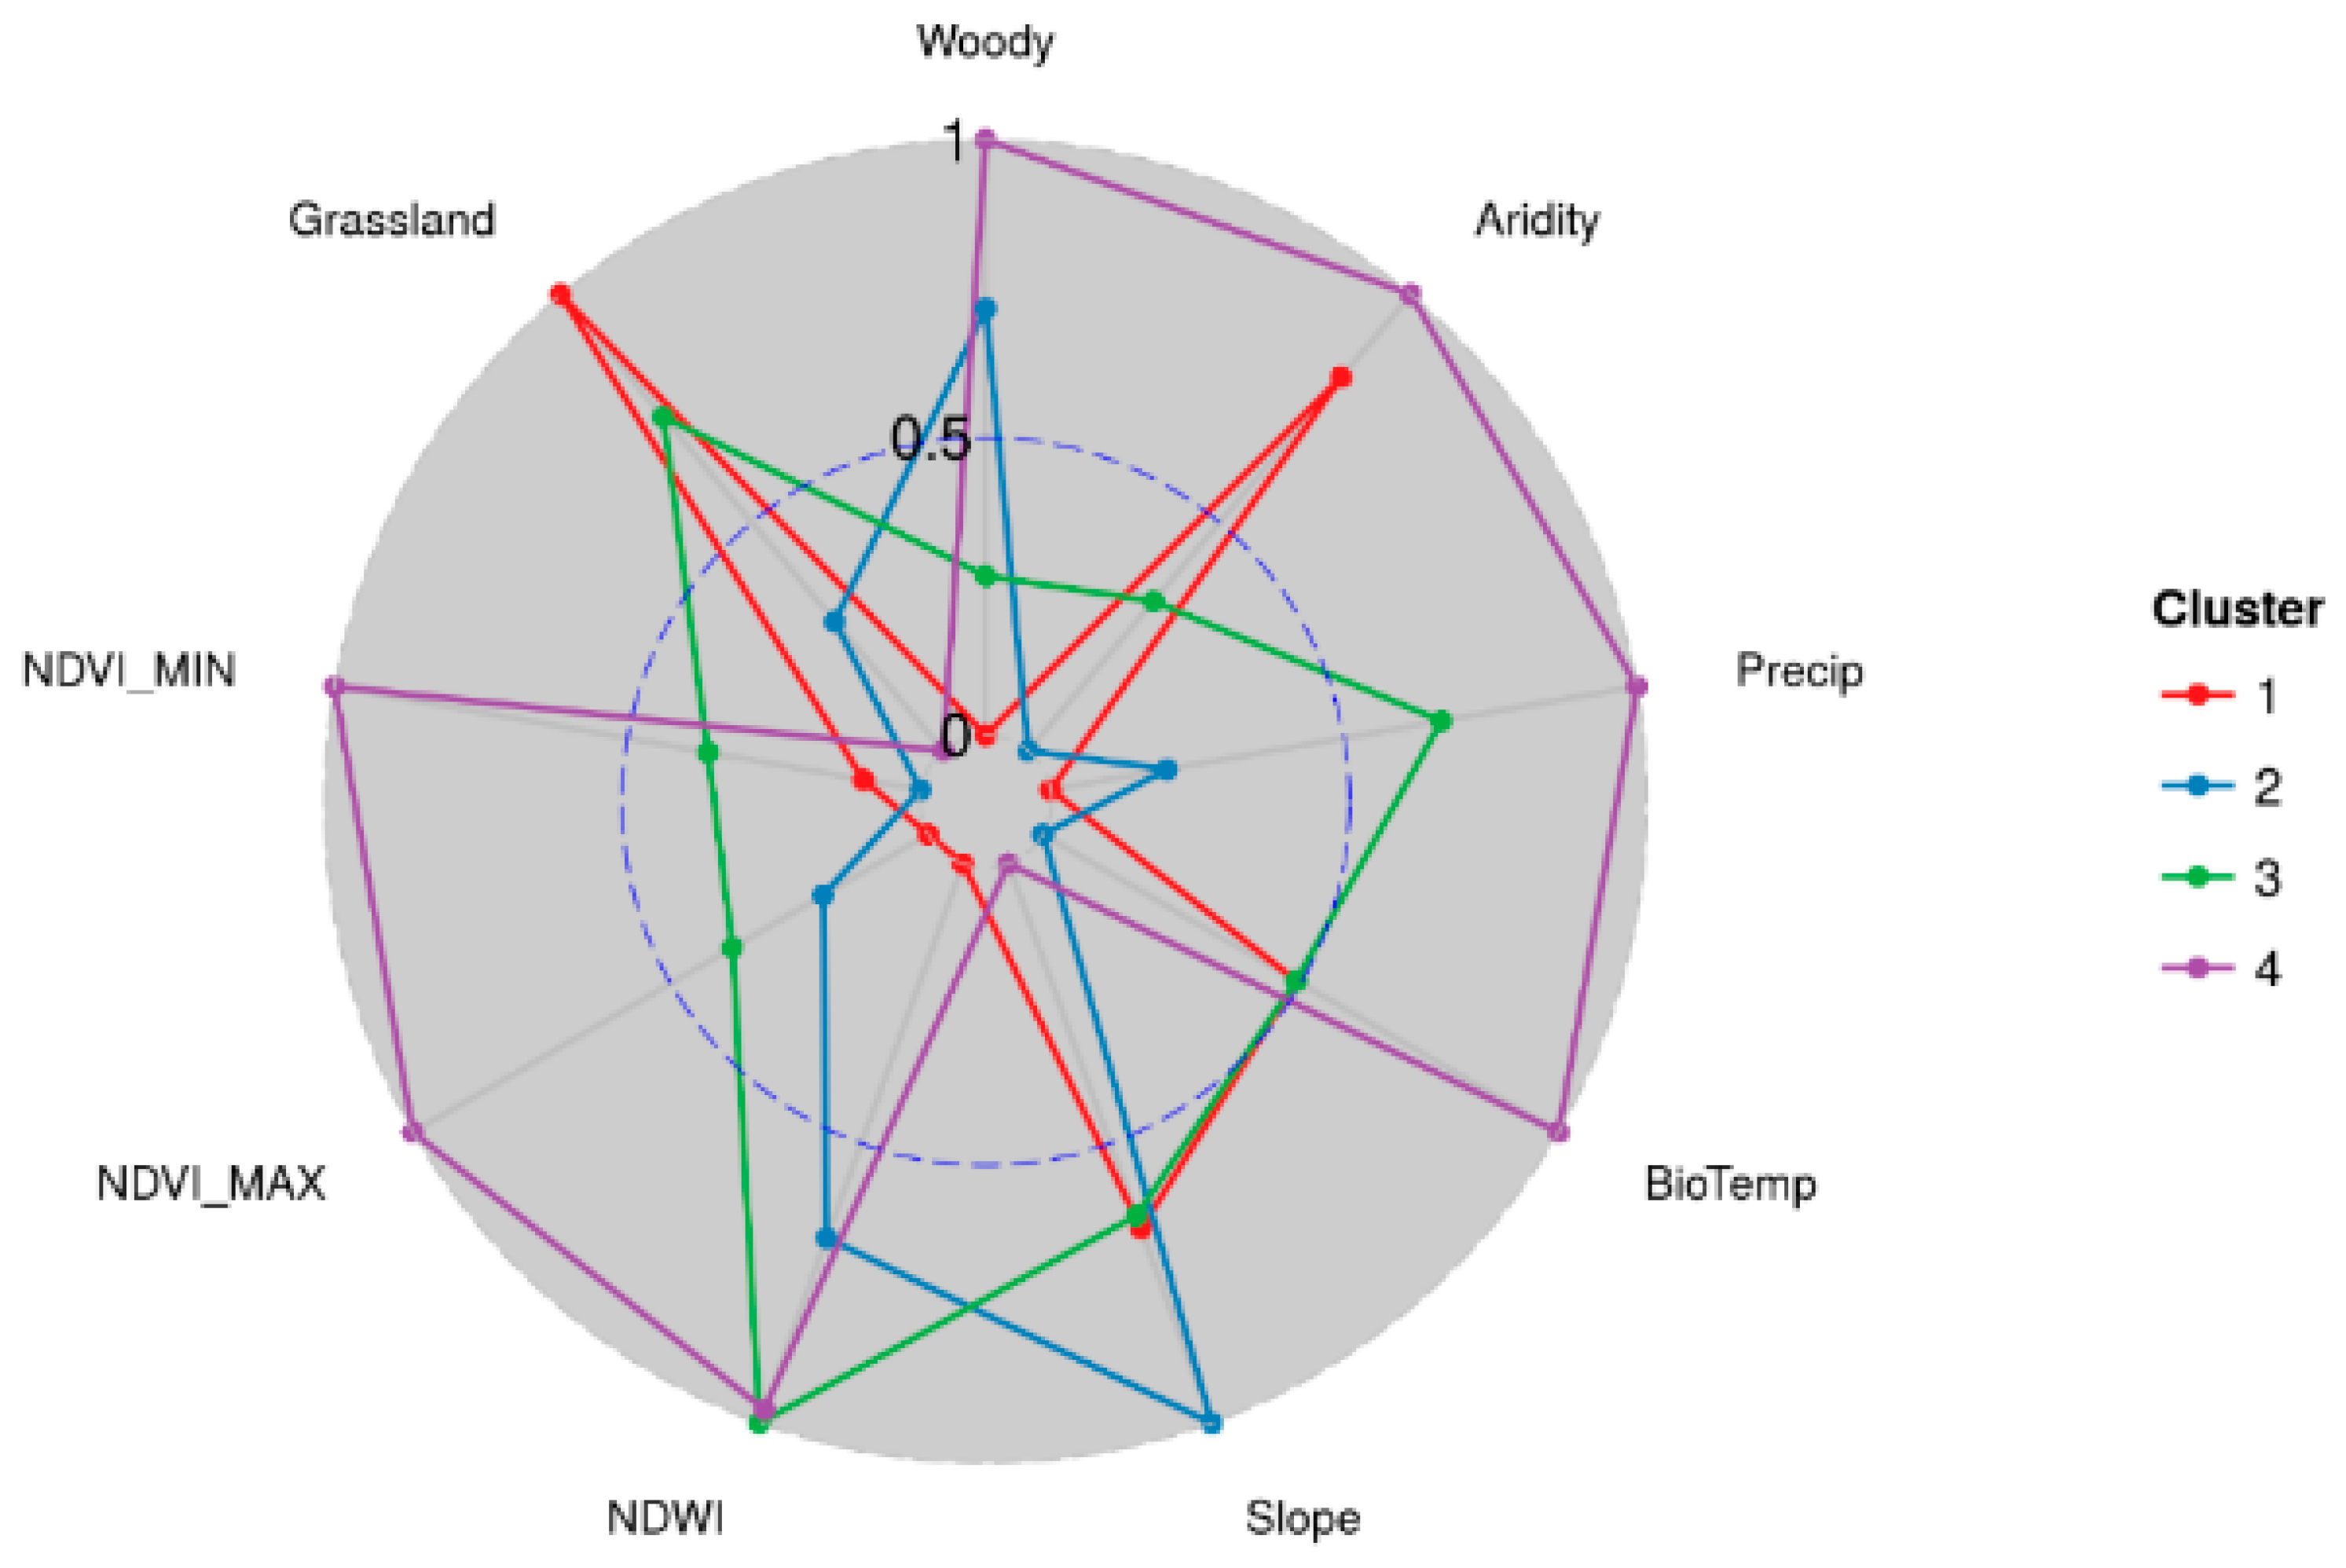
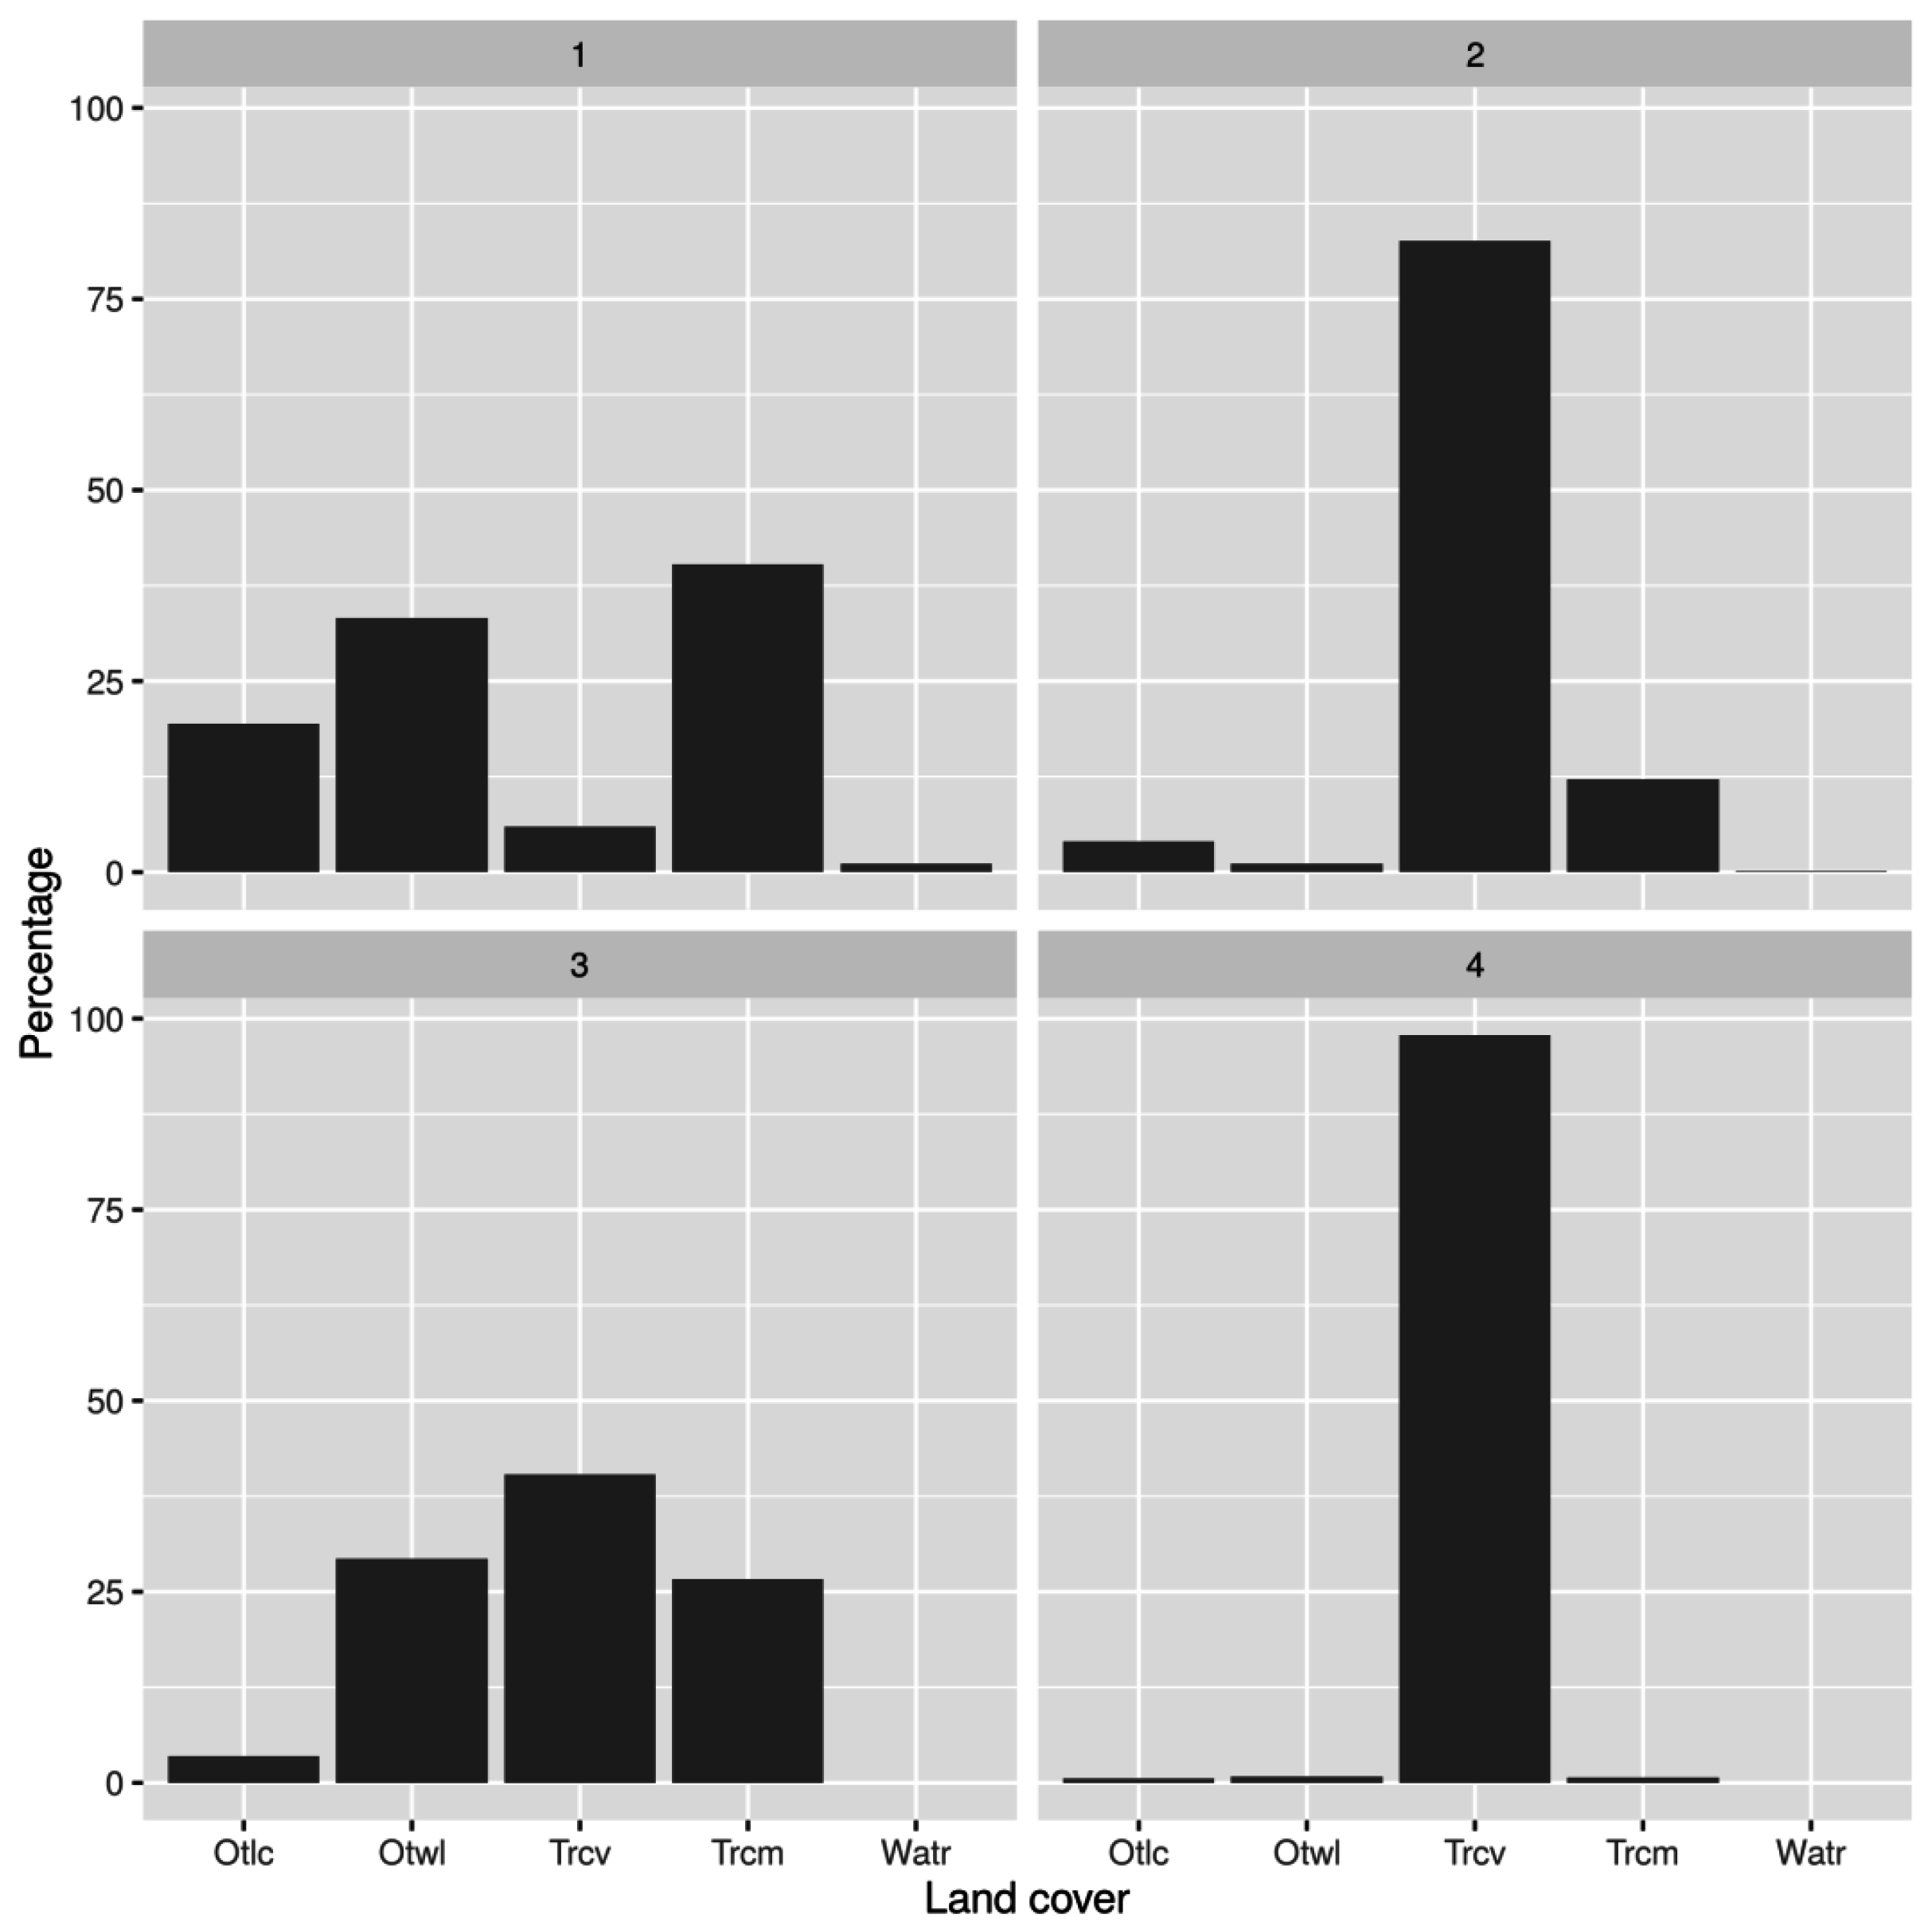
53]. These areas belong to the HFTs 1 and 3, which show a strong dominance of grass- and wood and shrublands. The regularity of these fire regimes, associated with no evident change or degradation of the natural vegetation cover, may lead to the assumption that these are prescribed fires to control and maintain the different habitats and the associated plant and animal species. Indeed, in many PAs fire is recognized as playing a key role in the well-being of the biological community (plants and animals) and is included in the park management plans to achieve conservation objectives [
54].
The mountainous topography makes this region less accessible for agriculture development, but presumably an effective park management is in place to protect the UMNP’s unique habitat and species, as described by WWF and TANAPA [
55,
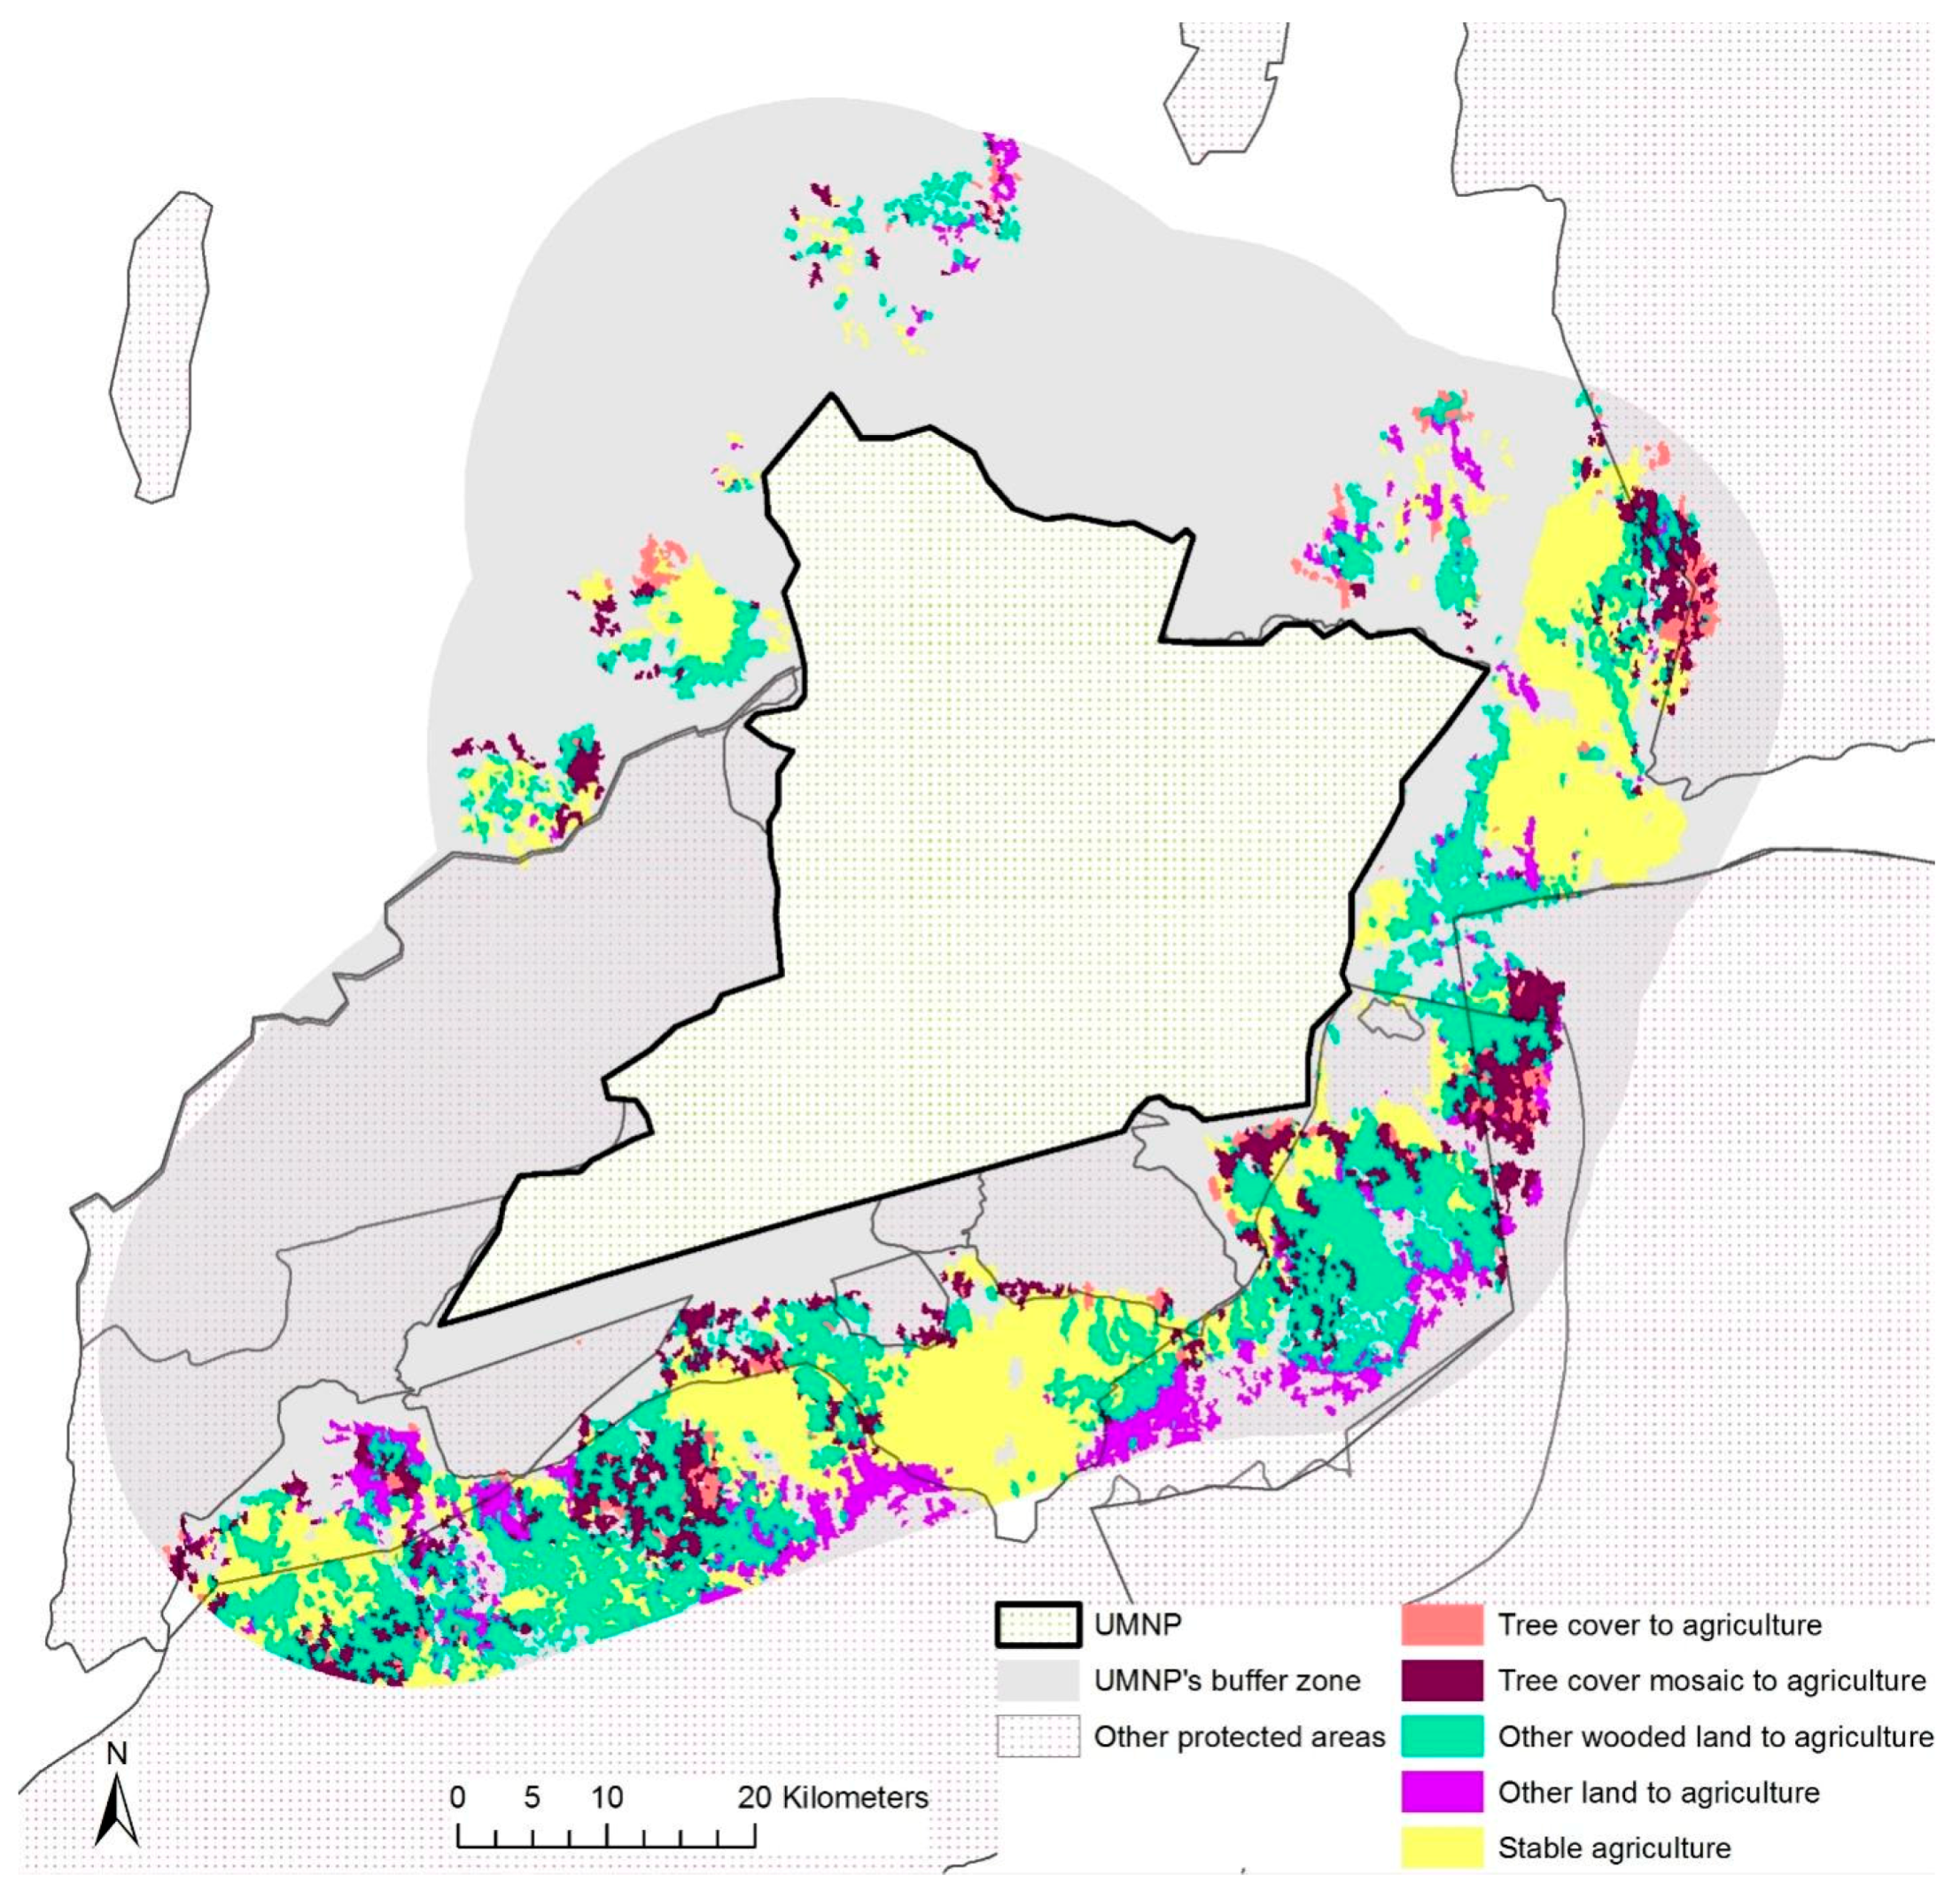
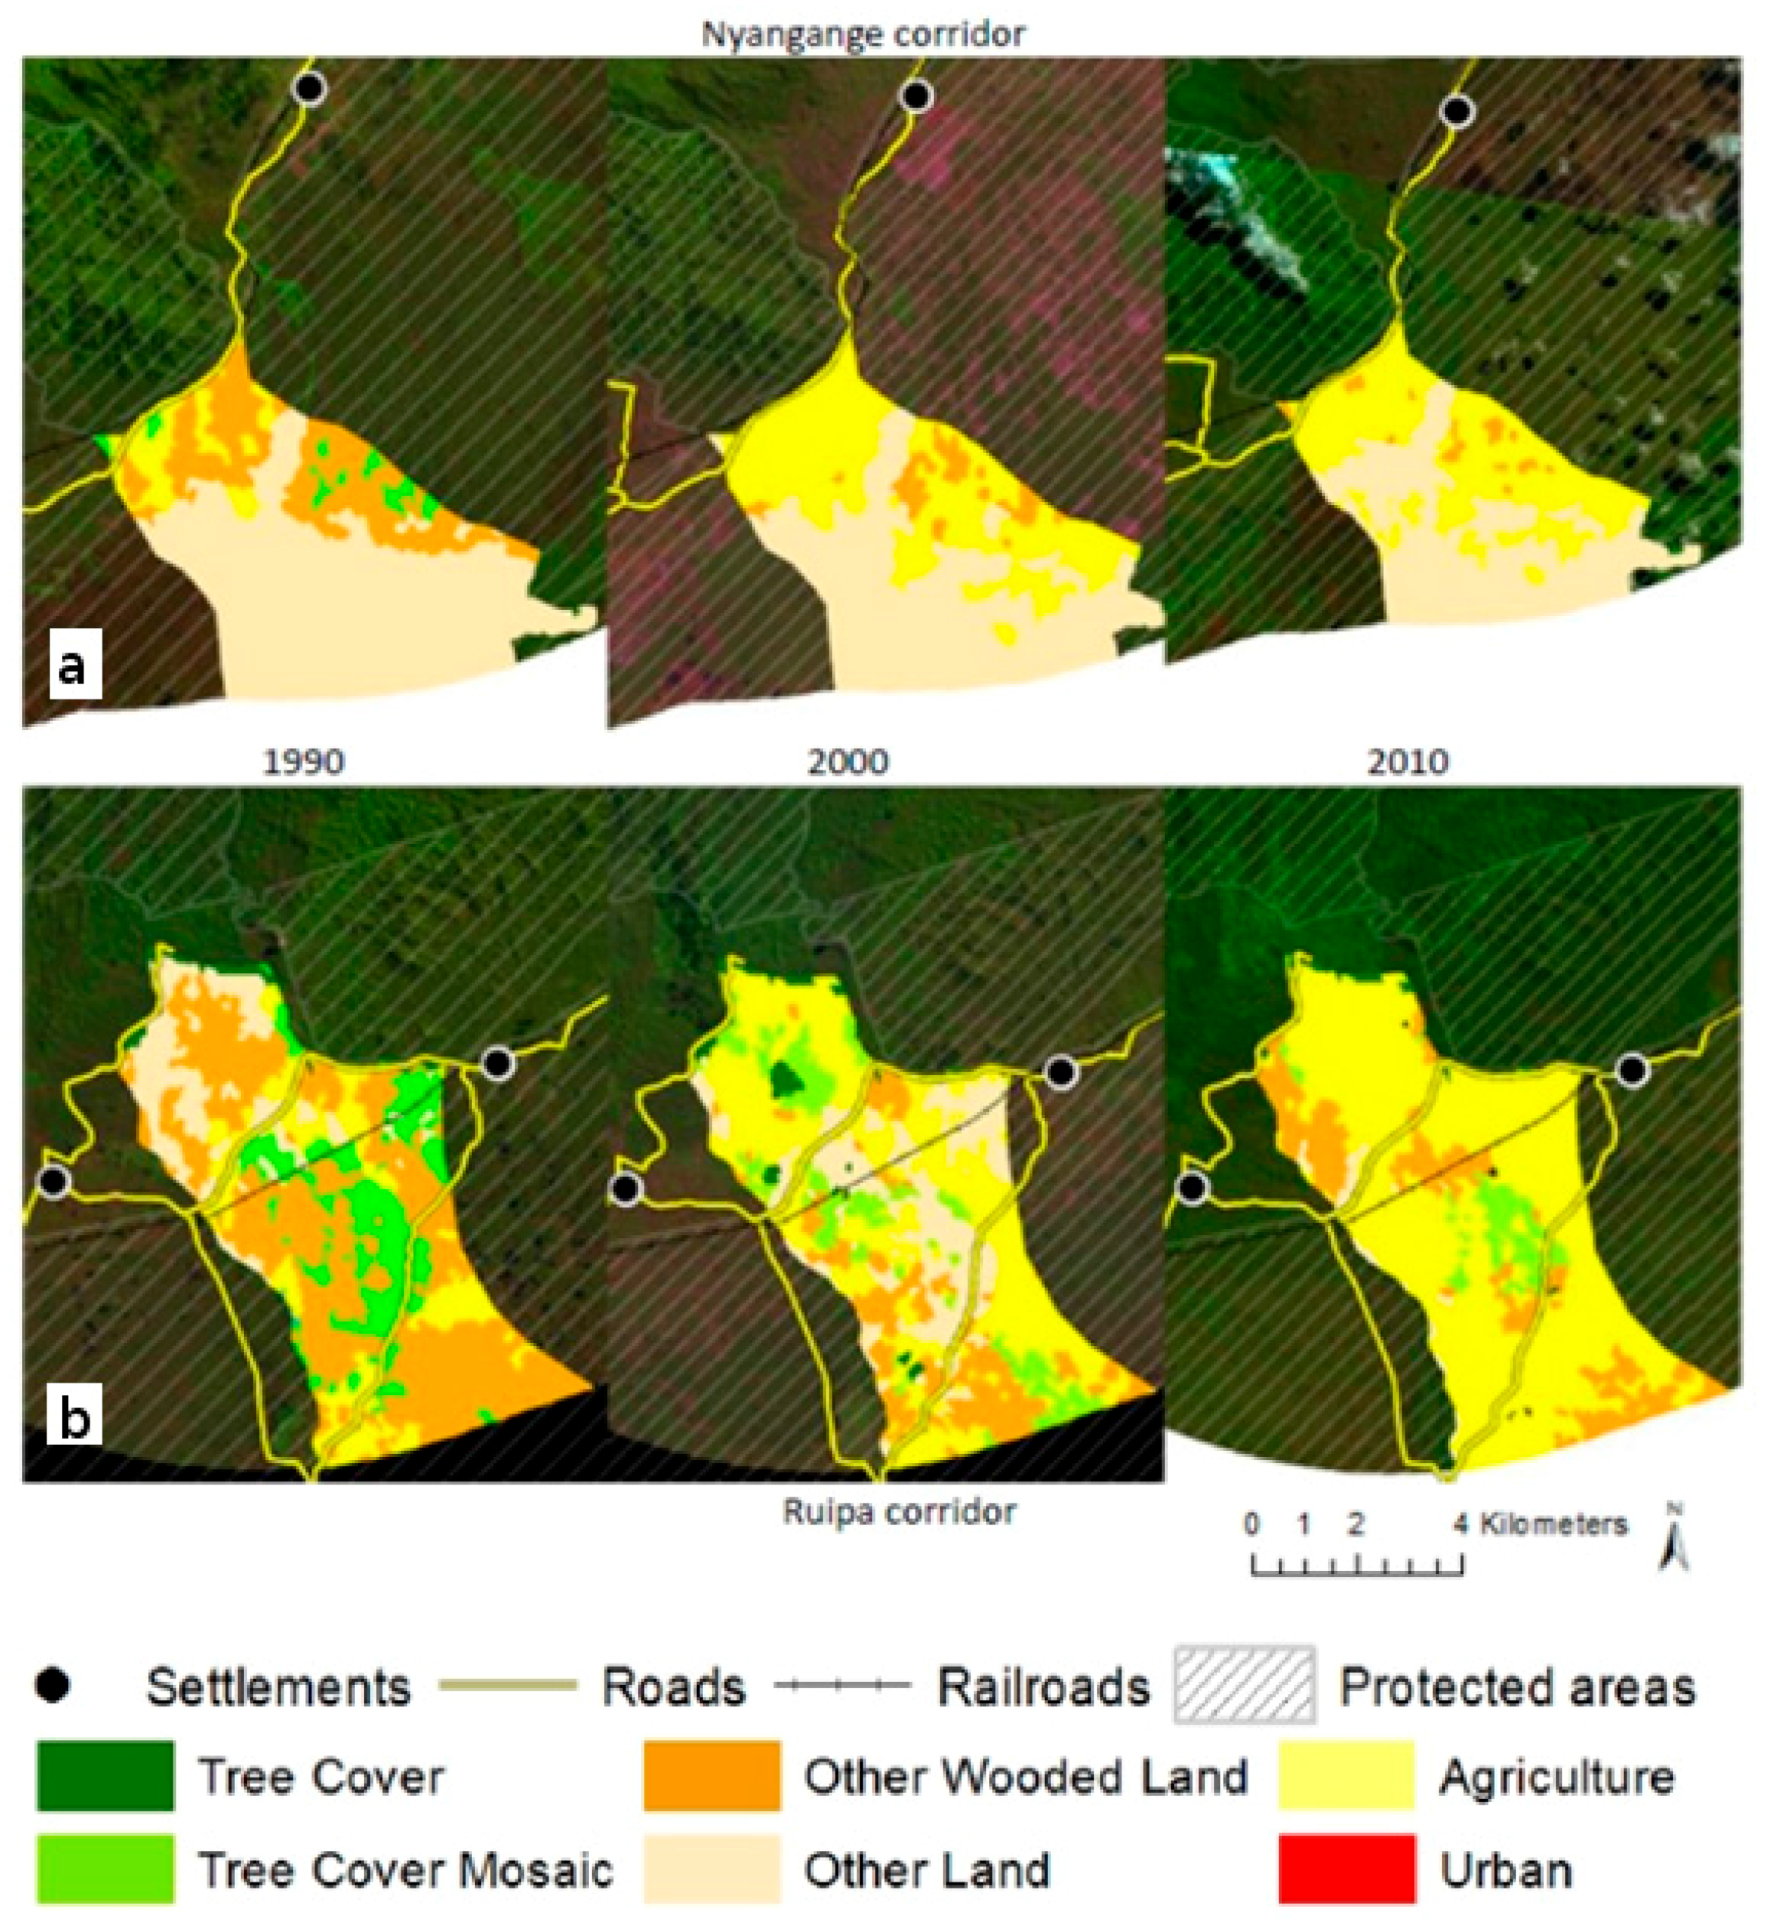
56]. However, in the surrounding areas, especially the areas included in the Kilombero Valley Floodplain, where the Udzungwa-Selous corridors (Ruipa and Mwanihana corridors) are located, anthropogenic impact has been strong. Population increase, followed by urban and infrastructure development and a massive agriculture expansion as demonstrated by the analysis, has put severe pressure on the park and the connecting corridors (interesting to note is that the majority of this area is designated as RAMSAR site). In total around 1091 km
2 of natural vegetation was converted to agriculture and other anthropogenic land uses in the 20 km buffer zone over the analyzed 20 year time frame, removing a large proportion of the natural vegetation in the above mentioned corridors. In fact, previous studies demonstrate that the Udzungwa-Selous corridors are currently closed—in particular for elephants [
57]. The HFT 3 map presented in
Figure 7 confirms this, clearly showing a similar habitat towards the Selous Game Reserve which however is not connected anymore to the UMNP due to the above illustrated land cover changes. Jones, et al. (2012) noted that increased farming and livestock keeping, associated with both local immigration and population growth, were the main reasons for these corridor blockage and closure. However, the authors highlight also the fact that continued attempts by elephants to cross the blocked routes suggest that connectivity can be restored.
Here the analysis of the HFTs and the similarity maps confirmed on the one hand the importance of these corridors for wildlife movements and their uniqueness based on the similarity maps. On the other hand, the similarity maps detected other potential corridors for wildlife as well. The 4 HFTs identified showed that several areas were similar according to their biophysical variables, thus identifying other habitats with suitable characteristics for hosting migrating wildlife such as elephants and which could act as potential corridors. The LULCC analysis showed whether these suitable identified areas are affected by land cover change. This is critical since in particular patterns of agricultural expansion with a consequent loss of natural areas often create “hard edges which inhibits many organisms from readily moving across the edge” [
58]. The integration of the LULC map with the HFTs provides a comprehensive habitat map of the type that is regularly requested by the conservation community [
59]. LULC associated to bio-physical variables such as vegetation indices, altitude, slope and climatic data delivers the type of information required for the classification and delineation of habitats, which can then be related to specific species and communities.
The importance in maintaining connectivity between PAs has been recognized as a vital element of overall animal population persistence [
60,
61]. The African continent has suffered from a severe loss and fragmentation of natural vegetation over the last 20 years [
62] with a consequent decline of natural habitats and increased and unprecedented threat to wildlife [
63]. In this context, the role of African PAs in maintaining connectivity in a network is critical. At a continental scale Wegmann, et al. (2016) [
64] explain how ecological spatial modelling can be combined with large-scale remote sensing data to investigate land cover changes and their impact on ecological processes and species conservation. In this case, the low resolution Advanced Very High-Resolution Radiometer (AVHRR) Normalized Difference Vegetation Index (NDVI) was used as an indicator for land cover dynamics (i.e., functional properties). Unlike the work presented here, the Wegmann study explicitly models animal movement by simulating steps based on dispersal and perceptual distance for a selected group of species across a landscape. This approach helps to identify the importance of particular pixels and PAs in maintaining connectivity in a landscape, but, because of the continental scale of the analysis, larger pixels (10 km as opposed to 30 m) are used to identify vegetation change, so that patterns and disturbances at a rather different scale are being identified. A key difference between the approaches is that the Wegmann study indirectly uses multivariate data to model habitat suitability for selected species (because it uses data from the Rondinini et al. (2011) [
65] analysis which combines LULC from the Globcover product [
66], elevation and hydrological features) while eHabitat, in contrast, models and maps the similarity between functional habitat types themselves, using a wider range of biophysical variables including climate and evapotranspiration. In future work, the movement simulation approach used in the Wegmann study could valuably be combined with the finer-scale LULCC change information and similarity maps produced in our study.
A valuable summary and review paper highlighting the remote sensing advantages and capabilities for biodiversity monitoring is provided by Petrou, et al. (2015) [
67]. The authors present the Aichi targets and the related CBD indicators whose monitoring can be facilitated by remote sensing highlighting for each headline indicator a number of recent remote sensing approaches able for the extraction of related properties. Indeed the general framework of the study presented here could serve several Aichi targets such as target 5, 7, 10 and 11 in particular.
The consistent results of the HFT-LSR and LULCC analysis presented in this study show the usefulness of both methods for assessing and evaluating the territory in relation to the definition of areas of interest for wildlife movements, as well as the impact of human activities in these habitats. The integration of more recent satellite data to describe the actual habitats, but even more importantly to identify current LULCC, is a necessary next step to provide relevant information to decision makers. Indeed, the most recent images provided by Google Earth highlight the fact that the former existing Mngeta forest corridor between the UMNP and the Udzungwa Scarp Forest Reserve is now disrupted by agriculture activities. Field work is additionally required to confirm (or not) the value and nature of the remotely-identified similar habitats and potential corridors and to assess their intactness, presence or absence of human activities and animal movement. Regarding eHabitat+, further work is required to optimize the selection of the input variables and to better understand the links of the HFTs with the species composition in order to further extend its use for policy support.
The results serve as an example of how eHabitat+ allows for large-scale analyses of PAs using continent-wide consistent datasets for producing key landscape indicators, identifying unique ecological areas that are currently unprotected and allowing results to be easily compared at global level through the DOPA [
7,
17]. Moreover, the integrative analysis of these habitat data with accurate LULCC information as derived from the IMPACT toolbox, allows potential pressures on ecological high value areas to be highlighted and thus serves as an effective decision support instrument.
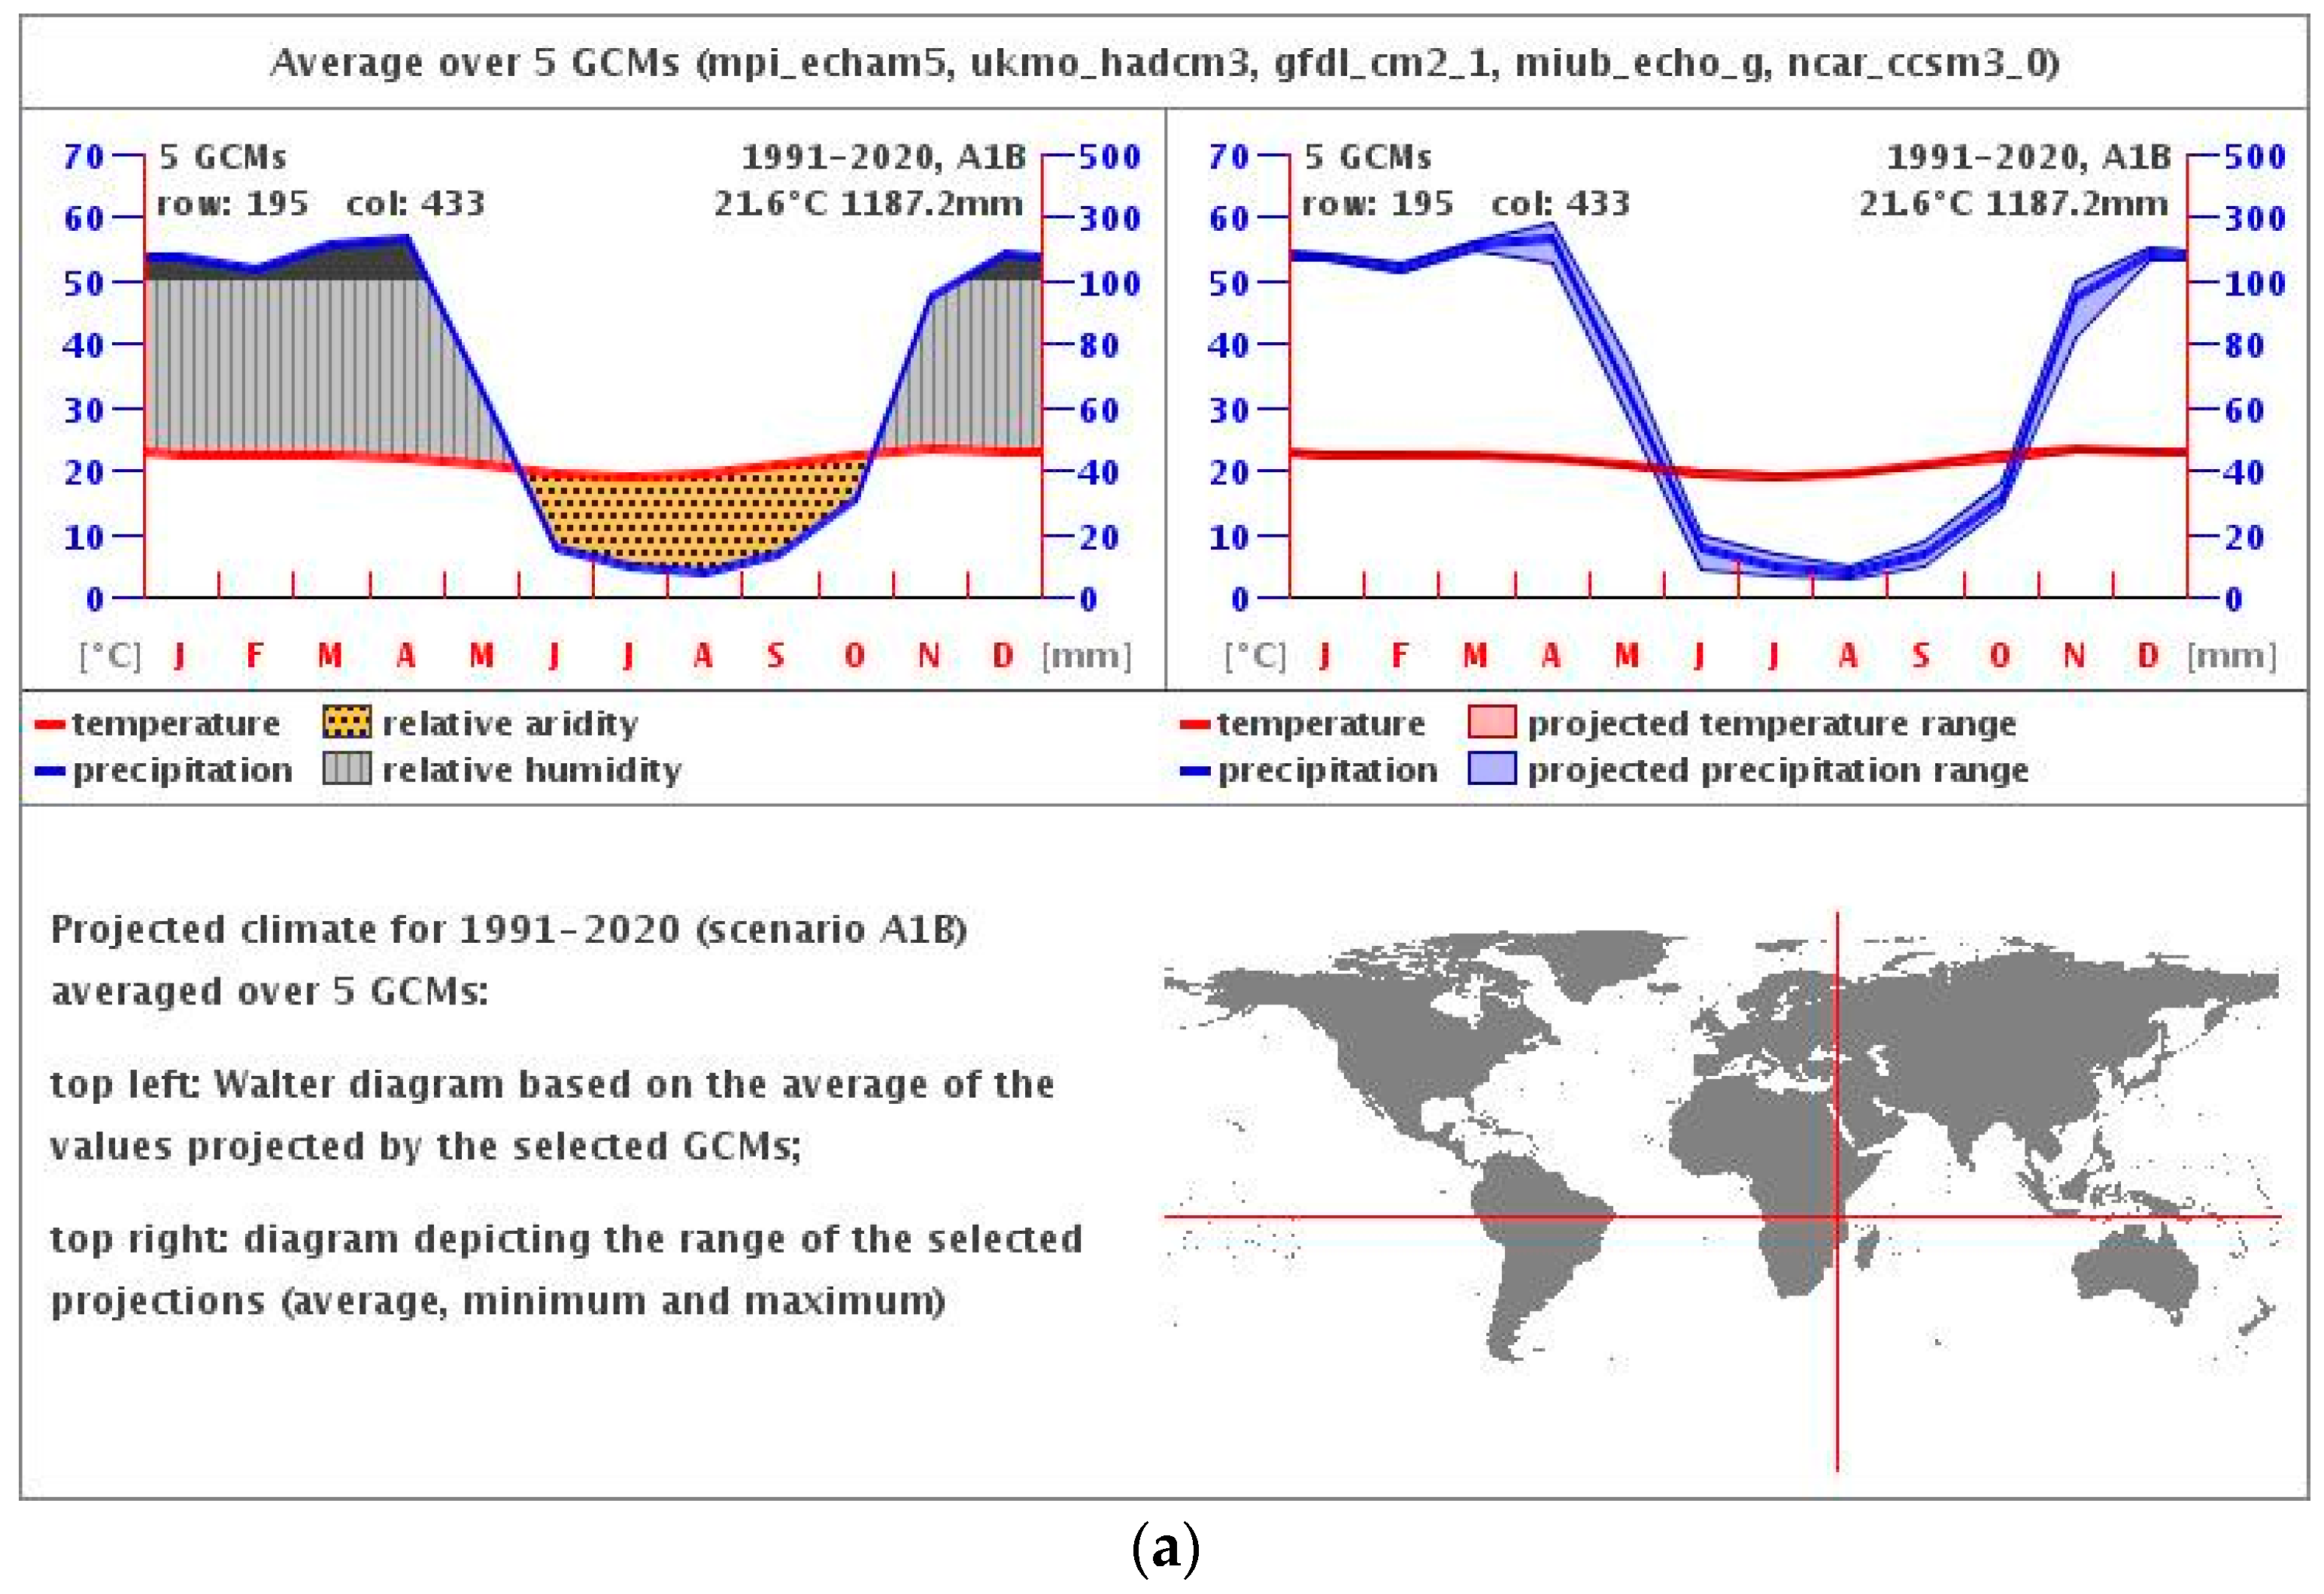
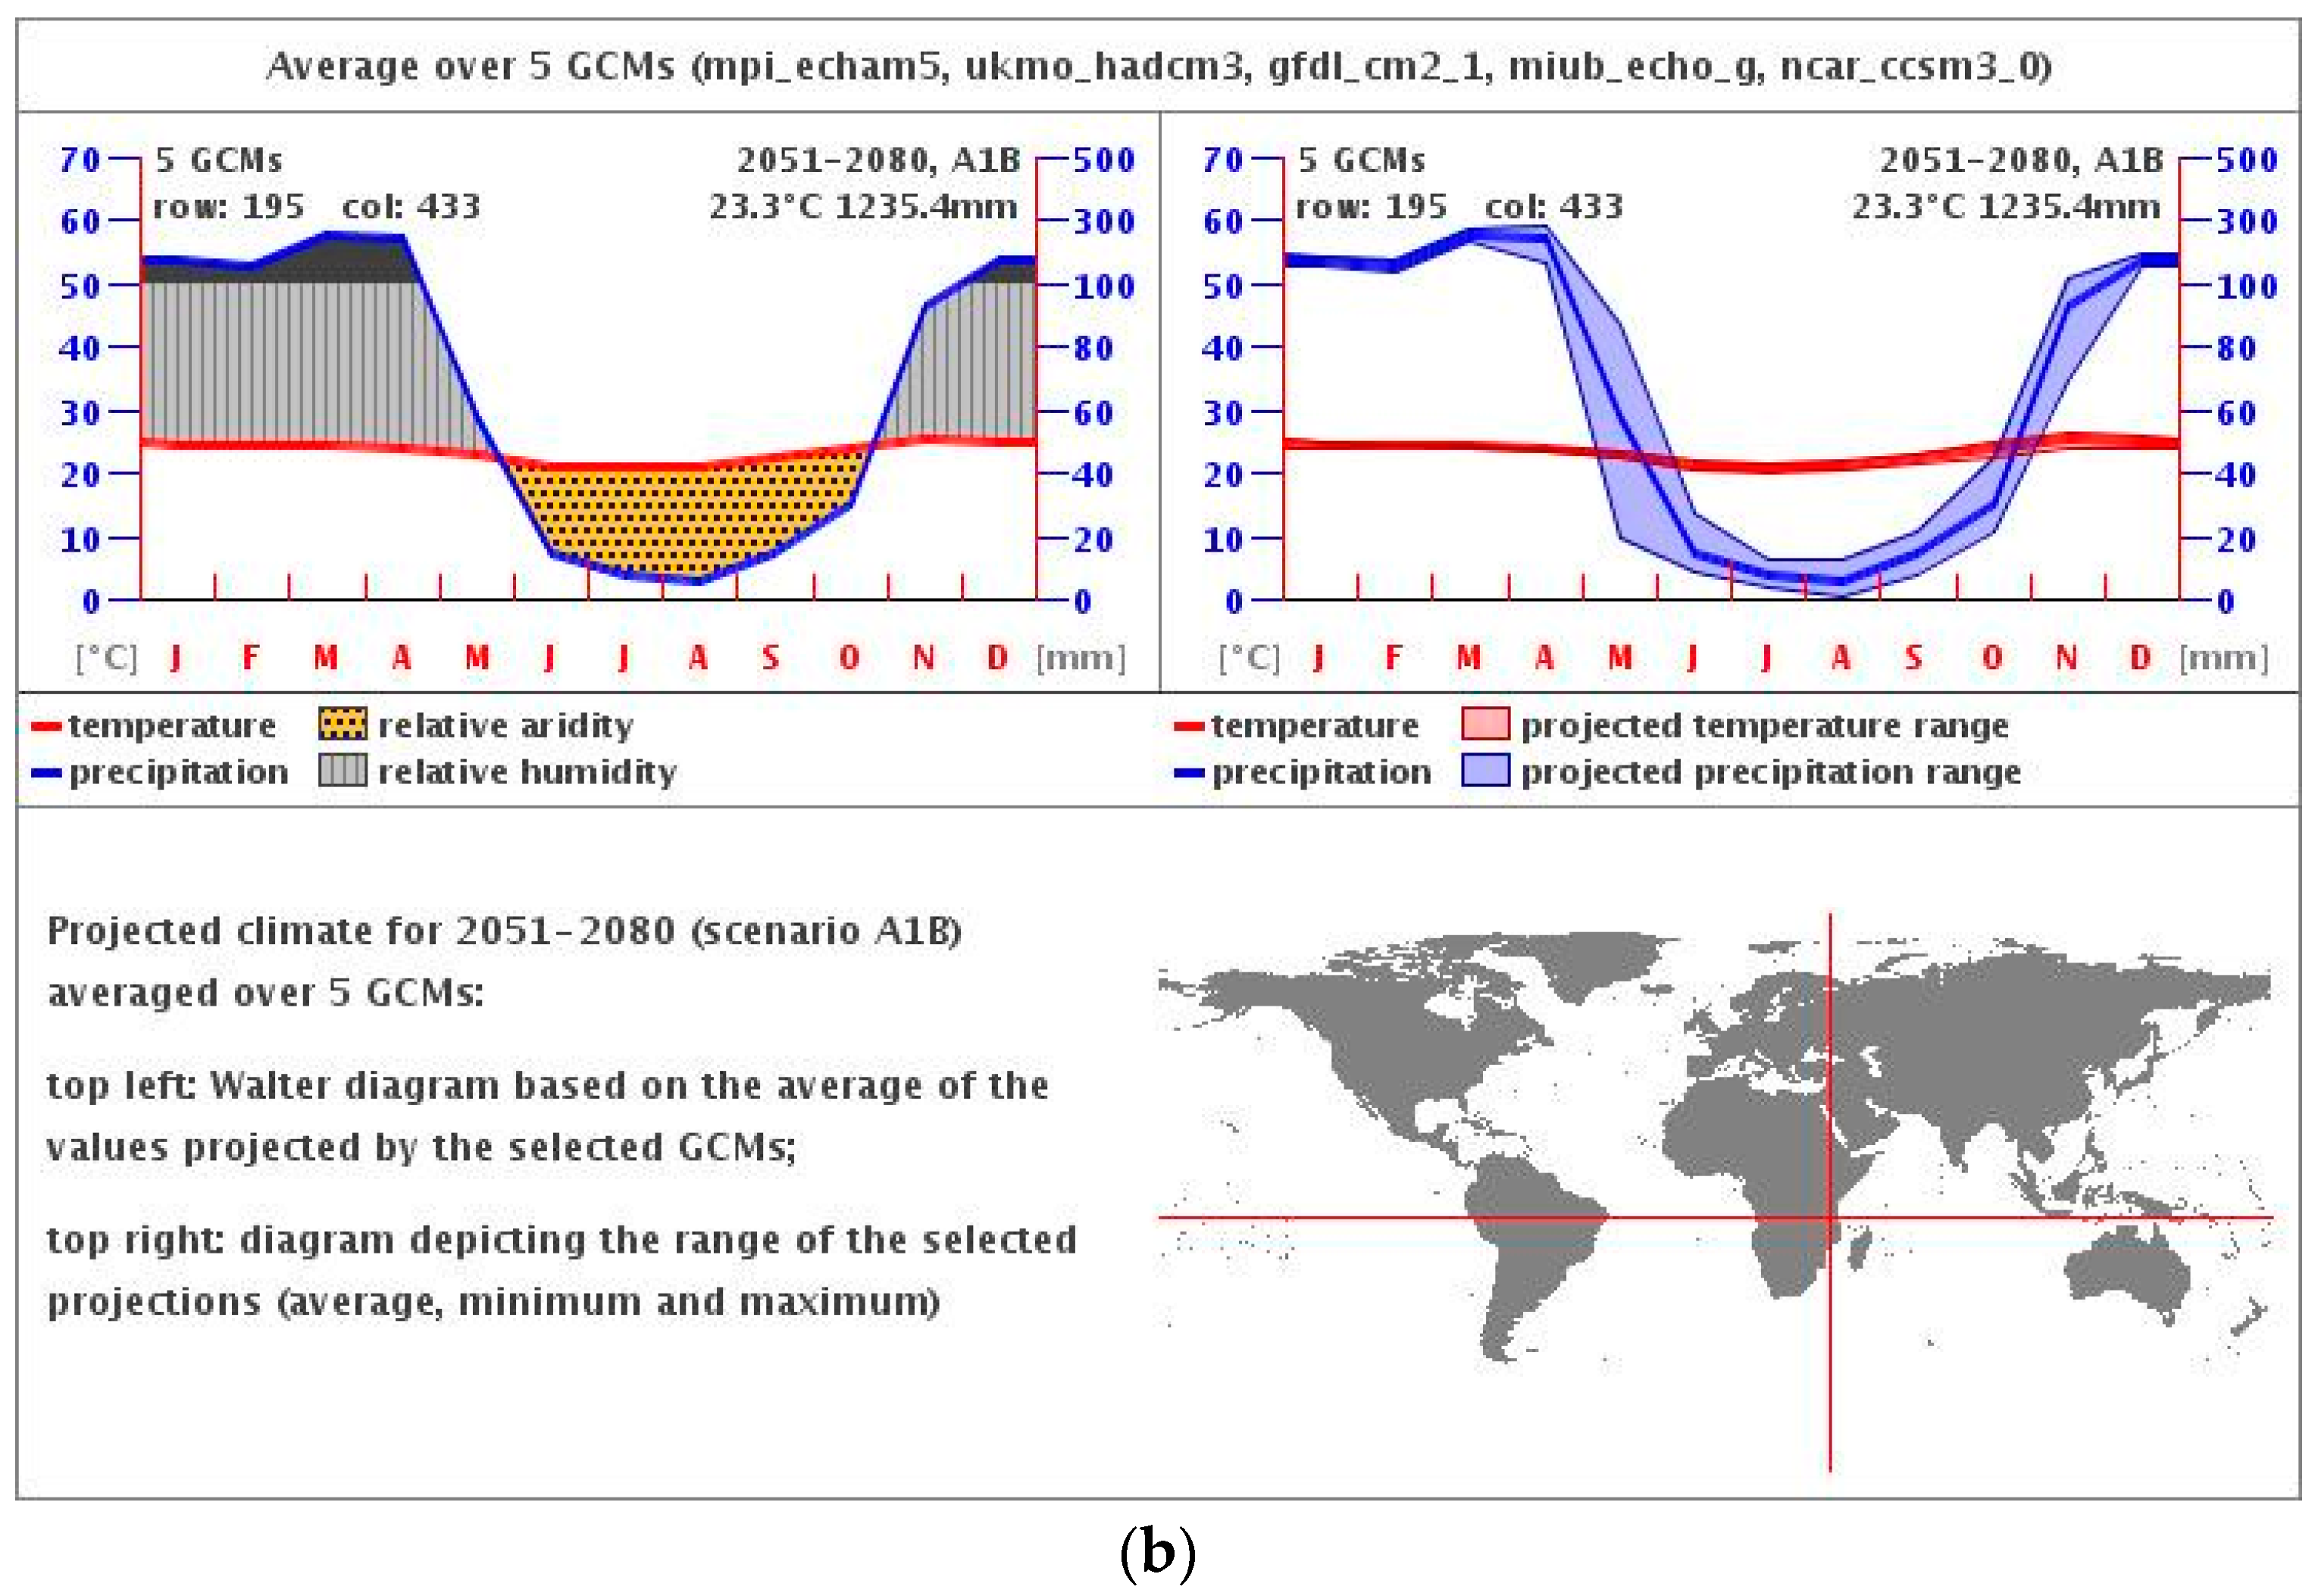
Finally, for a complete and future outlook this information should be analysed in combination with climate change projections for the area. In fact, according to the average over multiple Global Circulation Models (GCMs) in the next 60 years the temperature is likely to rise up to approximately 2 degrees Celsius and rainfall is expected to rise by nearly 50 mm [
68] in the UMNP area. In particular, an increase in temperature may cause the displacement or even disappearance of suitable habitats for some specialised species (see
Figure B2 in the
Appendix B).


 ,
, 


