1. Introduction
The planted forests in Japan cover approximately 10 million ha [
1]. Although harvest activities have almost stopped in some forests because of decreases in timber prices during the past 30 years, recently, many forest owners have had to improve their harvest efficiency to deal with the foreign competition related to the Trans-Pacific Partnership (TPP) agreement. One solution for the improvement of timber productivity is obtaining accurate and timely information on the condition of forest resources to support decision making. In addition, most privately owned forests, which account for approximately 58% of the total forested area in Japan [
1], were entrusted to FOCs (Forest Owners’ Cooperatives) for management with the main purpose of wood production. To date, forest information, such as species composition, diameter at breast height (DBH) and stem density, has been obtained from traditional field-based surveys. The FOCs are eager to obtain spatially explicit and up-to-date stand information on DBH, tree height, volume and species distribution patterns over large areas at a low cost. More than 50% of Japanese land has been covered by airborne laser scanning (ALS) as of July 2013 [
2]. The FOCs can obtain ALS data at a low cost, but they do not possess techniques to interpret the data. Consequently, the forest industry in Japan is looking to the next generation of forest inventory techniques to improve the current wood procurement practices.
Remote sensing has been established as one of the primary tools for large-scale analysis of forest ecosystems [
3]. It has become possible to measure forest resources at the individual tree level using high resolution images and computer technology [
4,
5]. However, it is nearly impossible to estimate the DBH and volume attributes of forests at the single tree level using only two-dimensional airborne and satellite imagery [
6,
7]. One of the most prominent remote sensing tools used in forest studies is ALS, which measures distances by precisely timing a laser pulse emitted from a sensor and reflected from a target, resulting in accurate three-dimensional (3D) coordinates for the objects [
8]. With the capability of directly measuring forest structure (including canopy height and crown dimensions), laser scanning is increasingly used for forest inventories at different levels [
9]. Previous studies have shown that ALS data can be used to estimate a variety of forest inventory attributes, such as tree height, basal area, volume and biomass [
7,
10,
11,
12,
13]. Several researchers have developed area-based approaches to estimate forest attributes at the stand level using ALS data [
14,
15,
16]. However, few studies have focused on the automated delineation of single trees in Japanese forests [
17].
Precision forestry, which can be defined as a method to accurately determine the characteristics of forests and treatments at the stand, plot or single tree level [
18], is a new direction for better forest management. Individual tree detection technology plays a very important role in precision forestry because it can provide precise forest information required at the above three levels. Individual tree-level assessments can also be used for simulation and optimization models of forest management decision support systems [
18]. During the past two decades, many approaches have been developed to detect individual tree crowns from remotely sensed data [
10,
19,
20]. Early studies focused on assessing individual trees based on optical imagery with high resolution [
21,
22,
23]. With the wide introduction of ALS into remote sensing, an increasing number of studies have undertaken individual tree detection using point clouds [
12,
24,
25]. Through time, these studies have shown increased complexity of analyses, increased accuracy of results, and a focus on the use of ALS data alone [
26,
27]. Lu et al. [
28] provided a literature review of more than 20 existing algorithms for individual tree detection and tree crown delineation from ALS, which showed overall accuracies ranging from 42% to 96% depending on the point density, forest complexity and reference data used. In general, these developed algorithms can be divided into two types: one uses a rasterized canopy height model (CHM) to delineate tree crowns [
25,
29,
30], and the other directly uses 3D point clouds to detect individual trees [
12,
31,
32]. Considering the effectiveness of the different tree crown delineation methods, some comparative studies were recently published showing that, depending on the forest type and structure, one method can be superior to another [
33,
34,
35]. For example, the CHM-based approaches, such as inverse watershed segmentation and region growing algorithms, work best for coniferous trees in boreal forests [
24,
36,
37]. The 3D point-based approaches sometimes successfully identify suppressed and understory trees [
12,
38], while most of the algorithms have lower accuracies over more structurally complex forests, especially in highly dense stands with interlocked tree crowns. Overall, single tree delineation in dense temperate and subtropical forests remains a challenging task. A marker-controlled watershed segmentation has shown a powerful capability for individual tree delineation in numerous previous studies [
9,
25,
39,
40].
Conventional existing methods for classifying forest species from remotely sensed data are mostly based on the spectral information from forest canopies [
5,
41]. Despite vegetation cover classification successes at the stand and landscape levels [
42,
43], improved accuracy of species classification at the individual tree level is still needed [
4]. The availability of laser instruments to measure the 3D positions of tree elements, such as foliage and branches, provides an opportunity to significantly improve forest species classification accuracy [
44]. During the last decade, a large number of researchers have contributed to the study of tree species classification using ALS data [
45,
46,
47]. Several ALS features have been extracted to describe crown structural properties of individual trees, such as crown shape and vertical foliage distribution [
44,
48]. These features are usually calculated based on the parameters of a 3D surface model fitted to the ALS points within a given tree [
38,
45,
49]. However, most of the previous studies showed that it is difficult to accurately classify mixed forests based solely on point clouds [
30,
46,
50,
51,
52]. Consequently, the combinations of ALS points with passive data sources, such as multispectral and hyperspectral images, have also been used to classify tree species at the single tree level [
27,
53], but most studies focused on test sites located in boreal forests with a relatively simple forest structure [
40]. However, species classification at the single tree level in Japanese temperate forests remains a challenging task. Stand density is generally higher, deciduous tree crowns are often interlocked, and species mixture is greater and more irregular compared with other temperate forests.
Selection of classification approaches plays an important role in forest species identification. Traditional parametric classification methods, e.g., Maximum Likelihood (ML), are easily affected by the “Hughes Phenomenon,” which arises in high dimensionality data when the training dataset size is not large enough to adequately estimate the covariance matrices [
53]. In forest classification studies, acquiring a sufficient amount of training data that exceeds the total number of spectral bands and other features required for the ML classifier is an impractical task, especially in highly spectrally variable environments. Consequently, non-parametric machine learning methods such as decision tree approaches have recently received increasing attention in species classification studies [
54]. The most commonly used approach is support vector machines [
27,
39,
40,
47,
48,
55,
56]. Random forest classification [
57] is considered as a solution to overcome the over-fitting issue [
50,
53,
58,
59]. Additionally, some researchers believed that linear and quadratic discriminant analysis classifiers were more suitable for their studies [
44,
51,
60]. To the best of our knowledge, only a few studies compared the performance of different approaches in forest classification. For example, Li et al. [
61] investigated three machine learning approaches—decision trees, random forest, and support vector machines—to classify local forest communities at the Huntington Wildlife Forest located in the central Adirondack Mountains of New York State and found that random forest and support vector machines produced higher classification accuracies than decision trees. However, assessing the performance of different methods in tree species identification at the individual tree level is still needed. Based on the above analyses, this study focused on the following objectives:
To assess the utility of ALS data for measuring single tree crowns in Japanese conifer plantations with a high canopy density using the watershed algorithm;
To determine the best combination of spectral bands and structural features for tree species classification; and
To evaluate the capability of different machine learning approaches for forest classification at the individual tree level.
4. Discussion
With the wide use of multiple data sources in forest resource measurements, a large number of features can be easily extracted from different datasets and used for forest classification and attribute estimation. Some authors used principal component analysis (PCA) to reduce the dimensions of feature space [
67]. However, how to select the optimal number of principal component features as input to the classifier is another challenging task. In [
68], the dimensionality of the data was reduced from 361 to 32 using a robust PCA method. A classification accuracy of 92.19% was achieved when the first 22 principal components were used. Then, the accuracy decreased slightly. In the pre-test, we attempted to classify the tree crowns using the principal components transformed from the tree features. However, the results indicated that all the classifications using PCA-transformed data had a lower overall accuracy than those using the original variables. Consequently, the results of the PCA classifications were excluded from this study. In addition, several studies selected feature importance to decrease the dimensions of the features [
44,
51,
53]. Feature importance assessment was initially conducted using an internal ranking method established in the classifiers before forest classification to extract those that are most important, and then tree species were classified based on the selected features. In this study, however, we found that for the same feature there were different contribution degrees to species classification in different loops, indicating that the importance of a feature is changeable and greatly depends on a special combination with other features. Therefore, how to determine the best combination of features for tree classification in different forests remains a critical issue that should be further clarified [
40,
53].
Although several studies have demonstrated that a multisource information-based approach is a feasible method for the improvement of forest classification [
39,
40,
53], data registration of different sensors is still a challenging task. The interpretation of species-specific individual trees always requires a registration error of less than 1 m, which is difficult to obtain especially for datasets acquired at different altitudes and in different seasons. In this study, matching with an accuracy of approximately 0.5 m between the orthoimages and CHM data was achieved, which can be one of the reasons that explains our better classification results compared with those of previous studies [
39,
55]. With the development of navigation technology, such as the synergy of different positioning satellite systems, the increasingly improved systematic error will be more advantageous for the measurement of forest resources at the single tree level.
A large number of studies have shown that the use of multispectral images is an effective means for species identification [
4,
22,
41] because it can provide abundant spectral and textural information on tree crowns. In addition to the average spectral reflectance of the three bands, the standard deviations (SD) of the pixel values within each tree crown were also used to differentiate species in this study. Compared with our previous study [
69], in which the tree crowns in the same area as this study were delineated using another algorithm, the overall accuracy was improved by 3.2 percentage points with the use of the SD features. Moreover, in the pre-test of this study, we found that the standard deviations contributed to the species classification with an improvement in overall accuracy ranging from 1.7% to 3.5%. The above results indicate that the SD parameter may be a valuable source of information for discriminating tree crowns of different species in Japanese plantations. However, a relatively low accuracy of 76.7% was obtained when using only the RGB features for the classification (
Table 4). Errors in the classification can be attributed to the lack of near-infrared (NIR) information. Several authors have demonstrated that NIR improved the accuracy of forest classification in different study areas [
4,
70,
71]. The findings of this study also suggest that the overall accuracy was improved by 6.6% with the use of a laser intensity (LI) feature with a wavelength of 1064 nm in the QSVM classification. Accordingly, the contribution of NIR, which can be obtained in laser scanning measurements using the colorIR mode, to species identification should be assessed in future studies. In addition, some studies suggested that band ratios and vegetation indices, such as NDVIs generated using different band combinations [
39,
53,
72], have advantages for species differentiation and biomass estimation because these features can reduce Bi-directional Reflectance Distribution Function (BRDF) errors and do not saturate as quickly as single band data [
55]. Consequently, the potential of these features for the improvement of tree crown-based classification requires further study.
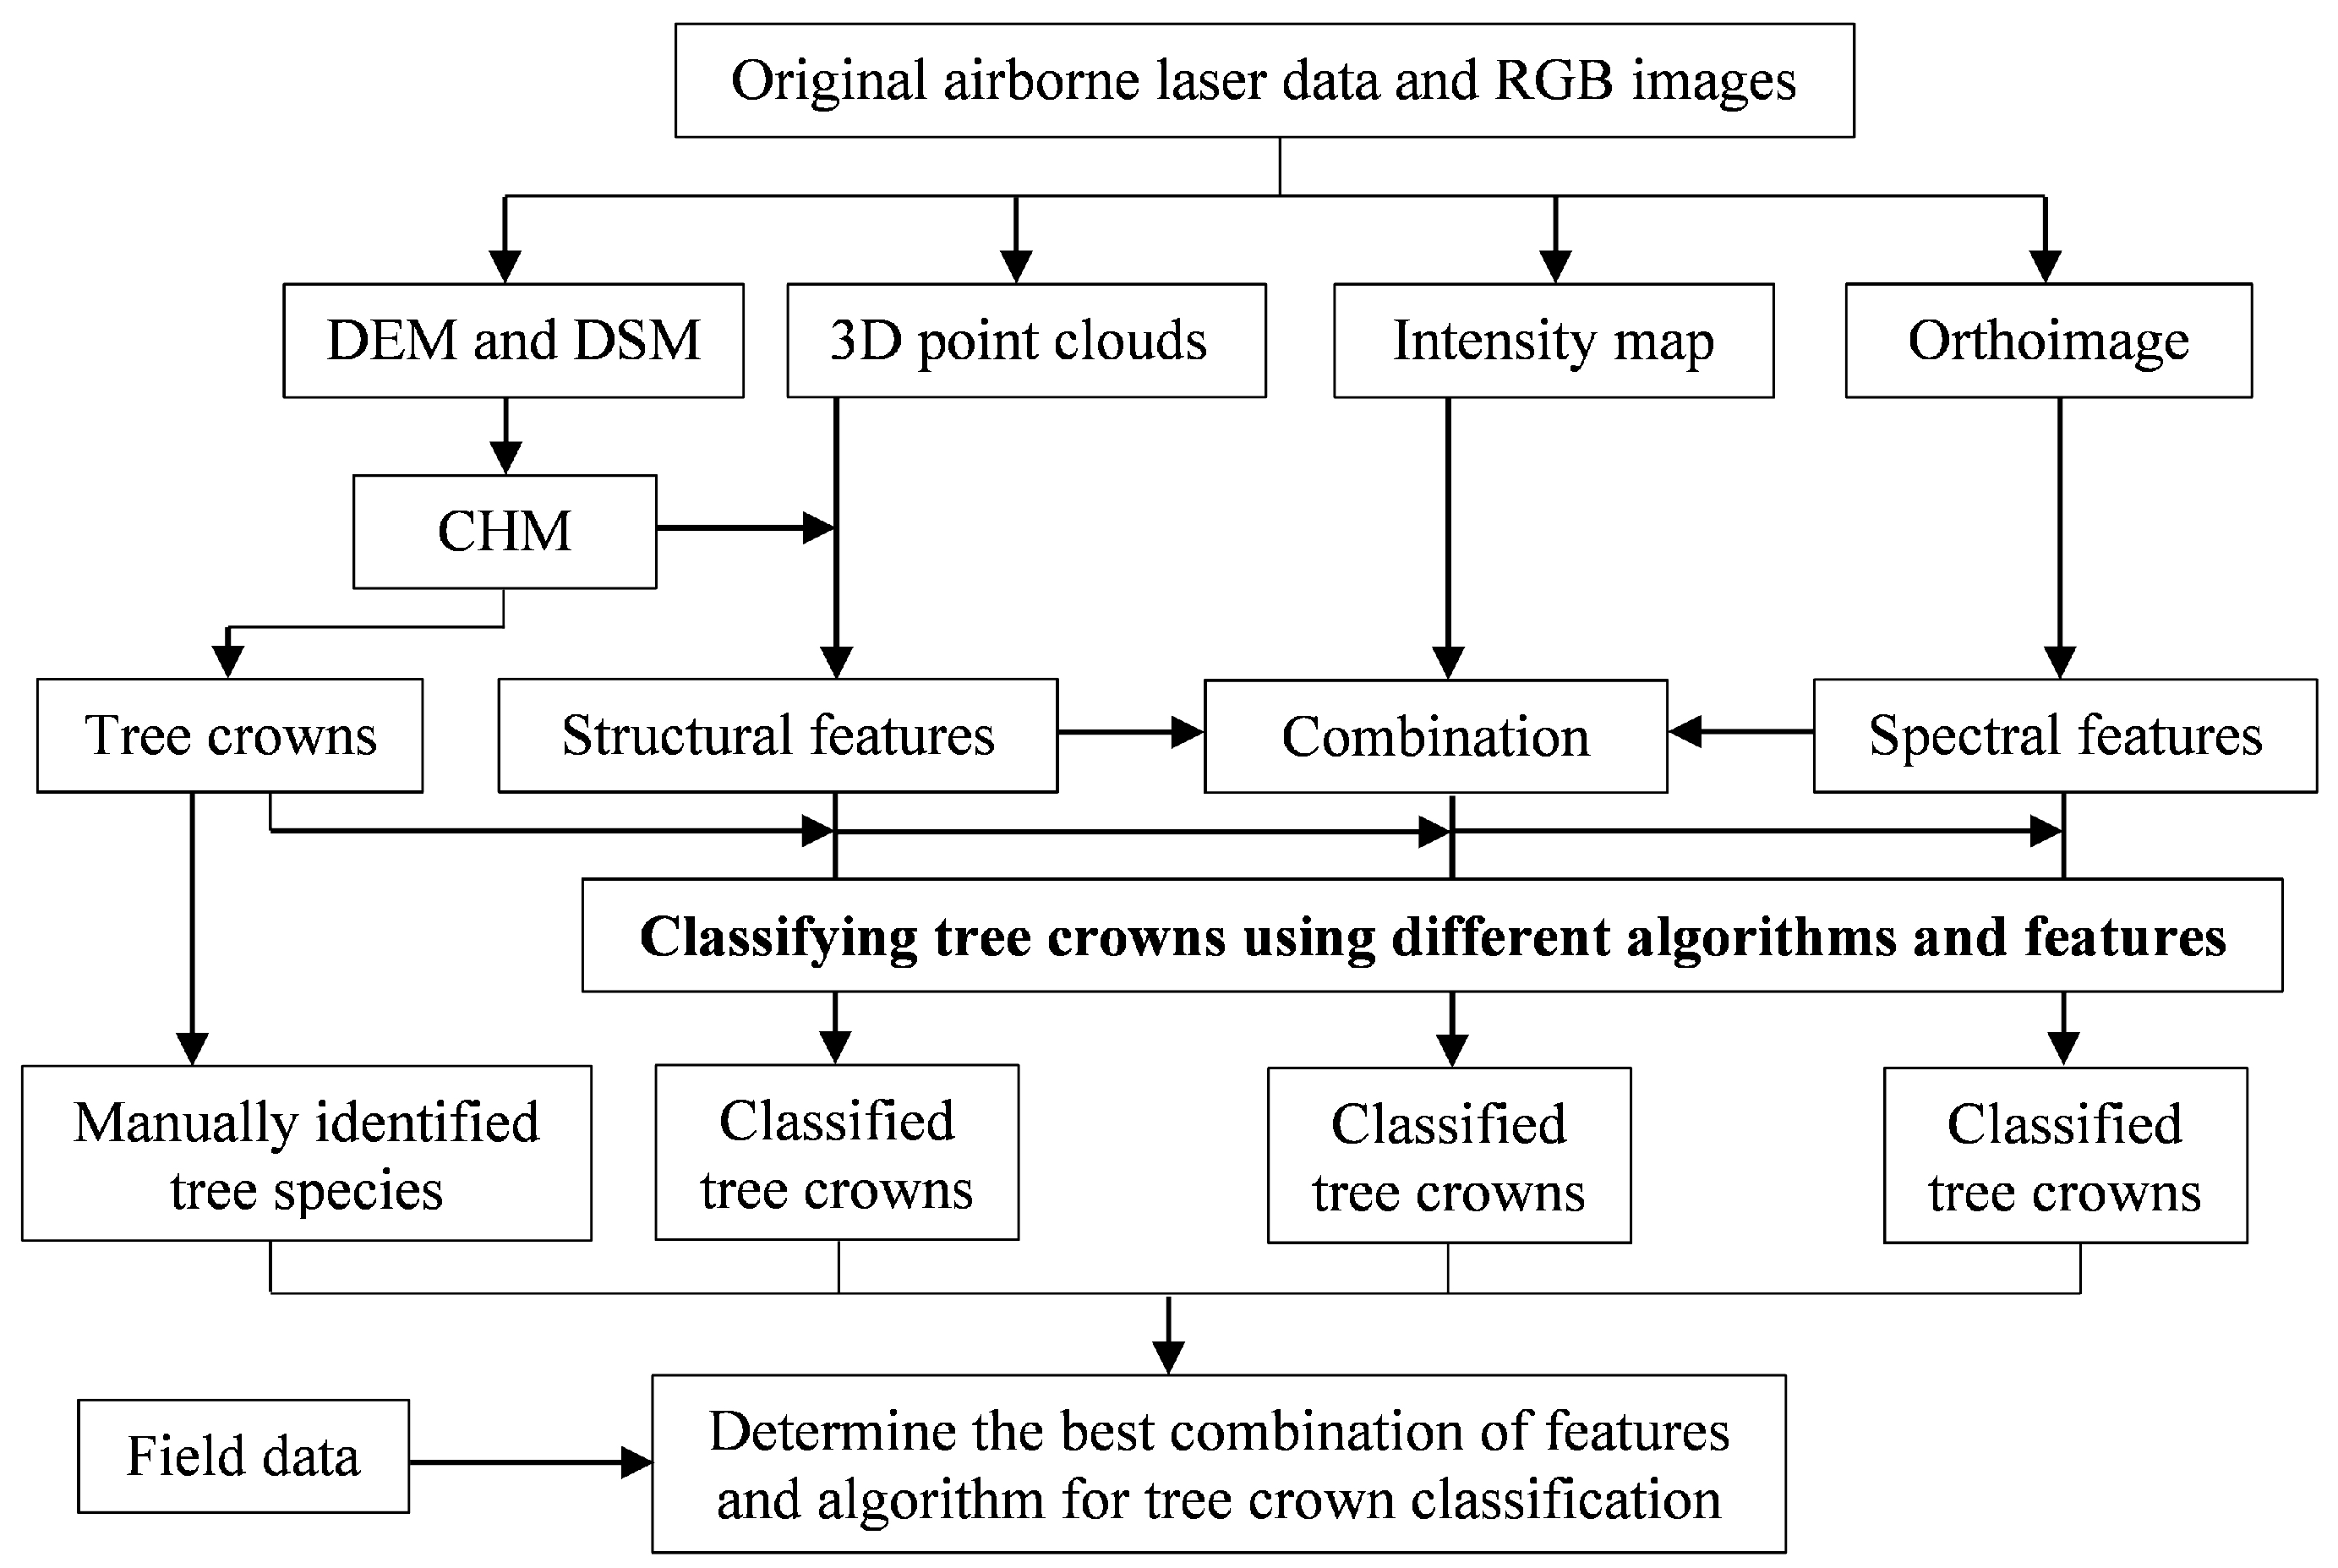
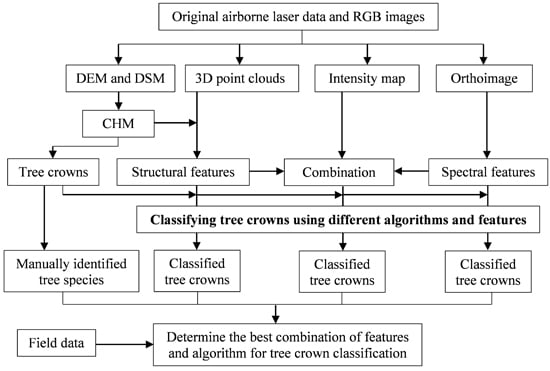
A combination of ALS and complementary data sources has been proven to be a promising approach to improve the accuracy of tree species recognition [
40]. Different from previous studies [
44,
48,
53], we aimed to develop a simple but efficient framework to propose and validate feature parameters from airborne laser data for tree species classification. Compared to only using the spectral characteristics of the orthophoto, the classification accuracy was improved in this study for all tree species using the ALS-derived features. Based on a comparison with the RGB features, the overall accuracy was improved by 14.1%, 9.4%, and 8.8% with the best combination of features when the respective QSVM, NN, and RF approaches were used (
Table 5). As shown in most previous studies [
60,
73,
74], the results of this study also suggest that the laser intensity is an important feature for the classification of individual trees, which improved the overall accuracy by 5.1% to 8% with the use of different classification approaches. Additionally, the convex hull area (CHA), convex hull point volume (CHPV), shape index (SI), crown area (CA), and crown height (CH) features contributed to the species classifications to different extents (
Table 4). CHA, CHPV and SI improved the overall accuracy by 5.5%, 1.4% and 0.4%, respectively. However, CA and CH only contributed 0.2% to the species classification. The best combination of features for species classification was determined using the QSVM approach, which indicates that there may be other best combinations for the NN and RF methods. In addition, the findings of this study did not support the recommendation that as many additional features as possible should be included in the tree species classification [
44].
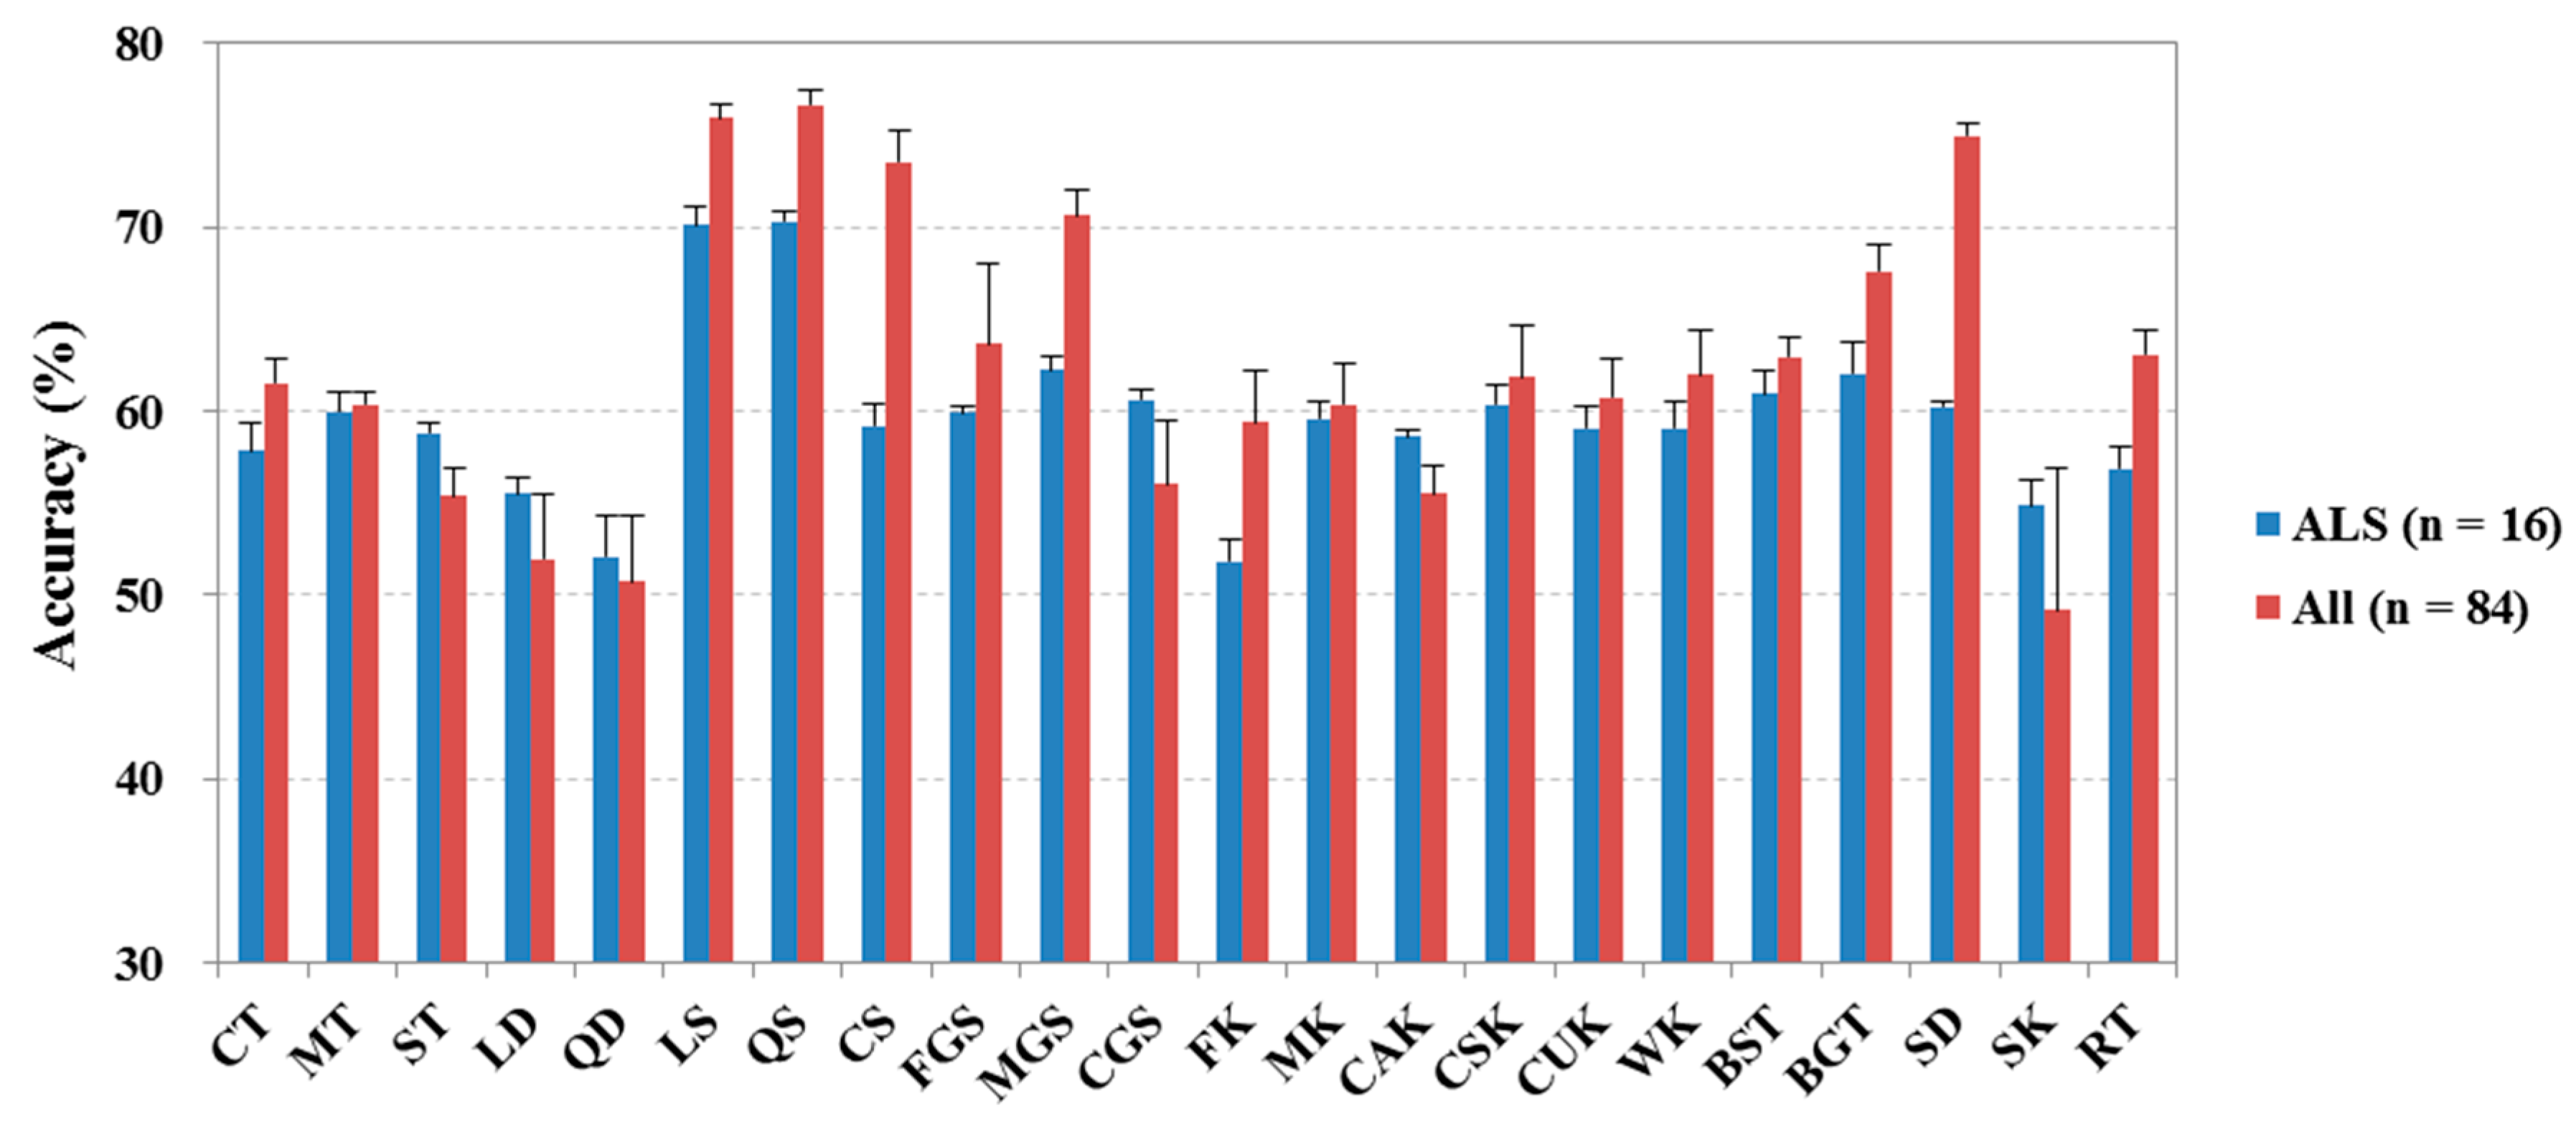
In this study, 22 algorithms were initially compared using 100 classifications, and the results indicated that the QSVM classifier had higher classification accuracies than the other classifiers. Then, the QSVM classifier was compared with the NN and RF approaches using eight combinations of different features. Previous studies obtained comparable results from the RF classifications [
50,
53,
58,
59], and some authors showed that RF produced higher classification accuracies than other classification techniques such as decision trees and bagging trees [
61,
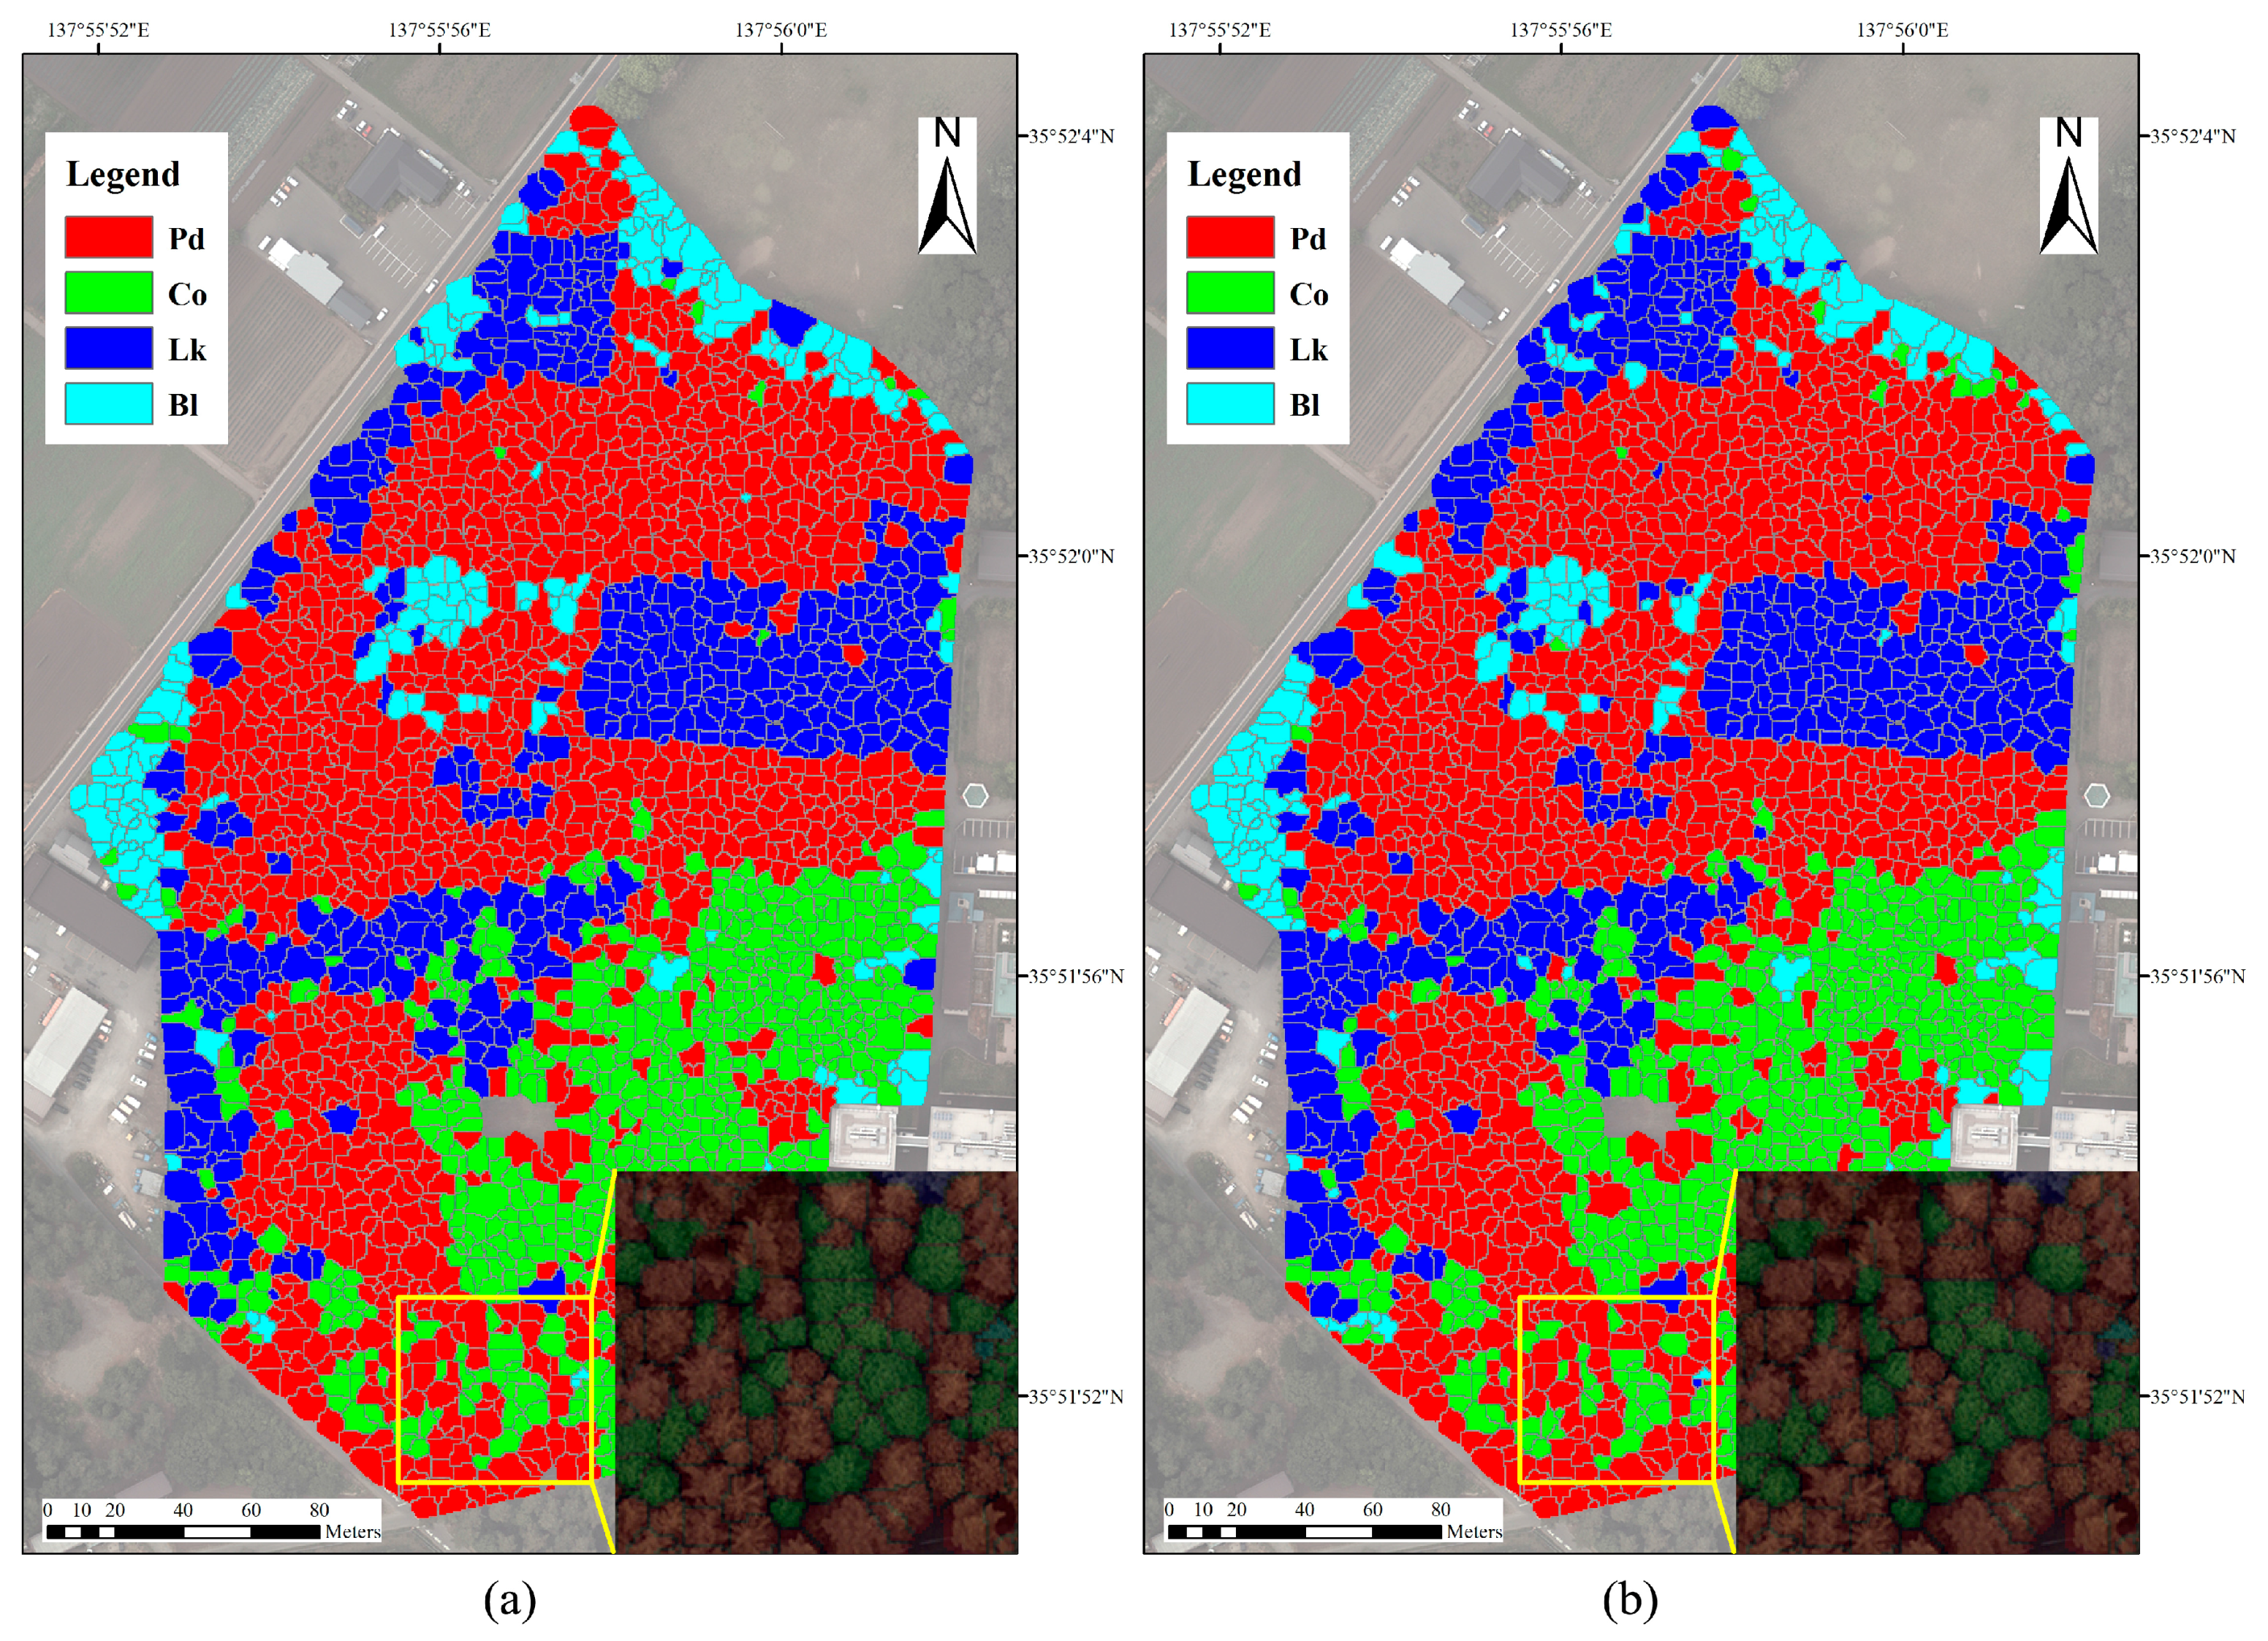
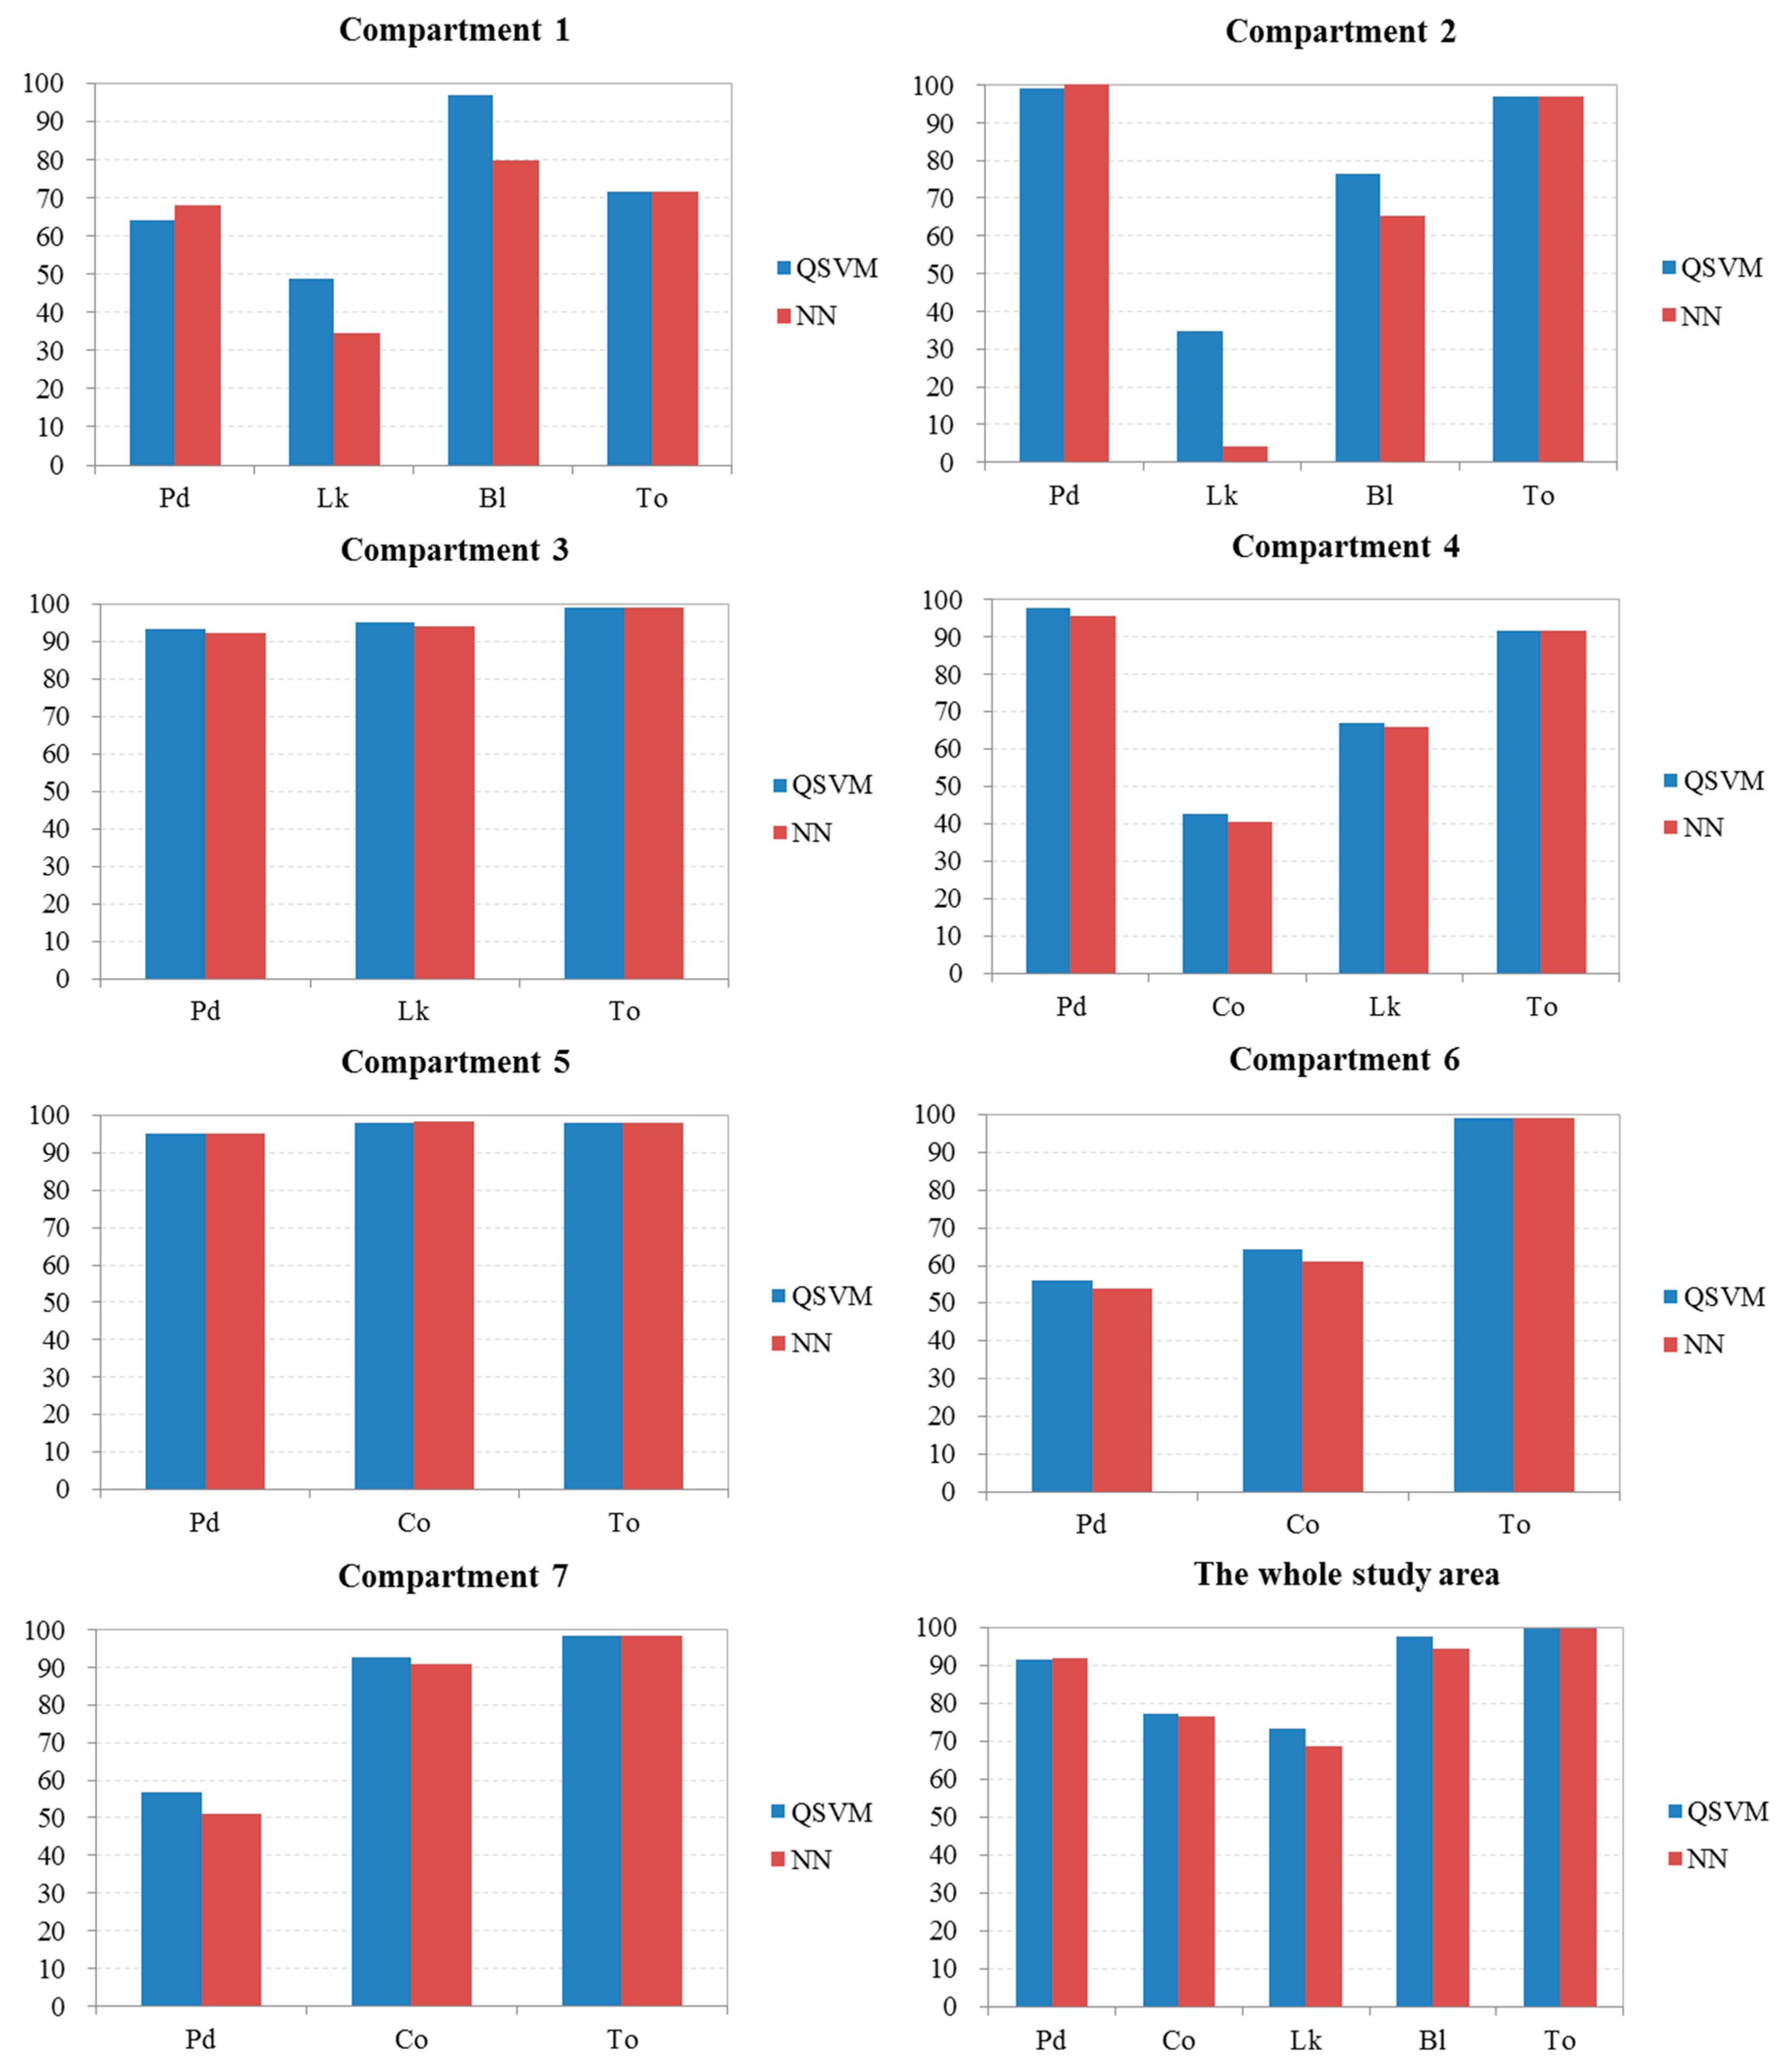
75]. In our study, however, we found that the QSVM and NN models were preferable to the RF models based on the classification accuracies. Although the overall accuracies of the classifications using NN were slightly higher than those using QSVM, it should be noted that several problems still remain with the NN method. For example, the NN model is more difficult to interpret than the QSVM model because it exhibits one or more hidden layer(s) and may therefore appear to be a “black box.” In terms of classification accuracies of different species, QSVM even obtained slightly better results than NN, especially for the broadleaved trees. Accordingly, we recommend the quadratic SVM approach rather than the neural network method to classify the tree crowns of forests in the study area. However, these classification approaches should be further compared in other forests using different data.
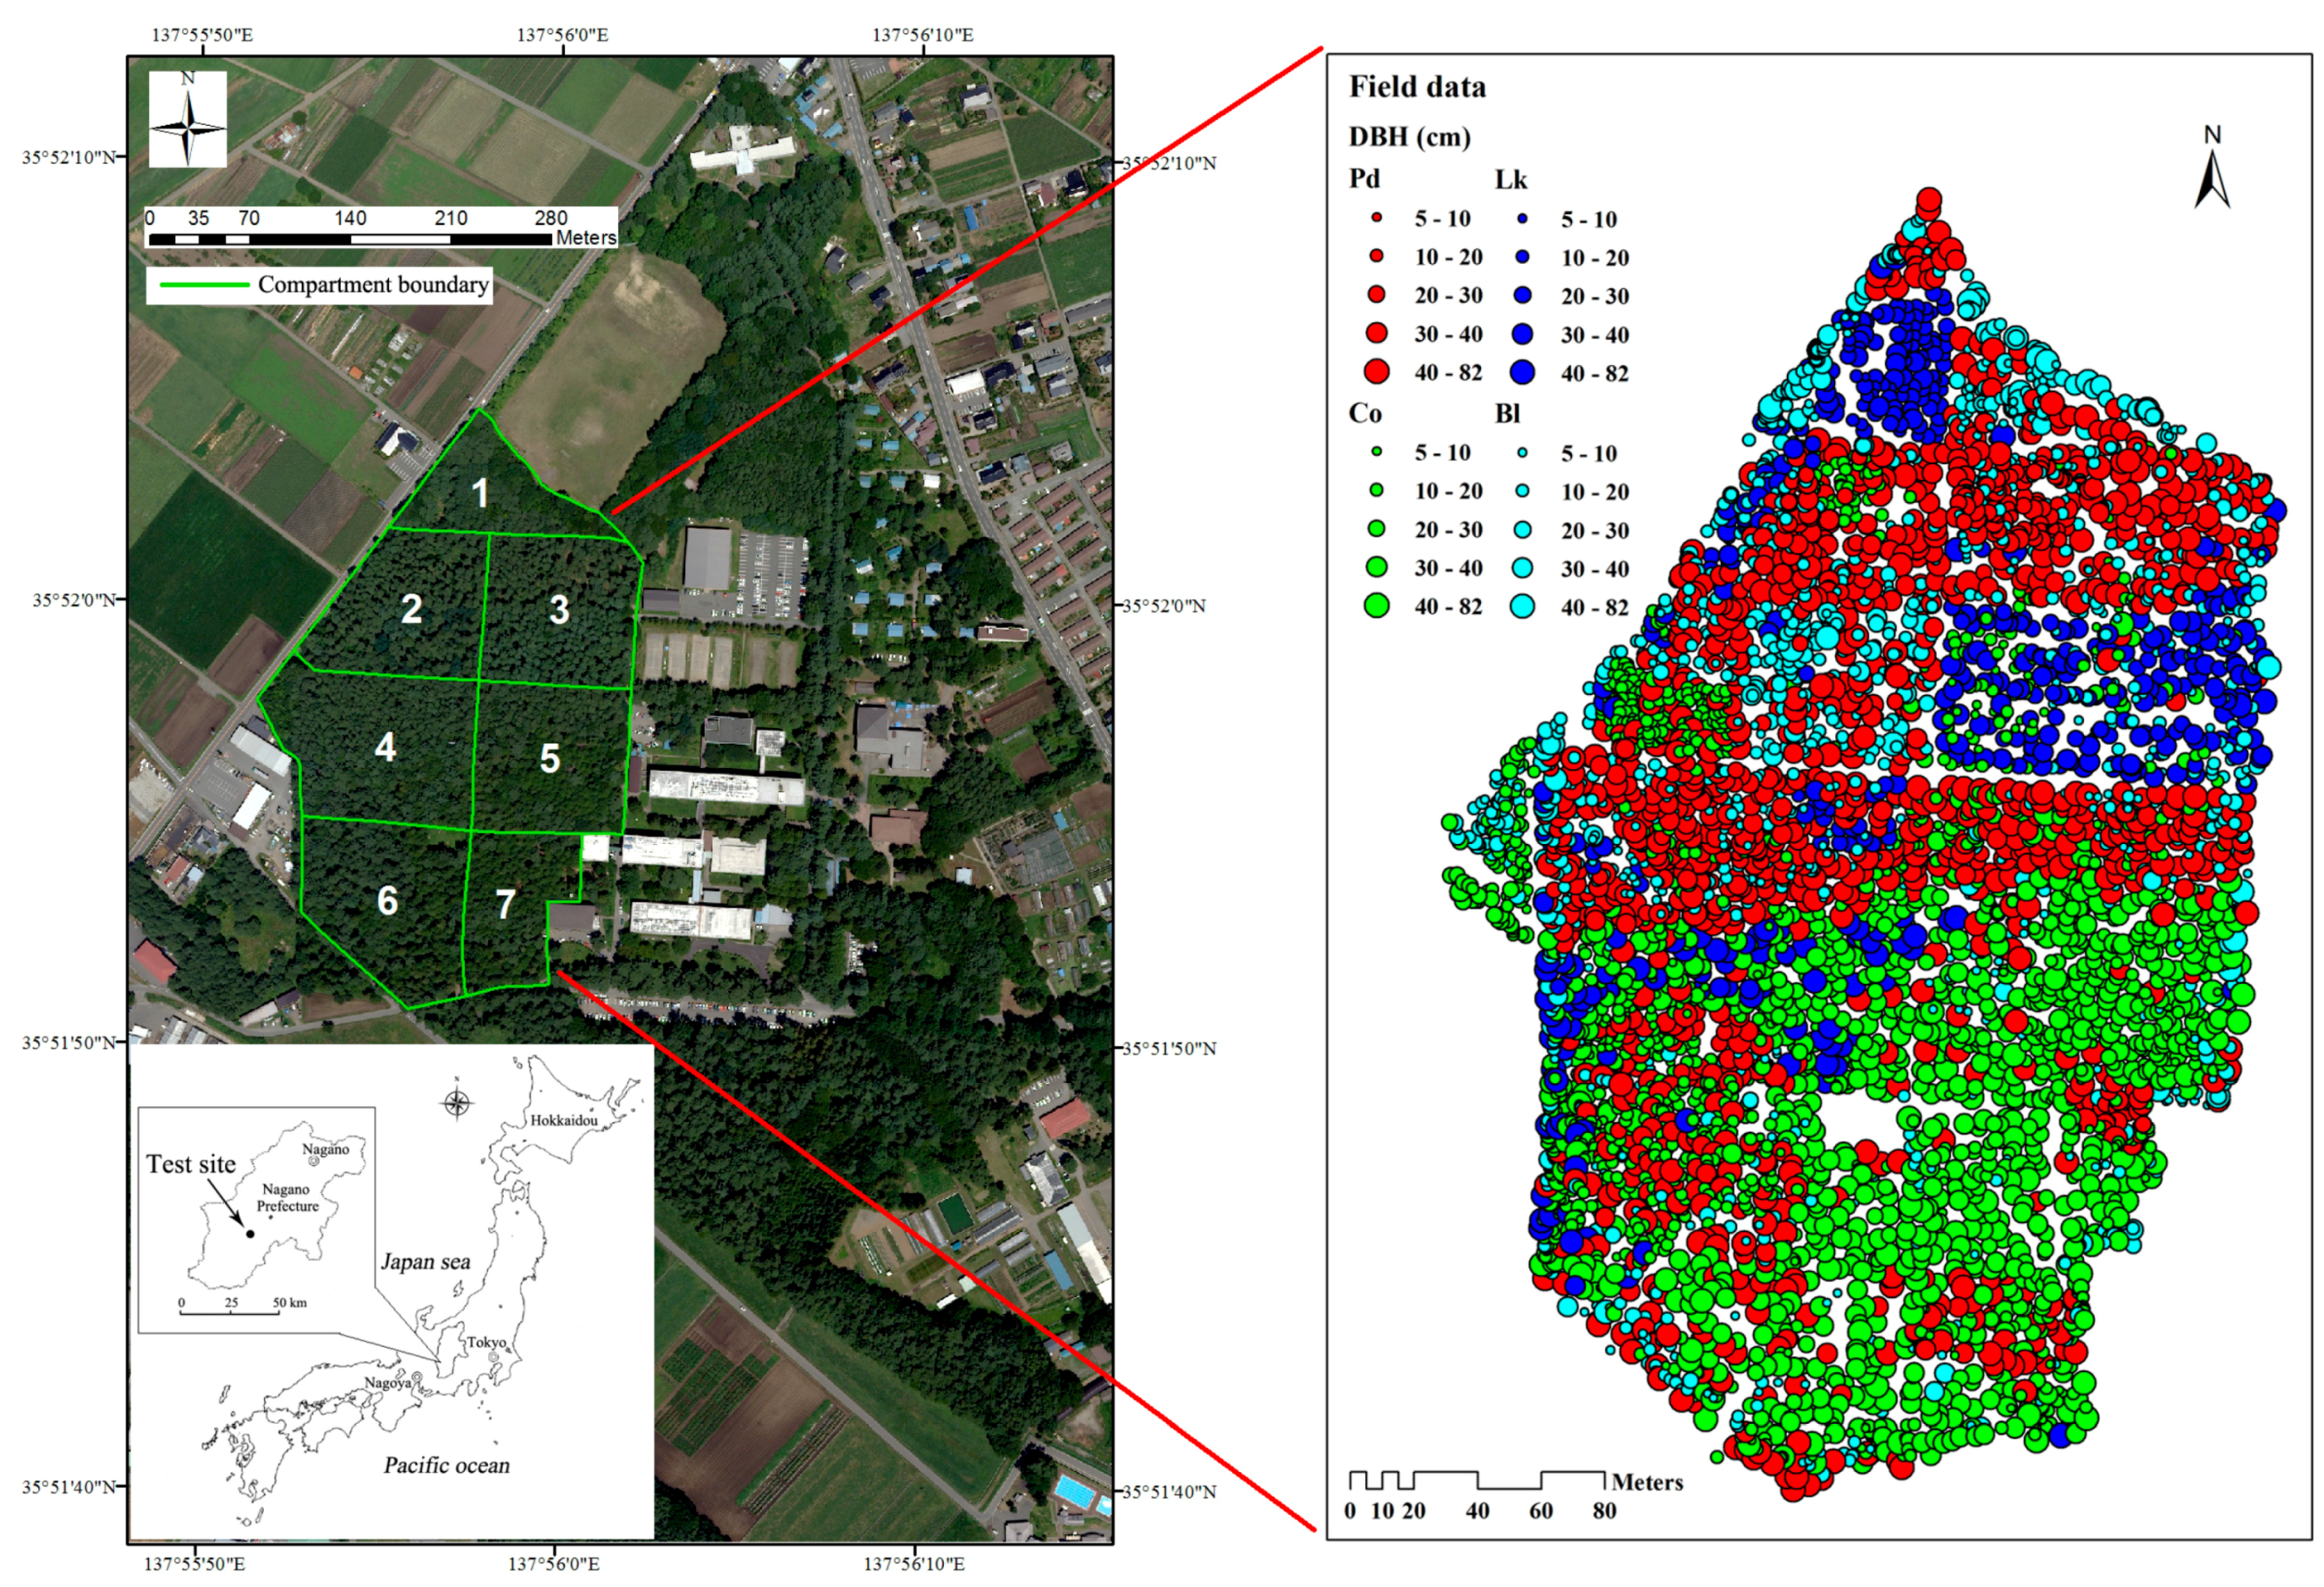
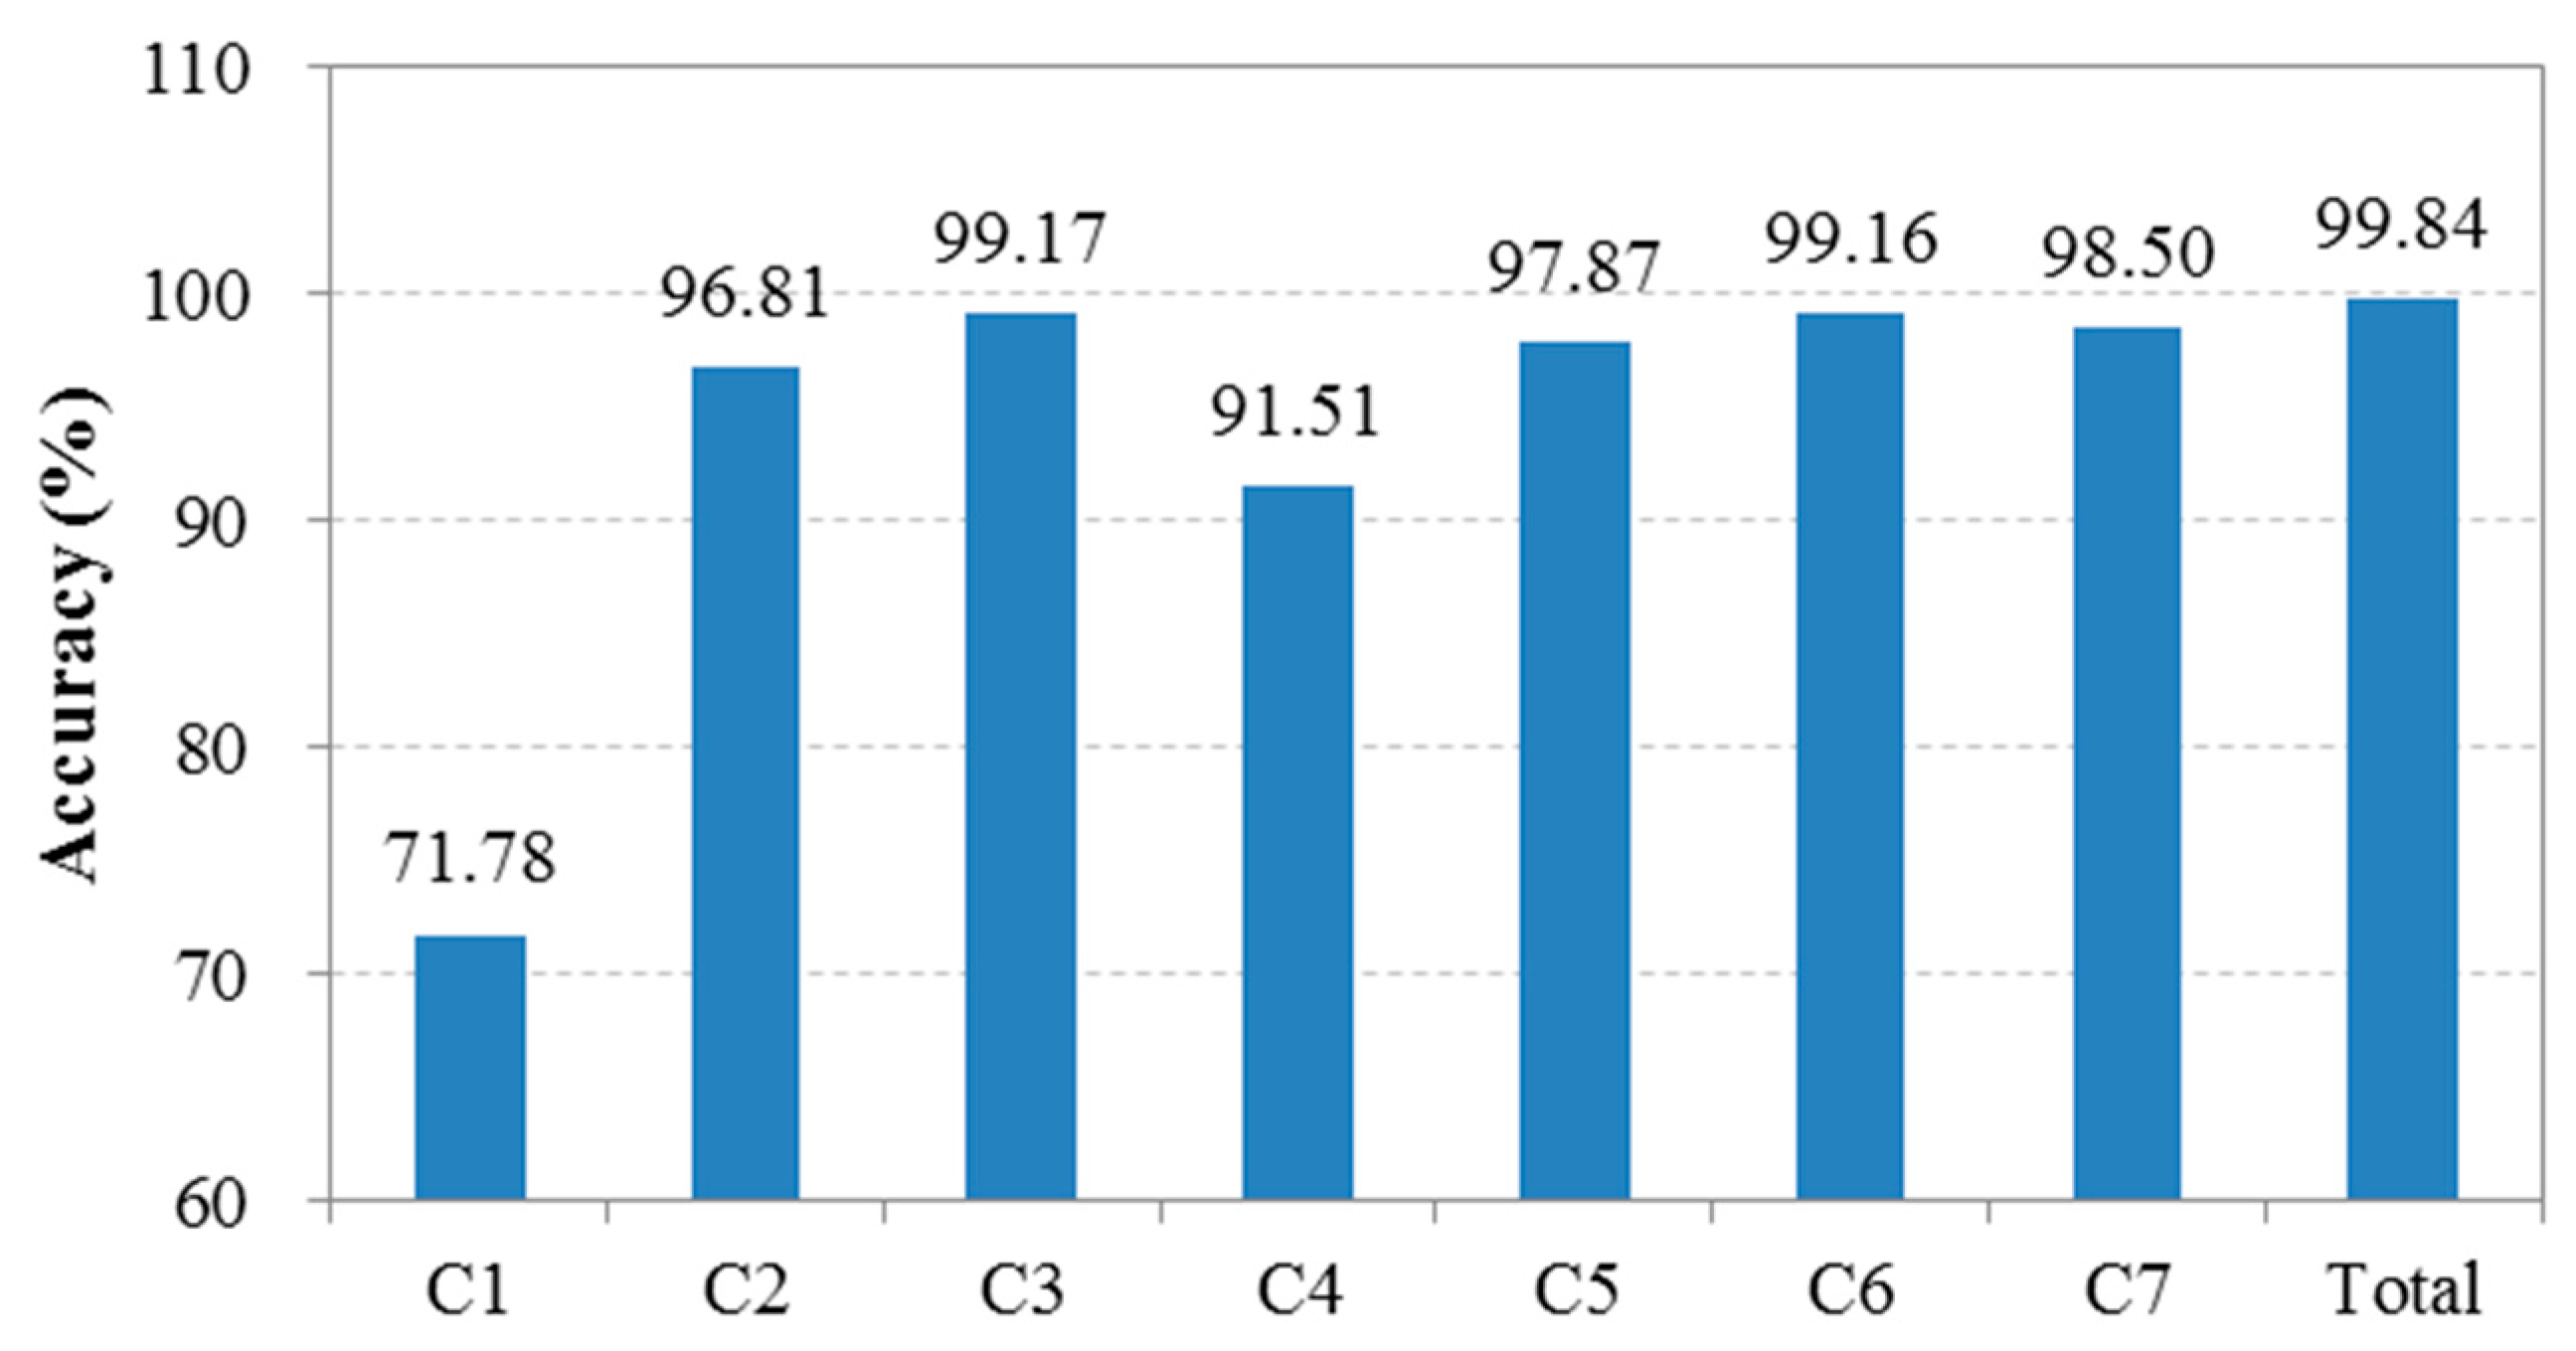
In theory, the success rate of individual tree detection to distinguish species depends on the accuracies of tree crown delineation and species classification in the study area. In this study, more than 90% of the trees in most compartments were delineated, and a classification accuracy of 90.8% was obtained by the QSVM approach when using the best combination of features. However, some dominant tree species were detected with a relatively low accuracy in some compartments. For example, Chamaecyparis obtusa was detected with an accuracy of less than 65% in compartments 4 and 6, and the Pinus densiflora trees were delineated at 57% in compartment 7. These results can be attributed to the high stem density and complex spatial structure of the forests in these areas, which increase the probability of overlap between tree crowns and were disadvantageous for species classification. Additionally, the DBH distribution also contributed to the detection accuracy. The compartments with a higher standard deviation for DBH classes had a lower accuracy. Another reason may be that the forest inventory data from 2005 to 2007 were used to examine the detection accuracy, whereas the airborne laser data were acquired in 2013. Although no management activities, such as thinning or timber harvest, were conducted since 2005, slightly better results were found in the accuracies calculated using the data surveyed in 2015 and 2016 for compartments 4 and 2 compared with those recorded in 2007. In addition, the trees with a DBH larger than 25 cm were considered to be the dominant canopy trees of the study area and were used to calculate the detection accuracy of the tree crowns to distinguish species. In fact, a notable difference in stand structure was found between some compartments. Consequently, a determination approach using the canopy trees in different forests should be further explored.
The synergy of laser scanning data with multi and/or hyperspectral images for individual tree detection to distinguish species has received more attentions in recent years [
39,
40,
67]. However, although more than 50% of Japanese land has been covered by ALS data as of July 2013 [
2], few airborne multispectral images with more than four bands are available in these areas. The successful launch of several commercial satellites such as GeoEye-1, WorldView-2 and WorldView-3 that can acquire images with a resolution less than 1 m provided a solution to this problem [
4]. In addition, WorldView-4, which was just launched on 11 November 2016, can be expected to be an effective means for single tree crown identification because it has the capability to collect 30 cm resolution imagery with an accuracy of 3 m CE90 [
76]. In fact, a combination of ALS data and WorldView-3 images has been successfully used for extracting the damaged trees caused by pine wood nematode in another study. Consequently, single tree delineation using the synergy of laser data and high resolution satellite imagery will be tested in our next study.
