Empirical Model for Phycocyanin Concentration Estimation as an Indicator of Cyanobacterial Bloom in the Optically Complex Coastal Waters of the Baltic Sea
Abstract
:1. Introduction
2. Materials and Methods
2.1. Area of Investigation
2.2. Radiometric Measurements
2.3. Phycocyanin Measurement
2.4. Model Development
2.5. Model Assessment
3. Results and Discussion
3.1. Field Measurements
3.2. Assessment of Known Models
3.3. Optimal Band Ratio Selection
3.4. Multilinear Model for PC Estimation
3.4.1. Hyperspectral Data
3.4.2. Multispectral Data
3.5. Model Robustness
3.6. Sensitivity for High chl−a Concentration
4. Summary and Conclusions
Acknowledgements
Author Contributions
Conflicts of Interest
References
- Blaha, L.; Babica, P.; Marsalek, B. Toxins produced in cyanobacterial water blooms-toxicity and risks. Interdiscip. Toxicol. 2009, 2, 36–41. [Google Scholar] [CrossRef]
- Landsberg, J.H. The effects of harmful algal blooms on aquatic organisms. Rev. Fish. Sci. 2002, 10, 113–390. [Google Scholar] [CrossRef]
- Boyer, J.N.; Kelbe, C.R.; Ortner, P.B.; Rudnick, D.T. Phytoplankton bloom status: Chlorophyll a biomass as an indicator of water quality condition in the southern estuaries of Florida, USA. Ecol. Indic. 2009, 9, 1188–1197. [Google Scholar] [CrossRef]
- Randolph, K.; Wilson, J.; Tedesco, L.; Li, L.; Pascual, D.L.; Soyeux, E. Hyperspectral remote sensing of cyanobacteria in turbid productive water using optically active pigments, chlorophyll a and phycocyanin. Remote Sens. Environ. 2008, 112, 4009–4019. [Google Scholar] [CrossRef]
- Ahn, C.-Y.; Joung, S.-H.; Yoon, S.-K.; Oh, H.-M. Alternative alert system for cyanobacterial bloom, using phycocyanin as a level determinant. J. Microbiol. 2007, 98–104. [Google Scholar]
- Gons, H.J.; Rijkeboear, M.; Ruddick, K.G. A chlorophyll-retrieval algorithm for satellite imagery (Medium Resolution Imaging Spectrometer) of inland and coastal waters. J. Plankton Res. 2002, 24, 947–951. [Google Scholar] [CrossRef]
- Seppälä, J.; Ylöstalo, P.; Kuosa, H. Spectral absorption and fluorescence characteristics of phytoplankton in different size fractions across a salinity gradient in the Baltic Sea. Int. J. Remote Sens. 2005, 26, 387–414. [Google Scholar] [CrossRef]
- Sobiechowska-Sasim, M.; Stoń-Egiert, J.; Kosakowska, A. Quantitative analysis of extracted phycobilin pigments in cyanobacteria—An assessment of spectrophotometric and spectrofulorometric methods. J. Appl. Phycol. 2014, 26, 2065–2074. [Google Scholar] [CrossRef] [PubMed]
- Song, K.; Li, L.; Li, Z.; Tedesco, L.; Hall, B.; Shi, K. Remote detection of cyanobacteria through phycocyanin for water supply source using three-band model. Ecol. Inform. 2013, 15, 22–33. [Google Scholar] [CrossRef]
- Ogashawara, I.; Mishra, D.R.; Mishra, S.; Curtarelli, M.P.; Stech, J.L. A Performance review of reflectance based algorithms for predicting phycocyanin concentrations in inland waters. Remote Sens. 2013, 5, 4774–4798. [Google Scholar] [CrossRef]
- Mishra, S.; Mishra, D.R.; Schluchter, W.M. A novel algorithm for predicting phycocyanin concentrations in cyanobacteria: A proximal hyperspectral remote sensing approach. Remote Sens. 2009, 1, 758–775. [Google Scholar] [CrossRef]
- Ruiz-Verdú, A.; Simis, S.G.; de Hoyos, C.; Gons, H.J.; Pena-Martinez, R. An evaluation of algorithms for the remote sensing of cyanobacterial biomass. Remote Sens. Environ. 2008, 112, 3996–4008. [Google Scholar] [CrossRef]
- Simis, S.G.H.; Peters, S.W.M.; Gons, H.J. Remote sensing of the cyanobacterial pigment phycocyanin in turbid inland water. Limnol. Oceanogr. 2005, 50, 237–245. [Google Scholar] [CrossRef]
- Larkum, A.W.D. Light harvesting systems in algae. In Photosynthesis in Algae; Springer: Dordrecht, The Netherlands, 2003; pp. 277–289. [Google Scholar]
- Dekker, A.G. Detection of Optical Water Quality Parameters for Eutrophic Waters by High Resolution Remote Sensing. Ph.D. Thesis, Vrije Universiteit, Amsterdam, The Netherlands, 1993. [Google Scholar]
- Seppälä, J.; Ylöstalo, P.; Kaitala, S.; Hällfors, S.; Raateoja, M.; Maunula, P. Ship-of-opportunity based phycocyanin fluorescence monitoring of the filamentous cyanobacteria bloom dynamics in the Baltic Sea. Estuar. Coast. Shelf Sci. 2007, 73, 489–500. [Google Scholar] [CrossRef]
- Riha, S.; Krawczyk, H. Development of remote sensing algorithm for cyanobacterial phycocyanin pigment in the Baltic Sea using neural network approach. Proc. SPIE 2011, 8175. [Google Scholar] [CrossRef]
- Moore, T.S.; Dowell, M.D.; Franz, B.A. Detection of coccolithophore blooms in ocean color satellite imagery: A generalized approach for use with multiple sensors. Remote Sens. Environ. 2012, 117, 249–263. [Google Scholar] [CrossRef]
- Kahru, M.; Michell, B.G.; Diaz, A.; Miura, M. MODIS detects a devastating algal bloom in Paracas Bay, Peru. Eos Trans. Am. Geophys. Union 2004, 85, 465. [Google Scholar] [CrossRef]
- Craig, S.E.; Lohrenz, S.E.; Lee, Z.P.; Mahoney, K.L.; Kirkpatrick, G.J.; Schofield, O.M. Use of hyperspectral remote sensing reflectance for detection and assessment of the harmful alga, Karenia brevis. Appl. Opt. 2006, 45, 5414–5425. [Google Scholar] [CrossRef] [PubMed]
- O’Reilly, J.E.; Maritorena, S.; Mitchell, B.G.; Siegel, D.A.; Carder, K.L.; Garver, S.A. Ocean color chlorophyll algorithms for SeaWiFS. J. Geophys. Res. 1998, 103, 24937–24953. [Google Scholar] [CrossRef]
- Morel, A.; Prieur, L. Analysis of variations in ocean color. Limnol. Oceanogr. 1977, 22, 709–722. [Google Scholar] [CrossRef]
- Darecki, M.; Stramski, D. An evaluation of MODIS and SeaWiFS bio-optical algorithms in the Baltic Sea. Remote Sens. Environ. 2004, 89, 326–350. [Google Scholar] [CrossRef]
- Kotta, J.; Remm, K.; Vahtmäe, E.; Kutser, T.; Orav-Kotta, H. In-air spectral signatures of the Baltic Sea macrophytes and their statistical separability. J. Appl. Remote Sens. 2014, 8, 083634. [Google Scholar] [CrossRef]
- Darecki, M.; Weeks, A.; Sagan, S.; Kowalczuk, P.; Kaczmarek, S. Optical characteristic of two contrasting case 2 waters and their influence on remote sensing algorithms. Cont. Shelf Res. 2003, 23, 237–250. [Google Scholar] [CrossRef]
- Kowalczuk, P. The absorption of yellow substance in the Baltic Sea. Oceanologia 2002, 22, 287–288. [Google Scholar]
- Kahru, M.; Savchuk, O.; Elmgren, R. Satellite measurements of cyanobacterial bloom frequency in the Baltic Sea: interannual and spatial variability. Mar. Ecol. Prog. Ser. 2007, 343, 15–23. [Google Scholar] [CrossRef]
- Kahru, M.; Elmgren, R. Multidecadal time series of satellite-detected accumulations of cyanobacteria in the Baltic Sea. Biogeosciences 2014, 11, 3619–3633. [Google Scholar] [CrossRef]
- Kutser, T.; Metsamaa, L.; Strombeck, N.; Vahtmae, E. Monitoring cyanobacterial blooms by satellite remote sensing. Estuar. Coast. Shelf Sci. 2006, 67, 303–312. [Google Scholar] [CrossRef]
- Reinart, A.; Kutser, T. Comparison of different satellite sensors in detecting cyanobacterial bloom events in the Baltic Sea. Remote Sens. Environ. 2006, 102, 74–85. [Google Scholar] [CrossRef]
- Hunter, P.D.; Tyler, A.N.; Carvalho, L.; Codd, G.A.; Maberly, S.C. Hyperspectral remote sensing of cyanobacterial pigments as indicators for cell populations and toxins in eutrophic lakes. Remote Sens. Environ. 2010, 114, 2705–2718. [Google Scholar] [CrossRef]
- Woźniak, M. Identification of the Dominant Phytoplankton Groups in the Algal Blooms in the Waters of the Baltic Sea using Remote Sensing Methods. Ph.D. Thesis, University of Gdansk, Gdynia, Poland, 2014. [Google Scholar]
- Barale, V.; Gade, M. Remote Sensing of the European Seas; Springer: London, UK, 2008. [Google Scholar]
- Nowacki, J.; Jarosz, E. The hydrological and hydrochemical division of the surface waters in the Gulf of Gdańsk. Oceanologia 1998, 40, 261–272. [Google Scholar]
- Pliński, M.; Jóźwiak, T. Harmful and Toxic Algal Blooms; Yasumoto, T., Oshima, Y., Fukuyo, Y., Eds.; IOC UNESCO: Paris, France, 1996. [Google Scholar]
- Mazur-Marzec, H.; Krężel, A.; Kobos, J.; Pliński, M. Toxic Nodularia spumigena blooms in the coastal waters of the Gulf of Gdańsk: A ten-year survey. Oceanologia 2006, 48, 255–273. [Google Scholar]
- Błaszczyk, A.; Toruńska, A.; Kobos, J.; Browarczyk-Matusiak, G.; Mazur-Marzec, H. Ekologia toksycznych sinic. Zakwity sinic (cyjanobakterii). Kosmos 2010, 59, 173–198. [Google Scholar]
- Mueller, J.L.; Austin, R.W. Ocean Optics Protocols. NASA Tech Memo; NASA Goddard Space Flight Center: Greenbelt, ML, USA, 1992. [Google Scholar]
- Zibordi, G.; Darecki, M. Immersion factor for the RAMSES series of hyperspectral underwater radiometers. J. Opt. Pure Appl. Opt. 2006, 8, 252–258. [Google Scholar] [CrossRef]
- Campbell, J.W. The lognormal-distribution as a model for bio-optical variability in the sea. J. Geophys. Res. Oceans 1995, 100, 13237–13254. [Google Scholar] [CrossRef]
- Doerffer, R.; Schiller, H. MERIS Regional Coastal and Lake Case 2 Water Project Atmospheric Correction ATBD; GKSS Research Center: Geesthacht, Germany, 2008. [Google Scholar]
- Darecki, M.; Ficek, D.; Krężel, A.; Ostrowska, M.; Majchrowski, R.; Woźniak, S.B.; Bradtke, K.; Dera, J.; Woźniak, B. Algorithms for the remote sensing of the Baltic ecosystem (DESAMBEM). Part 2: Empirical validation. Oceanologia 2008, 50, 509–538. [Google Scholar]
- Woźniak, B.; Krężel, A.; Darecki, M.; Woźniak, S.B.; Majchrowski, R.; Ostrowska, M.; Kozłowski, L.; Ficek, D.; Olszewski, J.; Dera, J. Algorithms for the remote sensing of the Baltic ecosystem (DESAMBEM). Part 1: Mathematical apparatus. Oceanologia 2008, 50, 451–508. [Google Scholar]
- Woźniak, M.; Bradtke, K.M.; Krężel, A. Comparison of satellite chlorophyll a algorithms for the Baltic Sea. J. Appl. Remote Sens. 2014, 8. [Google Scholar] [CrossRef]
- Campbell, J.W.; Anotine, D.; Armstrong, R.; Arrigo, K.; Balch, W.; Barber, R. Comparison of algorithms for estimating ocean primary production from surface chlorophyll, temperature, and irradiance. Glob. Biogeochem. Cycles 2002, 16. [Google Scholar] [CrossRef]
- Friedrichs, M.A.M.; Carr, M.-E.; Barber, R.T.; Scardi, M.; Antoine, D.; Armstrong, R.A. Assessing the uncertainties of model estimates of primary productivity in the tropical Pacific Ocean. J. Mar. Syst. 2009, 76, 113–133. [Google Scholar] [CrossRef]
- Schalles, J.F.; Yacobi, Y.Z. Remote detection and seasonal patterns of phycocyanin, carotenoid, and clorophyll pigments in eutrophic waters. Arch. Hydrobiol. 2000, 55, 153–168. [Google Scholar]
- Mishra, S. Remote Sensing of Harmful Algal Bloom. Ph.D. Thesis, Mississippi State University, Mississippi State, MS, USA, 2012. [Google Scholar]
- Berthon, J.-F.; Melin, F.; Zibordi, G. Ocean colour remote sensing of the optically complex European seas. In Remote Sensing of the European Seas; Barale, V., Gade, M., Eds.; Springer: Dordrecht, The Netherlands, 2008; pp. 35–52. [Google Scholar]
- Kowalczuk, P.; Olszewski, J.; Darecki, M.; Kaczmarek, S. Empirical relationships between Coloured Dissolved Organic Matter (CDOM) absorption and apparent optical properties in Baltic Sea waters. Int. J. Remote Sens. 2005, 26, 345–370. [Google Scholar]
- Roy, S.; Llewellyn, C.A.; Skarstad-Egeland, E.; Johnsen, G. Phytoplankton Pigments Characterization, Chemotaxonomy and Applications in Oceanography; Cambridge Environmental Chemistry Series: New York, NY, USA, 2011. [Google Scholar]
- Fleming-Lehtinen, V.; Laamanen, M. Long-term changes in Secchi depth and the role of phytoplankton in explaining light attenuation in the Baltic Sea. Estuar. Coast. Shelf Sci. 2012, 102–103, 1–10. [Google Scholar] [CrossRef]
- Hansson, M. Cyanobacterial blooms in the Baltic Sea; SMHI: Norrköping, Sweden, 2005. [Google Scholar]
- Raateoja, M.; Hällfors, S.; Rantajärvi, E. Phytoplankton Biomass and Species Succession in the Gulf of Finland, Northern Baltic Proper and Arkona Basin in 2004; FIMR: Helsinki, Finland, 2004. [Google Scholar]


| Parameter | Min. | Q25% | Q50% | Q75% | Max. |
|---|---|---|---|---|---|
| Secchi depth (m) | 1.5 | 3.0 | 3.5 | 4.5 | 7.0 |
| aCDOM(400 nm) (m-1) | 0.72 | 0.83 | 1.05 | 1.42 | 2.1 |
| PC (mg·m−3) | 0.05 | 0.5 | 0.84 | 3.00 | 18.95 |
| chl-a (mg·m−3) | 0.93 | 2.87 | 4.60 | 8.73 | 30.91 |
| PC/chl−a (-) | 0.02 | 0.12 | 0.20 | 0.37 | 0.73 |
| phytoplankton biomass (µg·dm−3) | 30 | 495 | 1118 | 2831 | 8928 |
| cyanobacteria biomass content (%) | 0.5 | 17.8 | 37.7 | 68.9 | 95.4 |
| phytoplankton cells number (×103·dm−3) | 119 | 1429 | 5929 | 10704 | 19165 |
| cyanobacteria cells content(%) | 0.1 | 15.4 | 40.6 | 69.5 | 89.4 |
| Model Symbol | Proposed Predictor XREF | Reference |
|---|---|---|
| SY00 | Rrs(650)/Rrs(625) | Schalles and Yacobi 2000 [47] |
| DA93 | 0.5·(Rrs(600) + Rrs(648)) − Rrs(624) | Dekker 1993 [15] |
| MM09 | Rrs(700)/Rrs(600) | Mishra et al. 2009 [11] |
| MS12 | Rrs(709)/Rrs(600) | Mishra 2012 [48] |
| HP10 | (Rrs−1(615) − Rrs−1(600))·Rrs(725) | Hunter et al. 2010 [31] |
| SP05 | Rrs(709)/Rrs(620) | Simis et al. 2005 [13] |
| No. | Band Ratio Rrs(λi)/Rrs(λj) | Coefficients | R2 | RMSE | MPD (%) | |
|---|---|---|---|---|---|---|
| k | l | |||||
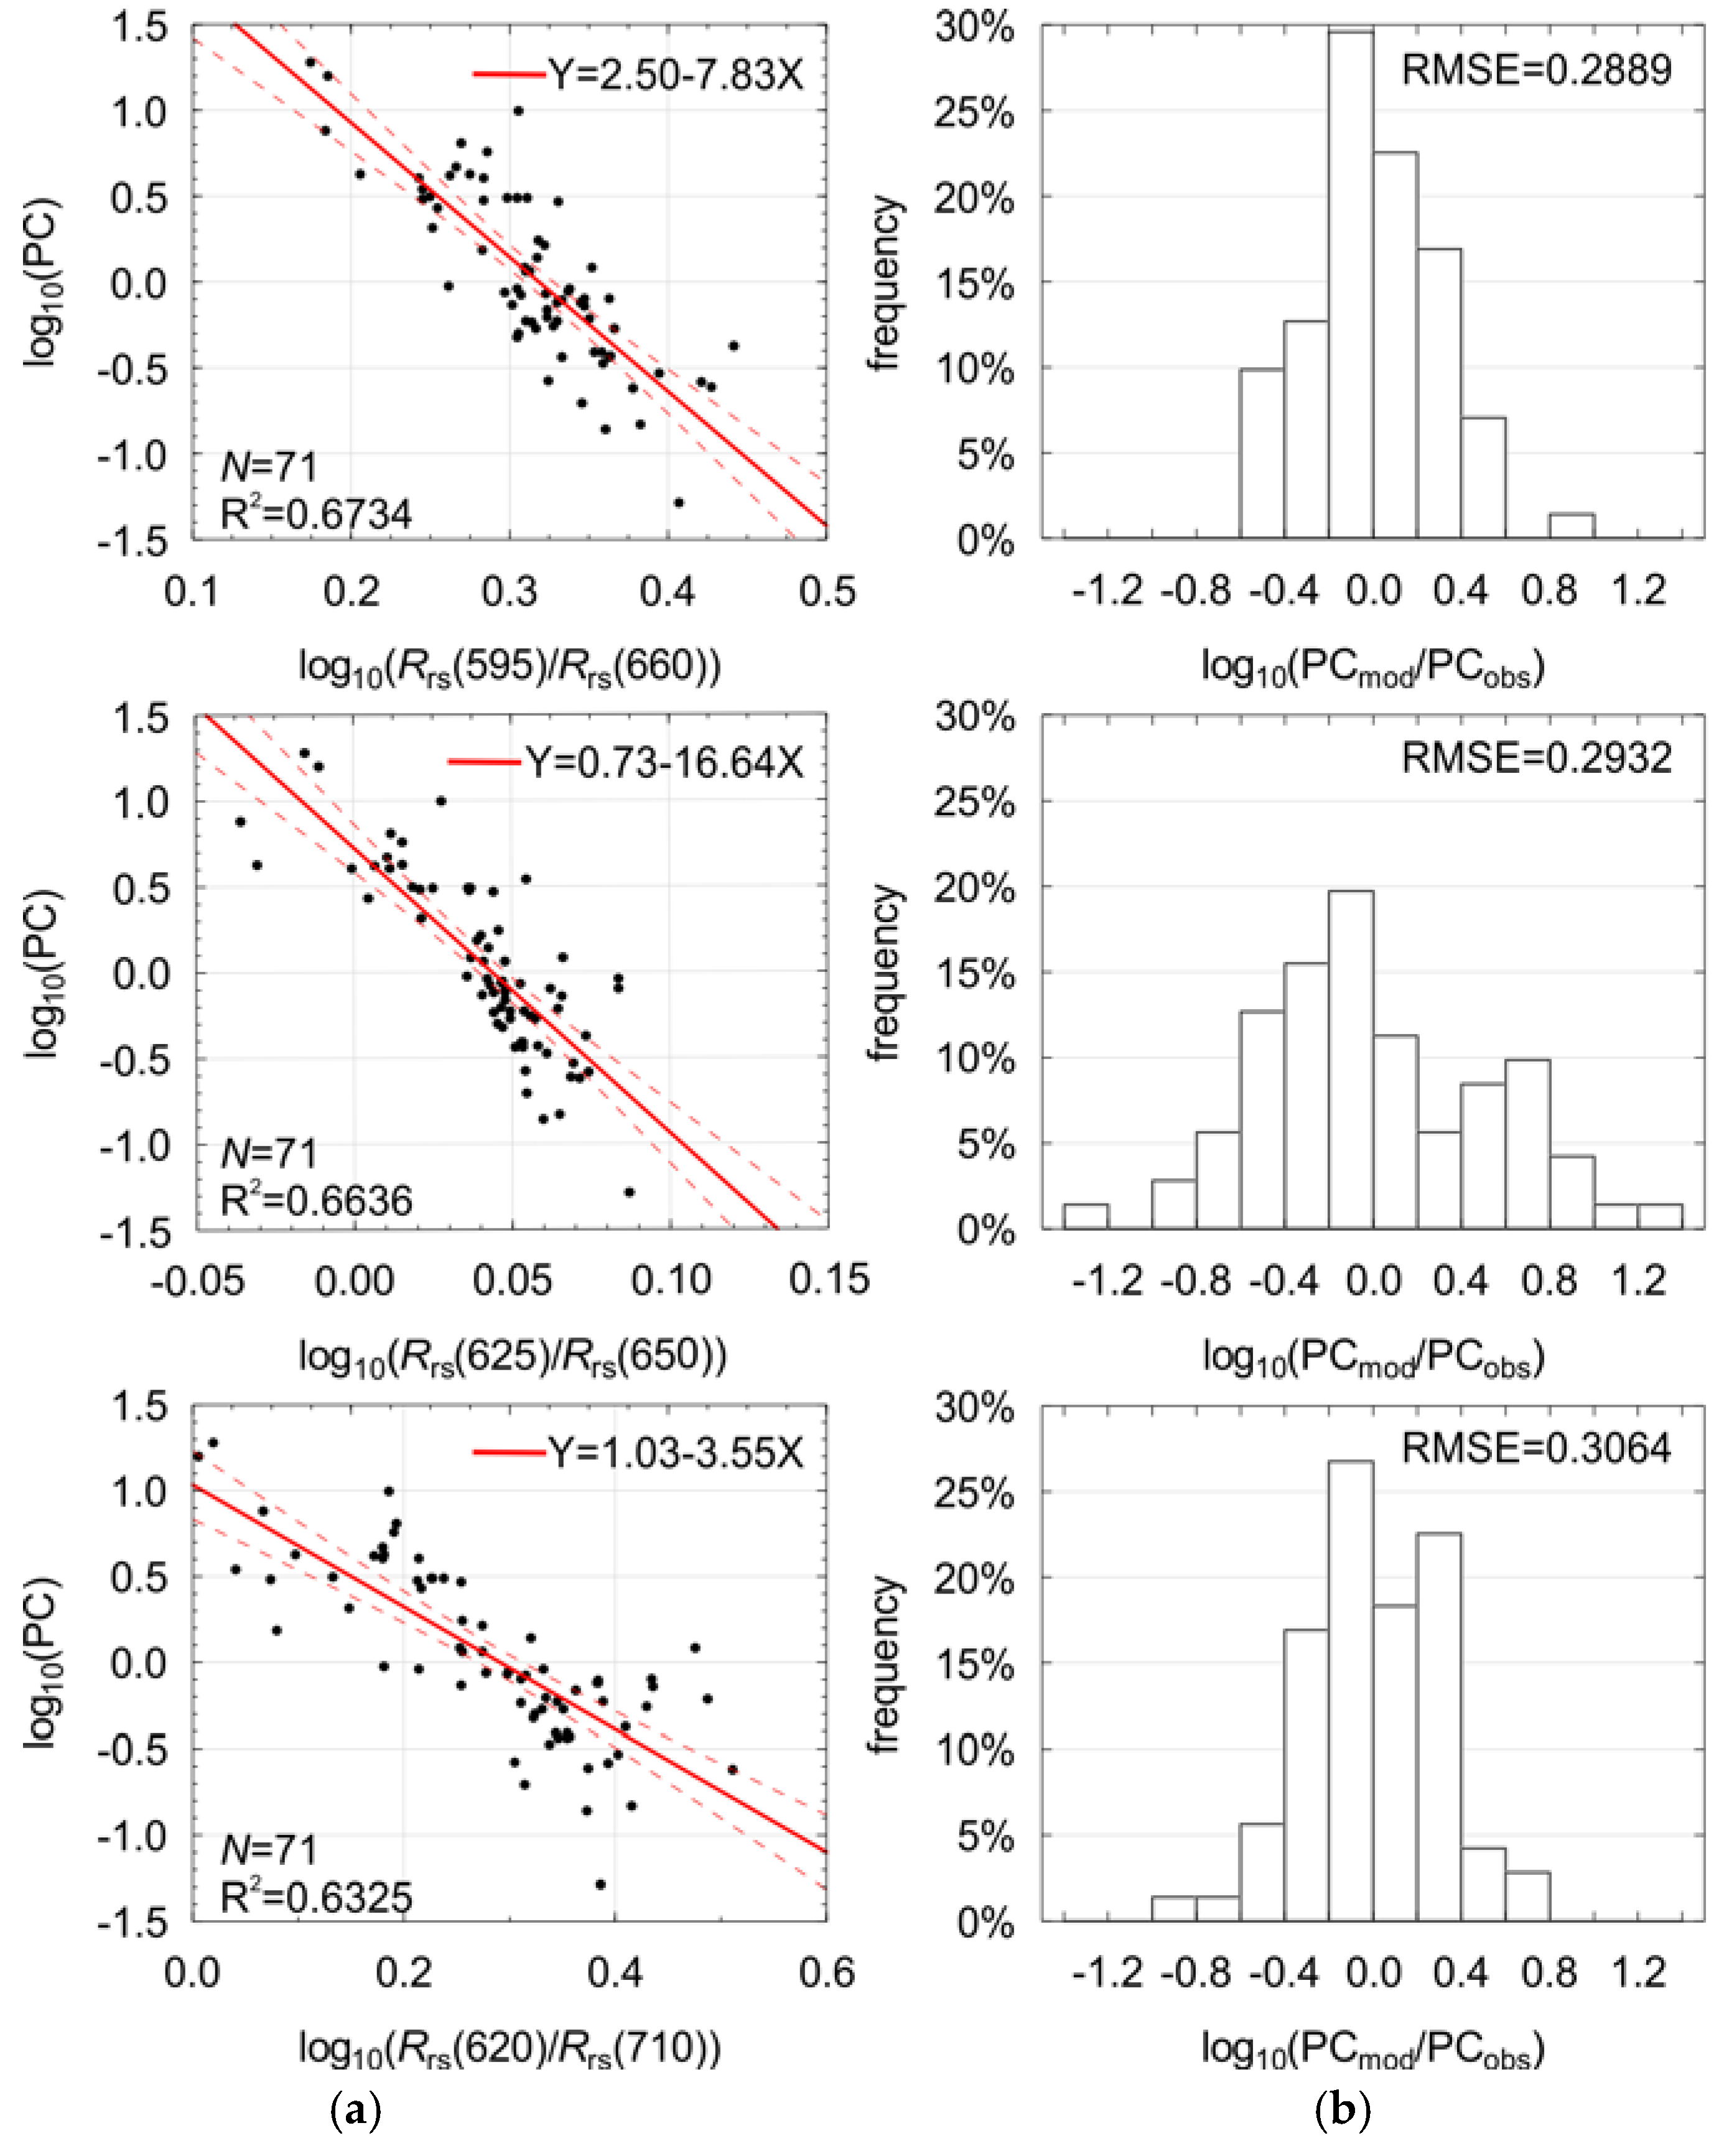
| #1 | Rrs(595)/Rrs(660) | 2.4952 | −7.8331 | 0.6734 | 0.2889 | 59 |
| #2 | Rrs(625)/Rrs(645) | 0.7659 | −20.5767 | 0.6728 | 0.2891 | 42 |
| #3 | Rrs(660)/Rrs(600) | 2.4564 | 8.9935 | 0.6699 | 0.2904 | 46 |
| #4 | Rrs(625)/Rrs(650) | 0.7263 | −16.6351 | 0.6636 | 0.2932 | 42 |
| #5 | Rrs(630)/Rrs(645) | 0.6032 | −21.6371 | 0.6597 | 0.2949 | 41 |
| #6 | Rrs(600)/Rrs(655) | 2.1574 | −8.9421 | 0.6581 | 0.2956 | 49 |
| #7 | Rrs(660)/Rrs(590) | 2.4100 | 6.0379 | 0.6418 | 0.3032 | 40 |
| #8 | Rrs(610)/Rrs(710) | 1.1968 | −3.5895 | 0.6342 | 0.3057 | 43 |
| #9 | Rrs(615)/Rrs(710) | 1.0850 | −3.5850 | 0.6349 | 0.3055 | 45 |
| #10 | Rrs(620)/Rrs(710) | 1.0330 | −3.5534 | 0.6330 | 0.3064 | 45 |
| #1 | #2 | #3 | #4 | #5 | #6 | #7 | #8 | #9 | #10 | |
|---|---|---|---|---|---|---|---|---|---|---|
| #1 | 1.00 | 0.91 | −0.99 | 0.88 | 0.89 | 0.99 | −0.98 | 0.86 | 0.86 | 0.85 |
| #2 | 1.00 | −0.94 | 0.99 | 0.99 | 0.93 | −0.85 | 0.77 | 0.77 | 0.77 | |
| #3 | 1.00 | −0.92 | −0.93 | −0.99 | 0.96 | −0.82 | −0.81 | −0.81 | ||
| #4 | 1.00 | 0.99 | 0.90 | −0.82 | 0.77 | 0.77 | 0.77 | |||
| #5 | 1.00 | 0.92 | −0.84 | 0.77 | 0.77 | 0.77 | ||||
| #6 | 1.00 | −0.97 | 0.84 | 0.84 | 0.83 | |||||
| #7 | 1.00 | −0.88 | −0.88 | −0.87 | ||||||
| #8 | 1.00 | 1.00 | 0.99 | |||||||
| #9 | 1.00 | 1.00 | ||||||||
| #10 | 1.00 |
| Factors | Partial Correlation | Coefficients | Standard Error | Significance p−value | |
|---|---|---|---|---|---|
| three-term model (PC3term) | intercept | k = 1.39 | 0.34 | 0.0001 | |
| −0.15 | l1 = −1.97 | 1.55 | 0.2095 | ||
| l1*= −0.21 | 0.16 | ||||
| −0.32 | l2 = −7.75 | 2.75 | 0.0064 | ||
| l2*= −0.38 | 0.13 | ||||
| −0.32 | l3 = −1.46 | 0.53 | 0.0075 | ||
| l3*= −0.33 | 0.12 | ||||
| two-term model (PChyp) | intercept | k = 0.98 | 0.09 | <<0.0001 | |
| −0.52 | l1 = −10.14 | 2.01 | <<0.0001 | ||
| l1*= −0.50 | 0.10 | ||||
| −0.45 | l2 = −1.84 | 0.44 | <<0.0001 | ||
| l2*= −0.35 | 0.10 |
| Factors | Partial Correlation | Coefficients | Standard Error | Significance p−level |
|---|---|---|---|---|
| intercept | − | k= 1.71 | 0.17 | <<0.0001 |
| −0.48 | l1= −5.47 | 1.23 | <<0.0001 | |
| l1*= −0.35 | 0.08 | |||
| −0.68 | l2= −3.13 l2*= −0.60 | 0.41 0.08 | <<0.0001 |
| Model | Cross-Validation | |||||||
|---|---|---|---|---|---|---|---|---|
| Coefficients | R2 | RMSE | Bias | |||||
| Mean | SD | Mean | SD | Mean | SD | Mean | SD | |
| PChyp | k = 0.98 l1 = −10.27 l2 = −1.82 | ±0.05 ±1.35 ±0.25 | 0.73 | ±0.11 | 0.27 | ±0.05 | −5 × 10⁻⁴ | ±0.08 |
| PCOLCI | k = 1.72 l1 = −5.56 l2 = −3.11 | ±0.11 ±0.81 ±0.22 | 0.69 | ±0.13 | 0.29 | ±0.05 | −2 × 10⁻³ | ±0.08 |
| #1 | #2 | #3 | #4 | #5 | RMSE | bias | |
|---|---|---|---|---|---|---|---|
| Measured Values: | |||||||
| PC in situ | 0.42 | 1.51 | 3.46 | 3.01 | 3.09 | − | |
| chl−ain situ | 22.27 | 20.01 | 30.91 | 26.55 | 24.85 | − | |
| Estimated Values: | |||||||
| PChyp (Equation (10)) | 0.30 | 2.71 | 2.22 | 4.25 | 3.50 | 0.17 | 0.02 |
| PCOLCI (Equation (11)) | 0.27 | 2.80 | 2.36 | 3.32 | 2.49 | 0.17 | -0.03 |
| PC (Equation (12)) | 4.44 | 3.99 | 6.19 | 5.31 | 4.97 | 0.53 | 0.43 |
© 2016 by the authors; licensee MDPI, Basel, Switzerland. This article is an open access article distributed under the terms and conditions of the Creative Commons by Attribution (CC-BY) license (http://creativecommons.org/licenses/by/4.0/).
Share and Cite
Woźniak, M.; Bradtke, K.M.; Darecki, M.; Krężel, A. Empirical Model for Phycocyanin Concentration Estimation as an Indicator of Cyanobacterial Bloom in the Optically Complex Coastal Waters of the Baltic Sea. Remote Sens. 2016, 8, 212. https://doi.org/10.3390/rs8030212
Woźniak M, Bradtke KM, Darecki M, Krężel A. Empirical Model for Phycocyanin Concentration Estimation as an Indicator of Cyanobacterial Bloom in the Optically Complex Coastal Waters of the Baltic Sea. Remote Sensing. 2016; 8(3):212. https://doi.org/10.3390/rs8030212
Chicago/Turabian StyleWoźniak, Monika, Katarzyna M. Bradtke, Miroslaw Darecki, and Adam Krężel. 2016. "Empirical Model for Phycocyanin Concentration Estimation as an Indicator of Cyanobacterial Bloom in the Optically Complex Coastal Waters of the Baltic Sea" Remote Sensing 8, no. 3: 212. https://doi.org/10.3390/rs8030212
APA StyleWoźniak, M., Bradtke, K. M., Darecki, M., & Krężel, A. (2016). Empirical Model for Phycocyanin Concentration Estimation as an Indicator of Cyanobacterial Bloom in the Optically Complex Coastal Waters of the Baltic Sea. Remote Sensing, 8(3), 212. https://doi.org/10.3390/rs8030212


