Operational Surface Water Detection and Monitoring Using Radarsat 2
Abstract
:1. Introduction
2. Materials
2.1. Study Area and Data
2.2. Water Extents Dynamics of Prairie Potholes
- Potholes change very rapidly, especially in early spring (from May to beginning of June), then they become more stable—i.e., the aerial extent of open water does not change significantly afterwards.
- The size of a pothole is not linked to its stability: inter-annual analysis showed that although the smaller potholes tend to disappear more rapidly (or become fully vegetated), large ones also could disappear (or be completely covered by vegetation) in less than 2 weeks.
- They have predictable locations. Over a 14 year period, potholes change the amount of water stored (they could shrink or expand) but for the most part, they’re always in the same location.
2.3. Image Acquisition and Parameters
3. Methods
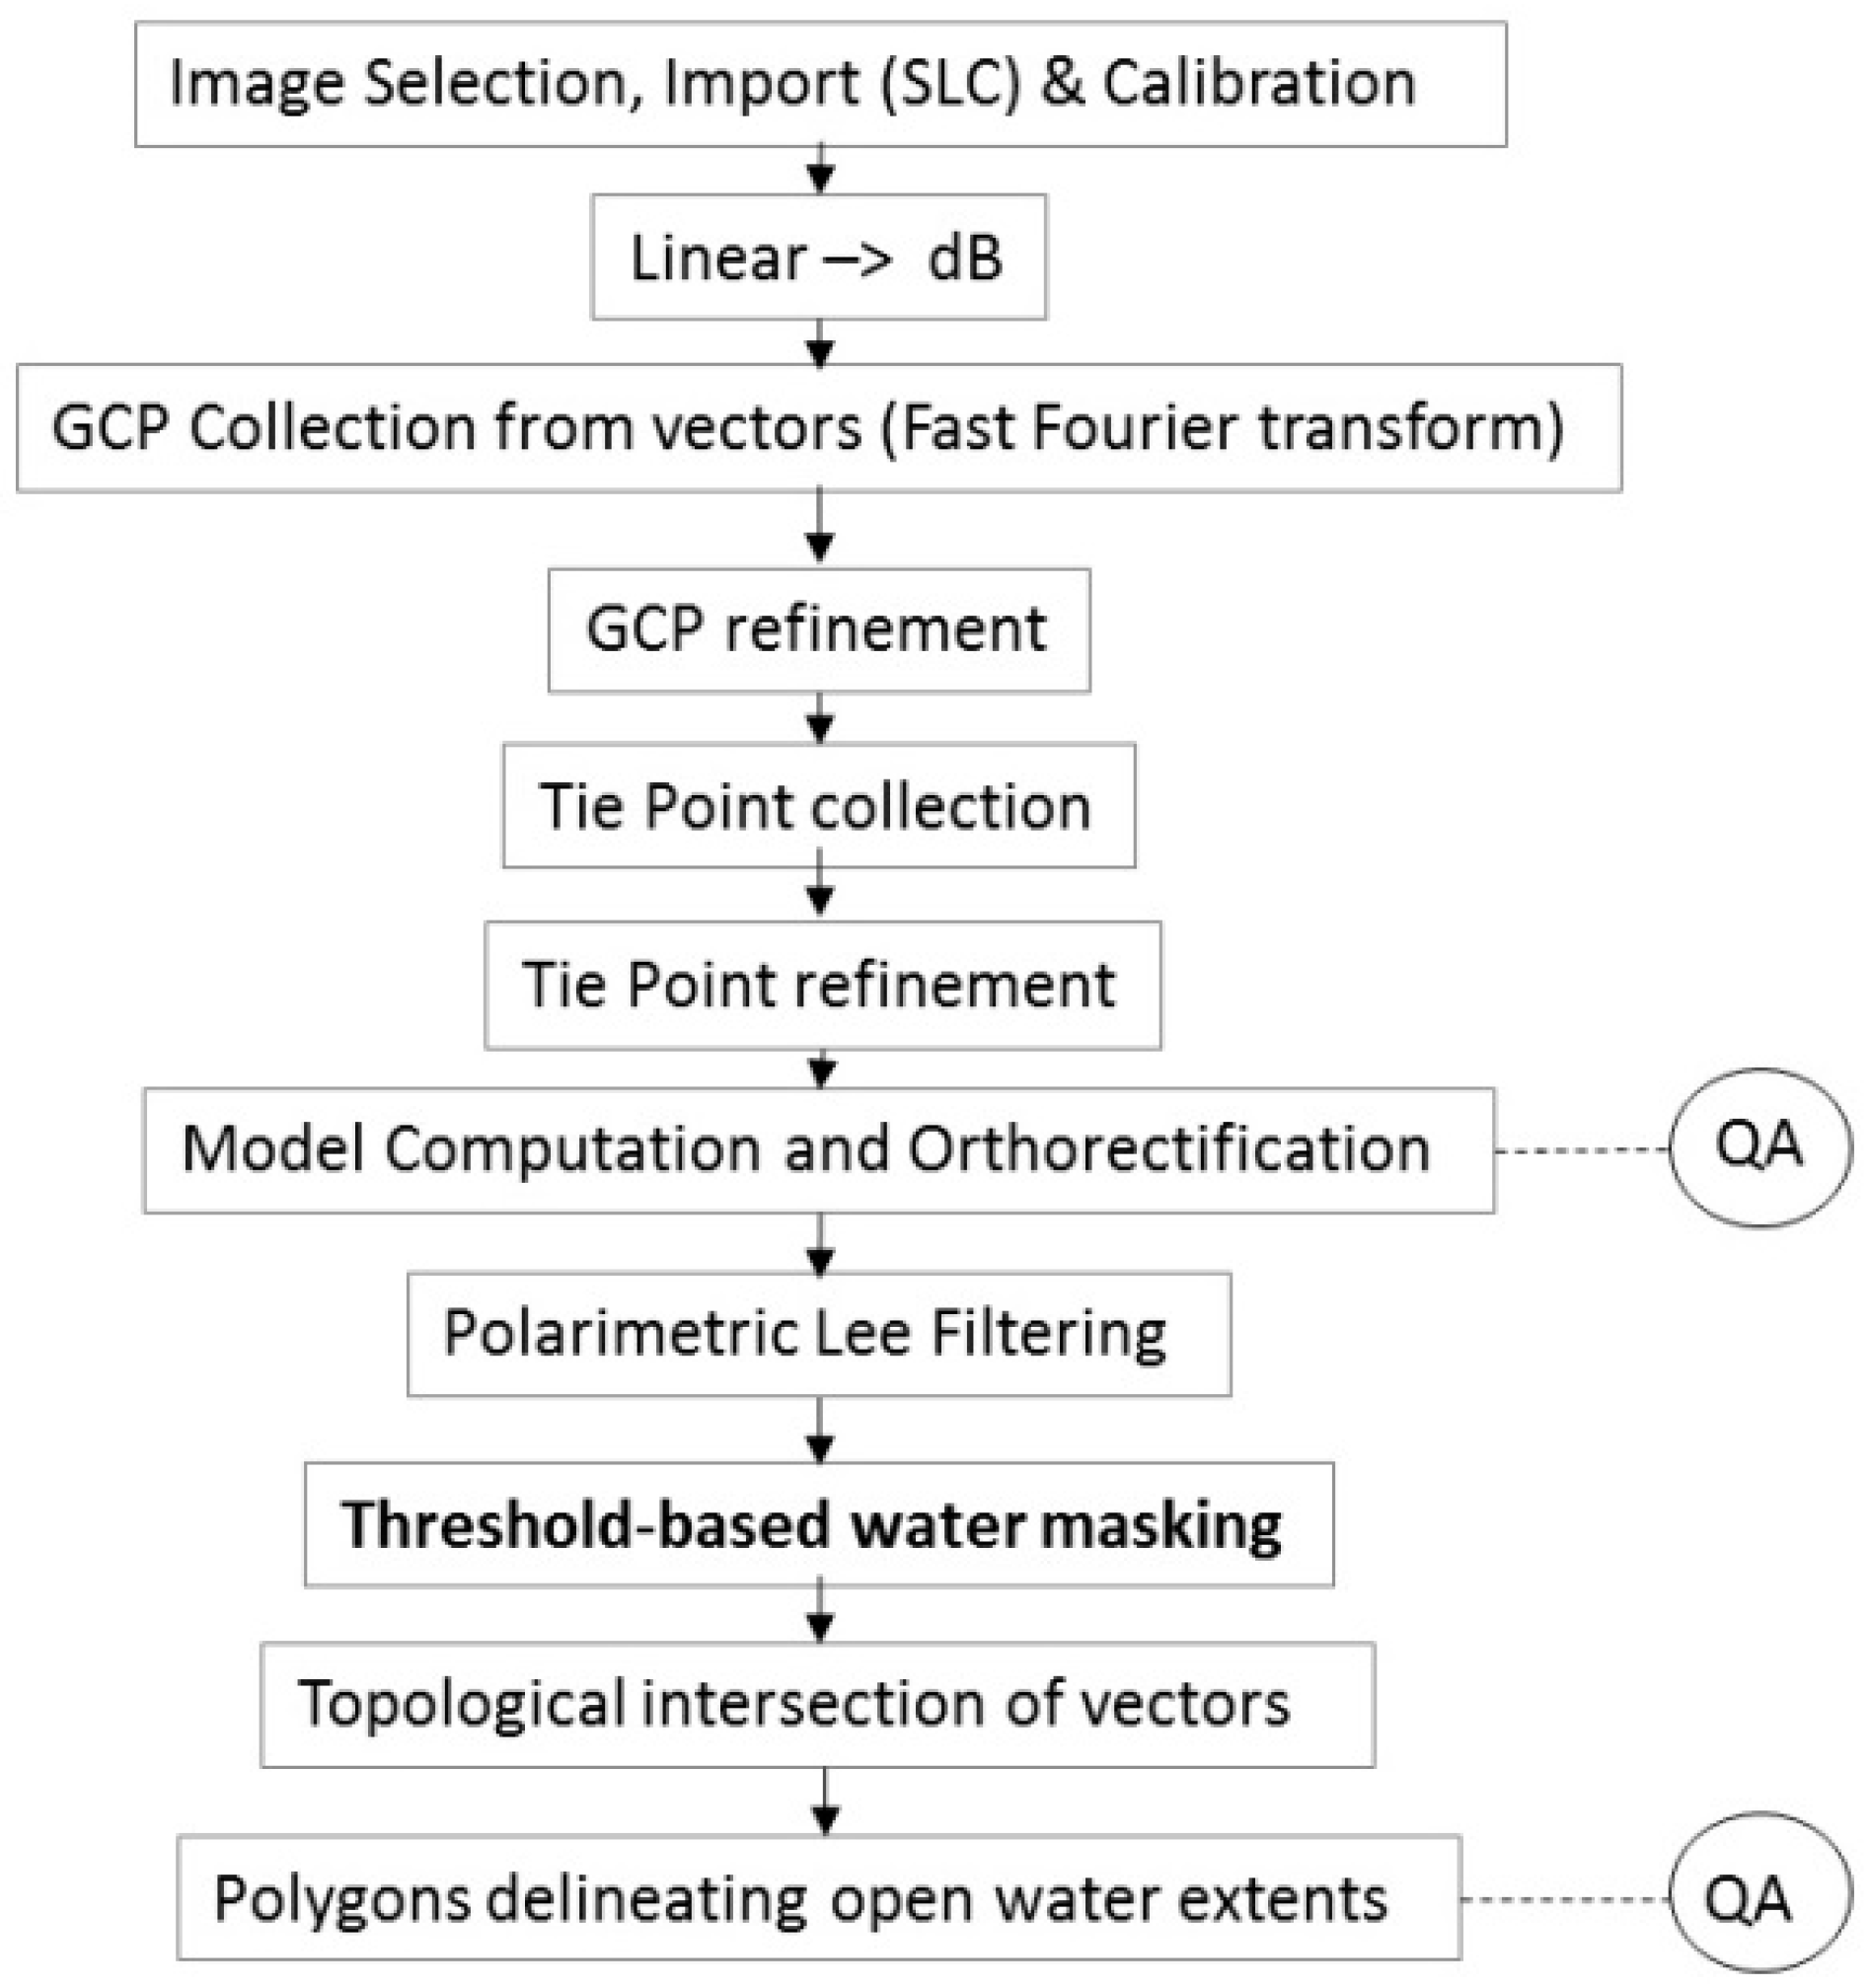
3.1. Image Preparation
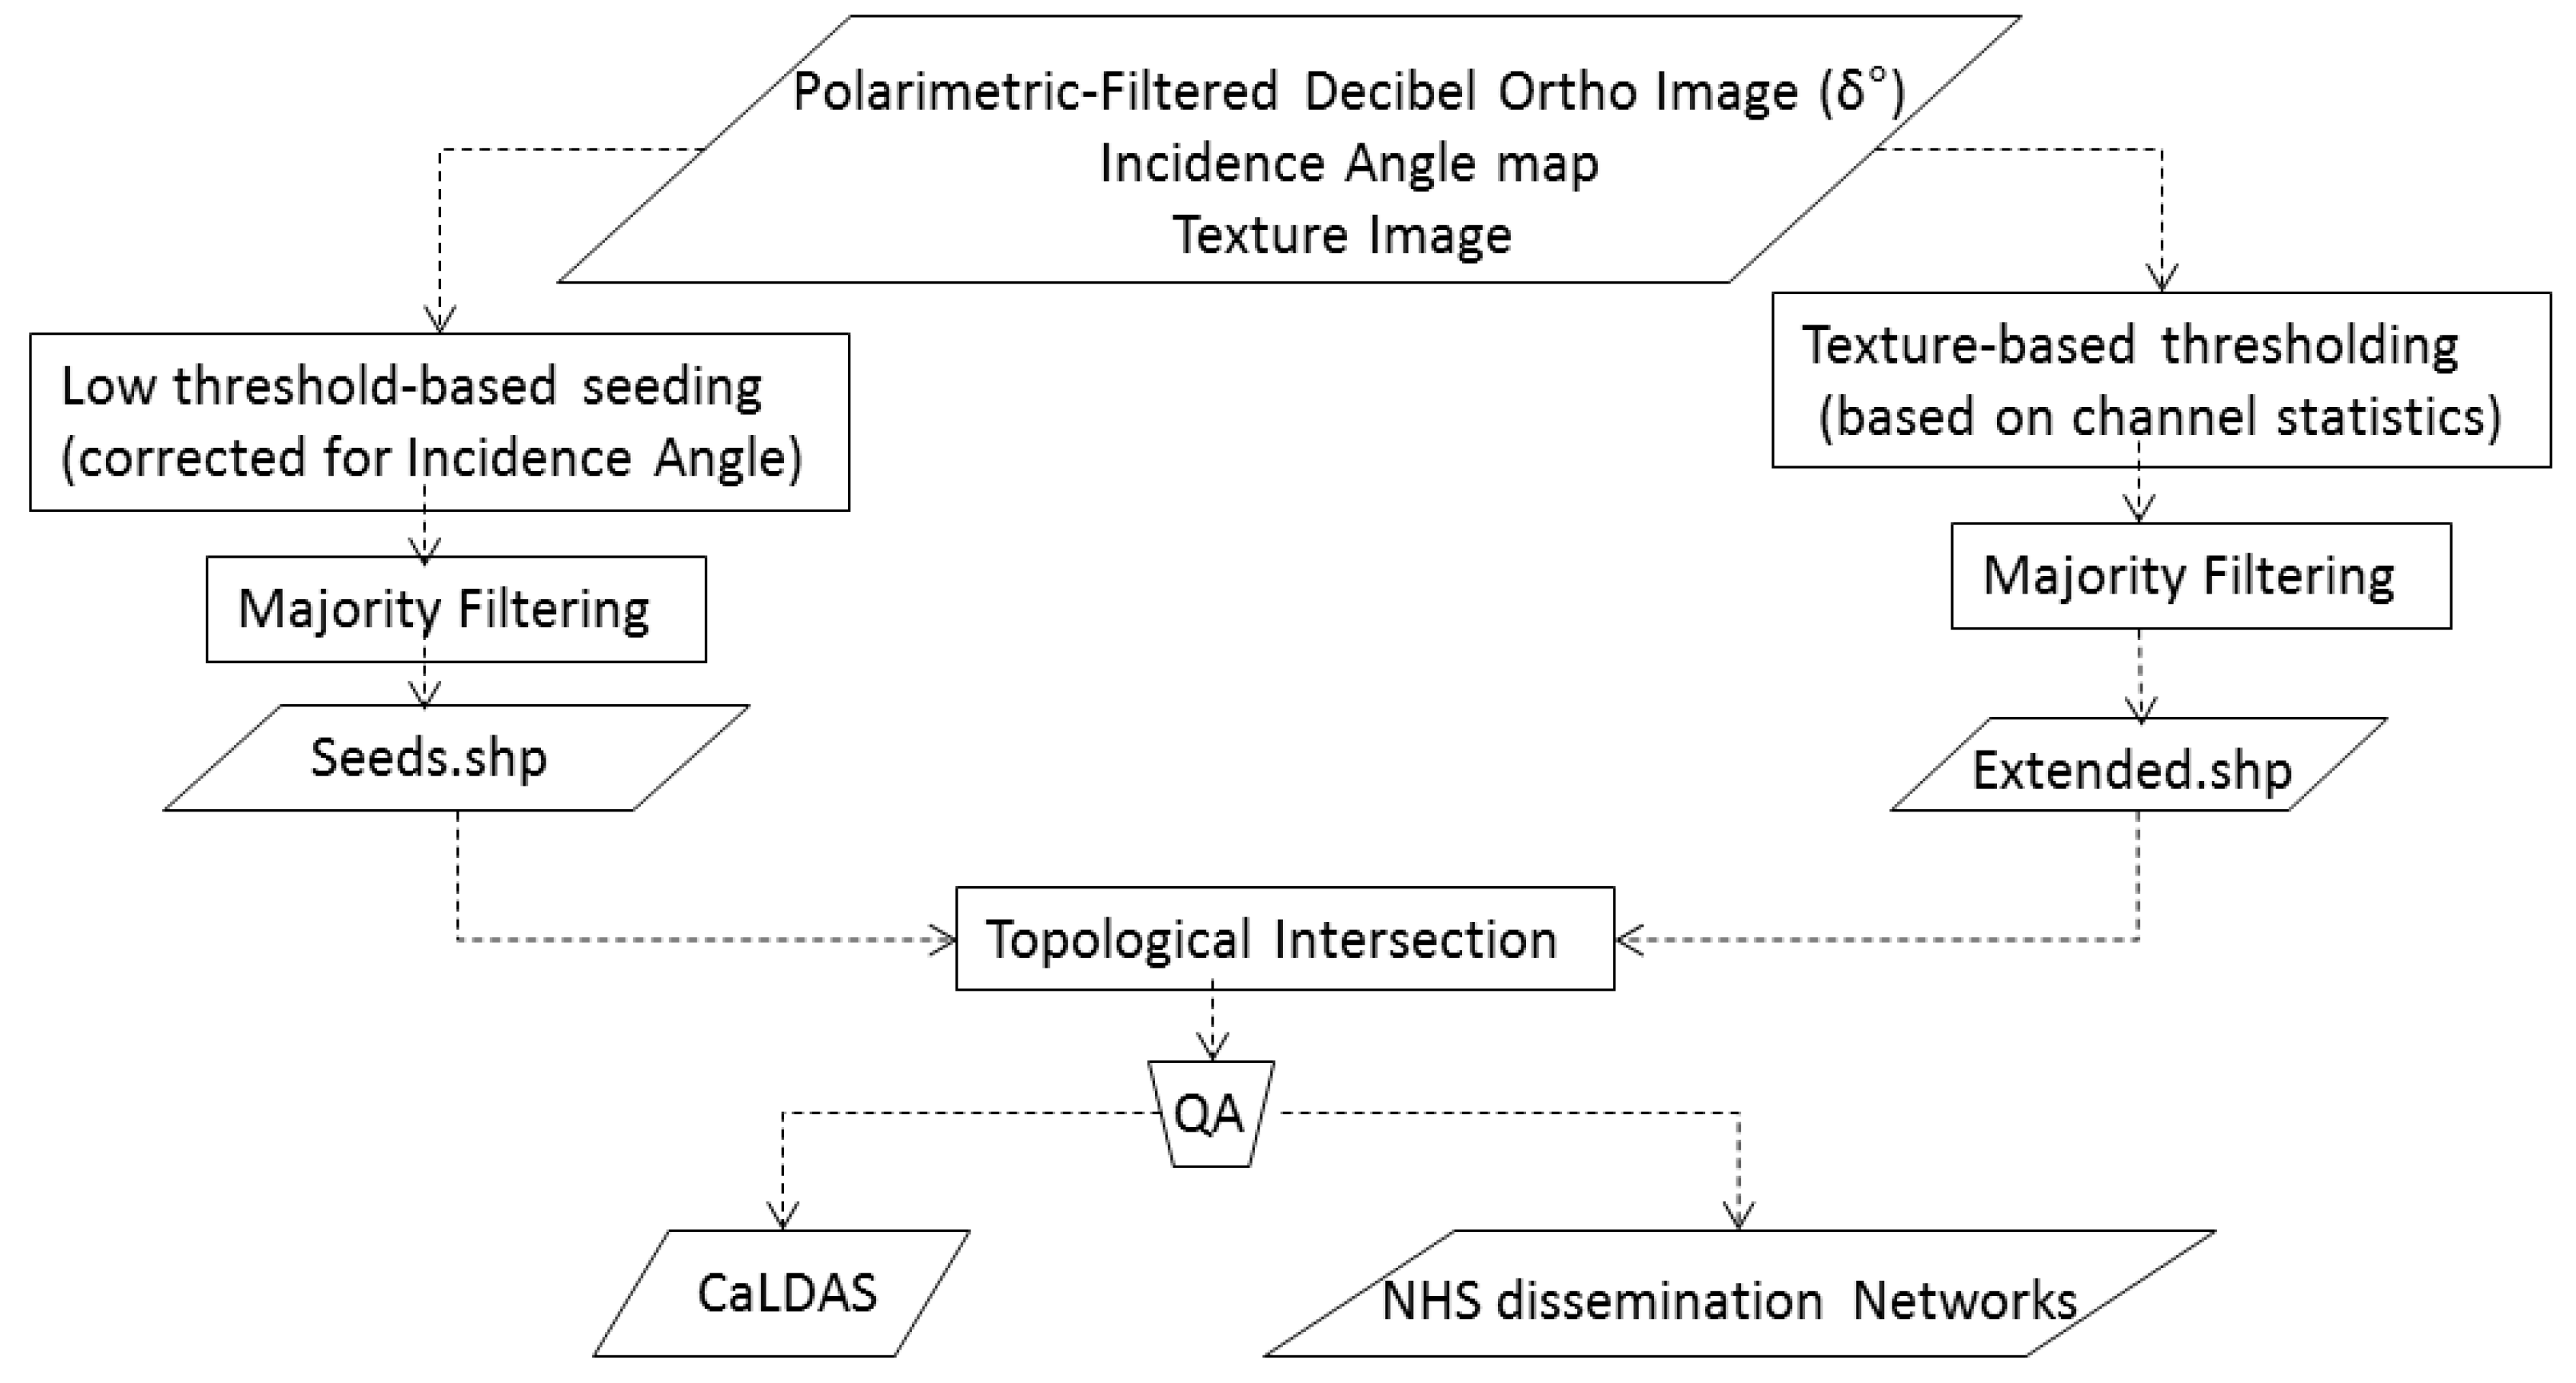
3.2. Thresholding
3.3. Topological Intersection
4. Results
- Pair 1: WV2 and F0W3 (0.5 m and 8 m resolution respectively). Surface water polygons were derived from a cloud-free orthorectified and pan-sharpened WorldView2 (WV2) image taken on 12 May 2014 over the east side of the city of Red Deer and with a coverage 116 km long by 20 km wide. The polygons delineating open water were produced by thresholding of the near and short-wave infrared bands and manually edited. The resulting polygons were compared against the ones derived from a Wide Fine (F0W3) scene taken 1 day before (i.e., 11 May 2014) and fully containing the WorldView-2 scene. The area covered by the optical image is cropland, which hydrological features are rivers, potholes and many shallow drainage flows that can be perceived mainly in sub-meter optical imagery, but are still considered surface water.
- Pair 2: WV2 and U76: (0.5 m and 2 m resolution respectively). Another WorldView-2 image taken on 10 May 2015 over an area 10 km west of the city of Schuler, Alberta was employed to derive water polygons using the same thresholding and manual editing procedure described above. The resulting polygons were compared against water polygons derived from an Ultra-Fine image (U76) taken 6 days after. The landscape in this area is mainly characterized by flooded vegetation.
- Pair3: RapidEye and FQ19 (5 m and 7 m resolution respectively). A RapidEye (RE) Image from 8 September 2012 over Elk Island National Pak in Alberta was employed to derive water polygons using thresholding and manual editing. The resulting polygons were compared against the water polygons obtained from a fully overlapping Fine Quad image (FQ19) taken the same day. Surface water in this area is mainly composed of open water bodies larger than 1 ha.
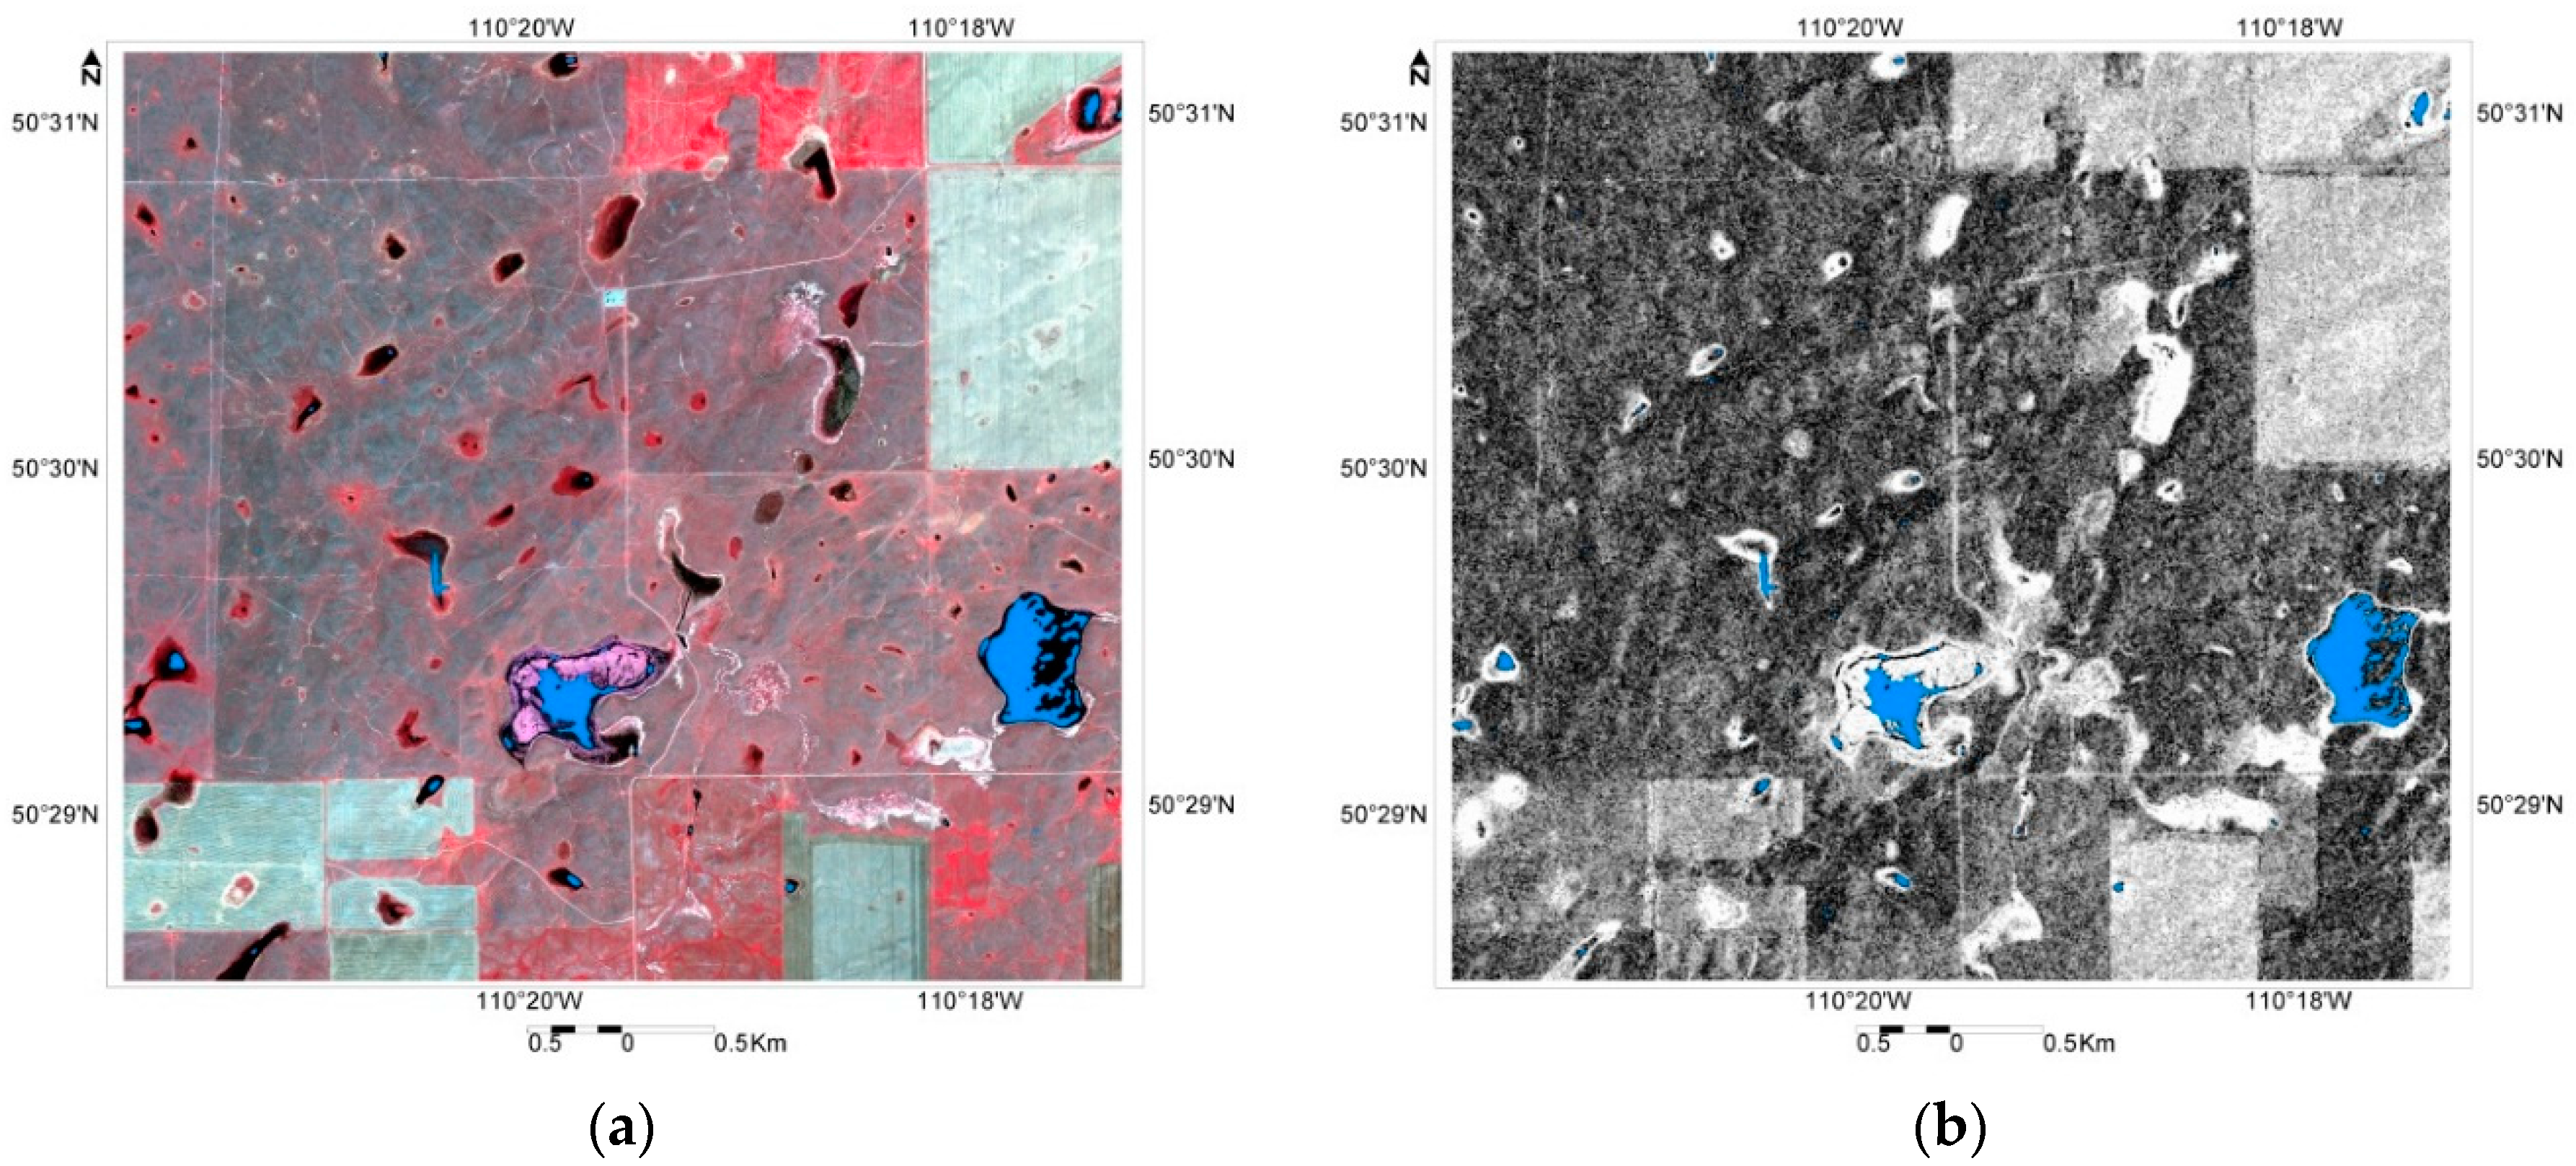
- Our procedure fails to map open water bodies smaller than 1 ha when applied to Wide Fine mode. For the first paired optical-SAR dataset evaluated (Table 1), small water bodies were mostly missed by the algorithm. Also, the cumulative area contained in polygons smaller than 2 ha contributed to 52% of total surface water area in this particular AOI, which explains why the accuracy of polygons extracted from the SAR image drops significantly for this beam mode—see Figure 6.
- The quantification of the area on large water features were missed from Wide Fine mode due to fragmentation. This occurs due to discontinuity of polygons delineating water edges, when vegetation patches occur at the edges (e.g., riparian forest)—see Figure 7. On the other hand, two big water polygons that are seen as separate entities in the RapidEye image can be joined together and form one in the SAR image, due to the missing separation by small low vegetation patches (which are visible on the RapidEye image)—this changed the distribution of the area contribution for the water polygons derived from Fine Quad between 2 ha and 0.5 km2 (Table 3).
- As expected, the algorithm also fails to detect flooded vegetation: a closer look at the polygons missed from the Ultra-Fine image vs. the polygons obtained from WolrdView 2 of the same time period showed that many polygons were larger than 1 ha and could have been seen in the Ultra-Fine image due its fine resolution, but were missed because of their high backscatter, which is characteristic of vegetation—see Figure 8 and Table 2.
- Fine mode imagery seems to provide the best results, as it quantified 88% of the total surface water area and picked up 97% of the total number of polygons larger than 1 ha when compared to polygons obtained from RapidEye (Table 3).
- Some water polygons that are selected by the algorithm from the SAR image are not shown as discernible open water bodies in the optical image (especially when the optical image pixels size is 5 m or more). They could be seen as false positives, but considering that SAR is more sensitive than optical imagery to water content, these areas could also be areas of low vegetation (where the vegetation cover is not high enough to influence backscatter but its chlorophyll content does influence reflectance) with particularly high water content—higher than its surroundings.
5. Discussion
6. Conclusions
Supplementary Materials
Acknowledgments
Author Contributions
Conflicts of Interest
Abbreviations
| RCM | Radarsat Constellation Mission |
| DN | Digital Number |
| DB | decibels |
| RMSE | Root Mean Square Error |
| GCPs | Ground Control Points |
| RPC | Rational Polynomial Coefficients |
| GIS | Geographic Information System |
| AOI | Area Of Interest |
| SAR | Synthetic Aperture Radar |
| QA | Quality Analysis |
| NESZ | Noise Equivalent Sigma Zero |
| BAQ | Block Adaptive Quantization |
| NIR | Near-Infrared |
| Km | kilometers |
| RE | RapidEye imagery |
| WV2 | WorldView-2 imagery |
| RGB | Red, Green, Blue guns used for visual display |
| UAV | Unmanned Aerial Vehicle |
| LiDAR | Light Detection and Ranging |
References
- Canadian Space Agency. 2014 Report on Plans and Priorities. Available online: http://www.asc-csa.gc.ca/eng/publications/pr-2014-highlights.asp (accessed on 24 November 2015).
- Pietroniro, A. Terrestrial Hydrology: Storage and Discharge of Water on Land: SWOT Hydrology for Canada. In Proceedings of the 4th SWOT Science Definition Team Meeting, Toulouse, France, 17–20 June 2014.
- Brisco, B.; Touzi, R.; Van der Sanden, J.; Charbonneau, F.; Pultz, T.J.; D’Iorio, M. Water resource applications with RADARSAT-2 a preview. Int. J. Digit. Earth 2008, 1, 130–147. [Google Scholar] [CrossRef]
- Wessels, J. Water extents mapping. In Proceedings of the LiDAR/SAR Wetlands and water monitoring workshop, Lethbridge, AB, Canada, 26–27 June 2014.
- Brisco, B.; Short, N.; van der Sanden, J.; Landry, R.; Raymond, D. A semi-automated tool for surface water mapping with RADARSAT-1. Can. J. Remote Sens. 2009, 35, 336–344. [Google Scholar] [CrossRef]
- White, L.; Brisco, B.; Pregitzer, M.; Tedford, B.; Boychuk, L. RADARSAT-2 Beam Mode Selection for Surface Water and Flooded Vegetation Mapping. Can. J. Remote Sens. 2014, 40, 135–151. [Google Scholar]
- Li, J.; Wang, S. An automated method for mapping inland surface waterbodies with Radarsat-2 imagery. Int. J. Remote Sens. 2015, 36, 1367–1384. [Google Scholar] [CrossRef]
- Westerhoff, R.S.; Kleuskens, M.P.H.; Winsemius, H.C.; Huizinga, H.J.; Brakenridge, G.R.; Bishop, C. Automated global water mapping based on wide-swath orbital synthetic-aperture radar. Hydrol. Earth Syst. Sci. 2013, 17, 651–663. [Google Scholar] [CrossRef]
- Töyrä, J.; Pietroniro, A. Towards operational monitoring of a northern wetland using geomatics-based techniques. Remote Sens. Environ. 2005, 97, 174–191. [Google Scholar] [CrossRef]
- Touzi, R. Wetland characterization using polarimetric RADARSAT-2 capability. In Proceedings of the IEEE International Conference on Geoscience and Remote Sensing Symposium (IGARSS 2006), Denver, CO, USA, 31 July–4 August 2006; pp. 1639–1642.
- Sokol, J.; NcNairn, H.; Pultz, T.J. Case studies demonstrating the hydrological applications of C-band multipolarized and polarimetric SAR. Can. J. Remote Sens. 2004, 30, 470–483. [Google Scholar] [CrossRef]
- Song, Y.-S.; Sohn, H.-G.; Park, C.-H. Efficient water area classification using Radarsat-1 SAR imagery in a high relief mountainous environment. Photogr. Eng. Remote Sens. 2007, 73, 285–296. [Google Scholar] [CrossRef]
- Pope, K.O.; Rejmankova, E.; Paris, J.F.; Woodruff, R. Detecting seasonal flooding cycles in marshes of the Yucatan Peninsula with SIR-C polarimetric radar imagery. Remote Sens. Environ. 1997, 59, 157–166. [Google Scholar] [CrossRef]
- Martinis, S.; Twele, A.; Voigt, S. Towards operational near real-time flood detection using a split-based automatic thresholding procedure on high resolution TerraSAR-X data. Nat. Hazards Earth Syst. Sci. 2009, 9, 303–314. [Google Scholar] [CrossRef]
- Chapman, B.; McDonald, K.; Shimada, M.; Rosenqvist, A.; Schroeder, R.; Hess, L. Mapping regional inundation with spaceborne L-Band SAR. Remote Sens. 2015, 7. [Google Scholar] [CrossRef]
- Hahmann, T.; Twele, A.; Martinis, S.; Buchroithner, M. Strategies for the Automatic Extraction of Water Bodies from TerraSAR-X / TanDEM-X data. In Geographic Information and Cartography for Risk and Crisis Management; Konecny, M., Zlatanova, S., Bandrova, T.L., Eds.; Springer Berlin Heidelberg: Berlin, Germany, 2010; pp. 129–141. [Google Scholar]
- Hahmann, T.; Wessel, B. Surface water body detection in high-resolution TerraSAR-X data using active contour models. In Proceedings of the 2010 8th European Conference on Synthetic Aperture Radar (EUSAR), Aachen, Germany, 7–10 June 2010; pp. 1–4.
- Solbo, S.; Malnes, E.; Guneriussen, T.; Solheim, I.; Eltoft, T. Mapping surface-water with Radarsat at arbitrary incidence angles. In Proceedings of the Geoscience and Remote Sensing Symposium, 2003, IGARSS ’03, Tolouse, France, 21–25 July 2003; Volume 2514, pp. 2517–2519.
- Al-Bayati, M.; El-Zaart, A. Automatic thresholding techniques for SAR images. In Proceedings of the International Conference of Soft Computing, Dubai, United Arab Emirates, 18–19 May 2013.
- Manjusree, P.; Prasanna Kumar, L.; Bhatt, C.; Rao, G.; Bhanumurthy, V. Optimization of threshold ranges for rapid flood inundation mapping by evaluating backscatter profiles of high incidence angle SAR images. Int. J. Disaster Risk Sci. 2012, 3, 113–122. [Google Scholar] [CrossRef]
- O’Grady, D.; Leblanc, M.; Gillieson, D. Use of ENVISAT ASAR Global Monitoring Mode to complement optical data in the mapping of rapid broad-scale flooding in Pakistan. Hydrol. Earth Syst. Sci. 2011, 15, 3475–3494. [Google Scholar] [CrossRef]
- Heremans, R.; Willekens, A.; Borghys, D.; Verbeeck, B.; Valckenborgh, J.; Acheroy, M.; Perneel, C. Automatic detection of flooded areas on ENVISAT/ASAR images using an object-oriented classification technique and an active contour algorithm. In Proceedings of the International Conference on Recent Advances in Space Technologies, 2003, RAST ’03, Istanbul, Turkey, 20–22 November 2003; pp. 311–316.
- Kass, M.; Witkin, A.; Terzopoulos, D. Snakes: Active contour models. Int. J. Comput. Vis. 1988, 1, 321–331. [Google Scholar] [CrossRef]
- Vachon, P.; DeLisle, D. From Radarsat-2 to Radarsat constellation mission data continuity. In Proceedings of the Advanced SAR oceanography (SeaSAR) Symposium, Tromsø, Norway, 18–22 June 2012.
- Canadian Space Agency. Radarsat Constellation. Available online: http://www.asc-csa.gc.ca/eng/satellites/radarsat/ (accessed on 10 November 2015).
- Carrera, M.L.; Bélair, S.; Bilodeau, B. The Canadian Land Data Assimilation System (CaLDAS): Description and synthetic evaluation study. J. Hydrometeorol. 2015, 16, 1293–1314. [Google Scholar] [CrossRef]
- Belair, S. Better Weather Forecasts Resulting from Improved Land Surface Processes in Environment Canada’s Numerical Prediction Systems. Available online: http://gmao.gsfc.nasa.gov/seminars/archive/ (accessed on 29 November 2015).
- Van der Valk, A.G. The prairie poholes of North America. In The Wold's Largest Wetlands; Fraser, L., Keddy, P., Eds.; Cambridge University Press: New York, NY, USA, 2005; pp. 393–423. [Google Scholar]
- Nature Conservancy of Canada. Land Lines. Available online: http://www.natureconservancy.ca/en/blog/tweetable-facts-on-WWD.html#.VmSXKr-OshQ (accessed on 24 November 2015).
- Pomeroy, J.; Fang, X.; Webrook, C.; Minke, A.; Guo, X.; Brown, T. Prairie Hydrological Model Study Final Report; University of Saskatchewan: Saskatoon, SK, Canada, 2010. [Google Scholar]
- Wray, H.E.; Bayley, S.E. A Review of Indicators of Wetland Health and Function in Alberta's Prairie, Aspen Parkland and Boreal Dry Mixedwood Regions; Alberta Environment: Edmonton, AB, Canada, 2006. [Google Scholar]
- Oliver, C.; Quegan, S. Understanding Synthetic Aperture Radar Images; Artech House: Norwood, MA, USA, 1998. [Google Scholar]
- Lopes, A. Adaptive speckle filters and scene heterogeneity. IEEE Trans. Geosci. Remote Sens. 1990, 28, 992–1000. [Google Scholar] [CrossRef]
- Lee, J.S.; Pottier, E. Polarimetric Radar Imaging: From Basics to Applications; CRC Press: Boca Raton, FL, USA, 2009. [Google Scholar]
- Cheng, P.; Toutin, T. Radarsat-2 data: Automated high accuracy geometric correction and mosaicking without ground control points. Geoinformatics 2010, 13, 22–27. [Google Scholar]
- MacDonald Dettwiler and Associates (MDA). Radarsat-2 Product Description; RN-RP-51–2713; MacDonald Dettwiler and Associates: Richmond, BC, Canada, 2014. [Google Scholar]
- Natural Resources Canada. Canadian Digital Elevation Data: Level 1 Product Specifications; Natural Resources Canada: Sherbrooke, QC, Canada, 2007.
- Toutin, T.; Omari, K. A “new hybrid” modeling for geometric processing of Radarsat-2 data without user’s GCP. Photogr. Eng. Remote Sens. 2011, 77, 601–608. [Google Scholar] [CrossRef]
- Natural Resources Canada. National Road Network, Canada: Level 1 Product Specifications; Natural Resources Canada: Sherbrooke, QC, Canada, 2003. [Google Scholar]
- Staples, G.; Cartwright, W. Radarsat-2 Imaging Modes and Aplications. In Informative Webinar Series; MDA Geospatial Services; Available online: http://gs.mdacorporation.com/includes/documents/webinar/RADARSAT-2 Imaging Modes and Applications Webinar.pdf (accessed on 23 April 2015).
- Dekker, R.J. Texture analysis and classification of ERS SAR images for map updating of urban areas in The Netherlands. IEEE Trans. Geosci. Remote Sens. 2003, 41, 1950–1958. [Google Scholar] [CrossRef]
- Blaschke, T.; Burnett, C.; Pekkarinen, A. Image segmentation methods for object-based analysis and classification. In Remote Sensing Image Analysis: Including The Spatial Domain; Jong, S.D., Meer, F.V.D., Eds.; Springer Netherlands: Houten, The Netherlands, 2004; Volume 5, pp. 211–236. [Google Scholar]
- Blaschke, T. Object based image analysis for remote sensing. ISPRS J. Photogr. Remote Sens. 2010, 65, 2–16. [Google Scholar] [CrossRef]
- Congalton, R.G. A review of assessing the accuracy of classifications of remotely sensed data. Remote Sens. Environ. 1991, 37, 35–46. [Google Scholar]
- Shook, K.; Pomeroy, J.W.; Spence, C.; Boychuk, L. Storage dynamics simulations in prairie wetland hydrology models: Evaluation and parameterization. Hydrol. Process. 2013, 27, 1875–1889. [Google Scholar] [CrossRef]
- O’Grady, D.; Leblanc, M.; Gillieson, D. Relationship of local incidence angle with satellite radar backscatter for different surface conditions. Int. J. Appl. Earth Observ. Geoinf. 2013, 24, 42–53. [Google Scholar] [CrossRef]
- Belair, S.; Canadian Meteorological Centre, Dorval, QC, Canada. Personal communication, 2015.
- Klemas, V.; Pieterse, A. Using remote sensing to map and monitor water resources in arid and semiarid regions. In Advances in Watershed Science and Assessment; Younos, T., Parece, T.E., Eds.; Springer International Publishing: New York, NY, USA, 2015; Volume 33, pp. 33–60. [Google Scholar]


| Area Range | WorldView2 (12 May 2014) | Radarsat-2 Wide Fine (F0W3) (11 May 2014) |
|---|---|---|
| [25 m2–1000 m2) | 86576 (15.44%) | 44 1 (0.15%) |
| [1000 m2–1 ha) | 8513 (27.26%) | 266 (6.19%) |
| [1–2 ha) | 533 (8.76%) | 75 (5.80%) |
| [2 ha–0.5 km2) | 488 (34.98%) | 119 (56.45%) |
| [0.5–5 km2] | 6 (13.55%) | 3 (31.41%) |
| Total number of polygons | 96116 | 507 |
| Total area | 84.825 km2 (100%) | 17.68 km2 (100%) |
| Area Range | WorldView2 (10 May 2014) | Radarsat-2 Ultra-Fine (U76) (16 May 2014) |
|---|---|---|
| [25 m2–1000 m2) | 7634 (15.8%) | 636 (23.27%) |
| [1000 m2–1 ha) | 401 (20.28%) | 65 (25.69%) |
| [1–2 ha) | 38 (10.16%) | 2 (3.68%) |
| [2 ha–0.5 km2) | 43 (53.74%) | 3 (47%) |
| [0.5 km2–5 km2] | 0 | 0 |
| Total number of polygons | 8116 | 771 |
| Total area | 5.52 km2 (100%) | 0.64 km2 (100%) |
| Area Range | RapidEye L3A (8 September 2012) | Radarsat-2 Fine Quad (FQ19) (8 September 2012) |
|---|---|---|
| [25 m2–1000 m2) | 5391 (3.29%) | 72 1 (0.20%) |
| [1000 m2–1 ha) | 674 (9.23%) | 698 (7.85%) |
| [1–2 ha) | 110 (5.87%) | 99 (6.00%) |
| [2 ha–0.5 km2) | 155 (35.89%) | 158 (48.90%) |
| [0.5 km2–5 km2] | 8 (45.6%) | 8 (36.93%) |
| Total number of polygons | 6336 | 779 |
| Total area | 26 km2 (100%) | 23 km2 (100%) |
| Image | Water | Non-Water | Totals (Classifier) | Totals (Reference Data) |
|---|---|---|---|---|
| Pair 1 (F0W3 vs. WV2) | ||||
| Water | 13 | 0 | 13 | 100 |
| Non-water | 87 | 99 | 187 | 99 |
| Pair 2 (UF76 vs. WV2) | ||||
| Water | 3 | 0 | 3 | 48 |
| Non-water | 45 | 52 | 97 | 52 |
| Pair 3 (FQ19 vs. RE) | ||||
| Water | 41 | 0 | 41 | 49 |
| Non-water | 8 | 51 | 59 | 51 |
| Image | Number of Points | Overall Accuracy (%) | 95% Confidence Interval (%) | Overall Kappa |
|---|---|---|---|---|
| Pair 1 (F0W3 vs. WV2) | 199 1 | 56.5 | 49.38–63.621 | 0.125 ± 0.05 |
| Pair 2 (UF76 vs. WV2) | 100 | 55.0 | 44.75–65.25 | 0.065 ± 0.19 |
| Pair 3 (FQ19 vs. RE) | 100 | 92.0 | 86.18–97.82 | 0.839 ± 0.03 |
© 2016 by the authors; licensee MDPI, Basel, Switzerland. This article is an open access article distributed under the terms and conditions of the Creative Commons by Attribution (CC-BY) license (http://creativecommons.org/licenses/by/4.0/).
Share and Cite
Bolanos, S.; Stiff, D.; Brisco, B.; Pietroniro, A. Operational Surface Water Detection and Monitoring Using Radarsat 2. Remote Sens. 2016, 8, 285. https://doi.org/10.3390/rs8040285
Bolanos S, Stiff D, Brisco B, Pietroniro A. Operational Surface Water Detection and Monitoring Using Radarsat 2. Remote Sensing. 2016; 8(4):285. https://doi.org/10.3390/rs8040285
Chicago/Turabian StyleBolanos, Sandra, Doug Stiff, Brian Brisco, and Alain Pietroniro. 2016. "Operational Surface Water Detection and Monitoring Using Radarsat 2" Remote Sensing 8, no. 4: 285. https://doi.org/10.3390/rs8040285
APA StyleBolanos, S., Stiff, D., Brisco, B., & Pietroniro, A. (2016). Operational Surface Water Detection and Monitoring Using Radarsat 2. Remote Sensing, 8(4), 285. https://doi.org/10.3390/rs8040285


