1. Introduction
Himalayan mountain ecosystems are under severe stress because of population pressure [
1,
2] amplified by climate change [
3]. For this reason, habitat fragmentation and degradation are clearly evident [
4,
5,
6]. Massive forest destruction began in this region during the early British Government rule (1850s), when forest wood was consumed for infrastructure development and commercial use [
7,
8]. According to reference [
9], three quarters of the Western Himalayan forest coverage has been lost since the last century, while reference [
10] observed that losses in the western region remained higher (23%) than the eastern region (7%) of the Himalaya during the last three decades.
Most forest studies within this region have concentrated on the Eastern Himalayas in Nepal and India, with the results extrapolated to the entire Himalayan region [
7]. Until recently, adequate attention has not been given to understand the cryosphere (
i.e., glaciers, snow and permafrost) dynamics in the Western Himalayas, where evidence suggests anomalous results relative to the Eastern Himalayas [
11]. Still, a comprehensive understanding of the ecological conditions (e.g., rangelands, forest, and biodiversity) remains incomplete for this region of the Himalayas.
In Pakistan, the current forest cover extent and deforestation rates are contentious issues among stakeholders. According to the first comprehensive remote sensing based on a national land cover assessment under the Forestry Sector Master Plan (FSMP), the forest area totals 3.59 million ha, which is 4.1% of the total land area of Pakistan [
12]. Out of this 3.59 million ha, approximately 67% of the forest area exists in the province Khyber Pakhtunkhwa (1.49 million ha), the administrative region Gilgit-Baltistan (0.66 million ha) and the state of Azad Jammu and Kashmir (0.26 million ha) in the Western Himalaya. Taking the FSMP study as the baseline, a national forest and range resource study observed that annual deforestation in natural forests was 27,000 ha during 1990–2000, giving an annual decline of 0.7%. The Global Forest Resource Assessment reported forest cover to be 2.5 million ha, 2.1 million ha and 1.7 million ha for the years 1990, 2000 and 2010, respectively; hence, the forest cover rate of change during the first decade was −1.6% per annum and −2.0% per annum during the second decade [
13]. Similarly, the World Bank reports Pakistan’s total forest cover to be 2.2% of its total land area [
14]. This situation is similar to several global assessments that refer to various figures on the extent of global forest coverage, which can also be partly attributed to a lack of a clear definition of “forest land” [
15]. Few countries have reliable data from comparable assessments over time [
13], and this lack of data is a sizable obstacle for efficient forest management policies in these countries. This review highlights the lack of systematic assessments and large area estimates of changes to forest cover in Pakistan.
Because the United States Geological Survey (USGS) is continuing to acquire global satellite images through Landsat 8 [
16] and has made the archived images publicly available [
17], there is the possibility to monitor forest changes both retrospectively and prospectively. In addition to being timely and cost effective [
18], satellite based monitoring enables a transparent and reliable [
19] means to monitor forest cover conditions. Although errors in the interpretation of spectral response and human bias exist [
20,
21], remote sensing remains to play key role in identifying and estimating deforested and reforested areas [
22,
23]. In the Himalayas, the application of remote sensing was introduced in the mid-1980s [
24] to identify and analyze the Land Use Land Cover (LULC) pattern [
25,
26,
27]. Through the analysis of the spatial and temporal patterns of deforestation and the identification of key variables related to deforestation, efforts are being made to identify the driving forces behind changes to forest cover [
28,
29,
30,
31,
32].
The objective of this study is to produce reliable large-scale datasets on the extent of forest cover and its changing trends by way of comprehensive mapping of forest cover in the mountain region of Western Himalaya, Pakistan.
2. Materials and Methods
2.1. Study Area
Geographically, the study area is in the extreme north of Pakistan, lying between 31°30′–37°00′N and 69°00′–77°30′E. Three different authorities administer the region, including the Khyber Pakhtunkhwa (KP) province, the administrative unit of Gilgit-Baltistan (GB) and the state of Azad Jammu and Kashmir (AJK). The total area covered in the study is approximately 18,260,000 ha (GB = 6,900,000; KP = 10,170,000; AJK = 1,190,000), which is 23% of the total land area of Pakistan and contains approximately 67% of the total forest cover of Pakistan.
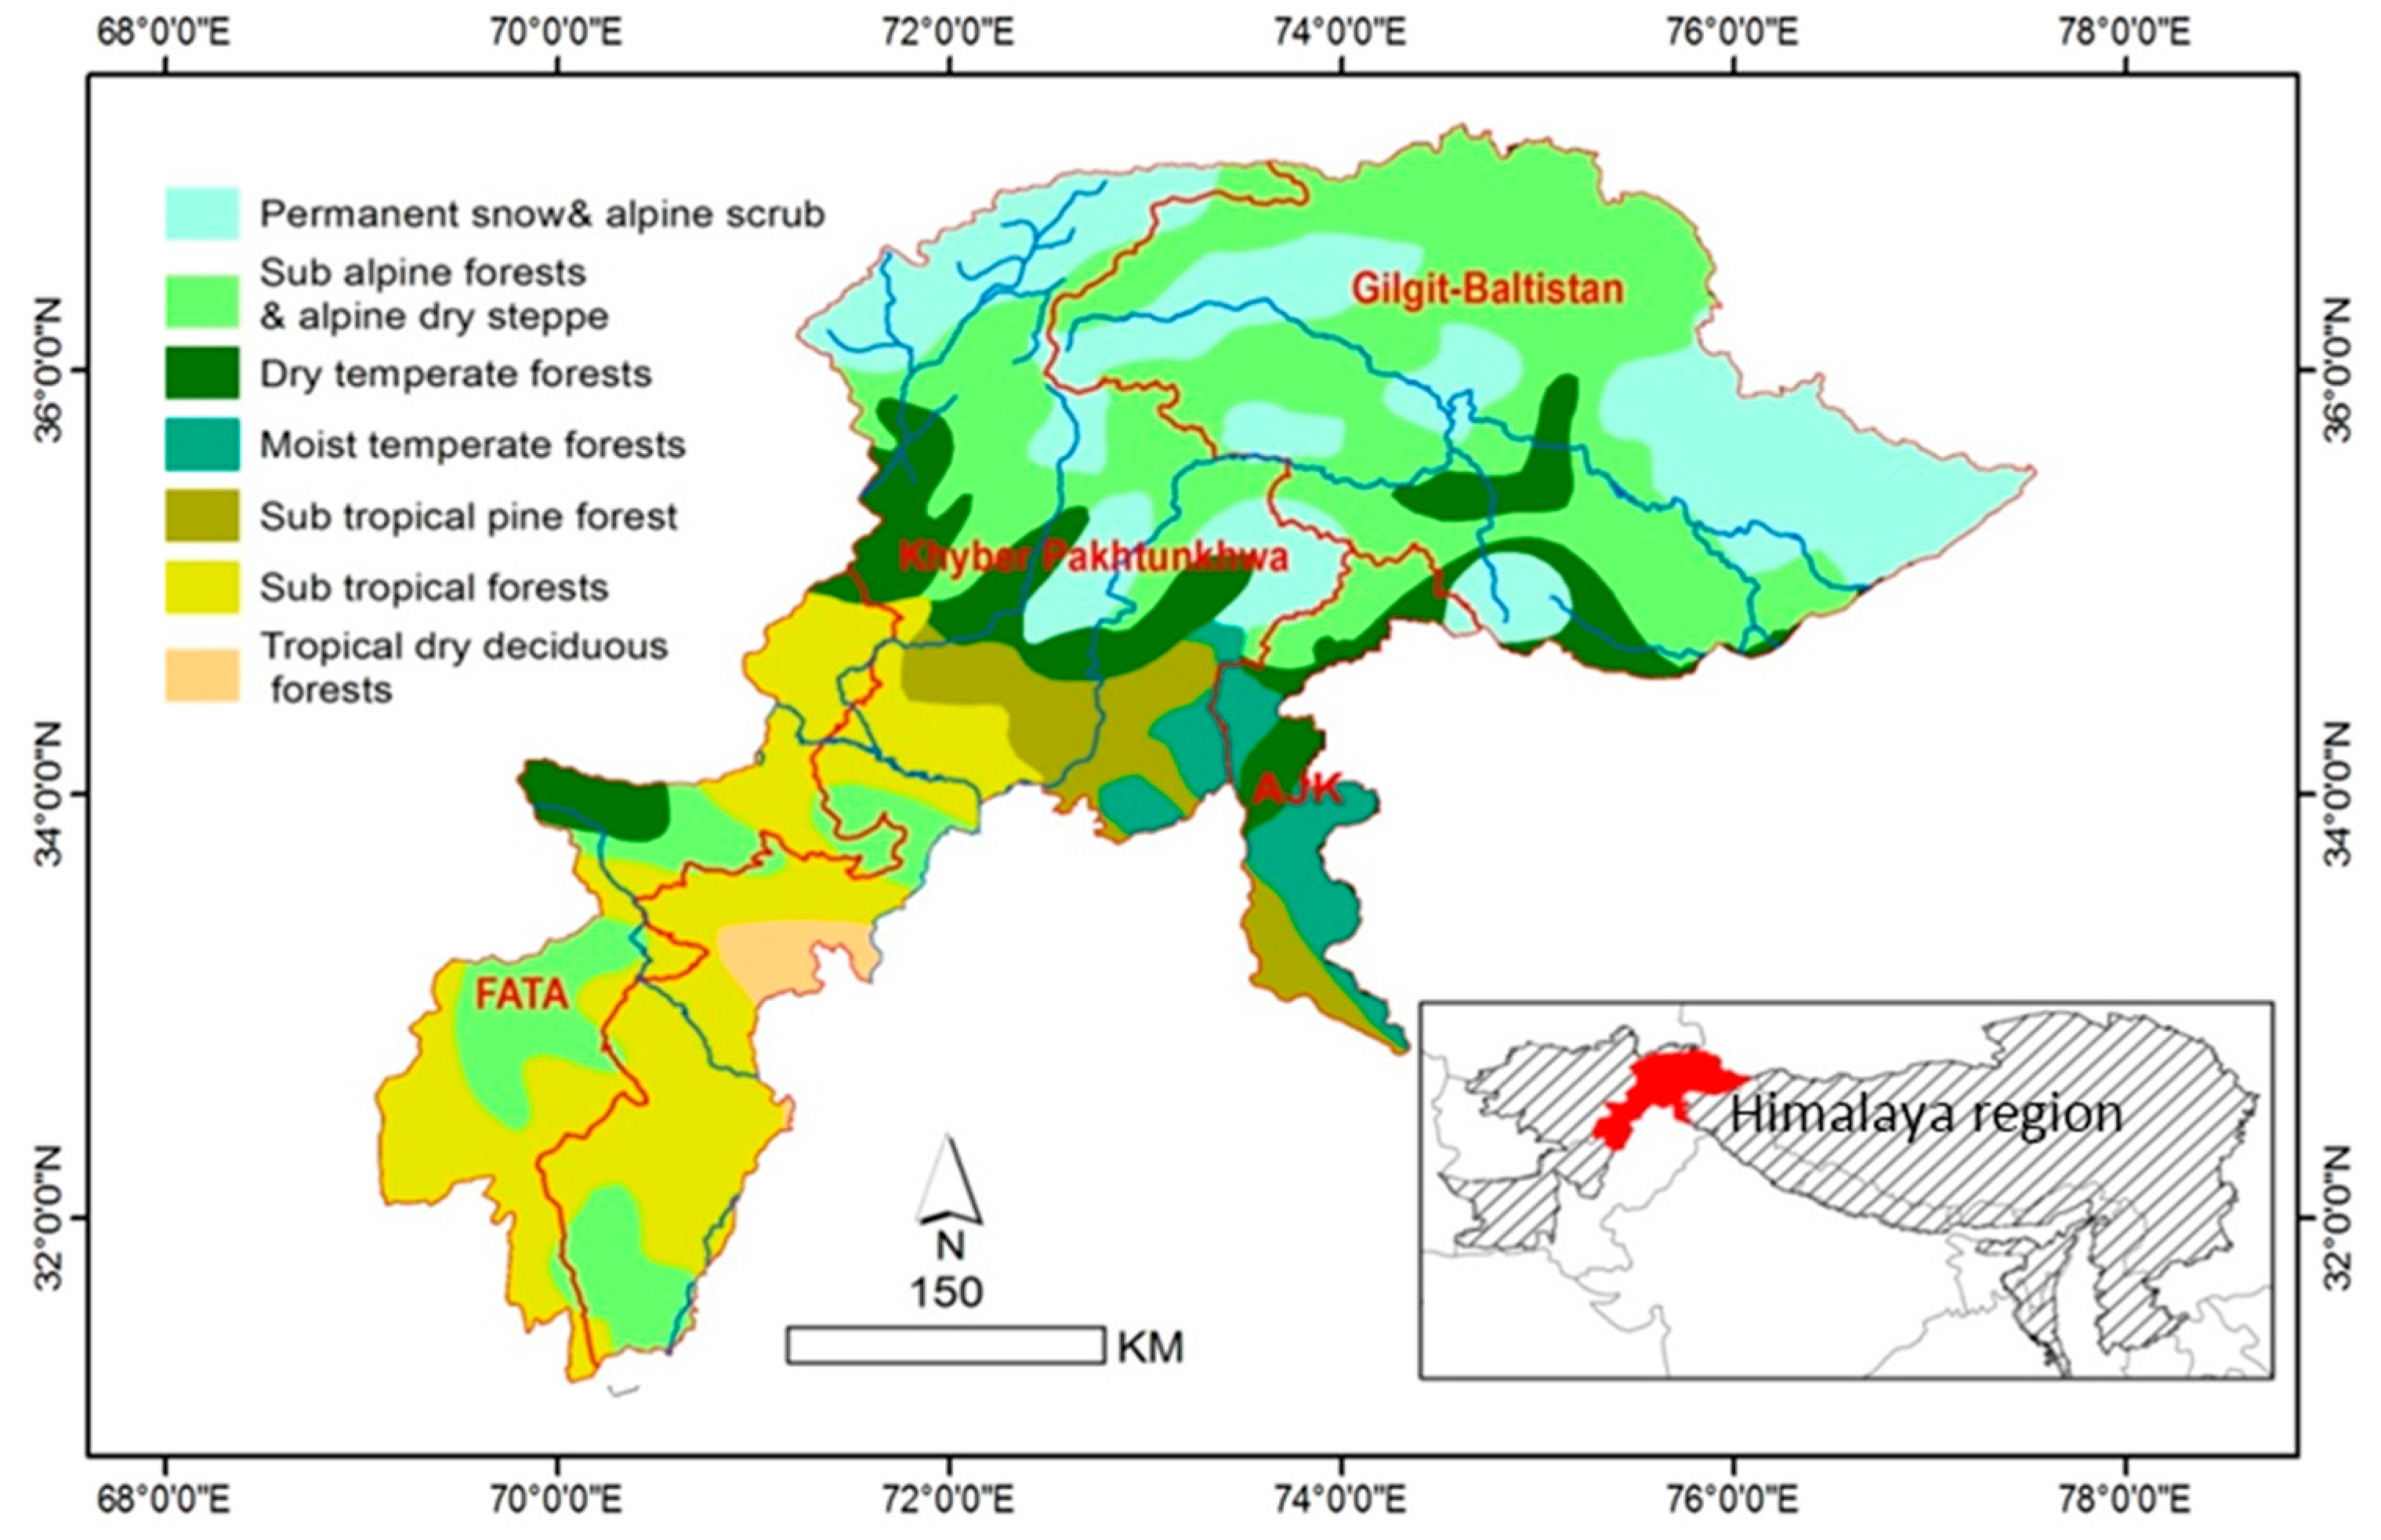
The vegetation in the Himalayas, as in any mountainous region, is essentially determined by the topography, climate, geology, rocks and soil. The Western Himalayas is a zone of lower monsoon rainfall in the summer and heavy snow fall in the winter. The classification of Himalayan vegetation into broad categories has been characterized by reference [
33] and later refined for Pakistan [
34]. A wide variety of forest types are found in Western Himalayas ranging from tropical forest to alpine scrub, which can be classified into seven major classes (
Figure 1) [
34].
Alpine Scrub: This type of forest begins immediately above the tree limit at 3600 m and extends until 4900 m. This zone comprises stunted woods alternating with meadows. The scrub consists of Junipreus squamata, Junipreus recurva, etc.
Sub Alpine Forests: These forests lay immediately above the temperate zone forest at the tree line extending from 3000–3800 m.
Dry Temperate Forests: The principal components of this forest type are Cedrus deodara and Pinus wallichiana, which occupy belts ranging from 1550 m to 3300 m.
Moist Temperate Forests: This forest type comprises evergreen oaks and conifers that cover the temperate zone of Western Himalaya between an altitude of 1500–3000 m. The dominant species in this region are Cedrus deodara, Picea smythiana and the oak species Quercus incana and Quercus dilatata.
Sub-Tropical Coniferous Forests: Formations of Pinus roxburghi cover the entire outer range between altitudes of 800–1800 m. In its lower elevation zones, this region is mixed with species such as Shorea robusta, and on its upper altitude range it is associated with species such as Quercus incana.
Sub Tropical (broad leaved) Forests: Elevation ranges between 350–1000 m, mean annual temperatures of 21–27 °C and average humidity of 50%–60%. These are forests of low or moderate height and mostly consist of deciduous tree species.
Tropical Dry Deciduous Forests: These occur along foothills and are found to an elevation of 1300 m with Shorea robusta as the dominant species.
2.2. Datasets
To interpret the land cover, Level 1 terrain corrected (L1T) temporal Landsat data, which is available from the USGS EROS [
35], for 1990, 2000 and 2010 (±2 years) were used. For the acquisition of optical satellite data in northern Pakistan, the months of August to October are considered to be the most suitable because of the least amount of cloud and snow cover during this period. The entire archive was examined thoroughly to locate the images captured during September and October (
Table S1, Supplementary Material). Bearing in mind the extensive temporal record and relatively consistent spatial and radiometric characteristics, the Landsat satellite data offers a reliable source of appropriate resolution data that is critical for the quantification of land change over reasonably long time periods [
36]. The data for the administrative boundaries at the sub-district level was accessed from the data portal in reference [
37].
2.3. Data Pre-Processing
The use of multi-temporal satellite data for large area mapping poses a number of challenges, including geometric correction errors, noise arising from atmospheric effects and changing illumination errors [
38]. For these reasons, pre-processing is necessary to remove or minimize such errors. The pre-processing steps used in this study included Top of Atmosphere (TOA) reflectance conversion, Bi-directional reflectance distribution function BRDF/View angle normalization, and cloud masking. Each image was normalized for solar irradiance by converting the digital number values to TOA reflectance. This conversion algorithm is “physically based, automated, and does not introduce significant errors to the data” [
39]. Corrections for BRDF effects were performed to the TOA image by employing a per scene BRDF adjustment. Reference [
40] showed that per scene BRDF adjustments improve radiometric response and land cover characterizations. A total of 57 (19 × 3) satellite images were processed individually. Subsequently, TOA reflectance was converted into ground reflectance through an atmospheric correction process. Second Simulation of the Satellite Signal in the Solar Spectrum (6S) is an advanced radiative transfer code that is designed to simulate the solar radiation reflectance by a coupled atmosphere-surface system for a wide range of atmospheric, spectral and geometric conditions [
41]. The code calculates the atmospheric correction coefficients xa, xb and xc for each band separately based on the input data, providing an indication of the most likely atmospheric conditions during image acquisition. These atmospheric correction coefficients are applied to the Top of Atmosphere (TOA) radiance (Lsat λ) to obtain SR values for each band. Using the 6S model, the SR (ρ) free from atmospheric effects was calculated using Equation (1).
where
. xa is the inverse of transmittance, xb is the scattering term of the atmosphere and xc is the reflectance of the atmosphere for isotropic light.
Information on the solar zenith angle, solar azimuth angle, sensor zenith angle, sensor azimuth angle and image acquisition date and time were extracted from the image metadata file, whereas the water vapour and aerosol optical depth values were retrieved from MODIS Terra Daily Level-3 (1° × 1°) global atmospheric product (MOD08_D3.051) from [
42]. Columnar ozone data were retrieved from the OMI Daily Level-3 (0.25° × 0.25°) global gridded product from [
42]. Additionally, the 6S model accounts for adjacency effects based on the view and azimuth angles of the sensor [
43].
The topography of mountainous areas causes reflectance issues that must be corrected for the subsequent analysis of the associated satellite data. In this study, the C-correction [
44,
45] method was applied to compensate for differences in solar illumination induced by the topography using SAGA GIS [
46].
2.4. Image Classification
The foremost step is the identification of classes that are to be mapped. Conventionally, the system would contain classes that are exhaustive and mutually exclusive; in fuzzy systems, this requirement can be relaxed, allowing intergradations of classes and mixed communities [
15]. To keep the current land cover classes comparable with previous efforts, earlier studies were reviewed, including the Forestry Sector Master Plan [
12], the National Forest and Range Resource Assessment [
47], the Provincial Forest Resource Inventory (PFRI) of North West Frontier Province—Pakistan [
48] and the Ecological Mapping and Monitoring for the Mountain Areas Conservancy Project [
49]. Fourteen land cover classes were identified (
Table 1). A Minimum Mapping Unit (MMU) of ~1 ha (3 × 3 pixels) is chosen to quantify the forest cover.
There are a plethora of methods that can be used to map forest cover using satellite imagery. However, forest cover maps have been derived from methods that are relatively effort-intense [
45,
47]. This study used a semi-automated (
i.e., computer-assisted) classification technique, which requires less time and is less interpreter-dependent than techniques based on visual interpretations. Performing a semi-automated classification, such as supervised classification, is desirable to provide reliable data over time to monitor the future state of forests [
50,
51]. The training areas (or spectral signatures collected during the training phase) can easily be used and refined (if new information is available) in future exercises of similar nature [
52].
Landsat satellite images taken in 2010 are foremost for the classification process. Training sites were identified and marked on the satellite data by polygons, which represent homogenous areas for each land-cover type. More than 200 training samples containing at least 10–15 pure training samples for each land-cover type were compiled. The source of these training areas was a combination of GPS based ground observation data compiled from previous land cover reports and visualization of high-resolution images from Google Earth. Based on the identified representative training areas, we performed signature evaluation through exploratory histogram analysis, computing signature separability using divergence between the distance between signatures and the contingency matrix to provide a basis for deciding whether to retain, merge, reshape, or take new training sites. Initially, mean values of training site samples were displayed with rectangular or elliptic boundaries on scatter plots of the spectral band combinations. The distance image and output thematic raster layer produced by Maximum Likelihood Classifier were used to identify those most likely to be misclassified. The histogram tails were cut-off interactively. Once the collected signatures were satisfactorily compared, multiple signatures were merged into one signature for a given land cover category and used for the classification. On the basis of the training areas and the spectral signature, the satellite image for the entire area resulted in a land cover map with 14 classes. Similarly, satellite images from years 2000 and 1990 were also processed by a similar approach for the classification of historic datasets. Individual pixels were re-sampled by applying a 3 × 3 majority filter to remove noise from the resultant land cover map; hence, we obtained a Minimum Mapping Unit (MMU) of ~1 ha (3 × 3 pixels) for the first draft of the land cover map.
2.5. Forest Cover and Change Statistics
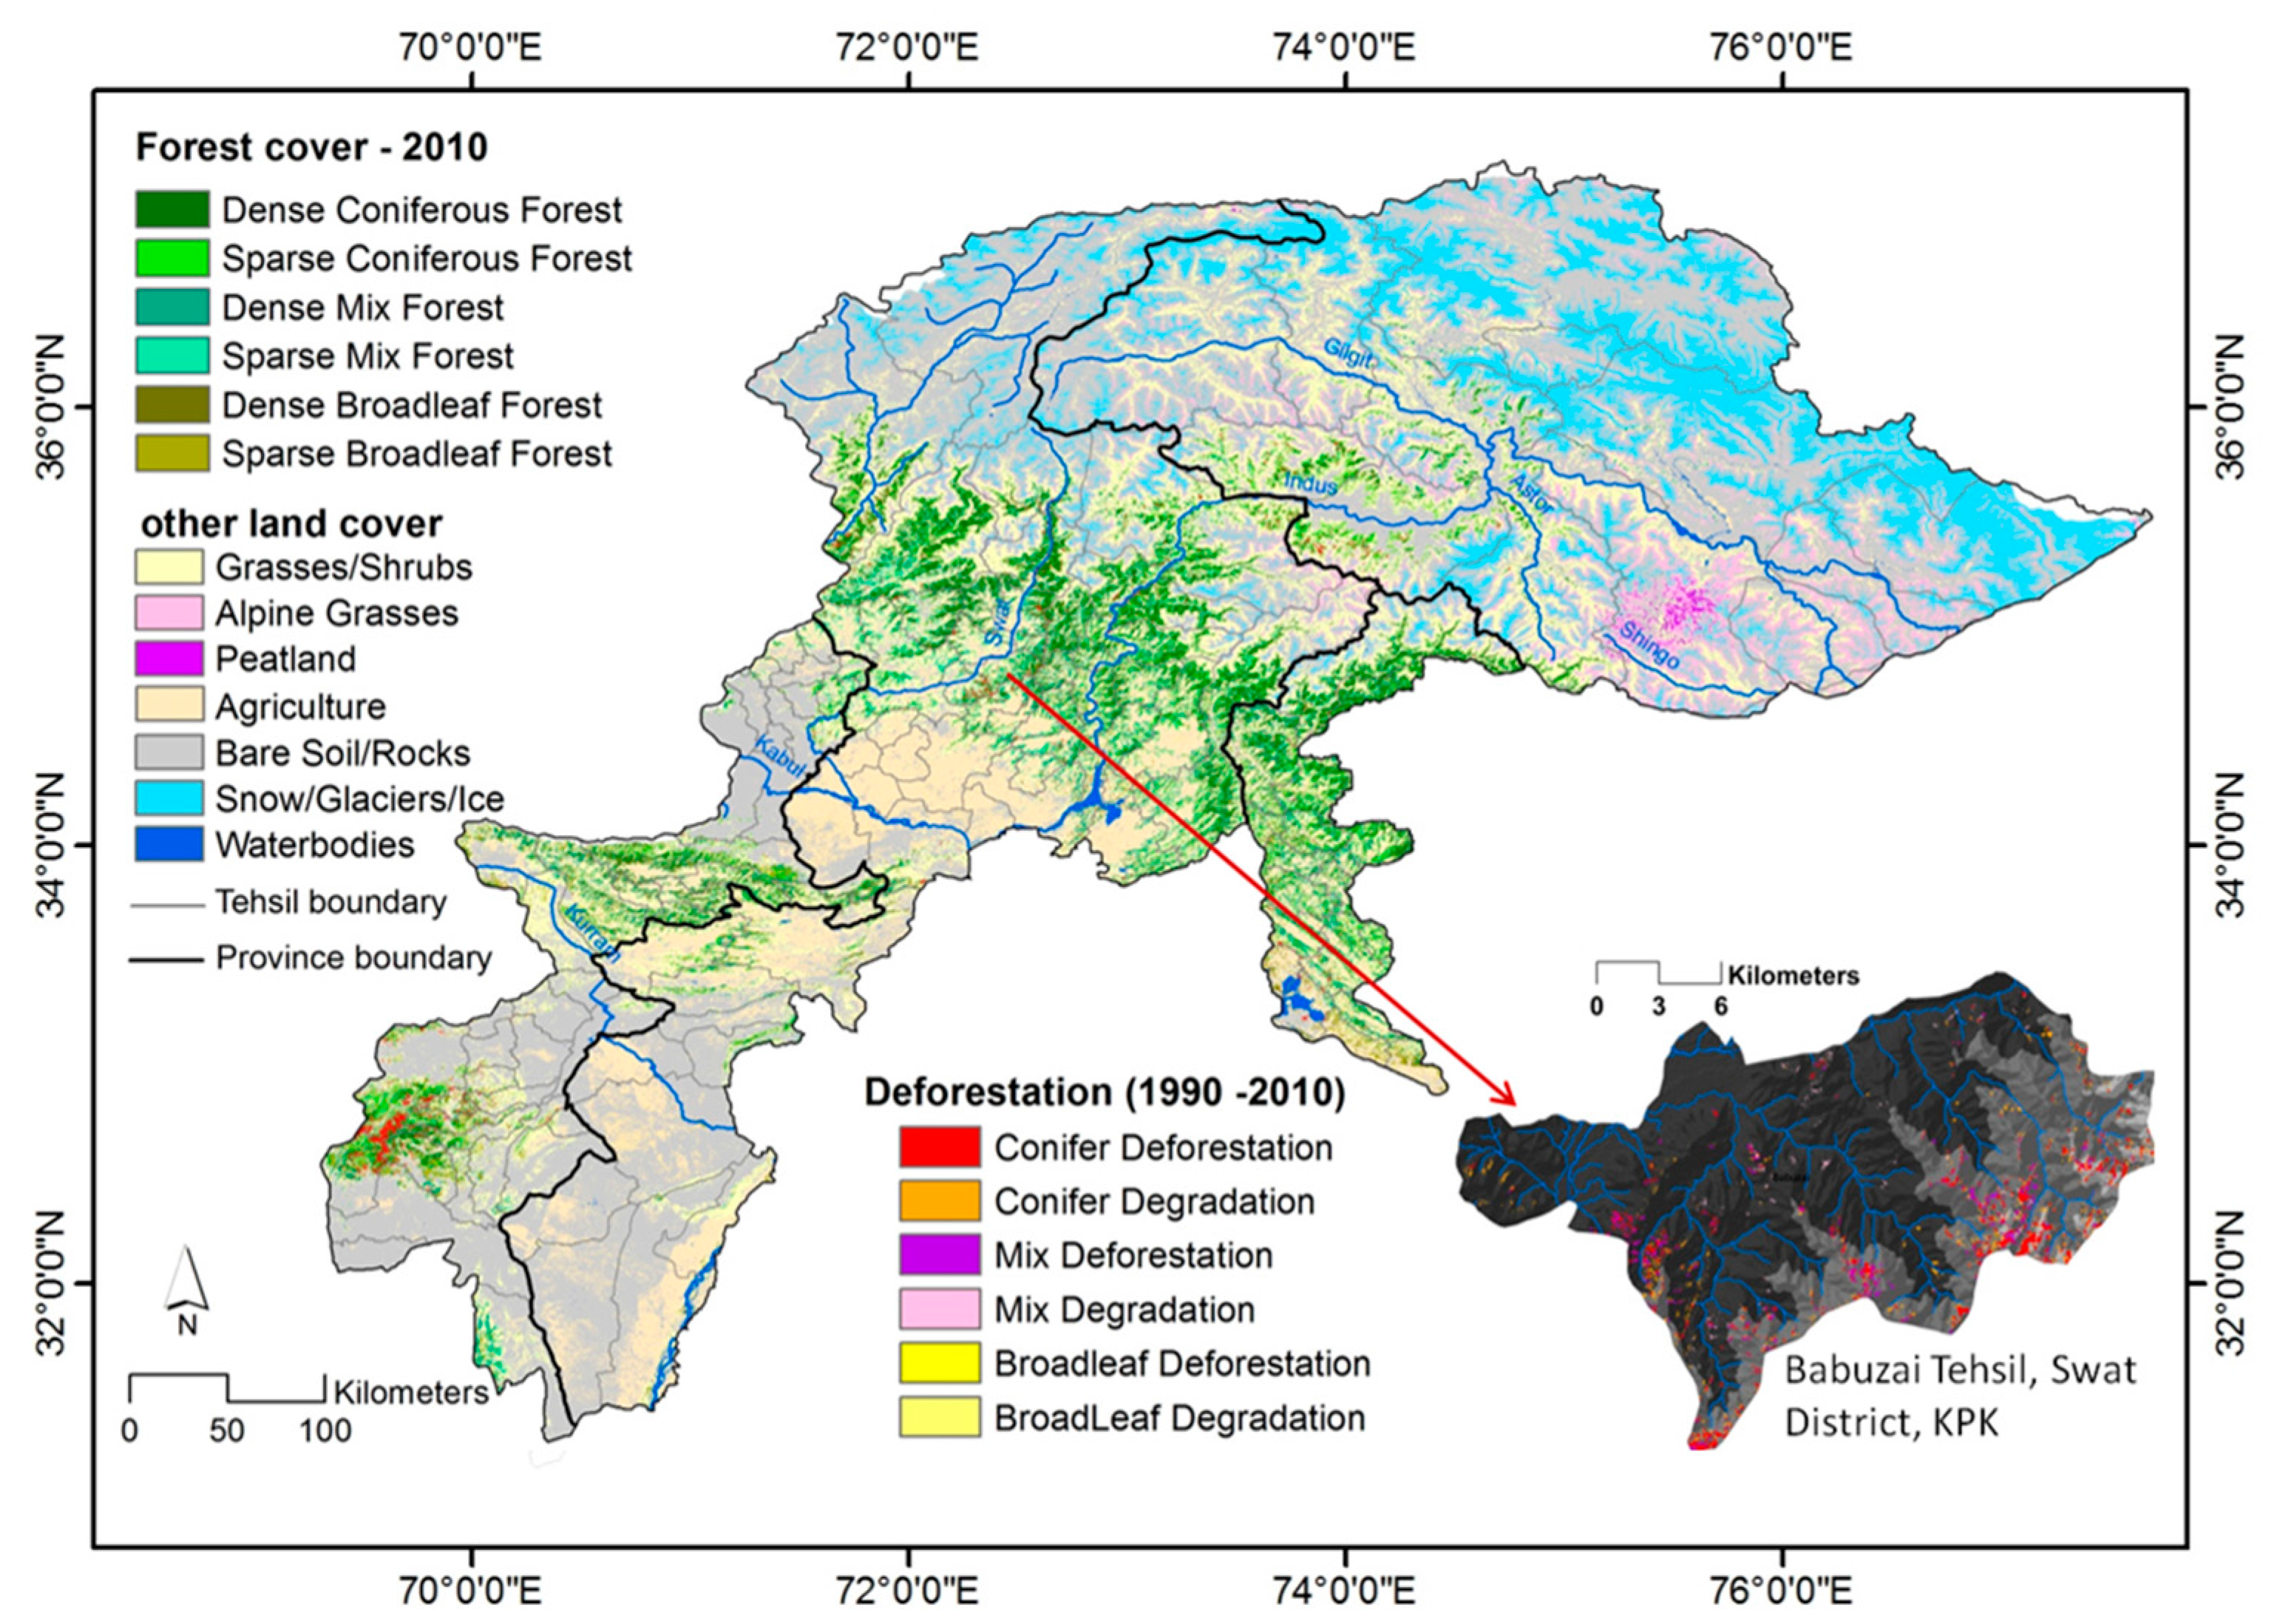
The land cover was primarily classified into 14 classes (
Table 1), including six forest cover classes (
i.e., dense coniferous forest, sparse coniferous forest, dense mixed forest, sparse mixed forest, sparse broadleaved forest) and eight non-forest cover classes (
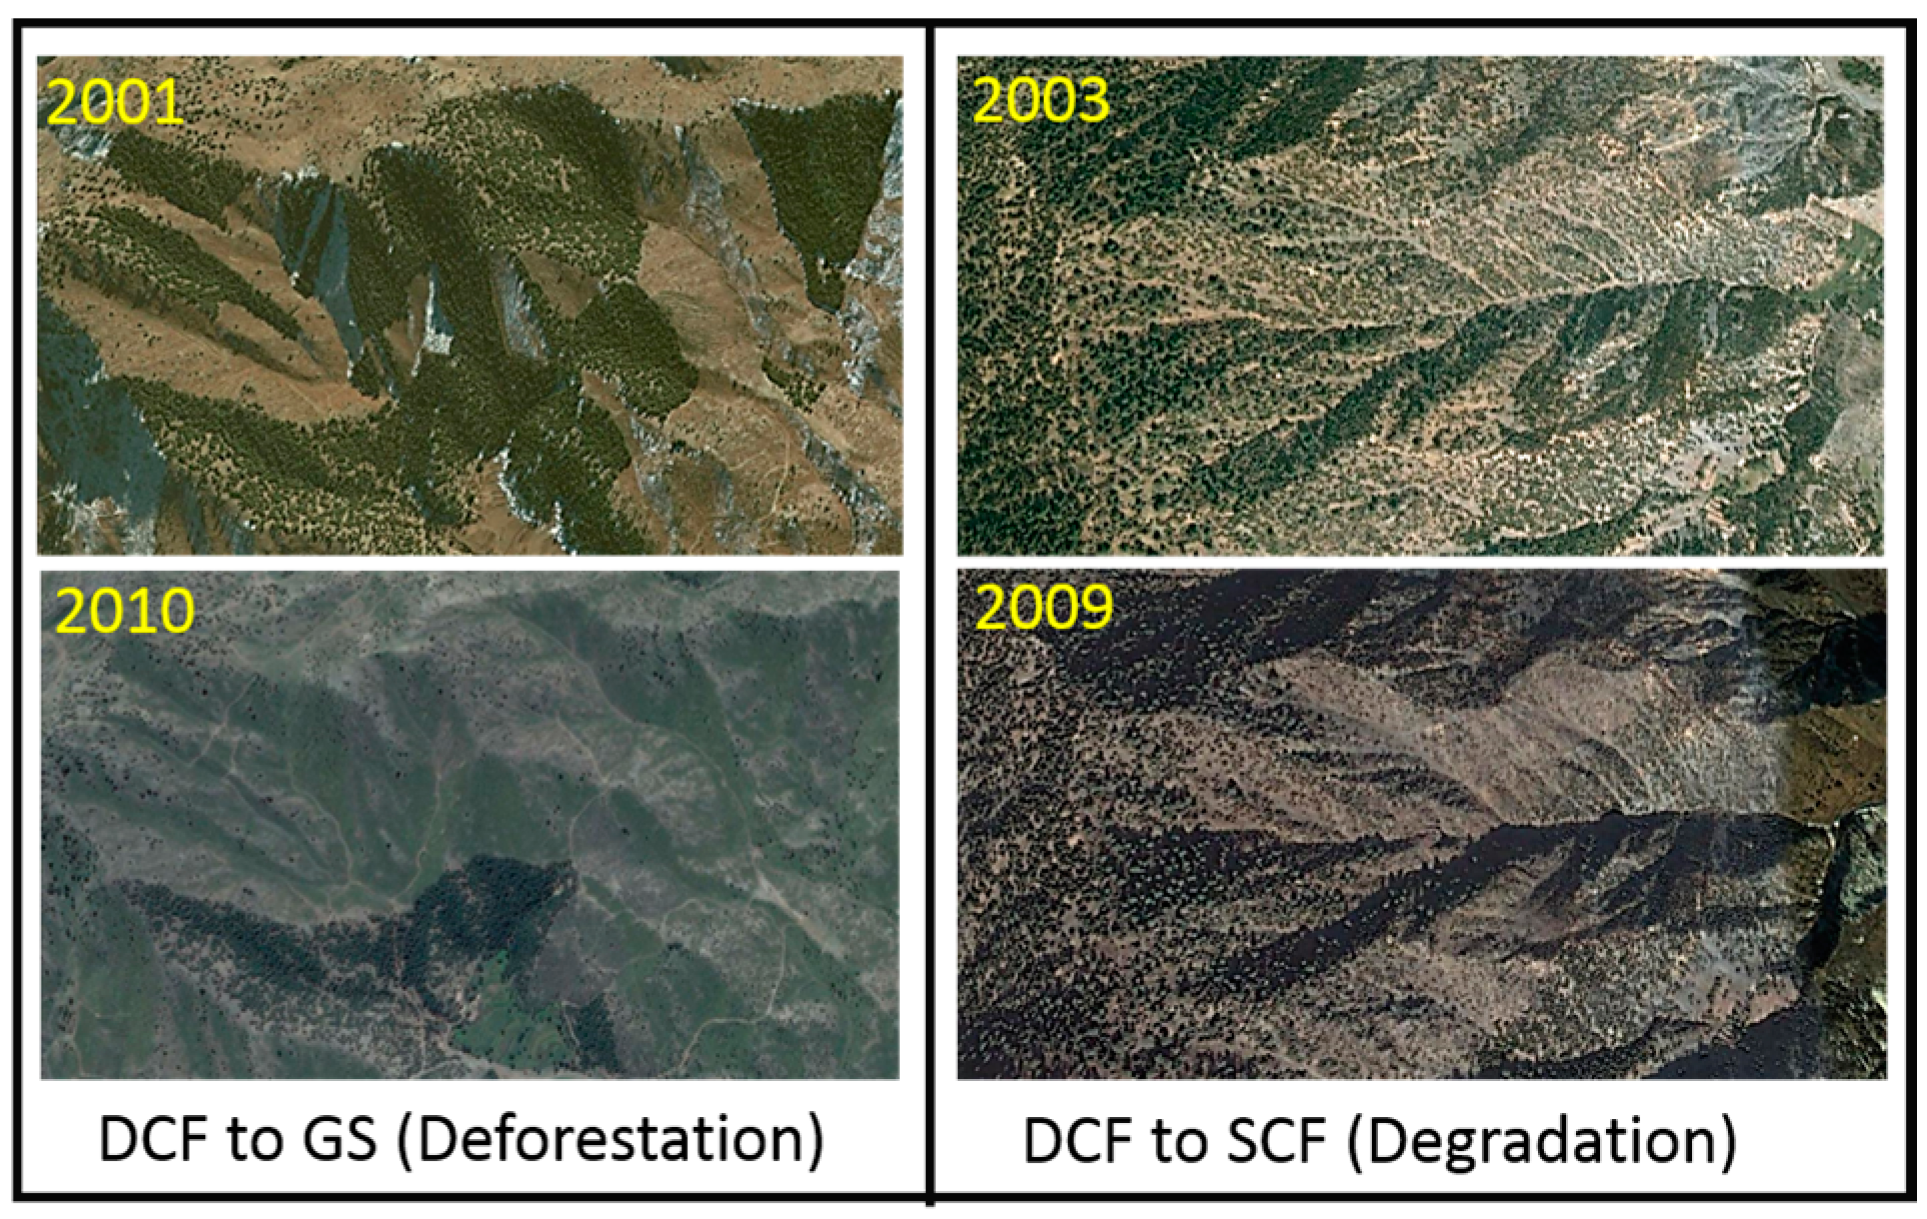
i.e., grassland/shrubs, alpine grassland, agriculture, bare soil/rocks, snow/glaciers/ice, water bodies). The transition from forest to non-forest was considered to be deforestation and dense forest to sparse forest was considered to be degradation. We employed FAO’s definition of deforestation which does not distinguish natural loss of forest from that caused by human action [
53,
54].
The change in forest cover classes was quantified using the output layers of land cover for three different years and cross tabulation between layers using the spatial analysis tool in ArcGIS. Changes other than forest are beyond the scope of the present work and were not extensively investigated. Thus, the accuracy of these classes is limited.
2.6. Interpretation Review by National Experts
Digital classification can be subject to misinterpretation caused by environmental conditions at the time of image acquisition (e.g., clouds, fog, etc.), variations in local forest types or limitations in computational algorithms. To address these limitations, professionals with backgrounds in remote sensing and strong ecological knowledge of the local area were invited to review the digital classification. To this end, experts from the WWF—Pakistan, the Karakorum International University and the National Agriculture Research Center (NARC) conducted a thorough review of 50 sub-districts during one month period.
Based on the observations on classification errors by these experts, improvements in the land cover were performed. A set of factors based on the threshold and conditionality of elevation, slope, aspect and spectral image indices of wetness index, shadow index, greenness index, snow index, among others (
S1, Supplementary material), was compiled to improve the description of land cover. All the statistics were recomputed with these improved land cover datasets.
2.7. Accuracy Assessment
The accuracy of the land cover maps developed from Landsat satellite images was assessed by comparing the land cover results with Google Earth based on very high resolution satellite (VHRS) images (VHRI). A systematic quarter degree (25 km) grid was developed and visualized on high-resolution satellite images of Google Earth. A total of 287 centre points of the grid are within the study area. While examining the observations possible via Google Earth, a simplified land cover with two classes of forest (i.e., Dense Forest and Sparse Forest) and other general classes of land cover was compared at each grid centroid for the purpose of validation. Based these observations, a systematic accuracy assessment was performed for the 2010 land cover map, as most of the Google Earth images were taken from 2007 to 2010. In addition, effort was made to validate deforestation and degradation patches by using time series Google Earth images available during 2000–2010.
4. Discussion
The time series land cover mapping (1990, 2000, 2010) revealed that extensive deforestation/degradation is occurring in the area. Indeed, approximately 170,684 ha of forest was cut or severely degraded during this time period (
Table 2,
Table 3 and
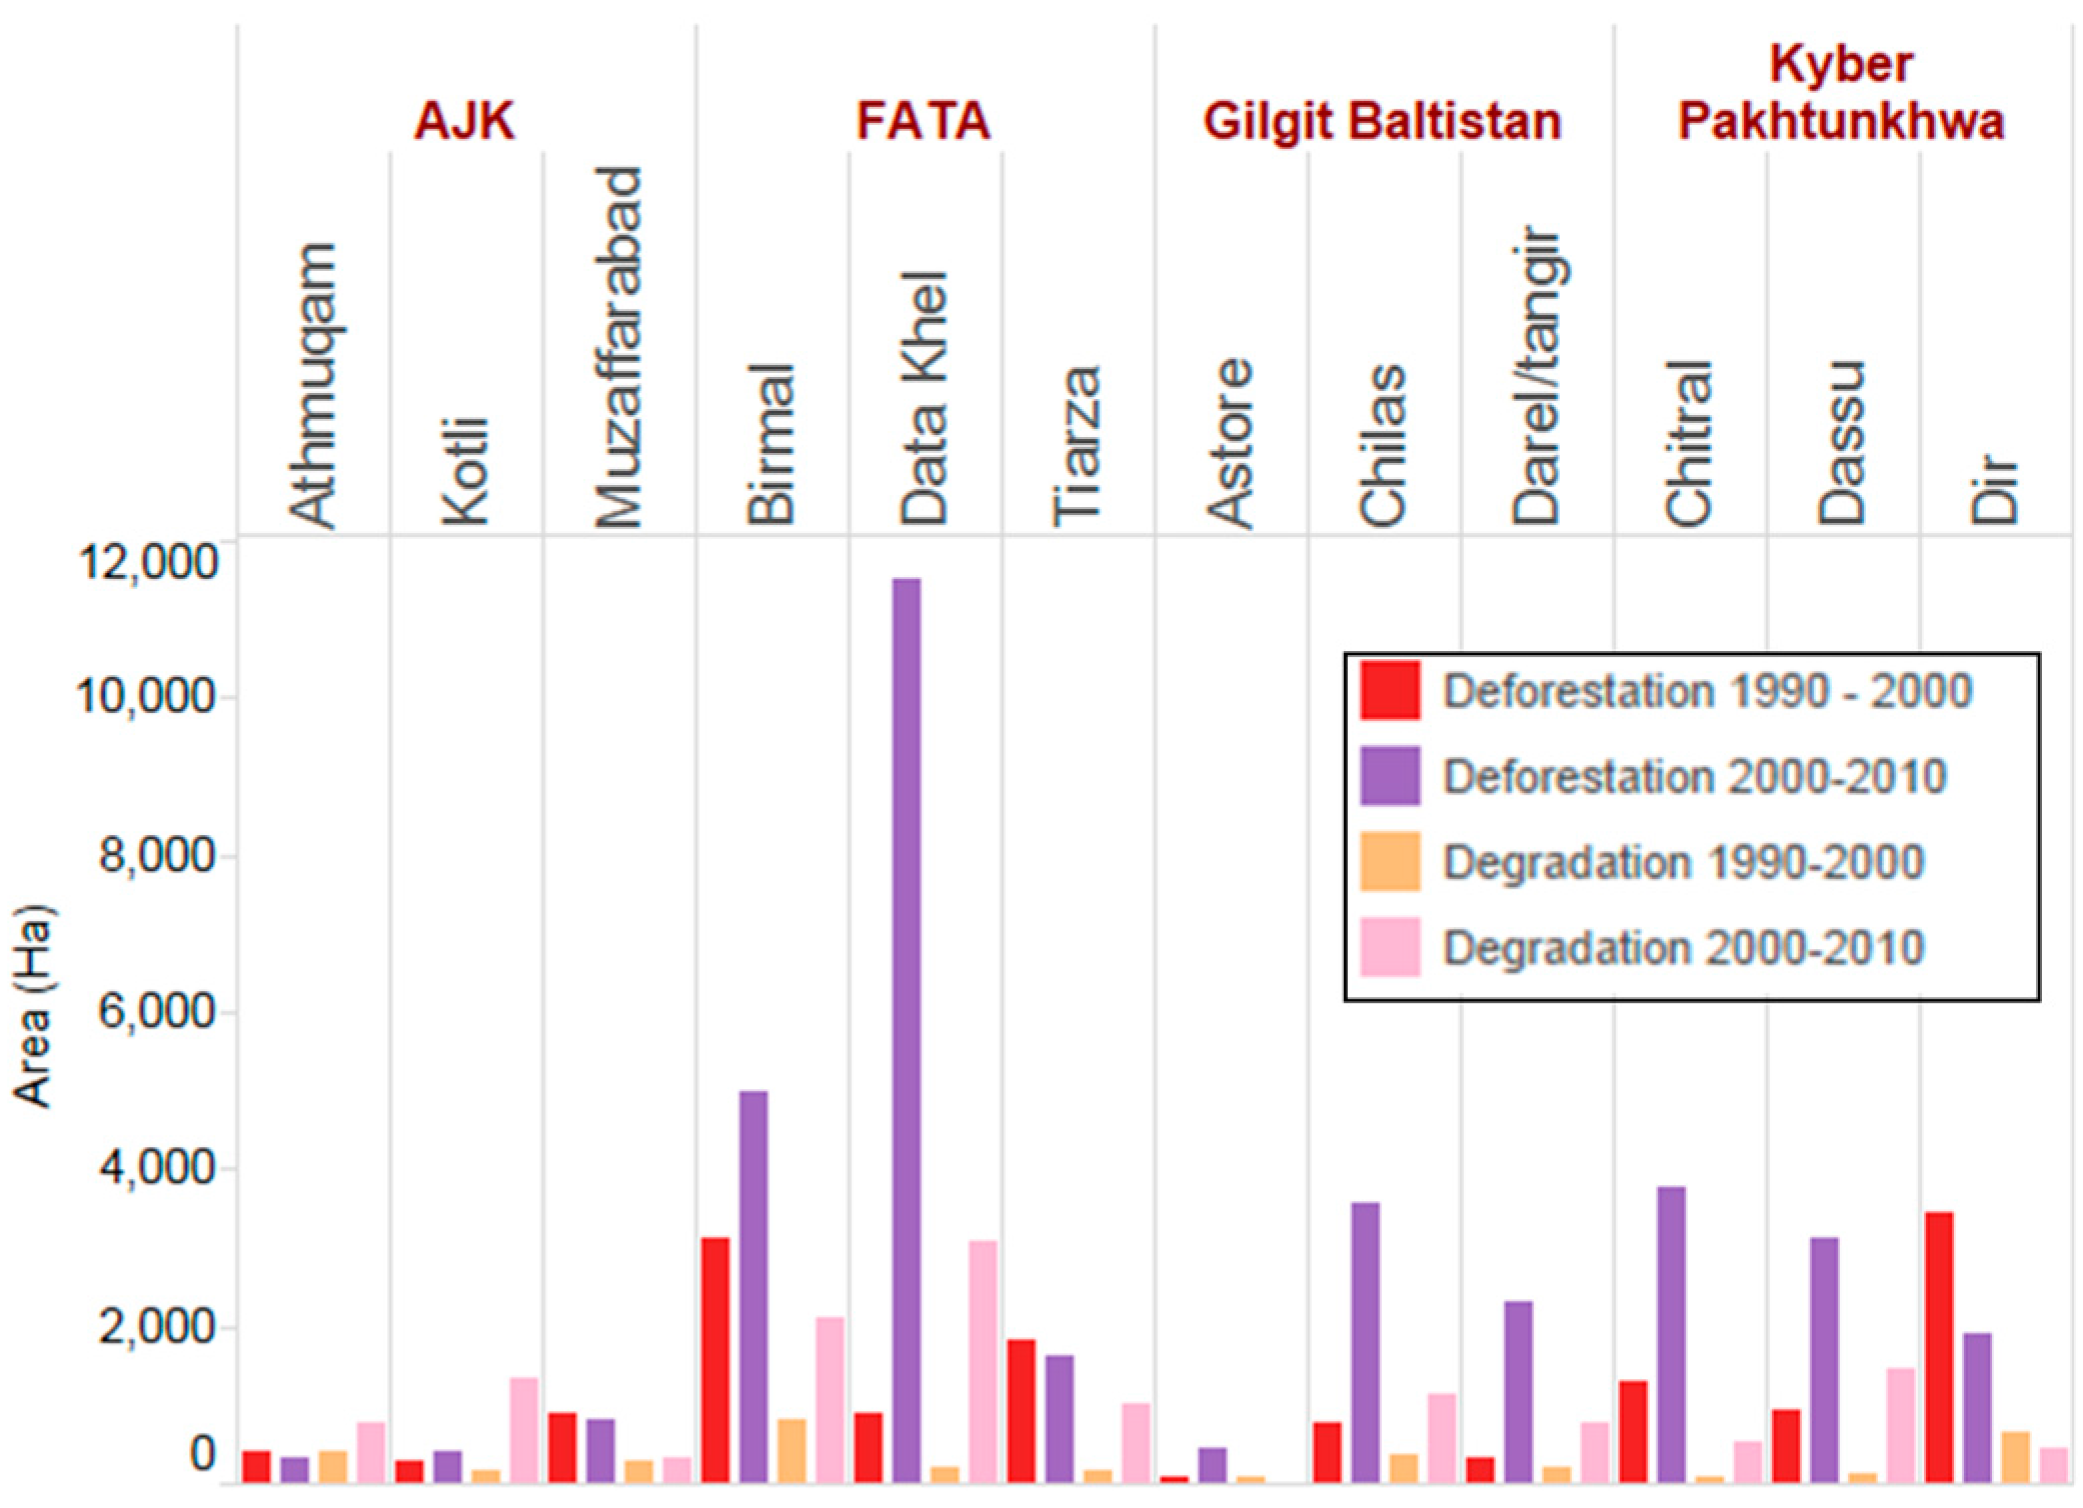
Table 4). The increase in the sparse forest classes during the study period is primarily attributed to a shift from the dense forest classes to sparse forest classes (degradation). Overall, the AJK state has the lowest deforestation rate, where the demand for wood for fuel, which is driven by population growth, is attributed to be the primary cause of this deforestation [
55]. KP province has the highest deforestation, which is also linked with population growth for fuel wood and further aggravated by large scale illegal commercial harvesting [
56]. In addition, recent security conflicts in the western borders have worsened this situation [
57]. Several reports relate this deforestation with nexus of timer mafia and combatant groups for financial gains and clearing by security forces for tactical reasons [
58,
59,
60]. Deforestation along the western borders of Pakistan during last decade are similar to the deforestation patterns in Afghanistan during 1980–2000 and the spatially concentrated loss and heavy dependence on forest resources during the Rwandan conflicts [
61,
62]. The deforestation and degradation levels reported in this study need to be analyzed in terms of anthropogenic factors as reported in several other studies [
55,
56,
57,
58,
59,
60,
61]. Similarly, no specific studies exist on assessing the impact of natural factors like climate, water, landslides, disease,
etc., on forest loss in the mountain region of Pakistan. The quantitative assessments on underlying causes of deforestation using spatial and temporal patterns of deforestation and degradation can further help in managing forest resources more effectively.
When a province-wide comparison is made between the current assessment and previous national forest cover change assessments [
47,
63], major differences in the extent of forest cover and deforestation rates are observed (
S2, Table S8–S11, Supplementary material). In its assessment, reference [
47] delineates forest area to be 660,000 ha for the Gilgit-Baltistan province in 1990, which is 9.4% of its total area. However, most of the province (78%) is above 3600 m elevation with limited annual rainfall (average 120–240 mm). Thus, the prevailing bio-climatic conditions cannot support such large areas of forest, as described in reference [
47]. In past inventories, such errors in assessment can be attributed to limited data and image interpretation as well as the use of inconsistent methods. Similarly, references [
64,
65] describe the drawbacks of global algorithms and datasets [
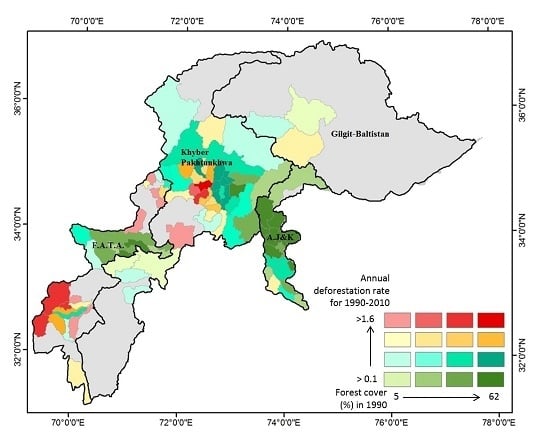
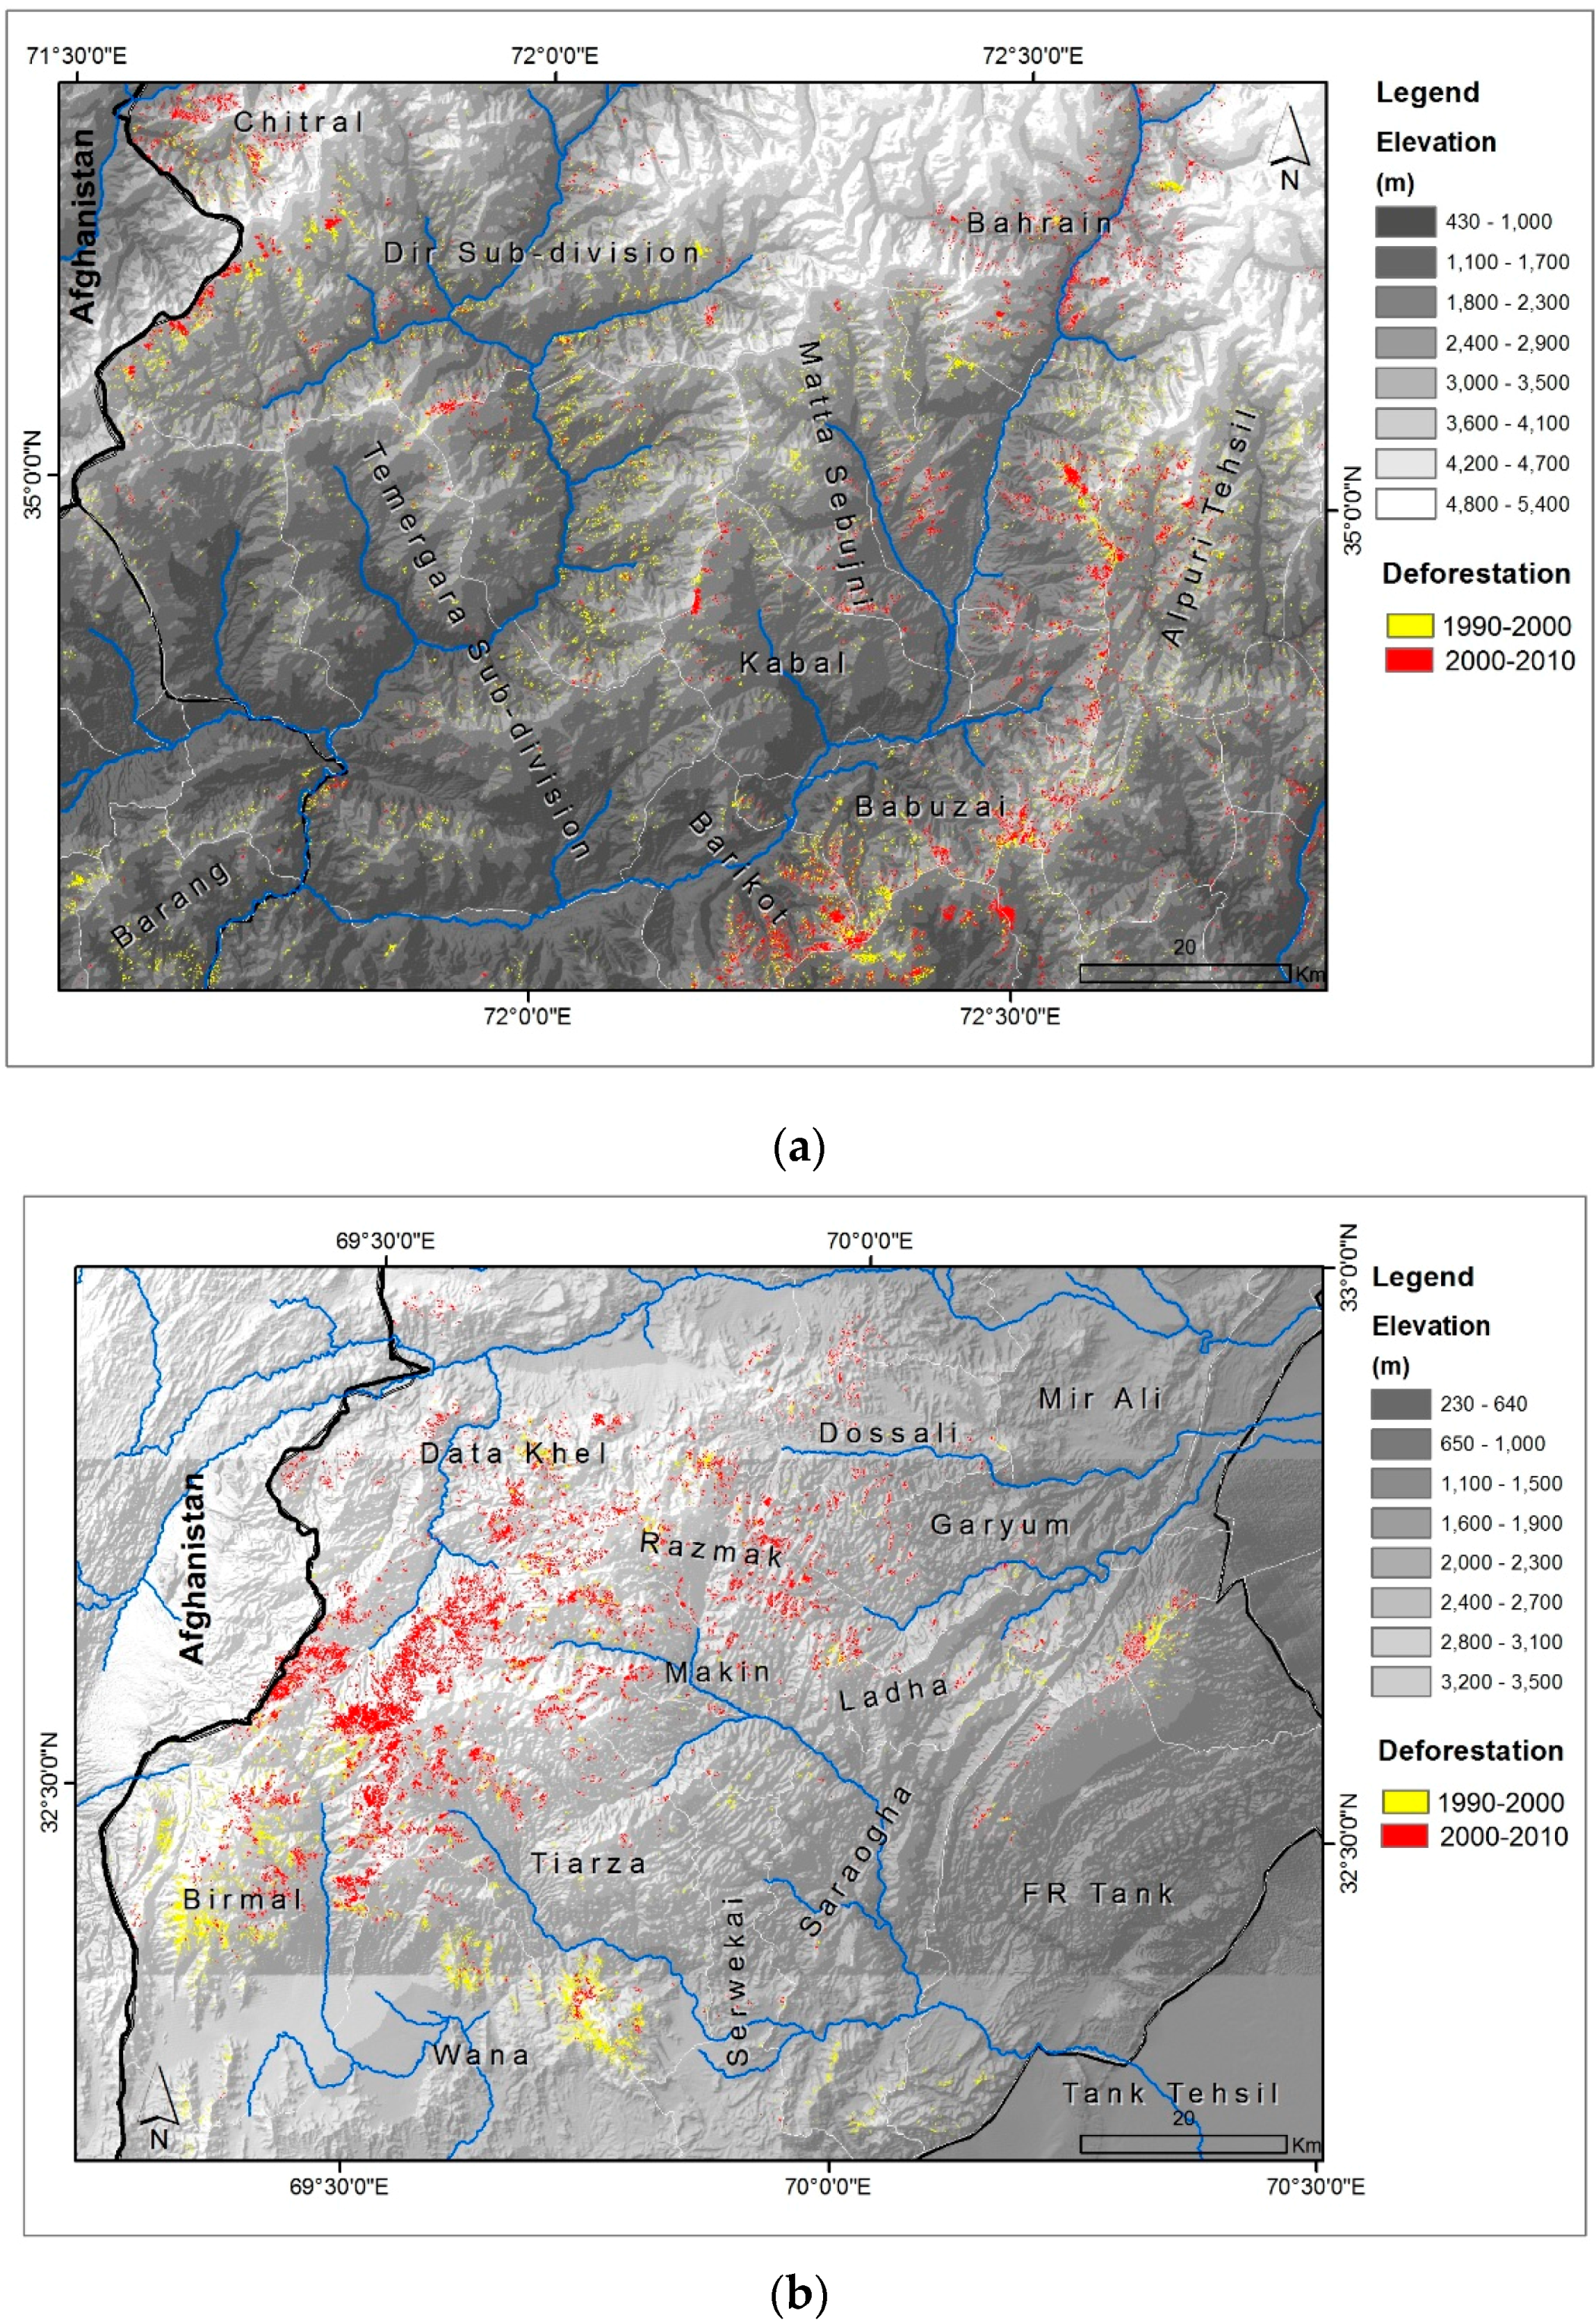
63] for local level assessments. In the current study, the assessment is based on uniform data, methods and interpretations. Overall, the annual forest cover rate of change is −0.38% for the entire area, and there are significant differences in the deforestation rates within the provinces. We note that this overall deforestation rate is inconsistent with the records from international organizations, which state a severe annual deforestation rate of approximately 2%. This study suggests that the international figures are based on site-specific studies, which are mostly conducted within deforestation hotspot areas (
Figure 3) that cannot be accurately extrapolated to the entire landscape. In such local level assessments, the recent temporal forest cover analysis (1968, 1990, 2007) revealed annual deforestation rates of 1.86%, 1.28%, and 0.80% in three zones of Scrub forest, agro-forest and alpine forest, respectively, in the Swat district [
66], whereas reference [
28] observed an annual gross deforestation of 0.81% in the Swat and Shangla districts of KP province during 2001–2009. Further, reference [
56] observed an annual forest cover rate of change of −1.32% during 1996–2008 in the Malakand and Hazara regions. In long period assessments [
8], Schickhoff (1995) observed 50% forest loss in the Kaghan Valley (in the Khyber Pakhtunkhwa province) from 1847 to 1990. He noted that deforestation was high mainly during two time periods; the first occurred from 1847 to 1867 (
i.e., the first two decades of British rule) and the second occurred during the Second World War in the 1940s. In the Siran Valley, reference [
67] identifies 45% forest loss between 1979 and 1988 when a large population of Afghan refugees resettled in this area. Additionally, reference [
68] observed approximately 50% forest cutting in the Basho Valley from 1968 to 2002, which was attributed to illegal commercial harvesting aggravated by political and administrative constraints.
According to reference [
69], deforestation in northern Pakistan is occurring primarily because of institutional neglect and there is a need to implement proper forest management strategies. According to reference [
70], historical analysis complemented with satellite images highlights the role of resource rights in forest protection. Specifically, the disconnect between de jure and de facto resource rights has contributed to extensive deforestation over time. The study emphasizes the need to define these rights more clearly, to implement community management systems and to formalize these rights within a legal framework. Considering the on-going demand for wood for fuel [
48], it is possible that the forests in Malakand and Hazara will cease to exist by 2027. Supplies from plantation, agricultural and range lands will only cover 21% of the total demand at this point in time, and an uncovered demand/supply gap of 8.8 million m
3 by 2027 will continue to grow to 13.6 million m
3 by 2050, of which again only 21% can be covered by local woody bio-mass supplies. In this timber demand situation, a decrease in agricultural areas and reductions in populated lands may also bear witness to small-scale tree cutting as an income-generating activity [
56]. Reference [
71] observed immense deforestation caused by excessive fuel-wood consumption in the Bagh district of Azad Jammu and Kashmir. There are not enough studies exist on associating massive forest loss in mountain region of Pakistan with natural factors like climate, water, landslides, disease, etc.
The observed destruction of forest eco-systems may result in environmental and bio-diversity degradation with loss of function of related ecosystem services such as soil conservation, carbon sequestration and recreational potential. The losses caused by Himalaya’s degradation are not confined to the region itself but also seriously affect the environment and economy of the adjoining plains of the Indus basin through disturbances in the hydrological cycle, which contribute to soil erosion, siltation, floods and desertification. The incidence of floods in the Indus river system has been more severe and more frequent over the past 25 years than during the previous 65 years, primarily because of increased surface runoff and accelerated erosion in the Himalayan mountains [
72]. According to the Pakistan Water Strategy, the country needs to raise water storage of 18 million acre-feet (MAF) by 2050, where 30% of this figure is only to replace storage loss caused by siltation.
The current study is the first systematic effort to characterize forest cover mapping and deforestation assessment of 60% of the forested areas of Pakistan. The results from this study will provide important insight to the deforestation patterns, which will facilitate the development of appropriate forest conservation and management strategies within the country. Careful analysis of these results may provide insights into land-change dynamics, both its causes and consequences, and identify deforestation hotspots. Moreover, the statistics available at the local administrative unit can provide the basis for the regular monitoring of deforestation in the area.
In terms of limitations of the study, the steep terrain posed some challenges in interpreting the forest and its change in shadowed areas. No deforestation has been marked in such situations, which represents the most conservative (unexaggerated) estimate of deforestation. Also, given the slow growth in these forest areas, and thus poor detectability, forest gains were less apparent than losses.


 ,
, 


