Article

Changes in Aerosol Optical and Micro-Physical Properties over Northeast Asia from a Severe Dust Storm in April 2014

1
Institute of Remote Sensing and Digital Earth, Chinese Academy of Sciences, Beijing 100101, China
2
National Satellite Meteorological Center, China Meteorological Administration, Beijing 100081, China
*
Author to whom correspondence should be addressed.
These authors contributed equally to this work.
Remote Sens. 2016, 8(5), 394; https://doi.org/10.3390/rs8050394
Submission received: 4 January 2016 / Revised: 7 April 2016 / Accepted: 12 April 2016 / Published: 9 May 2016

Abstract

:
This study focuses on analyzing the changes to aerosol properties caused by the dust storm called “China’s Great Wall of Dust” that originated from the Taklimakan Desert in April 2014. IDDI (Infrared Difference Dust Index) images from FY-2E and true color composite images from FY-3C MERSI (Medium Resolution Spectral Imager) show the breakout and transport path of the dust storm. Three-hourly ground-based measurements from MICAPS (Meteorological Information Comprehensive Analysis and Process System) suggest that anticyclonic circulation occupying the Southern Xinjiang basin and cyclonic circulation in Mongolia form a dipole pressure system that leads to strong northwesterly winds (13.7–20 m/s), which favored the breakout of the dust storm. IDDI results indicate that the dust storm breakout occurred at ~2:00 UTC on 23 April in the Taklimakan Desert. Four-day forward air mass trajectories with the HYSPLIT (Hybrid Single Particle Lagrangian Integrated Trajectory) model gives the simulation results of the dust transport paths and dust vertical distributions, which are consistent with the corresponding aerosol vertical distributions derived from CALIPSO. The Aerosol Index (AI) data of TOU (Total Ozone Unit) aboard FY-3B are first used to study the areas affected by the dust storm. From the AI results, the dust-affected areas agree well with the synoptic meteorological condition analysis, which supports that the synoptic meteorological conditions are the main reason for the breakout and transport of the dust storm. Anomalies of the average MODIS (Moderate Resolution Imaging Spectroradiometer) AOD (Aerosol Optical Depth) distributions over northeast Asia during the dust storm to the average of the values in April between 2010 and 2014 are calculated as a percent. The results indicate high aerosol loading with a spatially-averaged anomaly of 121% for dusty days between 23 April and 25 April. Aerosol Robotic Network (AERONET) retrievals of VSD (Volume Size Distribution) and SSA (Single Scattering Albedo) show that while the aerosol properties in Dalanzadgad, which is closer to the dust source, were influenced primarily by coarse dust particles, the aerosol properties in Beijing were mostly contributed by fine dust particles that transported over longer distances and at high atmospheric levels.

Graphical Abstract

1. Introduction

Dust storms in northeast Asia usually occur during spring, especially during the months of March and April [1,2,3]. Previous studies have identified the Taklimakan Desert, the Gobi Desert, the Badain Jaran Desert, the Loess Plateau and the Tengger Desert as the major sources of dust in northeast Asia [1,2,4]. Many factors have been examined to account for the variation of dust storms in this region. Anomalous changes in large-scale atmospheric circulation, such as the Antarctic Oscillation (AAO) [5], the Arctic Oscillation (AO) [6] and the Pacific/North American (PNA) pattern [7], are reported to be closely related to the Dust Storm Frequency (DSF) in northern China. These large-scale anomalous atmospheric circulation patterns can alter local climate factors, including temperature, precipitation, wind and moisture, which strongly influence dust storm activity in northeast Asia [8,9,10,11,12]. In addition to the weather and climate, factors, such as land cover change [13,14] and geomorphic conditions [15], can also affect dust storm activity in northeast Asia. To study the transport path and mechanism of such storms, digital simulation and predictive studies have been performed [16,17]. Asian dust aerosols can be transported to vast downwind areas, including large portions of China [18,19], the Korean Peninsula [20], Japan [21], North America [22] and even the Arctic [23], and they can mix with various aerosols during their long-range transport [24]. Satellite aerosol retrievals indicated that dust storms can lead to abnormally high aerosol loading over extended areas downwind of the dust source [25,26]. Dust storms can also change local microphysical aerosol properties, such as Single Scattering Albedo (SSA) and size distribution [27,28]. Despite their nontoxic nature, dust particles carried by dust storms may still have adverse effects on human health, especially the respiratory system. A previous study has shown that the number of people with lung inflammation or stroke increases significantly during a dust storm episode [29]. Dust weather also has a warming effect on the climate, as dust in the atmosphere may change the atmospheric radiation budget, which may consequently affect the weather or even short-term climates [30,31,32].
Because satellites cover large areas with high spatial and temporal resolution, they provide a unique approach to monitor and characterize changes to aerosol properties during the transport of dust storms. FY serial satellites operated by the National Satellite Meteorological Center (NSMC) of China have been used to monitor weather changes for many years. As the air quality of China draws increasing attention, more instruments for detecting atmospheric compositions have been aboard FY satellites in polar orbits. The Total Ozone Unit (TOU) flown on FY-3B has similar bands as the Ozone Monitoring Instrument (OMI), whose Aerosol Index (AI) products have been used extensively to monitor dust storms [33,34]. However, because the OMI has been in operation for over ten years and its AI products suffer from its decay, there is a growing need for new satellite products to monitor dust storms [35].
In this study, the transport and meteorological processes of the severe dust storm called “China’s Great Wall of Dust” by NASA in April 2014 are examined. Although ground-based aerosol products such as PM10 (Particulate Matter) and volume size distribution have demonstrated that coarse dust particles soar in the affected area during dust storms [28,34], few studies have investigated how fine dust particles influence the aerosol properties over downwind areas. In this study, two AERONET (Aerosol Robotic Network) stations in northeast Asia have been selected to examine changes to study the different aerosol properties attributed to the coarse and fine dust particles respectively during this dust storm. With the decay of the OMI instrument, AI products developed using TOU data are introduced for the first time to monitor the transport of dust storms. Further, because of the important role of wind in the formation and transport of dust storms [26,36], ground-based measurements of wind, including wind speed and direction, are used to identify the synoptic meteorological conditions during the April 2014 dust storm. This paper is organized as follows: Section 2 describes the data and models used for the study; Section 3 provides the results from the forward trajectory model, observational datasets depicting the meteorological conditions and the changes to the aerosol properties caused by the dust storm; Section 4 summarizes and concludes this study.

2. Datasets and Methodology

2.1. AERONET Measurements and Retrievals

Aerosol products of two AERONET stations located in Beijing (39.977°N, 116.381°E) and Dalanzadgad (43.577°N, 104.419°E) are used in the current work. The Cimel sky radiometer is the standard AERONET instrument used to measure direct sun and diffuse sky radiances within the 340–1020-nm and 440–1020-nm spectral ranges, respectively [37]. An inversion algorithm was used to retrieve the aerosol volume size distributions for radii ranging from 0.05–15 μm, while single scattering albedos were obtained from spectral sun and sky radiance data. To ensure accuracy, only Level 1.5 data (cloud screened) [38] and Level 2.0 data (quality assured) from both direct sun (Aerosol Optical Depth (AOD)) and inversion products (size distribution and SSA) during the dust storm are used. The uncertainty in AOD retrieval under cloud-free conditions was <±0.01 for wavelengths >440 nm and <±0.02 for shorter wavelengths, which is less than the ±5% uncertainty assigned to sky radiance measurements [39]. The retrieval accuracy has been explained fully by Dubovik et al. [40].

2.2. Meteorological Data

Forward air-mass trajectories are obtained via the HYSPLIT model [41] to reveal the transport pathways and vertical distributions of the dusty air masses. Four-day forward air mass trajectories starting from the Taklamakan Desert (39.51°N, 83.50°E) at 200 m above ground level during the dust storm are shown. The simulation results show the altitude variation along the dust transport path, which give important information of their possible interaction with the Atmospheric Boundary Layer (ABL). The interaction process favors the deposition of dust particles originating from the dust source. This analysis also helps to identify the downwind areas that were mostly affected by the dust storm.
To identify the synoptic meteorological conditions that preceded the dust storm, 3-hourly data records at surface stations in East Asia were documented on weather maps of MICAPS (Meteorological Information Comprehensive Analysis and Process System). MICAPS is an operational data visualization software tool for forecasters in the China Meteorological Bureau (CMA). It defines many types of meteorological data formats for surface or upper observations, model outputs, satellite observations and typhoon pathways. It is now the standard graphics workbench of Chinese forecasters [42]. In this study, an 850-hPa geopotential height and a 10-m wind vector field (i.e., wind speed and direction) are used.

2.3. Space-Based Aerosol Products

True color composite images of the Medium Resolution Spectral Imager (MERSI) aboard the FY-3C satellite launched on 23 September 2013 have been used to outline a general path description of the dust storm. The AI products of TOU aboard FY-3B are an important indicator of UV-absorbing aerosols, such as smoke, dust and volcanic ashes [43]. In this work, Level 2 UVAI grid data derived from TOU with a spatial resolution of 0.5° × 0.5° are used to examine the transport and spatial distribution of the dust particles.
FY-2E is an operational geostationary meteorological satellite. Dust storm monitoring products of FY-2E include the Brightness Temperature Difference (BTD) in split window channels, the Infrared Difference Dust Index (IDDI) and the ratio of middle infrared reflectance to visible reflectance [16]. To evaluate a complete picture of the dust events and to determine the breakout time of the dust storm for the forward air-mass trajectories, hourly IDDI results during the dust storm are collected. IDDI of one cloudless pixel can be defined as the absolute brightness temperature difference in the IR channel under clear sky conditions and under the dust particle loading conditions [36,44]. Because the surface is always hotter than a dust layer, the bright temperature of a pixel under clear sky is considered to be the maximum bright temperature over a 10-day period. Table 1 gives a description of the FY satellites and payloads used in the study.
Level 3 Collection 6 Terra MODIS combined Dark Target/Deep Blue AOD at 550 nm [45,46] are obtained over north Asia to characterize the highly abnormal AOD during the dust storm. Cloud-screening has been performed via the procedure described in Levy et al. [45].
Launched in 2006, CALIPSO carries the Cloud-Aerosol LiDAR with Orthogonal Polarization (CALIOP), a two-wavelength polarization LiDAR (532 and 1064 nm). This instrument provides information on the vertical distribution of aerosols and clouds, cloud particle phases and the classification of aerosol types [47]. CALIPSO attenuated backscatter at 532 nm and the aerosol classification L2 products of Version 3.30 have been used to investigate the aerosol vertical characteristics during the dust storm episode.

3. Results and Discussion

3.1. General Description of the Dust Storm Transport and the Affected Areas

True color composite images of FY-3C MERSI over northeast Asia on several days during the dust storm (Figure 1) reveal highly turbid atmospheres and a significant amount of dust transported over the area. The geolocation information of the affected areas is shown in Figure 2.
In Figure 1, the dust particles from the South Xinjiang basin were blown eastward and northeastward and spread over thousands of kilometers from the Taklimakan Desert to northeast China and Mongolia via Gansu province, Qinghai province, Inner Mongolia and Heilongjiang province. The dust storm reduced the air quality over its transport path. Ground-based PM10 (Particulate Matter) measurements collected from meteorological measurement stations of the CMA (China Meteorological Administration) showed extremely high concentrations of dust in Lanzhou (2576 μg/m3), Yinchuan (2053 μg/m3), Xining (1492 μg/m3) and Baotou (2734 μg/m3) between 23 April and 24 April. The plumes of the severe dust storm were thick enough to obscure the land and water surfaces from space.

3.2. Synoptic Meteorological Conditions during the Dust Storm

In this section, the atmospheric circulation characteristics over northeast Asia during the dust storm are examined. For this purpose, a synoptic map based on the MICAPS ground-based measurements and a re-analysis of the datasets is constructed (Figure 3). The map includes an 850-hPa geopotential height (corresponding to a height of ~1500 m) in which dust events usually occur and a wind vector field, including wind direction and wind speed during the dust storm.
On 22 April, a low pressure center and a primary high pressure center are evident over the middle (65°N, 110°E) and west of Russia (55°N, 45°E), respectively. The cyclonic circulation and anticyclonic circulation formed by the two pressure centers appear to be the driving force for abnormally strong winds that led to the breakout of the dust storm. As the two circulations progress, the dipole in the geopotential height on 23 April (with low values of 1400 m over the southern Xinjiang basin and high values of 1560 m over Kazakhstan) induces a strong northwesterly wind over the Taklamakan Desert, leading to the breakout of the dust storm. This wind velocity can reach 13.9–20.7 ms−1 or even more in certain locations. Similar results have also been found by Rodriguez et al. [48], who measured the variability of this high–low dipole-like pattern in terms of the North African Dipole Intensity (NAFDI). In this case, increases in the NAFDI resulted in higher wind speeds, which were associated with enhanced dust export over the subtropical North Atlantic. As the dipole system progresses on 24 April, the ridge over Qinghai and Gansu provinces combined with the trough over western Inner Mongolia to induce strong westerly and southwesterly flows. These phenomena transported dusty air masses from the Xinjiang basin toward the south of Mongolia and northeast China. On 25 April, the center of two pressure systems disperse, and the strength of the dipole system weakened significantly, with a concomitant reduction in dust activity over the region. Northerly winds with speeds of 8.0–13.8 m/s induced by the high pressure system at Shanxi and western Inner Mongolia province brought the dust particles southward.

3.3. The Breakout and Transport Path of the Dust Storm

Figure 4 shows the dust identification IDDI images derived from FY-2E from 23 April–26 April 2014 at 01:00, 02:00 and 06:00 UTC. The study of IDDI is considered to reveal the breakout time and transport paths of the dust storm.
As seen, the dust storm’s path and progress can clearly be discerned. The dust storm originated in the Taklamakan Desert at 2:00 UTC on 23 April as a result of the high–low pressure dipole (Figure 3) and the associated increase in strong wind. The high IDDI value of 15–20 K, which corresponds to an AOD of 1.3–1.4, is according to empirical comparisons with Sahelian stations [44] located around the dust source in the Xinjiang basin at 06:00 UTC on 23 April. As the high–low pressure dipole progresses, the largest areas, including Xinjiang, Qinghai, Gansu, west of Inner Mongolia and south of Mongolia, are affected by the dust storms, with an IDDI value of 20–30 K in most of the affected places (with some exceeding 30 K) at 06:00 UTC on 24 April. As the strength of the high–low pressure dipole with the two pressure centers disperses, relatively lower IDDI values (15–5 K) with large gaps in the dust transport path appear on 25 April. Dispersed dust affected points with low IDDI values (<15 K) indicate that the dust storm ended on 26 April.

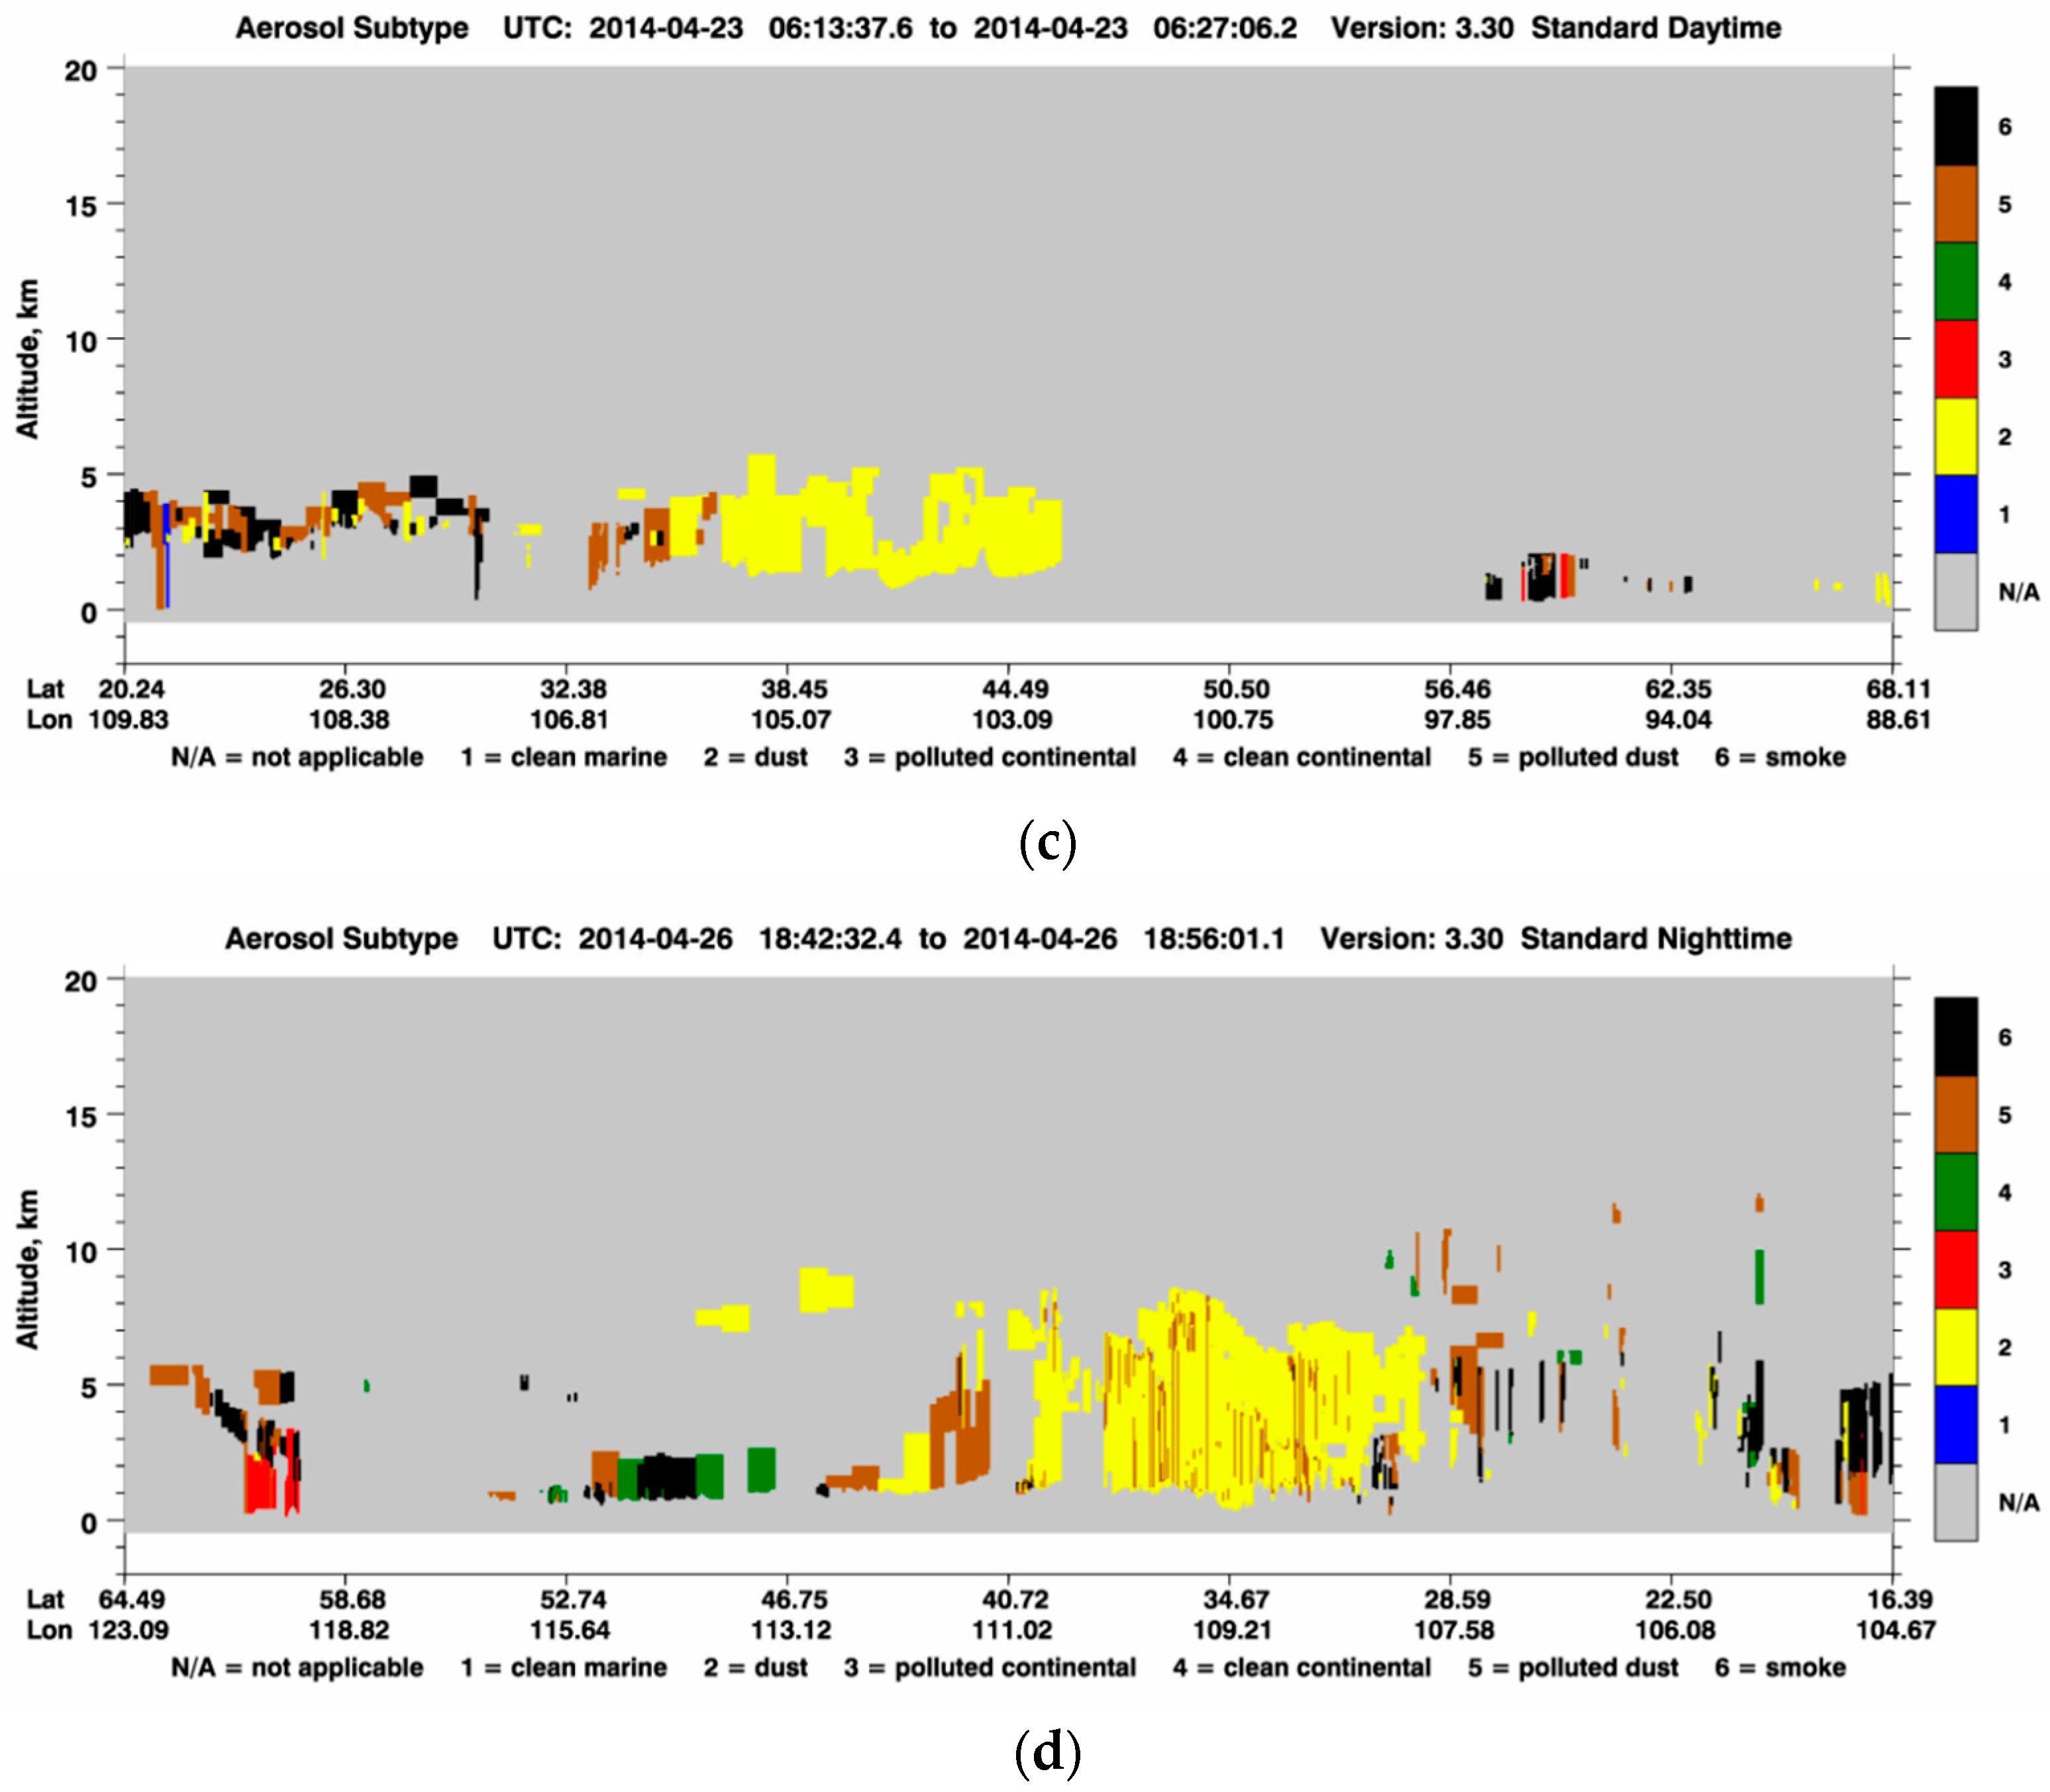
3.4. Vertical Distribution of Dust Particles

Knowledge of dust-aerosol vertical profiles is crucial because they influence radiative forcing, heating rates and the stability of the atmosphere [49,50,51]. Thus, four-day forward air mass trajectories are used to simulate the position of the dust and its vertical distribution. CALIPSO observations are used to validate the simulated height of the dust particles along the overpass trajectory.
Figure 5 shows the four-day forward air mass trajectories starting from the Taklamakan Desert (39.51°N, 83.50°E) at 200 m above ground level during the dust storm. The starting time of the simulation was set to 02:00 UTC on 23 April, which can be determined from the IDDI results. As seen, the dusty air masses first move eastward and then shift northeastward when they reach west of Inner Mongolia (~95.0°E), affecting the south of Mongolia and northeast China. The dust transport mechanisms and pathways are a function of the synoptic and dynamic processes in the atmosphere, which control the dust plume movement and altitude [52,53,54]. The presence of a low-pressure system over Mongolia and a high-pressure system over Xinjiang province on 24 April directs the air masses toward the northeast (in a cyclonic circulation) and uplifts them to heights >3 km (along the ABL). The air-mass altitude plays an important role in dust lifecycles, especially when the air mass interacts with the ABL, and it affects the atmospheric heating and dynamics, the dust deposition and the PM concentrations at the ground [55,56]. The analysis shows that shortly after the storm’s outbreak, the altitude of the dust plume remains below 3 km (mainly within the ABL) over northwestern China (including Xinjiang, Qinghai and Gansu provinces) and south of Mongolia, and it is capable of depositing a large amount of heavy and coarse dust particles. The rising dust then drifts with warm air advection to a height of 3–6 km (above ABL) over the central part of north China (32°N–42°N; 105°E–123°E) between 25 April and 26 April, causing hazy atmospheric conditions.
During the studied period (23–26 April 2014), the vertical profile products, including the vertical profiles of the Total Attenuated Backscatter (TAB) at 532 nm and the aerosol subtype from CALIPSO, that overpass the affected areas are collected to illustrate and validate the simulated vertical distributions of the dust particles (Figure 6).
The pass of CALIPSO on 23 April over the area of interest crosses the south of Mongolia, the west of Inner Mongolia and Ningxia, Gansu and Shanxi provinces (35.5°N, 106°E–45°N, 102°E), which are located ~1900 km from the dust source. The TAB and aerosol subtype image shows a thick (0.0025–0.004 km−1·sr−1) aerosol layer covering the area of interest within ~3.0 km above the ground. The forward air mass trajectory simulations show a similar dust height over the same area (Figure 5) and illustrate that the transport of dust particles is primarily within the ABL, leading to significantly dry dust deposition and extremely high PM10 in the four ground-based stations mentioned above.
The pass of CALIPSO on 26 April over the area of interest crosses Liaoning, east of Inner Mongolia province and east of Mongolia (41°N, 122°E–51°N, 114°E), which are located ~3700 km from the dust source. Although there are gaps of data on 26 April, dust particles located above 5 km (above the ABL) can be figured out, which is consistent with the simulation results. After a long distance transport, the dust plume was strongly attenuated, whereas large particles became deposit and fine dust particles travelled above the ABL by circulation and transported far from the dust source.

3.5. Spatial Distribution of Dust Particles with AI from TOU

The aerosol index derived from the difference between the wavelength dependence of reflected radiation in the presence of aerosols and that under pure molecular atmospheric conditions can be used to indicate the presence of ultraviolet (UV)-absorbing aerosols, such as dust and black carbon aerosols [57]. Considering the high sensitivity to the absorption of dust particles in the UV band, the aerosol index derived from TOU measurements is first used to examine the transport of airborne dust particles. Figure 7 gives the TOU AI values over northeast Asia during the dust storm.
TOU measurements at 331 nm and 360 nm are used to calculate the AI products. For the TOU sensor, the AI index can be defined as:
A I = 100 { l o g 10 [ I 360 M e a s I 331 M e a s ] l o g 10 [ I 360 C a l c I 331 C a l c ] }
where I 331 M e a s and I 360 M e a s are the TOA radiance measurements at 331 nm and 360 nm, respectively, and I 331 C a l c and I 360 C a l c are the simulated radiance of the corresponding bands using a radiative transfer model with the assumption of only pure atmospheric molecular scattering.
On 22 April, two high value areas appear at the Taklamakan Desert and northern Myanmar. The high UV AI value over northern Myanmar can be attributed to the BC (Black Carbon) emission transport from southwest Asia and obscuration by the Tibetan Plateau [58]. On 23 April, consistent with the IDDI result, the breakout of the dust storm in the southern Xinjiang basin led to a high value (AI > 5) area corresponding to the Taklamakan Desert expanding northeastward to the west of Inner Mongolia. On 24 April, the anticyclonic circulation over the southern Xinjiang basin and the cyclonic circulation over Mongolia caused an enhancement of the dust storm, which led to a high value area over the Xinjiang basin. The high value area also extends northeastward to the south of Mongolia as a result of a strong southwesterly wind. On 25 April, the high value area over the dust source of the southern Xinjiang basin decreased as the dust storm became weakened. Westerly winds caused by the impact of the trough and ridge over Mongolia continued to carry fine dust particles to the southeast of Mongolia and northeast China, leading to a high AI value area over the corresponding locations. Northerly winds caused by the high pressure center over Gansu province brought dust southward, leading to high value areas to the south of Gansu and to the east of Sichuan, Guizhou, Yunnan and Guangxi provinces.

3.6. Changes of Aerosol Properties over Northeast Asia

3.6.1. Changes in the Combined AOD Products of MODIS

The mean MODIS AOD550 distributions over northeast Asia during the dust storm between 23 April and 25 April and average distributions in April between 2010 and 2014 are shown in Figure 8a,b, respectively. Anomalies calculated following the method given by [26] are given in Figure 9.
The AOD spatial distribution during the dust storm (Figure 8b) shows enhanced values over northwest China, including Xinjiang province, Gansu province, Qinghai province and Inner Mongolia. Compared to the five-year average AOD in April (Figure 8a), aerosol loading during this dust storm was much higher, with AOD values at 550 nm up to 2.9 observed over the northwest China. The high aerosol loading is associated with dust exposure from the Taklamakan Desert, which is one of the most active dust sources in northeast Asia. The aerosol loading was significantly lower over other countries on the northwest of China, such as Kazakhstan, which is not on the dust transport path and is seldom influenced by dust storms with AOD values lower than 0.3. However, the abnormally high aerosol loading was not limited over northwest China, but covered nearly the entire northern region of China (~35–45°N, 75–115°E), with mean anomalies from the five-year average as high as 121% (Figure 9). The spatial-averaged (~35–45°N, 75–115°E) AOD values over north China at 550 nm were approximately 0.596, 1.348 and 1.050 on 23–25 April, respectively, revealing the intensity and permanency of this phenomenon.

3.6.2. Changes in the Aerosol Microphysical Properties

Variations in AOD and microphysical properties during the April 2014 dust storm were examined using AERONET products at Beijing and Dalanzadgad.
The AOD (675 nm) variability from 22 April 2014–27 April 2014 is shown in Figure 10. As seen, the AOD values were higher during the dust storm (23–25 April) than the days preceding and following it. The average AOD values at Beijing and Dalanzadgad during the dust storm were 1.266 and 0.306, respectively, whereas on the non-dusty days between 22 and 27 April, the AOD values ranged from 0.349–0.518 in Beijing and 0.093–0.155 in Dalanzadgad, with an average of 0.430 and 0.119, respectively. The dusty days include 23 April, 24 April and 25 April, whereas the non-dusty days include 22 April, 26 April and 27 April.
Figure 11 and Figure 12 illustrate the variation in the aerosol Volume Size Distributions (VSD) and Single Scattering Albedo (SSA) from 22 April–27 April, which show a clear distinction between dusty and non-dusty days. The annual average VSD and SSA in 2014 are also shown.
According to the annual average VSD and SSA, the aerosol model of Dalanzadgad can be characterized as fine/coarse mode aerosol mixtures that are dominated with fine particles. Though the annual averaged VSD peak of coarse particles (~0.02 μ m 3 / μ m 2 ) is larger than that of fine particles (~0.01 μ m 3 / μ m 2 ), the latter have a larger contribution to the total AOD, with a five year FMF average of 54.3% (2010–2014). As shown in Figure 11b, the annual average SSA decreases with wavelength, which mainly reflects the scattering and absorption properties of the fine particles. During the dusty days, the VSD peak of the coarse mode volume (with a maximum of 0.28 μ m 3 / μ m 2 on 24 April) was clearly higher than that on the non-dusty days (<0.04 μ m 3 / μ m 2 ). The peak of the fine particle volume during the dusty days shows a relatively lower increase of ~0.01 μ m 3 / μ m 2 . Dalanzadgad is closer (~2000 km) to the dust source than Beijing (~3100 km). In addition to the shorter distance to the dust source, the strong southwesterly winds induced by the dipole pressure system bring a large amount of coarse dust particles to Dalanzadgad, leading to an increase in the coarse particle volume peak. Because the coarse particles easily deposit, the peak of the coarse particle volume decreased to ~0.04 μ m 3 / μ m 2 on 25 April when the dust storm began to weaken.
Figure 11a indicates more complex aerosol property changes in Beijing during the dusty days compared to Dalanzadgad. The VSD peaks for both fine and coarse mode aerosols (with averages of ~0.125 ±   0.06   μ m 3 / μ m 2 and ~0.28 ±   0.08   μ m 3 / μ m 2 , respectively) show a distinct increase compared to non-dusty days (with averages of ~0.07 ±   0.03 μ m 3 / μ m 2 and ~0.18 ±   0.1   μ m 3 / μ m 2 , respectively). Because of further distance from the dust source and the fast deposition of coarse particles during the transport path, fine dust particles are the main contributors to the high aerosol loading (with AOD of 1.266 ± 0.06, on average) during the dusty days. The AERONET-retrieved fine mode weighting (FMF) of AOD at 675 nm was 89.9%, 77.6% and 62% on 23, 24 and 25 April, respectively. Strong northerly winds with speeds of 13.9–20.7 m/s appear in Beijing (not shown in Figure 3) on 26 April, resulting in the sharp decrease of aerosol loading from ~1.3 on 25 April to ~0.5 on 26 April. The strong wind dissipates the high aerosol loading over Beijing and brings some dust particles from northeast China. This phenomenon results in a fine mode volume peak that decreases sharply (~0.04 μ m 3 / μ m 2 ), whereas the coarse mode volume peak remains at a relatively high level (~0.3 μ m 3 / μ m 2 ) compared to dusty days. On 27 April, as the local anthropogenic fine aerosols and the deposition of coarse particles increased, the VSD peak of the fine mode particles increase, whereas the peak of the coarse mode particles decrease.
The annual average SSAs in 2014 demonstrate that the maximum SSA value (~0.82) occurred at 440 nm at Dalanzadgad, whereas that at Beijing occurred at 670 nm (~0.94). These data suggest a smaller size and stronger absorption of the aerosol particles at Dalanzadgad. According to the AERONET almucantar retrievals in 2014, the annual average effective radii of the fine and coarse mode particles at Dalanzadgad were 0.146 μm and 1.984 μm, respectively, and 0.157 μm and 2.420 μm for Beijing, respectively. Similar to a previous study on SSA spectral variations for fine aerosols with an angstrom exponent greater than 1.4 at Beijing and Kanpur [59], the annual average spectral SSA at Dalanzadgad decreased with wavelength, demonstrating the dominance of absorbing fine particles. For dusty days, the introduced strong scattering dust particles increased gradually, leading to an increase in the SSA at all four wavelengths. During this period, the SSA at each band increased continuously and the increasing amplitude increased with wavelength. On 24 April, the minimum SSA at all wavelength is ~0.88 at 440 nm, whereas the average SSA at the other wavelengths is ~0.97 ± 0.01. On 22 April, the average SSA at all wavelength is ~0.80 ± 0.02. Compared to the non-dusty days, the large amount of coarse dust particles on dusty days increased the effective radius of the aerosol mode, resulting in stronger scattering at longer wavelengths. The SSA at each band decreased gradually, and the decreasing amplitude increased with wavelength after 25 April. This can be attributed to a reduction of the introduced dusts and rapid deposition of early dust particles.
In Beijing, a large amount of dust particles was transported from the dust source because of the frequent number of springtime dust storms, leading to larger effective radii and stronger scattering at longer wavelengths compared to the other seasons. This is why the spectral SSA on 22 April peaked at a relatively longer wavelength (870 nm) than that of the annual average (675 nm). The SSAs of dusty days were larger at all wavelengths compared to the non-dusty day of 22 April. The average SSA of all four bands for the dusty days and the non-dusty day of 22 April are ~0.955 ± 0.005 and ~0.935 ±   0.015 , respectively. In Dalanzadgad, coarse particles mostly contribute to the AOD, with the average FMF at 675 nm during the dusty days being 27% and 77% for Dalanzadgad and Beijing, respectively; however, a large amount of fine dust particles was introduced through long-range transport from the Taklimakan Desert, which resulted in a sharp increase in AOD (with an average AOD of 1.266). The spectral SSA variation of dusty days shows a similar shape with the maximum at 675 nm and then decreases with wavelength. Compared to the coarse dust particles that strongly absorb at 440 nm, fine dust particles show relatively stronger scattering for their smaller radii, which is why the SSA values at 440 nm during the dusty days are larger than those on non-dusty days. Previous studies on the changes to the aerosol properties in Beijing caused by the dust storm [60,61,62,63] found that coarse dust particles led to higher AOD, lower AE (Angstrom Exponent) and an increase of spectral SSA with wavelength. Different spectral SSA variations in Beijing during this dust storm can be attributed to the influence of fine dust particles.
The spectral SSA variation on 26 April indicates distinct coarse dust particle properties, which show strong absorption at 440 nm and strong scattering at longer wavelengths. The different aerosol properties can be attributed to the strong northerly wind, dissipation of the high fine dust aerosol loading and the introduction of coarse dust particles from northeast China. On 27 April, as the local anthropogenic fine aerosols and the deposition of coarse particles increased, the spectral SSA decreased with wavelength, which was similar to the annual average in Dalanzadgad. However, the SSA at each band is larger than 0.93, whereas the SSA at each band is less than 0.82 for the annual average in Dalanzadgad. These data suggest the dominant contribution of fine particles in Beijing with much stronger scattering compared to Dalanzadgad for non-dusty days.

4. Conclusions

The present study examined the transport of the dust storm termed “China’s Great Wall of Dust” between 23 April and 25 April 2014. Changes to the aerosol properties in the downwind areas caused by the dust storm were analyzed. The main findings are summarized as follows:
  • Dust identification IDDI images derived from FY-2E showed that the dust storm originated from the Taklamakan Desert at 2:00 a.m. UTC on 23 April, moved eastward and northeastward on 24 April, dissipated on 25 April and ended on 26 April.
  • From four-day forward air mass trajectories, the dusty air masses were mostly transported within the atmospheric boundary layer (<3 km) over northwest China on 23 and 24 April; however, they progressively increased in altitude to above 5 km over the surface when they reached the central part of north and northeast China.
  • Anticyclonic circulation occupying the southern Xinjiang basin and cyclonic circulation in Mongolia formed the typical case of a low–high dipole orienting in the northeast-southwest direction over the source areas, which led to strong, high speed winds that favored dust storm formation. AI derived from TOU is sensitive to dust particles. The dust-affected areas show consistency with the synoptic meteorological condition analysis, strongly suggesting that such conditions are the primary reason for the breakout and transport of the dust storm.
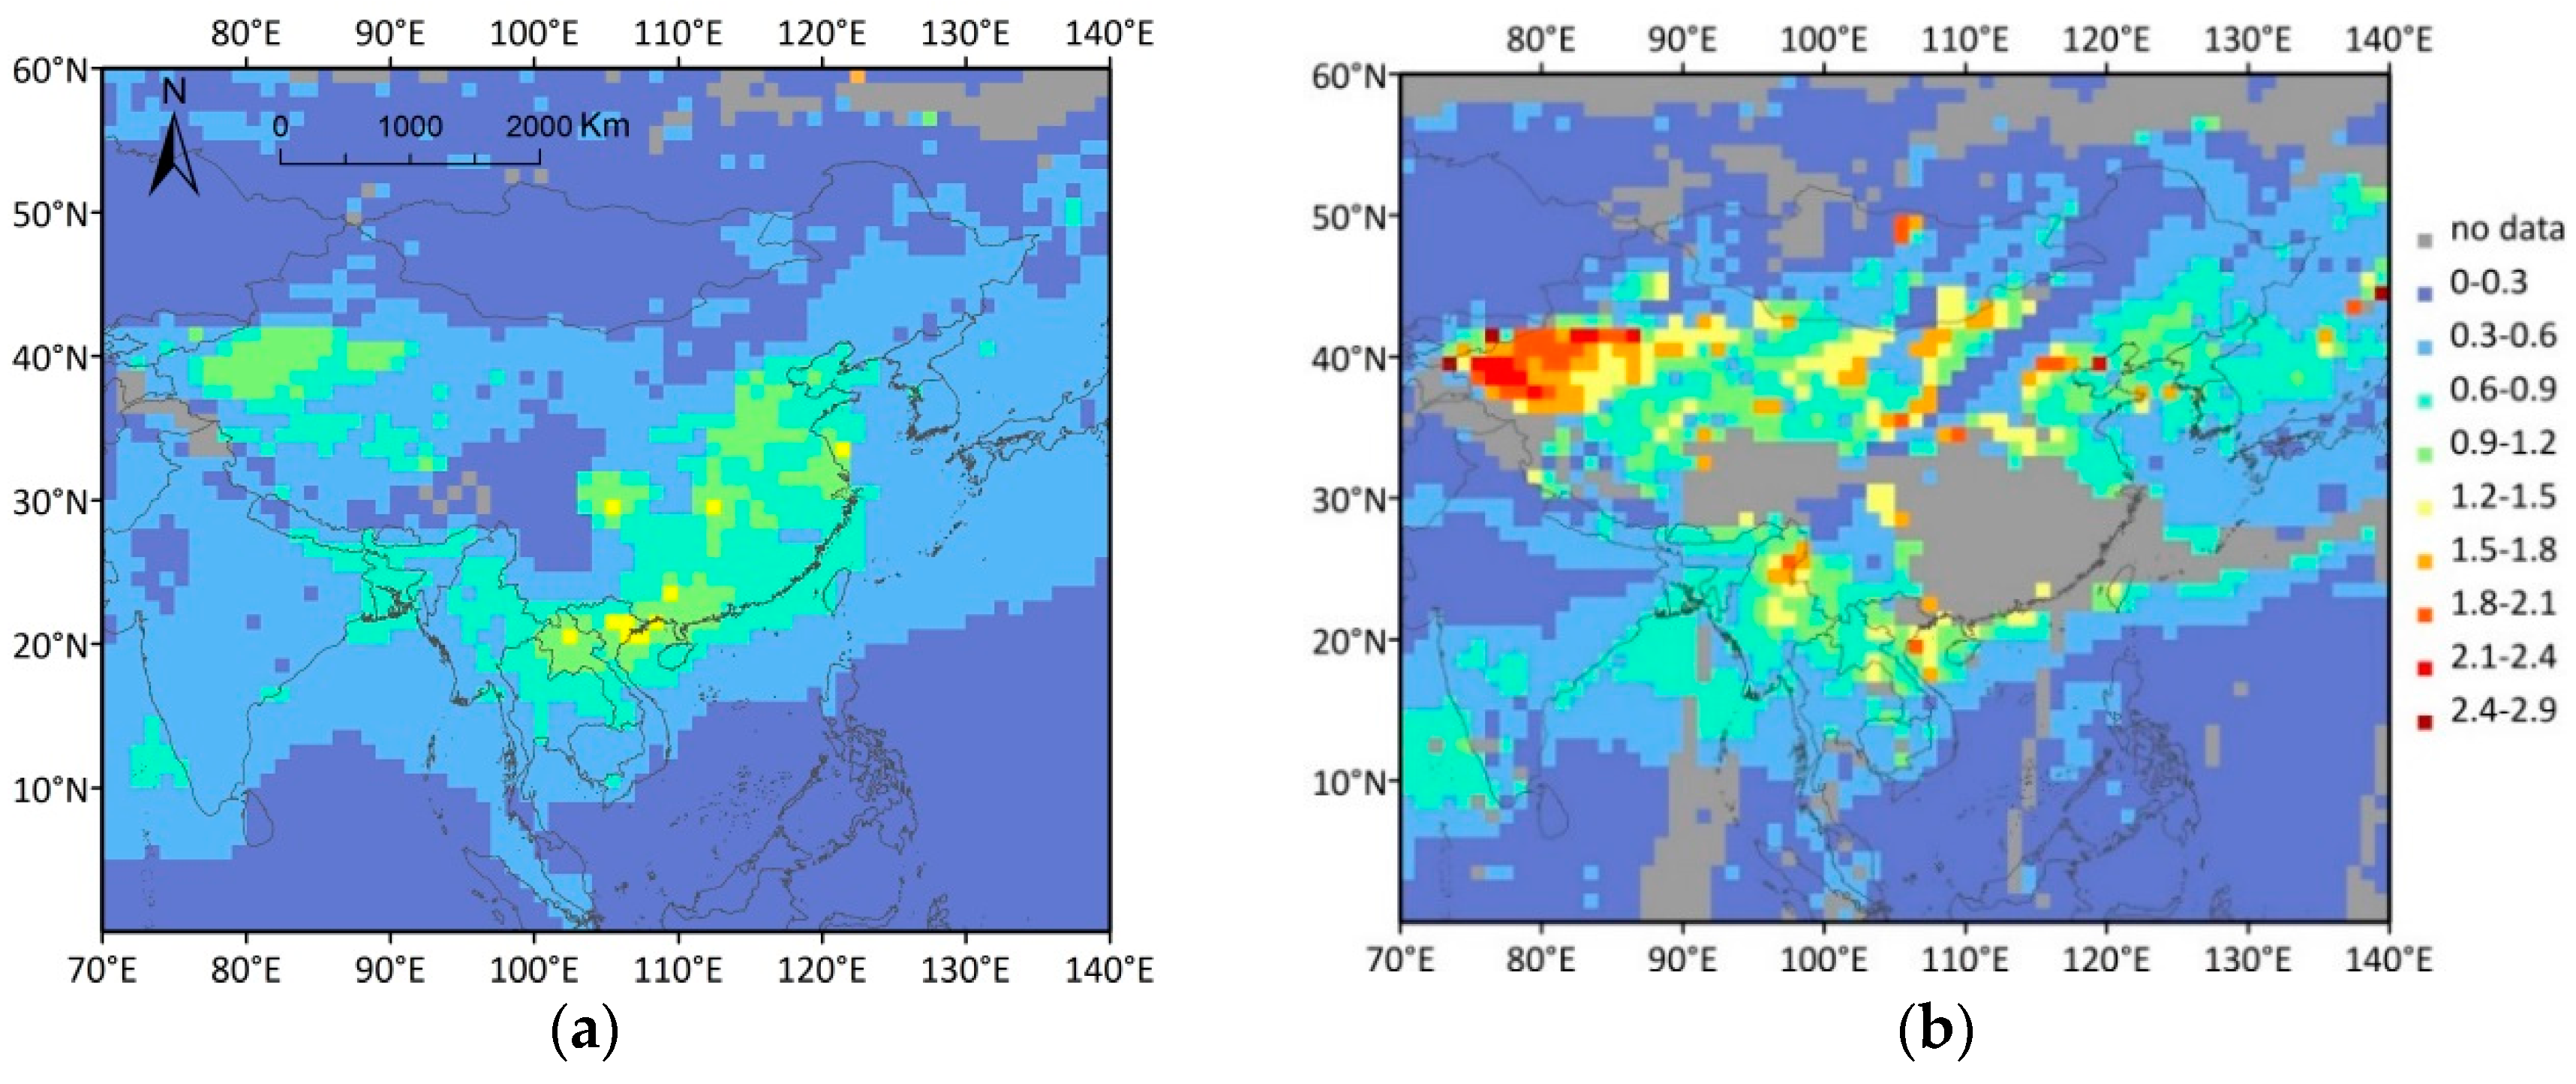
  • Anomalies of the mean MODIS AOD distributions over northern China during the dust storm to the average of those in April between 2010 and 2014 were as high as 121% and, hence, reveal high aerosol loading over the affected areas in northern China and south of Mongolia caused by the dust storm.
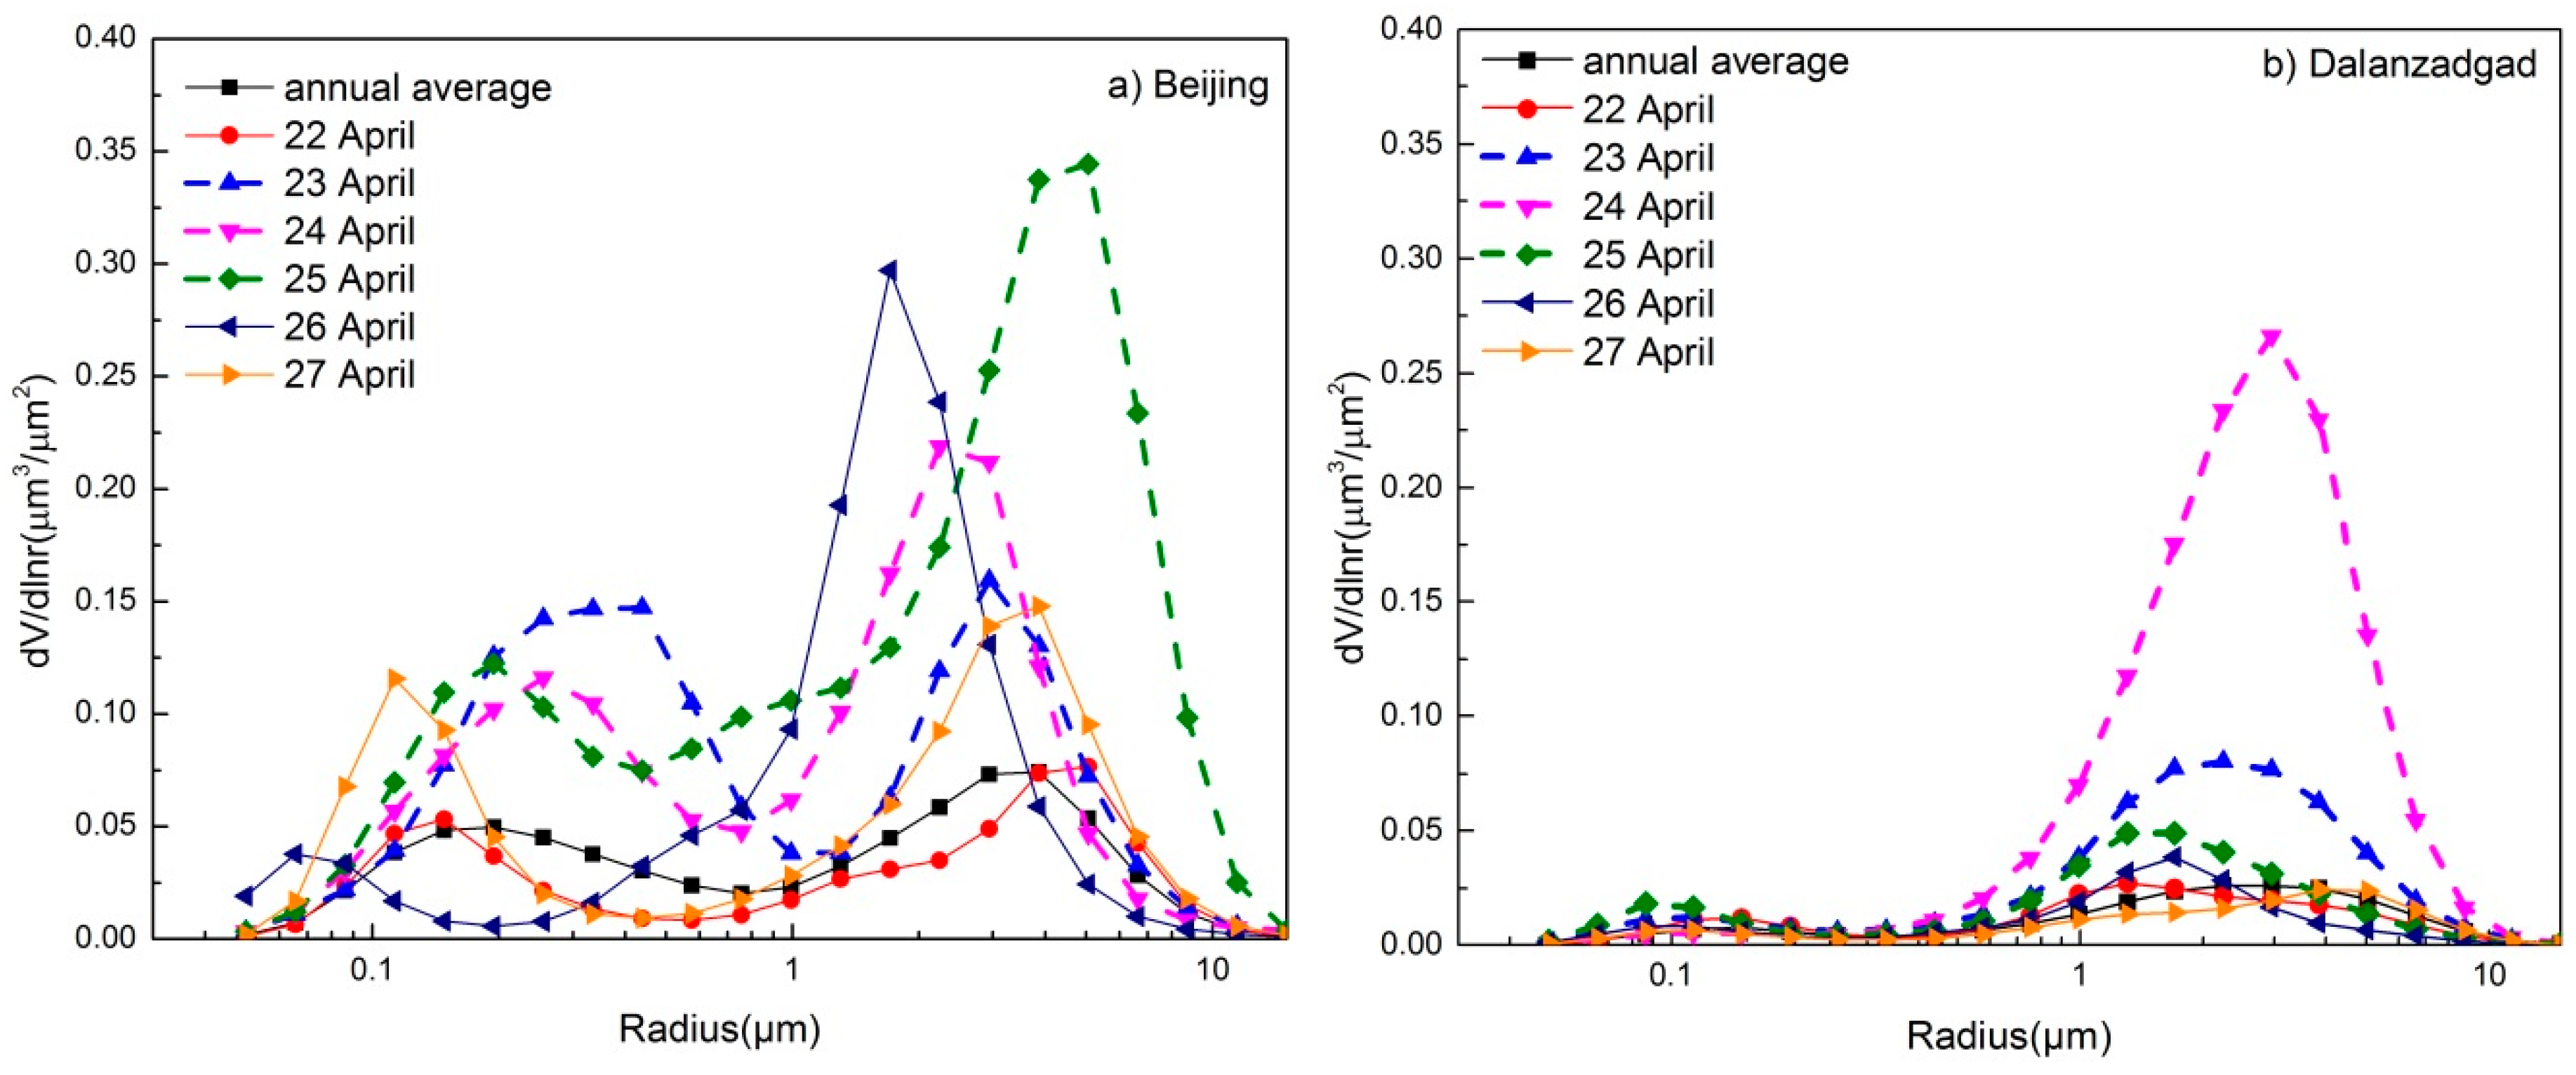
  • The dust storm brought different variations in the aerosol microphysical properties (i.e., VSD and SSA) between Beijing and Dalanzadgad as a result of the different distances from the dust source and the wind induced by the dipole pressure system. While the aerosol properties in Dalanzadgad, which is located closer to the dust source, were primarily influenced by coarse dust particles, the aerosol properties in Beijing were mostly influenced by fine dust particles that travelled over longer distances and at higher levels of the atmosphere.

Acknowledgments

This work was co-supported by National Natural Science Foundation of China (Grant Nos. 41306185 and 41175024), the National Key Basic Research and Development Program (973 Program, Grant No. 2011CB403401), the Research program funded by State of Administration of Science, Technology and Industry for National Defence (Grant No. 32-Y20A22-9001-15/17) and the National High Technology Research and Development Program of China (863 Program, Grant No. 2011AA12A104). We thank the PIs for their effort in establishing and maintaining the Beijing and Dalanzadgad AERONET sites used in this investigation. Thanks are given to the MODIS and CALIPSO mission scientists and associated NASA personnel for the production of the data used in this research effort. The authors gratefully acknowledge the NOAA Air Resources Laboratory (ARL) for the provision of the HYSPLIT transport and dispersion model.

Author Contributions

Li Fang examined the changes in aerosol properties by the synergy of satellite remote sensing and ground-based measurements and wrote the paper. Shupeng Wang contributed to the HYSPLIT model and infrared difference dust index analysis and revised the paper. Tao Yu and Xingfa Gu provided the technical guidance and contributed to analysis with CALIPSO products. Xingying Zhang and Weihe Wang contributed to the aerosol index retrieval. Suling Ren contributed to the synoptic meteorological conditions analysis.

Conflicts of Interest

The authors declare no conflict of interest.

Abbreviations

The following abbreviations are used in this manuscript:
IDDIInfrared Difference Dust Index
MERSIMedium Resolution Spectral Imager
AIAerosol Index
TOUTotal Ozone Unit
MODISModerate Resolution Imaging Spectroradiometer
AODAerosol Optical Depth
AERONETAerosol Robotic Network
SSASingle Scattering Albedo
OMIOzone Monitoring Instrument
HYSPLITHybrid Single Particle Lagrangian Integrated Trajectory
MICAPSMeteorological Information Comprehensive Analysis and Process System
DSTDust Storm Monitoring
CALIPSOCloud-Aerosol LiDAR with Orthogonal Polarization
UVUltraviolet
VSDVolume Size Distributions
FMFFine Mode Weighting

References

  1. Dong, Z.; Wang, X.; Liu, L. Wind erosion in arid and semiarid China: An overview. J. Soil Water Conserv. 2000, 55, 439–444. [Google Scholar]
  2. Prospero, J.M.; Ginoux, P.; Torres, O.; Nicholson, S.E.; Gill, T.E. Environmental characterization of global sources of atmospheric soil dust identified with the NIMBUS 7 Total Ozone Mapping Spectrometer (TOMS) absorbing aerosol product. Rev. Geophys. 2002, 40, 1002. [Google Scholar] [CrossRef]
  3. Wang, X.; Xia, D.; Wang, T.; Xue, X.; Lia, J. Dust sources in arid and semiarid China and southern Mongolia: impacts of geomorphological setting and surface materials. Geomorphology 2008, 97, 583–600. [Google Scholar] [CrossRef]
  4. Guan, Q.; Yang, J.; Zhao, S.; Pan, B.; Liu, C.; Zhang, D.; Wu, T. Climatological analysis of dust storms in the area surrounding the Tengger Desert during 1960–2007. Clim. Dyn. 2016, 42, 1–11. [Google Scholar]
  5. Ke, F.; Wang, H. Antarctic Oscillation and the dust weather frequency in North China. Geophys. Res. Lett. 2004, 31, 399–420. [Google Scholar]
  6. Gong, S.L.; Zhang, X.Y.; Zhao, T.L.; Blanchet, J.-P.; McKendry, I.G.; Zhou, Z.J. A simulated climatology of asian dust aerosol and its trans-pacific transport. Part II: Interannual variability and climate connections. J. Clim. 2006, 19, 104–122. [Google Scholar] [CrossRef]
  7. Gong, D.Y.; Mao, R.; Shi, P.J.; Fan, Y.D. Correlation between East Asian dust storm frequency and PNA. Geophys. Res. Lett. 2007, 34, 176–192. [Google Scholar] [CrossRef]
  8. Qian, W.; Quan, L.; Shi, S. Variations of the dust storm in China and its climatic control. J. Clim. 2002, 15, 1216–1229. [Google Scholar] [CrossRef]
  9. Gao, T.; Su, L.J.; Ma, Q.X.; Li, H.Y.; Li, X.C.; Yu, X. Climatic analyses on increasing dust storm frequency in the springs of 2000 and 2001 in Inner Mongolia. Int. J. Clim. 2003, 23, 1743–1755. [Google Scholar] [CrossRef]
  10. Kurosaki, Y.; Mikami, M. Resent frequent dust events and their relation to surface wind in East Asia. Geophys. Res. Lett. 2003, 30, 1736. [Google Scholar] [CrossRef]
  11. Liu, X.D.; Yin, Z.Y.; Zhang, X.Y. Analyses of the spring dust storm frequency of northern China in relation to antecedent and concurrent wind, precipitation, vegetation, and soil moisture conditions. J. Geophys. Res. 2004, 109. [Google Scholar] [CrossRef]
  12. Xu, J.X.; Liao, J.H. Original and secondary high-frequency sand storm zones in the Loess Plateau region, China. Geogr. Ann. 2007, 89, 121–127. [Google Scholar] [CrossRef]
  13. Zhang, J.Y.; Dong, W.J.; Fu, C.B. Impact of land surface degradation in norther China and southern Mongolia on regional climate. Chin. Sci. Bull. 2005, 50, 75–81. [Google Scholar] [CrossRef]
  14. Xu, X.K.; Jason, K.L.; Lin, Z.H.; Chen, H. An investigation of sand dust storm events and land surface characteristics in China using NOAA NDVI data. Glob. Planet. Change 2006, 52, 182–196. [Google Scholar] [CrossRef]
  15. Wang, X.M.; Zhou, Z.J.; Dong, Z.B. Control of dust emissions by geomorphic conditions, wind environments and land use in northern China: An examination based on dust storm frequency from 1960 to 2003. Geomorphology 2006, 81, 292–308. [Google Scholar] [CrossRef]
  16. Hu, X.Q.; Lu, N.M.; Niu, T.; Zhang, P. Operational retrieval of Asian sand and dust storm from FY-2C geostationary meteorological satellite and its application to real time forecast in Asia. Atmos. Chem. Phys. 2008, 8, 1649–1659. [Google Scholar] [CrossRef]
  17. Gao, T.; Zhang, X.B.; Wu, L.A. Seasonal forecast scheme for spring dust storm predictions in Northern China. Meteorol. Appl. 2010, 17, 433–441. [Google Scholar] [CrossRef]
  18. Zhang, R.J.; Wang, M.X.; Zhang, X.Y.; Zhu, G.H. Analysis on the Chemical and Physical Properties of Particles in a Dust Storm in Spring in Beijing. Powder Technol. 2003, 137, 77–82. [Google Scholar] [CrossRef]
  19. Zhao, J.P.; Zhang, F.W.; Xu, Y.; Chen, J.S.; Yin, L.Q.; Shang, X.S.; Xu, L.L. Chemical characteristics of particulate matter during a heavy dust episode in a coastal city, Xiamen, 2010. Aerosol Air Qual. Res. 2011, 11, 299–308. [Google Scholar] [CrossRef]
  20. Stone, E.A.; Yoon, S.C.; Schauer, J.J. Chemical characterization of fine and coarse particles in Gosan, Korea during Springtime Dust Events. Aerosol Air Qual. Res. 2011, 11, 31–43. [Google Scholar] [CrossRef]
  21. Mori, I.; Nishikawa, M.; Quan, H.; Morita, M. Estimation of the concentration and chemical composition of Kosa aerosols at their origin. Atmos. Environ. 2002, 36, 4569–4575. [Google Scholar] [CrossRef]
  22. Husar, R.B.; Tratt, D.M.; Schichtel, B.A.; Falke, S.R.; Li, F.; Jaffe, D.; Gassó, S.; Gill, T.; Laulainen, N.S.; Lu, F.; et al. Asian dust events of April 1998. J. Geophys. Res. 2001, 106, 18317–18330. [Google Scholar] [CrossRef]
  23. Bory, A.J.M.; Biscaye, P.E.; Svensson, A.; Grousset, F.E. Seasonal variability in the origin of recent atmospheric mineral dust at North GRIP, Greenland, Earth Planet. Sci. Lett. 2002, 196, 123–134. [Google Scholar]
  24. Mori, I.; Nishikawa, M.; Tanimura, T.; Quan, H. Change in Size distribution and chemical composition of Kosa (Asian Dust) Aerosol during long-range transport. Atmos. Environ. 2003, 37, 4253–4263. [Google Scholar] [CrossRef]
  25. Kokhanovsky, A.A. Satellite Aerosol Remote Sensing over Land; Springer: Heidelberg, Germany, 2009. [Google Scholar]
  26. Kaskaoutis, D.G.; Rashki, A.; Houssos, E.E.; Goto, D.; Nastos, P.T. Extremely high aerosol loading over Arabian Sea during June 2008: The specific role of the atmospheric dynamics and Sistan dust storms. Atmos. Environ. 2014, 94, 374–384. [Google Scholar] [CrossRef]
  27. Che, H.; Wang, Y.; Sun, J.; Zhang, X.; Zhang, X.; Guo, J. Variation of aerosol optical properties over the Taklimakan Desert in China. Aerosol Air Qual. Res. 2013, 13, 777–785. [Google Scholar] [CrossRef]
  28. Alam, K.; Trautmann, T.; Blaschke, T.; Subhan, F. Changes in aerosol optical properties due to dust storms in the Middle East and Southwest Asia. Remote Sens. Environ. 2014, 143, 216–227. [Google Scholar] [CrossRef]
  29. Chen, Y.S.; Sheen, P.C.; Chen, E.R.; Liu, Y.K.; Wu, T.N.; Yang, C.Y. Effects of Asian Dust Storm Events on Daily Mortality in Taipei, Taiwan. Environ. Res. 2004, 95, 151–155. [Google Scholar] [CrossRef] [PubMed]
  30. Winckler, G.; Anderson, R.F.; Fleisher, M.Q.; McGee, D.; Mahowald, N. Covariant Glacial-interglacial Dust Fluxes in the Equatorial Pacific and Antarctica. Science 2008, 320, 93–96. [Google Scholar] [CrossRef] [PubMed]
  31. Yue, X.; Wang, H.; Wang, Z.; Fan, K. Simulation of Dust Aerosol Radiative Feedback Using the Global Transport Model of Dust: 1. Dust Cycle and Validation. J. Geophys. Res. 2009, 114, D10202. [Google Scholar] [CrossRef]
  32. Solmon, F.; Nair, V.S.; Mallet, M. Increasing Arabian dust activity and the Indian summer monsoon. Atmos. Chem. Phys. 2015, 15, 8051–8064. [Google Scholar] [CrossRef]
  33. Lee, Y.G.; Ho, C.H.; Kim, J.H.; Kim, J. Quiescence of Asian dust events in South Korea and Japan during 2012 spring: Dust outbreaks and transports. Atmos. Environ. 2015, 114, 92–101. [Google Scholar] [CrossRef]
  34. Basha, G.; Phanikumar, D.V.; Kumar, K.N.; Ouarda, T.B.M.J.; Marpu, P.R. Investigation of aerosol optical, physical, and radiative characteristics of a severe dust storm observed over UAE. Remote Sens. Environ. 2015, 169, 404–417. [Google Scholar] [CrossRef]
  35. Zhang, X.; Wang, L.; Wang, W.; Cao, D.; Wang, X.; Ye, D. Long-term trend and spatiotemporal variations of haze over China by satellite observations from 1979 to 2013. Atmos. Environ. 2015, 119, 362–373. [Google Scholar] [CrossRef]
  36. Kaskaoutis, D.G.; Rashki, A.; Houssos, E.E.; Mofidi, A.; Goto, D.; Bartzokas, A.; Francois, P.; Legrand, M. Meteorological aspects associated with dust storms in the Sistan region, southeastern Iran. Clim. Dyn. 2015, 45, 407–424. [Google Scholar] [CrossRef]
  37. Holben, B.N.; Eck, T.F.; Slutsker, I.; Tanré, D.; Buis, J.P.; Setzer, A.; Vermote, E.; Reagan, J.A.; Kaufman, Y.J.; Nakajima, T. AERONET-A federated instrument network and data archive for aerosol characterization. Remote Sens. Environ. 1998, 66, 1–16. [Google Scholar] [CrossRef]
  38. Smirnov, A.; Holben, B.N.; Eck, T.F.; Dubovik, O.; Slutsker, I. Cloud screening and quality control algorithms for the AERONET data base. Remote Sens. Environ. 2000, 73, 337–349. [Google Scholar] [CrossRef]
  39. Dubovik, O.; Smirnov, A.; Holben, B.N.; King, M.D.; Kaufman, Y.J.; Eck, T.F.; Slutsker, I. Accuracy assessments of aerosol optical properties retrieved from Aerosol Robotic Network (AERONET) Sun and sky radiance measurements. J. Geophys. Res. 2000, 105, 9791–9806. [Google Scholar] [CrossRef]
  40. Dubovik, O.; Smirnov, A.; Holben, B.N.; King, M.D.; Kaufman, Y.J.; Eck, T.F.; Slutsker, I. Variability of absorption and optical properties of key aerosol types observed in worldwide locations. J. Atmos. Sci. 2002, 59, 590–608. [Google Scholar] [CrossRef]
  41. Draxler, R.R.; Hess, G.D. An Overview of the HYSPLIT_4 Modelling System for Trajectories, Dispersion, and Deposition. Aust. Meteorol. Mag. 1998, 47, 295–308. [Google Scholar]
  42. Luo, B.; Tan, X.; Guo, Y. Introduction of MICAPS-A Chinese forecaster’s interactive system. In Proceedings of the 86th AMS Annual Meeting/8th Conference on Atmospheric Chemistry, Atlanta, GA, USA, 27 January–3 February 2006.
  43. Torres, O.; Bhartia, P.K.; Herman, J.R.; Ahmad, Z.; Gleason, J. Derivation of aerosol properties from satellite measurements of backscattered ultraviolet radiation: Theoretical basis. J. Geophy. Res. Atmos. 1998, 103, 17099–17110. [Google Scholar] [CrossRef]
  44. Legrand, M.; Plana-Fattori, A.; N’doum’e, C. Satellite detectionof dust using the IR imagery of Meteosat: 1. Infrared difference dust index. J. Geophys. Res. 2001, 106, 18251–18274. [Google Scholar] [CrossRef]
  45. Levy, R.C.; Remer, L.A.; Mattoo, S.; Vermote, E.F.; Kaufman, Y.J. Second-generation operational algorithm: Retrieval of aerosol properties over land from inversion of Moderate Resolution Imaging Spectroradiometer spectral reflectance. J. Geophys. Res. 2007, 112, D13211. [Google Scholar] [CrossRef]
  46. Hsu, N.C.; Tsay, S.C.; King, M.D.; Herman, J.R. Deep blue retrievals of Asian aerosol properties during ACE-Asia. Geosci. Remote Sens. IEEE Trans. 2006, 44, 3180–3195. [Google Scholar] [CrossRef]
  47. Winker, D.M.; Hunt, W.H.; McGill, M.J. Initial performance assessment of CALIOP. Geophys. Res. Lett. 2007, 34, L19803. [Google Scholar] [CrossRef]
  48. Rodríguez, S.; Cuevas, E.; Prospero, J.M.; Alastuey, A.; Querol, X.; López-Solano, J.; García, M.I.; Alonso-Pérez, S. Modulation of Saharan dust export by the North African dipole. Atmos. Chem. Phys. 2015, 15, 7471–7486. [Google Scholar] [CrossRef]
  49. Guan, H.; Schmid, B.; Bucholtz, A.; Bergstrom, R. Sensitivity of shortwave radiative flux density, forcing, and heating rate to the aerosol vertical profile. J. Geophys. Res. 2010, 115, D06209. [Google Scholar] [CrossRef]
  50. Lemaître, C.; Flamant, C.; Cuesta, J.; Raut, J.-C.; Chazette, P.; Formenti, P.; Pelon, J. Radiative heatingrates profiles associated with a springtime case of Bodélé and Sudan dust transport over West Africa. Atmos. Chem. Phys. 2010, 10, 8131–8150. [Google Scholar] [CrossRef] [Green Version]
  51. Kaskaoutis, D.G.; Prasad, A.K.; Kosmopoulos, P.G.; Sinha, P.R.; Kharol, S.K.; Gupta, P.; El-Askary, H.M.; Kafatos, M. Synergistic Use of Remote Sensing and Modeling for Tracing Dust Storms in the Mediterranean. Adv. Meteorol. 2012, 2012, 978–988. [Google Scholar]
  52. Kaskaoutis, D.G.; Kosmopoulos, P.G.; Nastos, P.T.; Kambezidis, H.D.; Sharma, M.; Mehdi, W. Transport pathways of Sahara dust over Athens, Greece as detected by MODIS and TOMS. Geomat. Nat. Hazards Risk 2012, 3, 35–54. [Google Scholar] [CrossRef]
  53. Kaskaoutis, D.G.; Nastos, P.T.; Kosmopoulos, P.G.; Kambezidis, H.D. Characterizing the long-range transport mechanisms of different aerosol types over Athens, Greece during 2000–2005. Int. J. Clim. 2012, 32, 1249–1270. [Google Scholar] [CrossRef]
  54. Todd, M.C.; Washington, R.; Raghavan, S.; Lizcano, G.; Knippertz, P. Regional Model Simulations of the Bodélé Low-Level Jet of Northern Chad during the Bodélé Dust Experiment (BoDEx 2005). J. Clim. 2008, 21, 995–1012. [Google Scholar] [CrossRef]
  55. Gautam, R.; Hsu, N.C.; Lau, K.M. Premonsoon aerosol characterization and radiative effects over the Indo-Gangetic Plains: Implications for regional climate warming. J. Geophys. Res. 2010, 115, 1383–1392. [Google Scholar] [CrossRef]
  56. Rashki, A.; Kaskaoutis, D.G.; Francois, P.; Kosmopoulos, P.G.; Legrand, M. Dust-storm dynamics over Sistan region, Iran: Seasonality, transport characteristics and affected areas. Aeolian Res. 2015, 16, 35–48. [Google Scholar] [CrossRef]
  57. Torres, O.; Tanskanen, A.; Veihelmann, B.; Ahn, C.; Braak, R.; Bhartia, P.K.; Ahn, C.; Seftor, C. Aerosols and surface UV products from Ozone Monitoring Instrument observations: An overview. J. Geophys. Res. Atmos. 2007, 112, D24S47. [Google Scholar] [CrossRef]
  58. Cao, J.; Tie, X.; Xu, B.; Zhao, Z.; Zhu, C.; Li, G.; Liu, S. Measuring and modeling black carbon (BC) contamination in the SE Tibetan Plateau. J. Atmos. Chem. 2010, 67, 45–60. [Google Scholar] [CrossRef]
  59. Wang, S.P.; Fang, L.; Gu, X.F.; Yu, T.; Gao, J. Comparison of aerosol optical properties from Beijing and Kanpur. Atmos. Environ. 2011, 45, 7406–7414. [Google Scholar] [CrossRef]
  60. Yu, X.; Shi, C.; Ma, J.; Zhu, B.; Li, M.; Wang, J.; Yang, S.; Kang, N. Aerosol optical properties during firework, biomass burning and dust episodes in Beijing. Atmos. Environ. 2013, 81, 475–484. [Google Scholar] [CrossRef]
  61. Yu, X.; Kumar, K.R.; Lü, R.; Ma, J. Changes in column aerosol optical properties during extreme haze-fog episodes in January 2013 over urban Beijing. Environ. Pollut. 2016, 210, 217–226. [Google Scholar] [CrossRef] [PubMed]
  62. Cao, C.; Zheng, S.; Singh, R.P. Characteristics of aerosol optical properties and meteorological parameters during three major dust events (2005–2010) over Beijing, China. Atmos. Res. 2014, 150, 129–142. [Google Scholar] [CrossRef]
  63. Chen, H.; Cheng, T.; Gu, X.; Wu, Y. Characterization of aerosols in Beijing during severe aerosol loadings. Atmos. Environ. 2015. [Google Scholar] [CrossRef]
Figure 1. True color composite images of FY-3C MERSI over (a) north China on 23 April; (b) 24 April; and (c) 25 April 2014. The locations of Beijing (39.977°N, 116.381°E) and Dalanzadgad (43.577°N, 104.419°E) are marked with white circles.
Remotesensing 08 00394 g001
Figure 2. The geolocation of the affected areas and stations.
Remotesensing 08 00394 g002
Figure 3. The 850 pressure field (hPa), 10-m wind vector field (m/s) at (a) 0000 UTC on 22 April; (b) 0000 UTC on 23 April; (c) 0000 UTC on 24 April and (d) 0000 UTC on 25 April. Wind direction is represented by a wind-direction shaft (vertical bar) with the end pointing to the wind direction. Wind speed is represented by the number of horizontal bars at the other end of the wind-direction shaft: one, 0.3–3.3 m/s; two, 3.4–7.9 m/s; three, 8.0–13.8 m/s; four, 13.9–20.7 m/s; five, >20.7 m/s. ”D” represents the low pressure center, whereas “G” represents the high pressure center. The value of the contour must be multiplied by a factor of 10 to represent the 850-hPa geopotential height.
Remotesensing 08 00394 g003
Figure 4. Dust identification IDDI images from FY-2E from 23 April–26 April, 2014 (from top to bottom) at 01:00, 02:00 and 06:00 UTC (from left to right). The unit of the colored scale is Kelvin, and the colored scale is saturated to 30 K.
Remotesensing 08 00394 g004
Figure 5. Four-day (96 h) forward air mass trajectories starting from the Taklamakan Desert (39.51°N, 83.50°E) at 200 m above ground level during the dust storm. The altitudinal variation of the dusty air masses is shown in the colored scale.
Remotesensing 08 00394 g005
Figure 6. Total attenuated backscatter profiles at 532 nm on (a) 23 April 2014; (b) 26 April 2014 and aerosol subtype images obtained from CALIPSO observations on (c) 23 April 2014 and (d) 26 April 2014.
Remotesensing 08 00394 g006aRemotesensing 08 00394 g006b
Figure 7. TOU aerosol index over northeast Asia during the 2014 dust episode on (a) 22 April, (b) 23 April; (c) 24 April and (d) 25 April.
Remotesensing 08 00394 g007
Figure 8. Spatial distribution of the mean Terra-MODIS AOD550 over northeast Asia during (a) April 2010–2014; (b) the 2014 dust storm between 23 April and 25 April.
Remotesensing 08 00394 g008
Figure 9. Spatial distribution of the AOD550 anomalies (%) over northeast Asia during the dust storm with respect to long-term means (April 2010–April 2014).
Remotesensing 08 00394 g009
Figure 10. Variability of AERONET AOD measurements during dusty and non-dusty days in (a) Beijing and (b) Dalanzadgad.
Remotesensing 08 00394 g010
Figure 11. AERONET volume size distributions in (a) Beijing and (b) Dalanzadgad. Curves on the dusty days are represented with dashed lines.
Remotesensing 08 00394 g011
Figure 12. AERONET single scattering albedo retrievals in (a) Beijing and (b) Dalanzadgad.
Remotesensing 08 00394 g012
Table 1. (a) FY-serials used in the study; (b) the parameters of the payloads aboard the FY-serials used in this study.
(a)
AcronymFY-2EFY-3BFY-3C
Full nameFeng-Yun-2EFeng-Yun-3BFeng-Yun 3C
Mass at launch1380 kg2298 kg2300 kg
Power300 W2480 W2500 W
Data access information(1) Near real-time availability of full resolution S-VISSR (Stretched Visible and Infrared Spin Scan Radiometer) images.
(2) Availability of image segments of S-VISSR in digital form.
(3) Availability of DCP (Data Collection Platform) messages by ground lines.
(1) Real-time availability of ERM (Earth Radiation Measurement)-1, IRAS (Infra Red Atmospheric Sounder), MERSI (Medium Resolution Spectral Imager)-1, MWHS (Micro-Wave Humidity Sounder)-1, MWRI (Micro-Wave Radiation Imager), MWTS (Micro-Wave Temperature Sounder)-1, SBUS (Solar Backscatter Ultraviolet Sounder), SEM (Space Environment Monitor), SIM (Solar Irradiance Monitor)-1, TOU and VIRR by MTP.
(2) Real-time availability of a selection of data.
(3) Selected global data available under bilateral arrangements.
(1) Real-time availability of MERSI-1 by MPT (note: on FY-3C, MPT uses LHCP (Left-Handed Circularly Polarized) polarization unlike FY-3A and 3B).
(2) Real-time availability of other instrument data (ERM-1, IRAS, MWHS-1, MWRI, MWTS-1, SBUS, SEM, SIM-1, TOU and VIRR).
OrbitGeostationary orbitSun-synchronous orbitSun-synchronous orbit
Altitude35,786 km847 km834 km
Longitude/passing time86.5°E14:25 ascending10:20 descending
Launch23 December 20084 November 201023 September 2013
(b)
AcronymMERSI-1TOU
Full nameMedium Resolution Spectral Imager-1Total Ozone Unit
Type of instrumentModerate-resolution optical imagerCross-nadir scanning short wave sounder
PurposeOcean color, vegetation indexes and aerosolOzone total column mapping
Short description20 channels, 19 narrow-bandwidth in VIR/NIR/SWIR and one broadband in the Thermal IR (see detailed characteristics below)6 channels of 1.2-nm bandwidth in the range 308–360 nm,
Scanning techniqueCross-track: 2048 detectors for channels at 1000-m resolution or 8192 detectors for channels at 250-m resolution, swath 2900 km; along-track: ten 10-km lines every 1.5 sCross-track scanning, swath 3000 km
Resolution250 m or 1.0 km50 km
Coverage/cycleGlobal coverage in 1 day (in daylight)Global coverage once/day (daylight)
Mass117 kg19.2 kg
Power125 W18 W
Data rate16 Mbps1 kbps

