Abstract
Detailed spatial-temporal characterization of individual fire dynamics using remote sensing data is important to understand fire-environment relationships, to support landscape-scale fire risk management, and to obtain improved statistics on fire size distributions over broad areas. Previously, individuation of events to quantify fire size distributions has been performed with the flood-fill algorithm. A key parameter of such algorithms is the time-gap used to cluster spatially adjacent fire-affected pixels and declare them as belonging to the same event. Choice of a time-gap to define a fire event entails several assumptions affecting the degree of clustering/fragmentation of the individual events. We evaluate the impact of different time-gaps on the number, size and spatial distribution of active fire clusters, using a new algorithm. The information produced by this algorithm includes number, size, and ignition date of active fire clusters. The algorithm was tested at a global scale using active fire observations from the Moderate Resolution Imaging Spectroradiometer (MODIS). Active fire cluster size distributions were characterized with the Gini coefficient, and the impact of changing time-gap values was analyzed on a 0.5° cell grid. As expected, the number of active fire clusters decreased and their mean size increased with the time-gap value. The largest sensitivity of fire size distributions to time-gap was observed in African tropical savannas and, to a lesser extent, in South America, Southeast Asia, and eastern Siberia. Sensitivity of fire individuation, and thus Gini coefficient values, to time-gap demonstrate the difficulty of individuating fire events in tropical savannas, where coalescence of flame fronts with distinct ignition locations and dates is very common, and fire size distributions strongly depend on algorithm parameterization. Thus, caution should be exercised when attempting to individualize fire events, characterizing their size distributions, and addressing their management implications, particularly in the African savannas.
Keywords:
fire event; algorithm; time-gap; fire size distribution; active fire; MODIS; Gini coefficient 1. Introduction
Statistical descriptors of fire size distributions (FSD) are often used in the characterization of vegetation fire regimes [1,2,3]. Information on FSDs is applied in landscape fire management, for planning and evaluating prevention and suppression efforts [4,5], to understand fire impacts on vegetation dynamics [6,7], and to diagnose climate and/or land use changes [8].
Global daily burned area and active fire data, at spatial resolutions of 500 m and 1 km respectively, have been available for the last 15 years, from the MODIS Terra and Aqua instruments [9], and an active fire dataset of comparable length was produced by the European Space Agency Along-Track Scanning Radiometers (ESA ATSR) [10]. Availability of such data provides the opportunity to characterize fire size distributions in a systematic and consistent way at a global scale. However, this is not a trivial task because it requires the ability to identify individual fire events, by patching together or splitting apart the snapshots of fire spatial/temporal dynamics afforded by satellite imagery. This is particularly problematic in regions with extensive burning and fast spreading fires, such as tropical savannas, where formation of the “seasonal burning mosaic” [11] entails extensive coalescence of flame fronts with distinct ignition sources. Individuating fire events may be difficult too in regions affected by persistent cloud cover or heavy smoke.
Accurate identification of a “fire event”, described as a burning event with a single ignition location and contiguous spread in space and time [12], has been deemed critical to assess fire behavior and environmental impacts [13]. Various authors have sought to resolve the complex process of identifying individual fire events with the intent of accurately quantifying fire size distribution patterns. Pixel aggregation algorithms based on flood-fill techniques were used in past studies in an attempt to identify individual fire events [1,7,14,15]. These algorithms, initially proposed by [16] to detect individual fire events from MODIS burned area patches (MCD45A1), use a moving window to detect a fire-affected pixel, identify its date of burning and, in a recursive way, search for the date of burning of all spatially adjacent fire pixels to check whether they burned within some specified temporal threshold of their neighbors’ burning dates. If these two rules are met (spatial adjacency and temporal proximity), pixels are assumed to belong to the same fire event. This process will continue until one of the rules is not fulfilled [16]. In a different approach, [12] reconstructed the spread of large fires in northern Eurasia using MODIS active fire detections. Their algorithm starts with the earliest date of burning (point of ignition) and searches for all active fires occurring before a given temporal threshold and falling within a 2.5 km radius from the seed pixel. Once both criteria are met, the pixel is assigned to the new fire event and excluded from further consideration [12]. A fire event is considered complete when no new unassigned fire pixels fall within the temporal and spatial bounds of the fire pixels already assigned to a given event. A critical aspect of both algorithms is the selection of the time-gap used to cluster contiguous burned pixels and declare them as belonging to the same fire event [7]. The choice of a temporal threshold to define a fire event entails several assumptions affecting the degree of clustering/fragmentation of the individualized fire events [1]. Short time-gaps will yield a large number of small fires, while longer time-spans will promote higher spatial aggregation, resulting in a smaller number of larger events. Different time-gaps have been used in previous studies: [16] and [14] tested an 8-day time-gap in southern Africa. At the global scale, [1] used a 2-day time-gap and [7,15] used a 14-day time-gap to produce global fire size distributions. The 14-day time-gap used by [7,15] was justified with the purpose of overcoming the artificial increase in the number of fires that occurred with shorter time-gaps in areas with temporary cloud cover, or due to smoke obscuration of the land surface.
Here, we propose to evaluate the impact of the three previously used time-gaps (2-, 8- and 14-day), on the number, size and spatial distribution of active fire clusters. To accomplish this, we developed a new algorithm to identify individual active fire clusters in raster format, using MODIS satellite fire data. The algorithm relies on encoding in a graph structure the relevant space-time contiguity relationships among patches of active fires with the same date of burning, which we call fire patch units (FP). A standard graph technique is then used to decompose the set of FP into disjoint spatially connected clusters with consistent fire-path histories, which we designated as active fire clusters.
Contrary to the flood-fill approach where no further verification is performed to ensure consistency of the fire path histories within each fire event, with the new algorithm every pixel where a fire occurrence was recorded can be connected by a path consisting of active fire pixels with monotonically decreasing dates of burning, to a unique ignition point (i.e., to a patch of spatially adjacent pixels with the earlier date of burning in the fire event). Moreover, the more conceptual approach of the algorithm allows to easily adjust its parameters to meet specific requirements. Once these rules are established, the decomposition into active fire clusters is uniquely determined, and all the “work” is performed by standard graph decomposition techniques.
The newly developed algorithm is employed to perform a global scale assessment of the sensitivity of the Gini coefficient as a measure of fire size inequality to a range of settings of the time-gap parameter. Results are provided for six case studies and in the form of a 0.5° grid map, and assessed using the global Anthromes map of [17] and the global biomes map of [18].
2. Materials and Methods
2.1. Fire Data
Active fire data used for this study were taken from the MODIS MCD14ML Collection 5 daily Active Fire Product [19]. This dataset reports the location and timing of active fires at native resolution (1 km at nadir) for the Terra and Aqua satellites (the latter, since 4 May 2002). MODIS active fire data were screened for false alarms and non-vegetation fires according to the procedures described in [20] for 2003 (the first full year having data from both instruments), gridded to a 1km raster data structure and finally aggregated into a grid of 31,066 half degree spatial resolution cells.
2.2. Active Fire Clusters Individuation Algorithm
A new four-step algorithm to individuate active fire clusters was developed, including the following steps:
(I) Fire patch identification: The algorithm assumes that adjacent active fire with the same date of burning belong to the same active fire cluster. We designate as FP a spatially connected region formed by active fire pixels s with the same date of burning that cannot be enlarged with new active fire pixels. FPs constitute the basic units upon which active fire clusters are built. To identify the set of FPs with a given date of burning, we consider in the set of active fire pixels having the given date of burning a graph structure whose vertices are the active fire pixels and such that two of them are connected by an edge, if they are adjacent (under the eight-neighbor queens scheme). In this framework each FP with the given date of burning corresponds to a connected component of this graph, i.e., to a maximal set of vertices such that any pair of vertices can be connected to each other by a path within the connected component. This decomposition can be achieved in linear-time with respect to the input dimension (number of pixels plus number of pixel adjacencies under the eight-neighbor queens scheme) by applying a standard graph decomposition to each group of active fire pixels having the same date of burning.
(II) Fire patch contiguity relationships encoding: the relevant spatial-temporal contiguity relationships among FPs are encoded in a directed graph structure (digraph). Each FP in this graph defines a vertex. Two FPs are connected by a directed edge, starting at the FP with the earlier date of burning, if the FPs are spatially adjacent and the date difference between their dates of burning lies within the time-gap considered. We assign an edge weight to each directed edge connecting two FPs equal to the number of pairs of adjacent pixels (under the eight-neighbor scheme) with one pixel in each one of these FPs. We designate as point of ignition every FP having no other FP with an earlier date of burning connected to it in this graph.
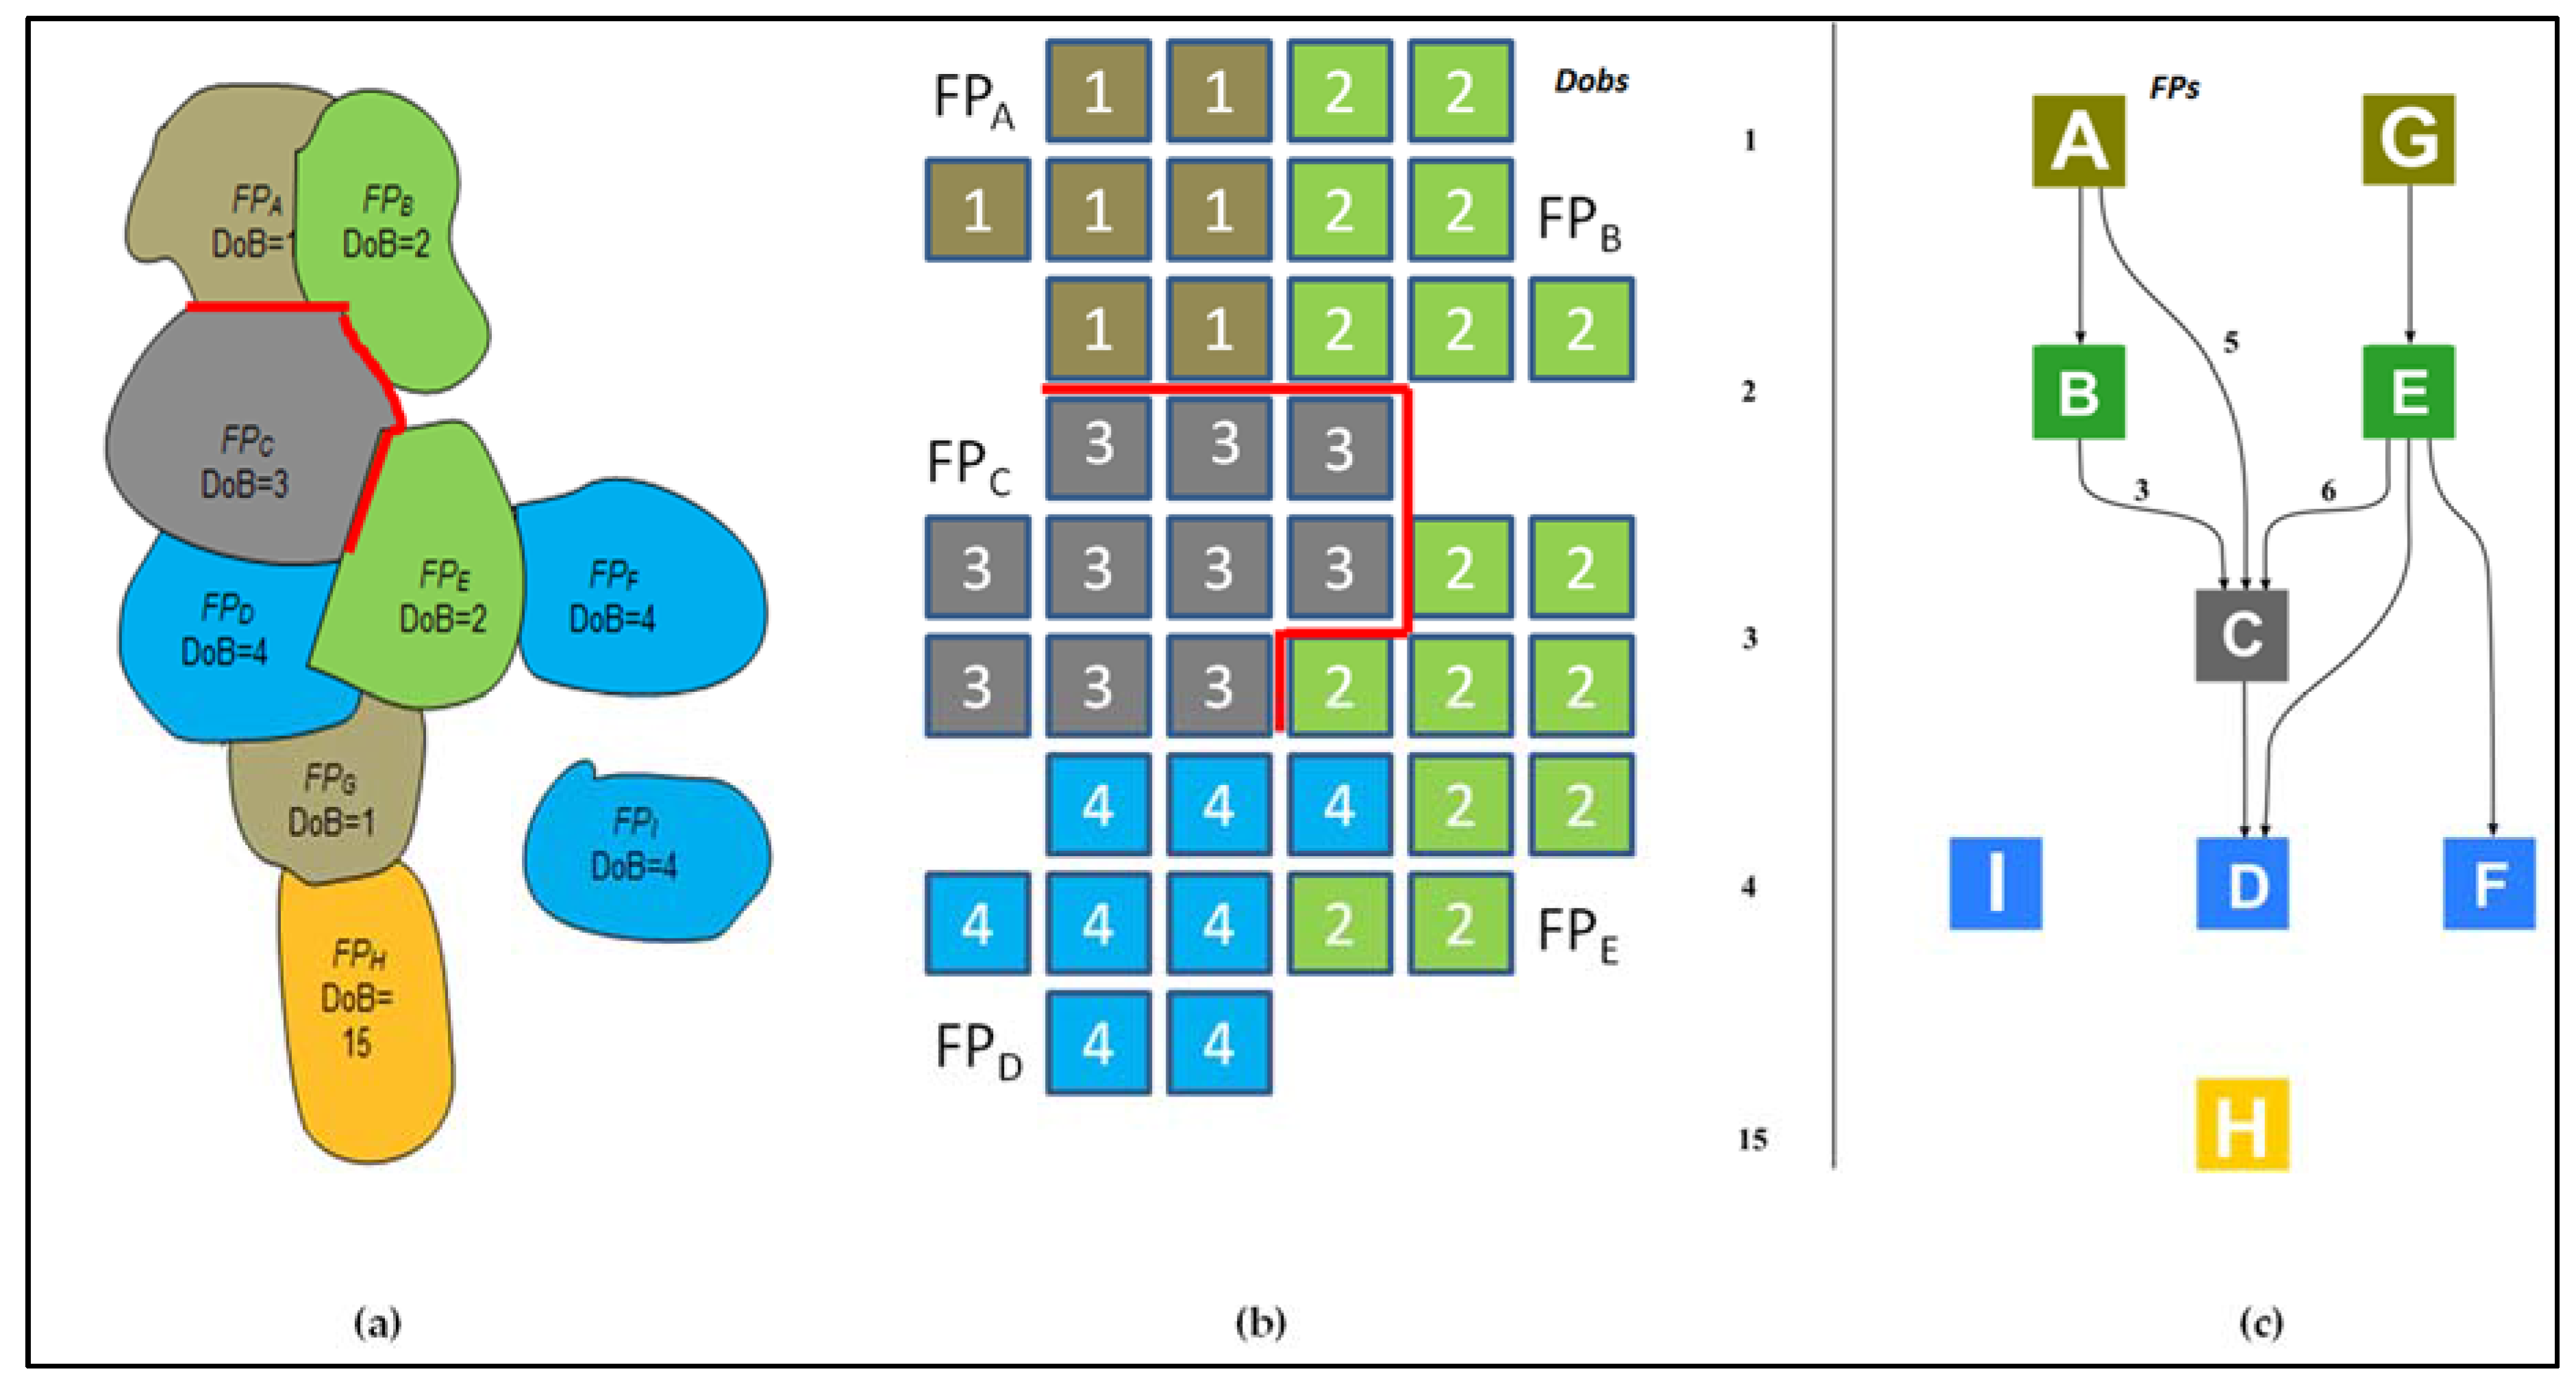
Figure 1 shows a conceptual example depicting a collection of fire events. In this example, nine FPs are depicted, each one with its respective date of burning. Each FP is identified with a unique ID (ranging from FPA to FPI), and corresponds to a maximal connected region formed by active fire pixels with the same date of burning. FPs with the same date of burning are depicted in Figure 1a with the same color. An illustration of FP as spatially connected groups of active fire pixels of the same color is shown in Figure 1b. Figure 1c depicts the digraph encoding the spatial-temporal contiguity relationships among the FP, assuming a time-gap of two days. The digraph contains four FPs corresponding to points of ignition (marked using oversized letter IDs).
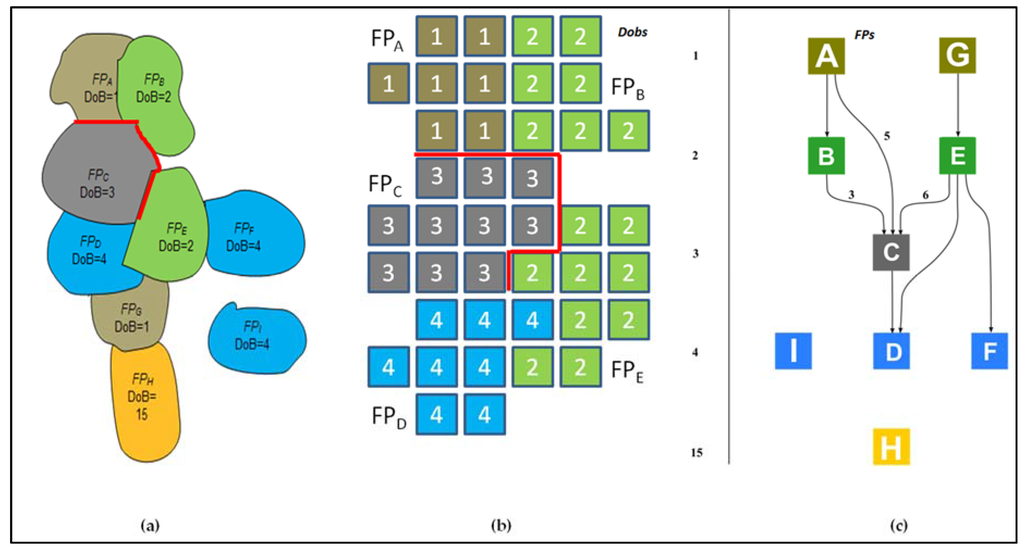
Figure 1.
(a) Simulated example of a group of nine Fire Patches (FPs). FP depicted by the same colour have the same date of burning; (b) the red line highlights the border between FPC and FPA, FPB and FPE. The number in each box correspond to the date of burning of each FP; (c) digraph structure encoding the space-time contiguity relationships connecting the nine FP (represented as vertices) of Figure 1a assuming a 2-day time-gap. Edge weights (numbers of adjacent pixels) for the connections FPA–FPC, FPB–FPC and FPE–FPC, are also displayed. The digraph contains the 4 points of ignition (displayed with oversized letter IDs): FPA, FPG, FPI and FPH.
Edge weights five, three, and six depicted on the directed edges connecting FPA to FPC, FPB to FPC, and FPE to FPC, respectively, correspond to the number of pairs of adjacent pixels between these pairs of FPs.
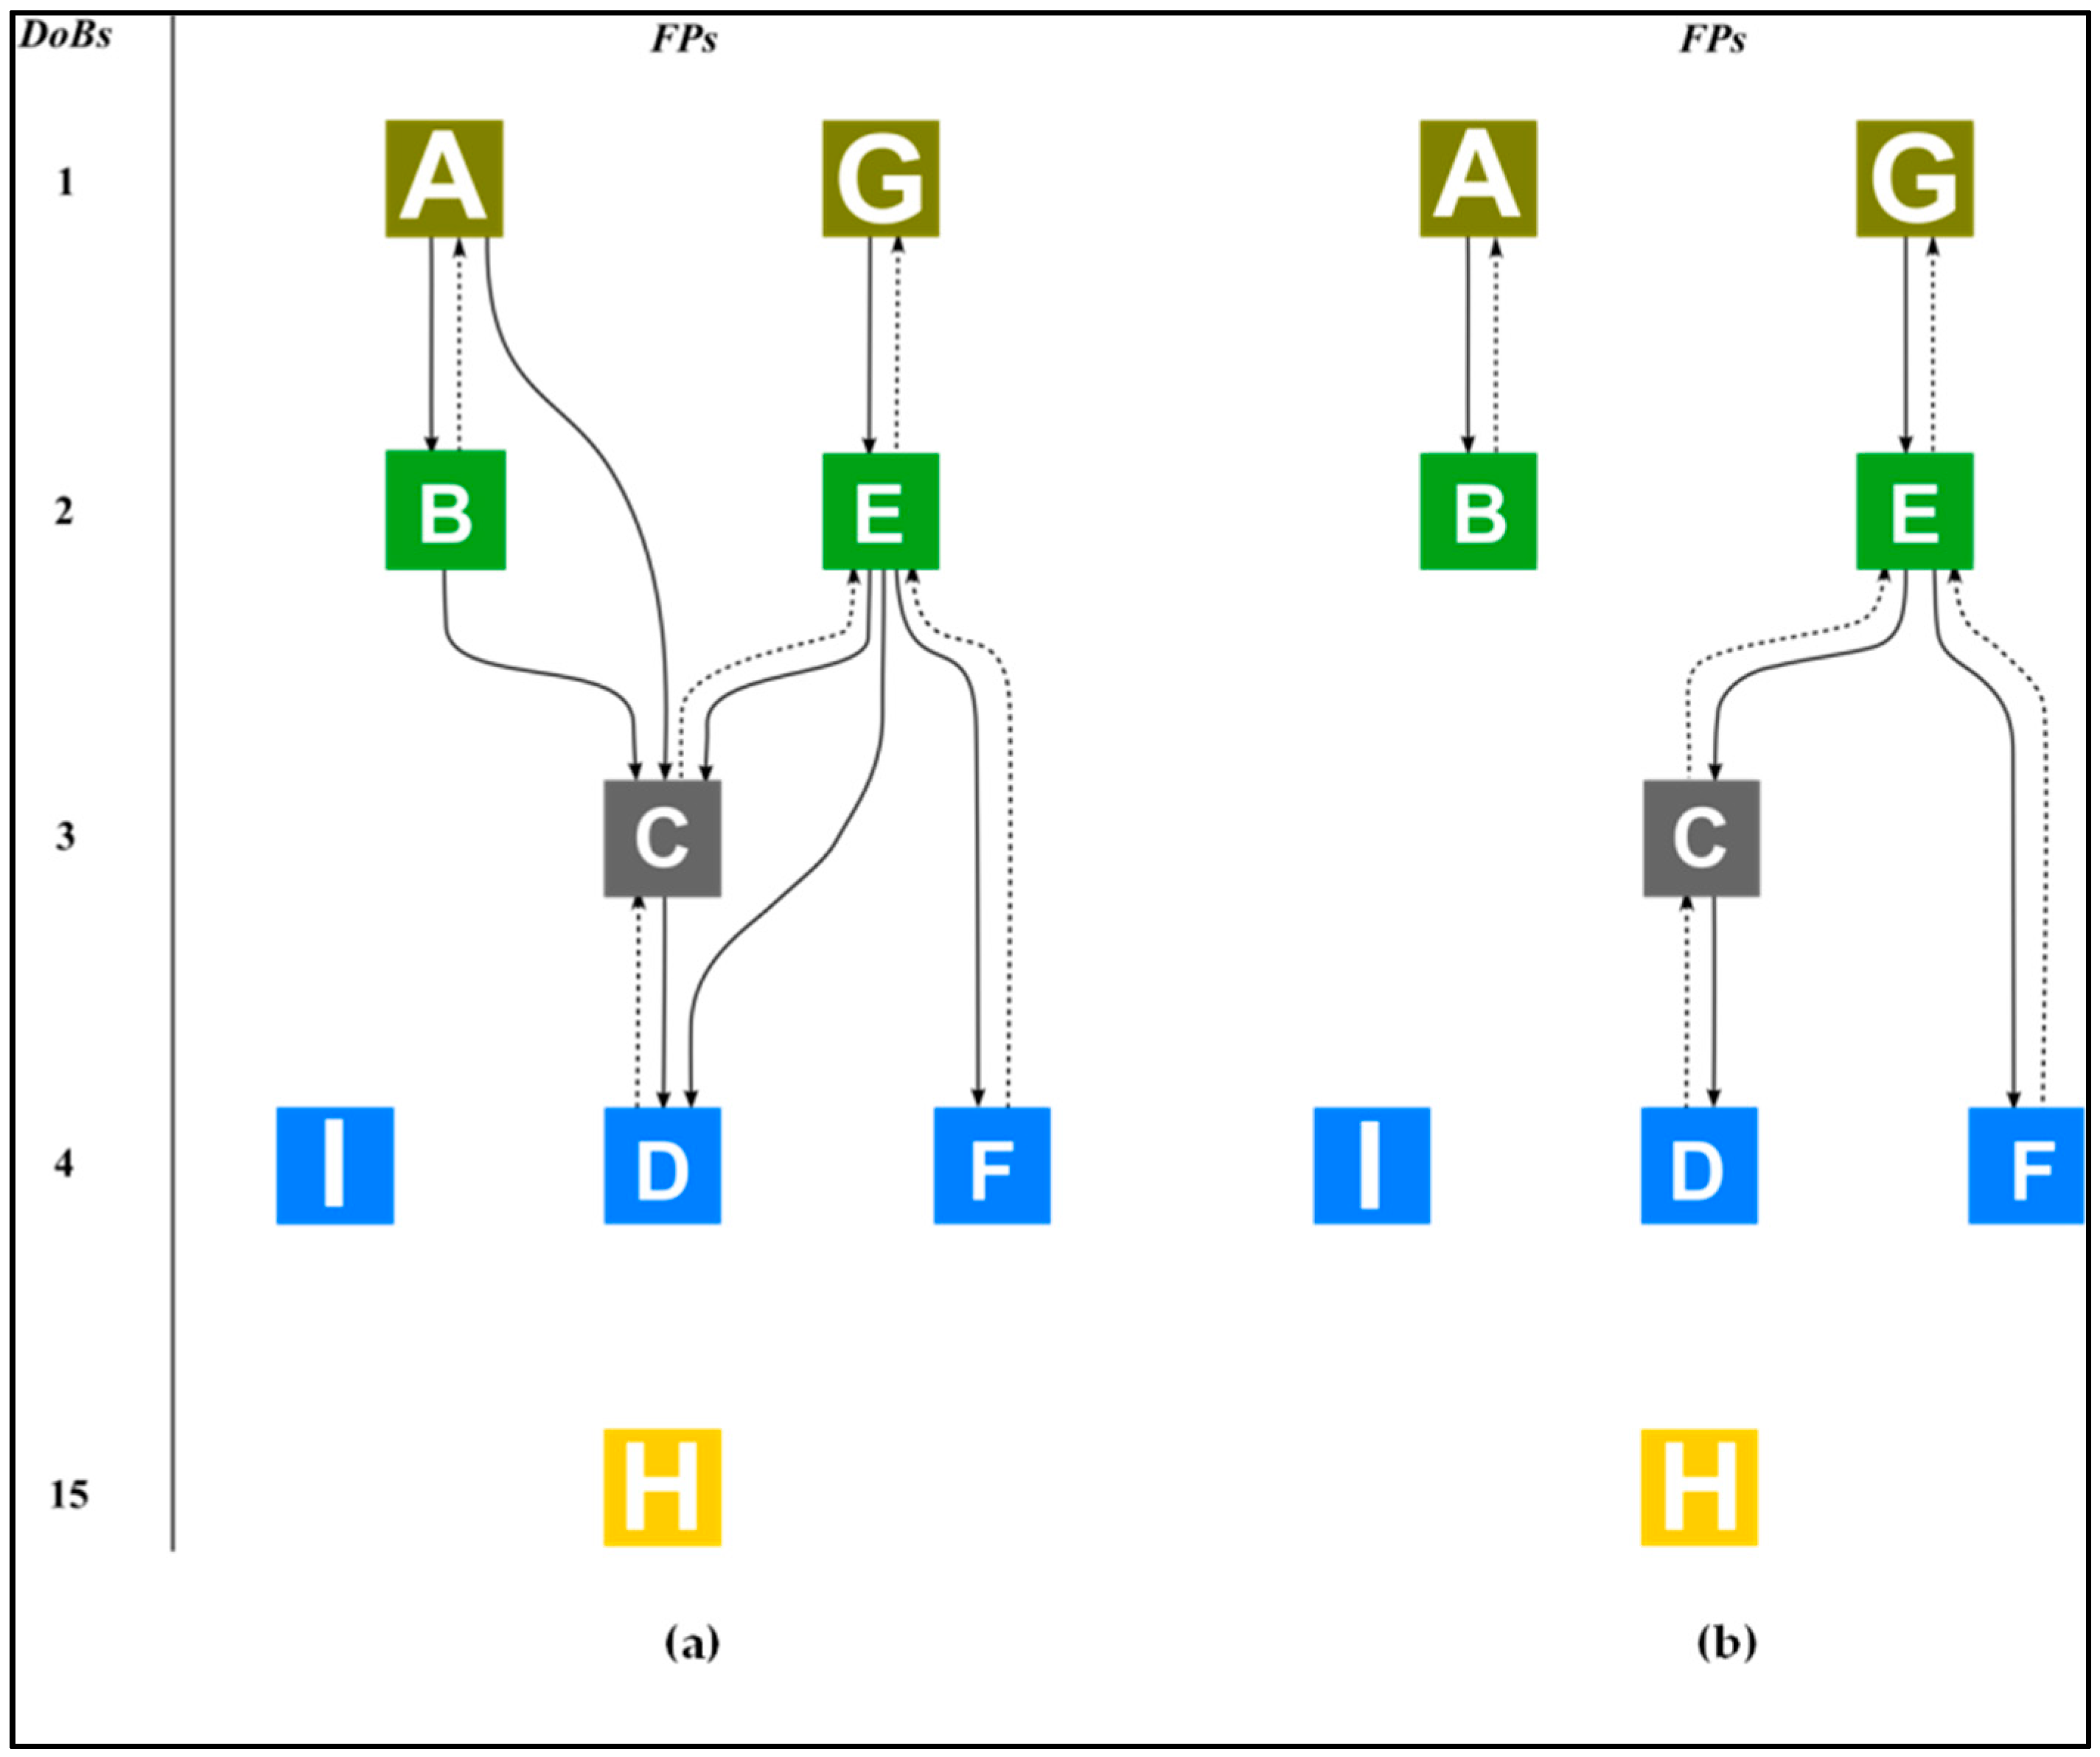
(III) Causal relation configuration: we assign one adjacent FP, with an earlier date of burning to each FP that is not an ignition point, such that their date of burning difference lies within the time-gap considered. This assignment identifies the adjacent FP from which the fire has propagated. The probability that a causal relation between two FPs is chosen is proportional to the weight of the directed edge connecting the FP, i.e., to the number of adjacent active fire pixels between the FPs. Causal relations are chosen in such a way that pairwise FPs connecting large fire perimeter segments are more likely to be aggregated. In Figure 1c, FPC can be connected by a causal relation to FPA, FPB, or FPE, with probability of success 5/14, 3/14, and 3/7 respectively. We call the set of all causal relation the causal relation configuration, which is represented in the digraph by dashed arrows (Figure 2a). Causal relations configuration determines the fire-path histories in the following sense: each FP that is not a point of ignition, can be traced back to a unique point of ignition by a sequence of causal relations with monotonically decreasing dates of burning, such that date differences between consecutive FPs lie within the time-gap. For instance, according to the causal relation configuration depicted in Figure 2a, the FPD can be traced back to its point of ignition, FPG by the sequence of causal relations FP: FPD→FPC→FPE→FPG. Using the causal relations configuration we modify the original digraph encoding the spatial-temporal contiguity relationships by adding the directed edges corresponding to the causal relations and by suppressing the directed edges connecting FP with no causal relation between them. The modified digraph derived from the causal relation configuration of Figure 2a is shown in Figure 2b.
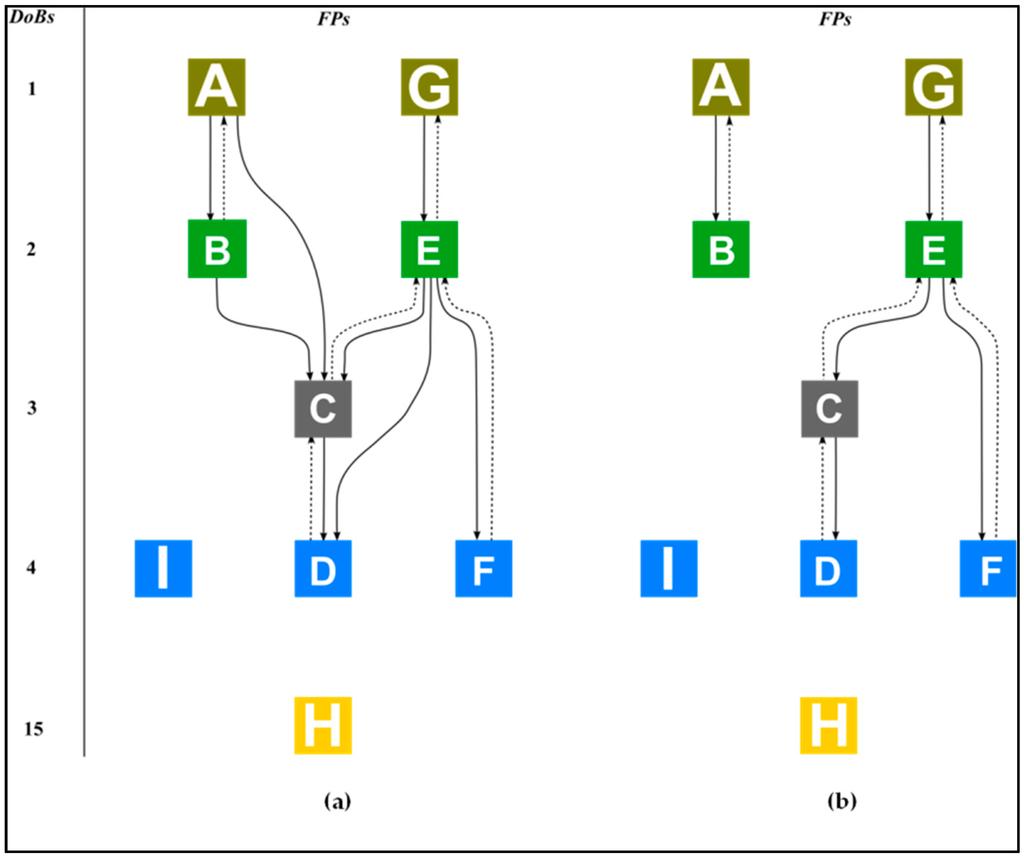
Figure 2.
Digraph structure encoding the space-time contiguity relationships (edges) connecting the nine Fire Patches (FP) (vertices) referred in Figure 1 for a two-day time-gap threshold. (a) A possible causal relations configuration and (b) modified graph containing only the directed edges connecting FP when a causal relation (dashed arrows) is present. Causal relations are displayed as dashed arrows. For each FP the corresponding date of burning is also shown.
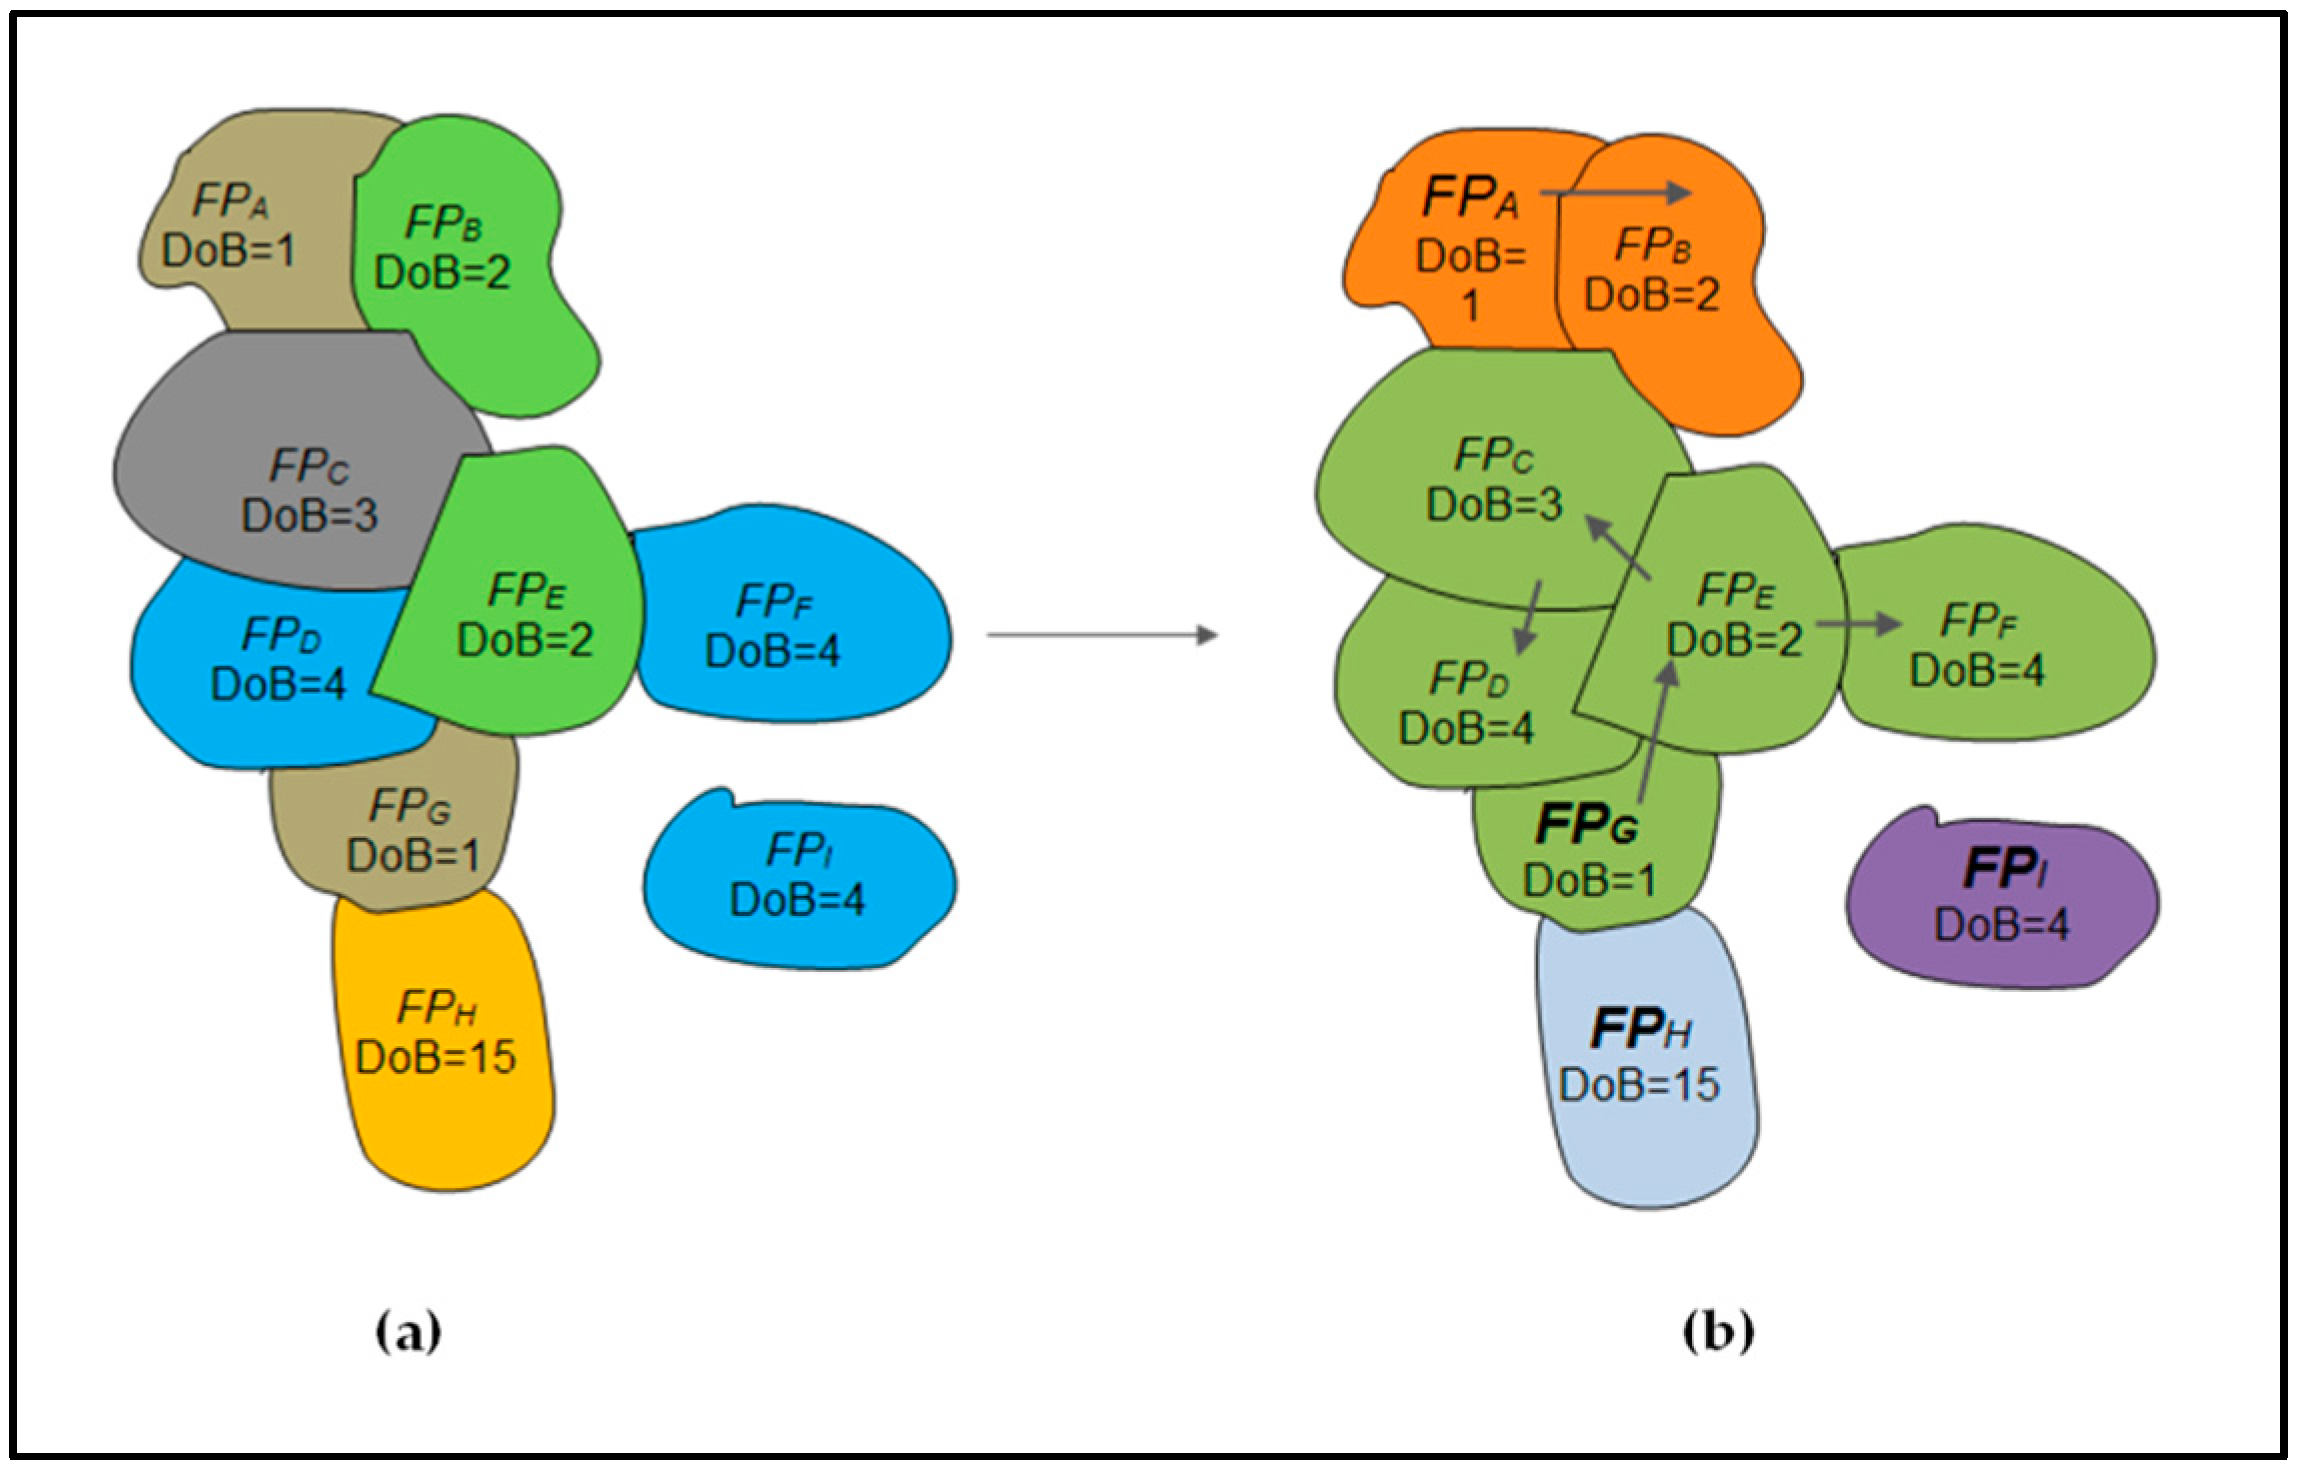
(IV) Decomposition into active fire clusters: the set of FP was partitioned into disjoint components consisting of spatially connected unions of FP, with a single point of ignition per component, according to the chosen causal relation configuration. Each one of these components is a union of fire-path histories starting at its (unique) point of ignition and corresponds to a unique active fire cluster. By construction, the number of active fire clusters is equal to the number of points of ignition, and is therefore independent of the causal relation configuration (depending only on the digraph structure encoding the spatial-temporal relationships). Mathematically, the partition into active fire cluster can be easily achieved by decomposing the modified digraph encoding the spatial-temporal relationships into strongly connected components, i.e., into maximal sub-graphs for which any pair of vertices in the sub-graph can be connected in both directions by directed paths. This decomposition is unique and can be efficiently obtained using Tarjan’s algorithm [21] having linear time-complexity in terms of the input dimension (number of vertices plus number of edges). In particular, the decomposition is scalable and thus can be applied to large data sets. Returning to the previous example, the causal relation configuration of Figure 2 led to the decomposition into four active fire clusters shown in Figure 3, where each active fire cluster is depicted using a different color, along with the its fire-path history (black arrows).
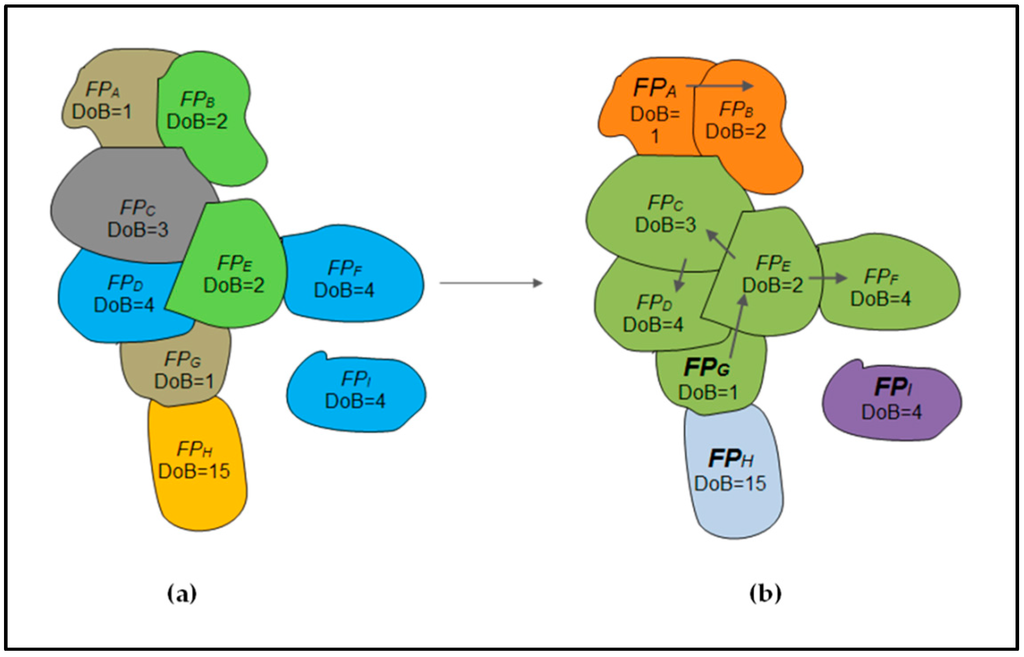
Figure 3.
(a) Original Fire Patches (PFs) and (b) possible four active fire clusters derived from the algorithm implementation. The black arrows display a fire path history determined by the causal relation configuration of Figure 2a. Points of ignition for this configuration are FPA (Date of burning: 1); FPG (Date of burning: 1); FPI (Date of burning: 4) and FPH (Date of burning: 15).
2.3. Sensitivity of Fire Size Distributions to the Time-Gap Parameter
The total number of fire events and their size distribution were analyzed for each 0.5° cell using MODIS active fire data for 2003 and different time-gaps. Fire size distributions were characterized using the Gini coefficient [22] as a measure of size inequality, assessing the extent to which burned area is dominated by a small number of large events or, conversely, made up of a large numbers of evenly sizes fires. Time-gaps of 2, 8, and 14 day were used to cluster individual active fires into active fire clusters and evaluate impacts on size distributions. The spatial distribution of Gini coefficient values was interpreted with the aid of the Anthropogenic Biomes of the World dataset (Anthromes) [17] and the global biomes map of [18]. The Anthrome dataset, which represents global patterns of anthropogenic transformation of terrestrial biomes integrating information on population density, land cover, and land use, was resampled to a 0.5° grid cell and reclassified into six major classes (Dense Settlements, Villages, Croplands, Rangelands, Forest, and Wildland) [17,18]. The spatial distribution of active fire clusters and the Gini coefficient as a function of land use/land cover, was analyzed with six case studies (grid cells) corresponding to six different Anthrome classes.
3. Results
3.1. Sensitivity of Fire Size Distributions to the Time-gap Parameter
A total of 4,477,192 fire observations were included in the analysis. Three different time-gaps used in the algorithm led to different active fire clusters number and size distributions (Table 1).

Table 1.
Time-gap sensitivity analysis for 2, 8, and 14-day and the corresponding number of active fire clusters for 2003. Values for each fire size class and time-gap are in %.
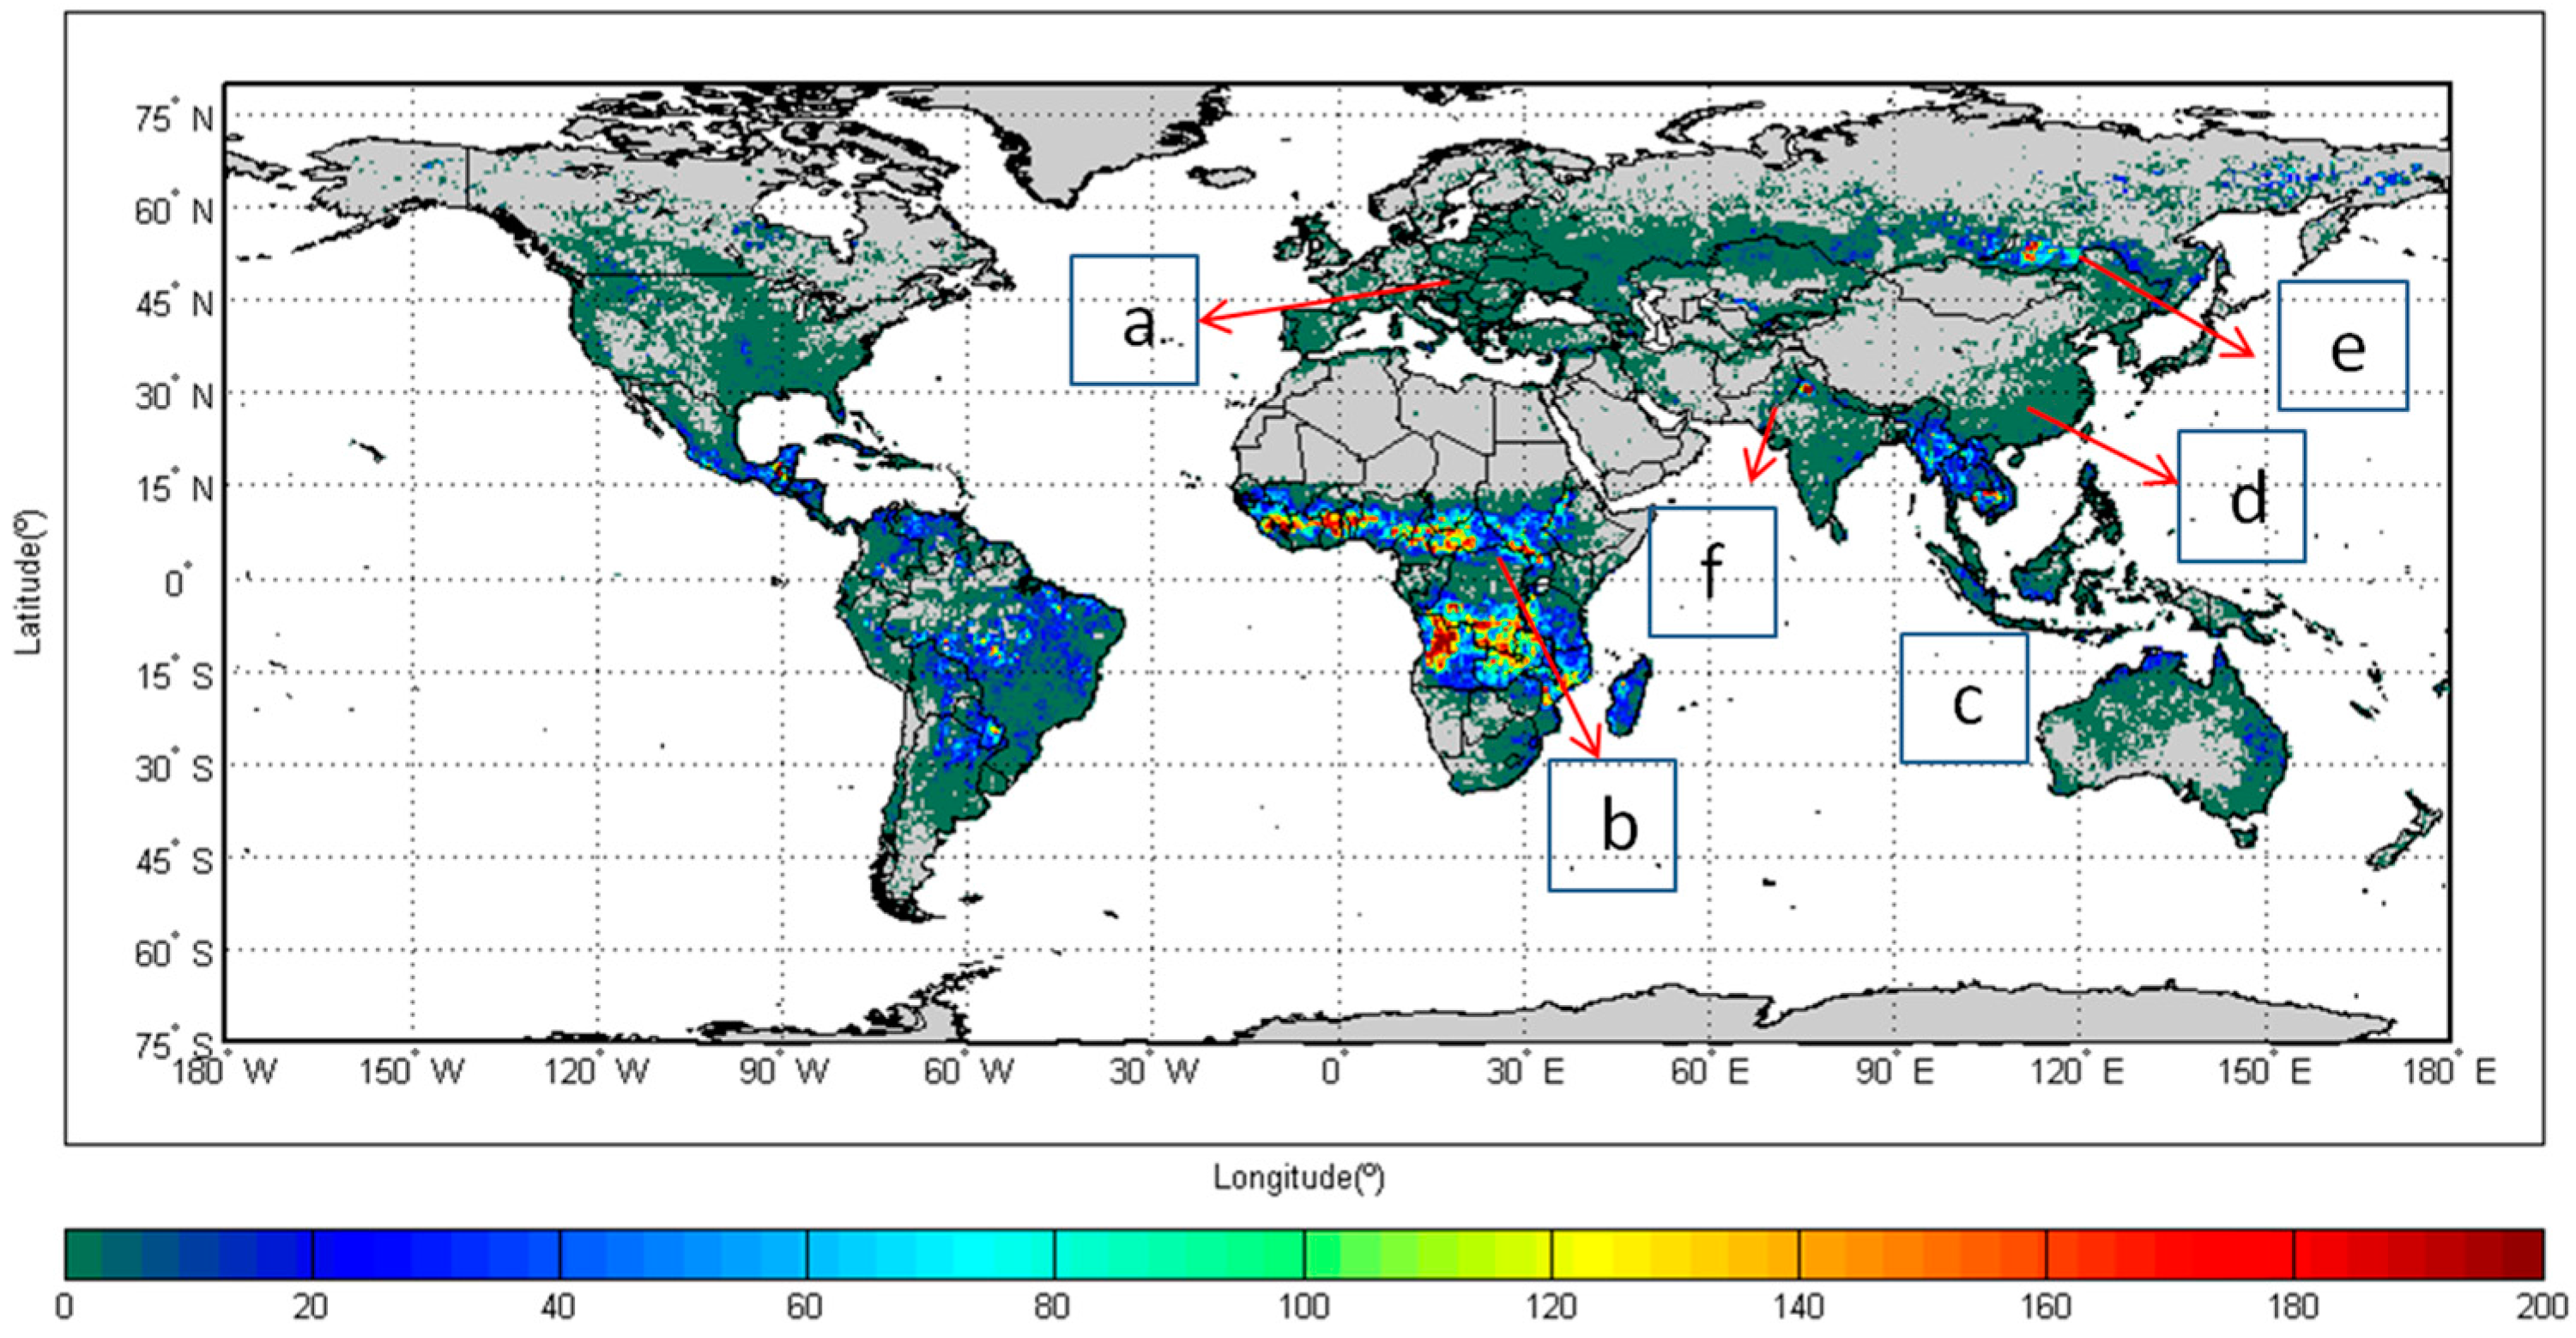
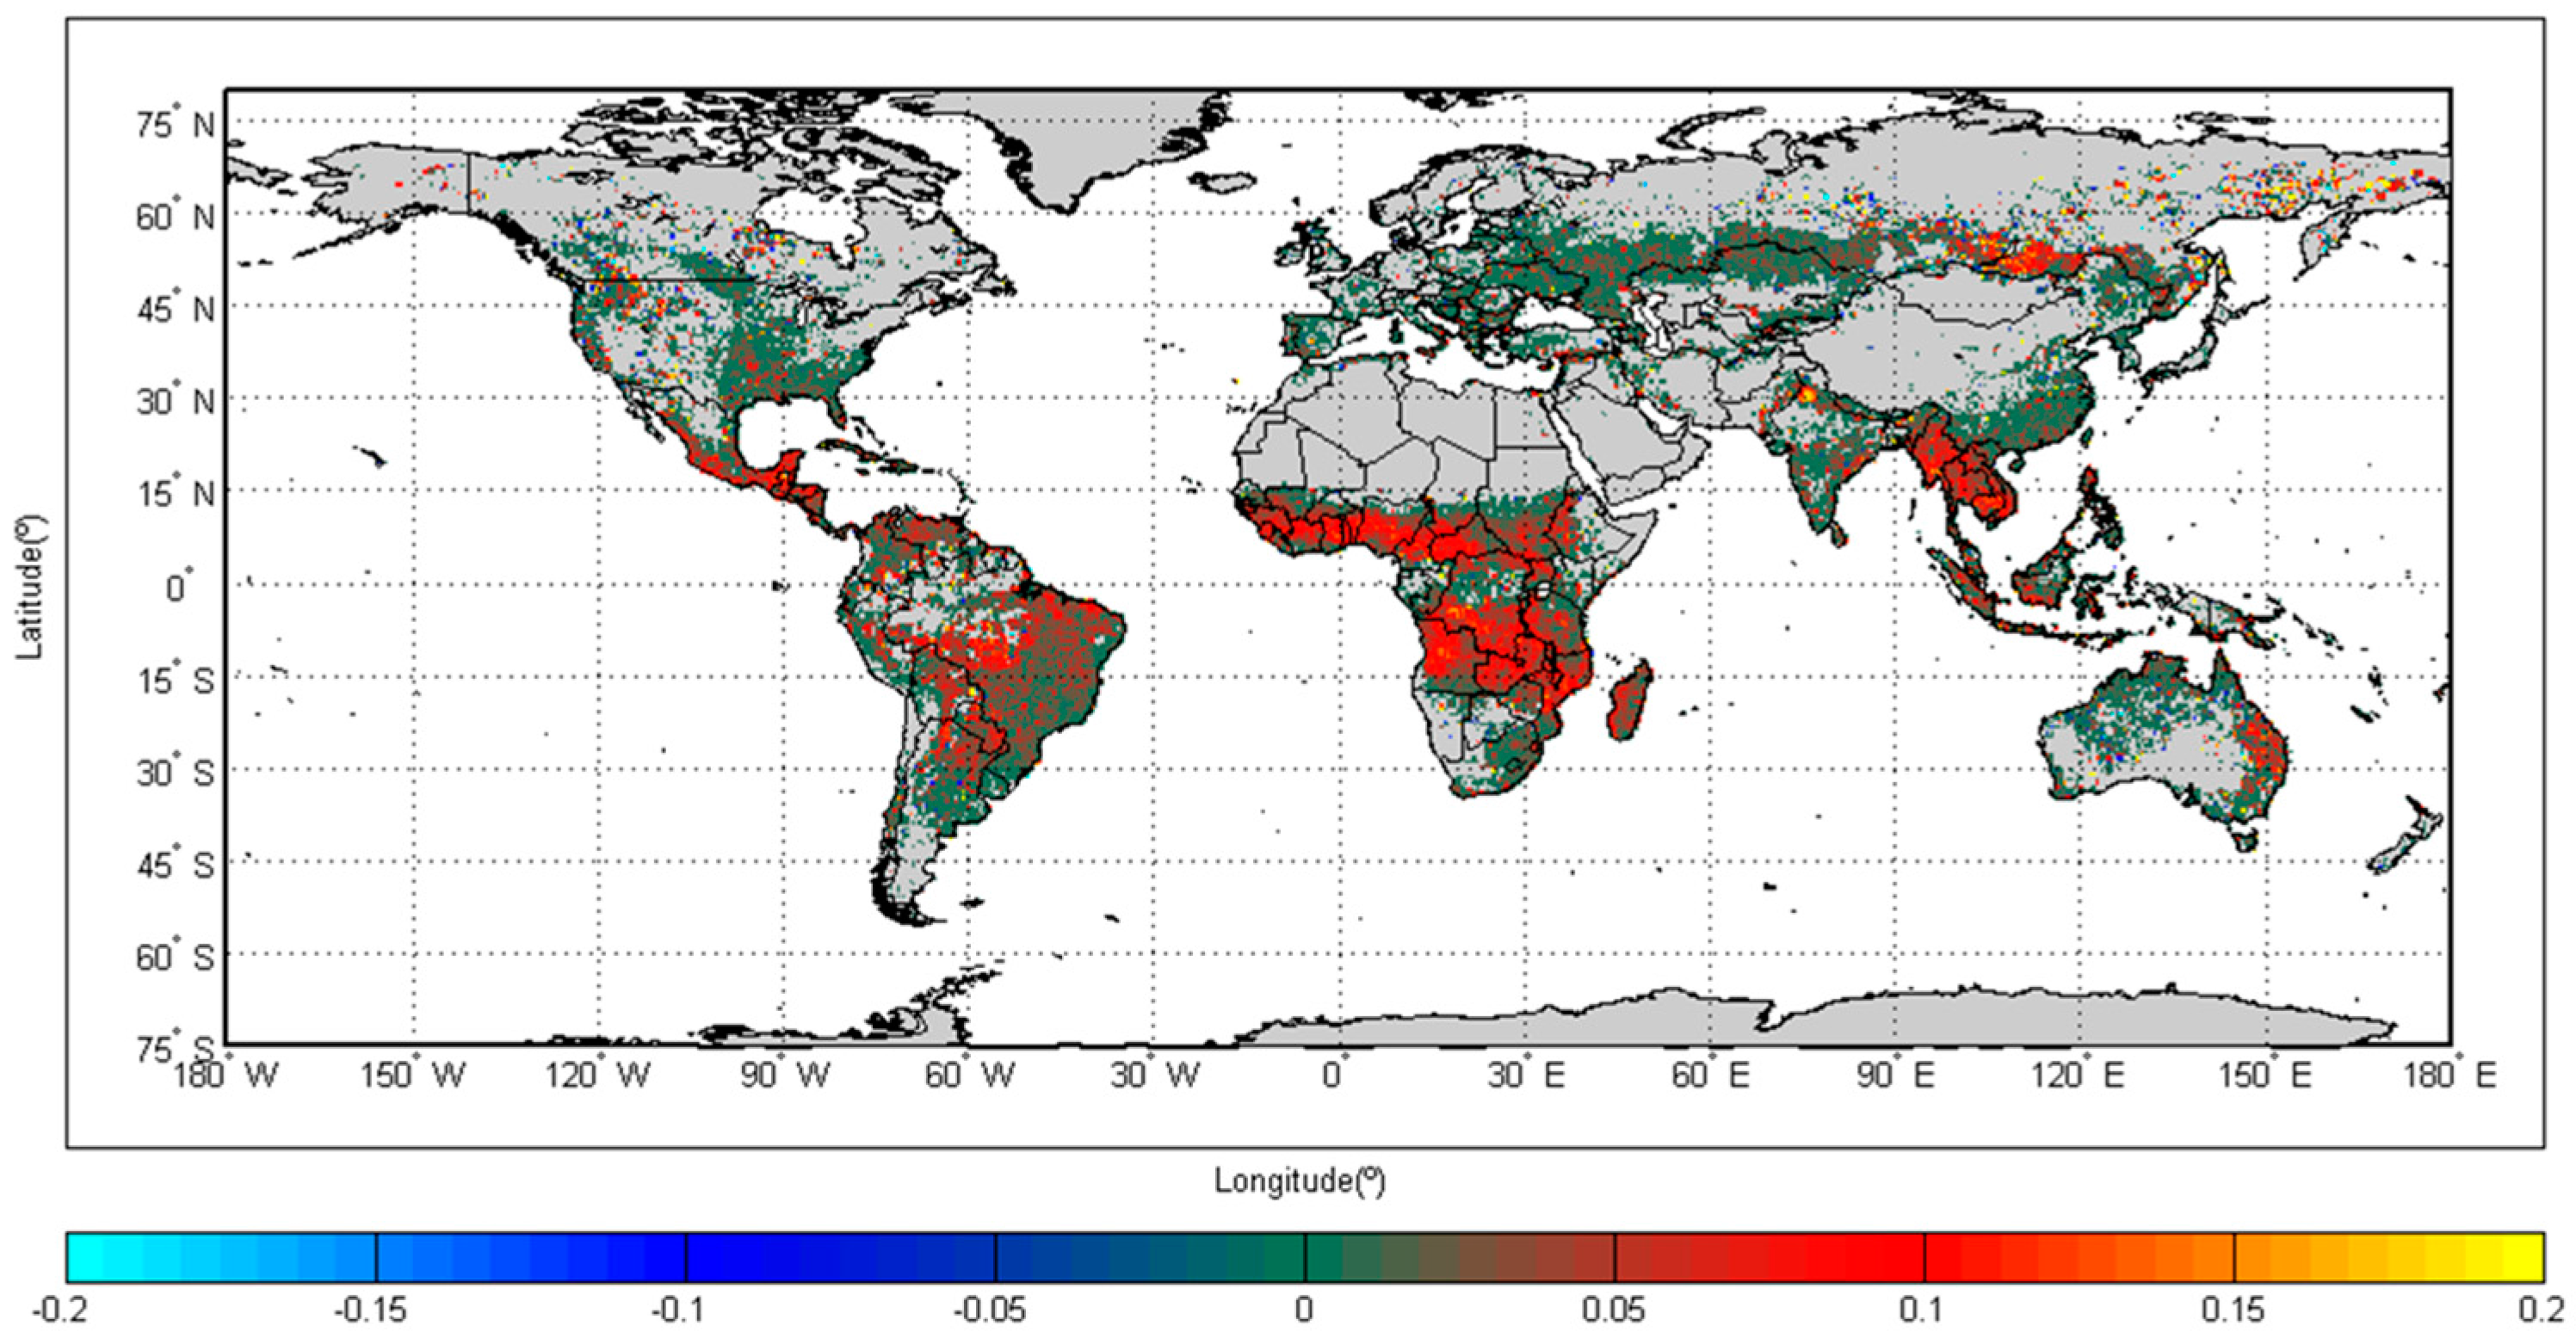
As expected, increasing the time-gap leads to a decrease in the total number of identified active fire clusters and to a smaller proportion of single pixel fires (Table 1). Increasing the time-gap also increased the proportion of active fire clusters in the larger fire size classes. The same trend was reported by [16] using four and eight day time-gaps. Figure 4 and Figure 5 respectively map the differences in the number of active fire clusters and Gini coefficient values obtained using 2- and 14-day time-gaps. In Figure 5, 16,112 out of 31,066 half degree cells (51.86%) show no difference in the number of active fire clusters. There are 122,744 unchanged active fire clusters, with a mean size of 1.7 km2. Areas with a stable number of active fire clusters occurred mainly in agricultural regions, characterized by small, short duration fires, with similar Gini coefficient values for both time-gaps (Figure 5). The cell with the largest difference in the number of active fire clusters was located in north-western India (Punjab, Haryana, and Uttar Pradesh districts), where 774 (mean size of 1.5 km2) and 401 (mean 2.5 km2) active fire clusters were identified with the 2- and 14-day time-gap parameter values, respectively. This area is responsible for two thirds of grain production in India, and has one of the highest fire densities in the world [20] due to extensive straw burning [23]. Large differences in number of active fire clusters as a function of time-gap parameter were also found in Africa, with a high incidence in Miombo savanna woodlands [24], characterized by a high fire size inequality [25], and also in Brazil and south-eastern Asia. Figure 5 shows 15,881 cells (51%) with positive values, meaning that the use of the 14-day time-gap led to higher fire size inequality.
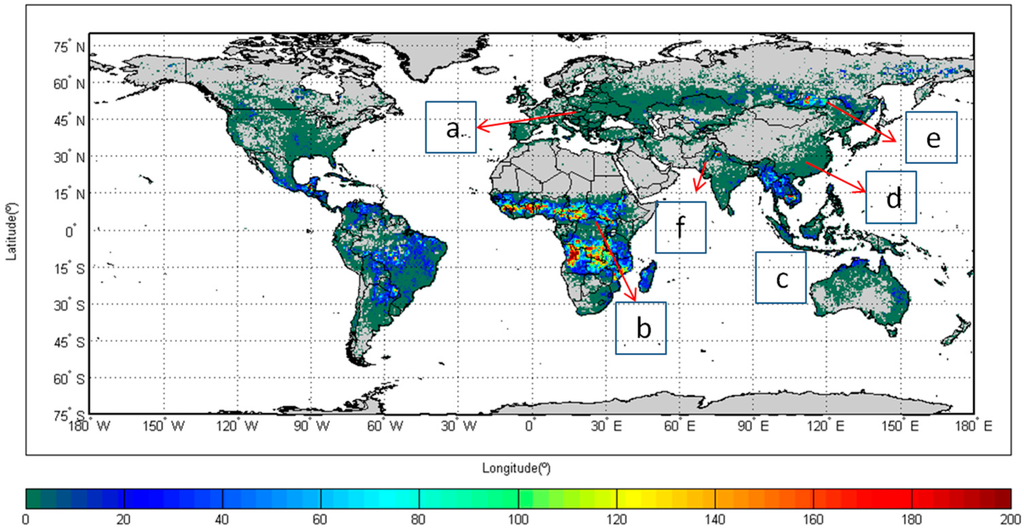
Figure 4.
Active fire clusters number difference for 2-day and 14-day time-gaps for each 0.5° cell in 2003. Cells with no change in active fire clusters number are shown in dark green. Boxes a-f are the location of case study cells:(a) Ukraine; (b) Sudan; (c) Cambodia; (d) China; (e) Russia; and (f) India.
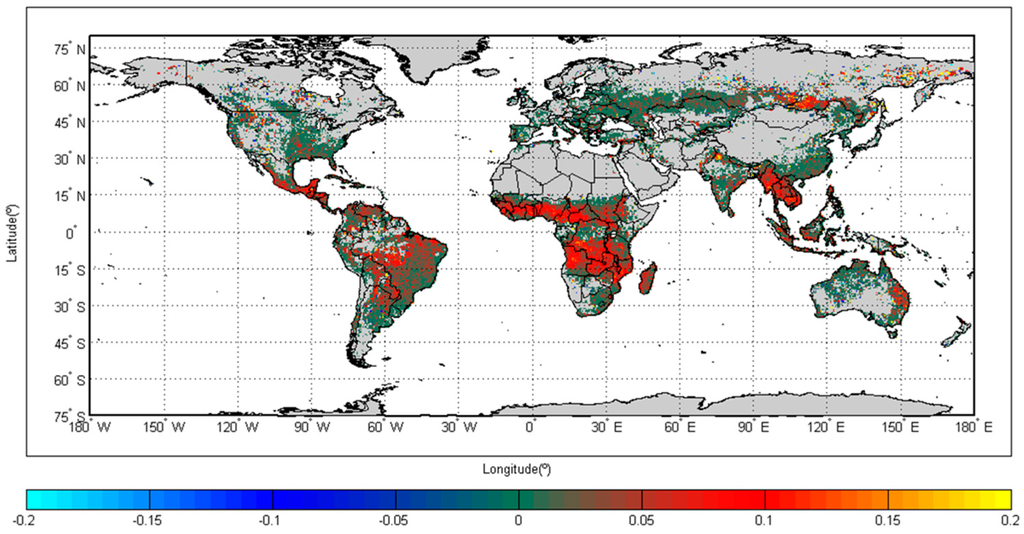
Figure 5.
Gini coefficient values difference for 14-day and 2-day time-gaps for each 0.5° cell in 2003. The differences are reported cell by cell. Cells with no change in number of active fire clusters are shown in dark green.
The largest positive Gini coefficient difference (0.6752) occurs in a cell located in the eastern Siberian steppe. This cell has a group of five active fire clusters, with mean size of 3.12 km2 for the two-day time-gap, and only two active fire clusters (1 km2 and 16 km2) with the 14-day time-gap. With sparse population and vast, uninterrupted expanses of grasslands, this region tends to have most of its burned area concentrated in a small number of very large events. Positive differences among Gini coefficients differences were also found in other semi-arid to arid dry lands of Central Asia, namely along the border between Mongolia and northern Kazakhstan. Woodland savannas in both African hemispheres, southeastern USA, the Llanos savannas of Colombia and Venezuela, the “arc of deforestation” in Brazil, the Chaco of Paraguay, eastern Australia, and insular south-east Asia also show increasing fire size inequality. A large patch with a high number of active fire clusters is founding the east of Lake Baikal, in the Amur River basin steppe, a sparsely inhabited area characterized by fire regimes dominated by wildfires in semi-arid to arid grasslands and shrublands. In the summer of 2003, this region recorded a large number of wildfires [26]. Decreasing size inequality in response to a larger time-gap, occurred in 9% of all cells (2836), scattered all over the globe. Most of these negative values correspond to rearrangements of fire size inequality towards a more balanced distribution with the 14-day time-gap, which occurs, for instance, with the largest negative Gini value observed in eastern Siberian steppe. In this case, two active fire clusters exhibit different arrangements according to the time-gap used. With a two-day time-gap, fire sizes of 1 km2 and 15 km2 were individuated, resulting in a value of Gini coefficient of 0.8235. With the 14-day time-gap, a new arrangement led to a more balanced fire size distribution with 7 km2 and 9 km2 and a value to which corresponded a Gini coefficient value of 0.08. Places exhibiting no significant differences between both time-gaps (12,349 cells, 40%) are mainly located in areas of intense land use management and high population density, dominated by small fire sizes. They are found over a very broad area spreading across the five continents: south-eastern/eastern of Mississippi river (USA), south-eastern Brazil, Peru, the Pampas of Uruguay and northern Argentina, large areas over eastern Europe, Kazakhstan, India, and eastern/south-eastern China.
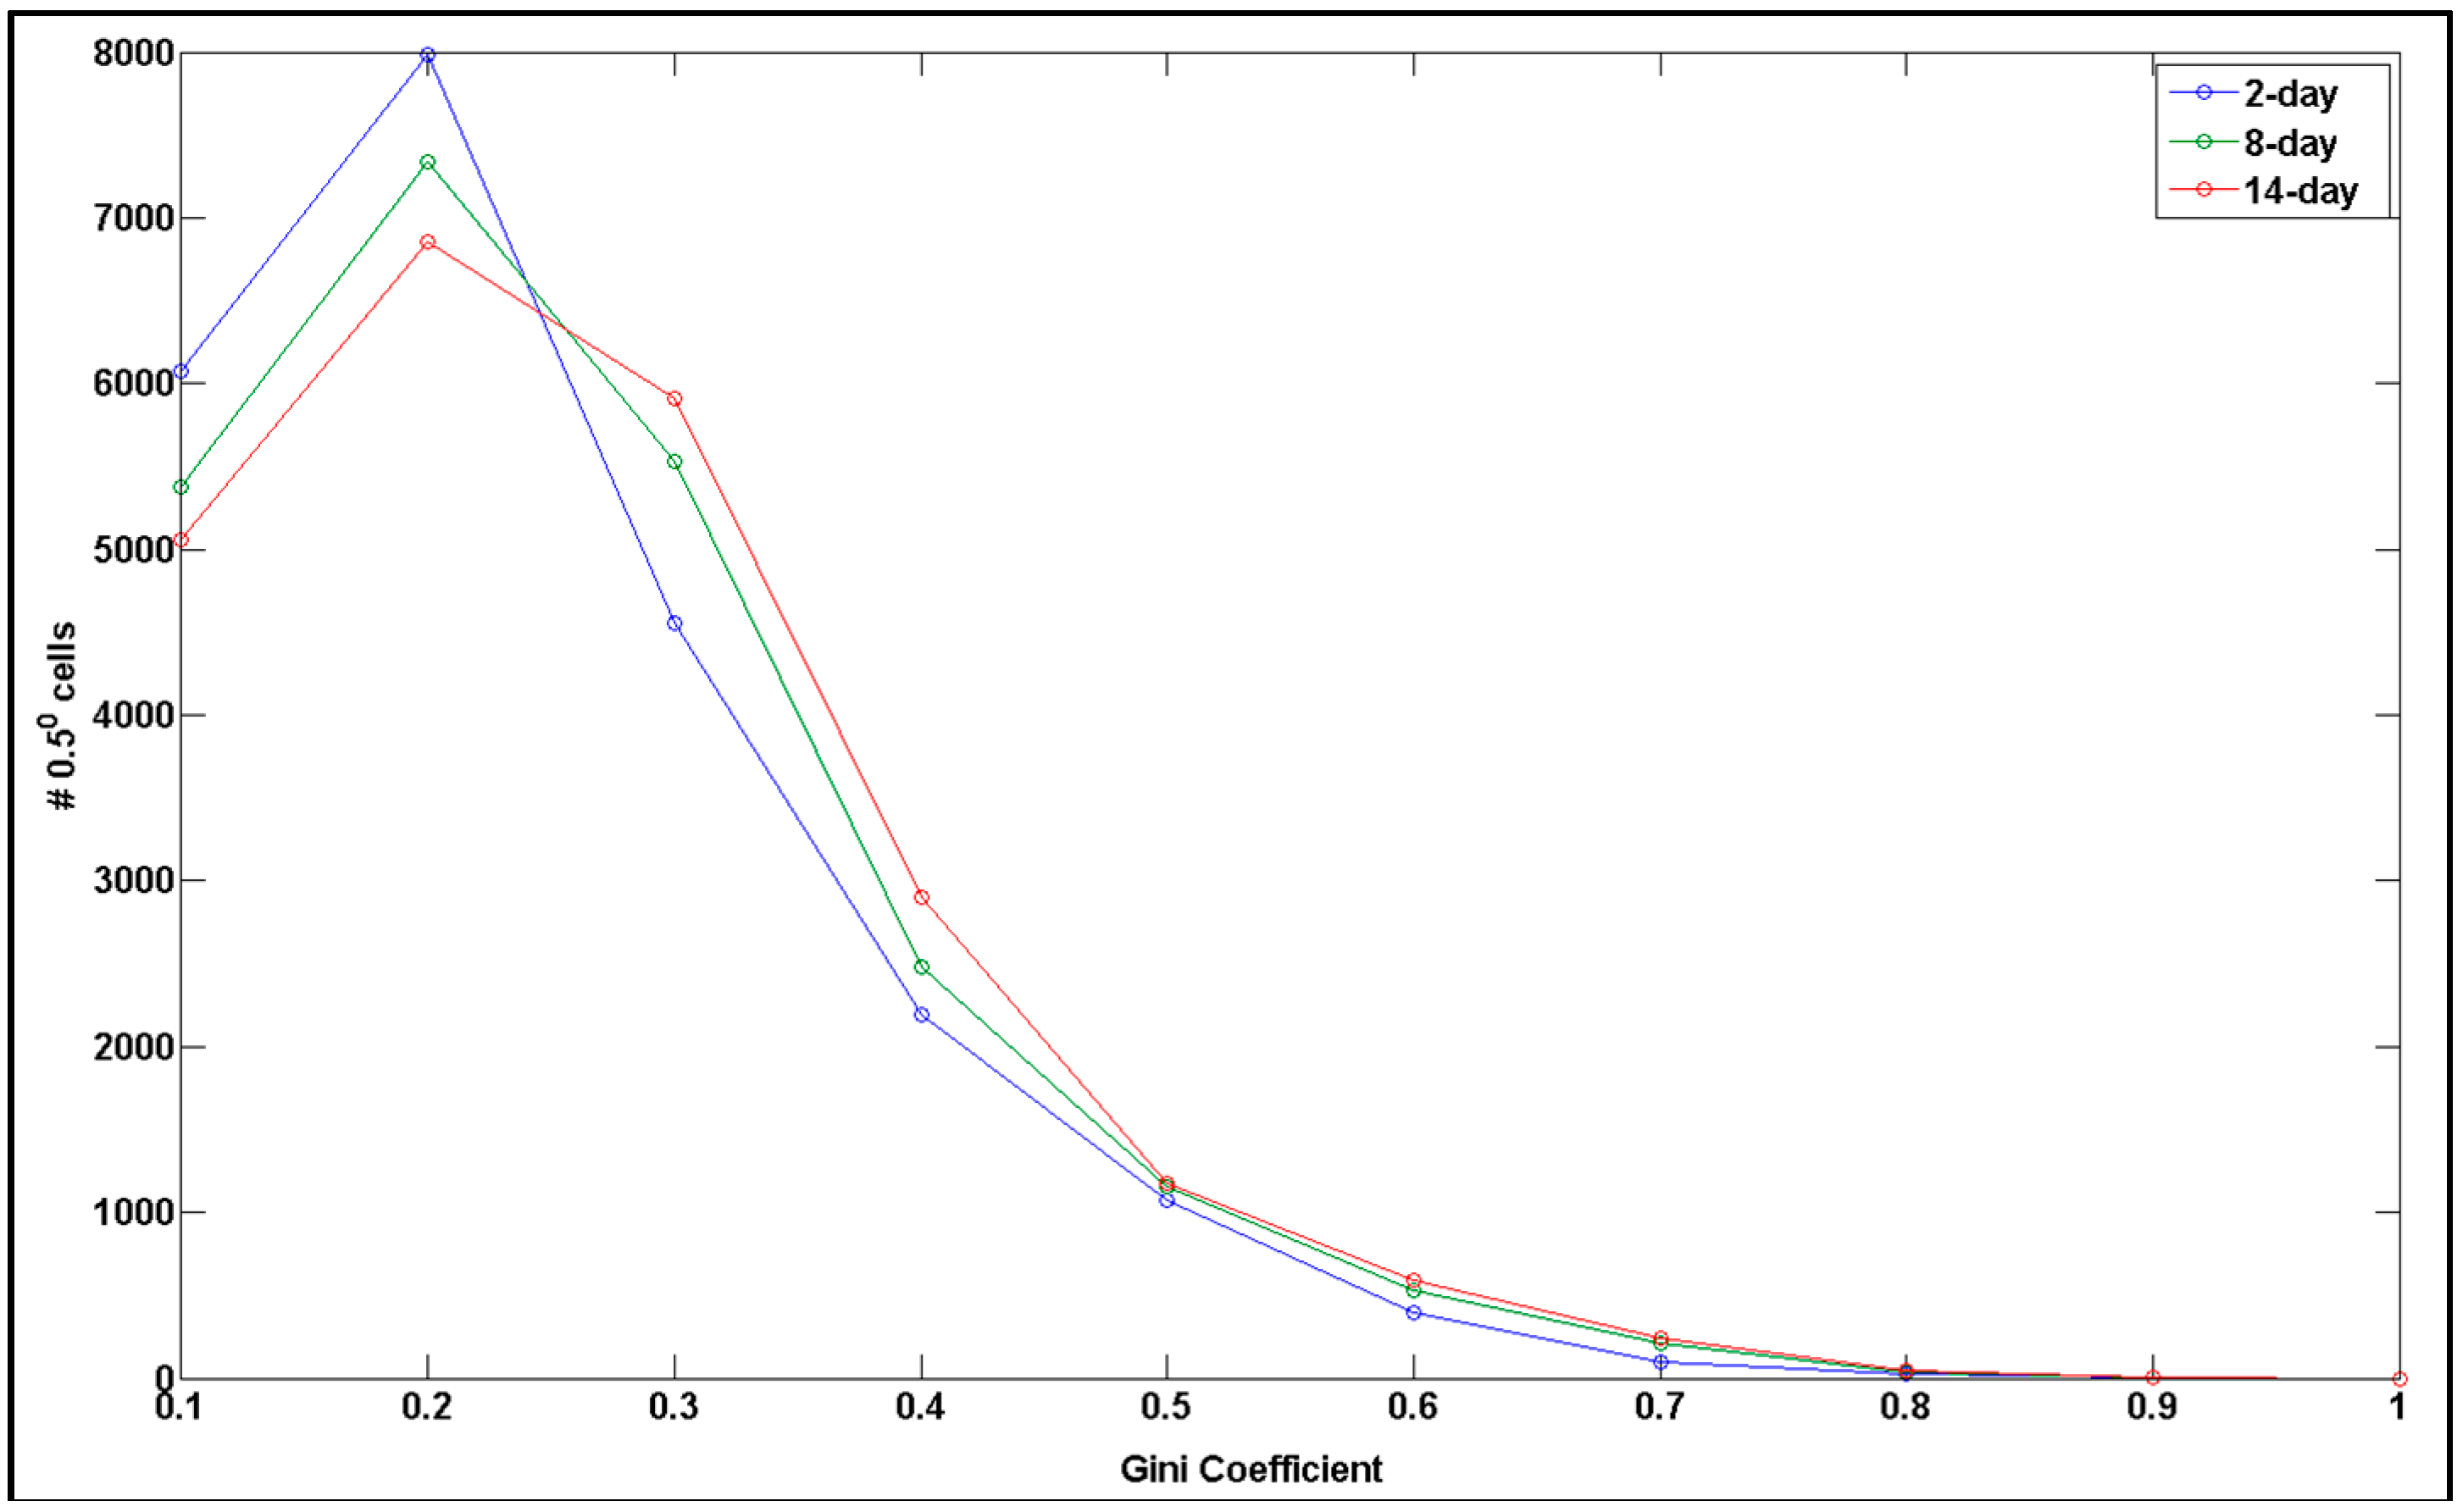
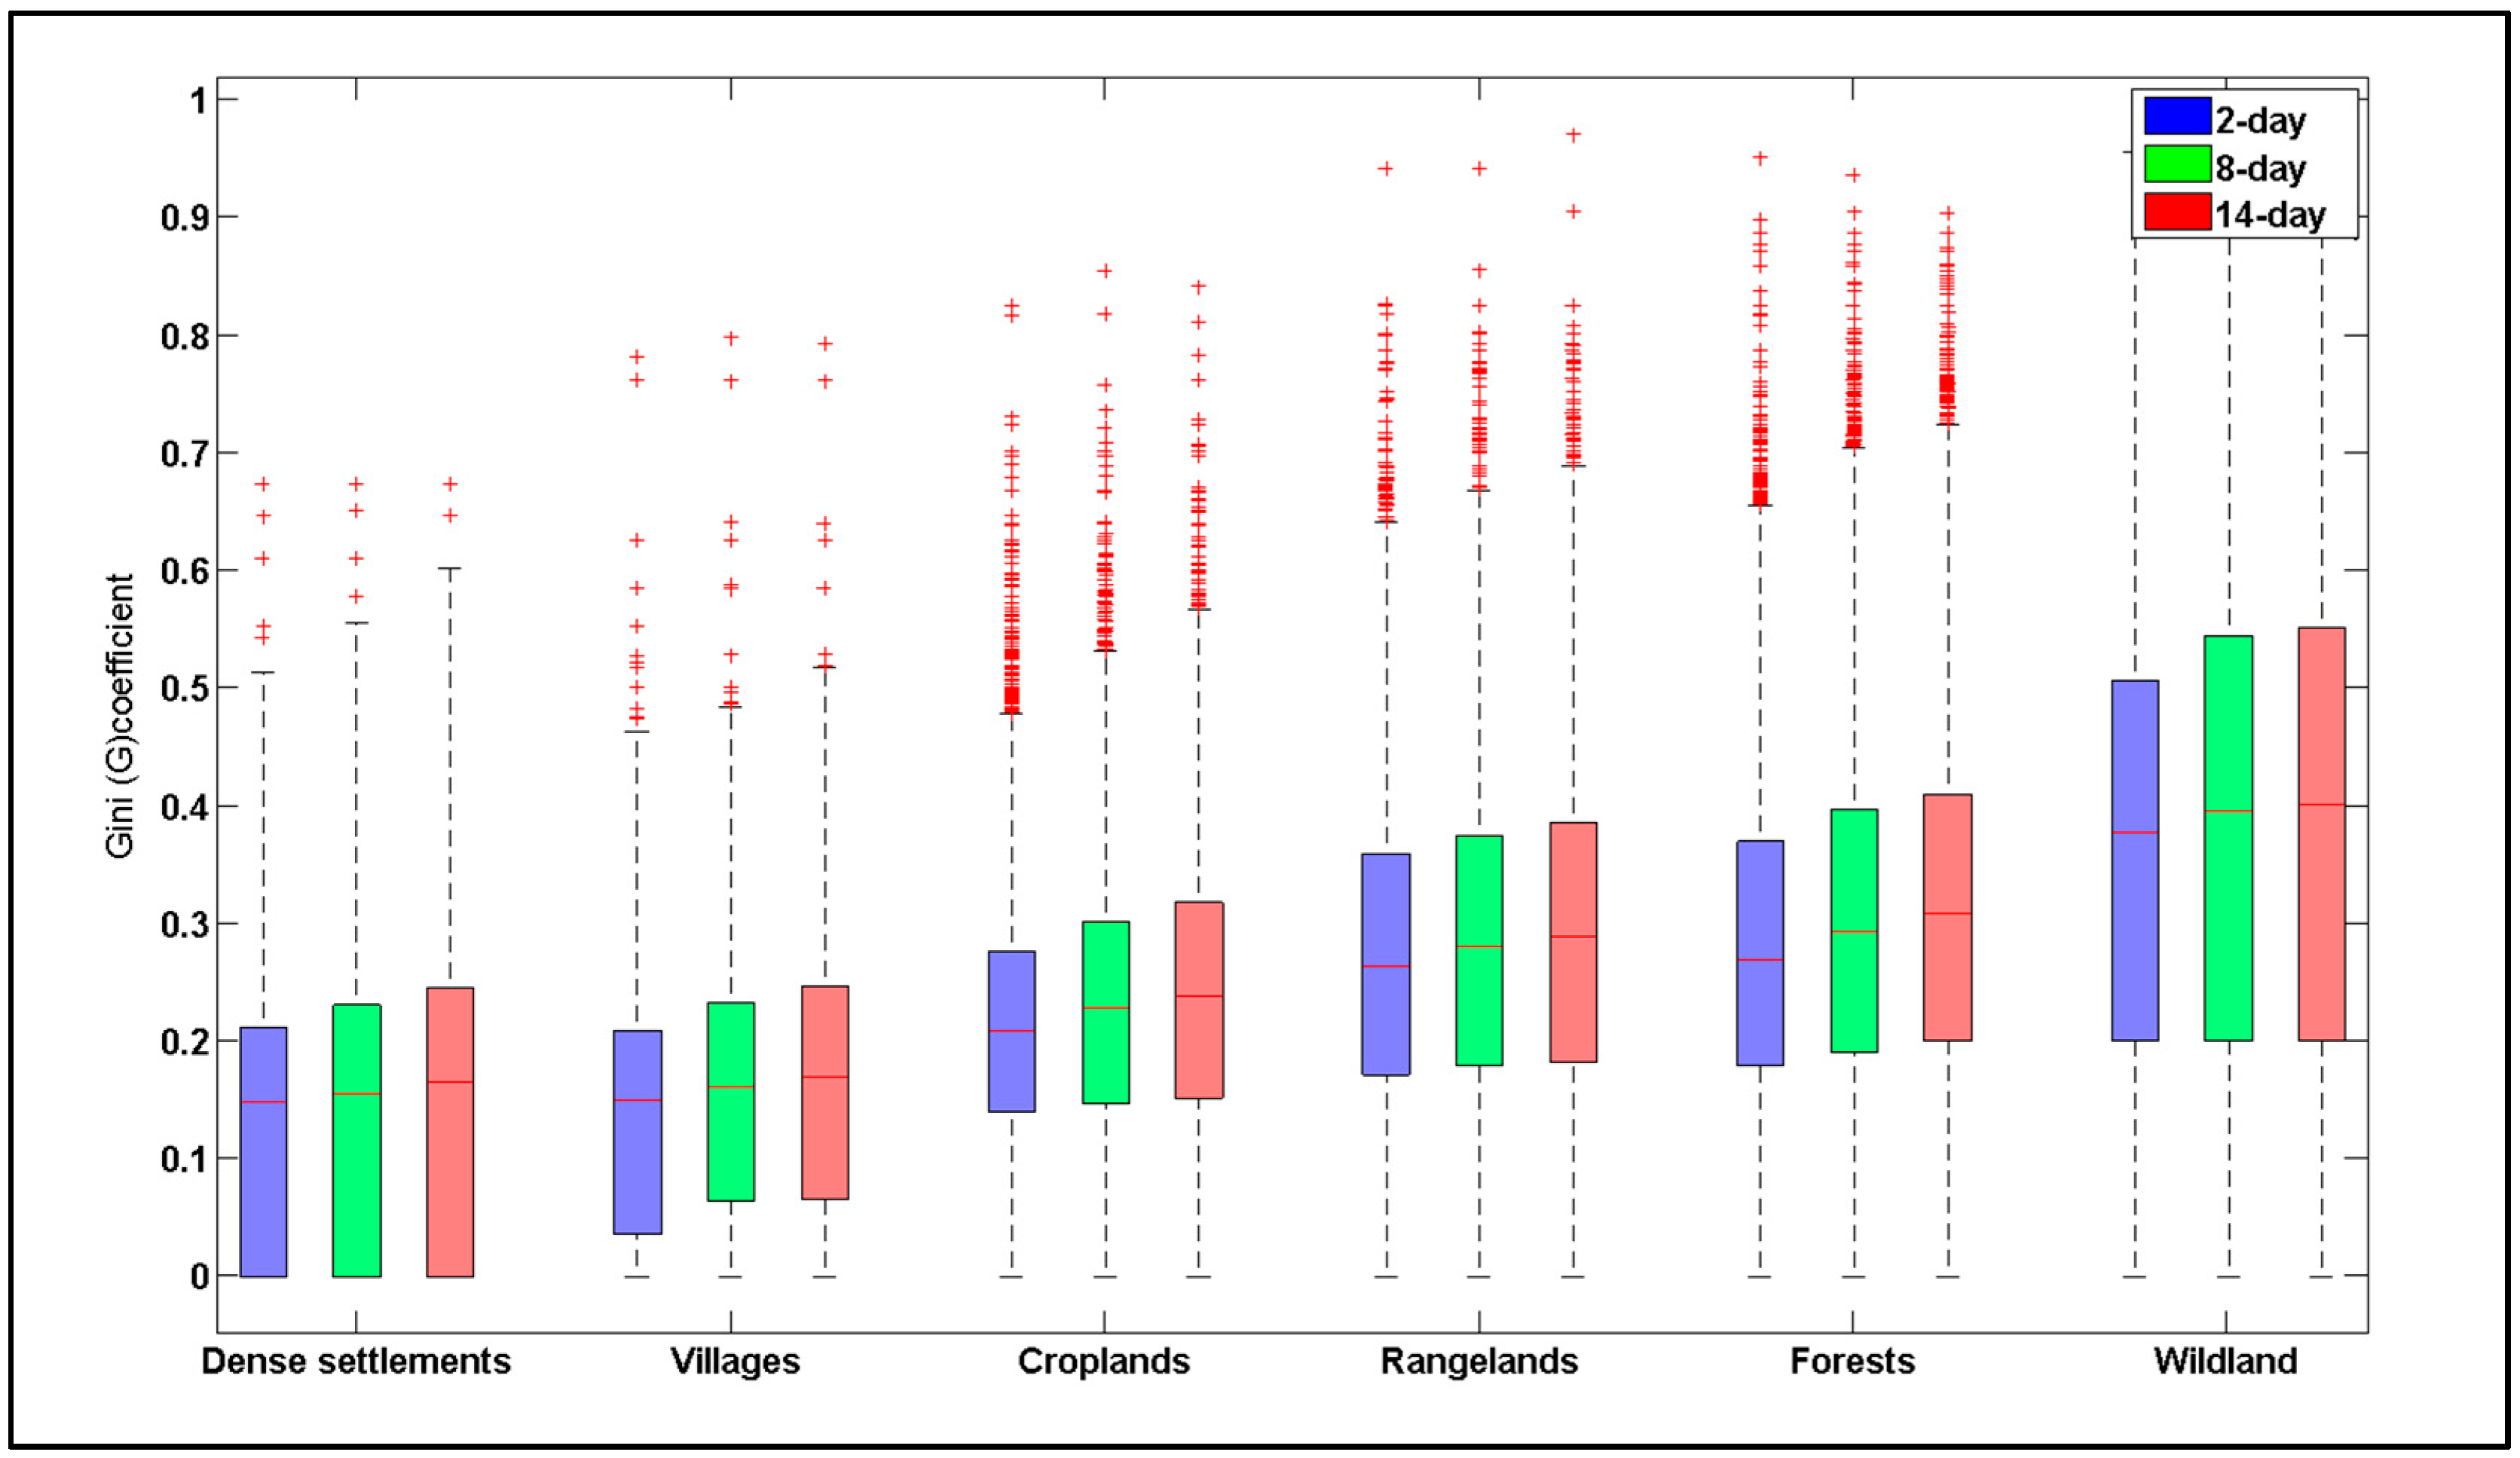
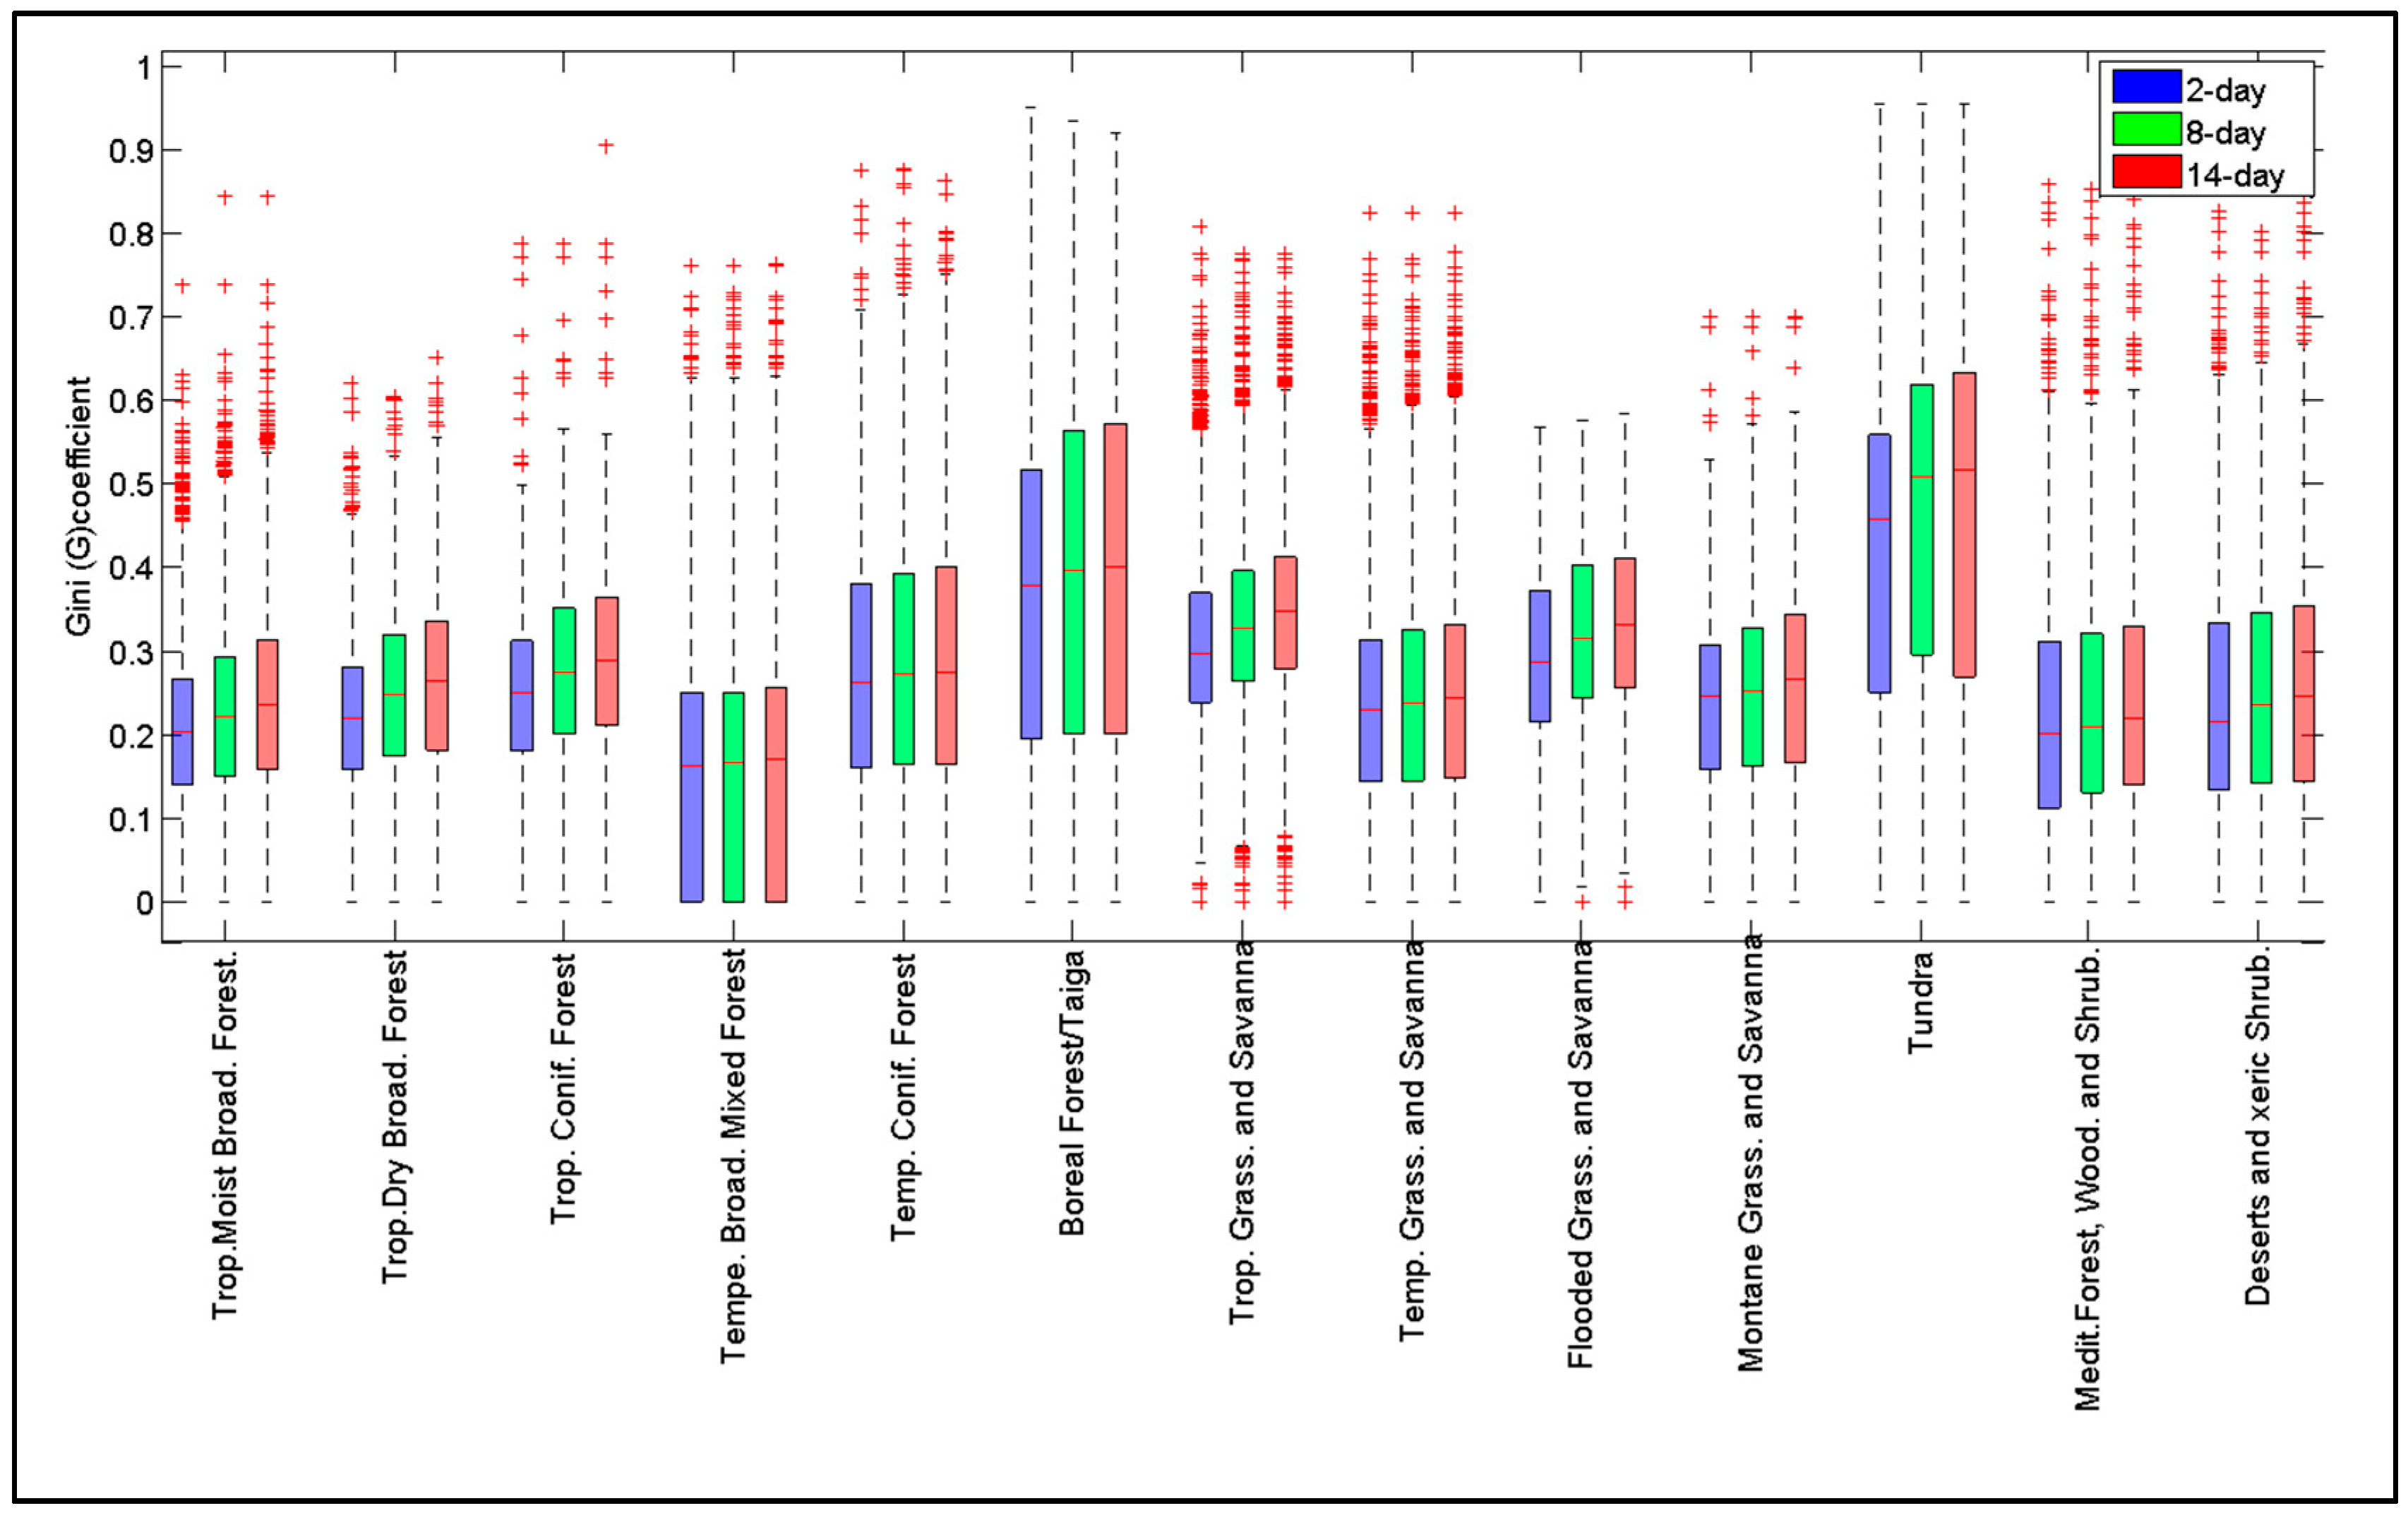
To interpret the impact on fire size distribution, the Gini coefficient was calculated for each time-gap (Figure 6) and its spatial distribution was analyzed with six Anthromes classes derived from [17] (Figure 7) and 13 biomes derived from [18] (Figure 8).
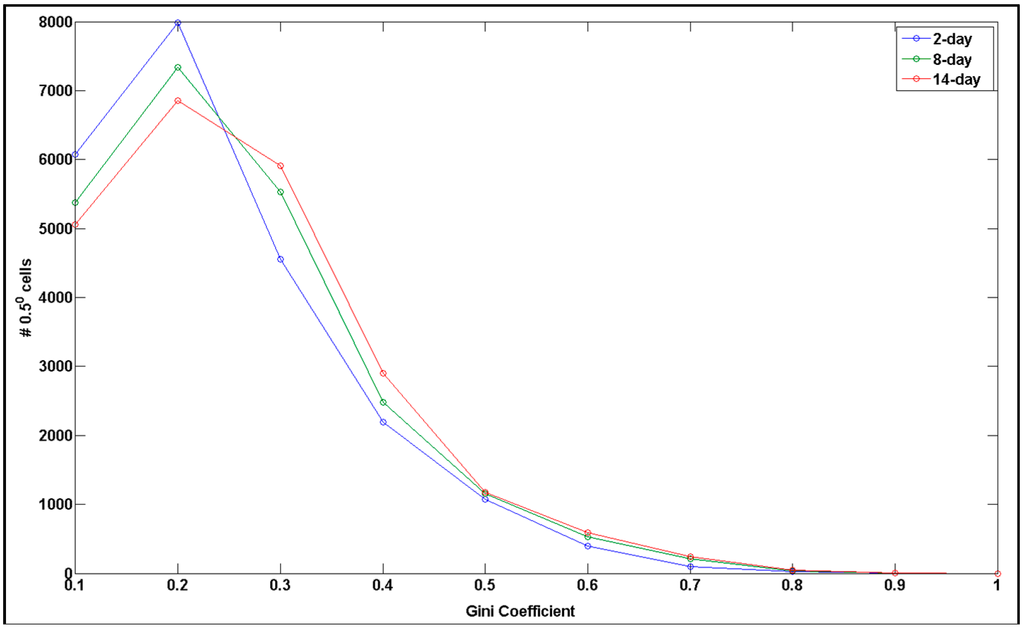
Figure 6.
Gini coefficient global frequency distributions for time-gaps 2-, 8- and 14-day.
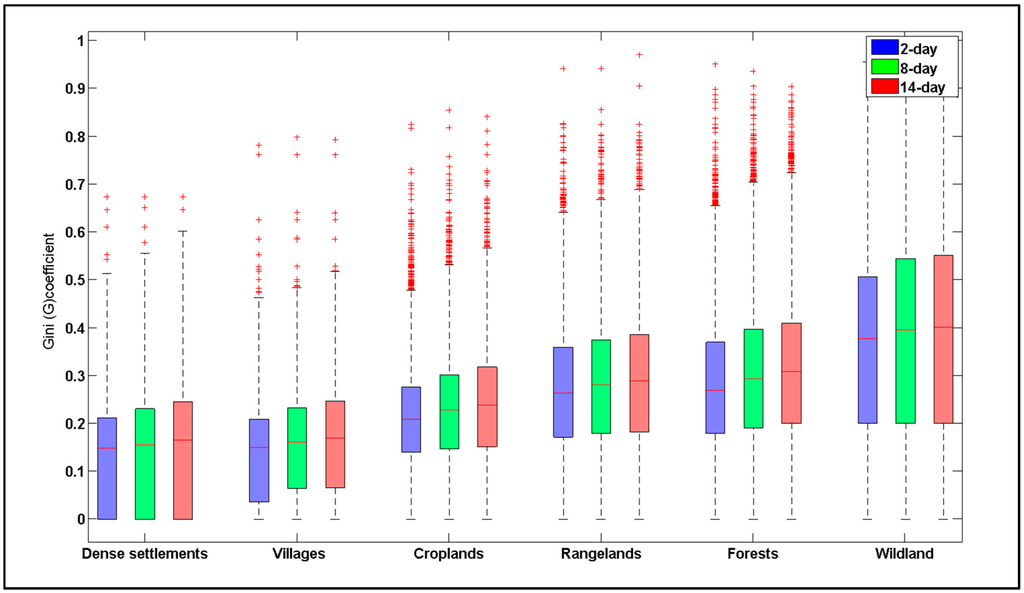
Figure 7.
Gini coefficient values for the six major Anthrome classes using 2-, 8- and 14-day time-gaps.
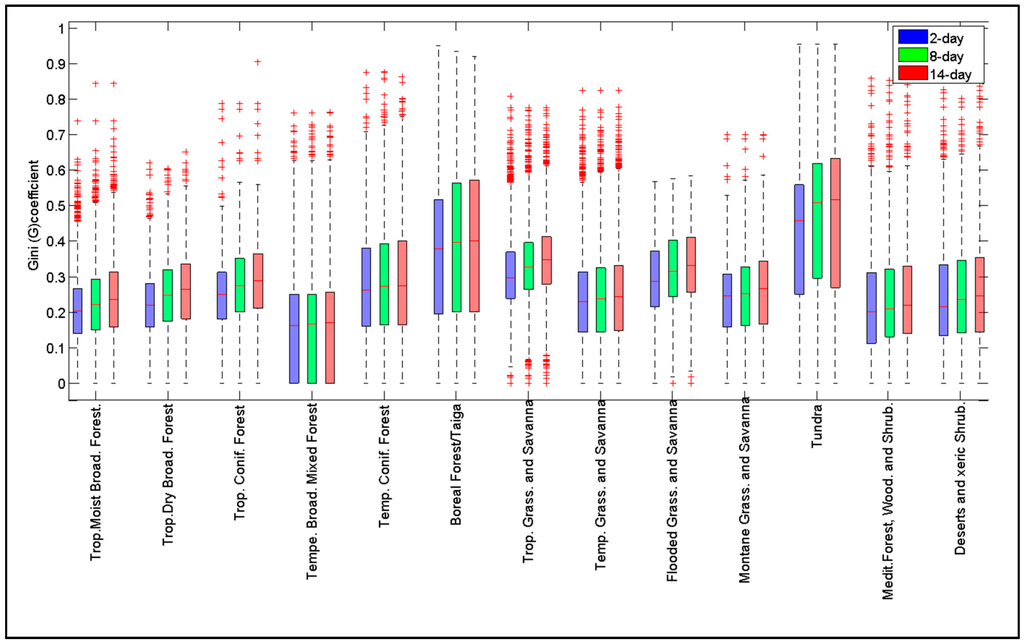
Figure 8.
Gini coefficient values for 13 biomes, using 2-, 8-, and 14-day time-gaps.
Although all three distributions peak in frequency at a Gini value of 0.2, the distribution for two-day time-gap displays higher frequencies for lower Gini values, indicating a more balanced distribution of active fire clusters by size class compared to those obtained with 8- and 14-day time-gaps, which tend to concentrate fire activity into a smaller number of larger events. Differences between the latter two distributions are smaller.
Gini coefficient values increase from densely settled and managed landscapes to sparsely populated, unmanaged areas, reflecting the shift from balanced distributions with many small fires, to distributions dominated by a small number of very large fires. No major differences between Anthromes in sensitivity to the time-gap parameter are apparent, although the 75th percentile seem to be slightly more sensitive than the 25th percentile in most Anthromes. For each Anthrome class, one 0.5 °cell was selected (Figure 4) and the total number of active fire clusters and Gini coefficient vales were depicted for the 3 different time-gaps (Table 2).

Table 2.
Total number of active fire clusters for each case study using three different time-gaps. Gini coefficients values are displayed in parenthesis.
Table 2 shows that the cells classified as Villages (d) and Croplands (a) have the lowest number of active fire clusters and the smallest difference between time-gaps. The highest number recorded for the three time-gaps belongs to Punjab district in India (f), with the largest difference in the number of active fire clusters occurring between 2- and 14-day time-gaps. As already mentioned, the 14-day time-gap yields considerably higher pixel aggregation as the 2- or 8-day time-gaps.
A biome based analysis [18], picks up a pattern not discernible with the Anthromes data: Gini coefficient sensitivity to time-gap is relatively higher in tropical biomes, such as Tropical Dry Broadleaf Forest, Tropical Grasslands and Savannas, and Flooded Grasslands and Savannas (most of which are located in the tropics) than in temperate of boreal biomes, with the lowest sensitivities occurring in Temperate Broadleaf Mixed Forests and in Temperate Conifer Forests.
3.2. Performance of the Active Fire Clusters Individuation Algorithm
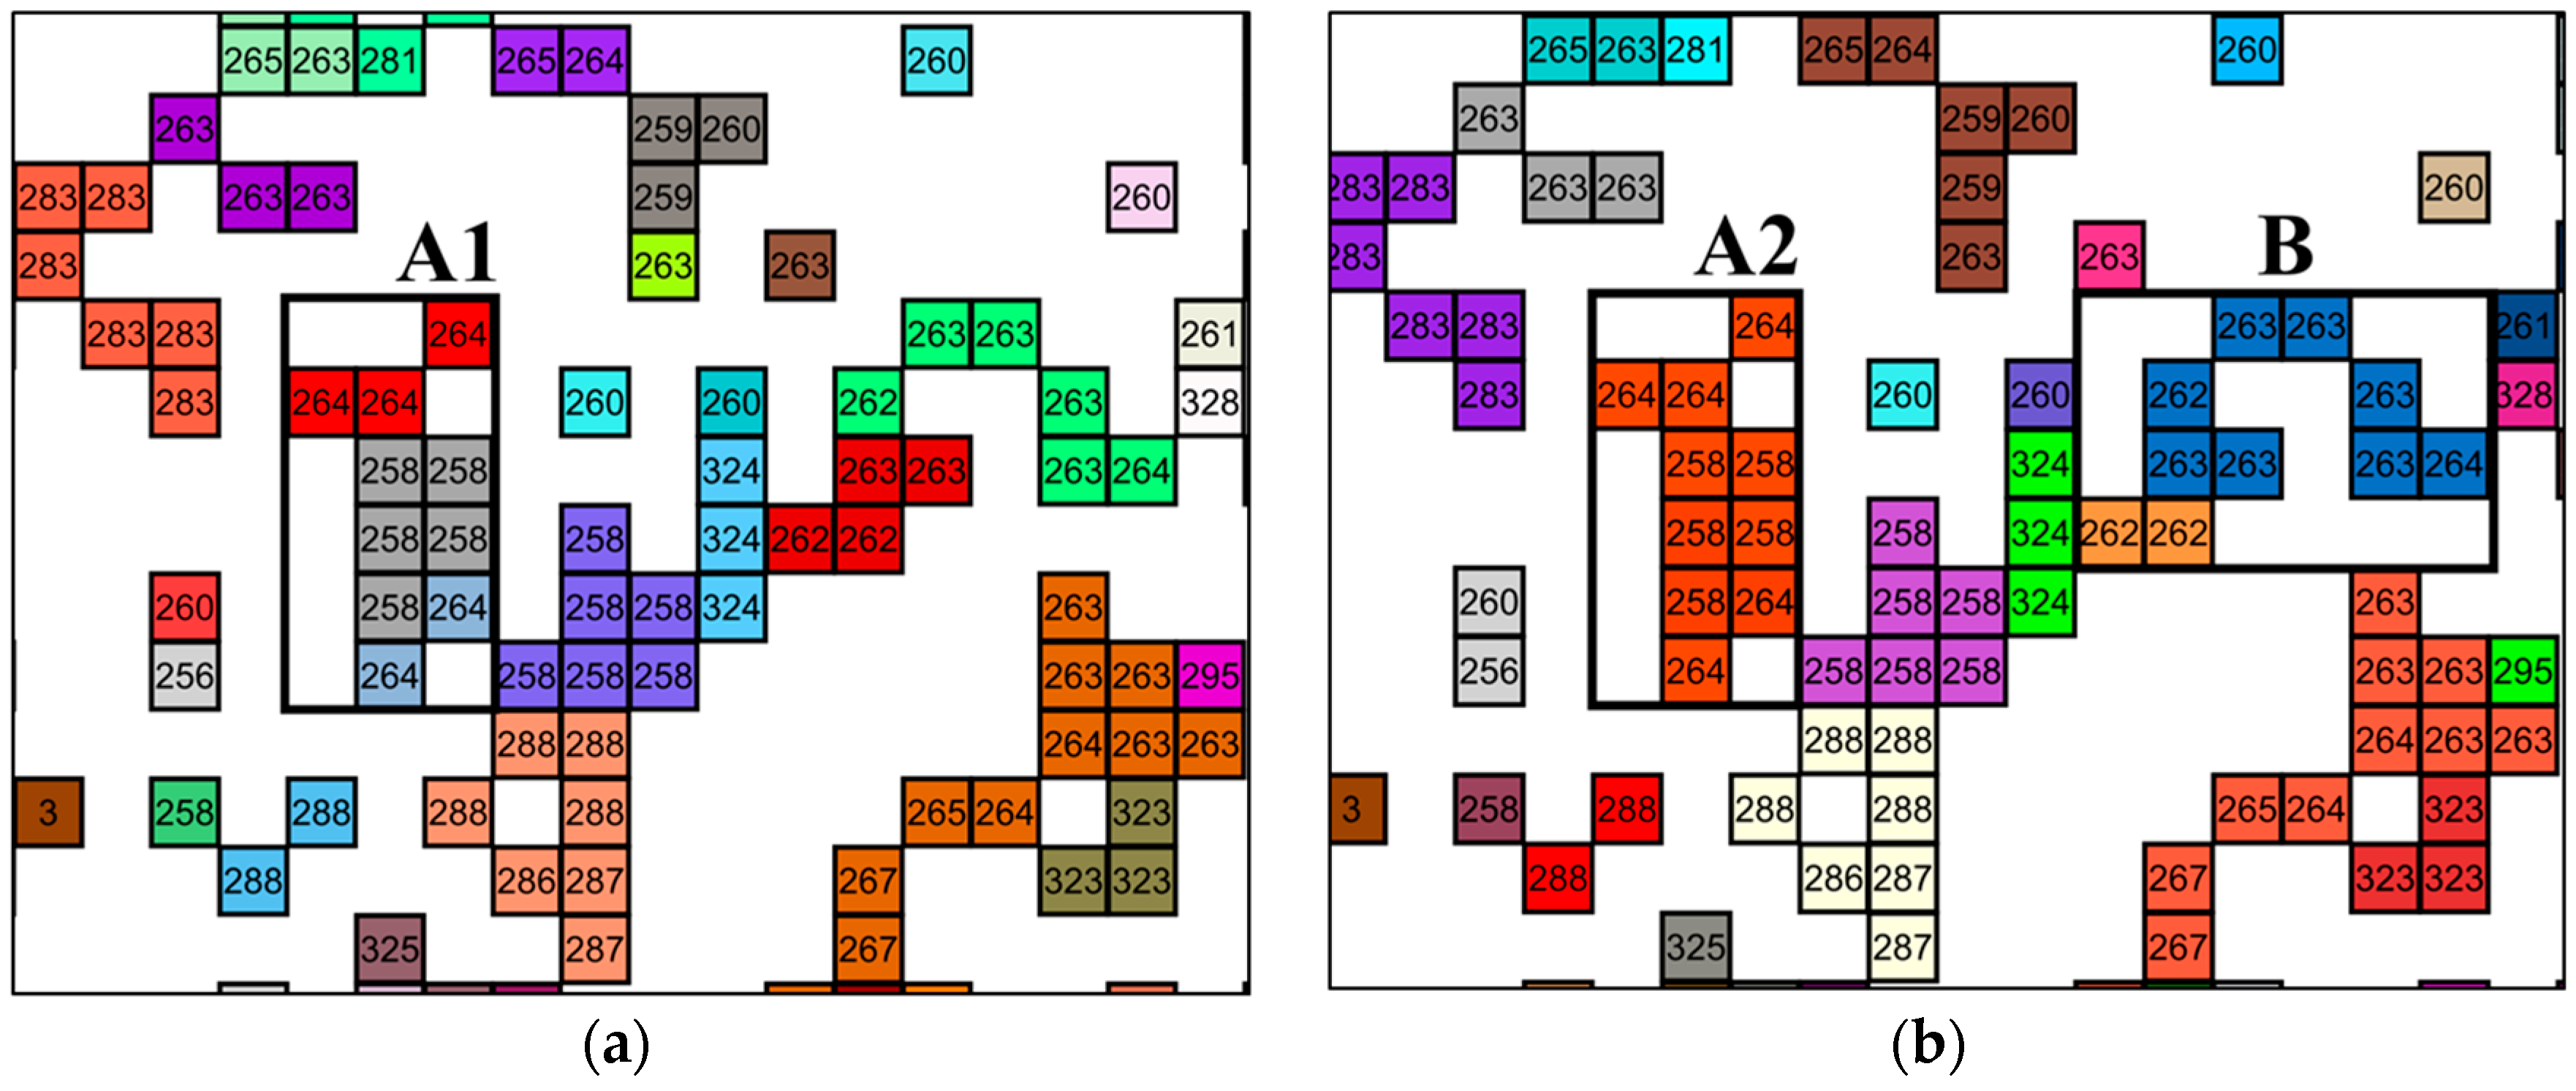
As an example of algorithm performance, Figure 9 show in detail the consequences of using different time-gaps (2- and 14-day) in a case study located in Sudan (Figure 9a,b. Figure 9b, based on a 14-day time-gap, exhibits a clearly more aggregated pattern with fewer active fire clusters than the two-day time-gap case of Figure 9a. For this cell, the number of active fire clusters for 2- and 14-day time-gaps were respectively 470 and 409 (Table 2).
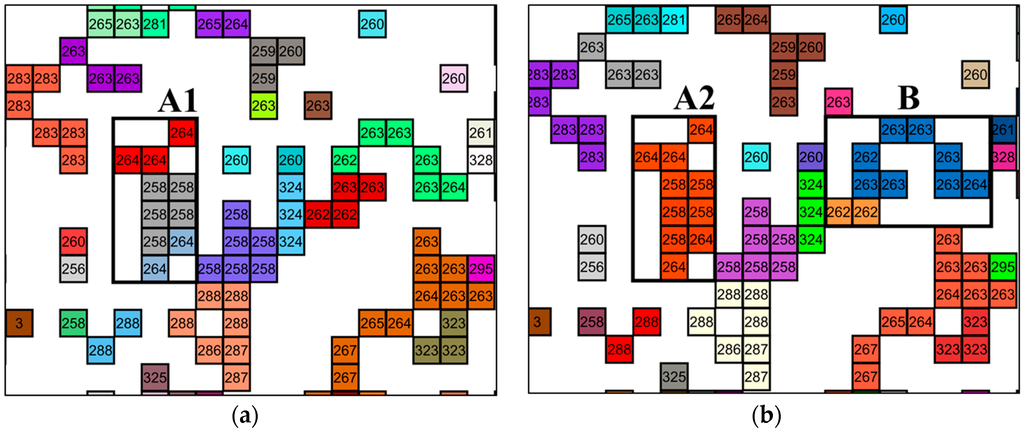
Figure 9.
Region of a Sudan 0.5° cell (8°N, 27°E), using (a) 2-day and (b) 14-day time-gaps. Colored small squares are MODIS 1 km2 active fire pixels for 2003. Each color is allocated to one active fire cluster. Numbers in the small boxes correspond to date of burning (1–365) for 2003. Box A1, A2, and B are described in the text and detailed in Figure 10 and Figure 11.
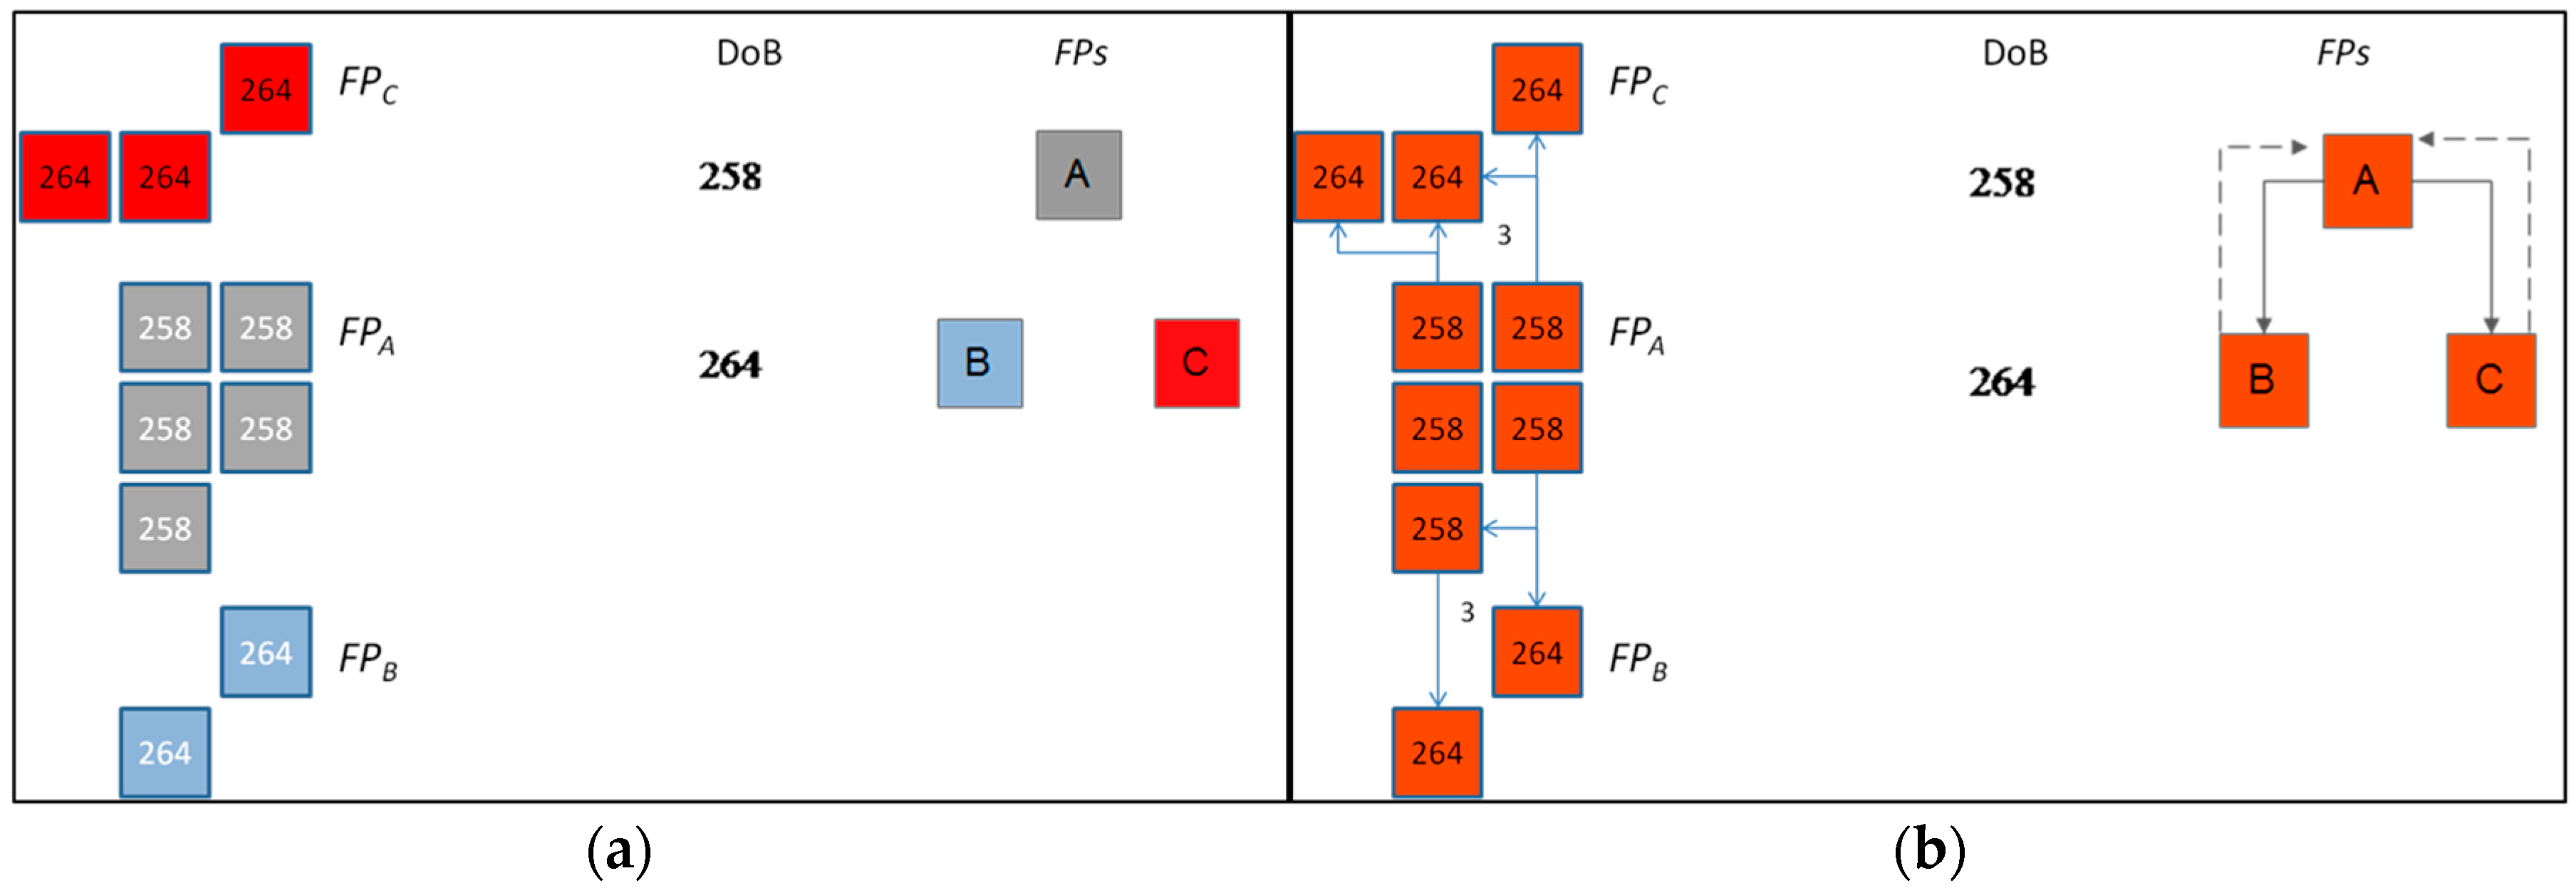
We analyzed in detail the decomposition into active fire clusters for boxes A1 and A2 in the Sudan region (Figure 10a,b respectively), to investigate if differences in the number of active fire clusters emerge from the two time-gaps (A1: 2-day; A2: 14-day). Figure 10 depicts several active fire pixels aggregated into three FPs. The common date of burning differences among these three FPs (six days) is above and below the 2-(Figure 10a) and 14-day time-gaps (Figure 10b), respectively. As a consequence, in the former case no temporal contiguity relationships exist, yielding three different active fire clusters. In the latter case, with the time-gap considered FPB and FPD are linked to FPA by causal relation (dashed arrows) and only one active fire cluster is obtained. No other configuration of causal relation may exist in this case.
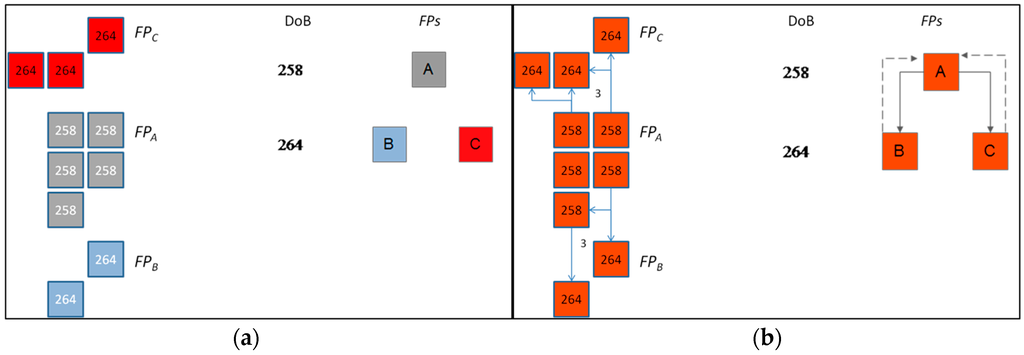
Figure 10.
(a) Detail of box A1 with 2-day time-gap and (b) box A2 with 14-day time-gap boxes mentioned in Figure 10. On the left side of the figures, each square represents a MODIS active fire with the number inside related to the date of burning. These active fires pixels are aggregated into Fire Patches (FPA, FPB and FPC) and their spatial-temporal contiguity relationships are encoded in the corresponding digraph structure shown on right side of the figures.
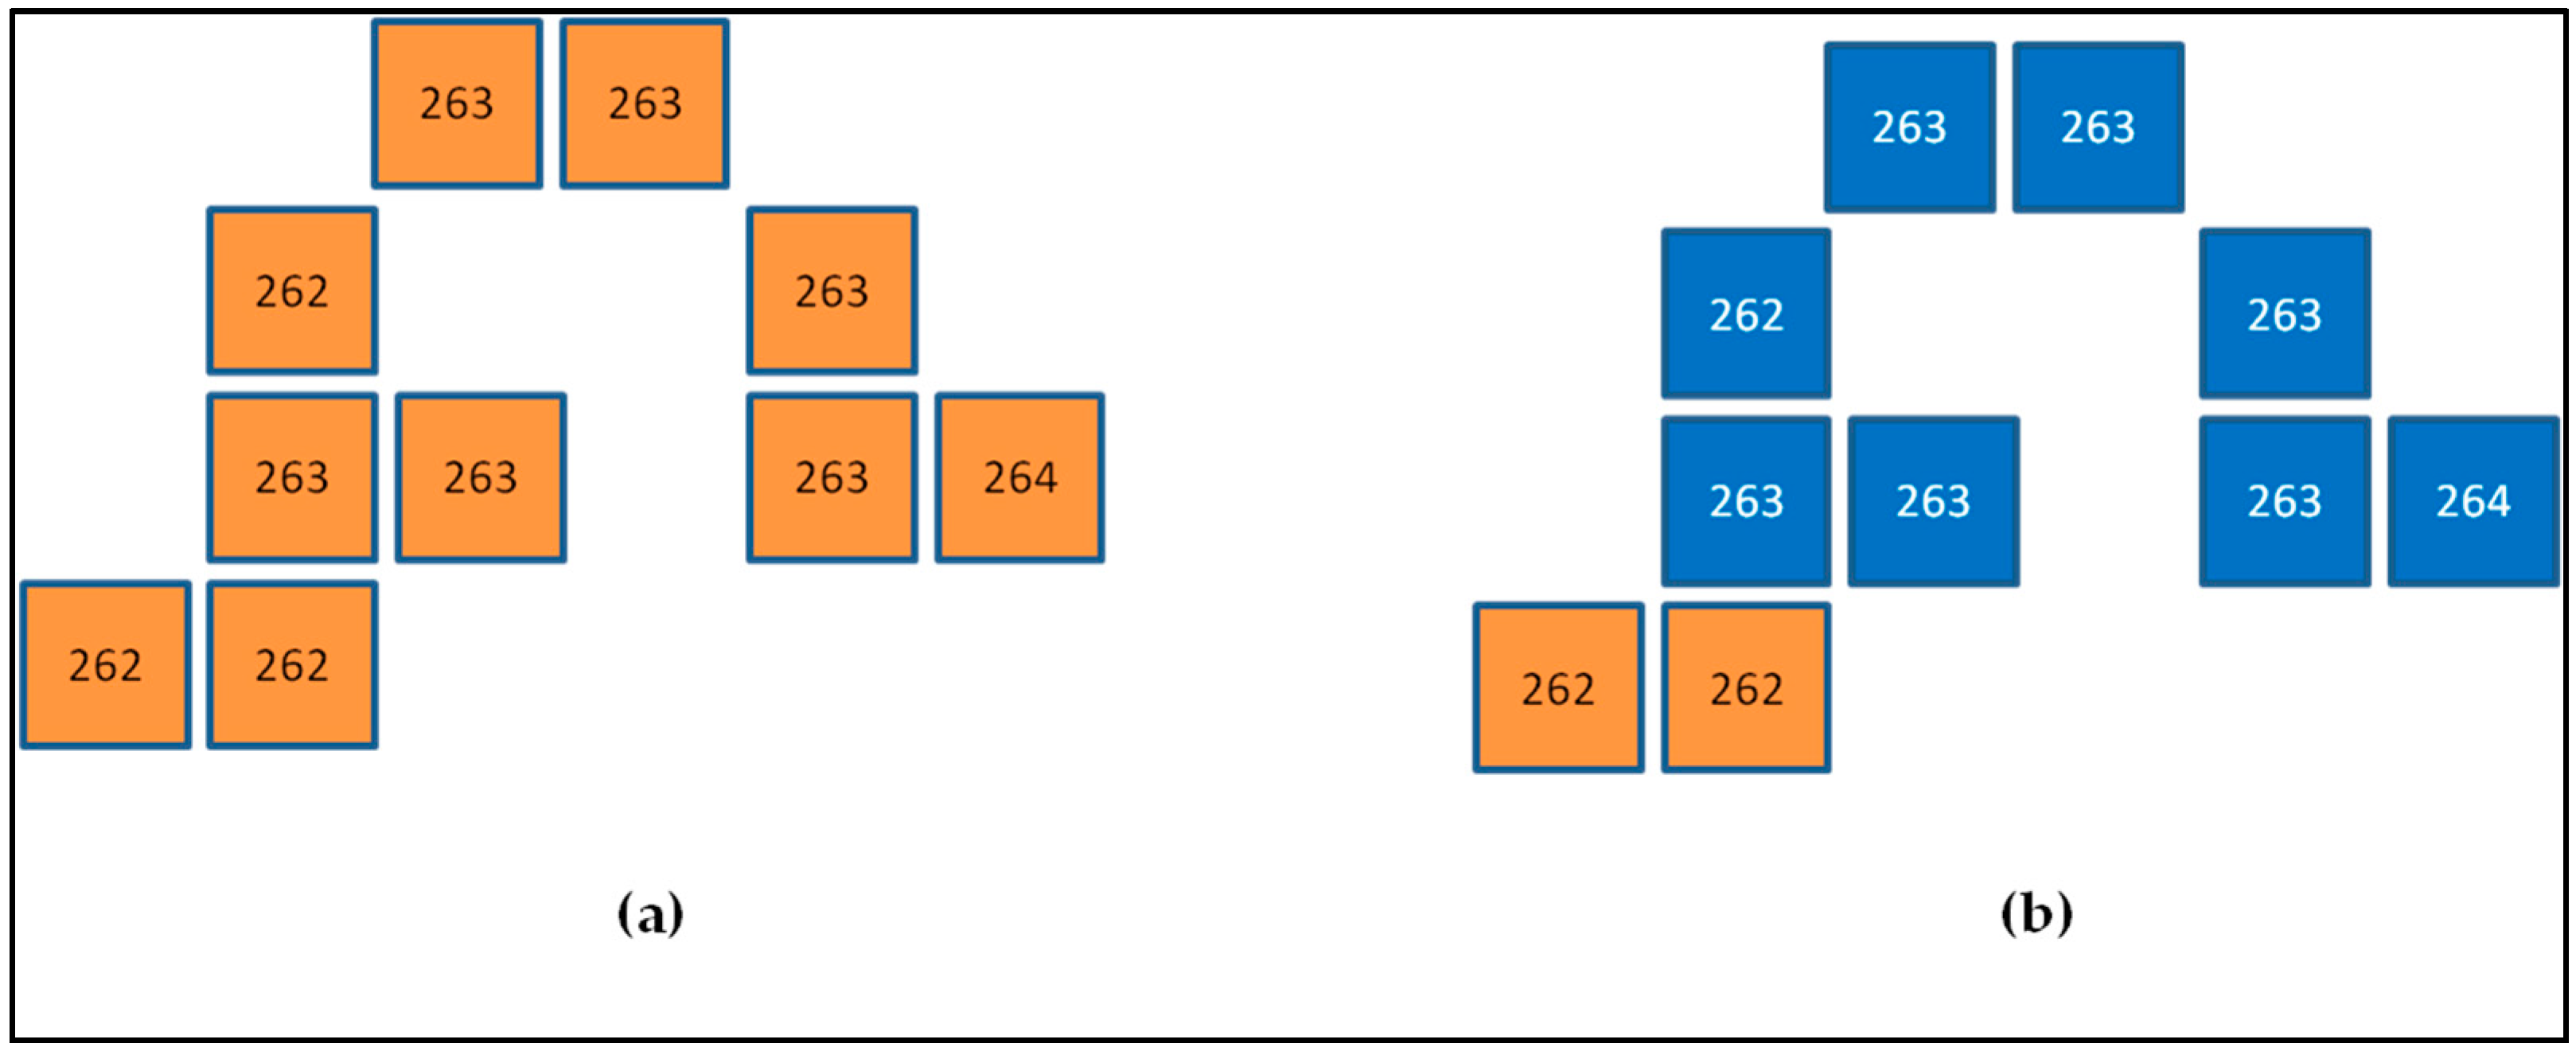
Figure 11 shows Box B of Figure 9a with two distinct decompositions into active fire clusters using a two-day time-gap, induced by different choices of the causal relation configurations (although the number of active fire clusters remains the same in both cases).

Figure 11.
Detail of box B depicted in Figure 9a exhibiting two distinct active fire clusters: (a) Choosing the causal relationship from FPB to FPA, yields the partition consisting of the union of FPA and FPB and union of FPC, FPD, and FPE and (b) Choosing the causal relationship from FPB to FPC, lead to a distinct decomposition into the two active fire clusters, the isolated FPA and the union of FPB, FPC, FPD, and FPE. Note that since the blue active fire cluster have ignition date 262, the other FPs with date of burning 262 could not be included in the same cluster because that would cause non-adjacent ignition points to occur in the same active fire cluster, contradicting a model assumption. Colored small squares are MODIS 1 km2 active fire pixels for 2003. Each similar color is allocated to one active fire cluster (orange and blue). Each number inside the boxes corresponds to the date of burning (1–365).
Thus, in spite of the fact that adjacent FPs lie within the time-gap considered, the set of FPs is broken up into active fire cluster to preserve consistent fire histories, which helps keeping the number of active fire clusters and their sizes limited, even when larger time-gap thresholds are considered.
4. Discussion
Selection of a single value of the time-gap parameter for global studies [1,7,14], not accounting for fire regimes specificities, such as the formation of a “seasonal mosaic” of fire-affected areas [11,27], and the occurrence of consecutive days of missing land surface observation due to clouds of smoke, may lead to art factual results in fire individuation and, consequently, in fire size distributions. Short time-gap values may break up fires and artificially increase the number of events in regions affected by persistent cloud cover. In regions prone to persistent cloud cover or heavy smoke, such as boreal [28] and tropical forests [29,30], the reduced satellite fire detection rates will lead to the occurrence of long time-spans with missing data which could promote excessive spatial aggregation when using higher time-gaps or split large and long duration fire events, resulting in a smaller number of large events when using smaller time-gaps. In tropical savannas, where a large fraction of the landscape burns every season as a result of many independent ignitions, individuation of fire events and the resulting fire size distributions critically depend on the time-gap parameter value. Detailed analysis of individual grid cells showed that the relatively high Gini coefficient sensitivity to the time-gap parameter observed in many tropical regions is due to very high ignition densities, which lead to extensive coalescence of neighboring (in space and time) fire events. Evidently, higher time gap parameter values will increase the extent of coalescence, reducing the number and increasing the size of active fire clusters, and yielding higher Gini coefficient values. Our results show that in regions where only a small fraction of the landscape burns in a given season, and thus coalescence of fires with distinct ignitions is minimal, active fire cluster size distributions are robust with respect to time-gap parameter values.
Fire size distributions are one of the defining attributes of fire regimes and are helpful to plan and evaluate forest fire suppression efforts [4]. They are strongly affected by human activity and reflect changes in climate and land use [15], such as an increase in fire size inequality in areas where land abandonment led to higher fuel loadings and reduced landscape fragmentation [8]. In African savannas, knowledge of fire size distributions is useful to assess the consequences of increasing anthropogenic ignitions and the effectiveness of barriers to fire spread [16], namely the ability of early dry season patch burning to prevent the occurrence of very large fires in the late dry season. Monitoring fire size distributions, to make sure a variety of fire sizes is available, was considered important to manage biodiversity at South Africa’s Kruger National Park [31]. Thus, important land resource management decisions rely on accurate information concerning the size and number of individual fire events.
The algorithm proposed in this study to individuate fire events, although tested with active fire data, is meant as an alternative to the flood-fill algorithm previously used in most studies with burned area data [1,7,15,16]. Starting from a seed (active fire), the flood-fill algorithm assigns each unclassified active fire that can be spatially connected to the seed, building a path of classified active fires, such that consecutive active fires have dates of burning differences within the time-gap considered. This time-gap restriction per se does not ensure consistency of the date of burning required to reconstruct the fire path-histories in each fire event. Our approach has been designed to overcome this limitation, by conveniently translating the individuation problem to a standard graph technique, according to a set of pre-defined causal relations. Contrary to the flood-fill approach, with our algorithm aggregation in the same event of adjacent active fire with date of burning differences within the time-gap considered, only occurs if no inconsistent fire-path histories arise. In this way, aggregation of active fires in the same fire event is often self-limited by the fire dynamics, even when adjacent FP with date of burning within the time-gap considered can be found. This situation is illustrated in Figure 12. In Figure 12a, the fire event consisting of all active fires (in orange) verifies the spatial and temporal restrictions of the flood-fill-algorithm and could be generated by it. With our algorithm, the case shown in Figure 12a would not occur, otherwise non-adjacent active fires with the same date of burning would be aggregated in the same fire event, yielding two causal relations assigned to the same FP. Thus, the algorithm necessarily decomposes the set of active fires into two distinct active fire clusters, as shown in Figure 12b (blue and orange).
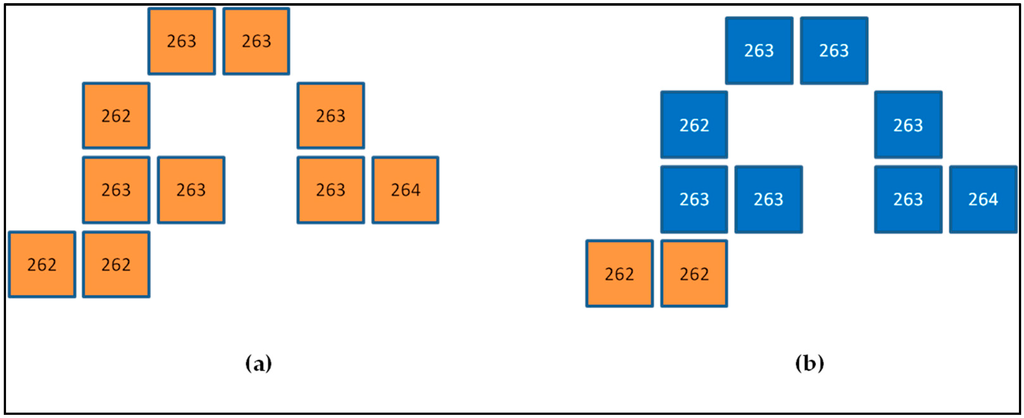
Figure 12.
Detail of the example shown in box B depicted in Figure 10a for a two-day time-gap obtained with (a) flood-fill algorithm and (b) the algorithm proposed in this study to individuate active fire clusters. Colored small squares are MODIS 1 km2 active fire pixels. Each similar color is allocated to one active fire cluster (orange and blue). Numbers in boxes are the date of burning (1–365).
We believe that the assumptions incorporated in the algorithm for individuating fire events are reasonable representations of the real process of the spatial dynamics of fire ignition and spread, as observed with thermal infrared satellite remote sensing with daily temporal resolution and 1 km spatial resolution. We chose values for the time-gap parameter matching those used in previous studies, to ensure comparability of results. Further algorithm improvements may be achievable by fine tuning the rules defining the causal relations to allow for coalescence of fire events (multiple ignition points in the same fire event), or to account for date of burning differences. It is however beyond the scope of this work to perform a thorough comparison of algorithm output values against independent observations. At this stage, evaluation of model outputs can only be performed qualitatively and at a very aggregate level, by expert evaluation of size distributions of active fire clusters generated by the algorithm. Detailed illustrations of algorithm performance are meant to expose its internal logic and the consequences of its underlying assumptions, not to establish its external validity.
Application of the algorithm using burned area data as input data is straightforward and will likely yield more robust results due to the fact that burned area data is more spatially aggregated. However, the running time of the algorithm will increase since the number of pixels to be processed is substantially higher. Nonetheless, since the most demanding parts of the algorithm are the determination of FPs (step I) and the decomposition into active fire clusters (step IV), both relying on standard graph algorithms with linear time complexity with the input size (number of vertices plus number of adjacencies), the expected increase in running time will be roughly linear with this input.
5. Conclusions
Given the different types of fire regimes that occur across different biomes, and the limitations of current Earth observation satellites in terms of spatial and temporal resolution, results of algorithms purporting to individuate fire events must be considered with great care, acknowledging the extent to which they may produce artefactual results. We performed a global study, using a novel algorithm, to assess the effect of different time-gap parameter values for individuating fire events, as well as to evaluate their impact on the size distribution and spatial patterns of active fire clusters. Fire size distributions show little sensitivity to the time-gap parameter in cropland areas, where individual fire events tend to be small and annual percent burned area is not very large. African savannas are particularly sensitive to the time-gap parameter due to the large number of fires and extensive area burned, which yield a complex spatio-temporal fire mosaic and abundant coalescence of fire fronts with distinct origins. In boreal and tropical forest regions (e.g., Siberia or South-East Asia), due to persistent cloud cover that may prevent observation of the land surface for a few consecutive days, setting a short time-gap may split large, long duration fire events. The next step in the algorithm development ought to be the elimination of a fixed, global time-gap parameter, and replacing it with an active fire aggregation stopping rule representing a compromise between fire event size and date of burning homogeneity, operating at the level of the individual fire event. Such an improvement will automate contextualization of the time-gap parameter choice, and will allow the validation of resulting fire size distributions against actual fire atlas data.
Acknowledgments
This study was funded by a doctoral grant SFRH/BD/47452/2008 (DO) and Centro de Estudos Florestais project PEst-OE/AGR/UI0239/2014 (PS, JMCP) from the Foundation for Science and Technology, Ministry for Science and Technology, Portugal.
Author Contributions
D.O., J.M.C.P, I.B., and P.S. conceived and designed the study; P.S, D.O developed the code algorithm; D.O., P.S., and J.M.C.P. analyzed the data; D.O., P.S., and J.M.C.P wrote the paper. All the authors reviewed the manuscript.
Conflicts of Interest
The authors declare no conflict of interest.
Abbreviations
The following abbreviations are used in this manuscript:
| MODIS | Moderate Resolution Imaging Spectroradiometer |
| FSD | Fire size distributions |
| FP | Fire Patch Unit |
References and Note
- Archibald, S.; Lehmann, C.E.; Gómez-Dans, J.L.; Bradstock, R.A. Defining pyromes and global syndromes of fire regimes. Proc. Natl. Acad. Sci. USA 2013, 110, 6442–6447. [Google Scholar] [PubMed]
- Kasischke, E.S.; Turetsky, M.R. Recent changes in the fire regime across the North American boreal regional: Spatial and temporal patterns of burning across Canada and Alaska. Geophys. Res. Lett. 2006, 33. [Google Scholar]
- Van Wagtendonk, J.; Lutz, J. Fire regime attributes of wildland fires in Yosemite National Park, USA. Fire Ecol. 2007, 3, 34–52. [Google Scholar] [CrossRef]
- Cui, W.; Perera, A.H. What do we know about forest fire size distribution, and why is this knowledge useful for forest management? Int. J. Wildland Fire 2008, 17, 234–244. [Google Scholar] [CrossRef]
- Haire, S.L.; McGarigal, K.; Miller, C. Wilderness shapes contemporary fire size distributions across landscapes of the Western United States. Ecosphere 2013, 4, 1–20. [Google Scholar] [CrossRef]
- Barclay, H.J.; Li, C.; Hawkes, B.; Benson, L. Effects of fire size and frequency and habitat heterogeneity on forest age distribution. Ecol. Model. 2006, 197, 207–220. [Google Scholar] [CrossRef]
- Hantson, S.; Pueyo, S.; Chuvieco, E. Global fire size distribution is driven by human impact and climate. Glob. Ecol. Biogeogr. 2014, 24, 77–86. [Google Scholar] [CrossRef]
- Pausas, J.G.; Fernández-Muñoz, S. Fire regime changes in the western Mediterranean basin: From fuel-limited to drought-driven fire regime. Clim. Chang. 2012, 110, 215–226. [Google Scholar] [CrossRef]
- Justice, C.; Giglio, L.; Korontzi, S.; Owens, J.; Morisette, J.; Roy, D.; Descloitres, J.; Alleaume, S.; Petitcolin, F.; Kaufman, Y. The modis fire products. Remote Sens. Environ. 2002, 83, 244–262. [Google Scholar] [CrossRef]
- Arino, O.; Rosaz, J. 1997 and 1998 world ATSR fire ATLAS using ERS-2 ATSR-2 data. In Proceedings of the Joint Fire Science Conference and Workshop, Boise, ID, USA, 15–17 June 1999; pp. 177–182.
- Laris, P. Burning the seasonal mosaic: Preventative burning strategies in the wooded savanna of Southern Mali. Hum. Ecol. 2002, 30, 155–186. [Google Scholar] [CrossRef]
- Loboda, T.; Csiszar, I. Reconstruction of fire spread within wildland fire events in Northern Eurasia from the MODIS active fire product. Glob. Planet. Chang. 2007, 56, 258–273. [Google Scholar] [CrossRef]
- Ichoku, C.; Kaufman, Y.; Giglio, L.; Li, Z.; Fraser, R.; Jin, J.-Z.; Park, W. Comparative analysis of daytime fire detection algorithms using AVHRR data for the 1995 fire season in Canada: Perspective for MODIS. Int. J. Remote Sens. 2003, 24, 1669–1690. [Google Scholar] [CrossRef]
- Archibald, S.; Scholes, R.; Roy, D.; Roberts, G.; Boschetti, L. Southern African fire regimes as revealed by remote sensing. Int. J. Wildland Fire 2010, 19, 861–878. [Google Scholar]
- Hantson, S.; Lasslop, G.; Kloster, S.; Chuvieco, E. Anthropogenic effects on global mean fire size. Int. J. Wildland Fire 2015, 24, 589–596. [Google Scholar] [CrossRef]
- Archibald, S.; Roy, D. Identifying individual fires from satellite-derived burned area data. In Proceedings of the 2009 IEEE International Geoscience and Remote Sensing Symposium, Cape Town, South Africa, 12–17 July 2009; pp. 160–163.
- Ellis, E.C.; Klein Goldewijk, K.; Siebert, S.; Lightman, D.; Ramankutty, N. Anthropogenic transformation of the biomes, 1700 to 2000. Glob. Ecol. Biogeogr. 2010, 19, 589–606. [Google Scholar] [CrossRef]
- Olson, D.M.; Dinerstein, E.; Wikramanayake, E.D.; Burgess, N.D.; Powell, G.V.; Underwood, E.C.; D’amico, J.A.; Itoua, I.; Strand, H.E.; Morrison, J.C. Terrestrial ecoregions of the world: A new map of life on earth a new global map of terrestrial ecoregions provides an innovative tool for conserving biodiversity. BioScience 2001, 51, 933–938. [Google Scholar] [CrossRef]
- Giglio, L.; Descloitres, J.; Justice, C.O.; Kaufman, Y.J. An enhanced contextual fire detection algorithm for MODIS. Remote Sens. Environ. 2003, 87, 273–282. [Google Scholar] [CrossRef]
- Oom, D.; Pereira, J. Exploratory spatial data analysis of global MODIS active fire data. Int. J. Appl. Earth Obs. Geoinf. 2013, 21, 326–340. [Google Scholar] [CrossRef]
- Tarjan, R. Depth-first search and linear graph algorithms. SIAM J. Comput. 1972, 1, 146–160. [Google Scholar] [CrossRef]
- Gini, C.W. Variability and mutability, contribution to the study of statistical distribution and relations. Studi Economico-Giuricici della R. Universita de Cagliari, 1912. [Google Scholar] Reviewed in Light, R.J.; Margolin, B.H. An analysis of variance for categorical data. J. Amer. Stat. Assoc. 1971, 66, 534–544. [Google Scholar]
- Sharma, A.R.; Kharol, S.K.; Badarinath, K.; Singh, D. Impact of agriculture crop residue burning on atmospheric aerosol loading—A study over Punjab state, India. Ann. Geophys. 2010, 28, 367–379. [Google Scholar] [CrossRef]
- Tarimo, B.; Dick, Ã.Y.B.; Gobakken, T.; Totland, Ã.R. Spatial distribution of temporal dynamics in anthropogenic fires in miombo savanna woodlands of Tanzania. Carbon Balance Manag. 2015, 10, 1–15. [Google Scholar]
- Archibald, S.; Staver, A.C.; Levin, S.A. Evolution of human-driven fire regimes in Africa. Proc. Natl. Acad. Sci. USA 2012, 109, 847–852. [Google Scholar] [CrossRef] [PubMed]
- Lee, K.H.; Kim, J.E.; Kim, Y.J.; Kim, J.; Von Hoyningen-Huene, W. Impact of the smoke aerosol from Russian forest fires on the atmospheric environment over Korea during May 2003. Atmos. Environ. 2005, 39, 85–99. [Google Scholar] [CrossRef]
- Laris, P.S. Spatiotemporal problems with detecting and mapping mosaic fire regimes with coarse-resolution satellite data in savanna environments. Remote Sens. Environ. 2005, 99, 412–424. [Google Scholar] [CrossRef]
- Csiszar, I.A.; Morisette, J.T.; Giglio, L. Validation of active fire detection from moderate-resolution satellite sensors: The MODIS example in northern eurasia. IEEE Trans. Geosci. Remote Sens. 2006, 44, 1757–1764. [Google Scholar] [CrossRef]
- Roy, D.P.; Boschetti, L.; Justice, C.O.; Ju, J. The collection 5 MODIS burned area product—Global evaluation by comparison with the MODIS active fire product. Remote Sens. Environ. 2008, 112, 3690–3707. [Google Scholar] [CrossRef]
- Boschetti, L.; Roy, D.P.; Justice, C.O.; Giglio, L. Global assessment of the temporal reporting accuracy and precision of the MODIS burned area product. Int. J. Wildland Fire 2010, 19, 705–709. [Google Scholar] [CrossRef]
- Van Wilgen, B.W.; Govender, N.; MacFadyen, S. An assessment of the implementation and outcomes of recent changes to fire management in the Kruger National Park. Koedoe 2008, 50, 22–31. [Google Scholar] [CrossRef]
© 2016 by the authors; licensee MDPI, Basel, Switzerland. This article is an open access article distributed under the terms and conditions of the Creative Commons Attribution (CC-BY) license (http://creativecommons.org/licenses/by/4.0/).

