1. Introduction
Earthly phenomena are widely captured through satellite imagery and global scale data are available in large scale big data repositories such as the Google Earth engine or the Amazon Cloud. More specifically, with an increased focus on land use and land cover monitoring of different areas in the world, it becomes essential for researchers and policy-makers, to access and understand the vast amount of data we have. One of the major challenges for users is to have an in-depth knowledge of the data they are working with. This is especially true for users who may not be experts in the domain of remote sensing or working with classified land cover data. For example, non-expert users may depend on remotely-sensed data for use in policy-support and decision-making. Thus, it is also crucial to know the “fitness for use” of the datasets to be used, for instance, for urban planning, monitoring deforestation, observing climate cycles, or supporting the conception of policies for governmental agencies.
One of the most effective ways to test how suitable a particular dataset is for a certain purpose is to involve users in the process of this evaluation [
1]. It is essential for users to be able to understand the suitability of the data they are seeking. When it comes to using remote sensing data, various factors, such as the spatial, temporal, and spectral resolutions are important to note, especially if we need to understand and process the finished results accurately. Thus, through a user study we can assess the “expertise” of the users and their level of knowledge, as well [
1,
2]. Engaging users not only provides us with an understanding of the users’ behaviour, but also helps to evaluate the quality of the datasets that are available. Thus, we obtain a comprehensive overview of understanding data-user interaction. Providing accurate statistics of a thematic map assists users in selecting a dataset for an appropriate application. This is especially important for cases where thematic maps are used for policy-based planning and decision-making.
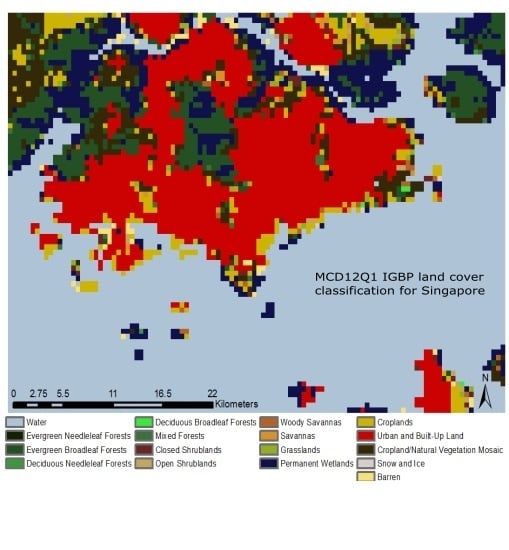
In our case, we want to explore the quality of the land classification scheme provided by the Moderate Resolution Imaging Spectrometer (MODIS) MCD12Q1-1. This product classifies the globe into different land cover types and we want to evaluate how well it captures land use and land cover for areas the size of our study area, Singapore and, by extension, smaller areas, in general. It is known to work well for vast forested areas such as the Brazilian Amazon [
3,
4], however, it is less clear whether global classification schemes, such as the International Geosphere Biosphere Programme (IGBP) [
5] or the Land Cover Classification Scheme (LCCS) [
6], can be effectively used for monitoring the urban dynamics of a country like Singapore. We were motivated by the challenge of the representation of smaller land masses in existing global classified datasets. The main question that arises is how well or how poorly these areas are represented. Global land cover datasets are useful for smaller countries as they provide an important overview of their landscape, especially in relation to the rest of the local region, continent, and the globe. In the case of Singapore, we were faced with a lack of open data, whereby users did, to a certain extent, depend on existing open datasets, such as MODIS and Landsat to assess the transforming physical environment of the island and urban planning.
It is important to treat the IGBP land cover definitions and the spatial information of the MCD12Q1-1 as two components that, together, constitute the classified dataset. The user study explicitly focuses on the ambiguity of the IGBP land class definitions for different land classes contained in the MCD12Q1-1. In addition to the user study, which focuses on the qualitative evaluation of the IGBP land class definitions, we also carried out a validation of the MCD12Q1-1 dataset using ground truth imagery. The accuracy assessment validates the spatial accuracy of any remote sensing product containing thematic information. The user study and the accuracy assessment were carried out independent to one another, yet they complement each other by providing a comprehensive overview of the MCD12Q1-1, in terms of the land class information it contains and the locational accuracy of the pixels.
The goal of this research is to engage users in an exercise with the aim of classifying Singapore into the existing classes of the MCD12Q1 IGBP land cover classification [
7]. This is done with the goal of making users understand the existing definitions of certain land cover classification systems, as well as giving us an idea of how clear, concise, and accurately Singapore is classified by the IGBP land classification scheme. The survey also provided an opportunity to evaluate the level of detail offered in the MCD12Q1-1 product, in terms of the definitions provided and how they specifically fit within the landscape of Singapore, which is one of the most urbanised countries in the world. The validation of the MCD12Q1-1 provides a quantification of the degree of agreement between the remotely-sensed data and ground reality. The statistics from the outcome of the validation can also be utilised by users to gauge the suitability of the MCD12Q-1 to map the land cover of Singapore.
2. Materials and Methods
2.1. Datasets and Study Area
The dataset we are using and evaluating is a MODIS-MCD12Q1 global land cover product. The product contains five different land classification systems, however, our research focuses on the IGBP system (MCD12Q1-1) [
5,
7,
8], which divides the land cover of the Earth into 17 land classes (
Table 1 and
Figure S1).
The spatial resolution of the dataset is 500 m. The product is derived from imagery from both MODIS Aqua and Terra satellites. There is a new dataset compiled at the end of each calendar year. Our work uses the classification generated on 31 December 2008. Singapore was covered by clouds for long periods and the year 2008 is a time where we could acquire relatively clear images through most of the year.
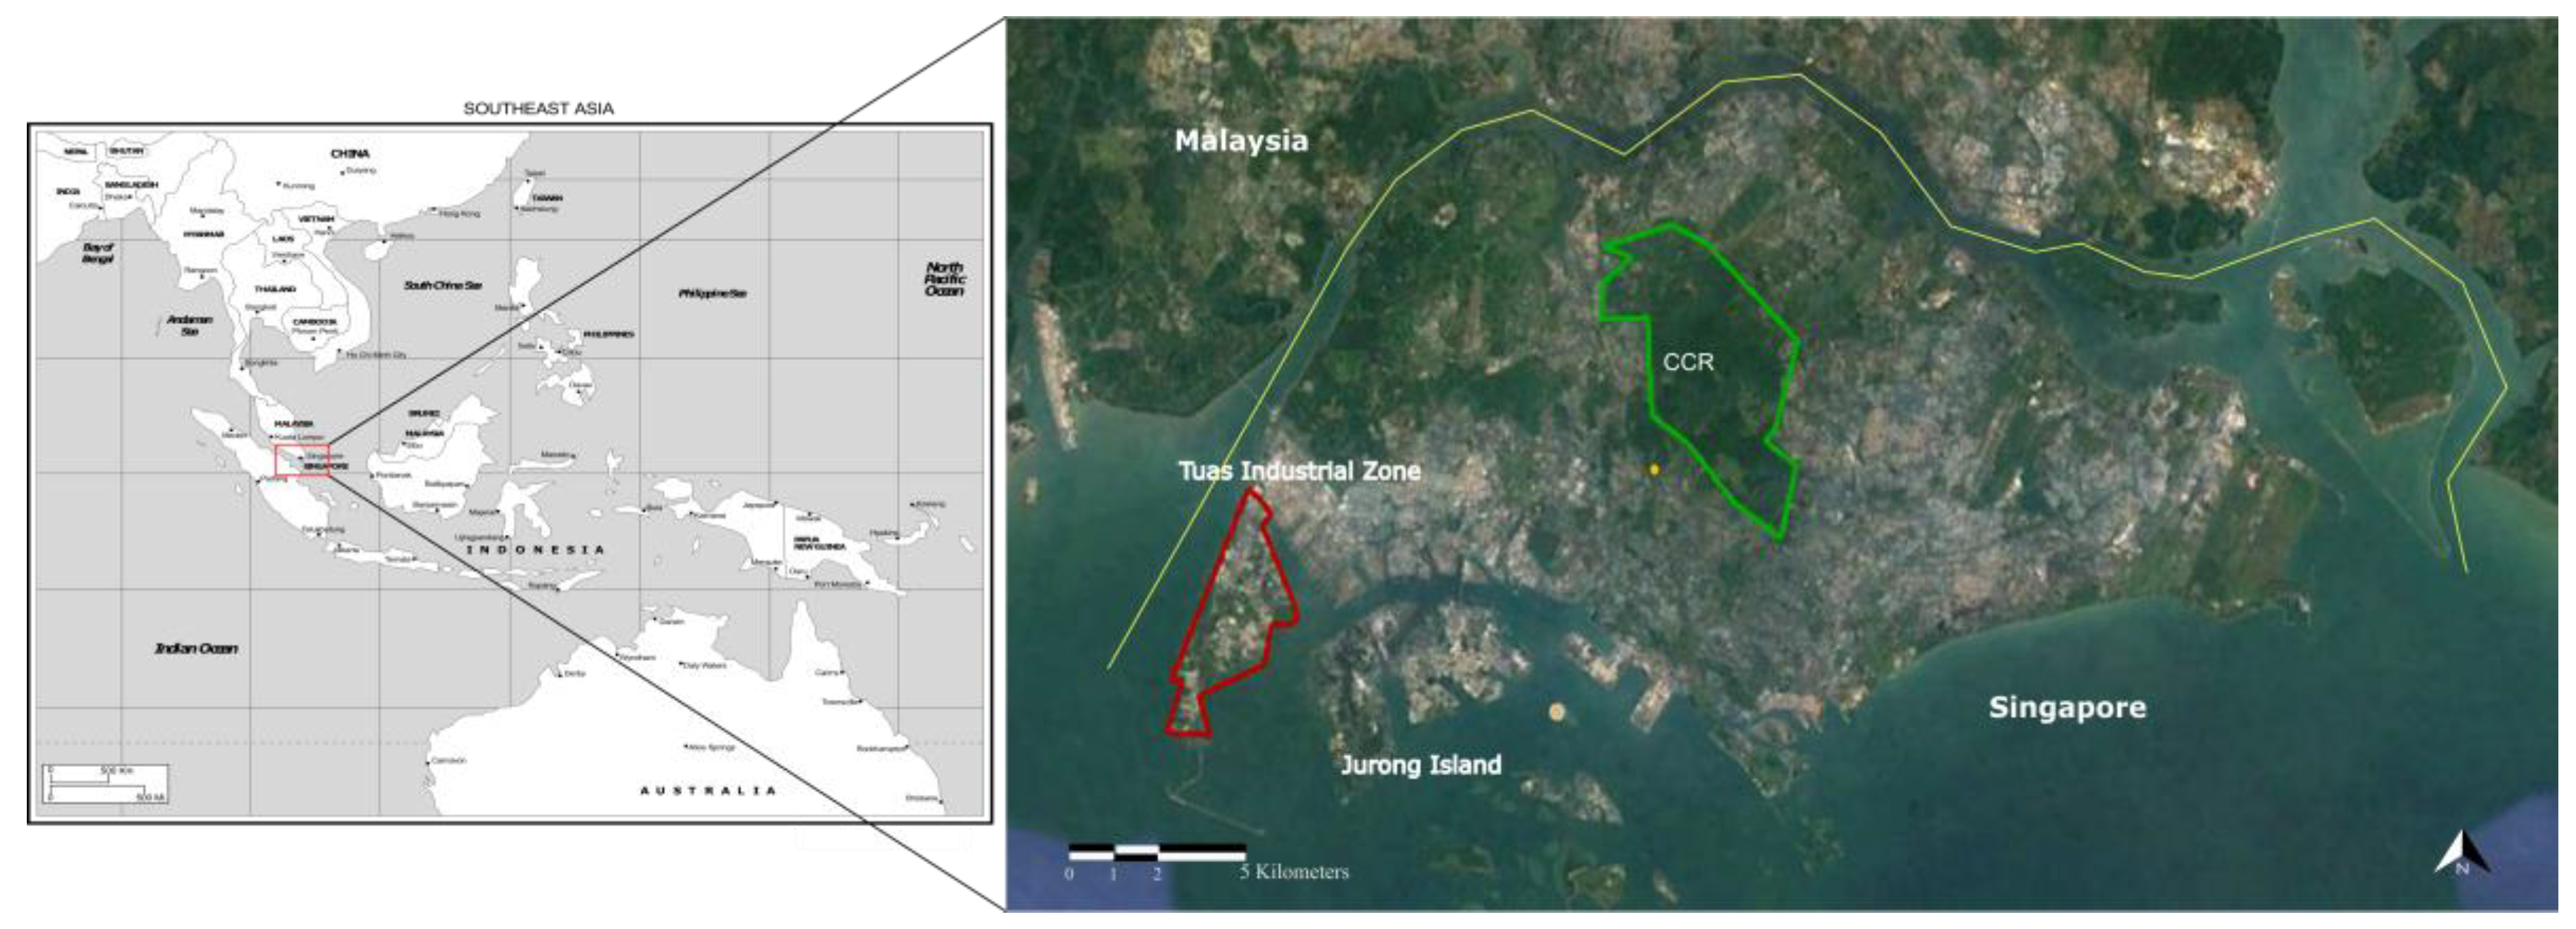
The study area for our research is Singapore (
Figure 1). The main motivation behind selecting Singapore as a study area is to find out how well an area the size of Singapore can be represented by a global remote sensing dataset. This also highlights the question of how we derive finer details from existing land cover definitions to improve upon the limitations that most land cover classification systems face. As seen from
Figure 1, Singapore has a highly urbanized landscape, which is interspersed with protected areas consisting of primary forests and wetlands (CCR and Bukit Timah), as well as urban green spaces. Land cover analysis is, moreover, inherently uncertain in Singapore due to its constantly changing physical boundaries. Land reclamation is indeed a common practice in the city-state [
9,
10].
2.2. Usability Studies
In order to ethically carry out the user study and interviews in Singapore we were required to obtain clearance from the National University of Singapore Institutional Review Board (NUS-IRB). The approval date for the same is 11 April 2016, with approval code NUS-2935.
To collect the responses for our user survey, we used the open source platform Limesurvey [
11]. Upon the creation of each survey, a unique user link is made available to the users which, in our case, can be found in [
11]. Through the user link they could gain access to the survey. The link was circulated amongst potential survey-takers at the National University of Singapore, Singapore Land Authority, Urban Redevelopment Authority and Centre for Remote Imaging Sensing and Processing, Singapore, via email. The link was kept live for a period of two months, during which time users could openly access the survey link. The questionnaire was kept anonymous as the name of the users was not relevant to the work, however, we did ask for the organizations they are affiliated with as that provides an idea of their extent of experience with land cover information. We received 33 complete responses out of 89 attempts. The survey questions consisted of Google Earth(2016) (Google Inc., Mountain View, CA, USA) images of subsections of Singapore with each image containing different landscapes. Each image has a spatial extent of 300–500 m. Some images consisted of a single land cover while others contained a mix of different cover types. Each image further varied in terms of brightness zoom level and angle in order to ensure randomisation and the receipt of meaningful responses. The questions were in the form of multiple choice, with eight answer options. The answer options provided were the land cover labels from the MODIS IGBP land cover classification (
Table 1), more specifically, the land classes that occur in Singapore according to the MCD12Q1-1 dataset. By providing maximum information to a user, we reduce the scope for biased responses.
At the end of the survey we also included an open ended question about how participants might use a global land cover dataset similar to MCD12Q1-1, which provides us with insight into what the survey-takers and users of remote-sensing data living and working with Singapore-specific data think about a global-level classification of the country.
Interviews
In order to support this survey, we also conducted personal interviews with four experts from organizations who work with remotely-sensed data for Singapore. They were affiliated to the National University of Singapore (NUS), Urban Redevelopment Authority (URA), National Parks (NP), and the Centre for Remote Imaging Sensing and Processing, Singapore. The interviews were informally structured, but highly focused. The questions were slightly varied to adapt to the background and experience of each interviewee. The questions asked are as follows:
What is your affiliation and the field of work you are in?
In your research or professional life, have you ever worked with remote sensing data?
What kind of remote sensing datasets have you worked with most frequently?
Have you ever worked with global land cover classification schemes such as MCD12Q1-1 or GlobCover (2009)?
Looking at this MCD12Q1-1 image, what is your opinion on what Singapore looks like according to this dataset?
In your opinion, how recent and up-to-date do these classifications seem?
How often do you think this data needs to be upgraded?
How would you use such an image?
What are the specific challenges of using remote sensing data for Singapore?
The interviewees did not participate in the user survey.
2.3. Labelling and Classification Scheme
The URA is one of the main governmental agencies that develop the land use plans for the island. The URA provides an updated land use plan for the country every 10–15 years. These plans are openly accessible at the URA website [
12]. Some of the classes as listed in these master plans were residential, commercial, business parks and transportation sites and the interpretation of these different classes can be found in [
13].
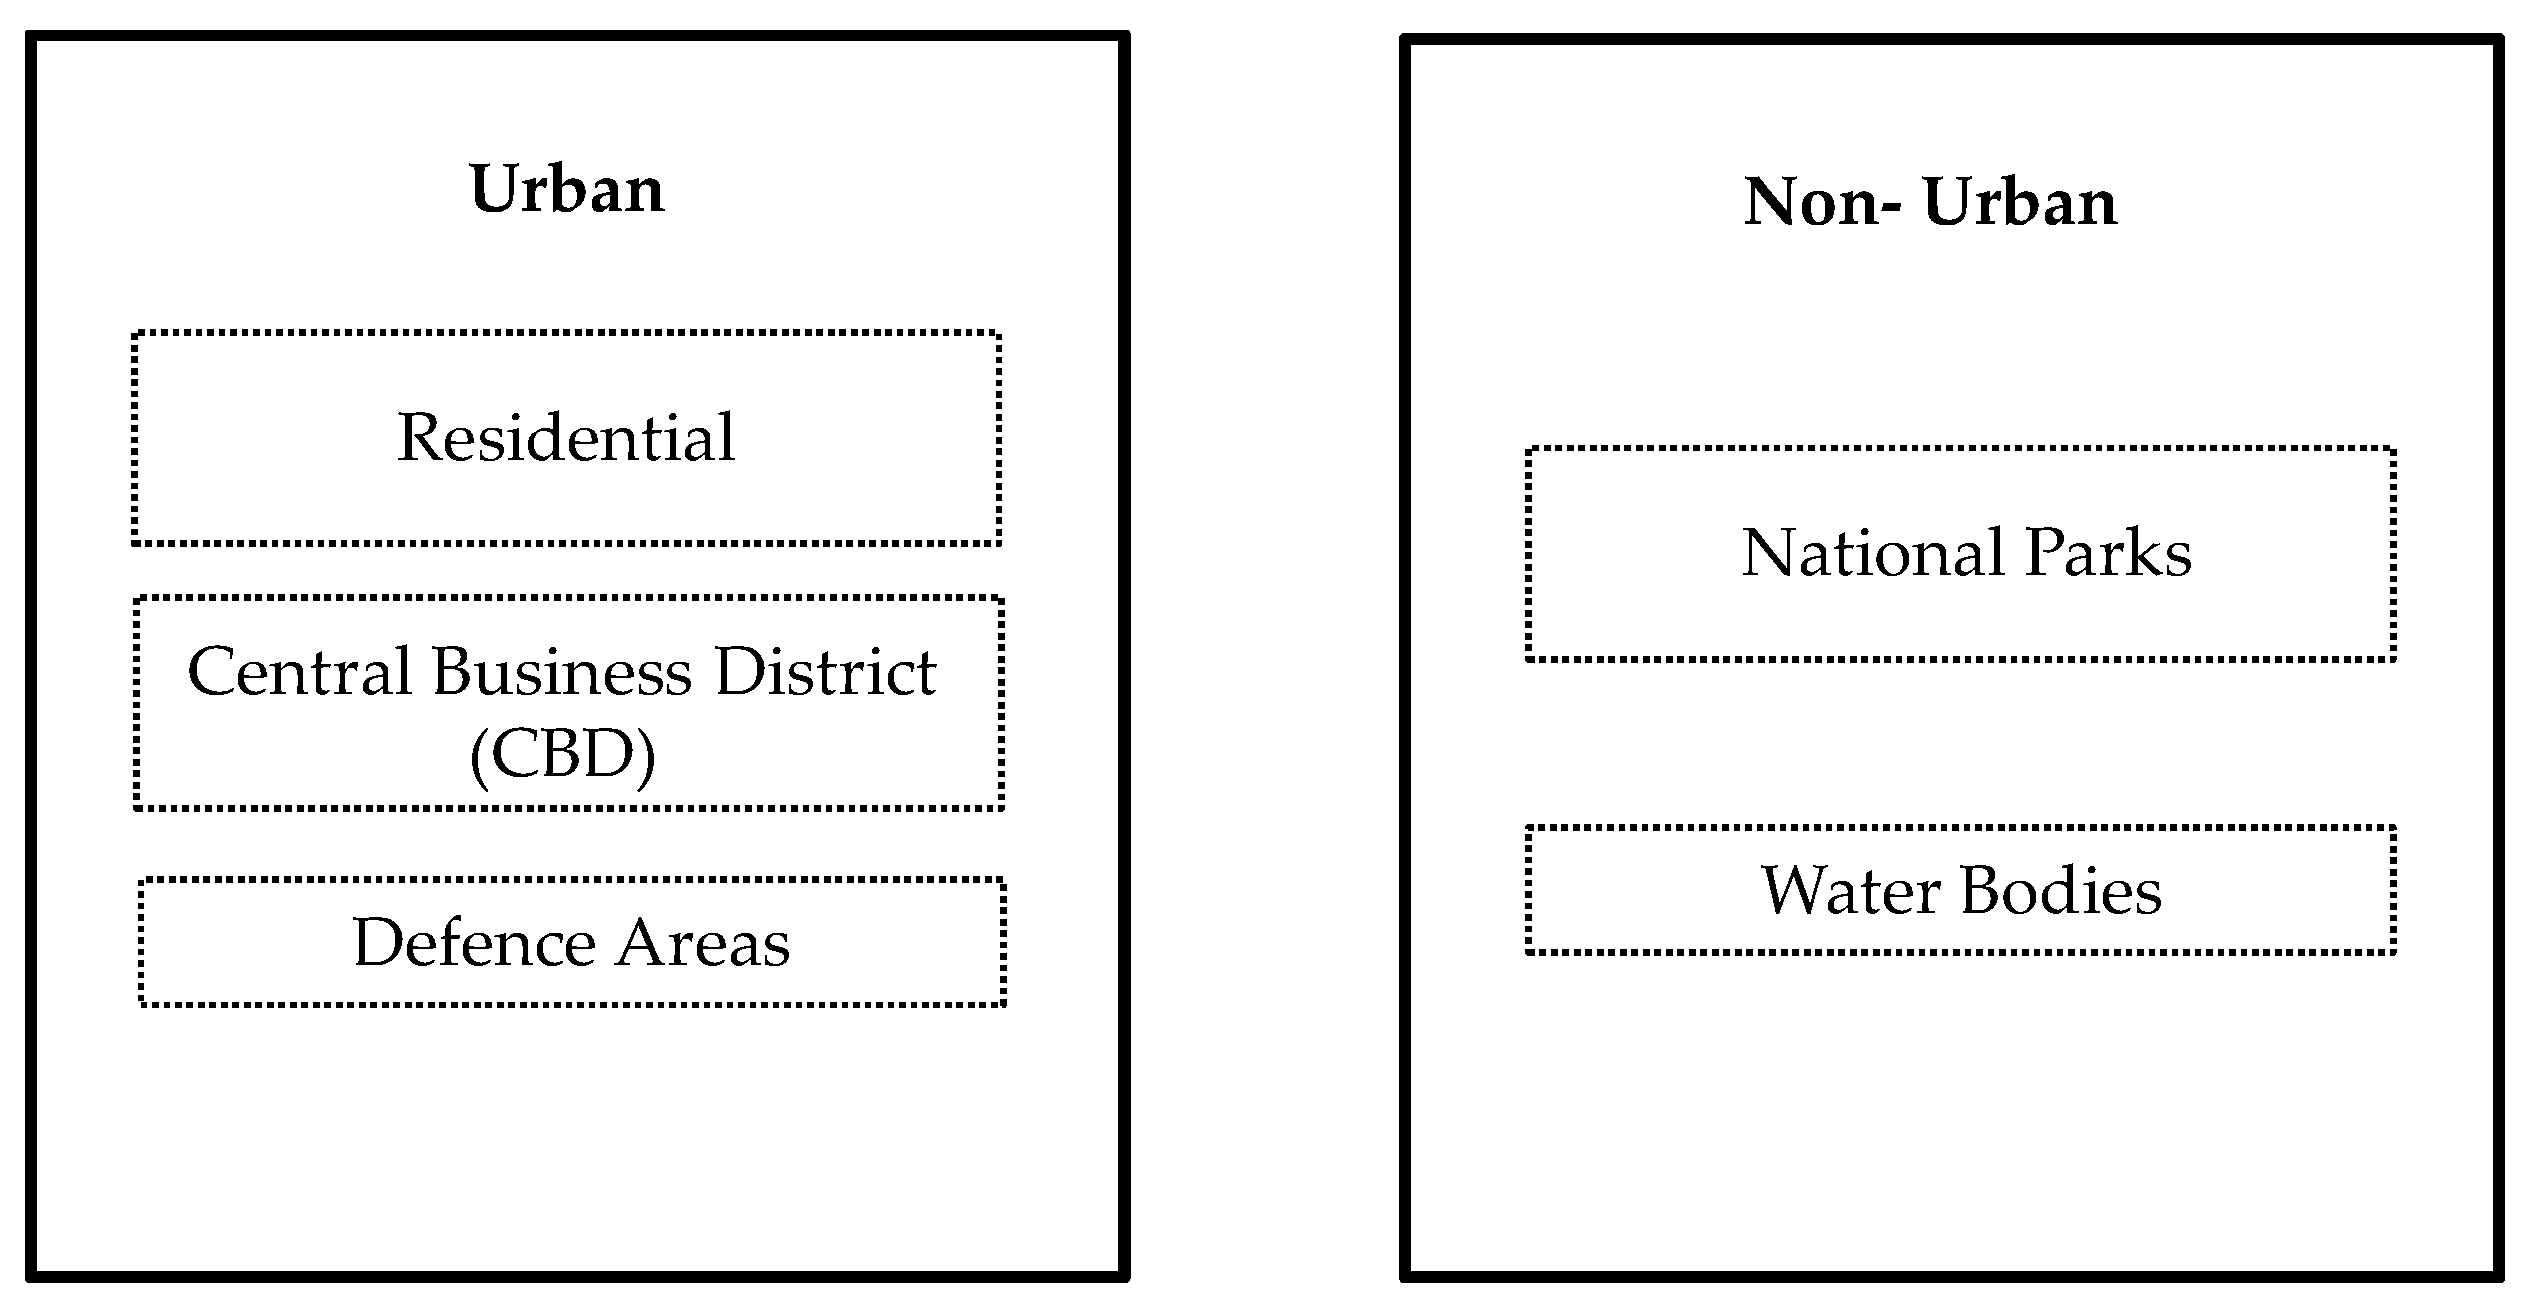
In addition to the user study validation, we propose a hierarchical labelling structure that divides Singapore into land classes that are derived from the URA plan and may be integrated into the MCD12Q1-1.
Owing to the highly urbanized landscape of Singapore, we commenced with two broad categories, namely “Urban” and “Non-Urban”. We further divide “Urban” into residential, Central Business District (CBD), and defence areas (e.g., military zones). The “Non-Urban” category contains national parks (primary forests and wetlands) and water bodies (
Figure 2).
2.4. Accuracy Assessment of the MCD12Q1-1 for Singapore Using Ground Truth Imagery
An accuracy assessment may be defined as the process of testing the degree of agreement between a classified map and ground truth. With the availability of numerous global land cover classifications, such as the MCD12Q1-1 [
5], GlobCover (2009) [
14], and GLC2000 [
15], and validation efforts have been undertaken to evaluate their thematic accuracy at global and regional levels. These studies address existing challenges in land use and land cover mapping, such as inconsistencies in land class definitions, comparison of legend information from different classification schemes, and the errors arising due to the different methods employed for data collection and compilation of remotely-sensed datasets.
Ground truth data used within accuracy assessments may be in the form of field data or high-resolution satellite imagery.
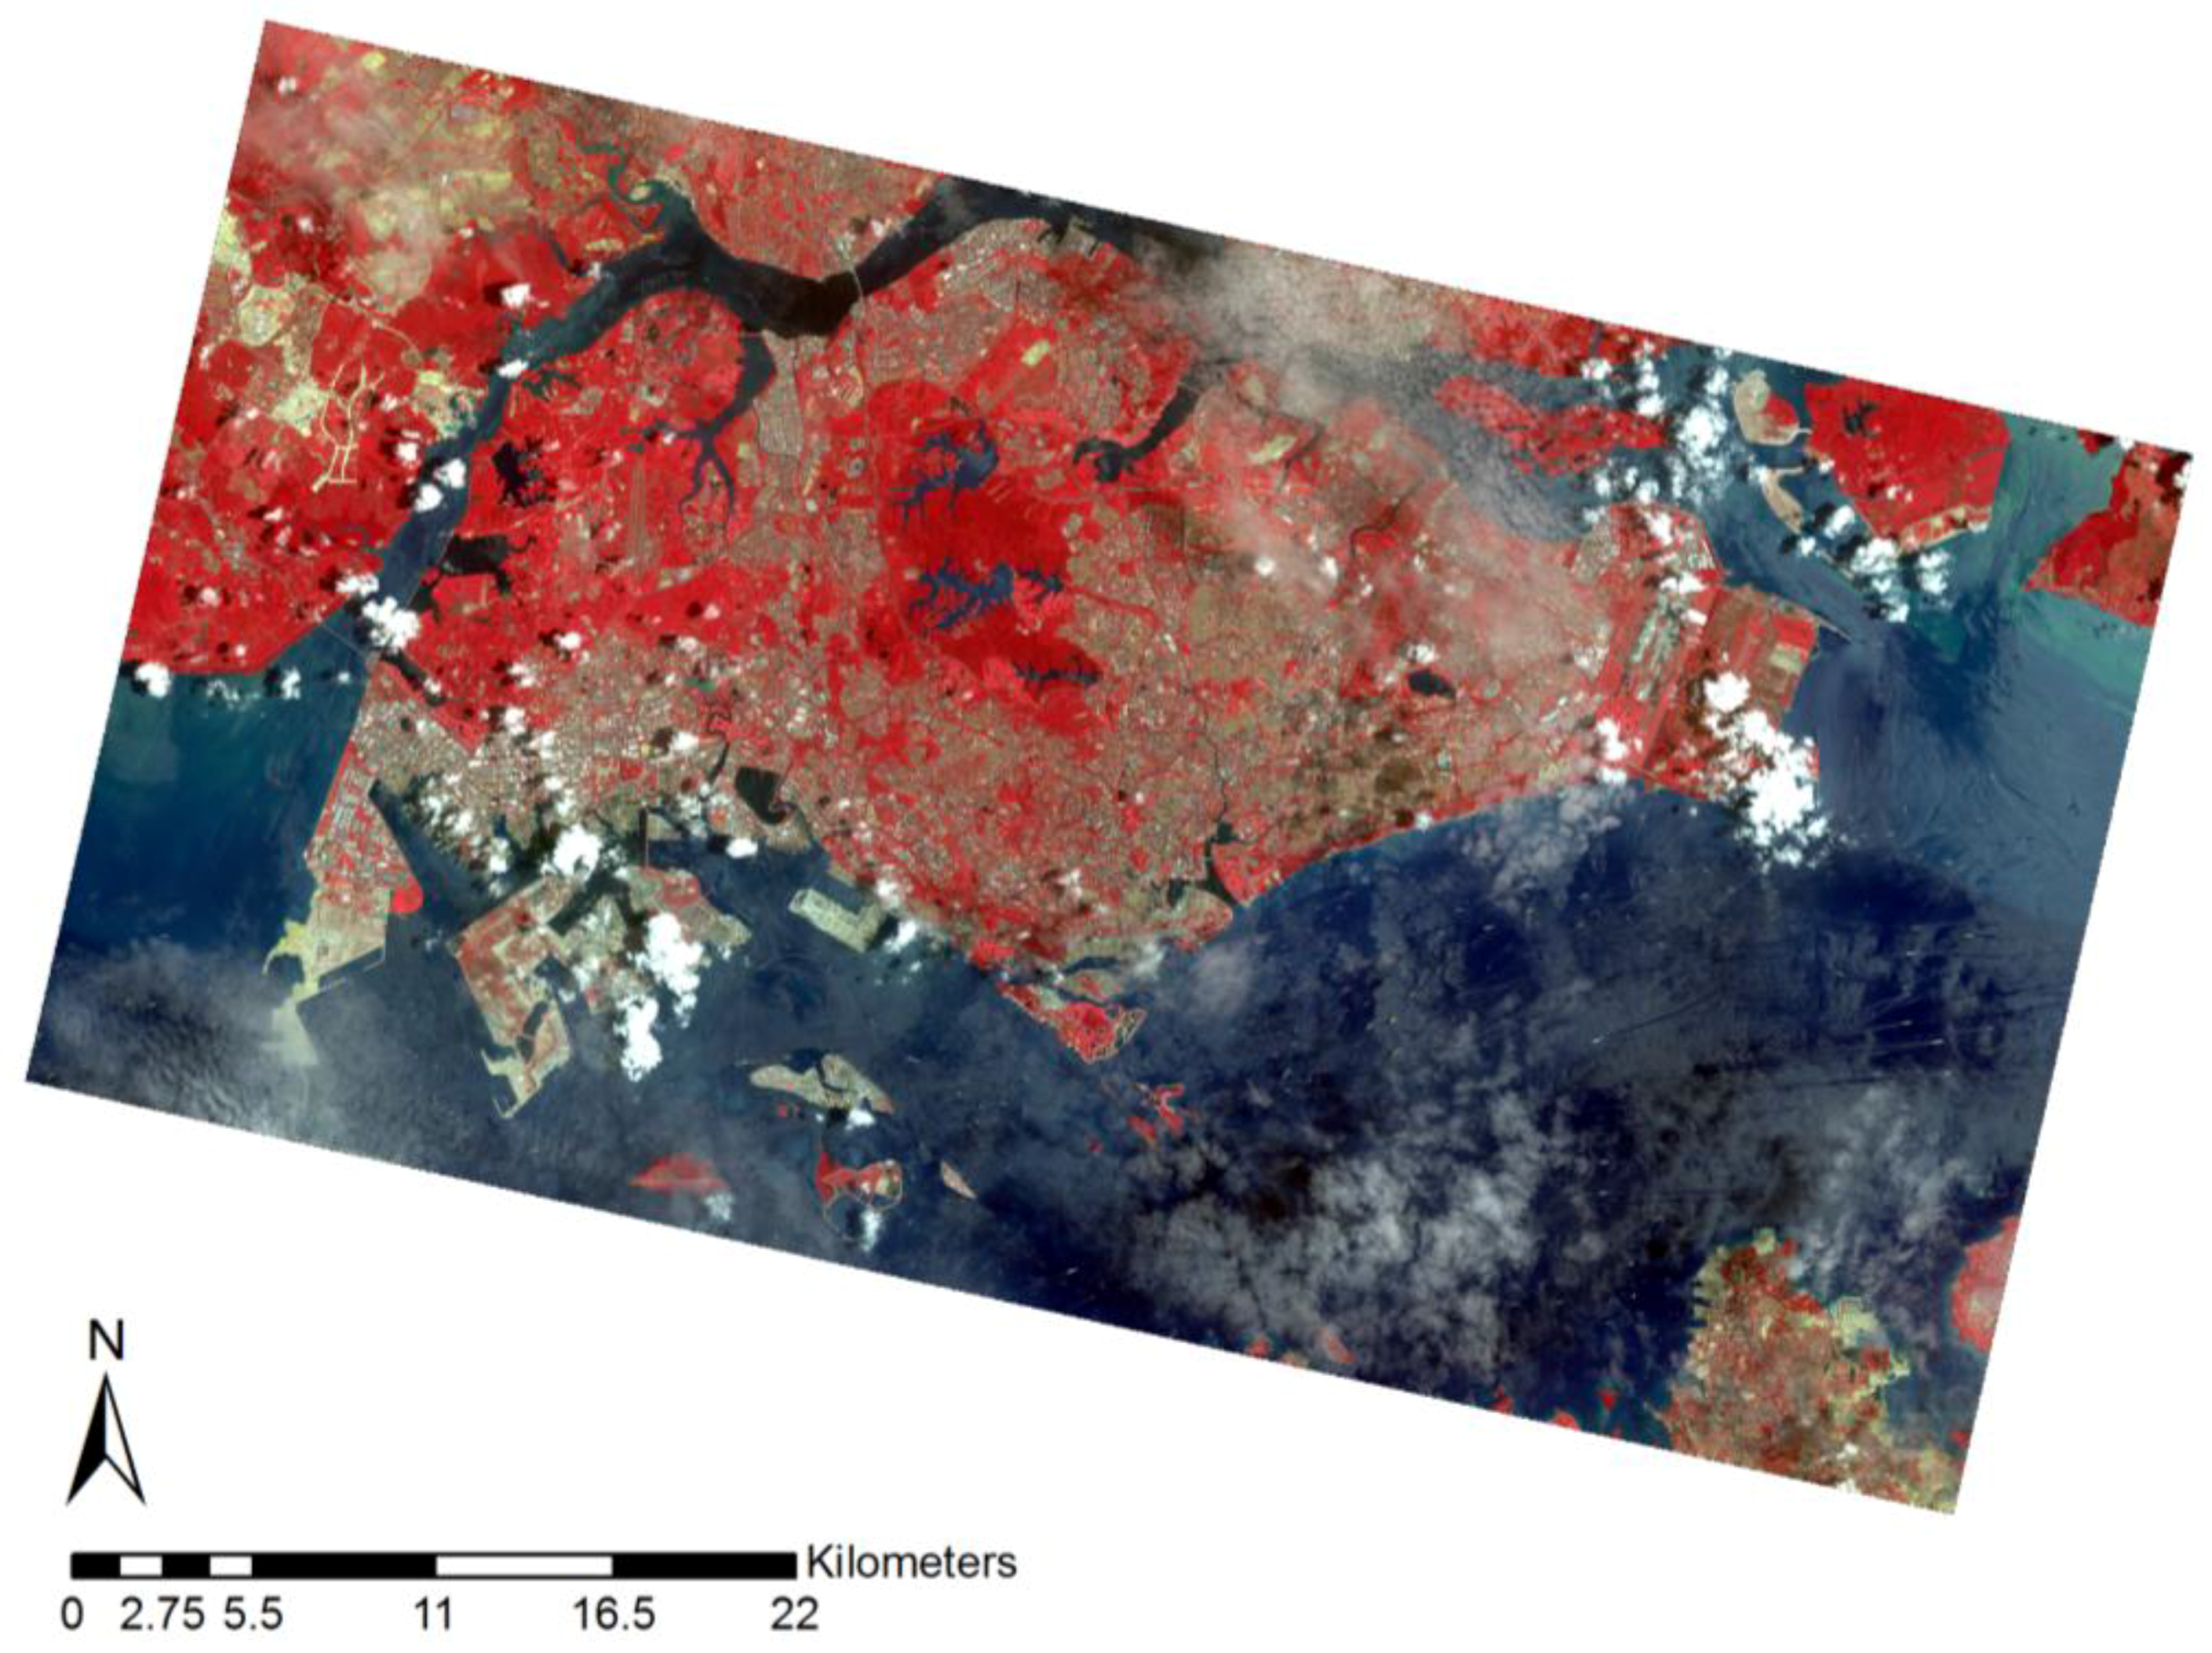
For our validation process, we obtained Satellite Pour l’Observation de la Terre (SPOT-5) imagery for Singapore (
Figure 3). The spatial resolution of the image is 10 m in the four spectral bands, namely, Band 1 (green: 0.50–0.59 μm), Band 2 (red: 0.61–0.68 μm), Band 3 (near infrared: 0.78–0.89 μm), and Band 4 (short-wave infrared: 1.58–1.75 μm).
The initial step to an accuracy assessment is to decide the sampling strategy for the validation points. Some common sampling methods used are: simple random sampling, stratified random sampling, systematic random sampling and cluster sampling. All sampling techniques contain some advantages and disadvantages. For example, simple random sampling increases the chance of missing out on smaller land classes, while systematic random sampling could introduce a sampling bias into the process as samples are selected with prior knowledge of their land class [
16]. Thus, for our validation, stratified random sampling was the best fit. This method selects the number of samples proportionately to the size of the classified land cover class. For example, the
Water and
Urban/Built-Up land classes are the most abundant for Singapore, thus, the algorithm assigns the largest and second largest validation sample groups to these classes, respectively. For the unweighted stratified sample or equalized stratified sample, each class in the analysis was assigned 100 points.
Validation is carried out initially for all 17 IGBP land cover classes of the MCD12Q1-1 product, using the weighted stratified sampling. This is followed by an accuracy assessment of only the most abundant land cover classes in our study area, namely, Urban/Built-Up, Evergreen Broadleaf Forests, Permanent Wetlands, and Water, using both weighted and unweighted stratified sampling. We did not repeat an equalized stratified sampling for all 17 IGBP classes. A majority of the land classes only contain 1–5 pixels in Singapore, thus, we could not obtain a suitable number of samples for the process.
Through the formulation of an error matrix, we evaluate the following statistics for the accuracy of the IGBP classification of Singapore:
Overall Accuracy: (No. of correctly classified pixels)/(Total pixels in the assessment). (1)
Producer’s Accuracy: The probability of a ground truth pixel being correctly classified:
where k
i,i is the diagonal element of the matrix for class i, and k.
i is the sum of pixels for class i in the reference image.
User’s Accuracy: The probability of a pixel in our classified map belonging to the correct class:
where k
i,i is the diagonal element of the matrix for class i, and k
i. is the sum of pixels for class i in the classified image.
Kappa index measure of prediction between a “ground truth” map and any alternative map. This outputs the probability of the actual agreement calculated being better than the agreement expected due to random chance. For example, a Kappa index of 0.45 indicates that overall agreement (from Equation (1)) is 45% better than the agreement due to chance.
3. Results and Discussion
3.1. User Study and Interviews
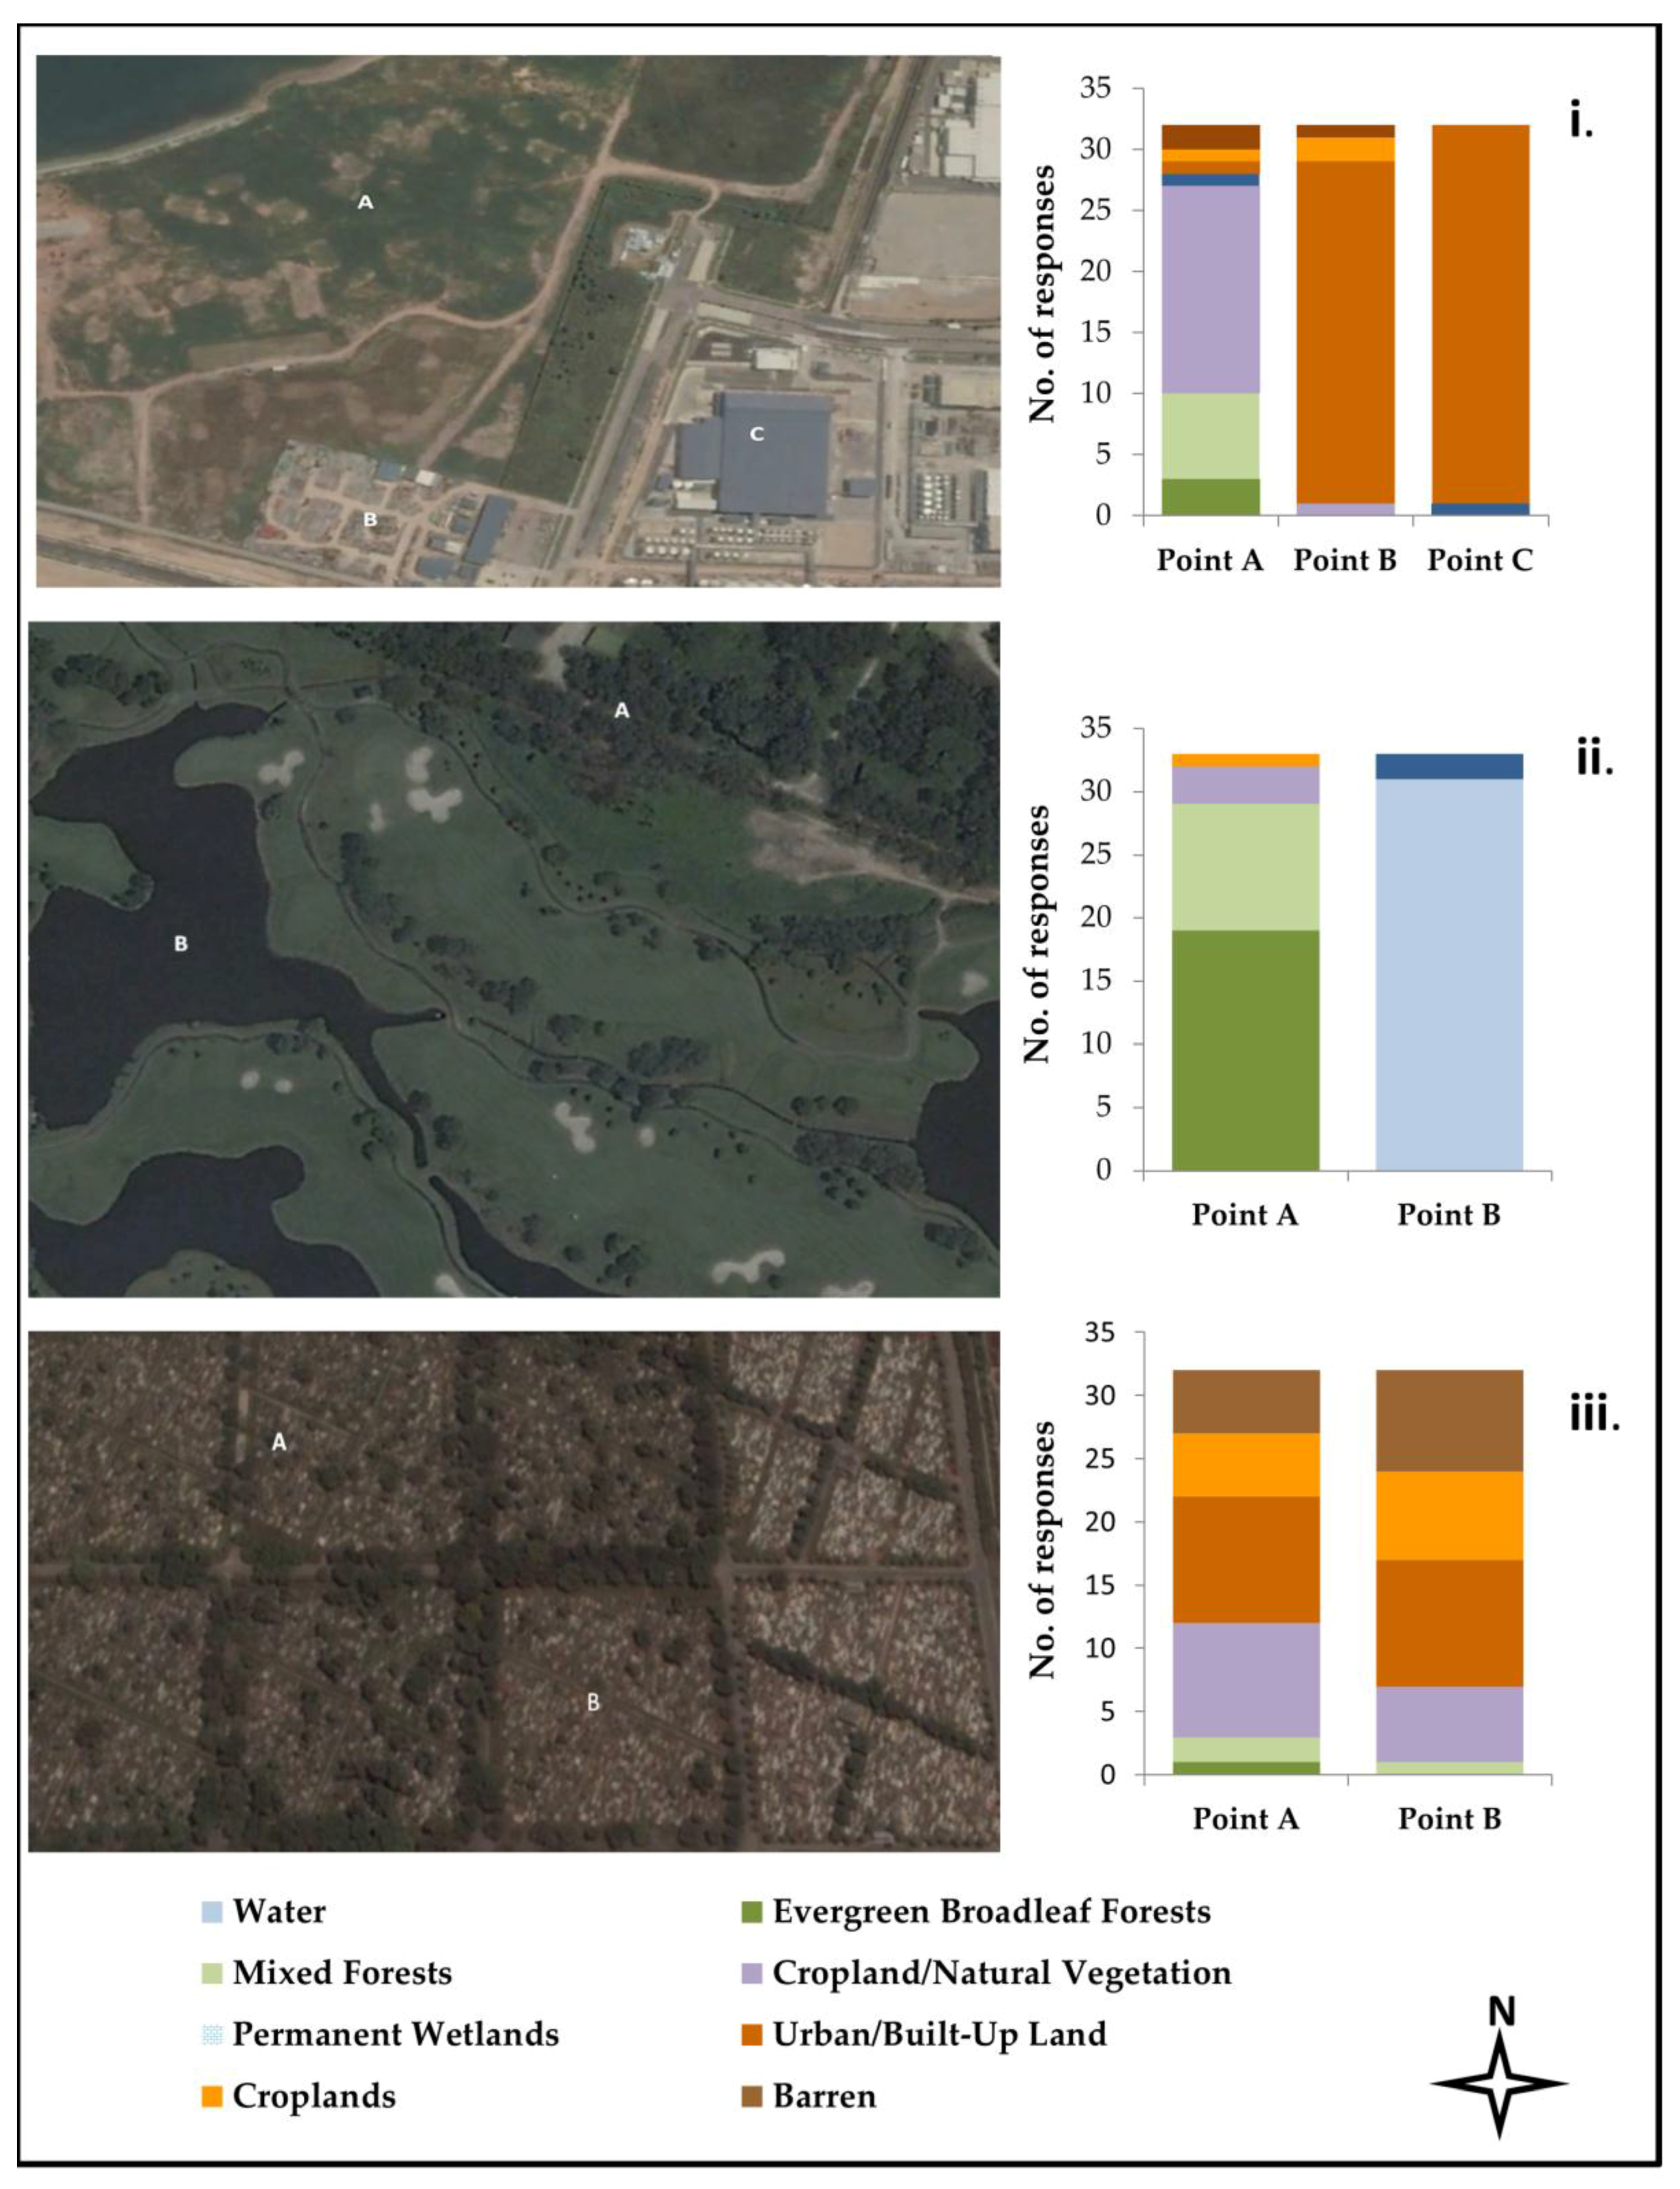
This section deals with the inferences we were able to draw from the 33 responses from our user study. In addition to the images that were clearly urban or built up land, we were able to highlight some confusion when it came to forested land as well as barren and cropland land classes. This survey is a user-based validation of the MODIS MCD12Q1-1 IGBP classification scheme. Out of the 30 images that users were asked to classify, we look at seven in detail which provided us with some interesting observations.
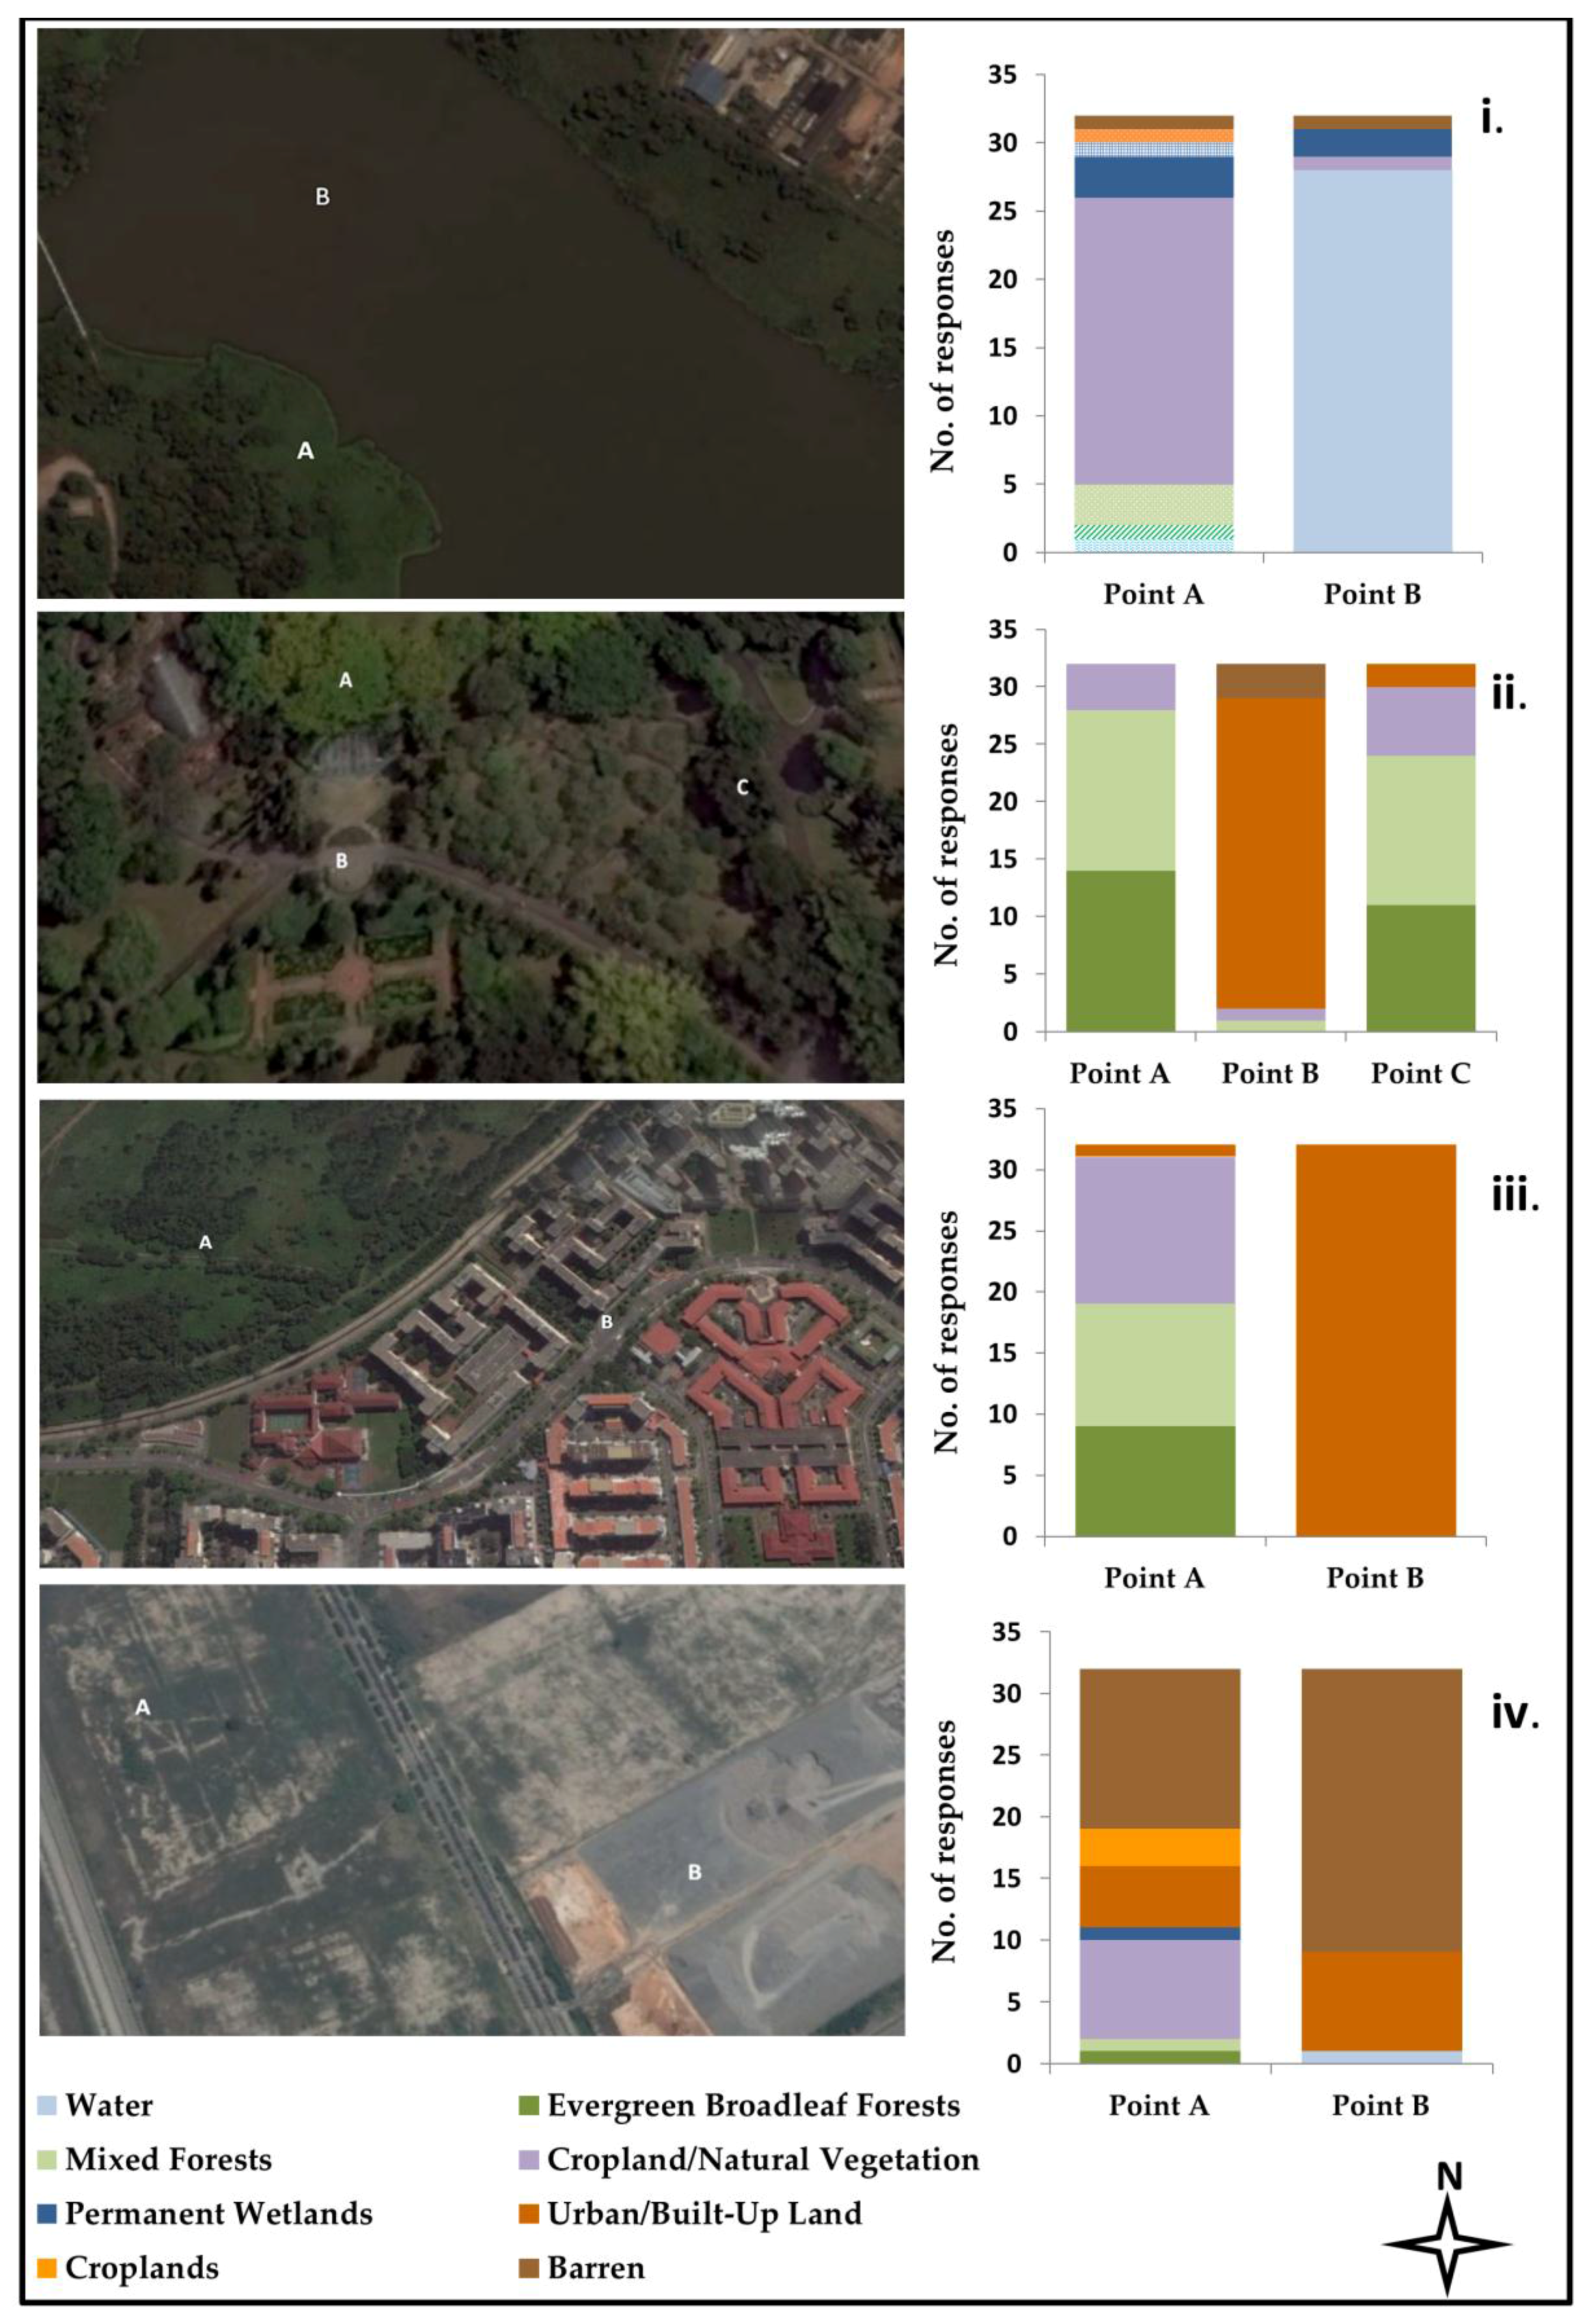
In images containing a single land cover type, users were able to discern the cover type well. However, in some images (
Figure 4iii,
Figure 5ii,iv) there is confusion at some points between barren and urbanised areas. According to the definitions provided in the MCD12Q1-1, which the users had continuous access to, it highlights the need for more detailed definitions, as well as a finer spatial resolution classification for an area such as Singapore.
According to the IGBP classification for Singapore most barren areas were also classified as urban or built up land. This is mainly due to the low spatial resolution of the dataset, as well as the logic of the definitions created. Industrial areas within Singapore are large swaths of land which are used as construction sites and holding sites for cement and sand. This is especially true for the Tuas Industrial Zone, which is a hotspot for land reclamation activities within Singapore [
9,
10]. This inherent understanding can be seen in the results of
Figure 5iv where 70% of users classify a stretch of land that falls within an industrial zone as barren. This point once again highlights the coarse level of global definitions for a country-scale analysis.
Singapore consists of designated protected areas of primary forest, mainly evergreen broadleaf forests [
17,
18]. As can be seen in
Figure 1, these forested areas are mostly untouched due to extremely strict government policies governing the land use and land cover of the country [
17,
18], and most users correctly classified these areas as
Evergreen Broadleaf Forests and/or
Mixed Forests. In
Figure 4ii, 70% users assigned the forest classes to Point A, while for
Figure 5ii, 85% (Point A) and 73% (Point C) respondents assigned the forest classes. This was especially true in the CCR area and the Bukit Timah National Reserve [
19], which are the areas depicted in
Figure 1. In some cases, however, we see some amount of confusion between forests and cropland/natural vegetation land cover. In
Figure 4i, Point A was classified as
Cropland/Natural Vegetation by 40% of users and
Evergreen Broadleaf Forest or
Mixed Forests by 30%. Similarly in
Figure 4iii, 36% users classify Point A as Cropland/Natural Vegetation and 57% classify as forests. Most of the users (93%) who took the survey categorized themselves as “experts” or having worked/working with land use and land cover products. Despite the users’ backgrounds and access to the IGBP land definitions throughout the survey, misclassifications revealed the definitions proposed by the IGBP classification scheme were not specific enough for the users’ understanding. The
Cropland/Natural Vegetation [
5] category includes lands with no more than 60% of forest/grasslands/shrublands and this type of terminology leaves space for a subjective analysis of this land class definition, increasing the chances for a misclassification. This sheds light on the need for a more detailed classification for islands the size of Singapore, which, at present, does not exist except as prescribed by the URA, and is primarily based on vector data.
The survey also includes an open-ended question to the respondents regarding how they would apply a global land cover product to study Singapore. We received 32 responses to the question group and the respondents conveyed the advantages of using an open global product especially for analysis of the land cover dynamics at a regional level (Southeast Asia scale). The major disadvantage that most users agree on is the coarse resolution of the dataset. In addition to the results of the user study, the interviews conducted in Singapore were a more focused viewpoint of four candidates in key positions working in different governmental agencies and the National University of Singapore. The major aspect of agreement amongst these four independent interviewees was that global classifications to the likes of the IGBP or LCCS provide a good overview of the different possible land covers present in Singapore and are useful to study the island at a country level, especially to monitor the ever-changing boundary due to the widespread practices of land and water reclamation. They further expressed the need to develop and study a more detailed land cover classification for Singapore, which was also captured through the responses of the survey.
Some of the limitations that were highlighted through the interviews were the need for regular updates to the MODIS datasets as a lot of the smaller islands that were reclaimed by the country were not present in the imagery or were not correctly classified. Furthermore, two out of four interviewees conveyed the importance of remote sensing data being in correspondence with the vector data that is more frequently used and suited for the need to manage a smaller landmass like mainland Singapore and its neighbouring islands.
3.2. Accuracy Assessment
For the validation of the MCD12Q1-1 using SPOT-5 imagery, we performed three accuracy assessment exercises using weighted and unweighted stratified sampling strategies. The selection of different sampling strategies helped us identify different sources of error, which may either be inherent in the MCD12Q1-1 dataset or arise out of the sampling process. We analyse and discuss the descriptive statistics derived through our accuracy assessments in the following sections.
3.2.1. Weighted Stratified Sampling for All 17 IGBP Land Classes
For our initial validation process, we obtained samples using a weighted stratification scheme for all 17-land classes in our study area. The error matrix using the weighted stratified sampling scheme is detailed below (
Table 2).
Smaller land cover classes namely, Open Shrublands, Croplands, Croplands/Natural Vegetation Mosaic occur with only one or two pixels in the classified image. The occurrence of these pixels is a source of random error within the MCD12Q1-1 dataset. Additionally, classes such as Savannas, Woody Savannas, and Grasslands do not exist in our study area, yet a small number of pixels appear in the MCD12Q1-1. Hence, the producer’s accuracies for the smaller classes could not be evaluated as the classes were not found in the reference image. The overall accuracy of the validation is ~62%. Due to the presence of numerous redundant land classes, the descriptive statistics evaluated in this case do not represent a true validation of the MCD12Q1-1. The process is affected by the difference in support mostly due to the coarse spatial resolution of MCD12Q1-1. Moreover, the MCD12Q1-1 does not include information about the neighbouring areas of Singapore, for example, the Jurong Islands or the Tuas Industrial Zone. As a result, Water is frequently misclassified as the Urban/Built-Up land class. This problem is specific to the peripheral areas of the island. However, for a country like Singapore, with a continuously changing land boundary, it is important for land cover products to be able to detect dredging, which is the dominant land conversion activity specific to the island.
3.2.2. Weighted Stratified Sampling for Most Abundant IGBP Land Classes in Singapore
In order to pre-correct our validation process, we repeated an accuracy assessment for the MCD12Q1-1, ignoring smaller redundant land classes. The dominant IGBP land cover classes of Singapore are
Urban/Built-Up Land,
Evergreen Broadleaf Forests,
Permanent Wetlands, and
Water. We narrowed down these relevant IGBP classes on the basis of information available in the master land use and land cover plans devised by the Singapore Land Authority and Urban Redevelopment Authority, which are the local authorities in charge of land planning for the island [
12,
13,
18]. We repeated a weighted stratified random sampling for our validation points, but only for these four land cover classes, as opposed to all 17 IGBP classes in
Section 3.2.1.
In this case, our overall classification accuracy improved to ~71%. An interesting observation is the producer’s and user’s accuracies for the
Permanent Wetlands class are the poorest. Furthermore, the error matrix (
Table 3) also shows that
Evergreen Broadleaf Forests in the classified image were marked as
Permanent Wetlands most frequently. This highlights the challenge of using the MCD12Q1-1 dataset to distinguish between mixed landscapes. In Singapore, the wetlands and swamp forests co-exist with the largest expanse of evergreen broadleaf forests in the Central Catchment Reserve (
Figure 1). The misclassification was not captured through the user study, which highlights the importance of both qualitative and quantitative evaluations to establish a comprehensive overview of the accuracy of existing land cover classification schemes.
3.2.3. Unweighted Stratified Sampling for Most Abundant IGBP Land Classes in Singapore
Following the improvement of the accuracy assessment by considering only the most abundant land cover classes, we repeated the computation using an equalized sampling scheme. The reason for this was to account for random errors that are inherent in the MCD12Q1-1 dataset, as well as account for oversampling within land classes from the weighted sampling method. Using this sampling strategy (
Table 4), we obtain ~62% overall agreement between the IGBP classification and ground truth. We notice that our descriptive statistics have improved in comparison to the previous two validation efforts. Despite the lower overall accuracy than in the previous validation run, we further observe that increasing the number of samples within the
Permanent Wetlands and
Evergreen Broadleaf Forests leads to an improvement in their producer’s and user’s accuracies. These improvements may be attributed to the pre-filtering process of disregarding insignificant land classes and also the equal weight distribution to the remaining land classes. An attribute of an unweighted stratified sampling scheme is a reduction in overall accuracy; however, we are able to study individual land classes with higher precision.
4. Conclusions
This research helps users understand a global dataset within the context of a local area which, in our case, is Singapore. We find that in the case of a global classification, smaller islands or countries often fall short of being classified completely and accurately.
In an urban setting, such as Singapore, there has not been land cover conversion in the form of deforestation over many years [
17]. However, dredging activities for land reclamation led to a constantly-changing country boundary, intensifying from the year 2004, with the development of the Tuas Industrial Zone in the southwest part of the island [
9]. The survey takers and interviewees shed light on the need for an openly-accessible and globally-integrated land classification system for the island state that contains up-to-date land cover information for the island. This was important to note as the Tuas Industrial Zone and Jurong Islands could not be observed in the MCD12Q1-1 (
Figure S1) for the year 2008.
The user survey we undertook focuses specifically on the perspective of the users of land cover maps and the information they derive from classification data. It highlights that broad land class definitions can be a source of confusion for users and increase the probability of misclassifications. Furthermore, the access to the detailed terminology of each IGBP land cover class does not prevent misclassification of land cover types, especially in images with mixed landscapes. The users and interviews emphasize on the need for improving the level of detail of existing IGBP land cover definitions in the context of Singapore. This is due to the highly focused nature of land cover change and activities in Singapore. The detailed user responses can be found in the
supplementary material. The validation of the MCD12Q1-1 dataset against ground truth imagery supports the user study by quantifying the errors in the dataset. The statistics obtained through the validation runs give an overall accuracy of ~62% (
Table 2 and
Table 4) and 71% (
Table 3). The low accuracy statistics highlight the challenge of scaling of global level spatial information in MCD12Q1-1, despite efforts to pre-filter for errors by focusing on only the most frequently occurring land classes in our study area. As highlighted in [
20],
Urban/Built-Up and
Permanent Wetlands classes may be under-represented in a global context. However, these classes are of the highest relevance to users of the MCD12Q1-1 map assessing Singapore and its neighbouring areas, since they are the most frequently occurring land cover classes in Southeast Asia. Hence, it is not suitable to use MCD12Q1-1 to quantify the extent of the
Urban/Built-Up and
Permanent Wetlands land classes for our study area.
Some of the challenges that we faced during our research can also be perceived in a broader context. One of the main challenges was the lack of access to open data, specifically for our study area. Thus, it was imperative to include users and officials who work with different types of land cover data to obtain more information. A limitation of the accuracy assessment is a lack of information regarding the training phase of the MCD12Q1 dataset. Thus, errors that may have affected the development phase of the dataset could have affected the validation. At present, research in Singapore relies heavily on vector data (e.g., building footprints, roads, parks) from the SLA to monitor urban expansion. It is challenging to work with vector data in terms of quantifying land change within spatial polygons. There is an opportunity to create and integrate more Singaporean remote sensing data with existing open global level land cover information (e.g., MODIS, GlobCover LCCS), which is used by the scientific community.


