Assessment of WorldView-3 Data for Lithological Mapping

Abstract
:
1. Introduction
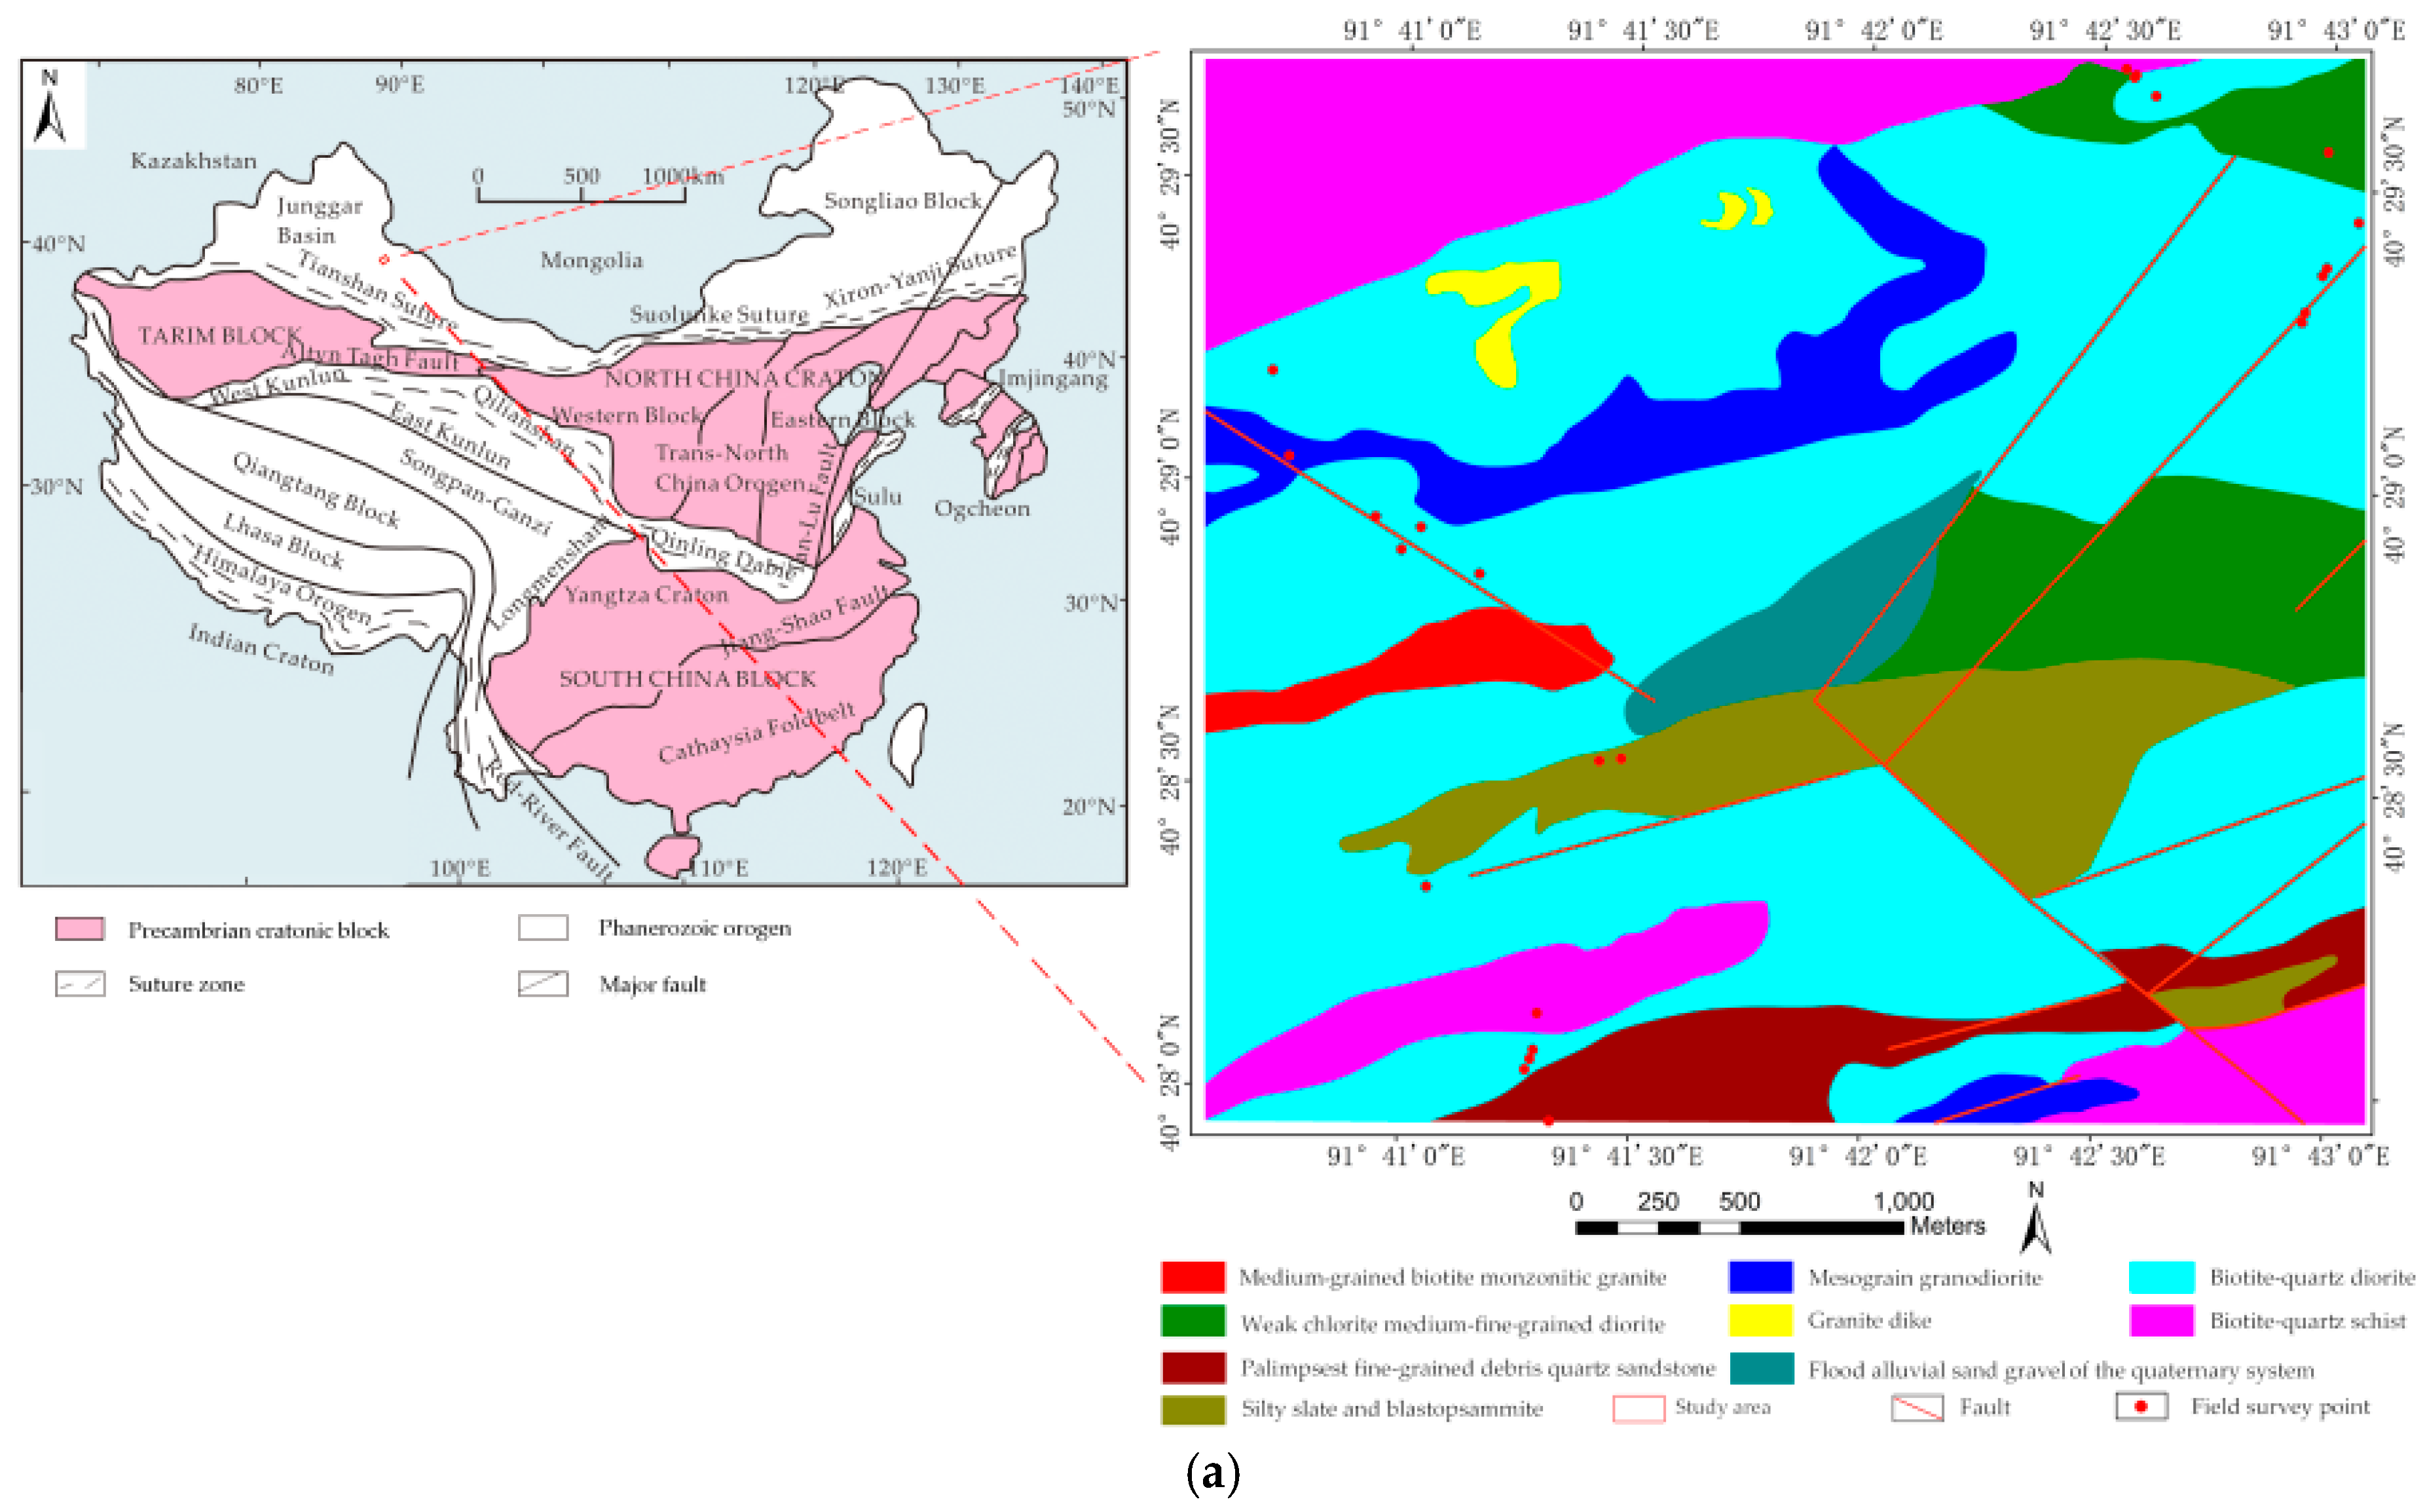
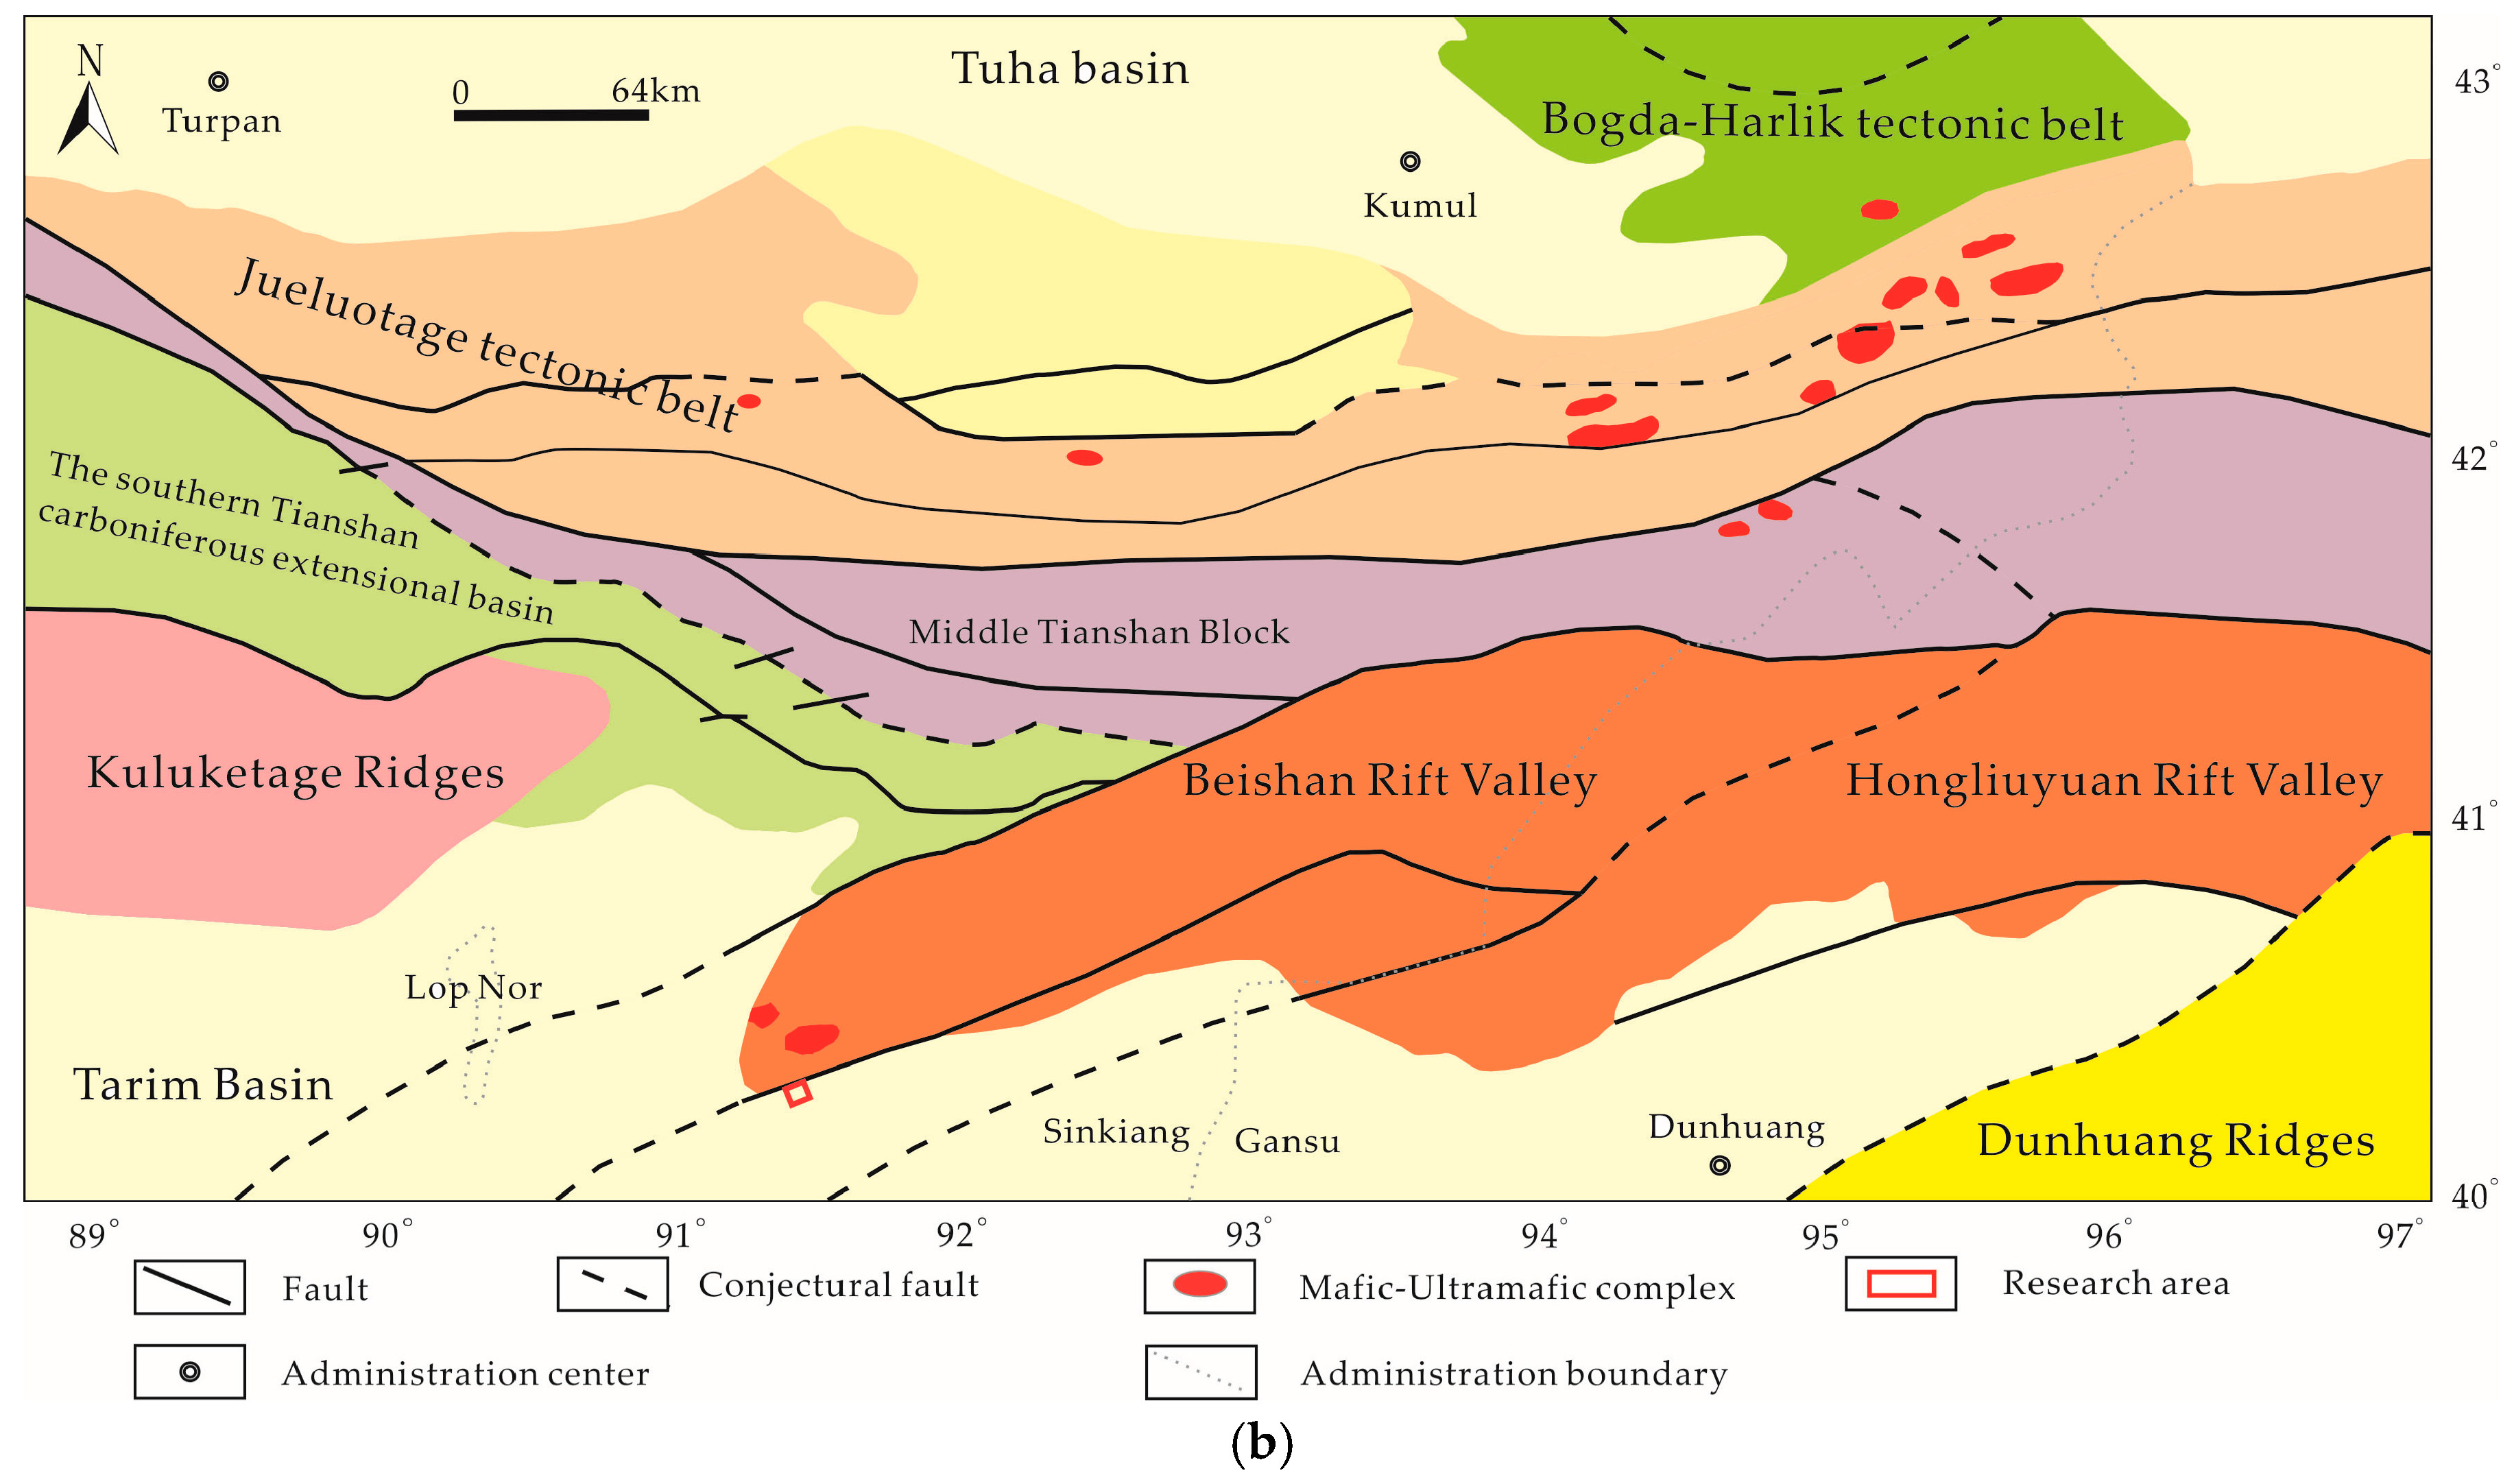
2. Study Area
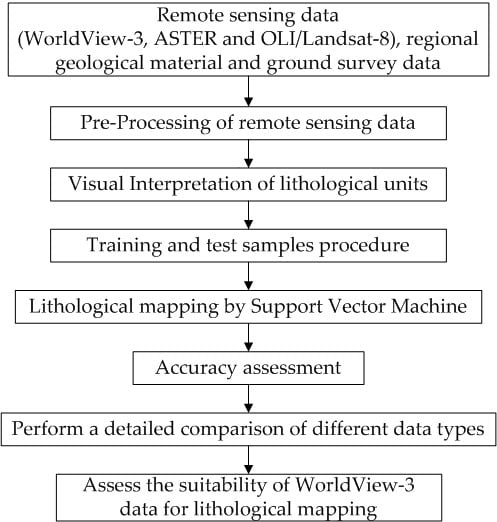
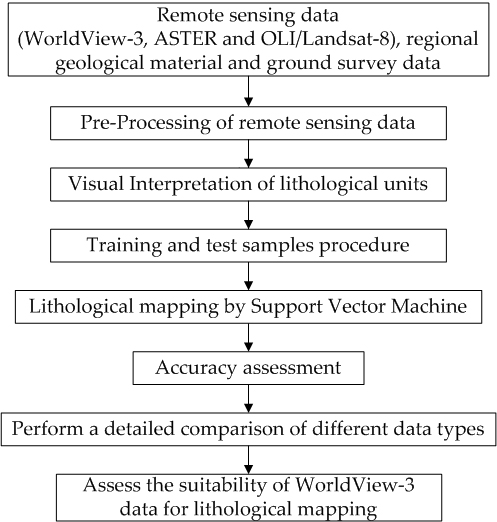
3. Materials and Methods
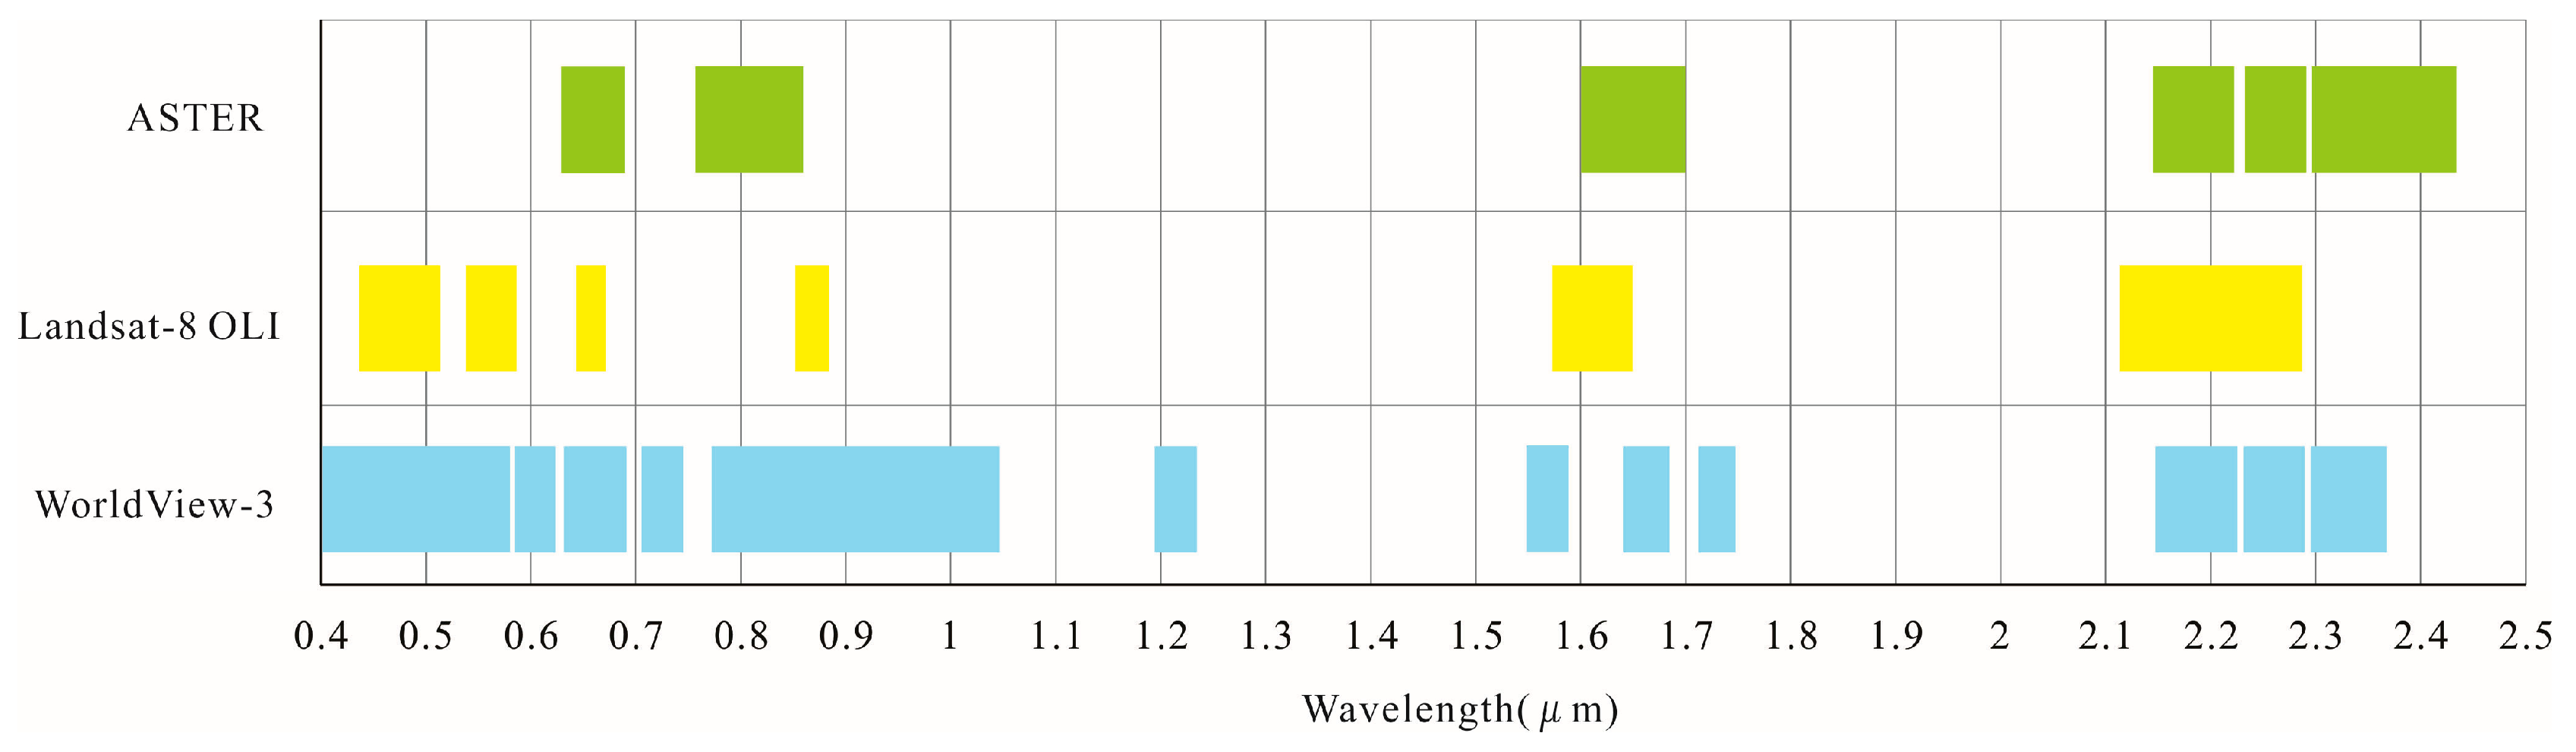
3.1. Data Sources
3.2. Pre-Processing of Remote Sensing Data
- (1)
- Radiometric calibration. The digital numbers (DN) in the pixel of the original image were 16-bit integers. Radiometric calibration converted the data of the observed surface into physical radiance; and
- (2)
- Atmospheric correction. While the wavelength range is an atmospheric window, there is atmospheric influence, including scattering, absorbing, attenuating energy, or changing the spectral distribution, which needs to be compensated for, especially for quantitative applications. Previous studies have shown that the Fast Line-of-sight Atmospheric Analysis of Spectral Hypercubus module (FLAASH module) is valid for both hyper-spectral and multi-spectral imagery, which has a better utility and practicability [42,43]. Meanwhile, Nisha Rani et al. [44] recommended that FLAASH was better than Quick Atmospheric Correction (QUAC) for atmospheric correction and correct interpretation and identification of composition of any object or minerals. Therefore, WV-3 bands were corrected by the FLAASH module.
- (3)
- Geometric correction, data resampling and stacking. Since VNIR and SWIR data acquisition time were different, there was geographical deviation between the two kinds of data. Based on VNIR data, the SWIR data was calibrated and the total RMS error was controlled within one pixel. Simultaneously, SWIR bands were resampled to 2.0 m and stacked with the VNIR bands, in order to centralize the multispectral features into one single file.
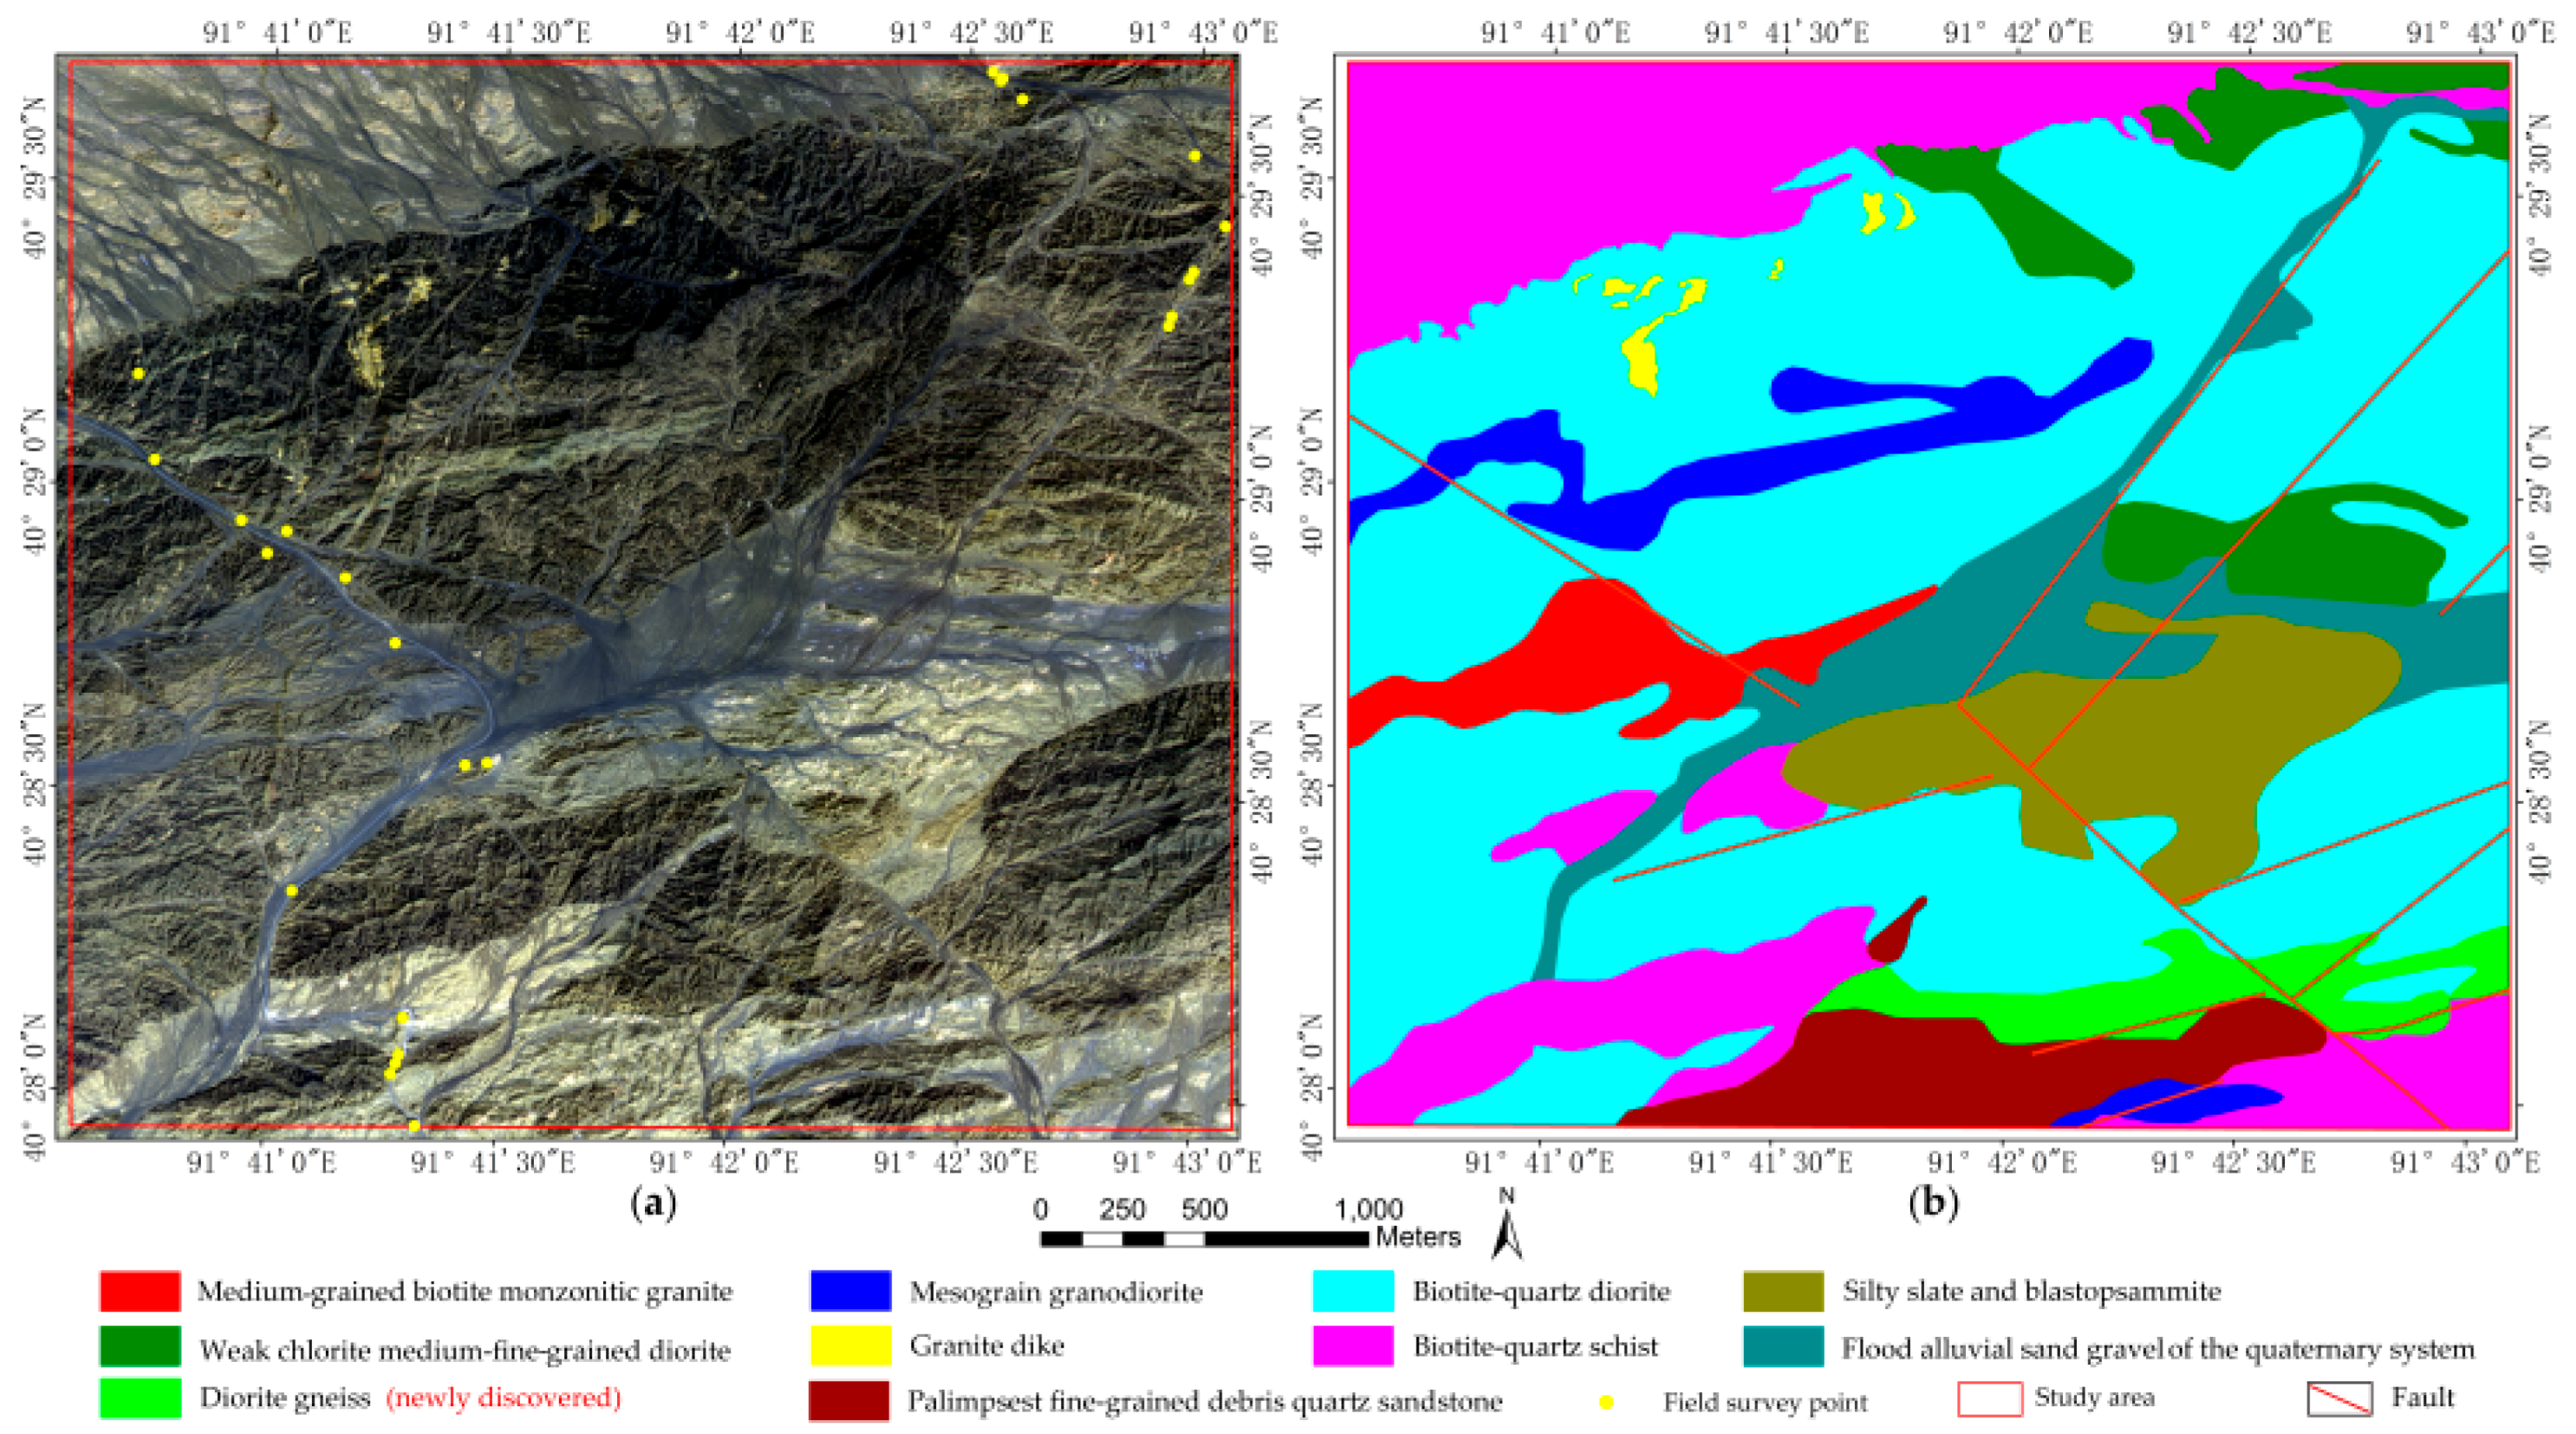
3.3. Visual Interpretation of Lithological Units
3.4. Samples Procedure
3.5. Lithological Mapping by Support Vector Machine
3.6. Accuracy Evaluation
4. Results
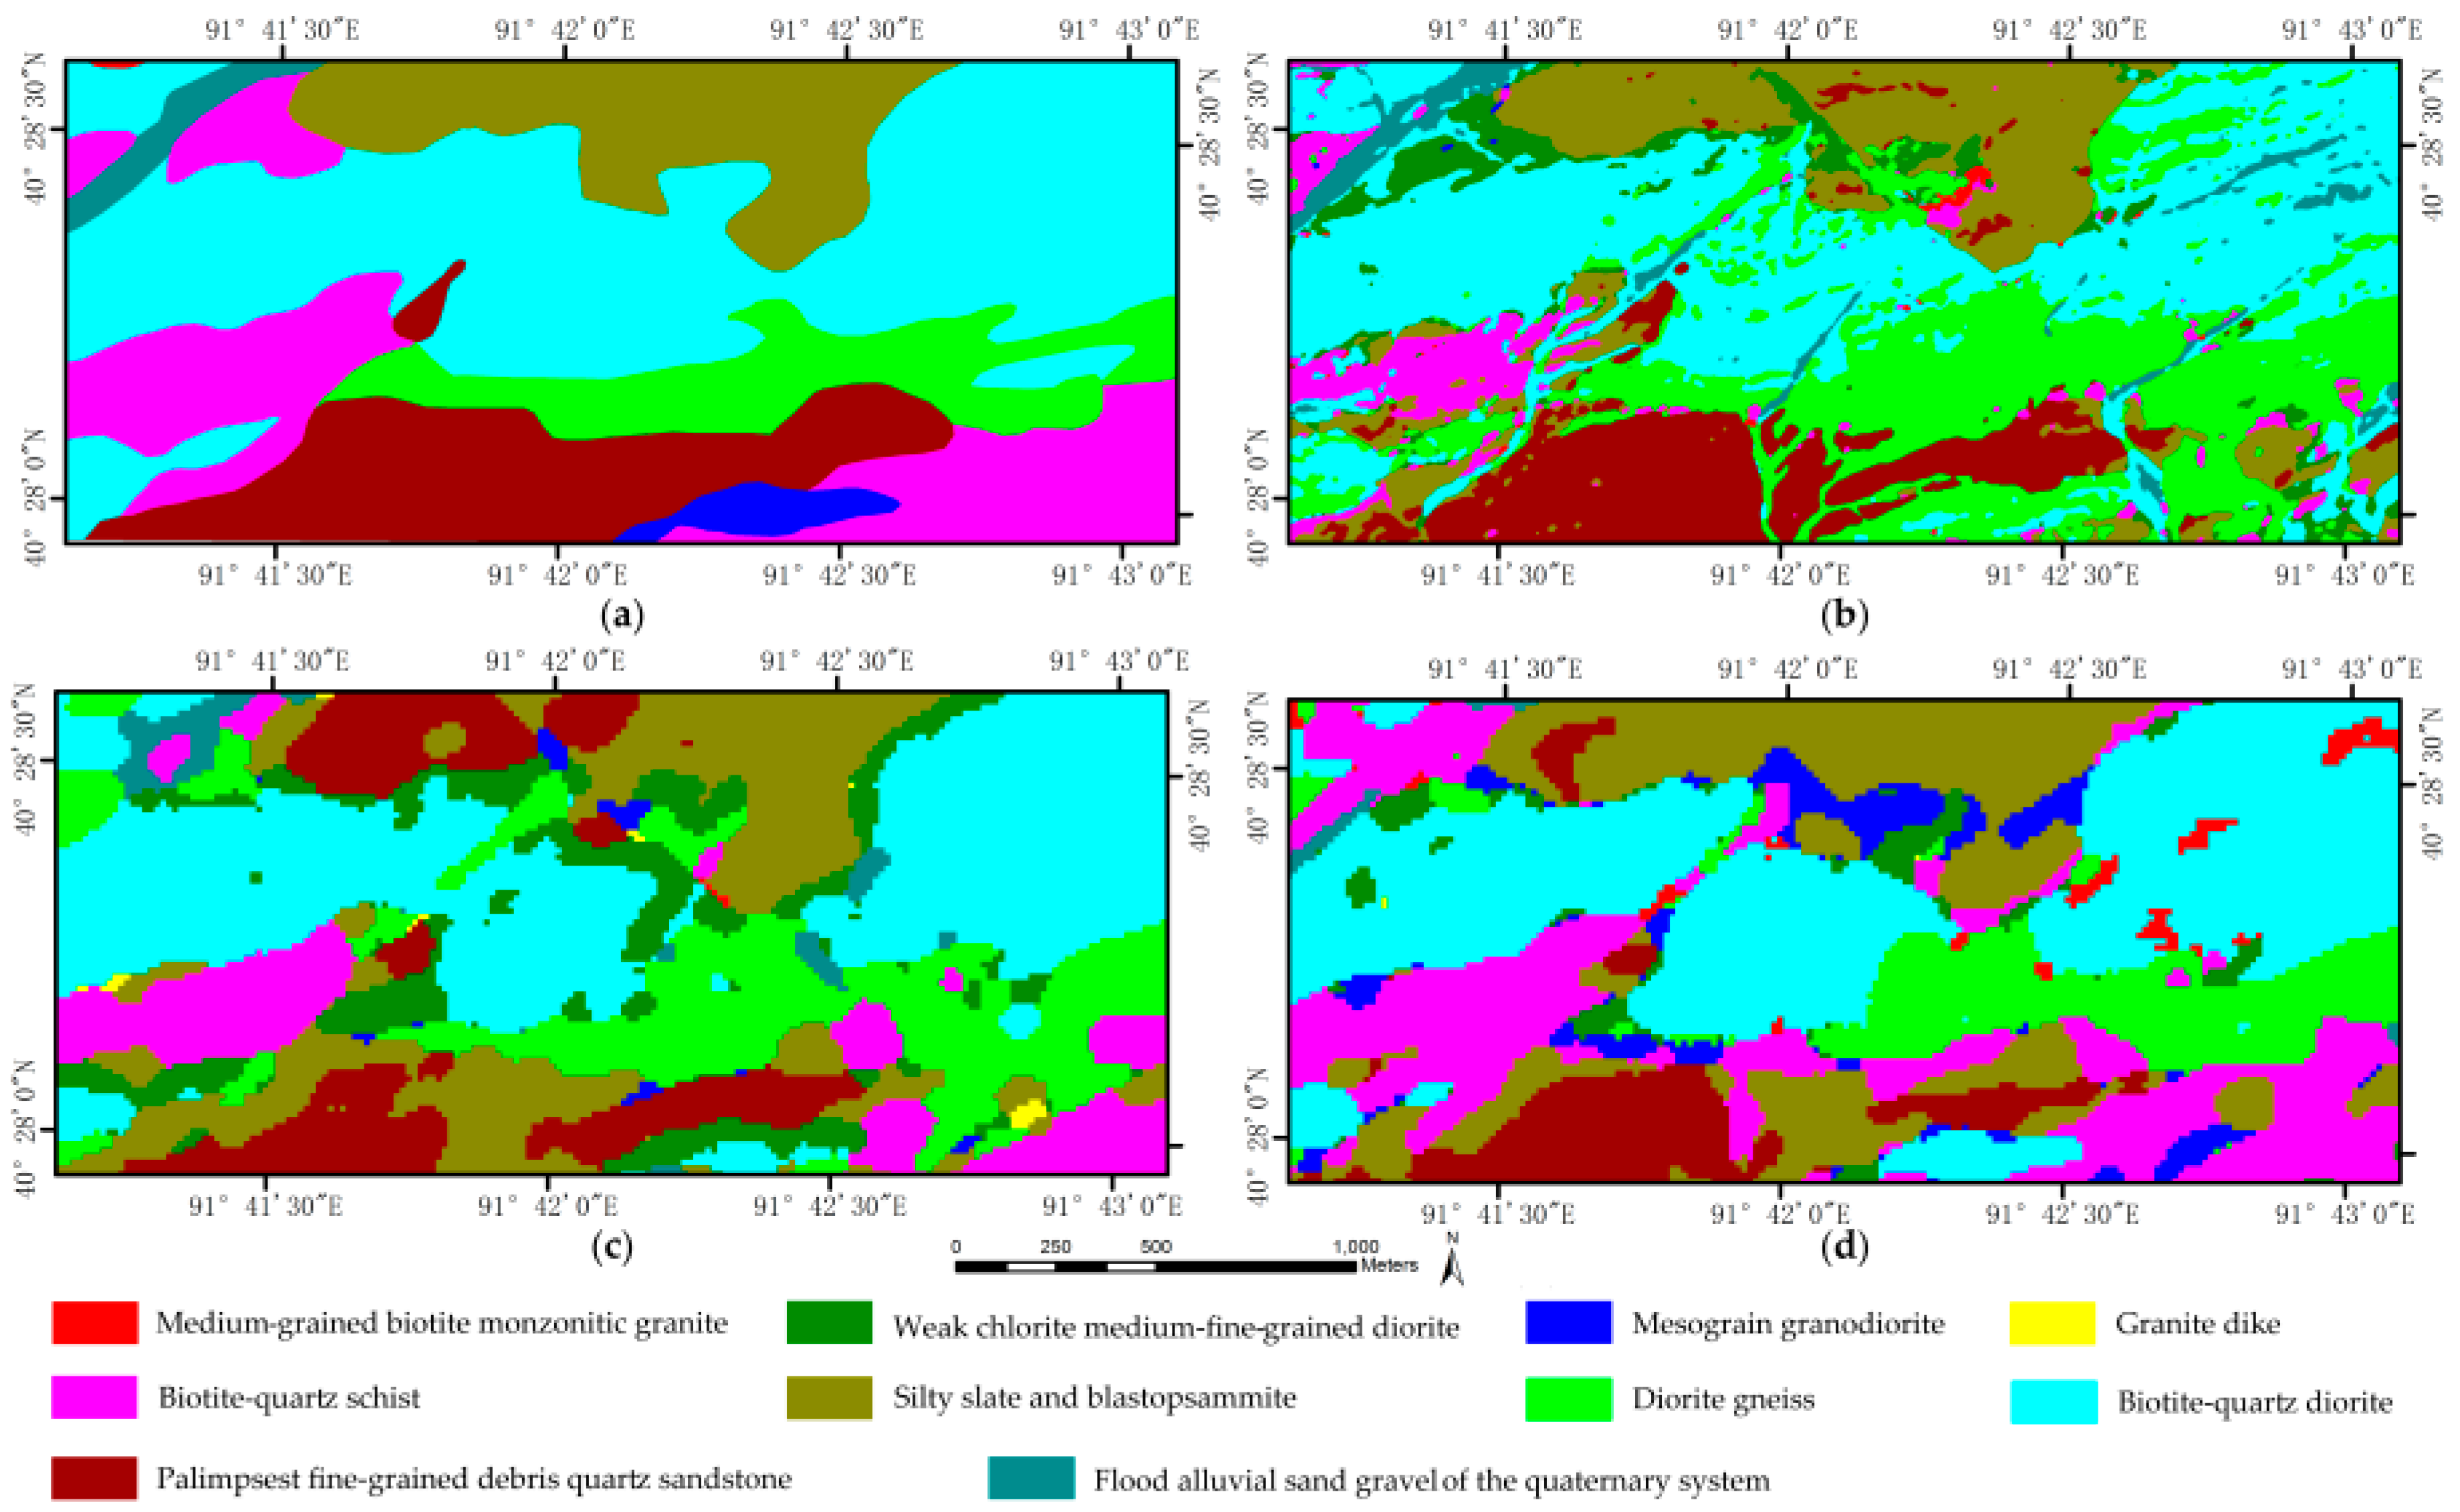
4.1. Lithological Map of Viaual Interpretation
4.2. Training and Test Samples
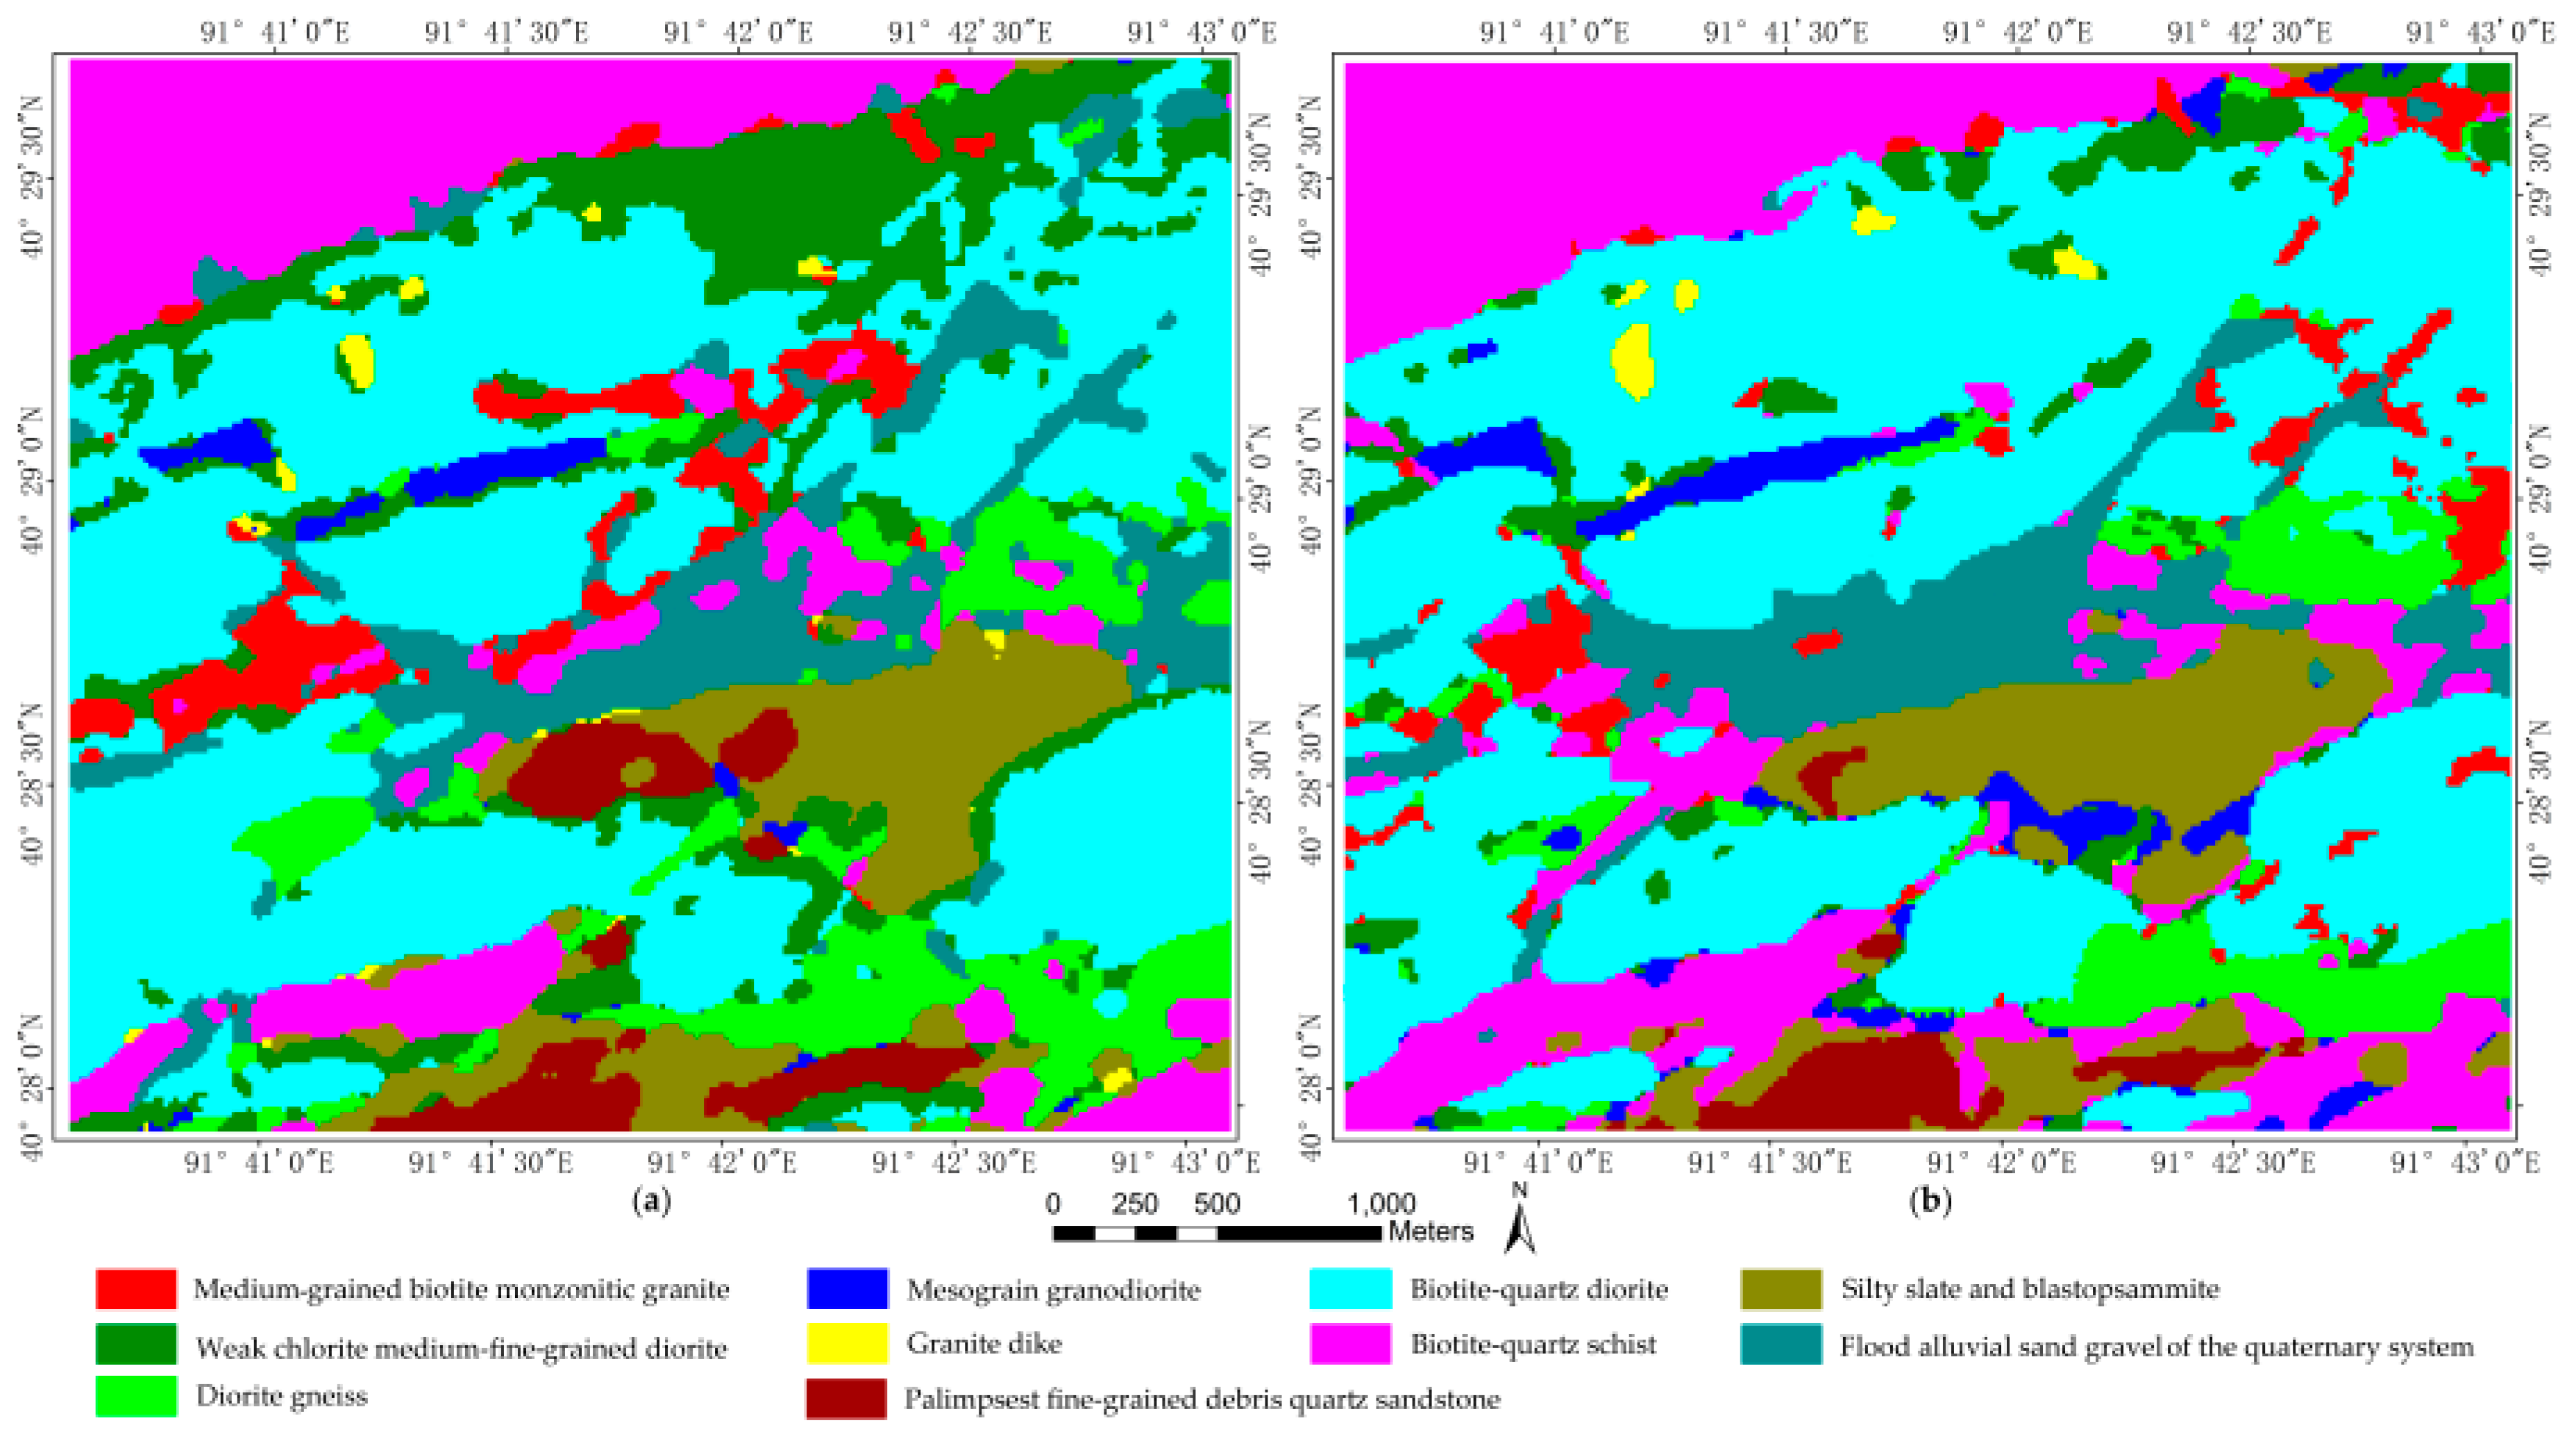
4.3. Lithological Classification Maps
4.4. Classification Accuracy
5. Discussion
6. Conclusions
Acknowledgments
Author Contributions
Conflicts of Interest
References
- Amer, R.; Kusky, T.; Ghulam, A. Lithological mapping in the central eastern desert of Egypt using ASTER data. J. Afr. Earth Sci. 2010, 56, 75–82. [Google Scholar] [CrossRef]
- Haselwimmer, C.E.; Riley, T.R.; Liu, J.G. Lithologic mapping in the Oscar ii Coast area, Graham Land, Antarctic Peninsula using ASTER data. Int. J. Remote Sens. 2011, 32, 2013–2035. [Google Scholar] [CrossRef]
- Sadeghi, B.; Khalajmasoumi, M.; Afzal, P.; Moarefvand, P.; Yasrebi, A.B.; Wetherelt, A.; Foster, P.; Ziazarifi, A. Using ETM+ and ASTER sensors to identify iron occurrences in the Esfordi 1:100,000 mapping sheet of central Iran. J. Afr. Earth Sci 2013, 85, 103–114. [Google Scholar] [CrossRef]
- Tangestani, M.H.; Jaffari, L.; Vincent, R.K.; Sridhar, B.B.M. Spectral characterization and ASTER-based lithological mapping of an ophiolite complex: A case study from Neyriz Ophiolite, SW Iran. Remote Sens. Environ. 2011, 115, 2243–2254. [Google Scholar] [CrossRef]
- Zhang, X.; Pazner, M. Comparison of lithologic mapping with ASTER, Hyperion, and ETM data in the southeastern chocolate mountains, USA. Photogramm. Eng. Remote Sens. 2007, 73, 555–561. [Google Scholar] [CrossRef]
- Madani, A.A.; Emam, A.A. SWIR ASTER band ratios for lithological mapping and mineral exploration: A case study from EL Hudi area, southeastern desert, Egypt. Arab. J. Geosci. 2009, 4, 45–52. [Google Scholar] [CrossRef]
- Mars, J.C.; Rowan, L.C. Spectral assessment of new ASTER SWIR surface reflectance data products for spectroscopic mapping of rocks and minerals. Remote Sens. Environ. 2010, 114, 2011–2025. [Google Scholar] [CrossRef]
- Amri, K.; Mahdjoub, Y.; Guergour, L. Use of Landsat 7 ETM+ for lithological and structural mapping of Wadi Afara Heouine area (Tahifet–Central Hoggar, Algeria). Arab. J. Geosci. 2010, 4, 1273–1287. [Google Scholar] [CrossRef]
- He, J.; Harris, J.R.; Sawada, M.; Behnia, P. A comparison of classification algorithms using Landsat-7 and Landsat-8 data for mapping lithology in Canada’s Arctic. Int. J. Remote Sens. 2015, 36, 2252–2276. [Google Scholar] [CrossRef]
- Amri, K.; Rabai, G.; Benbakhti, I.M.; Khennouche, M.N. Mapping geology in Djelfa district (Saharan Atlas, Algeria), using Landsat 7 ETM+ data: An alternative method to discern lithology and structural elements. Arab. J. Geosci. 2017, 10, 87. [Google Scholar] [CrossRef]
- Masoumi, F.; Eslamkish, T.; Abkar, A.A.; Honarmand, M.; Harris, J.R. Integration of spectral, thermal, and textural features of ASTER data using random forests classification for lithological mapping. J. Afr. Earth Sci. 2017, 129, 445–457. [Google Scholar] [CrossRef]
- Cao, G.; Li, Y.; Liu, Y.; Shang, Y. Automatic change detection in high-resolution remote-sensing images by means of level set evolution and support vector machine classification. Int. J. Remote Sens. 2014, 35, 6255–6270. [Google Scholar] [CrossRef]
- Deng, C.; Pan, H.; Fang, S.; Konaté, A.A.; Qin, R. Support vector machine as an alternative method for lithology classification of crystalline rocks. J. Geophys. Eng. 2017, 14, 341–349. [Google Scholar] [CrossRef]
- Larar, A.M.; Chauhan, P.; Suzuki, M.; Wang, J.; Parakh, K.; Thakur, S.; Chudasama, B.; Tirodkar, S.; Porwal, A.; Bhattacharya, A. Machine learning and spectral techniques for lithological classification. Proc. SPIE 2016, 9880, 98801Z. [Google Scholar]
- Othman, A.; Gloaguen, R. Improving lithological mapping by SVM classification of spectral and morphological features: The discovery of a new chromite body in the mawat ophiolite complex (Kurdistan, NE Iraq). Remote Sens. 2014, 6, 6867–6896. [Google Scholar] [CrossRef]
- Seifi Majdar, R.; Ghassemian, H. A probabilistic SVM approach for hyperspectral image classification using spectral and texture features. Int. J. Remote Sens. 2017, 38, 4265–4284. [Google Scholar] [CrossRef]
- Yu, L.; Porwal, A.; Holden, E.-J.; Dentith, M.C. Towards automatic lithological classification from remote sensing data using support vector machines. Comput. Geosci. 2012, 45, 229–239. [Google Scholar] [CrossRef]
- Zhou, J.J.; Tian, S.F.; Wang, N.; Hu, X. Enhancement and application of Worldview-2 to geological interpretation. Adv. Mater. Res. 2014, 1010–1012, 1237–1242. [Google Scholar] [CrossRef]
- Adiri, Z.; Harti, A.E.; Jellouli, A.; Maacha, L.; Bachaoui, E.M. Lithological mapping using Landsat 8 OLI and TERRA ASTER multispectral data in the Bas Drâa Inlier, Moroccan Anti Atlas. J. Appl. Remote Sens. 2016, 10, 016005. [Google Scholar] [CrossRef]
- Eslami, A.; Ghaderi, M.; Rajendran, S.; Pour, A.B.; Hashim, M. Integration of ASTER and Landsat TM remote sensing data for chromite prospecting and lithological mapping in Neyriz ophiolite zone, South Iran. Resour. Geol. 2015, 65, 375–388. [Google Scholar] [CrossRef]
- Pournamdari, M.; Hashim, M.; Pour, A.B. Spectral transformation of ASTER and Landsat TM bands for lithological mapping of Soghan ophiolite complex, south Iran. Adv. Space Res. 2014, 54, 694–709. [Google Scholar] [CrossRef]
- Vanderhoof, M.; Distler, H.; Mendiola, D.; Lang, M. Integrating Radarsat-2, LiDAR, and Worldview-3 imagery to maximize detection of forested inundation extent in the Delmarva Peninsula, USA. Remote Sens. 2017, 9, 105. [Google Scholar] [CrossRef]
- Black, M.; Riley, T.R.; Ferrier, G.; Fleming, A.H.; Fretwell, P.T. Automated lithological mapping using airborne hyperspectral thermal infrared data: A case study from Anchorage Island, Antarctica. Remote Sens. Environ. 2016, 176, 225–241. [Google Scholar] [CrossRef]
- Deroin, J.-P.; Djemai, S.; Bendaoud, A.; Brahmi, B.; Ouzegane, K.; Kienast, J.-R. Integrating geologic and satellite radar data for mapping dome-and-basin patterns in the in Ouzzal Terrane, Western Hoggar, Algeria. J. Afr. Earth Sci. 2014, 99, 652–665. [Google Scholar] [CrossRef]
- Pour, A.B.; Hashim, M. Structural geology mapping using PALSAR data in the Bau gold mining district, Sarawak, Malaysia. Adv. Space Res. 2014, 54, 644–654. [Google Scholar] [CrossRef]
- Pour, A.B.; Hashim, M. Application of PALSAR-2 remote sensing data for structural geology and topographic mapping in Kelantan river basin, Malaysia. IOP Conf. Ser. Earth Environ. Sci. 2016, 37, 012067. [Google Scholar] [CrossRef]
- Grebby, S.; Cunningham, D.; Naden, J.; Tansey, K. Lithological mapping of the Troodos ophiolite, Cyprus, using airborne LIDAR topographic data. Remote Sens. Environ. 2010, 114, 713–724. [Google Scholar] [CrossRef] [Green Version]
- Kruse, F.; Perry, S. Mineral mapping using simulated Worldview-3 short-wave-infrared imagery. Remote Sens. 2013, 5, 2688–2703. [Google Scholar] [CrossRef] [Green Version]
- Asadzadeh, S.; de Souza Filho, C.R. Investigating the capability of Worldview-3 superspectral data for direct hydrocarbon detection. Remote Sens. Environ. 2016, 173, 162–173. [Google Scholar] [CrossRef]
- Sun, Y.; Tian, S.; Di, B. Extracting mineral alteration information using Worldview-3 data. Geosci. Front. 2017, 8, 1051–1062. [Google Scholar] [CrossRef]
- Barazzetti, L.; Roncoroni, F.; Brumana, R.; Previtali, M. Georeferencing accuracy analysis of a single Worldview-3 image collected over Milan. ISPRS Int. Arch. Photogramm. Remote Sens. Spat. Inf. Sci. 2016, XLI-B1, 429–434. [Google Scholar] [CrossRef]
- Hu, F.; Gao, X.M.; Li, G.Y.; Li, M. Dem extraction from Worldview-3 stereo-images and accuracy evaluation. ISPRS Int. Arch. Photogramm. Remote Sens. Spat. Inf. Sci. 2016, XLI-B1, 327–332. [Google Scholar] [CrossRef]
- Li, D.; Ke, Y.; Gong, H.; Li, X. Object-based urban tree species classification using bi-temporal Worldview-2 and Worldview-3 images. Remote Sens. 2015, 7, 16917–16937. [Google Scholar] [CrossRef]
- Sibanda, M.; Mutanga, O.; Rouget, M. Testing the capabilities of the new Worldview-3 space-borne sensor’s red-edge spectral band in discriminating and mapping complex grassland management treatments. Int. J. Remote Sens. 2016, 38, 1–22. [Google Scholar] [CrossRef]
- Warner, T.A.; Skowronski, N.S.; Gallagher, M.R. High spatial resolution burn severity mapping of the new jersey pine barrens with Worldview-3 near-infrared and shortwave infrared imagery. Int. J. Remote Sens. 2016, 38, 598–616. [Google Scholar] [CrossRef]
- Niroumand-Jadidi, M.; Vitti, A. Optimal band ratio analysis of Worldview-3 imagery for bathymetry of shallow rivers (case study: Sarca river, Italy). ISPRS Int. Arch. Photogramm. Remote Sens. Spat. Inf. Sci. 2016, XLI-B8, 361–364. [Google Scholar] [CrossRef]
- Wang, T.; Zhang, H.; Lin, H.; Fang, C. Textural–spectral feature-based species classification of mangroves in Mai Po nature reserve from Worldview-3 imagery. Remote Sens. 2016, 8, 24. [Google Scholar] [CrossRef]
- Zheng, Y.-F.; Xiao, W.-J.; Zhao, G. Introduction to tectonics of China. Gondwana Res. 2013, 23, 1189–1206. [Google Scholar] [CrossRef]
- Su, B.-X.; Qin, K.-Z.; Sakyi, P.A.; Liu, P.-P.; Tang, D.-M.; Malaviarachchi, S.P.K.; Xiao, Q.-H.; Sun, H.; Dai, Y.-C.; Yan, H. Geochemistry and geochronology of acidic rocks in the Beishan region, NW China: Petrogenesis and tectonic implications. J. Asian Earth Sci. 2011, 41, 31–43. [Google Scholar] [CrossRef]
- Worldview-3 Satellite Sensor. Available online: https://www.satimagingcorp.com/satellite-sensors/worldview-3/ (accessed on 12 September 2017).
- Digital Globe. Available online: https://content.satimagingcorp.com.s3.amazonaws.com/static/satellite-sensor-specification/WorldView-3-PDF-Download.pdf (accessed on 12 September 2017).
- Nguyen, H.C.; Jung, J.; Lee, J.; Choi, S.U.; Hong, S.Y.; Heo, J. Optimal atmospheric correction for above-ground forest biomass estimation with the ETM+ remote sensor. Sensors 2015, 15, 18865–18886. [Google Scholar] [CrossRef] [PubMed]
- Schäfer, K.; Perkins, T.; Comerón, A.; Adler-Golden, S.; Matthew, M.; Slusser, J.R.; Picard, R.H.; Berk, A.; Anderson, G.; Carleer, M.R.; et al. Retrieval of atmospheric properties from hyper and multispectral imagery with the FLAASH atmospheric correction algorithm. Proc. SPIE 2005, 5979, 59790E. [Google Scholar]
- Rani, N.; Mandla, V.R.; Singh, T. Evaluation of atmospheric corrections on hyperspectral data with special reference to mineral mapping. Geosci. Front. 2017, 8, 797–808. [Google Scholar] [CrossRef]
- Iwasaki, A.; Tonooka, H. Validation of a crosstalk correnction algorithm for ASTER/SWIR. IEEE Trans. Geosci. Remote Sens. 2005, 12, 2747–2751. [Google Scholar] [CrossRef]
- Gasmi, A.; Gomez, C.; Zouari, H.; Masse, A.; Ducrot, D. PCA and SVM as geo-computational methods for geological mapping in the southern of Tunisia, using ASTER remote sensing data set. Arab. J. Geosci. 2016, 9, 753. [Google Scholar] [CrossRef]
- Zhou, Q.; Zhang, J.; Tian, Q.; Zhuo, L.; Geng, W. Automatic endmember extraction using pixel purity index for hyperspectral imagery. In Proceedings of the International Conference on Multimedia Modeling, Miami, FL, USA, 4–6 January 2016; Volume 9517, pp. 207–217. [Google Scholar]
- Ghosh, G.; Kumar, S.; Saha, S.K. Hyperspectral satellite data in mapping salt-affected soils using linear spectral unmixing analysis. J. Indian Soc. Remote Sens. 2011, 40, 129–136. [Google Scholar] [CrossRef]
- Support Vector Machine. Available online: https://en.wikipedia.org/wiki/Support_vector_machine (accessed on 12 September 2017).
- Burges, C. A tutorial on support vector machines for pattern recognition. Data Min. Knowl. Discov. 1998, 2, 121–167. [Google Scholar] [CrossRef]
- Othman, A.A.; Gloaguen, R. Integration of spectral, spatial and morphometric data into lithological mapping: A comparison of different machine learning algorithms in the Kurdistan region, NE Iraq. J. Asian Earth Sci. 2017, 146, 90–102. [Google Scholar] [CrossRef]
- Sahoo, S.; Jha, M.K. Pattern recognition in lithology classification: Modeling using neural networks, self-organizing maps and genetic algorithms. Hydrogeol. J. 2016, 25, 311–330. [Google Scholar] [CrossRef]
- Yang, X. Parameterizing support vector machines for land cover classification. Photogramm. Eng. Remote Sens. 2011, 77, 27–37. [Google Scholar] [CrossRef]
- Liu, P.; Choo, K.-K.R.; Wang, L.; Huang, F. SVM or deep learning? A comparative study on remote sensing image classification. Soft Comput. 2017, 21, 7053–7065. [Google Scholar] [CrossRef]
- Wang, M.; Wan, Y.; Ye, Z.; Lai, X. Remote sensing image classification based on the optimal support vector machine and modified binary coded ant colony optimization algorithm. Inf. Sci. 2017, 402, 50–68. [Google Scholar] [CrossRef]
- Congalton, R.G. A review of assessing the accuracy of remotely sensed data. Remote Sens. Environ. 1991, 37, 35–46. [Google Scholar] [CrossRef]
- Grebby, S.; Naden, J.; Cunningham, D.; Tansey, K. Integrating airborne multispectral imagery and airborne LiDAR data for enhanced lithological mapping in vegetated terrain. Remote Sens. Environ. 2011, 115, 214–226. [Google Scholar] [CrossRef] [Green Version]
- Brown, D.G.; Lusch, D.P.; Duda, K.A. Supervised classification of types of glaciated landscapes using digital elevation data. Geomorphology 1998, 21, 233–250. [Google Scholar] [CrossRef]
- Monserud, R.A.; Leemans, R. Comparing global vegetation maps with the kappa statistic. Ecol. Model. 1992, 62, 275–293. [Google Scholar] [CrossRef]
- Clark, R.N.; Swayze, G.A.; Livo, K.E.; Kokaly, R.F.; Sutley, S.J.; Dalton, J.B.; McDougal, R.R.; Gent, C.A. Imaging spectroscopy: Earth and planetary remote sensing with the USGS tetracorder and expert systems. J. Geophys. Res. Planets 2003, 108. [Google Scholar] [CrossRef]


| Sub-System | Band Number | Band Name | Wavelength Range (nm) | Sub-System | Band Number | Band Name | Wavelength Range (nm) |
|---|---|---|---|---|---|---|---|
| VNIR | 1 | Coastal | 400–450 | SWIR | 9 | SWIR1 | 1195–1225 |
| 2 | Blue | 450–510 | 10 | SWIR2 | 1550–1590 | ||
| 3 | Green | 510–580 | 11 | SWIR3 | 1640–1680 | ||
| 4 | Yellow | 585–625 | 12 | SWIR4 | 1710–1750 | ||
| 5 | Red | 630–690 | 13 | SWIR5 | 2145–2185 | ||
| 6 | Red edge | 705–745 | 14 | SWIR6 | 2185–2225 | ||
| 7 | Near-IR1 | 770–895 | 15 | SWIR7 | 2235–2285 | ||
| 8 | Near-IR2 | 860–1040 | 16 | SWIR8 | 2295–2365 |
| Category Number | Category Name | Sample Size (Pixel) | |
|---|---|---|---|
| Training Samples | Test Samples | ||
| 1 | Medium-grained biotite monzonitic granite | 90 | 90 |
| 2 | Weak chlorite medium-fine-grained diorite | 90 | 90 |
| 3 | Mesograin granodiorite | 90 | 90 |
| 4 | Granite dike | 90 | 90 |
| 5 | Biotite–quartz diorite | 117 | 117 |
| 6 | Biotite–quartz schist | 90 | 90 |
| 7 | Silty slate and blastopsammite | 90 | 90 |
| 8 | Flood alluvial sand gravel | 90 | 90 |
| 9 | Palimpsest fine-grained debris quartz sandstone | 90 | 90 |
| 10 | Diorite gneiss | 90 | 90 |
| Total (1854) | 927 | 927 | |
| Category Number | Category Name | Area Percentages | ||
|---|---|---|---|---|
| WV-3 | ASTER | OLI/Landsat-8 | ||
| 1 | Medium-grained biotite monzonitic granite | 2.93% | 4.17% | 3.93% |
| 2 | Weak chlorite medium-fine-grained diorite | 9.76% | 9.65% | 4.39% |
| 3 | Mesograin granodiorite | 3.75% | 2.19% | 2.94% |
| 4 | Granite dike | 0.62% | 0.34% | 0.48% |
| 5 | Biotite–quartz diorite | 41.66% | 41.45% | 43.58% |
| 6 | Biotite–quartz schist | 14.83% | 14.82% | 20.23% |
| 7 | Silty slate and blastopsammite | 6.79% | 8.07% | 8.14% |
| 8 | Flood alluvial sand gravel | 8.60% | 9.59% | 8.03% |
| 9 | Palimpsest fine-grained debris quartz sandstone | 3.53% | 3.40% | 2.19% |
| 10 | Diorite gneiss | 7.51% | 6.33% | 6.08% |
| Data Type | WorldView-3 | ASTER | OLI/Landsat-8 | ||||||
|---|---|---|---|---|---|---|---|---|---|
| Category Name | Prod.acc | User.acc | Average.acc | Prod.acc | User.acc | Average.acc | Prod.acc | User.acc | Average.acc |
| 1 | 80.00 | 80.00 | 80.00 | 80.00 | 100.00 | 90.00 | 30.00 | 100.00 | 65.00 |
| 2 | 60.00 | 66.67 | 63.34 | 30.00 | 27.27 | 28.64 | 40.00 | 66.67 | 53.34 |
| 3 | 100.00 | 83.33 | 91.67 | 70.00 | 100.00 | 85.00 | 80.00 | 100.00 | 90.00 |
| 4 | 90.00 | 100.00 | 95.00 | 40.00 | 66.67 | 53.34 | 40.00 | 80.00 | 60.00 |
| 5 | 92.31 | 92.31 | 92.31 | 92.31 | 66.67 | 79.49 | 100.00 | 56.52 | 78.26 |
| 6 | 60.00 | 75.00 | 67.50 | 80.00 | 88.89 | 84.45 | 100.00 | 71.43 | 85.72 |
| 7 | 100.00 | 100.00 | 100.00 | 90.00 | 64.29 | 77.15 | 100.00 | 83.33 | 91.67 |
| 8 | 100.00 | 90.91 | 95.46 | 90.00 | 100.00 | 95.00 | 100.00 | 90.91 | 95.46 |
| 9 | 90.00 | 100.00 | 95.00 | 50.00 | 83.33 | 66.67 | 70.00 | 100.00 | 85.00 |
| 10 | 100.00 | 83.33 | 91.67 | 70.00 | 46.67 | 58.34 | 70.00 | 50.00 | 60.00 |
© 2017 by the authors. Licensee MDPI, Basel, Switzerland. This article is an open access article distributed under the terms and conditions of the Creative Commons Attribution (CC BY) license (http://creativecommons.org/licenses/by/4.0/).
Share and Cite
Ye, B.; Tian, S.; Ge, J.; Sun, Y. Assessment of WorldView-3 Data for Lithological Mapping. Remote Sens. 2017, 9, 1132. https://doi.org/10.3390/rs9111132
Ye B, Tian S, Ge J, Sun Y. Assessment of WorldView-3 Data for Lithological Mapping. Remote Sensing. 2017; 9(11):1132. https://doi.org/10.3390/rs9111132
Chicago/Turabian StyleYe, Bei, Shufang Tian, Jia Ge, and Yaqin Sun. 2017. "Assessment of WorldView-3 Data for Lithological Mapping" Remote Sensing 9, no. 11: 1132. https://doi.org/10.3390/rs9111132
APA StyleYe, B., Tian, S., Ge, J., & Sun, Y. (2017). Assessment of WorldView-3 Data for Lithological Mapping. Remote Sensing, 9(11), 1132. https://doi.org/10.3390/rs9111132