1. Introduction
The surface reflectance product is a critical input for generating downstream products, such as vegetation indices (VI), leaf area index (LAI), fraction of absorbed photosynthetically-active radiation (FAPAR), bidirectional reflectance distribution function (BRDF), albedo, and land cover. A surface reflectance land climate data record (LCDR) needs to be of the highest possible quality so that minimal uncertainties propagate in the dependent/downstream products. The generation of such a record necessitates the use of multi-instrument/multi-sensor science-quality data record and a strong emphasis on data consistency, which, in this study, is achieved by careful characterization and processing of the original data, rather than degrading and smoothing the dataset. As a consequence, the LCDR needs to be derived from accurately calibrated top of the atmosphere reflectance values that are precisely geo-located, carefully screened for clouds and cloud shadows, corrected for atmospheric effects using a radiative transfer model-based approach and, finally, corrected for directional effects. All of these steps are necessary, as spurious trends will appear in the data record if the above effects are not corrected.
The first requirement for accurate atmospheric correction is a proper absolute calibration of the instrument. Calibration errors propagate through the whole atmospheric correction chain, in particular through the aerosol inversion and impact most of the bands in the visible part of the spectrum and subsequent downstream products. It is very important therefore to assess instrument performance and independently monitor calibration. The Advanced Very High Resolution Radiometer (AVHRR) remains an important data source for the study of long-term variations in land surface properties as it provides the longest time-series of global satellite measurements [
1]. Vermote and Kaufman [
2] presented a method for absolute calibration of the red and near-infrared channels of AVHRR. It was based on a combination of observations over remote ocean areas and over highly reflective clouds located in the tropics over the Pacific Ocean. Later, Vermote and Saleous [
3] validated these results using a stable Saharan desert site and data from MODIS. The agreement between MODIS and AVHRR was better than 1%. Inter-comparison of the MODIS Aqua and AVHRR for the 2000–2014 period reported in this paper has further enabled refinement of the AVHRR record. Using state-of-the-art algorithms for geolocation, calibration, cloud screening, and atmospheric and surface directional effect correction, we have been able to achieve the most consistent data record possible. Such a long data record allows for the development of several applications involving evaluation of trends in surface properties (e.g., [
4,
5,
6]). During the last several years, agricultural monitoring using remote sensing data has gained increasing interest among the science community, mainly since the development in 2011 of the Group on Earth Observations Global Agricultural Monitoring (GEOGLAM) initiative. The main objective of GEOGLAM is to strengthen global agricultural monitoring by improving the use of remote sensing tools for crop production projections and weather forecasting. In this context we demonstrate the performance of the LCDR, by applying the yield model described in [
7,
8] to the V4 series of the AVHRR data records.
In this paper, we present the latest improvements of the AVHRR BRDF corrected surface reflectance and NDVI Version 4 products by assessing the accuracy of geolocation (
Section 3.1), calibration (
Section 3.2), cloud mask (
Section 3.3), and the final surface reflectance product using AERONET data (
Section 3.4) and cross-comparing it to MODIS Aqua (
Section 3.5). Additionally, we evaluate the performance of the LAI, which is derived using surface reflectance (
Section 3.6). Finally, an application of the product to estimate the winter wheat yield in the USA from the 1980s is presented in
Section 3.7.
2. Materials
2.1. Land Climate Data Record (LCDR)
This work builds on previous efforts by [
9] that created the first three versions of the consistent long-term land data records spanning a time period of 1981–2000 through processing and reprocessing, of the AVHRR Global Area Coverage (GAC) data. The NASA LCDR detailed in [
9] contains gridded daily surface reflectance and brightness temperatures derived from processing of the data acquired by the AVHRR sensors onboard four NOAA polar orbiting satellites: NOAA-7, -9, -11, and -14. Daily surface reflectance from the AVHRR channels 1 and 2 (at 640 and 860 nm) is a NOAA Climate Data Record (CDR). These data records are produced in a geographic projection at a spatial resolution of 0.05 degree similar to the Climate Modelling Grid (CMG) used in processing of the daily MODIS Surface Reflectance CMG data MOD09CMG/MYD09CMG.
With substantial improvements, the version 4 Land Surface CDR products were produced by the NASA Goddard Space Flight Center (GSFC) and the University of Maryland. The Version 4 series extended the time period of the records to the present day through processing of the AVHRR data from the NOAA-16, -17, -18, and -19, with additional improvements to version 3. Improvements include better geolocation accuracy achieved by using one-line-elements (OLE) instead of two-line-elements (TLE) for ephemeris, the use of the center of each grid as the reference to be consistent with other heritage records, such as from MODIS on-board the Earth Observing System (EOS) satellites, and use of a weighted average of available observations instead of the one best sample used in version 3. Version 4 was produced by reprocessing the raw GAC dataset for each instrument.
2.2. MODIS Daily Climate Model Grid (CMG) Time-Series
This study uses the MODIS CMG daily surface reflectance Collection 6 data (M{OY}D09CMG) distributed by the Land Processes Distributed Active Archive Center (LP DAAC,
https://lpdaac.usgs.gov/products/modis_products_table), which are gridded in the linear latitude, longitude projection at 0.05° resolution (5600 m at the Equator). Science Data Sets (SDSs) provided for this product include surface reflectance values for bands 1–7, brightness temperatures for bands 20, 21, 31, and 32, solar and view zenith angles, relative azimuth angle, ozone, granule time, quality assessment, cloud mask, aerosol optical thickness at 550 nm, and water vapor content.
2.3. Methods
2.3.1. Geolocation
The purpose of geolocation assessment is to identify any errors by comparing the images to control points that can be easily traceable. Thus, in order to assess the accuracy of the geolocation of a given sensor, we used ‘coastal chips’ as a reference, which were selected manually using the MODIS CMG product. This approach has been proven very useful for the AVHRR dataset, where the error could be significant and the drift of the clock onboard the NOAA satellites leads to a desynchronization between the satellite clock and the tracking station clock [
10].
2.3.2. Calibration Monitoring
The approach relies on using the multi-year MODIS Terra dataset to derive spectral and directional characterizations of stable desert sites that can be used as invariant targets. A candidate list of such targets is provided in [
11]. Subsets of MODIS Terra data are collected and undergo a rigorous screening based on the quality flags (cloud, cloud shadow, adjacent cloud, high aerosol, or snow). The directional characterization is derived using the MODIS bidirectional reflectance distribution function (BRDF) algorithm that relies on a kernel-driven linear BRDF model, defined as a weighted sum of three kernels representing basic scattering types: isotropic scattering, radiative transfer-type volumetric scattering based on the Ross-Thick function and geometric-optical surface scattering based on the Li-Sparse model [
12]. Using the site directional characterization, we compute a surface reflectance at the needed acquisition time and viewing conditions. Using the data corrected for directional effects we are also able to spectrally characterize the sites at the MODIS central wavelengths and account for spectral difference between MODIS and the AVHRR given the relatively broad AVHRR bands only for each particular site. Atmospheric parameters (surface pressure, gaseous content, water vapor, aerosol optical thickness) obtained from assimilated data, MODIS data, MODIS-like and/or ground measurements are then used in conjunction with the 6S radiative transfer code [
13] to determine the target sensor (MODIS-Aqua, AVHRR) Top Of Atmosphere (TOA) reflectance. The computed reflectance is compared to the acquired reflectance to infer changes in the instrument calibration.
2.3.3. Cloud Mask
The CloudSat and the Cloud-Aerosol Lidar and Infrared Pathfinder Satellite Observation (CALIPSO) mission and, in particular the Cloud-Aerosol Lidar with Orthogonal Polarization (CALIOP), provides a unique and independent opportunity to evaluate cloud mask products. Despite its relatively narrow footprint (330 m to 5 km depending on the altitude of the sensed layer), CALIOP acquires data about 2 min after MODIS Aqua, which makes it ideal for cloud mask evaluation and the MODIS Aqua cloud mask can then be used itself as a reference. The current AVHRR cloud mask has been evaluated against MODIS Aqua and the results show that is improved as compared to the CLAVR algorithm [
14]. This improved technique utilizes albedo thresholds derived from MODIS Aqua data to mask clouds.
2.3.4. Surface Reflectance Accuracy Assessment
Accurate estimation of atmospheric parameters, such as water vapor content or aerosol optical thickness, is critical and comprises the main source of error in the surface reflectance estimation. With the purpose of assessing the performance of the AVHRR surface reflectance product, we compare it with the surface reflectance derived from the top of the atmosphere AVHRR data corrected using field-based atmospheric data. These data were extracted for over 48 AERONET sites distributed across the globe [
15].
2.3.5. Direct Intercomparison of the Surface Reflectance Products
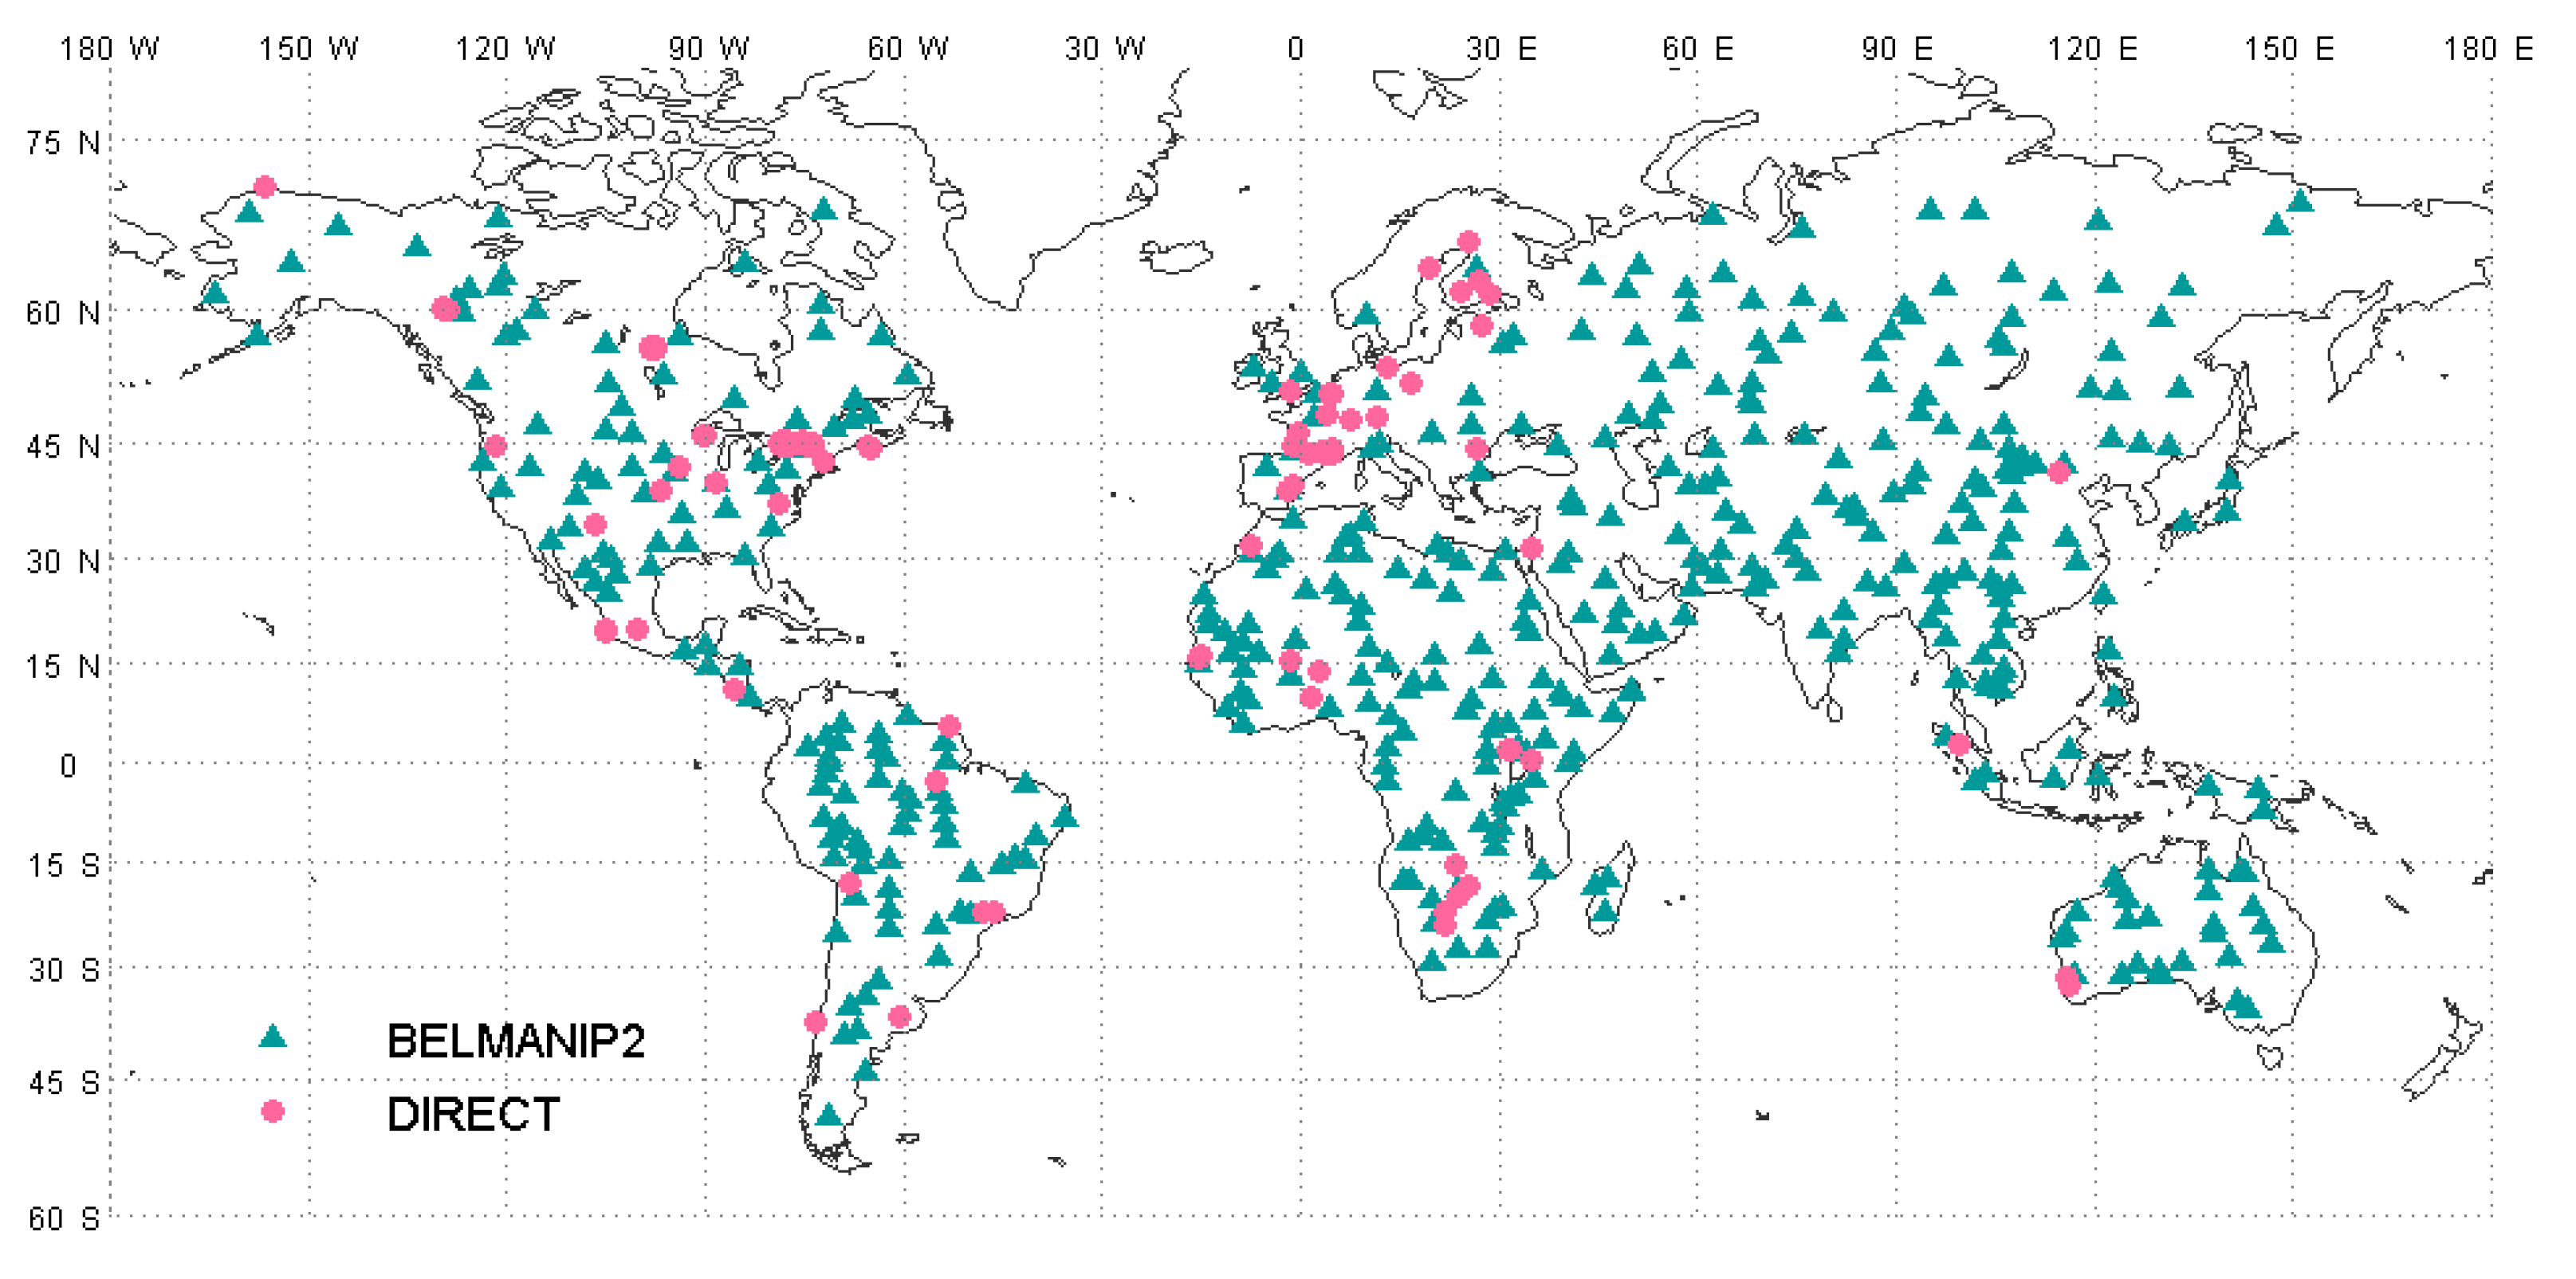
Inter-comparison of the surface reflectance products from different sensors can be used to evaluate their performance and check their inter-consistency. The MODIS data are accurately calibrated and the surface reflectance product has been validated through the various stage (up to Stage III) defined by the MODIS land validation approach [
16]. Thus, the MODIS surface reflectance product can be considered as a good reference to evaluate the AVHRR surface reflectance product. The AVHRR surface reflectance and MODIS Aqua data over the BELMANIP2 (BEnchmark Land Multisite ANalysis and Intercomparison of Products) sites were intercompared, using the directional correction [
17]. BELMANIP2 is an updated version of BELMANIP1 [
18] that aims at providing a representative set of relatively flat and homogenous sites sampling the variability of land surface type and state over the globe. The original BELMANIP2 dataset included 445 sites (
Figure 1).
2.3.6. Agriculture Application
As a demonstration of the utility of the LCDR, we apply the methods developed by [
7,
8] to test the performance of the AVHRR data to monitor wheat yield. These methods are based on the assumption that the yield is positively and linearly correlated to the seasonal maximum NDVI (adjusted for background noise) at the administrative unit (AU, county, or oblast) level and to the purity of the wheat signal (percentage of wheat within the pixel). Becker-Reshef [
7] developed a regression model that was calibrated and applied at the state level in Kansas using MODIS data and proved to be directly applicable at the national level in Ukraine. Looking for an improvement in the timeliness of the yield forecast, Franch [
8] enhanced the method from Becker-Reshef [
7] by including growing degree day (GDD) information. With this method a reliable forecast can be made between 30 days to 45 days prior to the peak NDVI (i.e., 60 to 75 days prior to harvest), while keeping an accuracy of 10% in the yield forecast. Note that this method provides the same yield results than Becker-Reshef [
7] when the yield forecast is applied during the date of the NDVI peak. In this work, we evaluate the yield model’s applicability to AVHRR.
3. Results
3.1. Geolocation
Geolocation is an important prerequisite to ensure consistency in the land time-series of observations [
19]. A number of physical effects such as clouds, atmospheric contamination and surface anisotropy require compositing multiple daily orbits into a single dataset [
15,
20]. Achieving a high-level accuracy of relative geolocation is a critical step for each orbit [
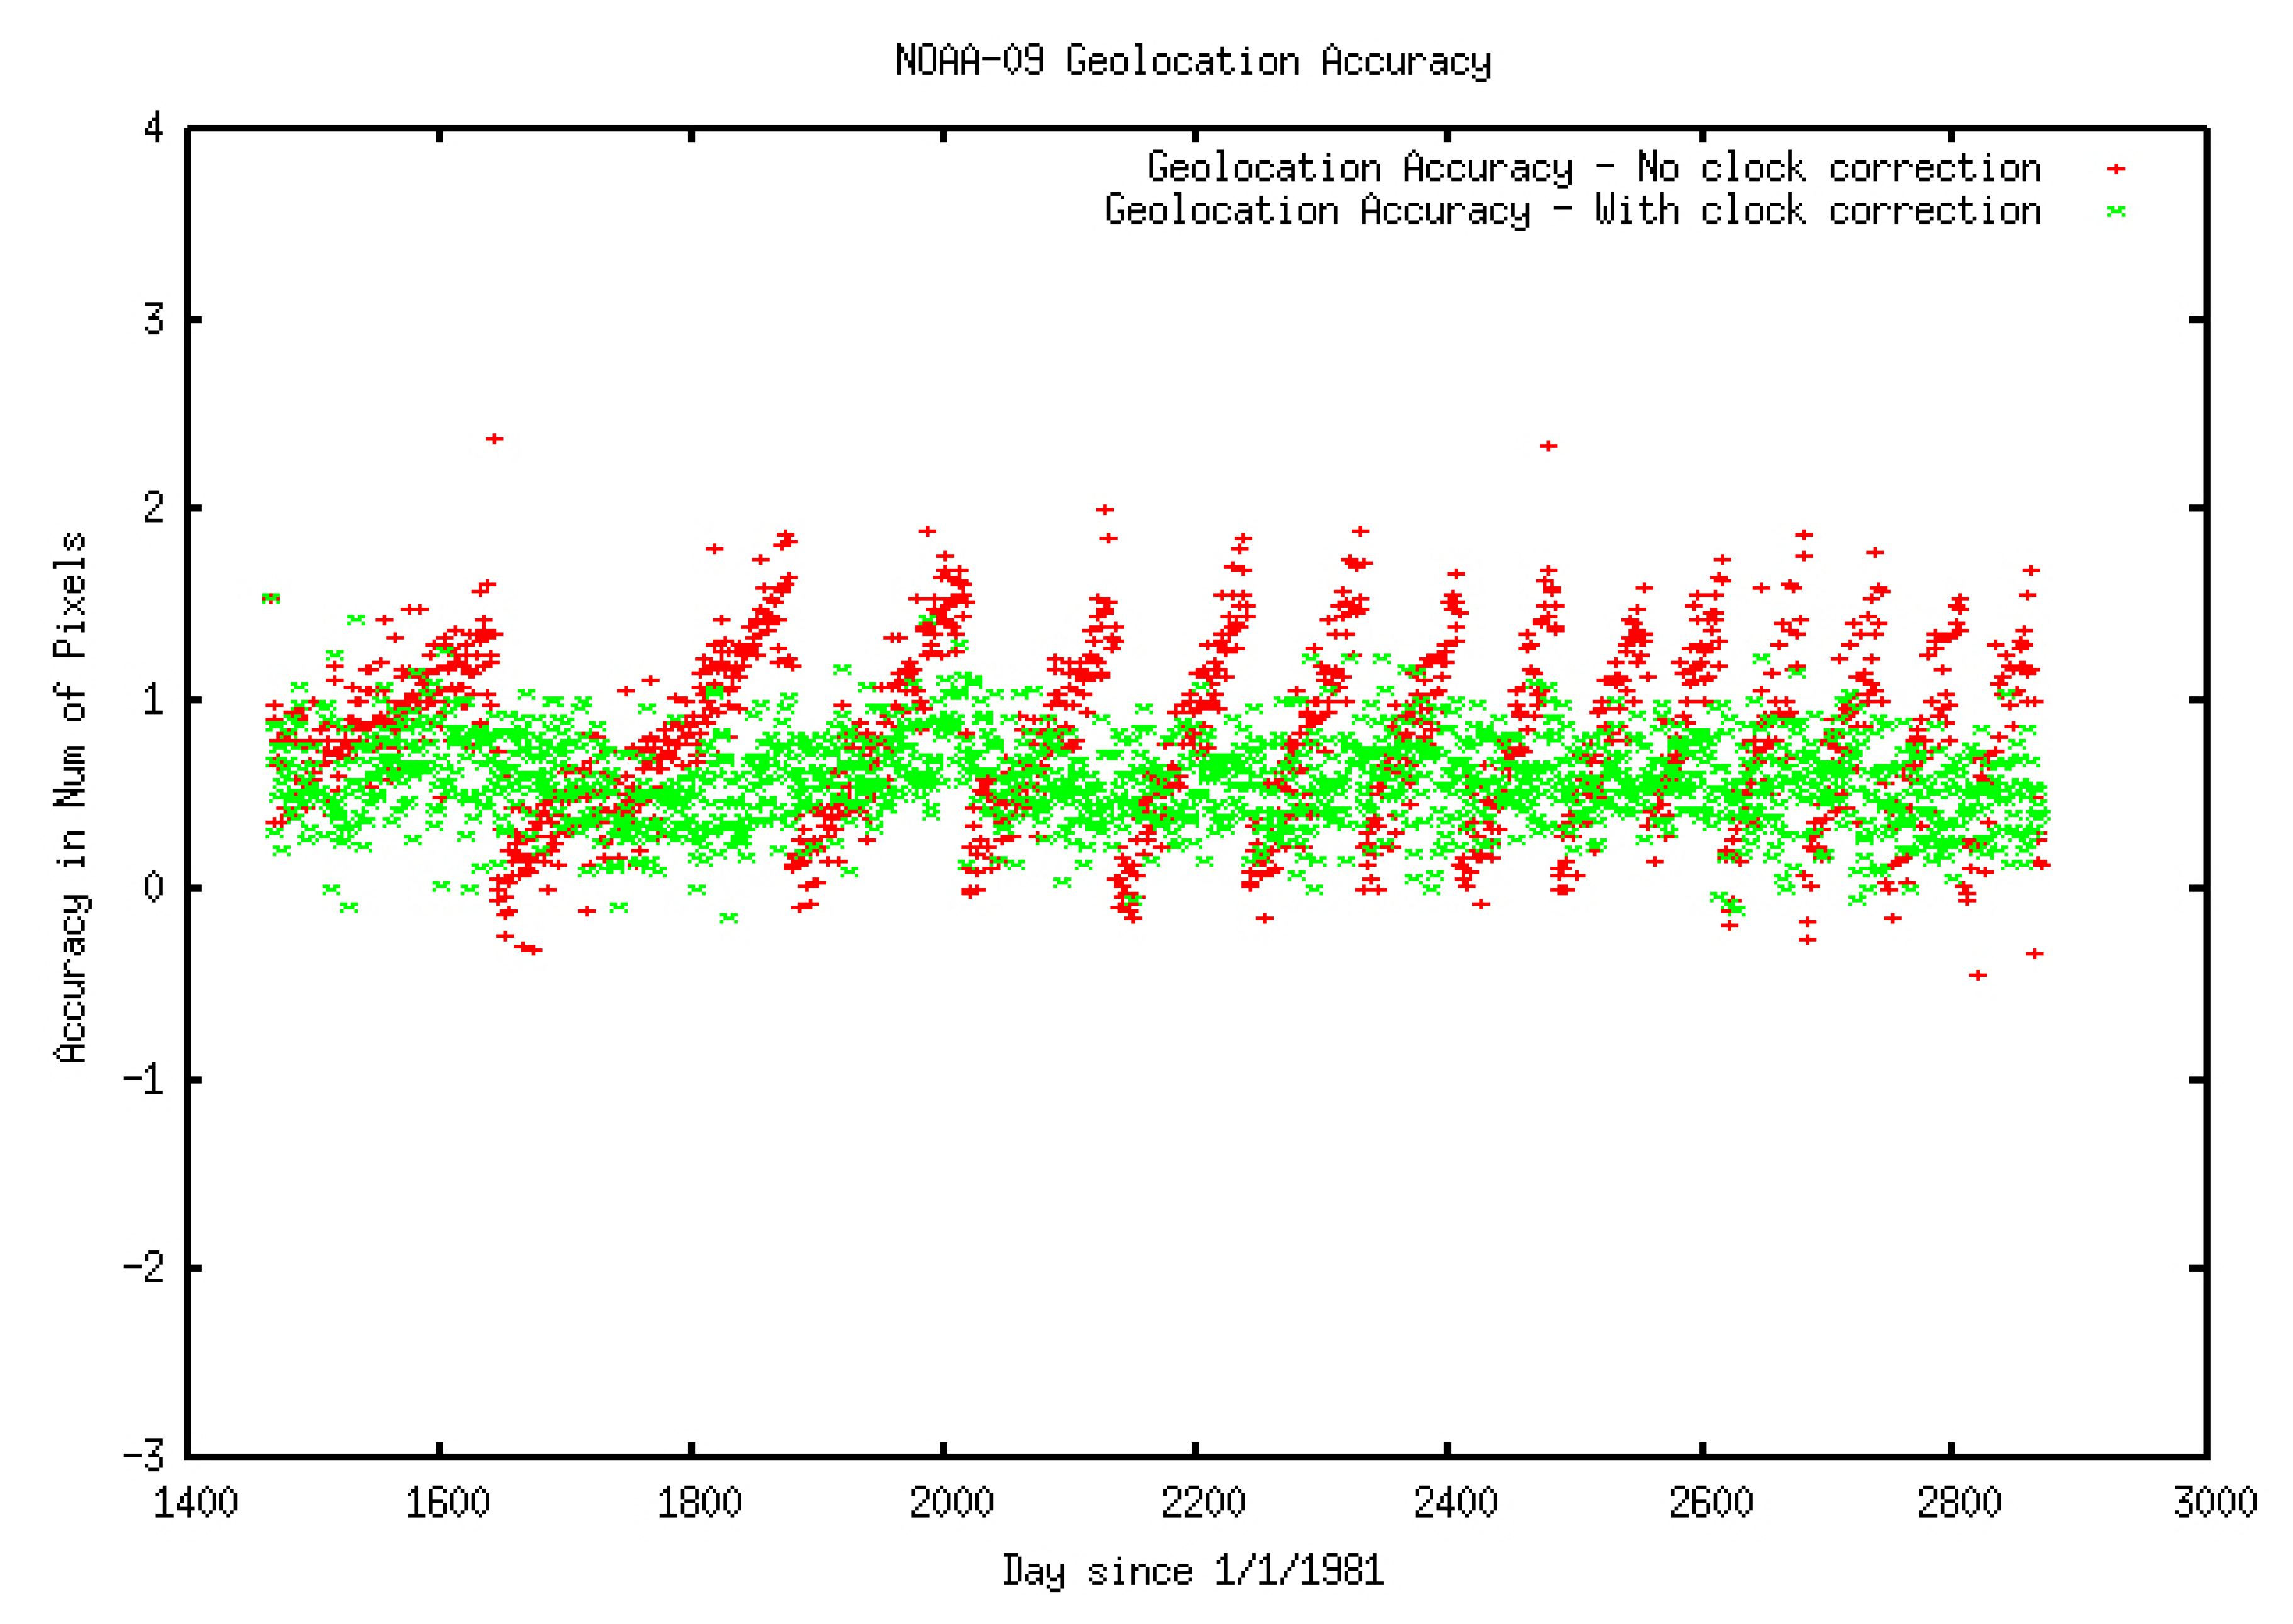
21]. Therefore, major efforts are made in geometric correction and the assessment of geolocation accuracy. The accuracy of this correction was assessed by using the coastal chips database as a reference. When the on-board clock was reset, a discontinuity in the accuracy is introduced (
Figure 2, red dots). The clock correction approach developed by [
22] significantly improves the geolocation accuracy (
Figure 2, green dots).
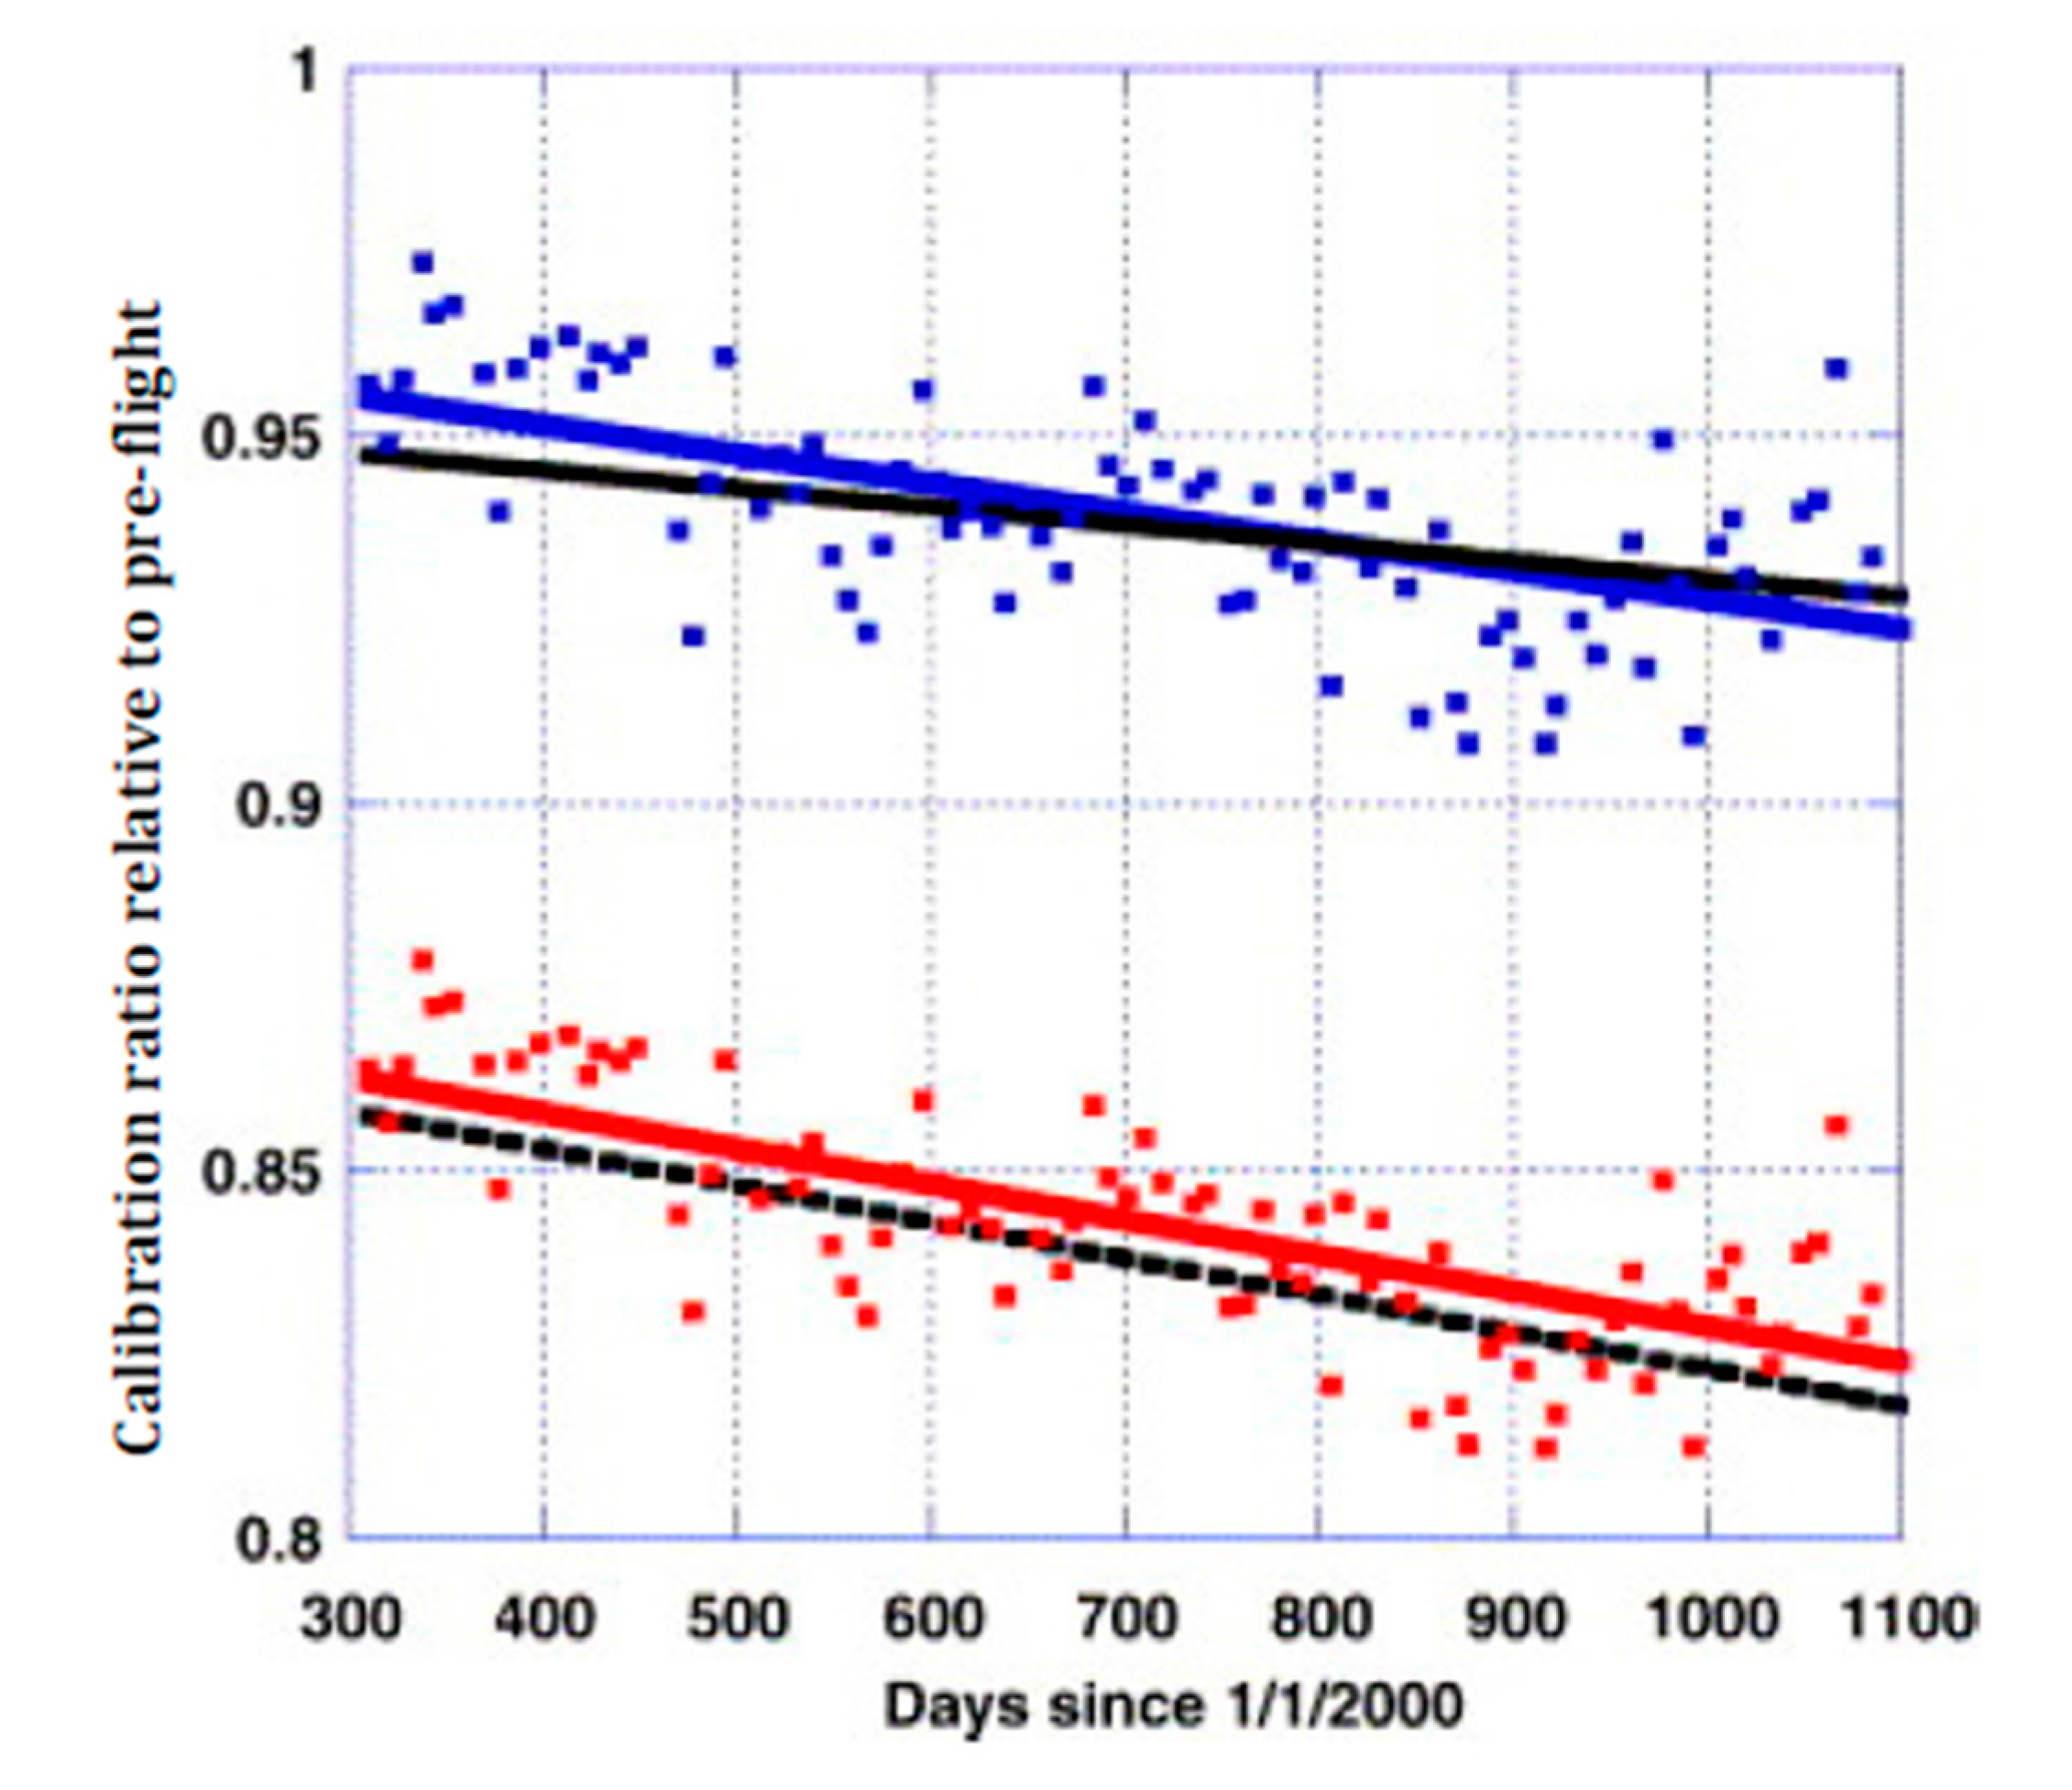
3.2. Calibration Monitoring
Accurate radiometric calibration is a prerequisite to creating a science-quality time-series of BRDF-corrected surface reflectance and, consequently, higher order downstream products. Calibration errors can propagate directly into the surface reflectance and create artificial variations that can be misinterpreted as trends, especially if these variations are due to a slow decay in the calibration mechanism. Vicarious calibration provides an additional source of calibration information, to verify and evaluate on-board calibration. As mentioned in the methods section, we will use the approach of [
3] for cross-calibration of AVHRR with MODIS to monitor the calibration in the visible to shortwave infrared bands and to provide correction terms as needed (
Figure 3). To assess this approach, Vermote, et al. [
3] applied it to transfer the MODIS Terra calibration to the MODIS Aqua instrument. When applied to a stable desert ground site in Niger, the results of this approach agreed to within 1% of the MODIS Aqua on-board solar diffuser [
3]. The calibration coefficients used are available from the project website (
http://ltdr.nascom.nasa.gov).
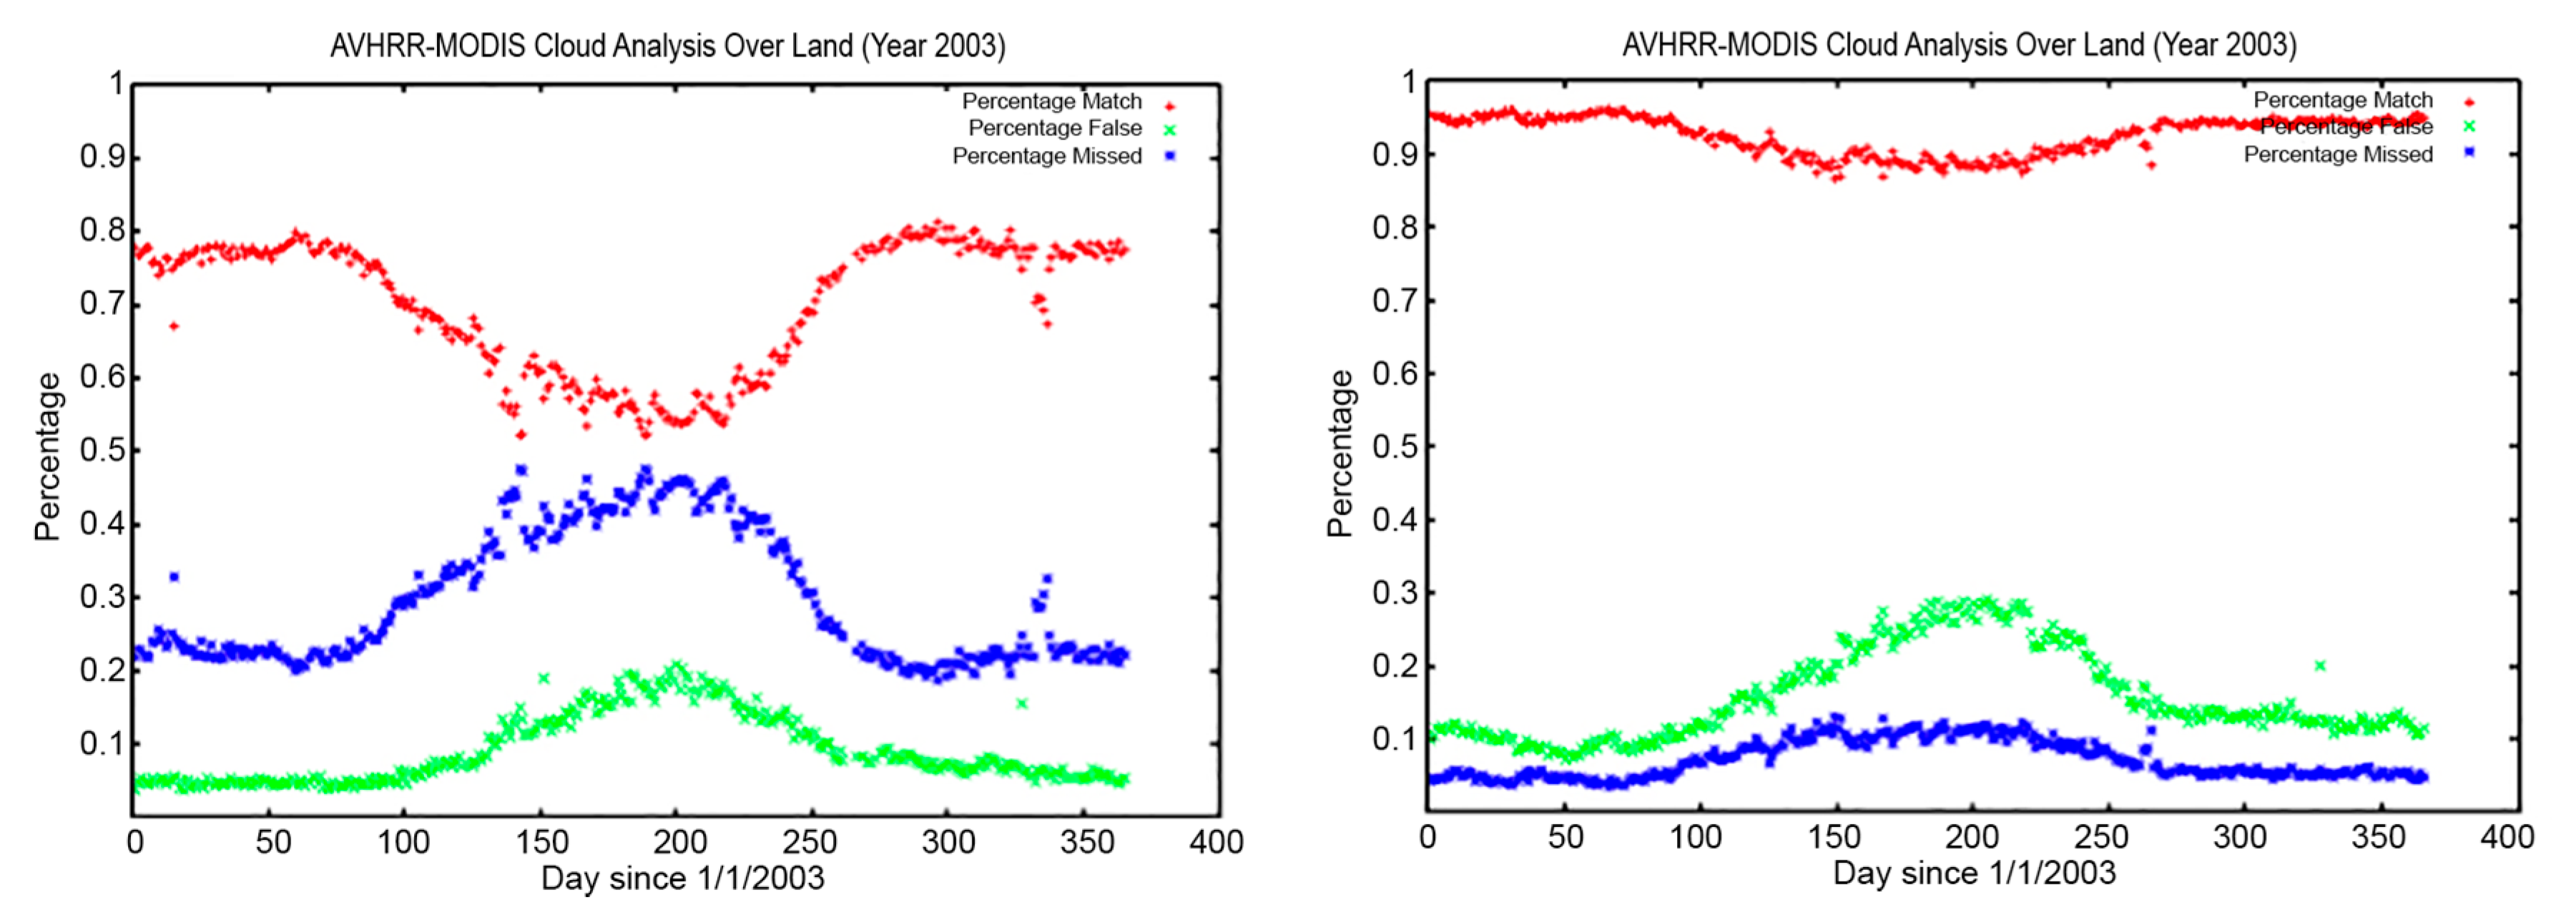
3.3. Cloud Mask
While the validation of surface reflectance is facilitated by AERONET data, the validation of the cloud mask remains a significant challenge. To verify the improvement in the cloud mask, we have undertaken an inter-comparison between the AVHRR cloud mask with the MODIS Aqua cloud mask for near-coincident (in time) observations.
Figure 4 shows the evaluation of the improved AVHRR cloud mask, where the agreement with MODIS Aqua is higher than 90% compared to an average 60% agreement for the CLAVR cloud mask.
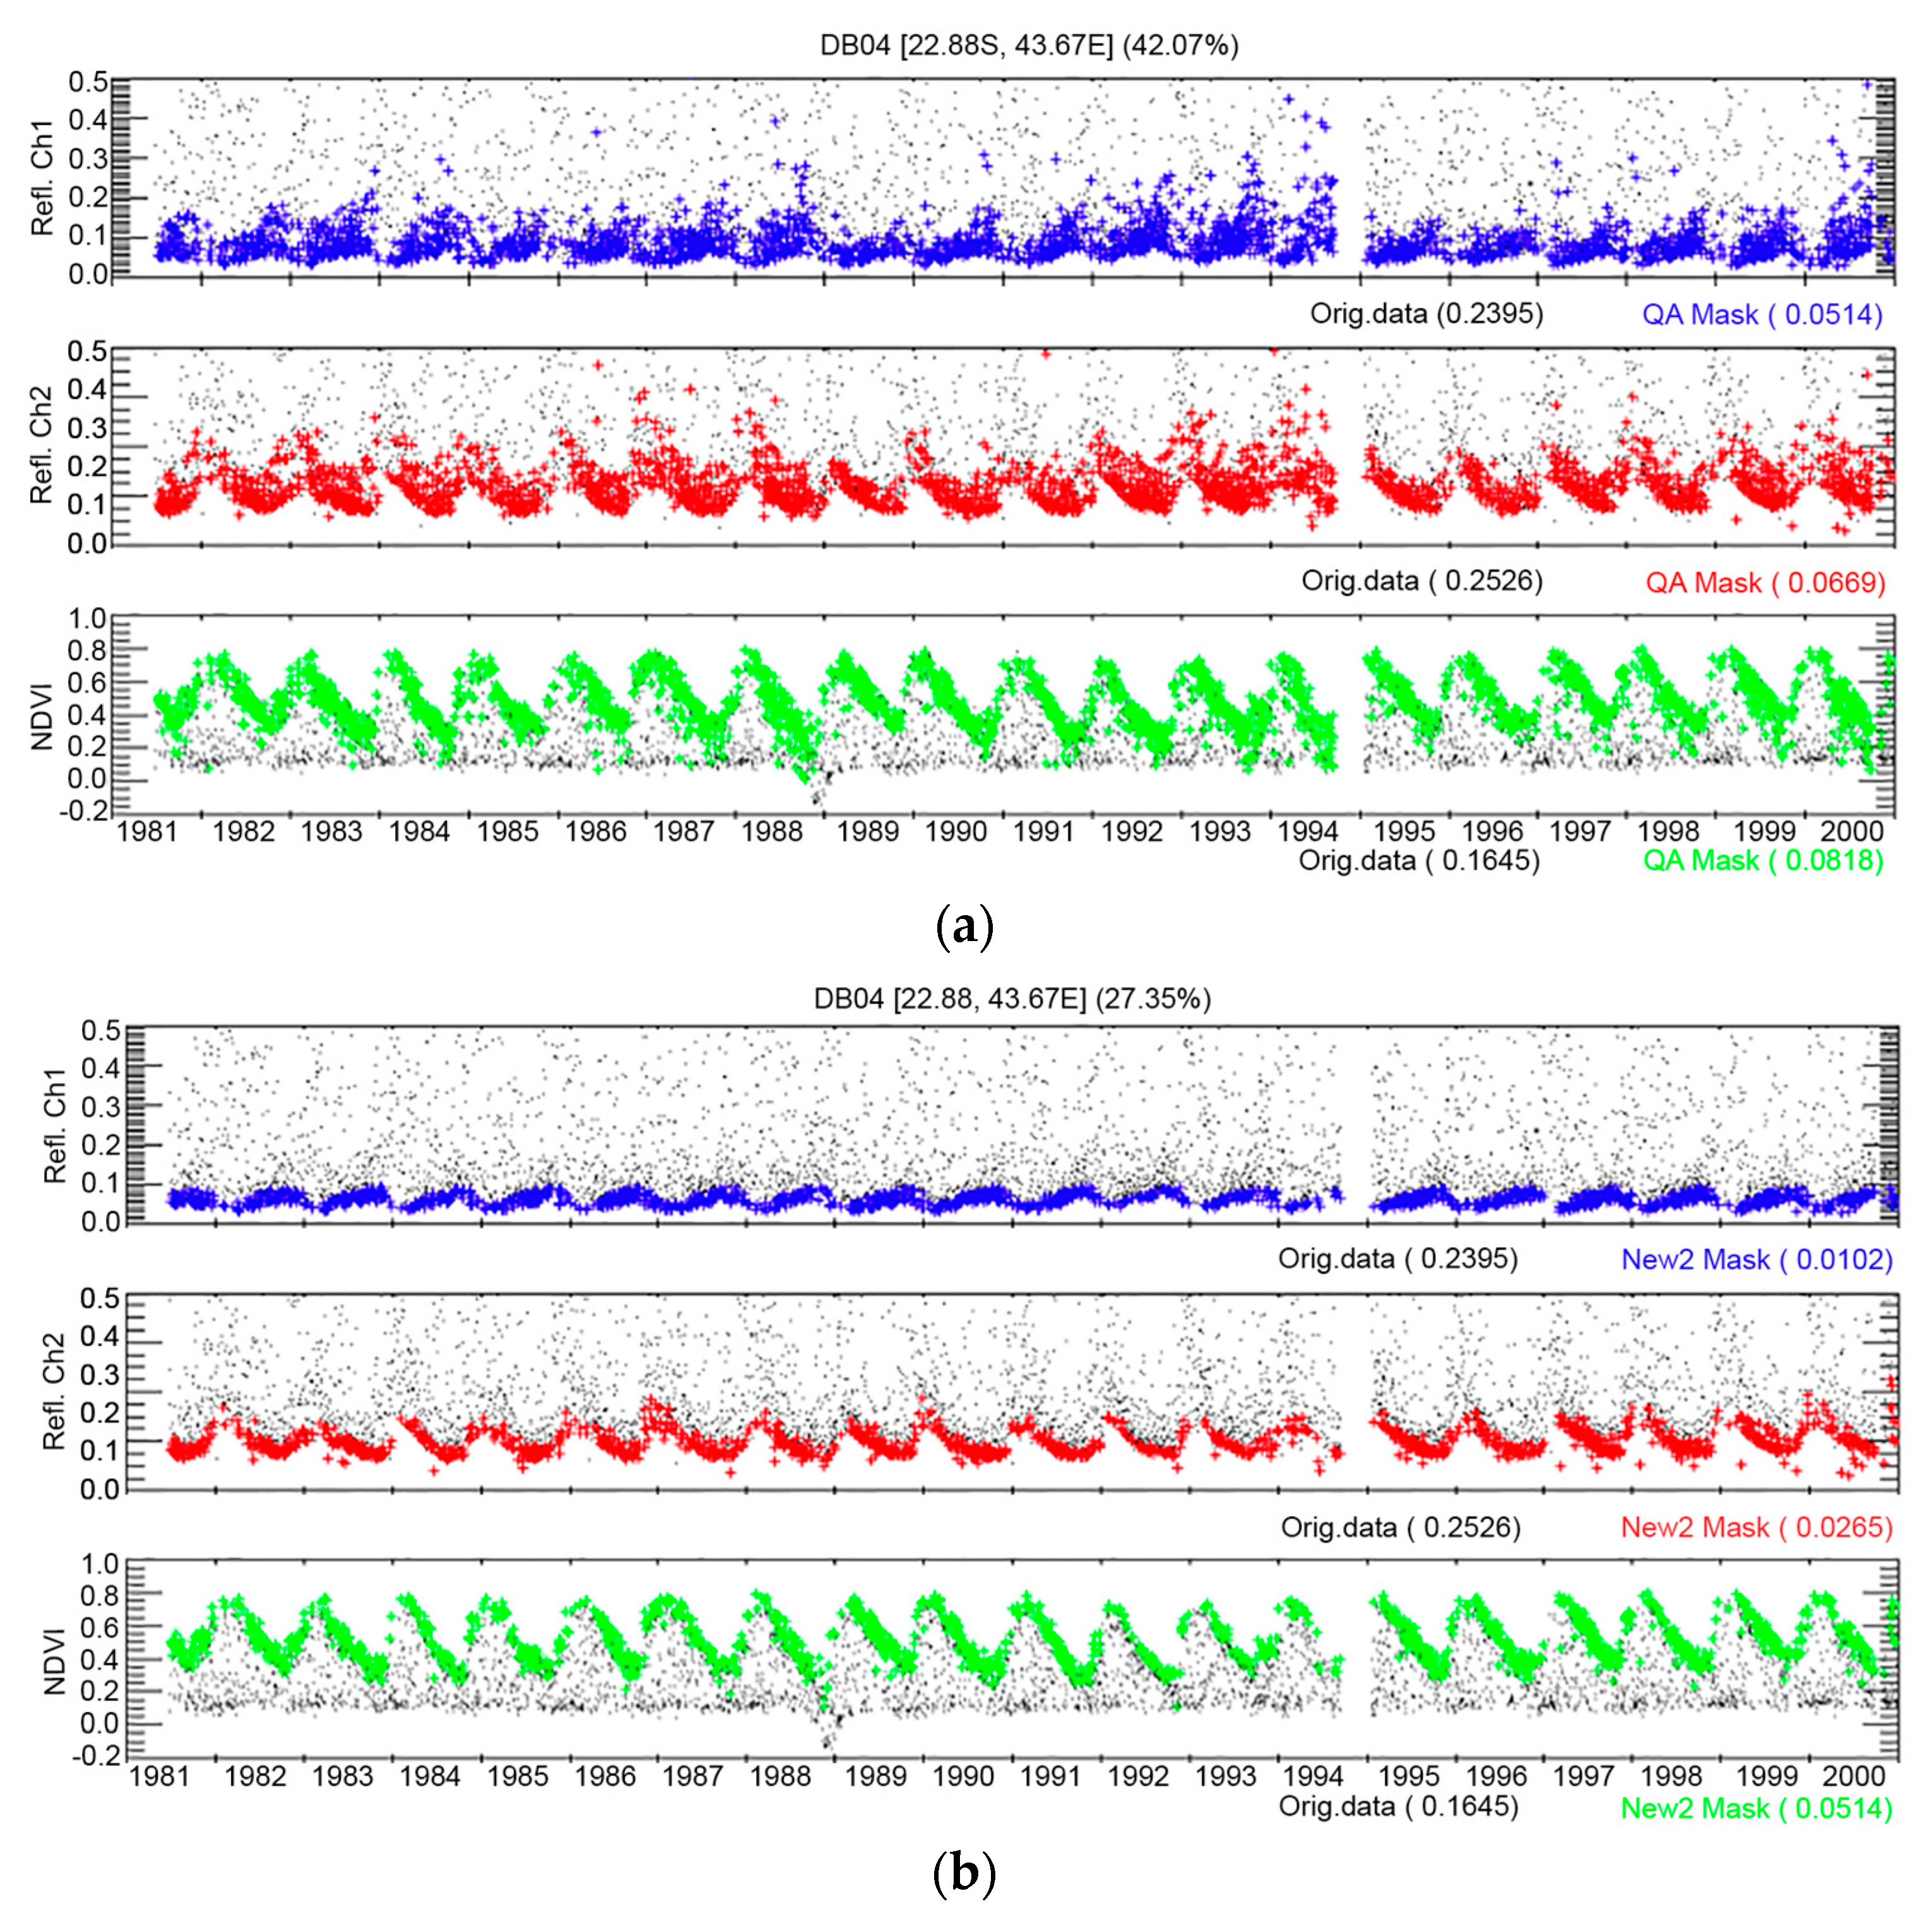
Figure 5 shows the time-series evolution of the surface reflectance of channel 1 (blue) and channel 2 (red), as well as the NDVI (green) over one BELMANIP2 site (see
Section 2.3.4 for a description of the BELMANIP2 sites) located in Madagascar, using the CLAVR cloud mask (
Figure 5a) and the LCDR cloud mask (
Figure 5b). These plots show a strong reduction of noise when using the LCDR cloud mask in channel 1 (from 0.05 to 0.01), channel 2 (from 0.07 to 0.03), and the NDVI (from 0.08 to 0.05).
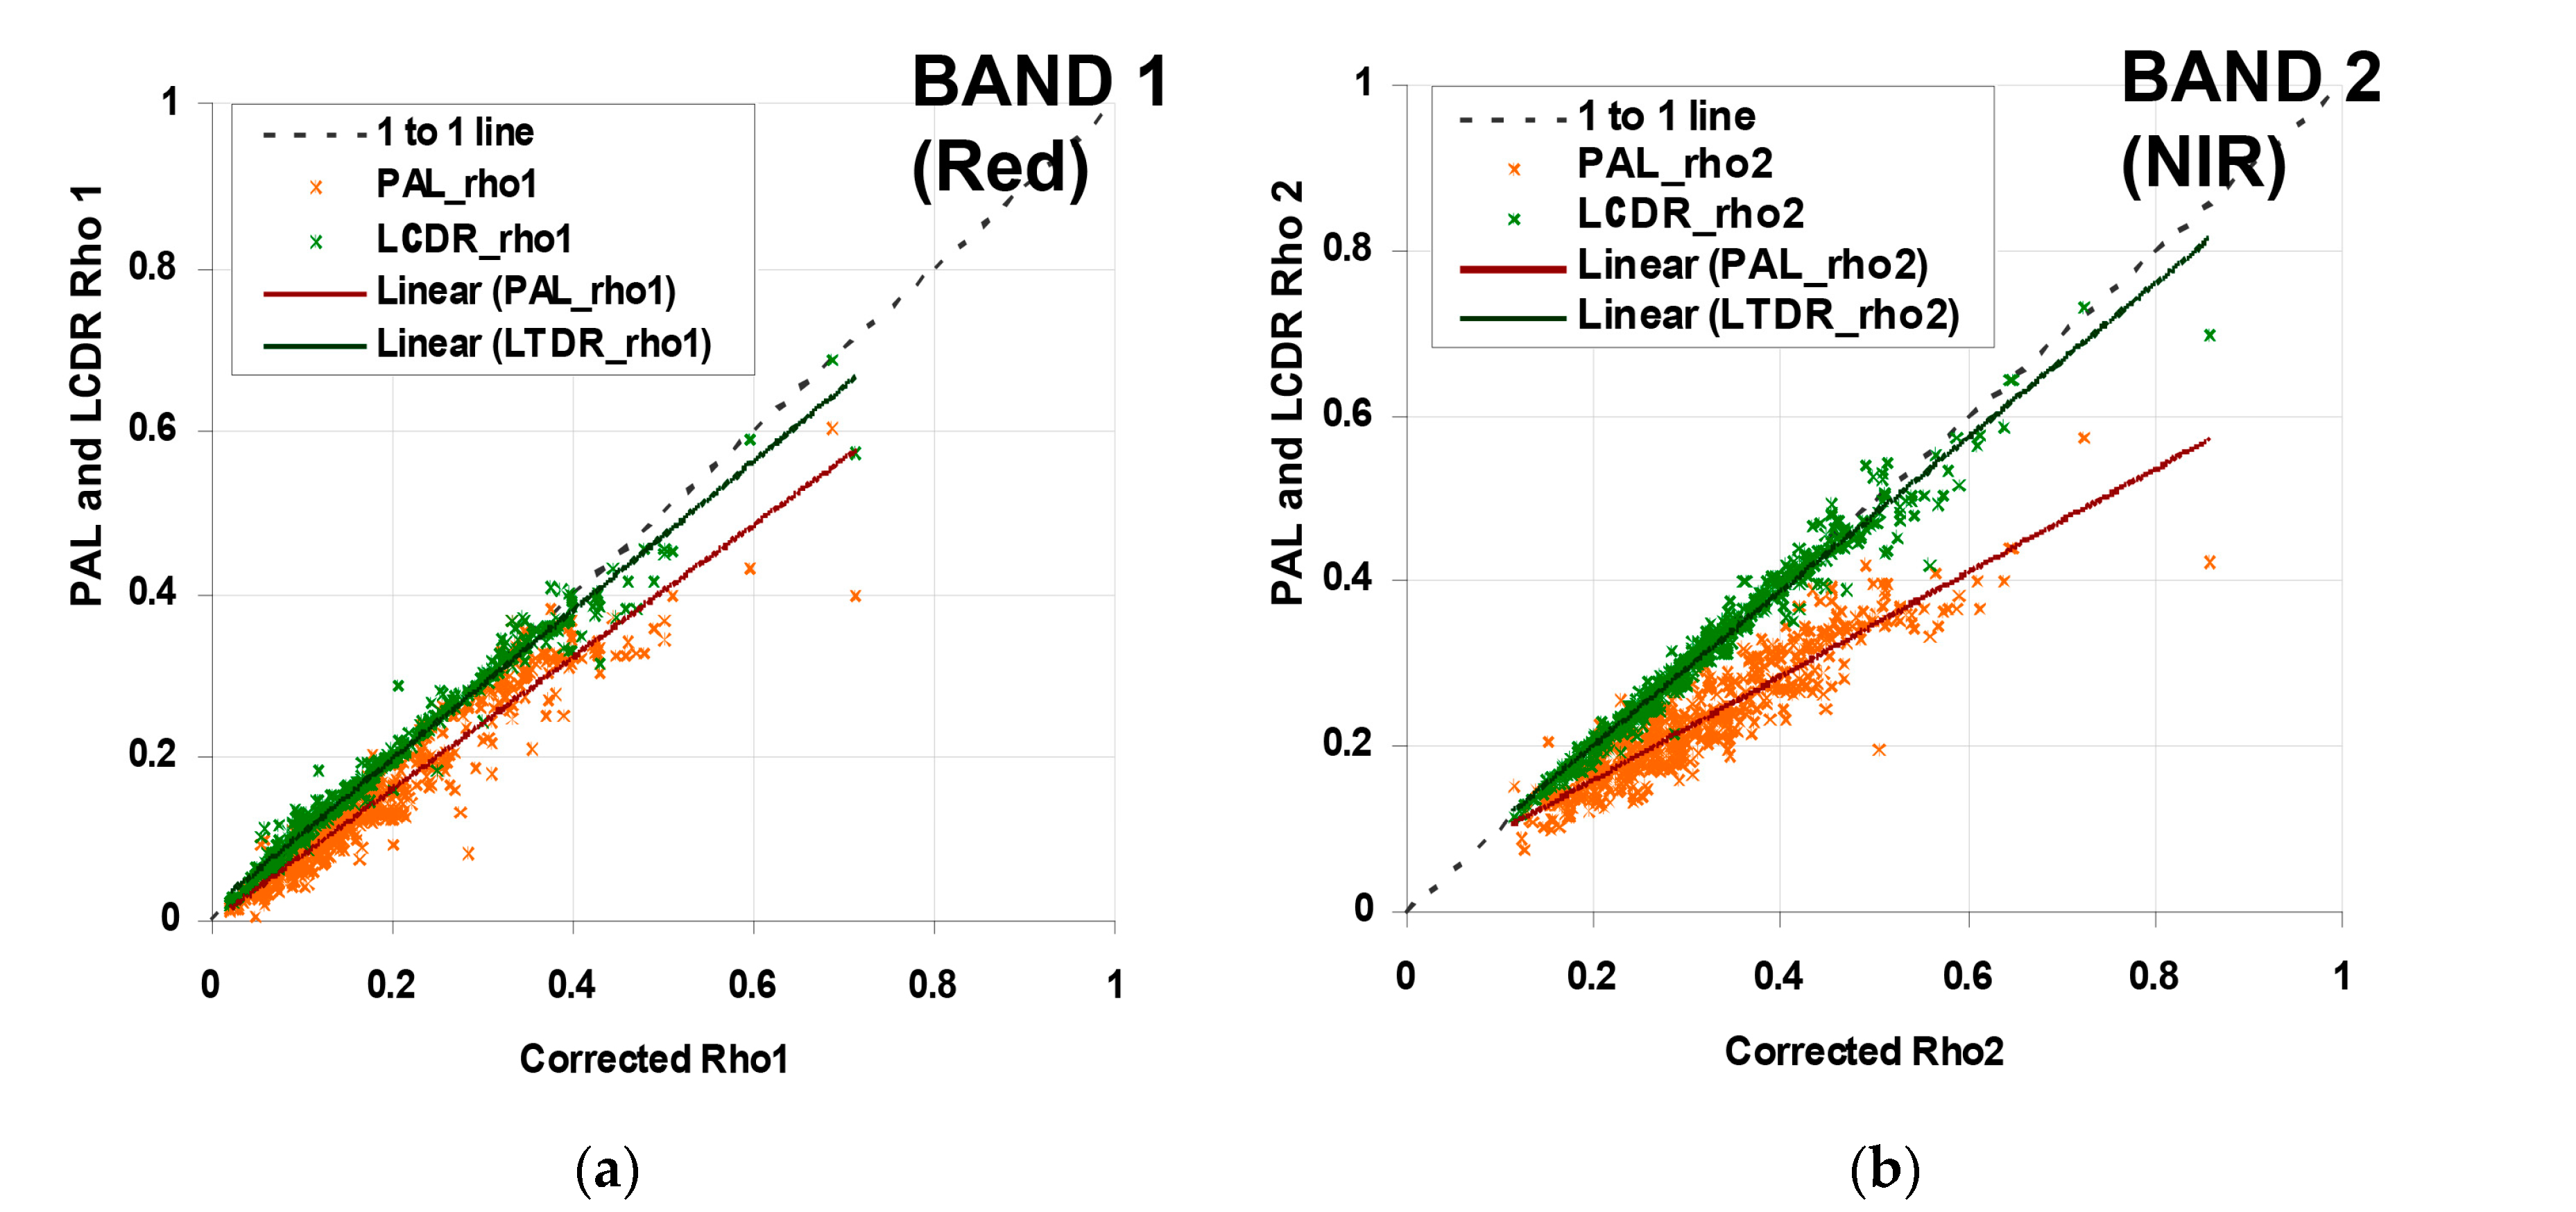
3.4. Surface Reflectance Accuracy Assessment
We have analyzed a comprehensive estimate of the performance of the AVHRR surface feflectance for 1999 over the AERONET sites [
15]. The performance was evaluated along with Pathfinder AVHRR Land (PAL) daily products [
23] over 48 sites distributed across the globe [
9]. Atmospheric data from AERONET sun photometers at each site [
17] were used as the input to the 6S radiative transfer model [
13] to atmospherically correct the top of the atmosphere AVHRR data to determine surface reflectance values for channels 1 and 2.
Figure 6a shows that the AVHHR data for channel 1 follow the one-to-one line very closely. Similarly,
Figure 6b shows the AVHRR results for channel 2, with good correlation for surface reflectance values up to ~0.5, although the PAL data are further from the 1-to-1 line.
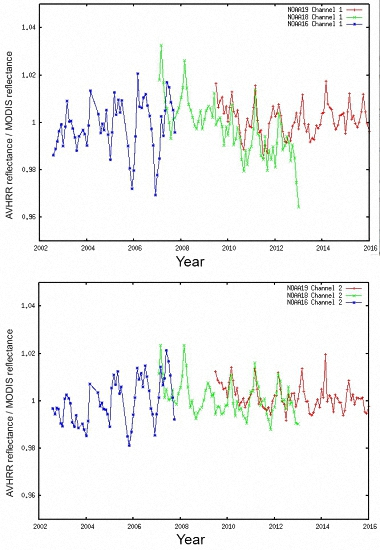
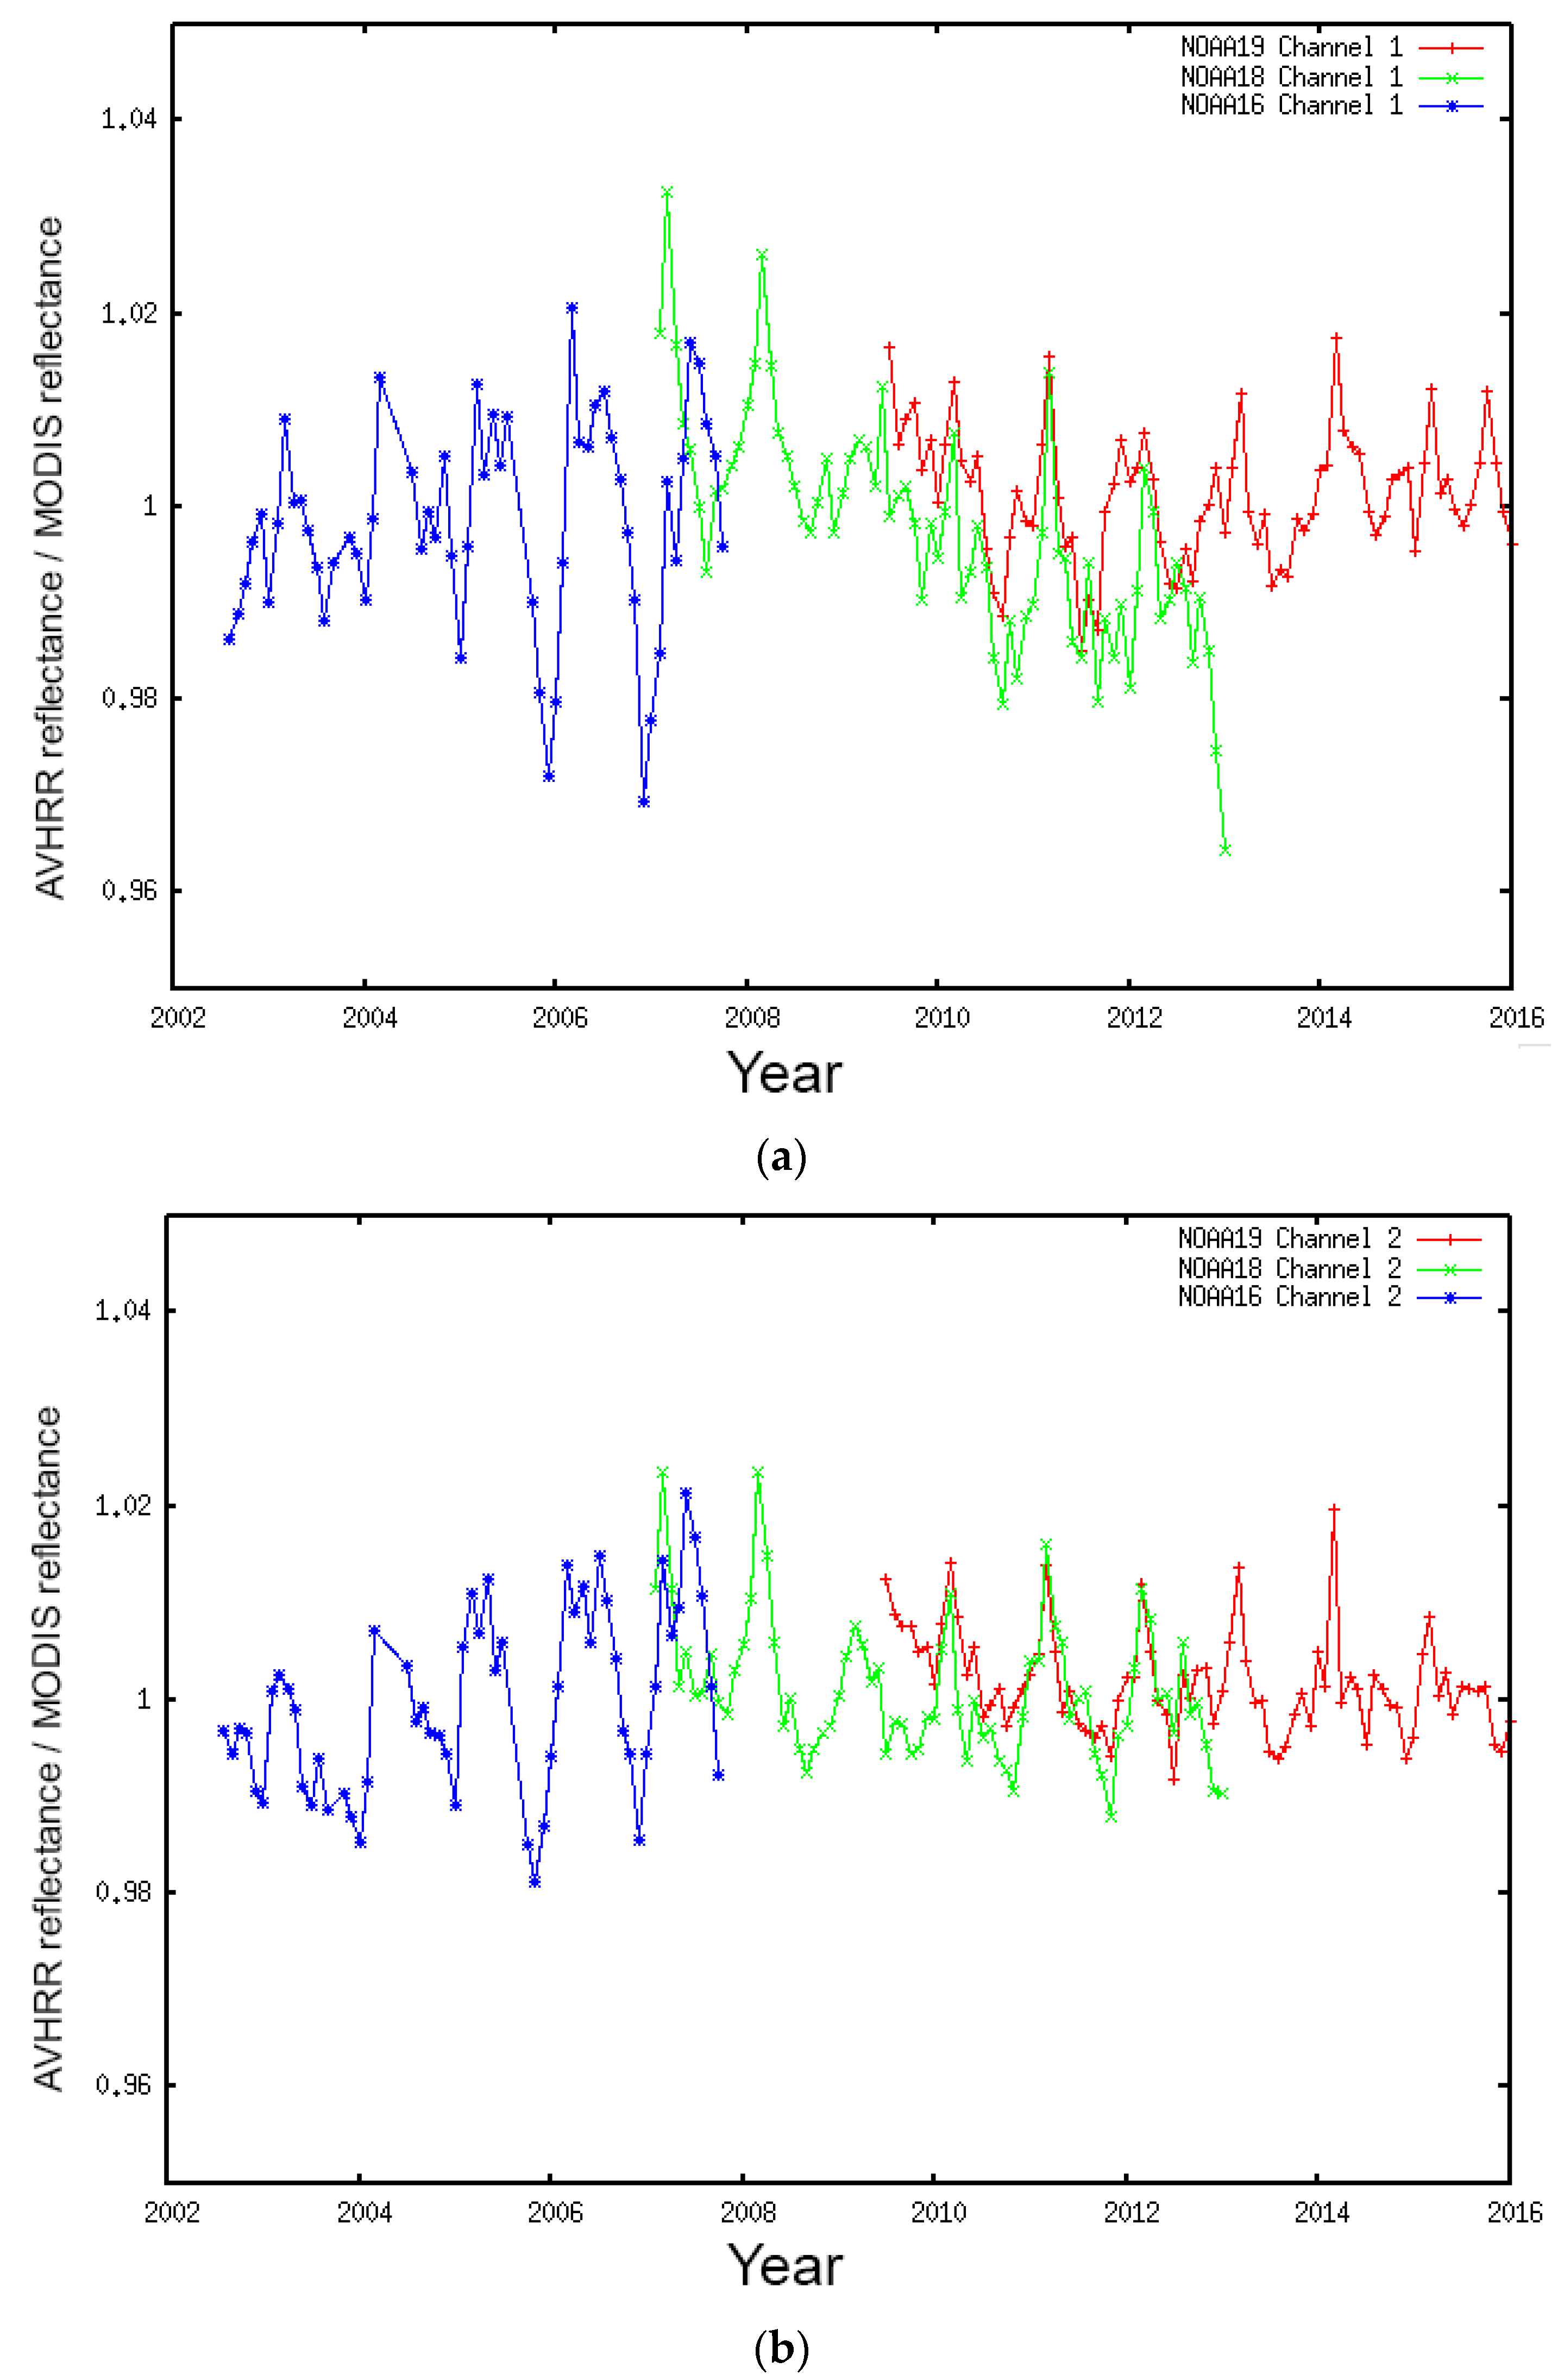
3.5. Direct Intercomparison of the Surface Reflectance Products
Figure 7 shows the cross-comparison of AVHHR data with MODIS over the BELMANIP2 sites. The monthly averaged ratios of the observed (AVHRR data) and the predicted reflectance (MODIS Aqua corrected reflectance at AVHRR spectral and directional conditions) for AVHRR channel 1 (
Figure 7a) and channel 2 (
Figure 7b) are plotted as a function of time [
3]. The plots show a consistent evolution of the ratios for the different sensors (NOAA16, NOAA18, and NOAA19) and for the two channels with values close to one. It should be noted that, at the beginning of each mission, there are discrepancies between sensors [
24] (beginning of the NOAA18 record with NOAA16 and beginning of the NOAA19 record with NOAA18); this is expected during the outgassing period where both the thermal bands are not stable and the calibration in the red and near infrared is evolving quickly.
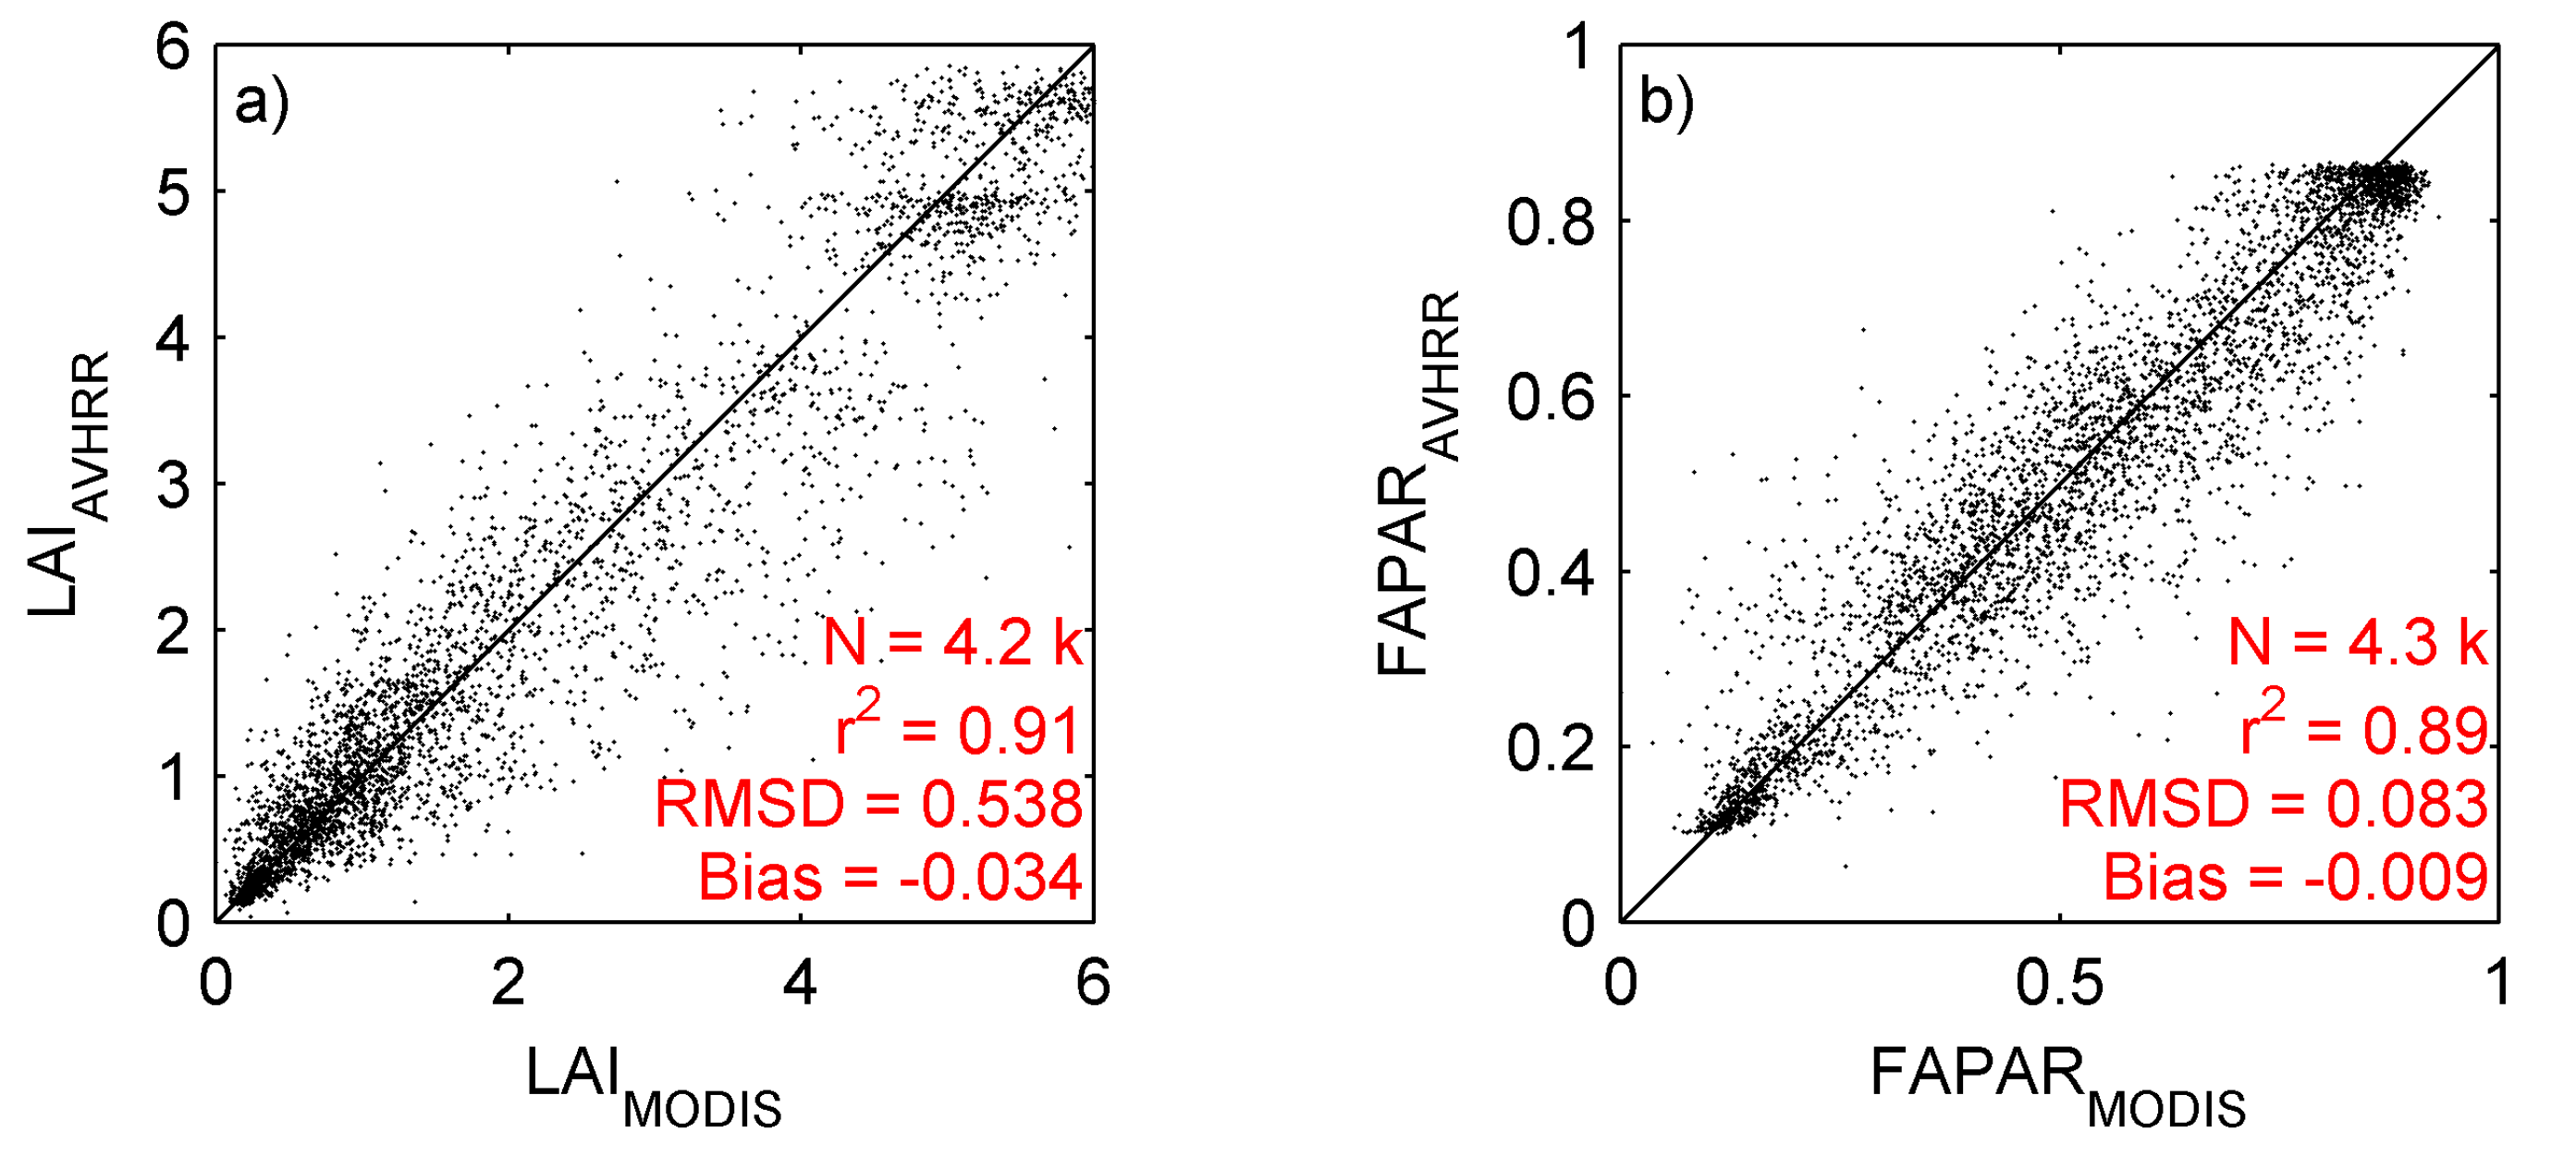
3.6. Derived LAI/FAPAR Products
Using AVHRR surface reflectance, a LAI/FAPAR product (AVH15C1 product) was derived [
25]. The algorithm relies on artificial neural networks (ANN) trained using MODIS LAI/FAPAR products and AVHRR surface reflectance products, acquired over BELMANIP-2 sites from 2001 to 2007. A full description of the algorithm and its evaluation process is given in [
26]. Using different sites than the ones used for training (DIRECT network [
27],
Figure 1),
Figure 8 shows that the MODIS and AVHRR LAI/FAPAR are well correlated (r
2 ~ 0.9). However, a clear saturation effect is observed with high FAPAR (>0.8) values. This saturation affects mainly deciduous forest, associated with a complex 3D canopy [
26].
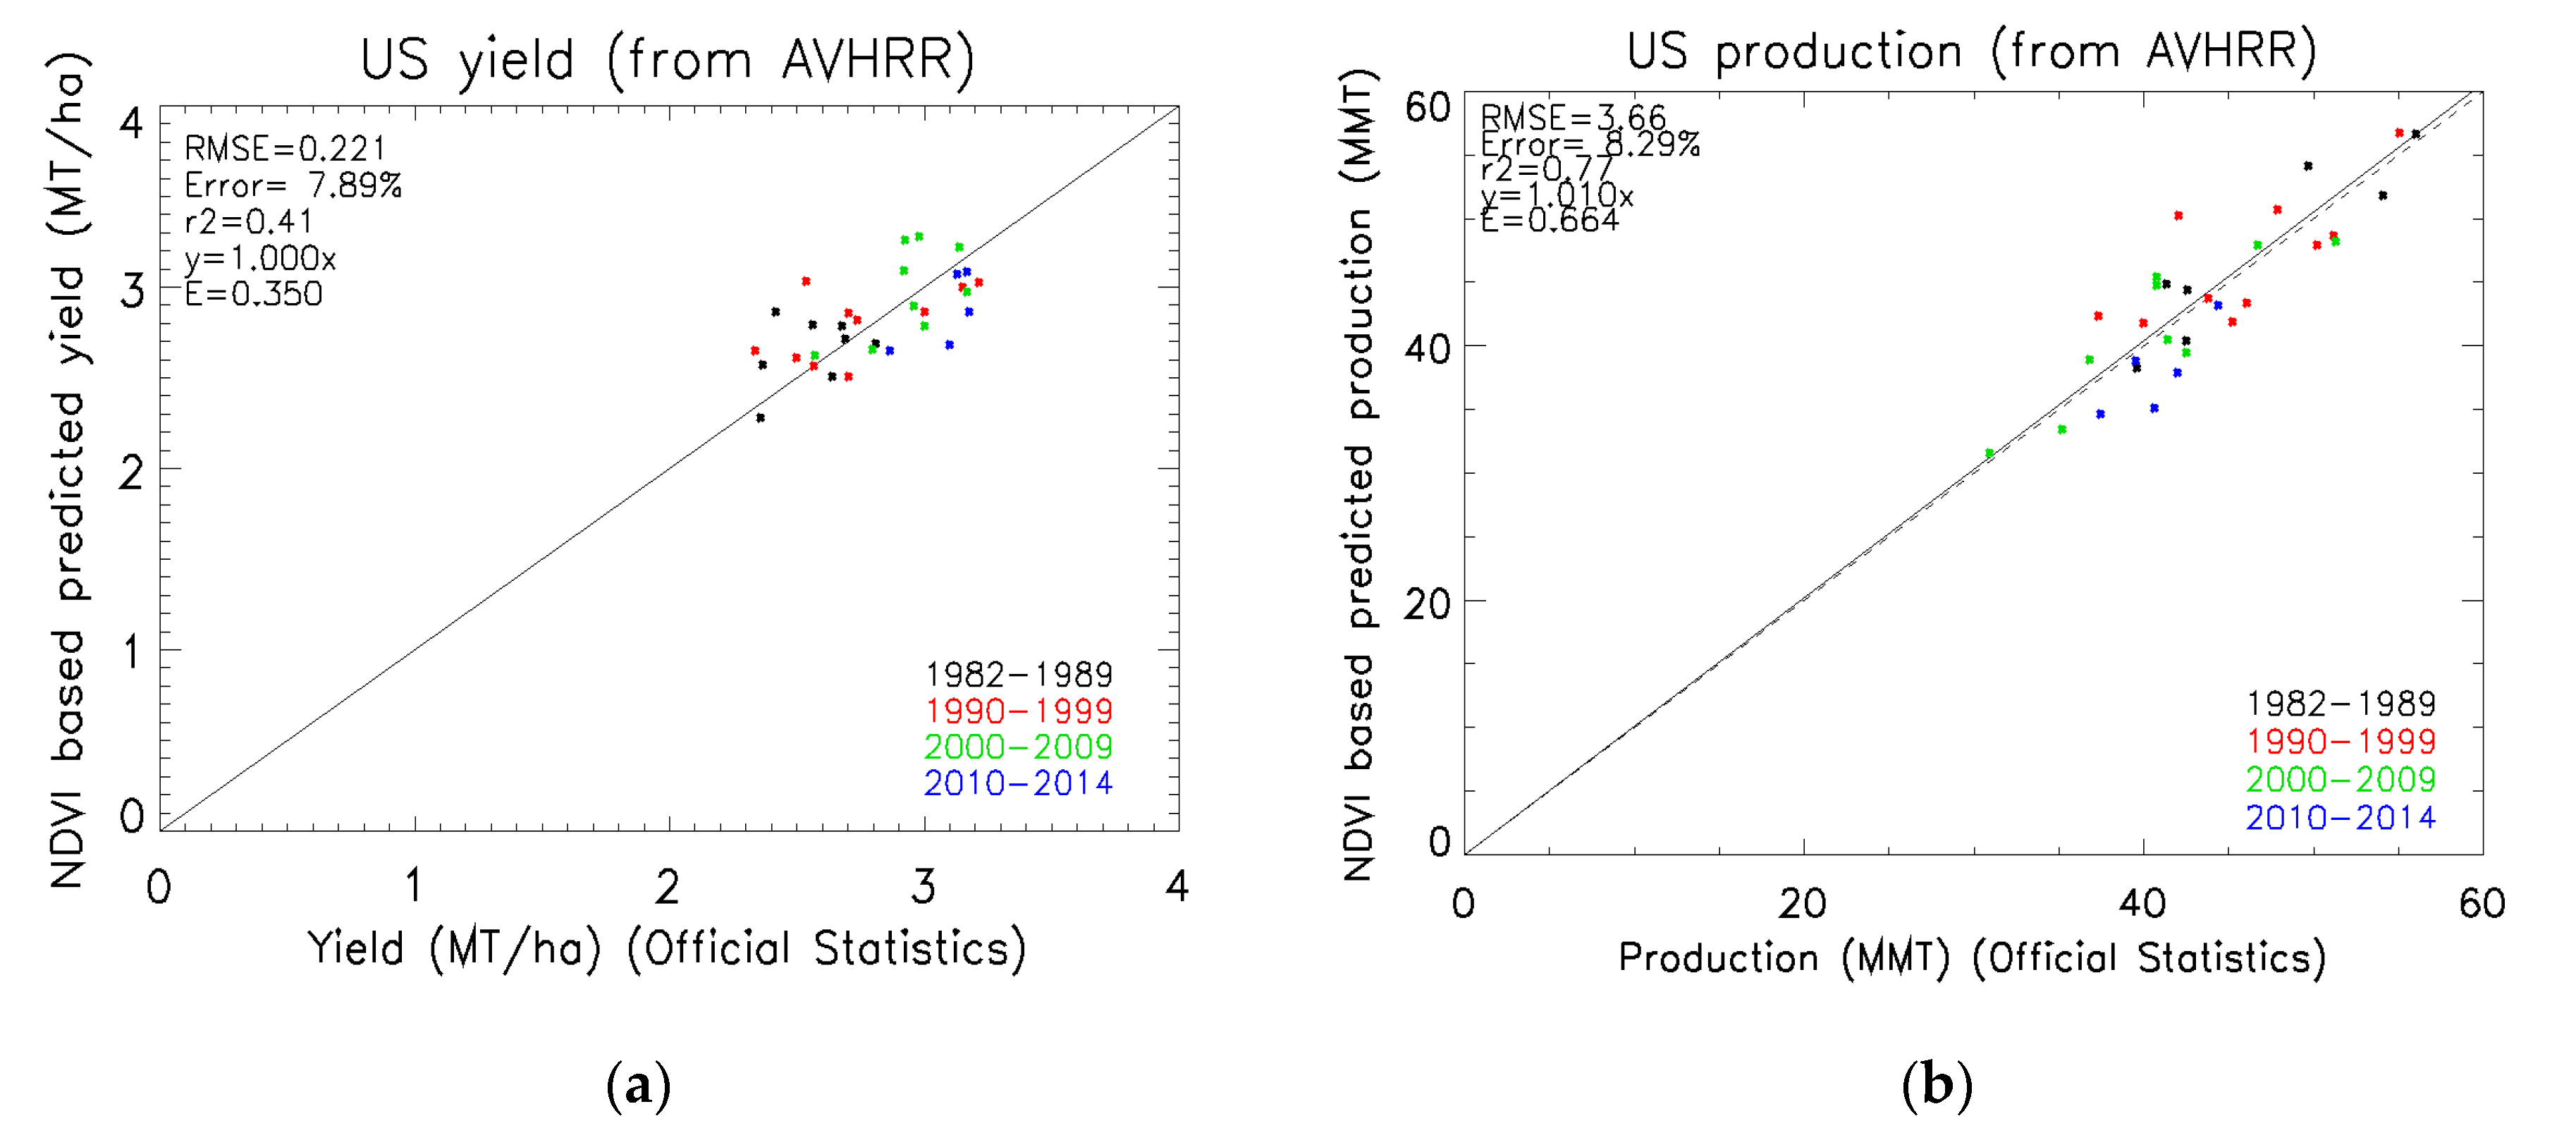
3.7. Agriculture Application
With the purpose of evaluating the applicability of the yield models to AVHRR data, we validate the methods taking advantage of the AVHRR LTDR historical data from 1982 to 2014.
Figure 9 shows the validation of the method using the AVHRR LCDR data from 1982 to 2014. Note that we removed from the analysis the year 2007 that was identified as a problem in [
7], when a late frost damaged most of the wheat crops in Kansas and Oklahoma. Comparing the statistics of these figures with the statistics presented in [
8], where the model is applied using MODIS data from 2001 to 2012, adding more years to the analysis and using Version 4 AVHRR surface reflectance data barely affects the error, keeping it at around 7%. These results confirm the good performance of the method, providing good results during the extreme years in terms of production. The statistics also display the Nash–Sutcliffe model efficiency coefficient (E) proposed by [
28]. It is defined as one minus the sum of the absolute squared differences between the predicted (P) and observed (O) values, normalized by the variance of the observed values during the period under investigation.
The range of E lies between 1.0 (perfect fit) and −∞. An efficiency of lower than zero indicates that the mean value of the observed time series would have been a better predictor than the model. Both the yield and the production show E values greater than zero.
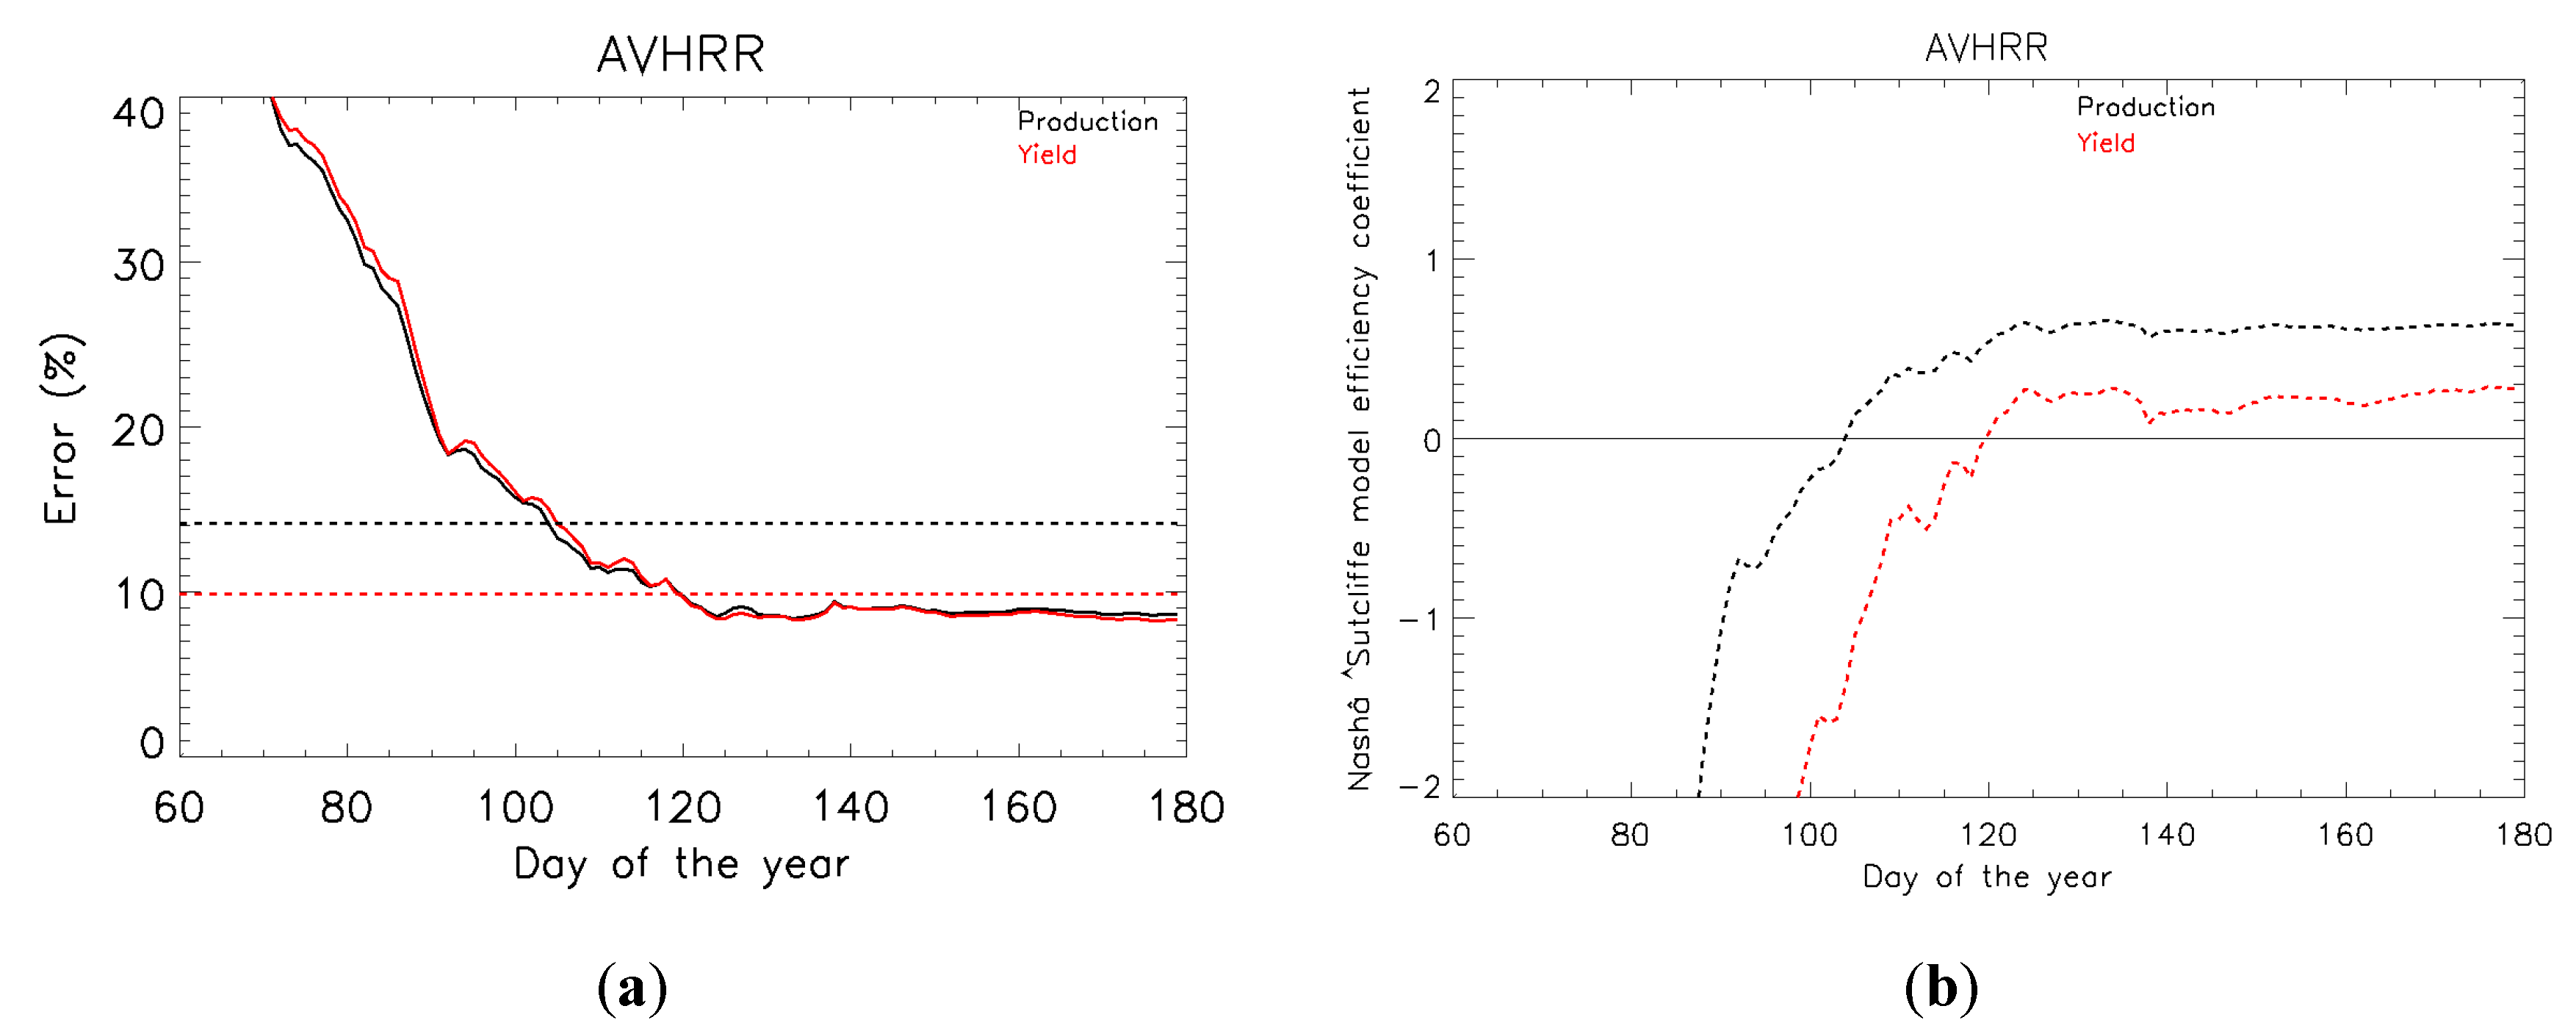
Figure 10 shows the error evolution of the yield and the production when applying the [
8] method depending on the day of the forecast. Comparing this plot to the results published in [
8] that was just based on the MODIS-era time-series, shows that the inclusion of more days in the analysis provides more stability in the error evolution. The plot also shows a horizontal line that represents the error if we assume the yield/production equal to the time series average. In order to study the feasibility of the model compared to assuming the average yield/production,
Figure 10 displays the evolution of the E coefficient. The yield forecast shows E positive values up from DOY 120 (30 April), while for the production which is corrected by the official statistics of area, the E coefficient is positive from DOY 100 (10 April).
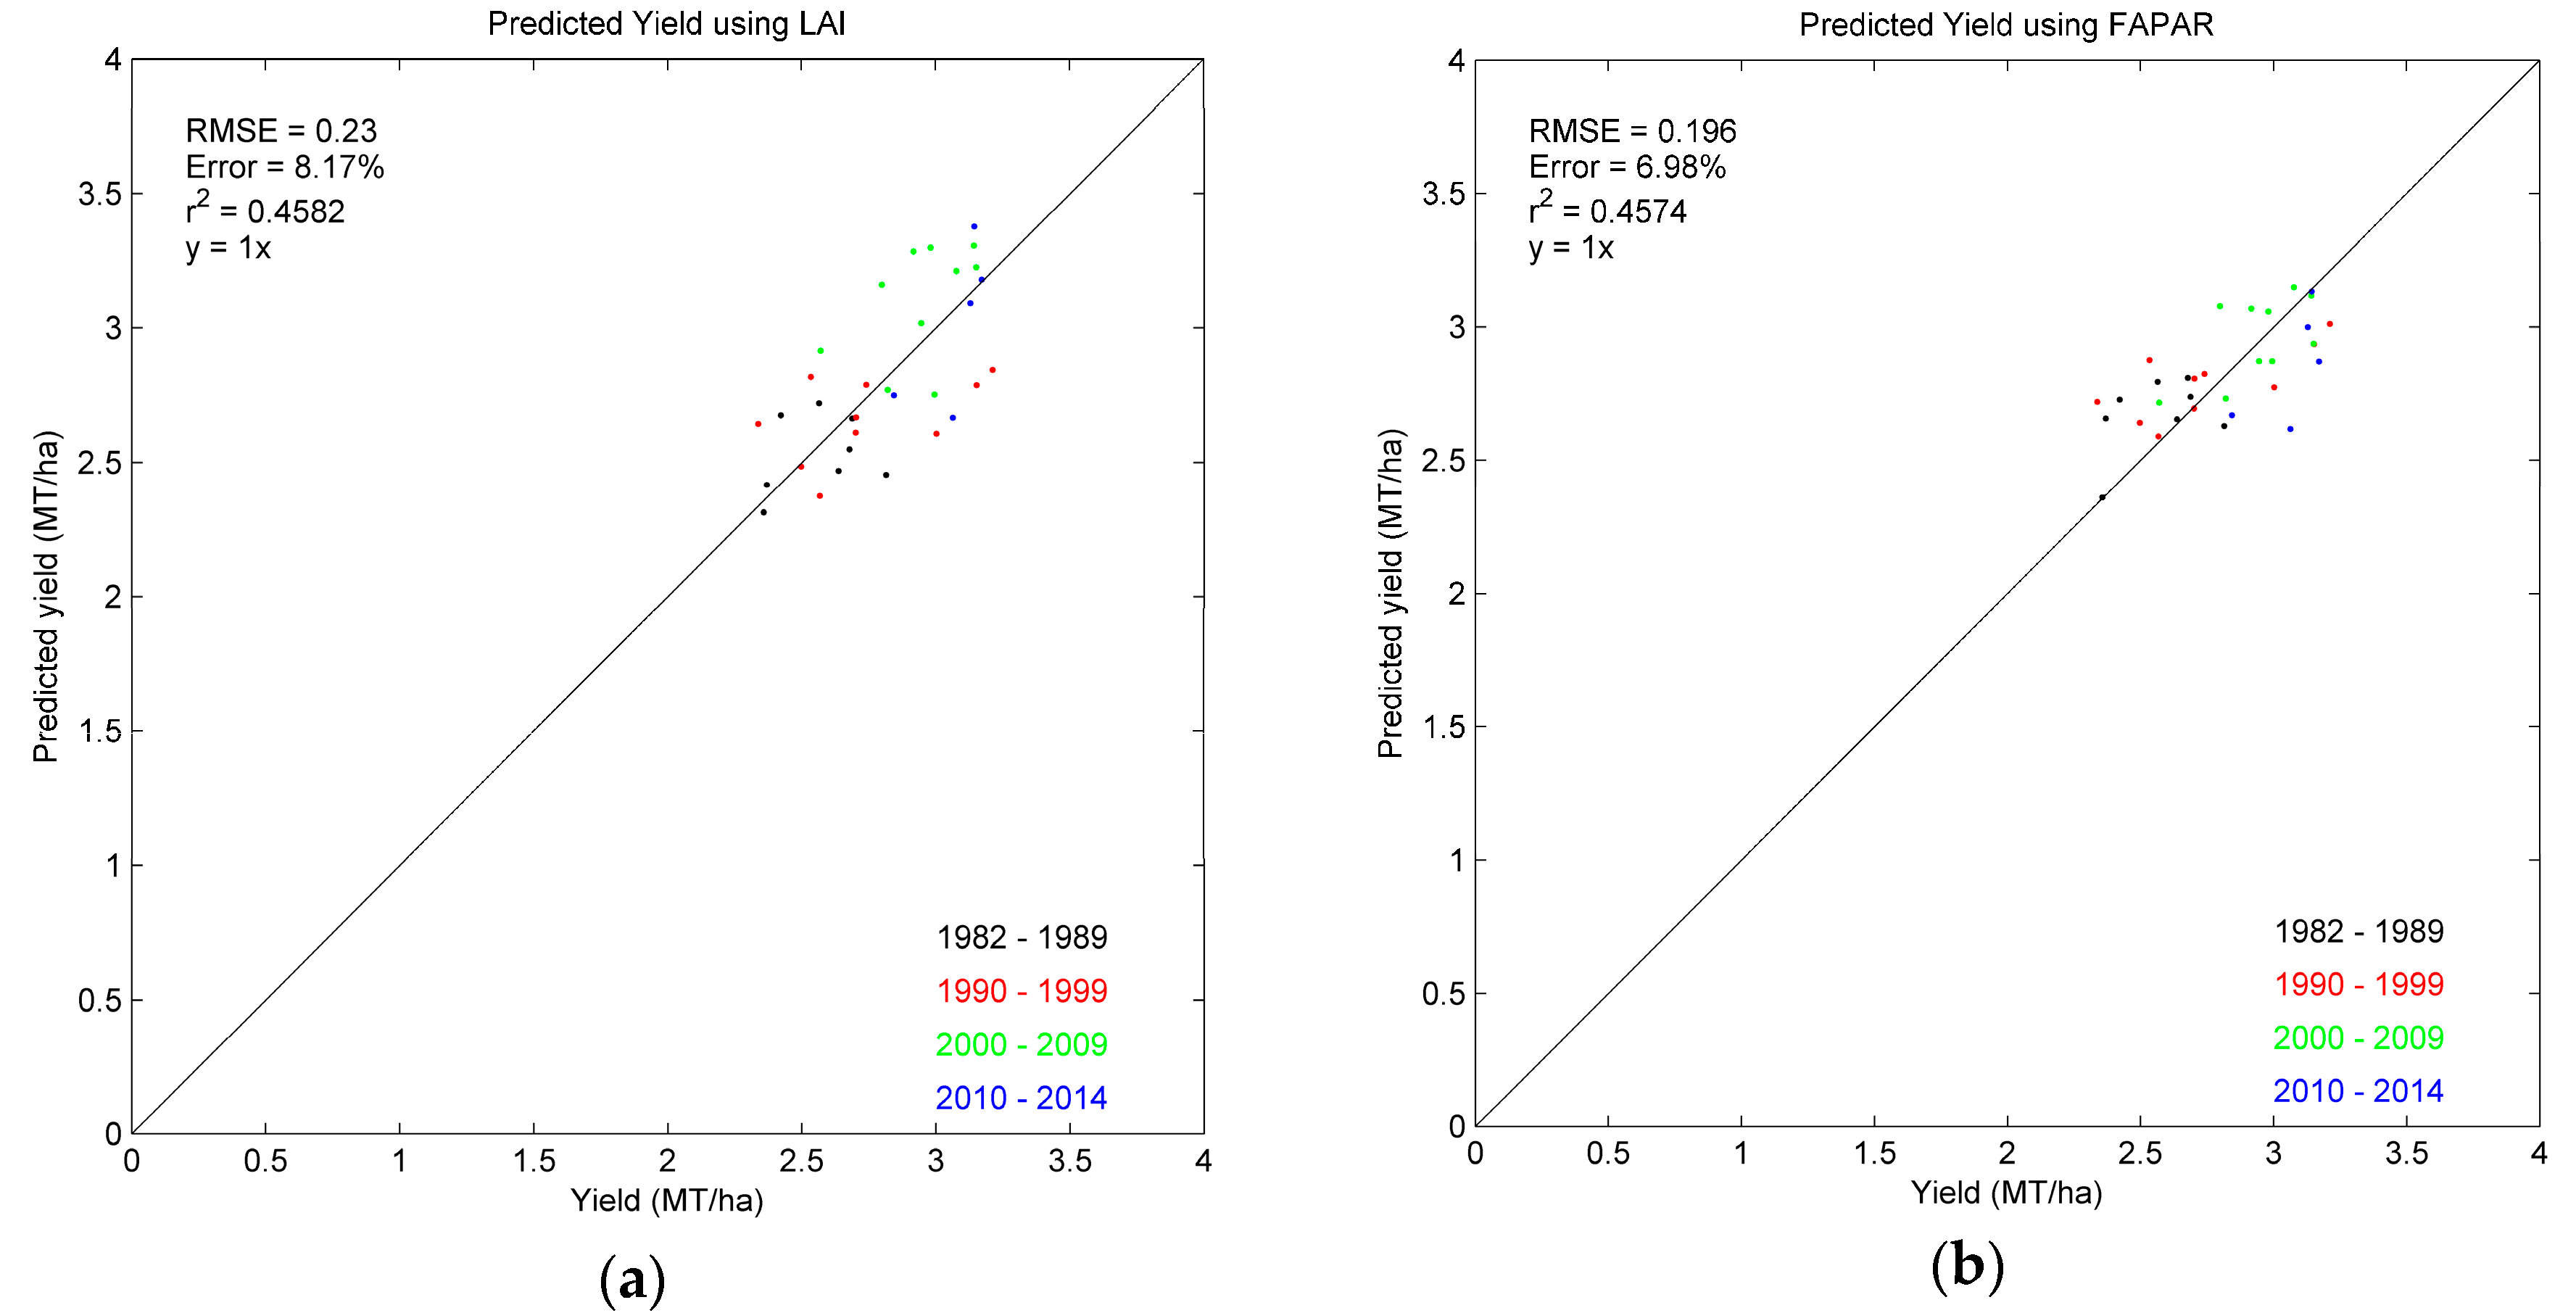
We also used the AVH15C1 LAI and FAPAR products with the method devised in [
7].
Figure 11 shows the yield validation with the official statistics. Comparing these results with the NDVI (
Figure 11a), they show similar errors (8.07% NDVI, 8.17% LAI, and 6.98% FAPAR) and similar correlation coefficients (0.38 NDVI, 0.46 LAI, and 0.46 FAPAR). Thus, we can conclude that the three different parameters (NDVI, LAI, and FAPAR) provide equivalent results.
4. Discussion
In this work we present the improvements and assess the AVHRR BRDF-corrected surface reflectance/NDVI Version 4 product. In addition to the geolocation and cloud mask evaluations, the assessment is done through four different exercises: first, we compare the product with the surface reflectance derived using AERONET atmospheric data (
Section 3.4); second, we intercompare the AVHRR with the MODIS surface reflectance products; third, we evaluate the LAI and FAPAR downstream products; and fourth, we apply a method to the AVHRR historical surface reflectance dataset to estimate the wheat production in the U.S.
The inter-comparison of MODIS and AVHRR surface reflectance products show ratios close to one, which means that both time-series are consistent. However, the ratio still shows some noise (maximum of 2% variation). The reasons for such errors could be associated with errors in the water vapor correction, an error residual of the BRDF correction or even a systematic variation of the calibration during the year. All of these possible explanations will be further explored in our future work.
Regarding the yield model, the method developed for MODIS data was evaluated with the longer AVHRR historical record, which contains greater inter-annual variability in surface conditions (generally winter wheat yields with lower values: see x-axis data variability of
Figure 11a). Additionally, the method was applied satisfactorily to AVHRR using the same calibration coefficients as for MODIS and producing equivalent statistics, showing the comparability and consistency of the MODIS and AVHRR surface reflectance products for this application.
5. Conclusions
This paper evaluated the AVHRR BRDF-corrected surface reflectance/NDVI Version 4 product. We reviewed the various efforts developed to improve its accuracy, from the geolocation correction and the cloud mask improvement to the calibration monitoring. Additionally, we evaluated the performance of the product, first using AERONET data and also by inter-comparison with the MODIS surface reflectance, an already validated and established product. The results presented show good performance of the AVHRR product and consistency with MODIS. We also demonstrate the usefulness and assess the performance of the product by its application to agricultural monitoring. This agricultural application demonstrates the utility of the LCDR to test the robustness of the yield forecast methods.
We are still working on the improvement of the product based on a better estimation of the atmospheric constituents: the aerosols and water vapor content. Future work will also include the development of a more systematic, robust and statistically significant evaluation of the product.
Acknowledgments
The authors would like to acknowledge NOAA NCEI for supporting the development of the surface reflectance/NDVI CDR product through the Cooperative Institute for Climate and Satellites-North Carolina under Cooperative Agreement NA14NES432003.
Author Contributions
B.F., E.F.V. and J.C.R. conceived the project idea; B.F., E.F.V., E.M., M.C. and J.N. processed the data; B.F., E.F.V., J.C.R., I.B.R., C.J., J.N., I.C., D.M., F.B., E.M., R.W. and S.D. performed the analysis; B.F., E.F.V., J.C.R., I.B.R., C.J., M.C., F.B. and S.D. wrote and contributed to the manuscript.
Conflicts of Interest
The authors declare no conflicts of interest.
References
- Zhang, X. Reconstruction of a complete global time series of daily vegetation index trajectory from long-term AVHRR data. Remote Sens. Environ. 2015, 156, 457–472. [Google Scholar] [CrossRef]
- Vermote, E.; Kaufman, Y.J. Absolute calibration of AVHRR visible and near-infrared channels using ocean and cloud views. Int. J. Remote Sens. 1995, 16, 2317–2340. [Google Scholar] [CrossRef]
- Vermote, E.F.; Saleous, N.Z. Calibration of NOAA16 AVHRR over a desert site using MODIS data. Remote Sens. Environ. 2006, 105, 214–220. [Google Scholar] [CrossRef]
- Moreno Ruiz, J.A.; Riaño, D.; Arbelo, M.; French, N.H.F.; Ustin, S.L.; Whiting, M.L. Burned area mapping time series in Canada (1984–1999) from NOAA-AVHRR LTDR: A comparison with other remote sensing products and fire perimeters. Remote Sens. Environ. 2012, 117, 407–414. [Google Scholar] [CrossRef]
- Alcaraz-Segura, D.; Liras, E.; Tabik, S.; Paruelo, J.; Cabello, J. Evaluating the Consistency of the 1982–1999 NDVI Trends in the Iberian Peninsula across Four Time-series Derived from the AVHRR Sensor: LTDR, GIMMS, FASIR, and PAL-II. Sensors 2010, 10, 1291–1314. [Google Scholar] [CrossRef] [PubMed]
- Verger, A.; Baret, F.; Weiss, M.; Lacaze, R.; Makhmara, H.; Pacholczyk, P.; Smets, B.; Kandasamy, S.; Vermote, E. LAI, FAPAR and FCOVER products derived from AVHRR long time series: Principles and evaluation. In Proceedings of the EGU General Assembly 2012, Vienna, Austria, 22–27 April 2012.
- Becker-Reshef, I.; Vermote, E.; Lindeman, M.; Justice, C. A generalized regression-based model for forecasting winter wheat yields in Kansas and Ukraine using MODIS data. Remote Sens. Environ. 2010, 114, 1312–1323. [Google Scholar] [CrossRef]
- Franch, B.; Vermote, E.F.; Becker-Reshef, I.; Claverie, M.; Huang, J.; Zhang, J.; Justice, C.; Sobrino, J.A. Improving the timeliness of winter wheat production forecast in the United States of America, Ukraine and China using MODIS data and NCAR Growing Degree Day information. Remote Sens. Environ. 2015, 161, 131–148. [Google Scholar] [CrossRef]
- Pedelty, J.; Devadiga, S.; Masuoka, E.; Brown, M.; Pinzon, J.; Tucker, C.; Roy, D.; Ju, J.; Vermote, E.; Prince, S.; et al. Generating a long-term land data record from the AVHRR and MODIS Instruments. In Proceedings of the IGARSS 2007—2007 IEEE International Geoscience and Remote Sensing Symposium, Barcelona, Spain, 23–28 July 2007; pp. 1021–1025.
- El Saleous, N.Z.; Vermote, E.F.; Justice, C.O.; Townshend, J.R.G.; Tucker, C.J.; Goward, S.N. Improvements in the global biospheric record from the Advanced Very High Resolution Radiometer (AVHRR). Int. J. Remote Sens. 2000, 21, 1251–1277. [Google Scholar] [CrossRef]
- Cosnefroy, H.; Leroy, M.; Briottet, X. Selection and characterization of Saharan and Arabian desert sites for the calibration of optical satellite sensors. Remote Sens. Environ. 1996, 58, 101–114. [Google Scholar] [CrossRef]
- Schaaf, C.B.; Gao, F.; Strahler, A.H.; Lucht, W.; Li, X.; Tsang, T.; Strugnell, N.C.; Zhang, X.; Jin, Y.; Muller, J.-P.; et al. First operational BRDF, albedo nadir reflectance products from MODIS. Remote Sens. Environ. 2002, 83, 135–148. [Google Scholar] [CrossRef]
- Vermote, E.; Tanre, D.; Deuze, J.L.; Herman, M.; Morcrette, J.J. Second Simulation of the Satellite Signal in the Solar Spectrum (6S): An overview. IEEE Trans. Geosci. Remote Sens. 1997, 35, 675–686. [Google Scholar] [CrossRef]
- Stowe, L.L.; Davis, P.A.; McClain, E.P. Scientific Basis and Initial Evaluation of the CLAVR-1 Global Clear/Cloud Classification Algorithm for the Advanced Very High Resolution Radiometer. J. Atmos. Ocean. Technol. 1999, 16, 656–681. [Google Scholar] [CrossRef]
- Holben, B.N.; Eck, T.F.; Slutsker, I.; Tanré, D.; Buis, J.P.; Setzer, A.; Vermote, E.; Reagan, J.A.; Kaufman, Y.J.; Nakajima, T.; et al. AERONET—A Federated Instrument Network and Data Archive for Aerosol Characterization. Remote Sens. Environ. 1998, 66, 1–16. [Google Scholar] [CrossRef]
- Morisette, J.T.; Privette, J.L.; Justice, C.O. A framework for the validation of MODIS Land products. Remote Sens. Environ. 2002, 83, 77–96. [Google Scholar] [CrossRef]
- Vermote, E.; Justice, C.O.; Bréon, F.-M. Towards a generalized approach for correction of the BRDF effect in MODIS directional reflectances. IEEE Trans. Geosci. Remote Sens. 2009, 47, 898–908. [Google Scholar] [CrossRef]
- Baret, F.; Morissette, J.T.; Fernandes, R.A.; Champeaux, J.L.; Myneni, R.B.; Chen, J.; Plummer, S.; Weiss, M.; Bacour, C.; Garrigues, S.; et al. Evaluation of the representativeness of networks of sites for the global validation and intercomparison of land biophysical products: Proposition of the CEOS-BELMANIP. Geosci. Remote Sens. IEEE Trans. 2006, 44, 1794–1803. [Google Scholar] [CrossRef]
- Wolfe, R.E.; Nishihama, M.; Fleig, A.J.; Kuyper, J.A.; Roy, D.P.; Storey, J.C.; Patt, F.S. Achieving sub-pixel geolocation accuracy in support of MODIS land science. Remote Sens. Environ. 2002, 83, 31–49. [Google Scholar] [CrossRef]
- Leroy, M.; Roujean, J.L. Sun and view angle corrections on reflectances derived from NOAA/AVHRR data. IEEE Trans. Geosci. Remote Sens. 1994, 32, 684–697. [Google Scholar] [CrossRef]
- Bicheron, P.V.; Amberg, L.; Bourg, D.; Petit, M.; Huc, B.; Miras, C.; Brockmann, O.; Hagolle, S.; Delwart, F.; Ranéra, M.L.; et al. Geolocation Assessment of MERIS GlobCover Orthorectified Products. IEEE Trans. Geosci. Remote Sens. 2011, 49, 2972–2982. [Google Scholar] [CrossRef] [Green Version]
- Evans, R.H.; Casey, K.S.; Cornillon, P.C. Transition of AVHRR SST Pathfinder to Version 6, Continued Evolution of a CDR; American Geophysical Union: Miami, FL, USA, 2010. [Google Scholar]
- Rao, C.R.N.; Chen, J. Post-launch Calibration of the Visible and Near-Infrared Channels of the Advanced Very High Resolution Radiometer on the NOAA-14 Spacecraft. Int. J. Remote Sens. 1996, 17, 2743. [Google Scholar] [CrossRef]
- Tucker, C.J.; Pinzon, J.E.; Brown, M.E.; Slayback, D.A.; Pak, E.W.; Mahoney, R.; Vermote, E.F.; El Saleous, N. An extended AVHRR 8-km NDVI dataset compatible with MODIS and SPOT vegetation NDVI data. Int. J. Remote Sens. 2005, 26, 4485–4498. [Google Scholar] [CrossRef]
- Claverie, M.; Vermote, E.; Program, N.C. NOAA Climate Data Record (CDR) of Leaf Area Index (LAI) and Fraction of Absorbed Photosynthetically Active Radiation (FAPAR), Version 4; NOAA National Climatic Data Center: Asheville, NC, USA, 2014. [Google Scholar]
- Claverie, M.; Matthews, J.L.; Vermote, E.F.; Justice, C.O. A 30+ Year AVHRR LAI and FAPAR Climate Data Record: Algorithm Description and Validation. Remote Sens. 2016, 8, 263. [Google Scholar] [CrossRef]
- Garrigues, S.; Lacaze, R.; Baret, F.; Morisette, J.T.; Weiss, M.; Nickeson, J.E.; Fernandes, R.; Plummer, S.; Shabanov, N.V.; Myneni, R.B. Validation and intercomparison of global Leaf Area Index products derived from remote sensing data. J. Geophys. Res. Biogeosci. 2008, 113. [Google Scholar] [CrossRef]
- Nash, J.E.; Sutcliffe, J.V. River flow forecasting through conceptual models part I—A discussion of principles. J. Hydrol. 1970, 10, 282–290. [Google Scholar] [CrossRef]
© 2017 by the authors. Licensee MDPI, Basel, Switzerland. This article is an open access article distributed under the terms and conditions of the Creative Commons Attribution (CC BY) license ( http://creativecommons.org/licenses/by/4.0/).


 ,
, 


