1. Introduction
Rapid urbanization has led to great changes in rural landscapes [
1,
2,
3]. During the process of urbanization, many villages grow into towns and cities, or become part of a city due to urban expansion [
4,
5]. In addition, rural households far from the city are increasingly moving into cities and finding seasonal or permanent employment, and sending remittances back to the villages [
6]. This increased connectivity between urban and rural areas may also lead to great changes in rural villages [
6,
7]. These changes have marked ecological and environmental impacts, such as the loss of habitat and increased habitat fragmentation, loss of biodiversity, farmland loss and fragmentation, and urban heat islands [
8,
9,
10,
11,
12,
13]. Understanding how rural villages have changed over time and the drivers of change is crucially important for quantification of ecological and environmental impacts.
Remote sensing has been widely used for change analysis on rural landscapes, or more specifically, rural residential settlements (i.e., the artificial lands in rural areas), with the advantages of explicitly and periodically providing their spatial pattern over a large geographic area [
14,
15,
16,
17]. These studies may be loosely classified into two categories based on their analytical unit: grid-based and administrative boundary-based. The former uses a grid with a certain size as the unit of analysis to quantify the proportional cover of rural residential settlements and their changes [
18,
19,
20,
21]. For example, Tian et al. [
19] used a grid of one kilometer and land use/land cover (LULC) maps derived from 30 m Landsat TM imagery to quantify changes in rural residential settlements and differences among 33 rural landscapes in China during the 1990s. A vegetation index, such as the Enhanced Vegetation Index (EVI) from the MOD13Q1 product, was also used to estimate impervious surfaces and their change in rural areas [
17]. Another frequently used approach in previous studies was to quantify the proportional cover of rural residential settlements and their changes within the administrative units, ranging from county to prefecture city, and even to the national scale [
22,
23,
24]. For example, Long et al. [
21] investigated five regions of the Yangtze River watershed from the lower to the upper reaches using an administrative unit approach and found different phases of transitions in rural settlement land.
Previous studies only identified the increase or decrease of rural settlements at the administrative or grid level [
4,
17,
25]. However, few studies have examined the changes at the village scale; that is, using the individual rural settlements as the unit of analysis. In fact, such information is crucially important for understanding the fate of each individual rural settlement, but is not available from the abovementioned analyses or methods. For example, how many villages (or what proportion of villages) were totally lost, expanded, or shrunken during the process of urbanization? Or, are villages close to the city (i.e., in the peri-urban areas) more likely to become part of the city or expand to become another town or city?
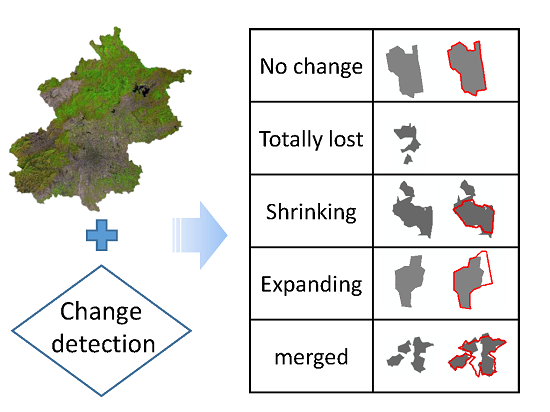
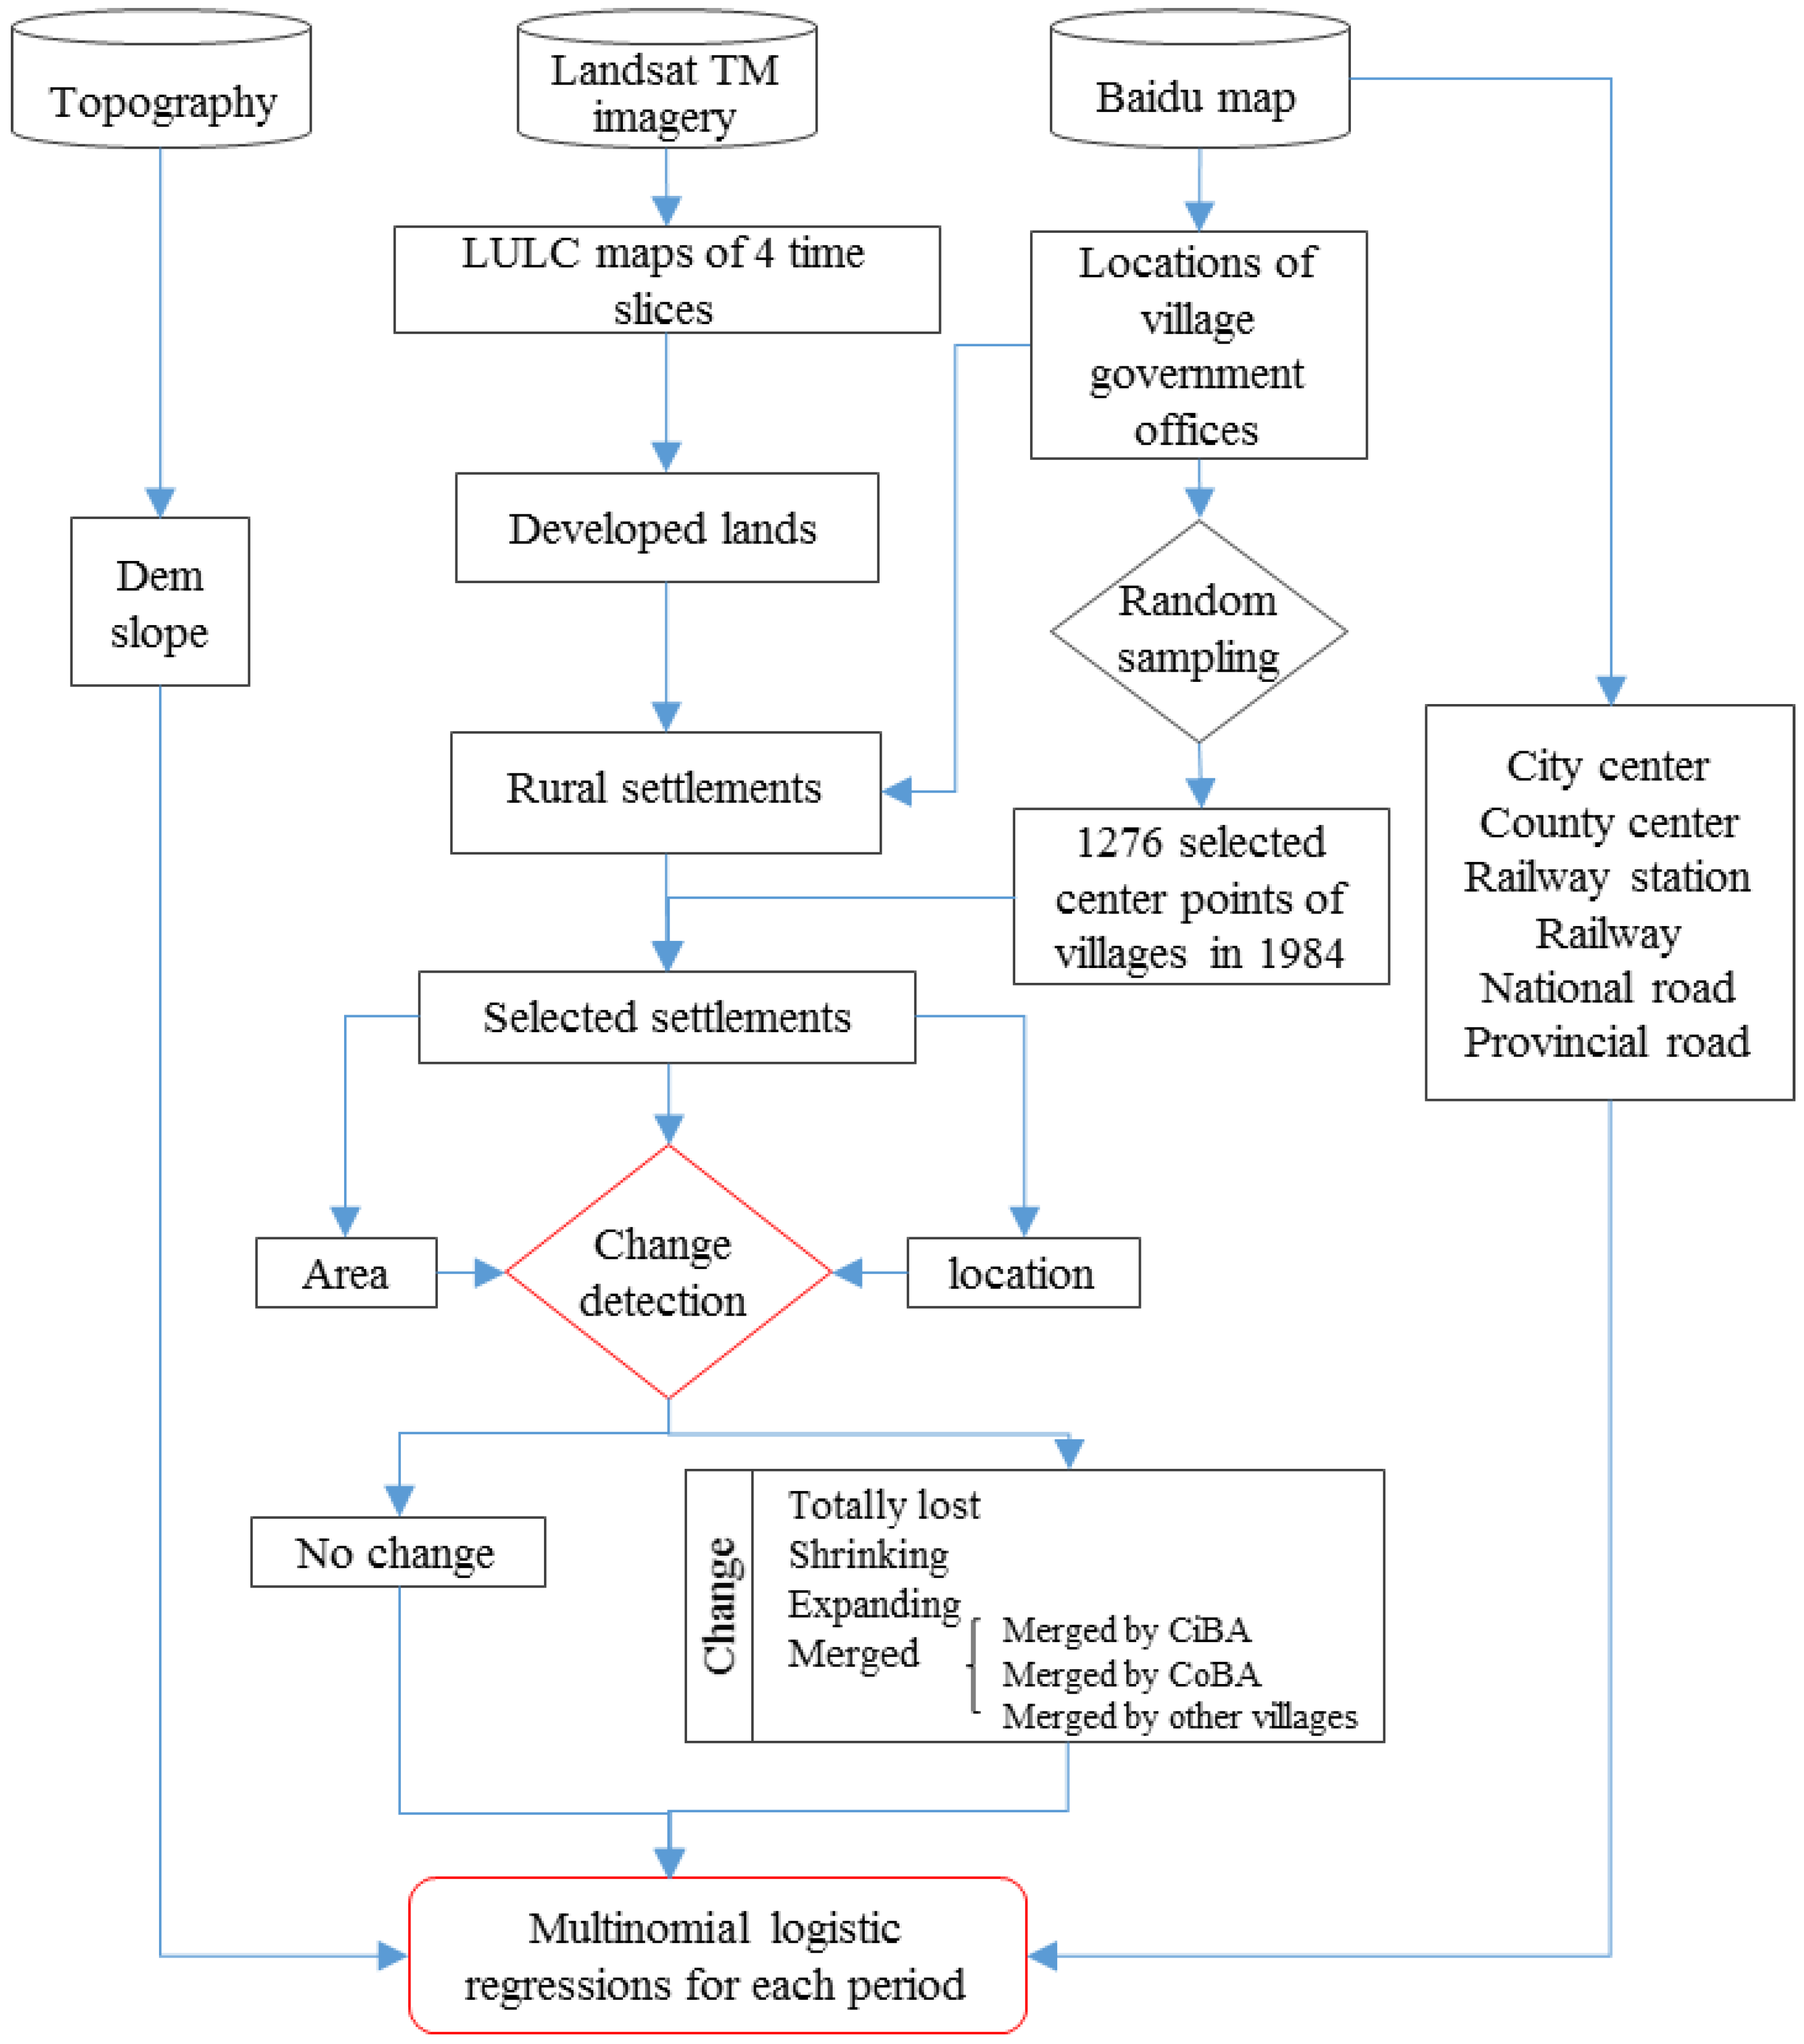
Here, we present a new approach to identify different types of changes at the individual rural settlement level by integrating remote sensing and GIS analyses. We further applied this approach to quantify the spatiotemporal patterns of rural residential settlements in the Beijing metropolitan area from 1984 to 2010. Additionally, we investigated the drivers of such changes. Specifically, we addressed two research questions: (1) What are the spatiotemporal patterns of rural residential settlement change in the Beijing metropolitan area? (2) what are the driving forces of rural residential settlement change, their relative importance, and their temporal dynamics? We used Landsat TM data collected in 1984, 1990, 2000, and 2010, in combination with other GIS layers for the analysis of settlement dynamics. We used multinomial logistic regression models to examine the effects of the driving forces on changes.
3. Results
3.1. Spatiotemporal Patterns of Rural Residential Settlements
While the number of rural residential settlements decreased sharply, the total area greatly increased. The randomly selected 1276 rural settlements in 1984 decreased rapidly to 812 in 2010, a loss of 36% of the villages over thirty years (
Table 3). A total of 221 villages were lost during 1984–1990, 129 in 2000–2010, and 114 in 1990–2000. In contrast, the total area of artificial land for existing rural residential settlements increased by 128 km
2 during 1984–2010, an increase of 34% of artificial land. The largest increase of 85 km
2 occurred during 2000–2010 (
Table 3).
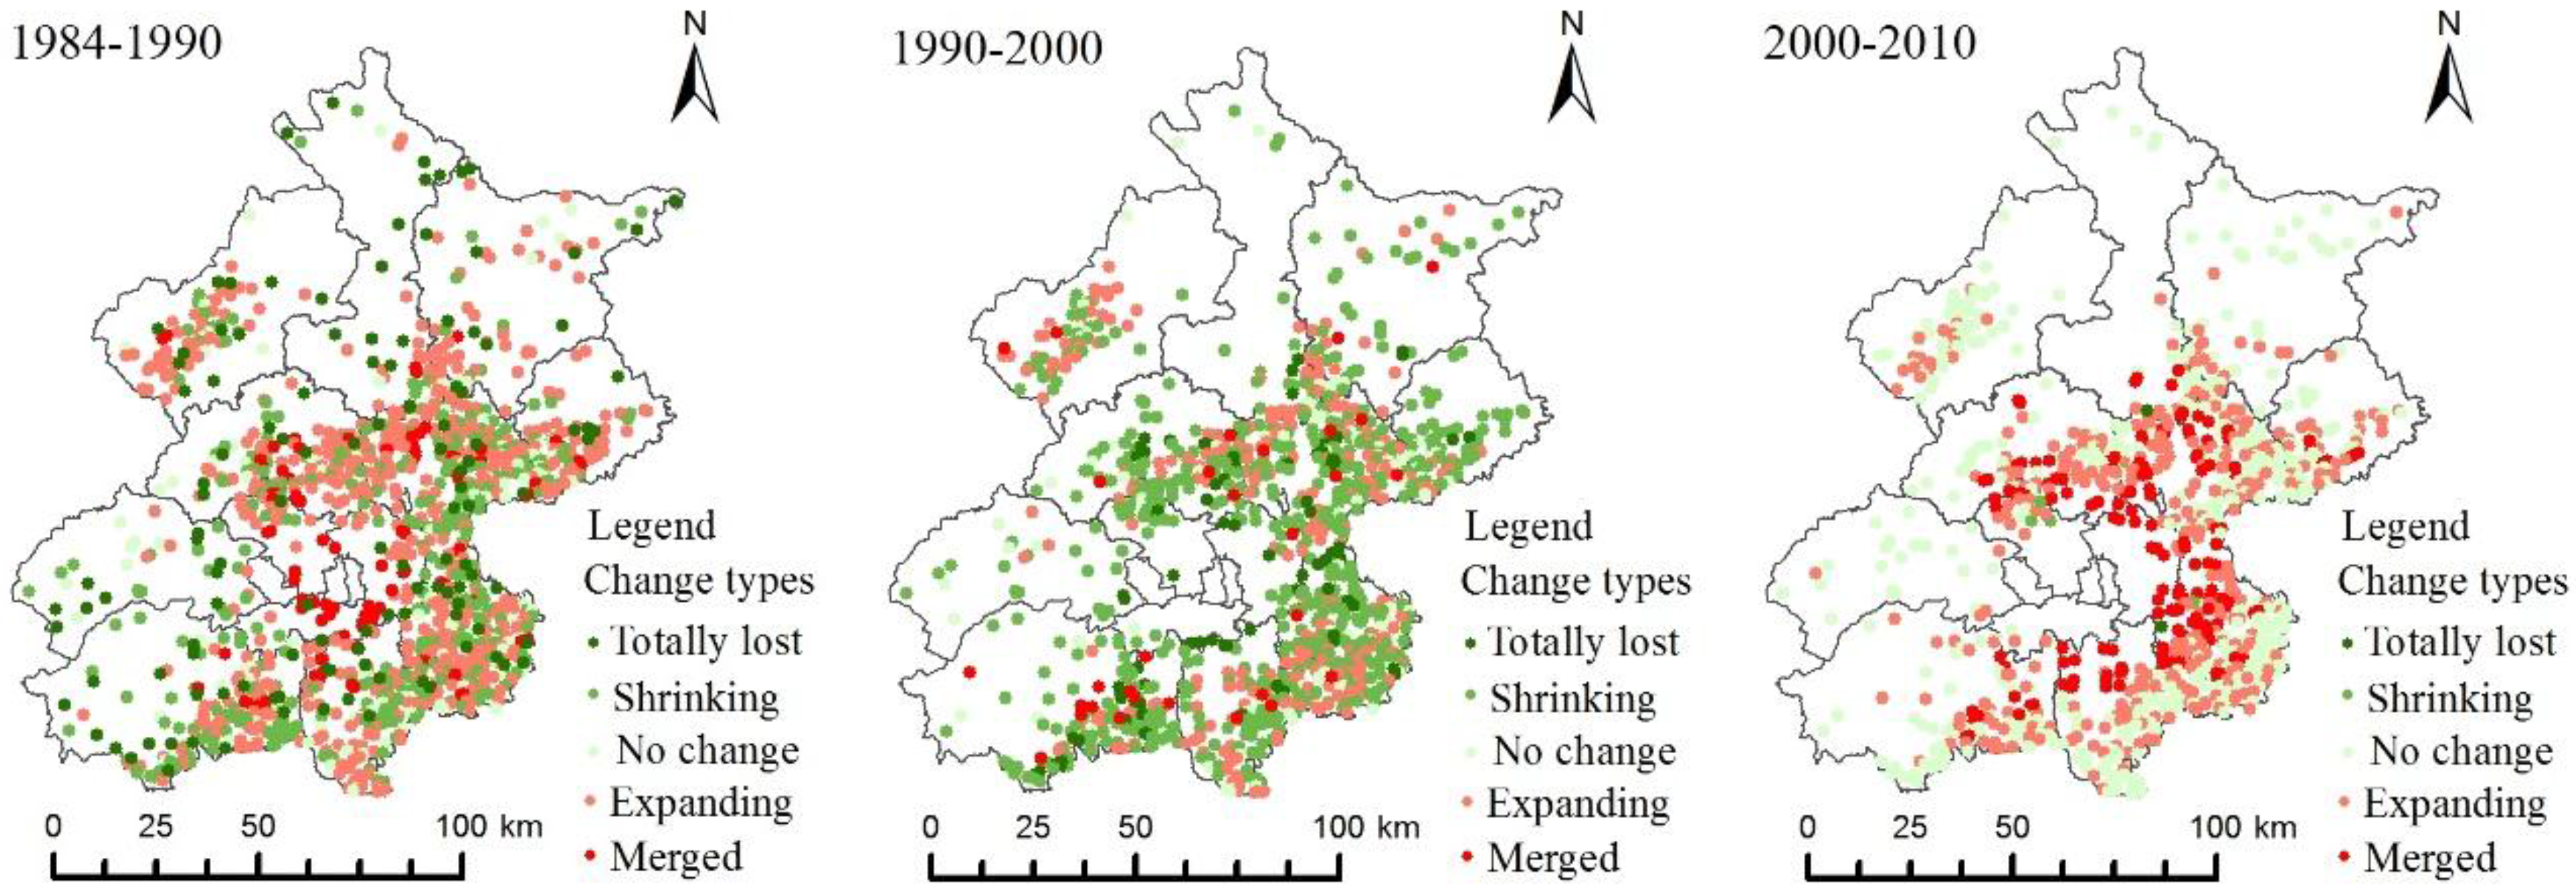
The number of rural residential settlements in different change types varied with time, and the main change type shifted from ‘expansion’ to ‘no change’ (
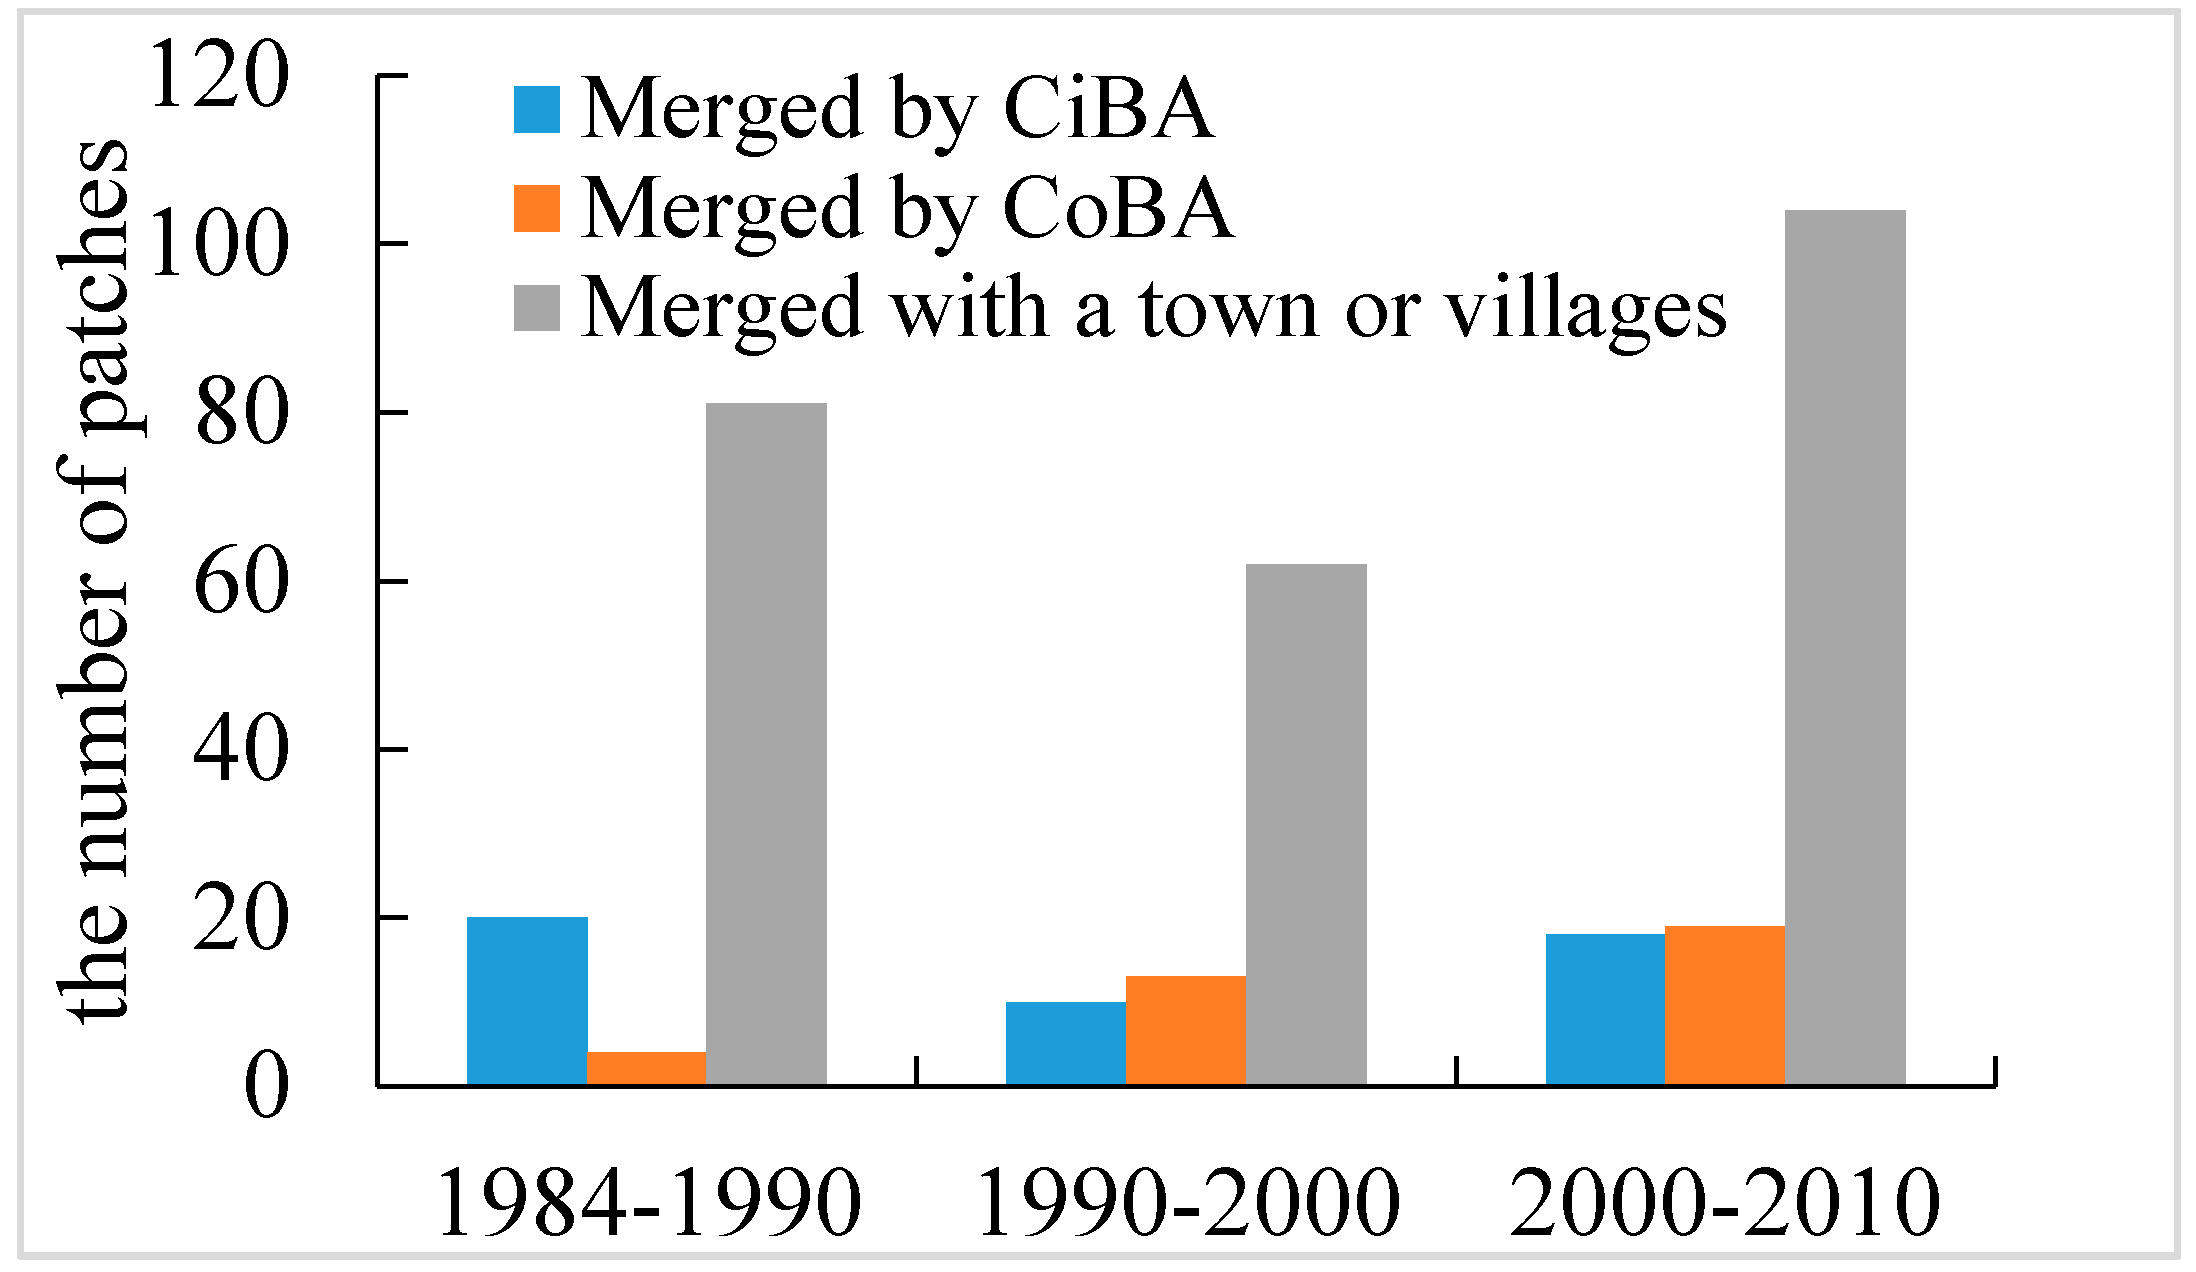
Table 4). During 1984–1990 and 1990–2000, only 132 (or 10.3%) and 94 (or 8.91%) of the rural settlements remained unchanged. From 2000 to 2010, however, 468 of the sampled villages (or 49.7%) remained unchanged. In contrast, the number of settlements that were totally lost or shrunken continually decreased. In all the three time periods, great proportions of villages were expanding and fewer villages merged with other villages or cities.
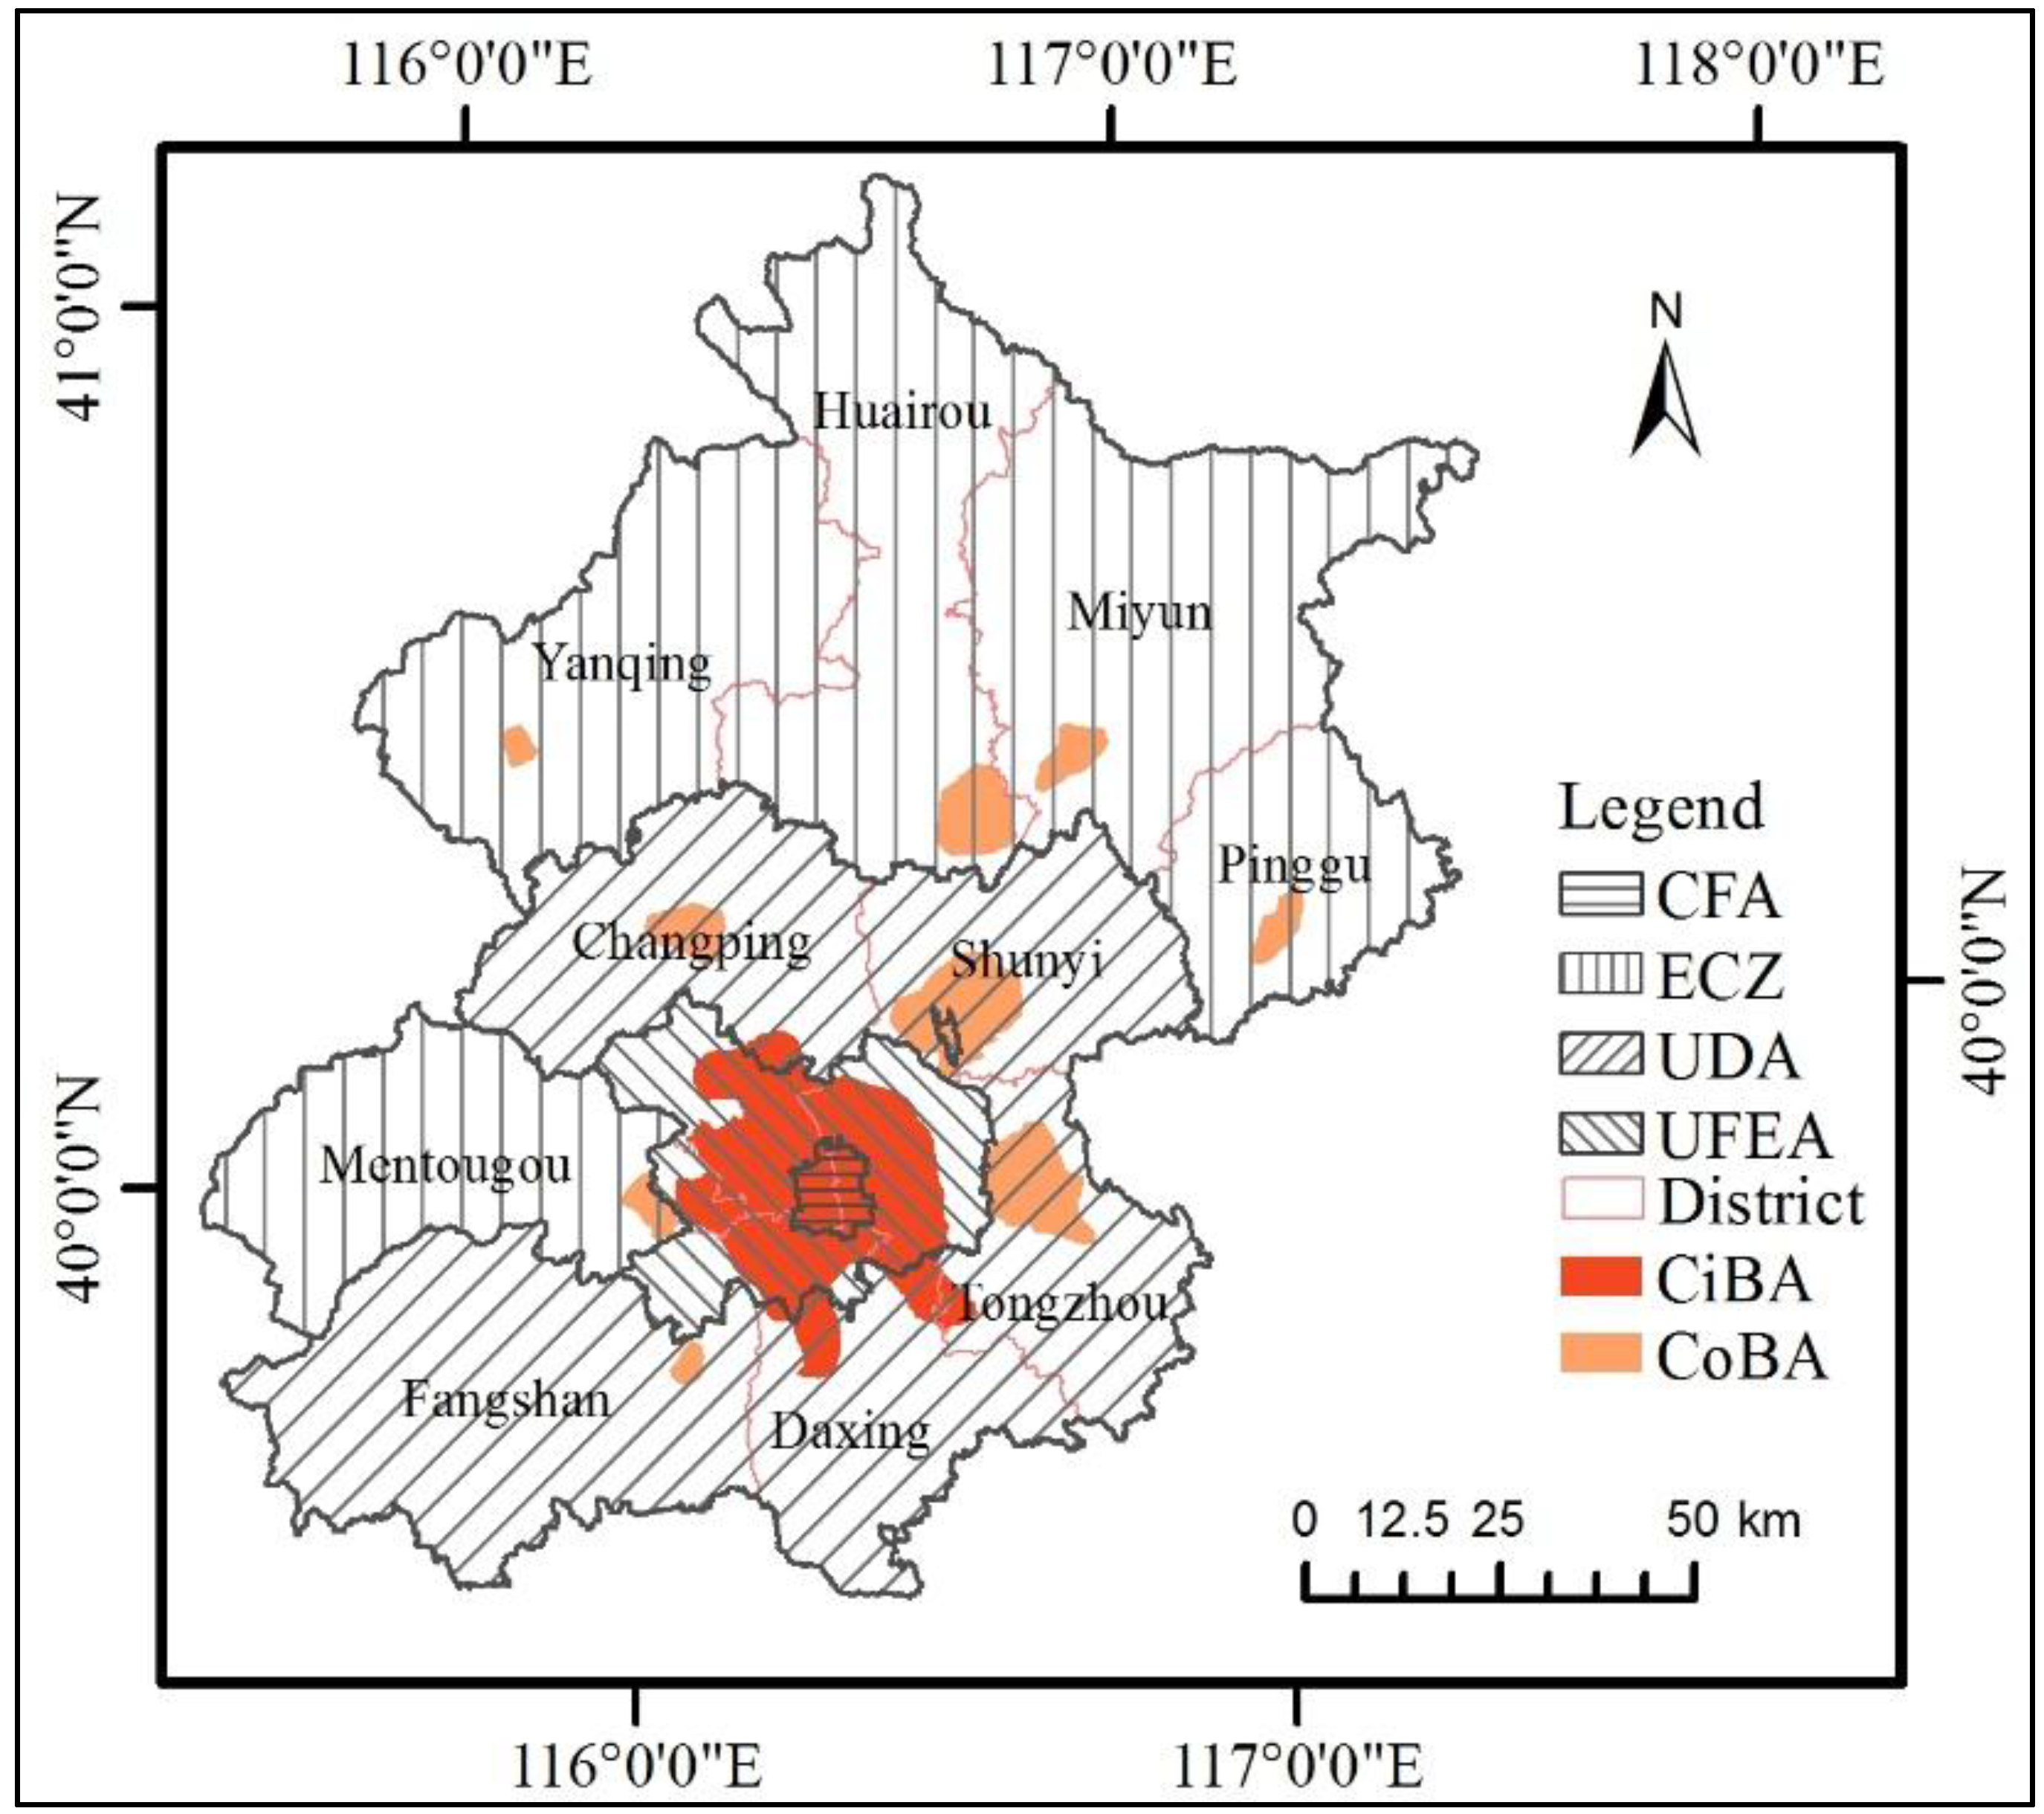
Spatially, most of the rural residential settlements with changes were located in the plain, especially in the Urban Development Areas (UDA) (
Figure 4). The total number of settlements in UDA were 859 in 1984–1990, 741 in 1990–2000, and 658 in 2000–2010, consisting of 67.32%, 70.24%, and 69.93% of all the sampled settlements in Beijing, respectively (
Table 5). Additionally, settlements that expanded or were merged in UDA both increased with time. For example, the total numbers of expanding settlements in UDA were 358, 409, and 239 in each time period, accounting for 64.62%, 68.97%, and 73.54% of all the sample villages that experienced expansion in Beijing, respectively. Similarly, the total expanded areas of rural residential settlements in UDA were 82.72 km
2, 82.83 km
2, and 190.99 km
2 in each time period, accounting for 53.79%, 58.51%, and 86.98% of the total area of expanded rural settlements, respectively (
Table 6). In contrast, the number of total settlements in the Urban Function Expansion Area (UFEA) decreased continuously from 90 (or 7.05%) to 40 (or 4.25%). There was no settlement in the Capital Function Area (CFA) during the study period.
3.2. The Relative Importance of the Driving Forces in Different Time Periods
The multinomial logistic regression models explained the variance in changes of rural settlements well (
Table 7). All these models were significant at the 0.01 level (p < 0.001). The values of percentage correctly predicted (PCP) were 61.2%, 68.5%, and 66.4% for the models in 1984–1990, 1990–2000, and 2000–2010, respectively. The explained variances of the probability (Nagelkerke’s R
2) were 0.31, 0.33, and 0.32. The MLR for 2000–2010 included only 3 change types, because the number of villages with “totally lost” and “shrinking” was too small. In general, all these change types in rural settlements were significantly affected by both the topographical and distance factors, as detailed below.
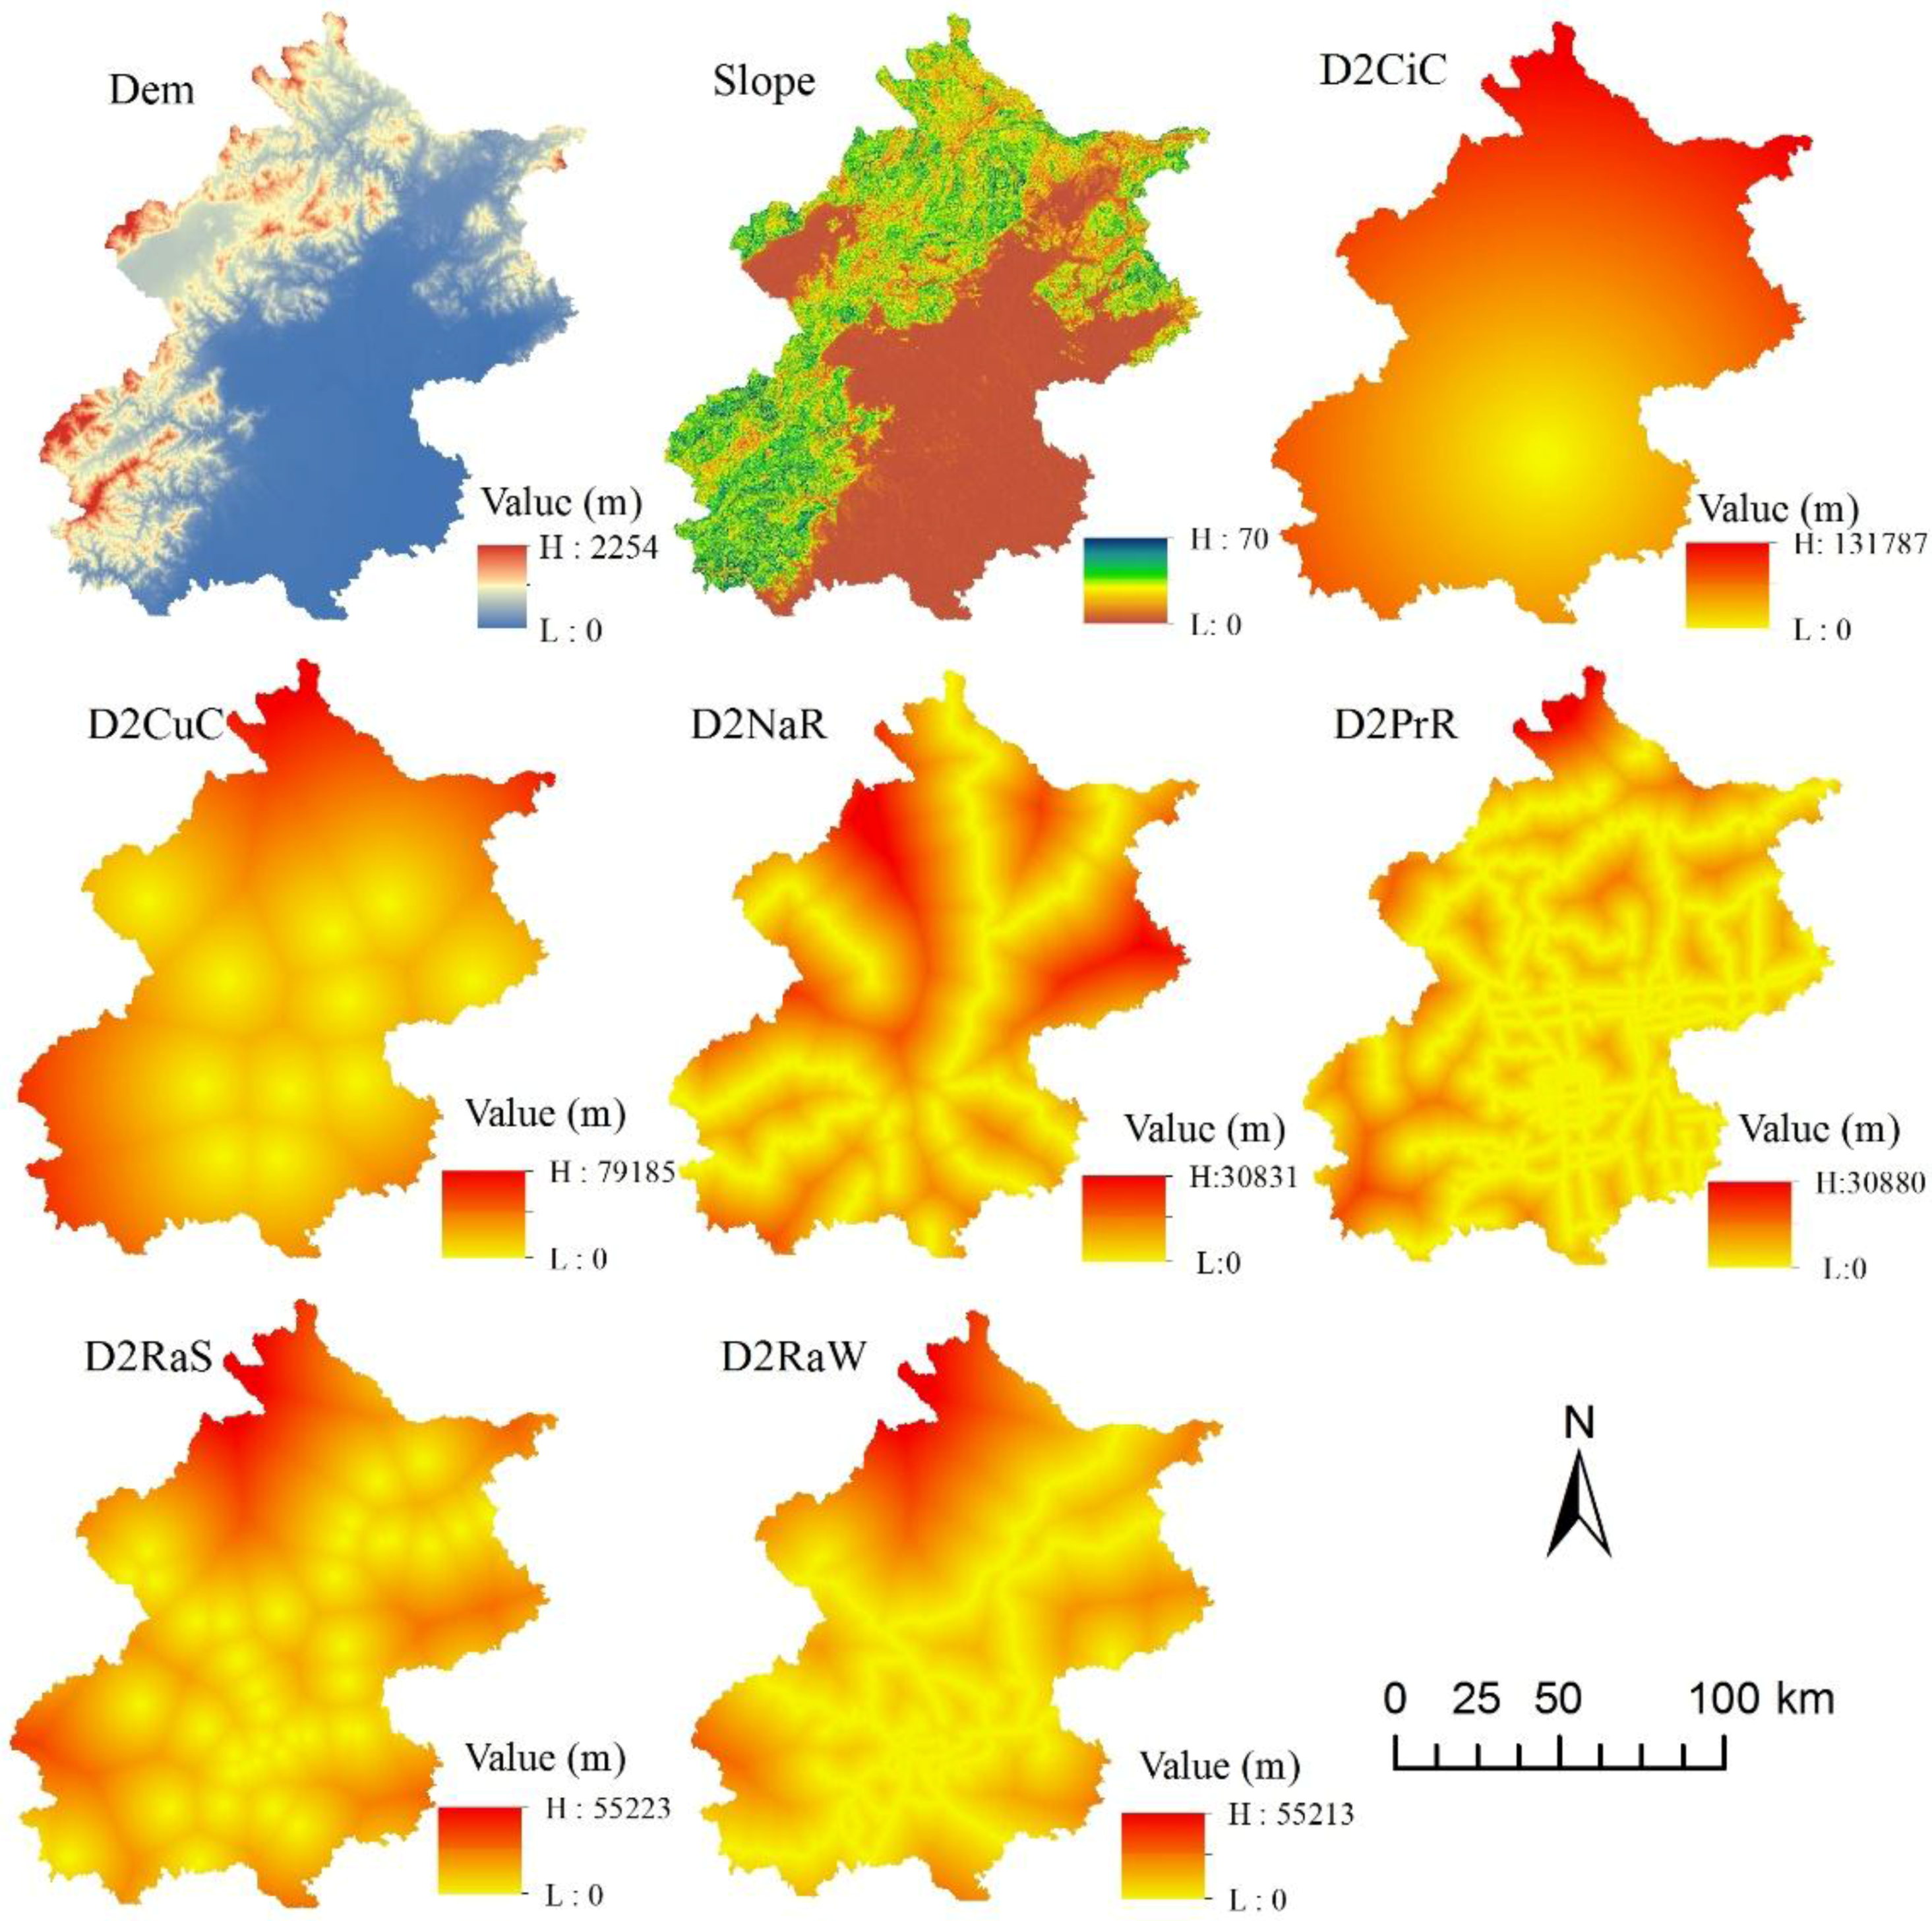
For the type of settlements of “totally lost”, slope and distance to railway (D2RaW) had a significantly positive effect during the time period of 1984–1990, suggesting that villages at that time period were more likely to be lost if they had greater slope and were further away from railways. In 1984–2000, the distance to railway station (D2RaS) had a significant negative relationship with “totally lost” and the absolute value of the standardized coefficient increased from 5.768 to 7.340. This indicated that the effect of D2RaS on the loss of village was increased. However, the variable slope was no longer significantly related in 1990–2000, indicating that the importance of topographical factors on the total loss of rural settlements decreased through time.
The type of settlements of “shrinking” was mostly affected by distance factors. The distance to railway station (D2RaS) had significantly negative effects on “shrinking” consistently throughout 1984–2000, suggesting that settlements close to railway stations had a greater probability of shrinking over all time periods. In addition, the distance to national road (D2NaR) in 1984–1990 showed a significantly positive influence, indicating the settlements far from the national roads were more likely to shrink. However, slope became the most important factor during 1990–2000 (β = −9.391) and showed negative impacts on settlement shrinking, implying that villages with low slope at that time had a higher possibility to shrink.
Similarly, the “expanding” type villages were more affected by distance variables than topographical factors. In 1984–1990, settlement expansion was significantly and negatively affected by slope and distance to rail station (D2RaS), suggesting that villages were more likely to expand if they had low slope and were close to railway stations. In addition, most of the distance variables showed significantly negative impacts on village expansion during 1990–2010, such as the distances to railway stations (D2RaS) in 1990–2000, and the distances to city centers (D2CiC), the distances to county centers (D2CoC) and to provincial roads (D2PrR) in 2000–2010, indicating that settlements near economic and transportation centers had greater possibility to expand.
As for settlements that “merged”, distance variables were the dominant factors, with negative influences during the entire study period. The results indicated that villages were more likely to merge if they were close to Beijing satellite cities and national and provincial roads. The influences of these two variables increased from 1984 to 2010, indicated by the increase of the coefficients of D2CiC and D2CoC by 5.259 and 7.812, respectively. In addition, there were an increased number of distance factors that significantly affected whether villages merged or not.
5. Conclusions
Globally, urban expansion has resulted in dramatic changes in rural landscapes, which have marked social and eco-environmental consequences. Understanding how rural villages have changed over time and the drivers of change is crucially important to assess such consequences. Using remote sensing data to quantify the distribution of rural settlements and their changes has received increasing attention in the past three decades, but remains a challenge. This study presents a new approach that can identify five different types of changes at the individual village level by integrating remote sensing and GIS analyses, using multi-temporal Landsat TM image data. We applied this approach to quantify the spatiotemporal patterns of rural residential settlements in the Beijing metropolitan area from 1984 to 2010. We found: (1) 36% of the villages were lost, but the total area of developed lands in existing villages increased by 34%; (2) Changes were dominated by the type of ‘expansion’ in 1984–1990 (accounting for 43.42%) and 1990–2000 (56.21%). However, from 2000 to 2010, 49.73% of the villages remained unchanged; (3) both topographical factors and distance factors had significant effects on whether the villages changed or not, and the types of changes they had; but their impacts changed through time. The topographical driving factors showed decreasing effects on the loss of rural settlements, while distance factors had increasing impacts on settlement expansion and merging. Results from this study can enhance our understanding of the changes in rural residential settlements and their associations with urbanization in the Beijing metropolitan area. While only tested in Beijing, this approach can be applied in other metropolitan areas as well.


