Abstract
In this study, we inter-compared observed Ku-, X- and C-band microwave backscatter from saline 14 cm, 8 cm, and 4 cm snow covers on smooth first-year sea ice. A Ku-, X- and C-band surface-borne polarimetric microwave scatterometer system was used to measure fully-polarimetric backscatter from the three snow covers, near-coincident with corresponding in situ snow thermophysical measurements. The study investigated differences in co-polarized backscatter observations from the scatterometer system for all three frequencies, modeled penetration depths, utilized co-pol ratios, and introduced dual-frequency ratios to discriminate dominant polarization-dependent frequencies from these snow covers. Results demonstrate that the measured co-polarized backscatter magnitude increased with decreasing snow thickness for all three frequencies, owing to stronger gradients in snow salinity within thinner snow covers. The innovative dual-frequency ratios suggest greater sensitivity of Ku-band microwaves to snow grain size as snow thickness increases and X-band microwaves to snow salinity changes as snow thickness decreases. C-band demonstrated minimal sensitivity to changes in snow salinities. Our results demonstrate the influence of salinity associated dielectric loss, throughout all layers of the three snow covers, as the governing factor affecting microwave backscatter and penetration from all three frequencies. Our “plot-scale” observations using co-polarized backscatter, co-pol ratios and dual-frequency ratios suggest the future potential to up-scale our multi-frequency approach to a “satellite-scale” approach, towards effective development of snow geophysical and thermodynamic retrieval algorithms on smooth first-year sea ice.
1. Introduction and Background
Arctic sea ice extent, age, volume, and thickness have undergone rapid decrease during the past three decades, with the Arctic Ocean on a path to a new climate regime influenced by a thinner sea ice cover and being more and more dominated by first-year ice (FYI) [1,2]. Widespread decline of multi-year ice (MYI) replaced by FYI, with associated decline in spring snow depth are well accepted and documented [1,3,4]. A warming Arctic triggers delayed sea ice “freeze-up” which could lead to thinner FYI, thereby decreasing adequate time for snow accretion on FYI. These thinner snow covers on FYI are likely to become more saline owing to the accentuated vapor and temperature gradients across the ocean–atmosphere interface [5]. Snow electro-thermophysical properties (through accumulation and redistribution) on FYI exhibit high spatiotemporal variability [6] from hourly to seasonal time scales throughout its annual cycle, and plays a central role in regulating sea ice growth and decay processes [7].
Active microwave remote sensing techniques employing space-borne scatterometry and Synthetic Aperture Radar (SAR) have proven to be effective tools to characterize the electrical and thermodynamic state of snow covered FYI, where snow cover plays a critical role in microwave interactions (propagation and scattering) within the snow/sea ice system [8,9,10,11,12,13,14]. With changes in snow thickness and its associated thermophysical properties such as snow temperature, snow salinity, snow density and snow grain size (grain radius or specific surface area) on FYI, microwaves exhibit characteristic variations within different snow cover types on FYI [15,16]. Snow cover can influence and modify microwave interactions on FYI (dependent on incidence angle (), polarization and wavelength) in two ways. First, through thermodynamically controlled effects (e.g., snow wetness and brine volume) on snow dielectrics (dielectric permittivity and loss), and secondly due to microwave scattering (surface and volume scattering) owing to different snow thermophysical properties. Fluctuations in near-surface air temperature change the snow temperature, which in turn modifies the brine volume at/near the snow/sea ice interface and within-snow layers, following the eutectic phase distribution curve. Snow salinity controls the penetration depth, and it influences the partitioning between scattering at interfaces, i.e. surface scattering (air/snow, within-snow at density gradients, snow/ice) and volume scattering by modulating the absorption of both the incident and the reflected/scattered microwave radiation. This in turn alters dielectric and thermodynamic properties of the snow cover, which in turn could lead to uncertainties in snow thickness estimations on FYI.
Understanding complex microwave interactions utilizing a multi-frequency approach from different snow cover types on Arctic FYI requires further examination. Space-borne scatterometer systems such as the Advanced Scatterometer (ASCAT) (C-band; 5.2 GHz) and Quick Scatterometer (QuikSCAT) (Ku-band; 13.4 GHz), and SAR systems such as Sentinel-1, RADARSAT-2 (C-band; 5.5 GHz), TerraSAR-X and Constellation of Small Satellites for the Mediterranean basin Observation (Cosmo-SkyMed) (X-band; 9.6 GHz) operate over a wide range of varying spatiotemporal resolutions, coverage areas, and polarization combinations. Owing to high spatiotemporal variability of the snow cover on FYI, correlating a SAR pixel to the underlying snow thermophysical properties adds significant uncertainty for direct thermophysical interpretation. Additionally, all of the above-mentioned space-borne platforms operate over coarse temporal resolutions making it extremely difficult to quantify plot-scale variations in microwave backscatter due to the dynamic changes in snow thicknesses. Plot-scale studies are crucial to understand detailed high-resolution behavior of various thermophysical processes from different snow cover types, which dictate the microwave backscattering behavior at multiple frequencies. Using surface-based and air-borne multi-frequency and multi-polarization measurements, a significant amount of research has investigated microwave backscatter sensitivity to plot-scale changes in snow thermophysical properties (e.g., [14,17,18,19,20]). However, no previous studies have explored the potential of characterizing these plot-scale polarization-dependent multi-frequency microwave backscatter diversity from different snow cover types on Arctic FYI.
2. Research Objectives
This study presents surface-based fully-polarimetric microwave backscatter measurements acquired at Ku- (17.25 GHz), X- (9.65 GHz) and C-band (5.52 GHz) frequencies from saline snow covers (14 cm, 8 cm and 4 cm) on smooth FYI. These frequencies relate closely to the center frequencies of recent and currently operational space-borne scatterometer and SAR systems like ASCAT, QuikSCAT, TerraSAR-X, COSMO-SkyMed, and RADARSAT-2. Utilizing a surface-based multi-frequency polarimetric microwave scatterometer system, this study explores the potential of a multi-frequency observational approach to characterize the diversity of Ku-, X-, and C-band and , its derived co-polarization ratios (), and the innovative dual-frequency ratios (), from the three different snow cover cases. Here, or sigma-naught is the conventional normalized measure of the radar return per unit area, from a distributed target, and VV or HH denotes co-polarized backscatter in vertical and horizontal polarizations, respectively. To accomplish our research objectives within the study context, we address the following questions:
- (a)
- What are the observable differences in Ku-, X- and C-band and and modeled penetration depths, as a function of , from the saline 14 cm, 8 cm and 4 cm snow covers on FYI?
- (b)
- How do various polarization-dependent dual-frequency ratios () and co-pol ratios () change with 14 cm, 8 cm and 4 cm snow covers on FYI?
- (c)
- Based on differences in , , , and from the 14 cm, 8 cm and 4 cm snow covers answered by (a) above, which polarization and frequency exhibit the greatest sensitivity with respect to changes in snow thickness?
3. Methods
3.1. Study Area
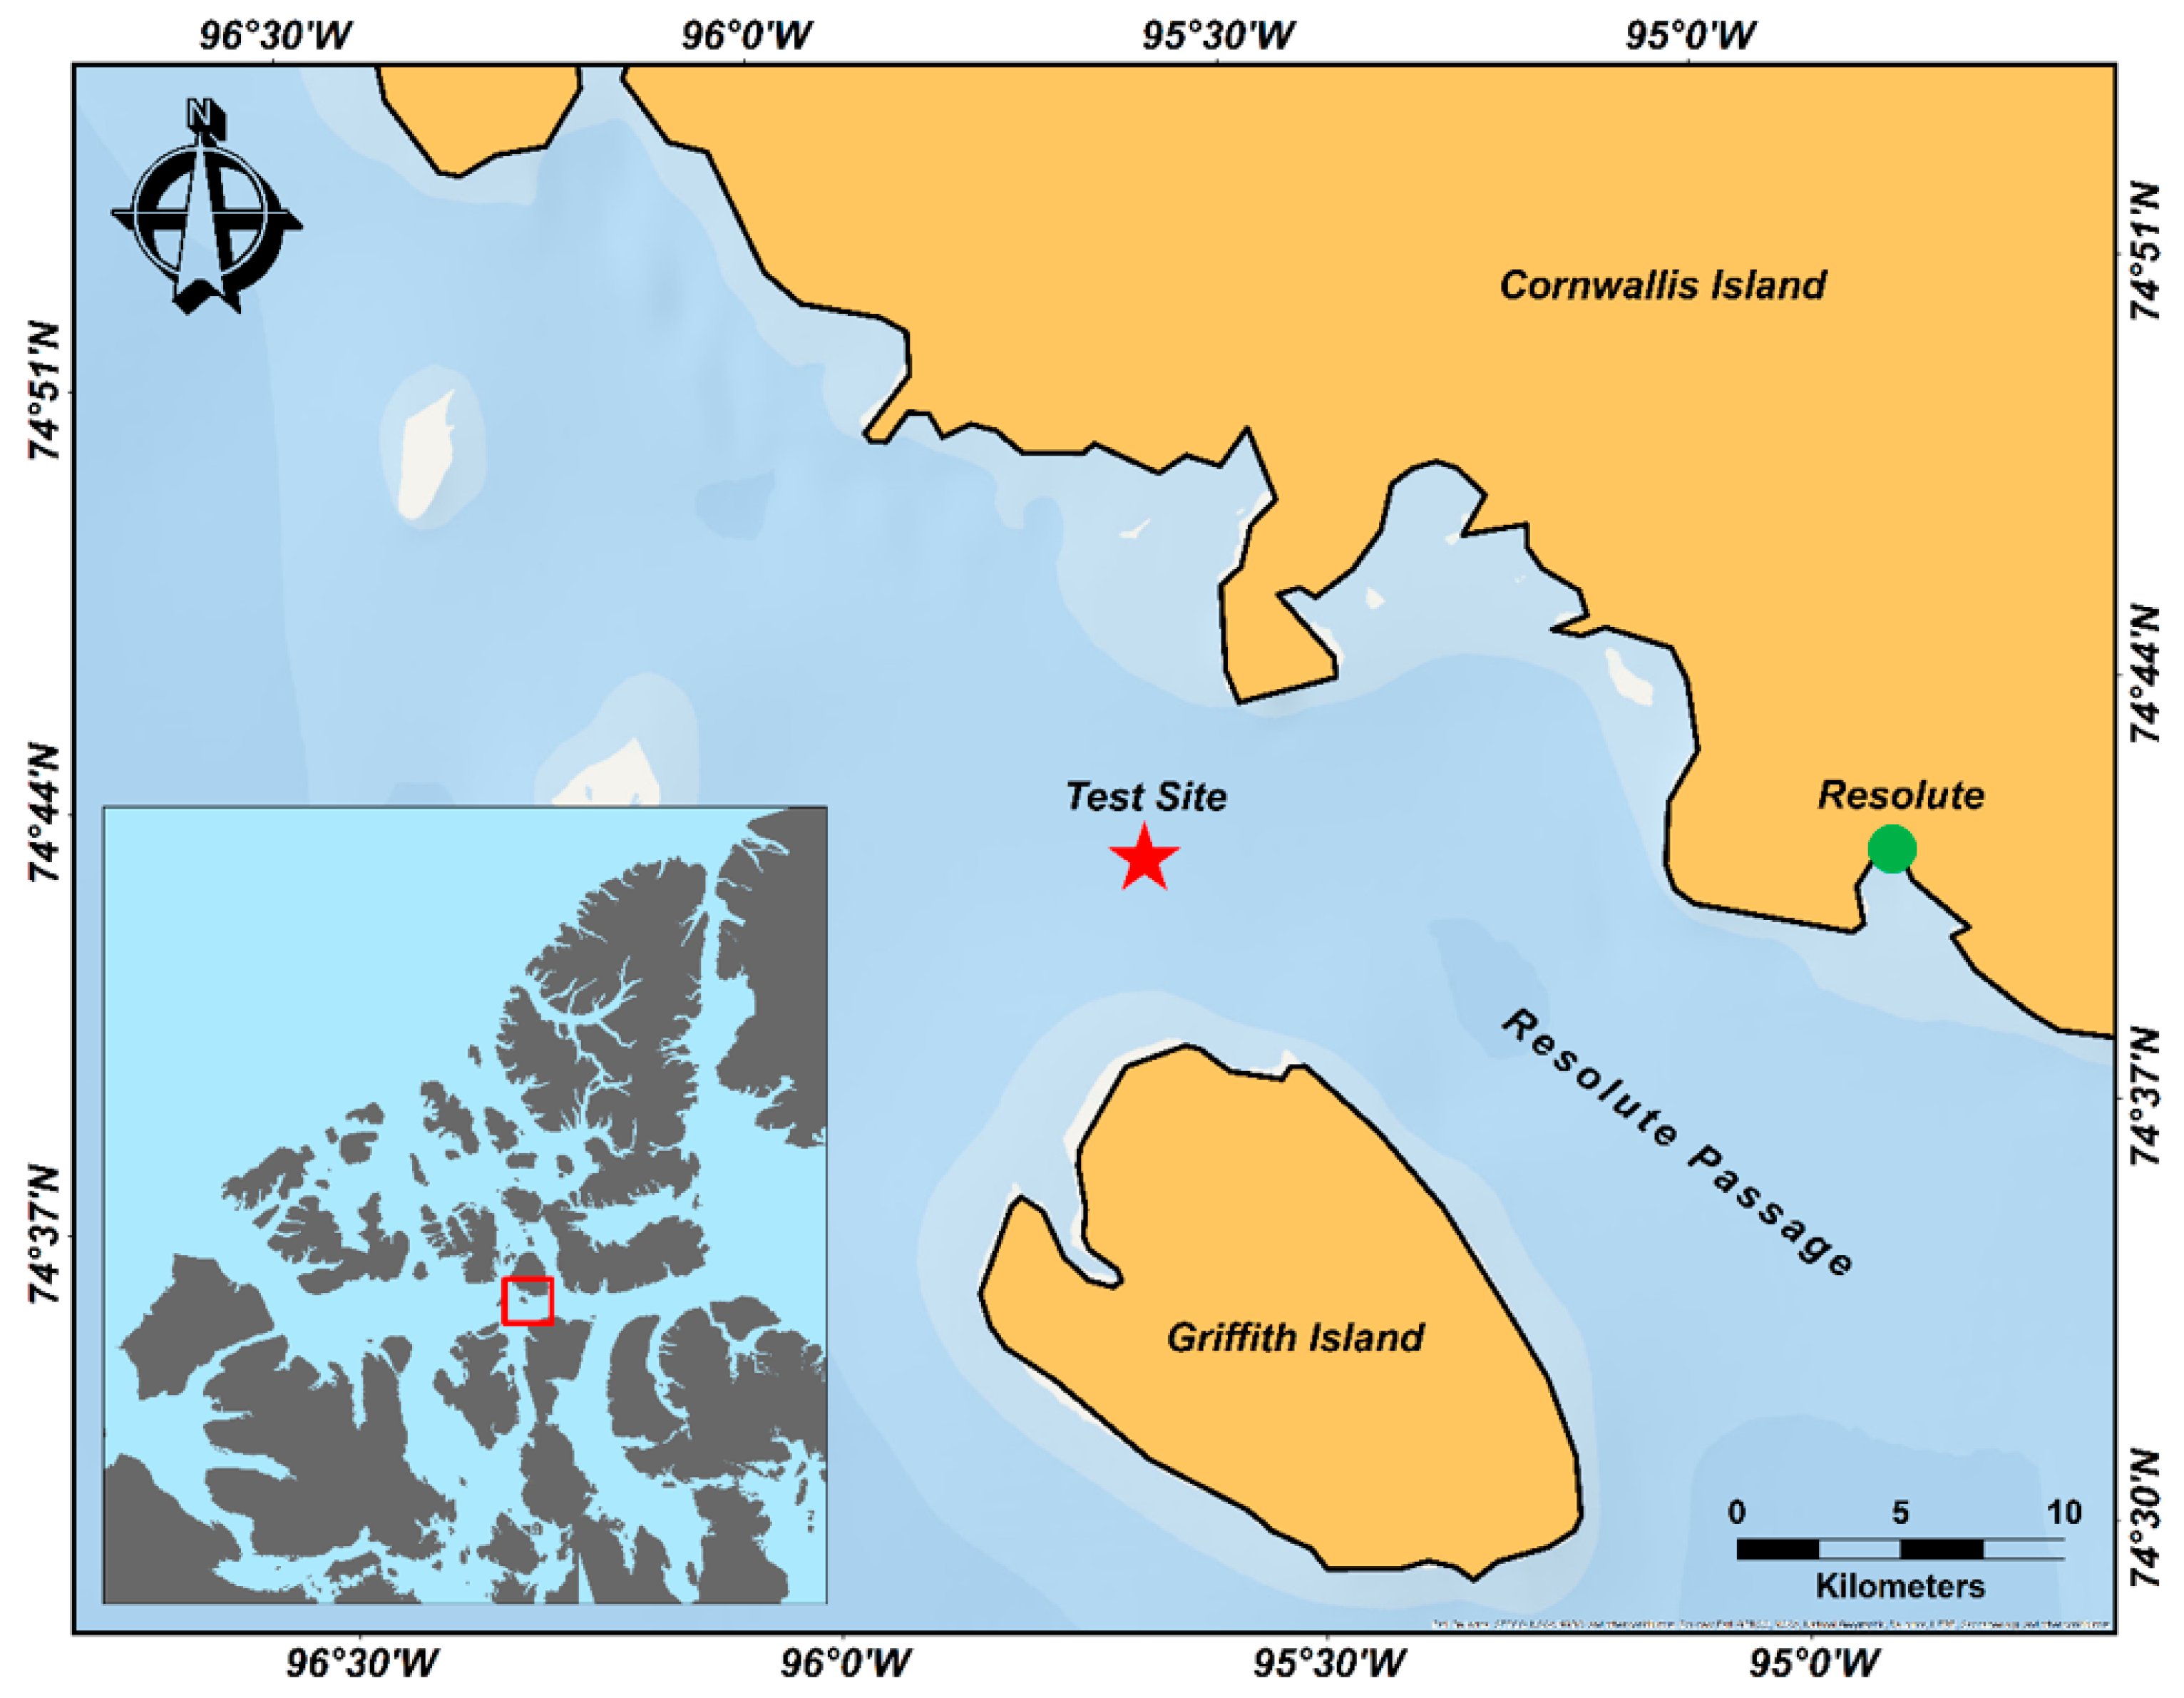
The surface based Ku-, X- and C-band scatterometer data () were acquired on 19 May 2012, from homogenous and saline 14 cm, 8 cm and 4 cm snow covers. The scatterometer measurements were acquired at ~9:45 a.m. (for 14 cm), ~12:25 p.m. (for 4 cm) and ~9:30 p.m. (for 8 cm) local time, respectively. The study site is situated near Resolute Bay, Nunavut, Canada (74.70°N, 95.63°W) (Figure 1), and dominated by relatively smooth, slightly deformed land-fast first-year ice types. The snow covers selected for this study are representative of snow covers on smooth FYI in the Canadian Arctic Archipelago (CAA), and their thicknesses fall closely to the mean interannual snow thickness ranges prior to melt-onset, previously reported by [6,9]. These snow cover cases fall on the lower end of the snow thicknesses, and is important to investigate, since increasingly thinner snow covers on Arctic sea ice are observed during mid- to late-winter seasons [3]. The air temperature () (in °C) measured using an on-sea ice installed micro-meteorological station (measured at one minute intervals and resampled hourly), were found to be consistently cold close to −13.5 °C, throughout the sampling period (Figure 2). No significant precipitation events such as snow falls were reported on 19 May 2012.

Figure 1.
Map of Resolute Bay region (indicated in green dot) in Resolute Passage in the Canadian Arctic, Nunavut, Canada. Study site location is indicated in red star. Snow covered first-year ice accumulated areas are depicted in light blue, and land in brown. Note: A similar figure with different color scheme can be found in [14].
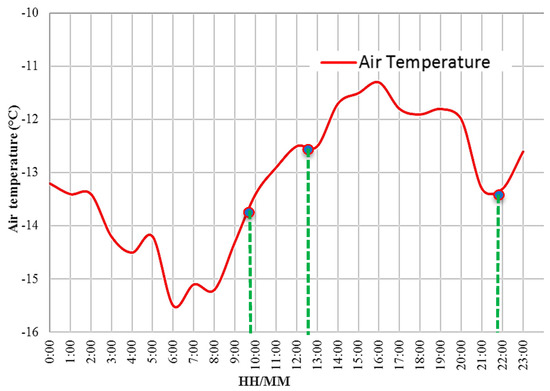
Figure 2.
Hourly air temperature measured on 19 May 2012, from the on-ice micro-meteorological station. Colored dots represent times of in-situ snow property measurements at ~9:45 a.m. (for 14 cm), ~12:25 p.m. (for 4 cm) and ~9:30 p.m. (for 8 cm) local times. Green vertical lines denote the timing of the scatterometer measurements quasi-coincident with the in-situ snow thermophysical property measurements.
3.2. Data Collection
3.2.1. Ku-, X- and C-Band Multifrequency Polarimetric Microwave Scatterometer System
The Ku-, X- and C-band fully-polarimetric measurements were acquired at a range resolution of ~30 cm using a surface-based multi-frequency scatterometer system (Figure 3). The Ku- (17.25 GHz) and X-band (9.65 GHz) UW-Scat scatterometer system operated concurrently with the C-band (5.52 GHz) scatterometer, with three overlapping replicate scans, completed within an hour. Detailed description of both scatterometer system specifications can be found under Table 1 in [14]; and details of calibration process, near-field correction and error determination documented in [21] (for Ku- and X-bands) and [18] (for C-band). In a 60° azimuth scan range, the scatterometer scan lines are averaged, as a function of system geometry and antenna beam-width, in order to obtain a minimum of 10 (Ku- and C-bands) and 15 (X-band) independent samples per scan line. The UW-Scat system acquired microwave backscatter at between 21° and 81° at 2° increments, while the C-band scatterometer system acquired data between 15° and 75° at 3° increments. A rough illustration of scatterometer acquisition method can be found in Figure 3b in [14]. Only the co-polarized backscatter coefficients ( and ) are used within our current study context, as the magnitude of cross-polarized is very low, owing to the high noise level (−50 dBm2 for Ku- and X-band and −36 dBm2 for C-band), restricting the usability of scatterometer measurements for upscaling to recently operating space-borne dual-polarized SAR systems.
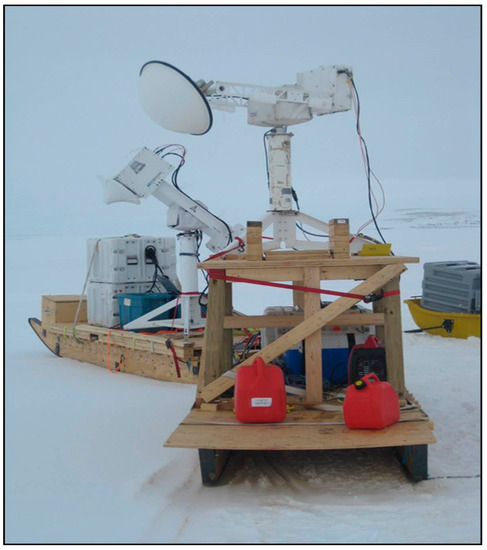
Figure 3.
Surface-based multi-frequency polarimetric microwave scatterometer system: C-band scatterometer (foreground), and UW-Scat (Ku- and X-bands) (background).

Table 1.
Snow cover and sea ice thermophysical properties for the 14 cm snow cover on smooth FYI for 19 May 2012. The total sea ice thickness was 1.3 m, and “sea ice” in the table represent the topmost 2 cm frazil ice core section. Note that snow and sea ice thermophysical properties for the 14 cm snow cover used here are adopted from Table 2 in [14].
3.2.2. Snow Thermophysical Property Observations
The 14 cm, 8 cm and 4 cm snow pits were located adjacent to the scatterometer scan area (~25 m × 25 m) at three different locations (located within ~100 m2), and snow thermophysical measurements were sampled quasi-coincident with the Ku-, X- and C-band scatterometer observations. Snow density (; sampled using a 66.35 cm3 density cutter with an accuracy of ±0.01 g), snow temperature (; measured using a 0.1 °C resolution Digi-Sense RTD thermometer probe at an accuracy of ±0.2 °C), snow salinity (; measured using a WTW Cond 330i conductivity meter with an accuracy of ±0.5%) and snow grain radius (; measured from disaggregated snow grains on a 2 mm grid crystal plate and classified following [22] were sampled from all three snow covers, sampled every 2 cm in vertical profile. Post-measurement destructive snow sampling (including snow thickness and thermophysical measurements) of the scatterometer scan area revealed that the snow cover was consistent with the adjacent snow pit used for sampling snow thermophysical measurements. However, it has to be noted that stochastic variability in snow thermophysical properties from a single snow cover from different snow pits located within small spatial scales may exist [16]. This study also assumes the air/snow interface and within-snow interfaces to be radar smooth [14]. This is important to be noted as the both the scatterometer systems are not co-located and scan a relatively wide area at 60° azimuth scan range; and therefore the snow covered area covering the scatterometer scan area is assumed to be isotropic in nature.
The 8 cm snow cover (Figure 4b) exhibited similar snow vertical structure as the 14 cm snow cover (Figure 4a) (detailed schematic and description of the vertical stricture of the 14 cm snow cover based on snow grain types can be found in [14]. The 4 cm snow cover consisted of highly brine-wetted rounded depth hoar crystals (Figure 4c). All layers for all three snow covers contained significant amounts of brine. Field measurements from the three snow thicknesses show a highly saline bottom 4 cm basal layer (~6—~20 parts per thousand (ppt)) consisting of somewhat-rounded depth hoar crystals (Table 1, Table 2 and Table 3). High salinities in the basal snow layers are due to significant upward brine wicking [16,23,24]. The presence of brine throughout the snow cover during the late winter season are less commonly observed as snow covers are brine-wetted usually during freeze-up, and snow covers overlaying highly saline frost flowers. [16,23].
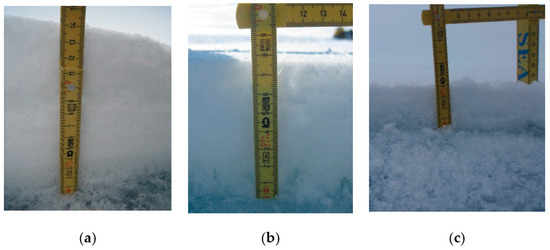
Figure 4.
Sample snow cover on first-year sea ice (FYI) located adjacent to the scatterometer scan area: (a) 14 cm; (b) 8 cm; and (c) 4 cm.
Table 2.
Snow cover and sea ice thermophysical properties for the 8 cm snow cover on smooth FYI for 19 May 2012. The total sea ice thickness was 1.3 m, and “sea ice” in the table represent the topmost 2 cm frazil ice core section.
Table 3.
Snow cover and sea ice thermophysical properties for the 4 cm snow cover on smooth FYI for 19 May 2012. The total sea ice thickness was 1.3 m, and “sea ice” in the table represent the topmost 2 cm frazil ice core section.
3.3. Brine Wetted Snow Dielectric Modeling and Penetration Depth
The dielectric permittivity, and dielectric loss, for all three brine-wetted snow covers are calculated for each frequency (Table 2 and Table 3). The first step involves calculating layer-wise brine volume following [23].
where is the density of brine in g/cm3, is the temperature-dependent density of pure ice in g/cm3, is the snow density in g/cm3, and is the temperature-dependent brine volume fraction of sea ice. From the layer-wise and , we calculate the and for each snow layer for all three snow covers. For fresh dry snow on FYI, the dielectric permittivity equals the permittivity of dry snow , which is frequency independent [25]:
where is the dry snow density in g/cm3. For snow brine-wetted snow layers, becomes the permittivity of brine-wetted snow , calculated using a dielectric mixture model following [25].
where is a saturation-dependent dielectric depolarization factor, set to 1.33 [26], and is the frequency- and temperature-dependent permittivity of brine [26].
For fresh dry snow on FYI, the dielectric loss equals the dielectric loss of dry snow (), which is <0.01 according to [27]; here is set at 0.001. For brine-wetted snow layers, becomes the dielectric loss of brine-wetted snow (), also calculated using a dielectric mixture model according to [25].
Employing the modeled and , the penetration depth into the snow cover, ignoring scattering losses is derived following [28]:
where is the free space sensor wavelength. The two-way loss for a snow layer is given by
where the extinction coefficient is the inverse of , is the incidence angle within the snow layer based on the degree of refraction, and is the snow layer thickness (0.02 m). The maximum is attained using the equation , where is the power at the air/snow interface and is the power at depth [14,29]. Hence, the deepest layer to which microwaves penetrate corresponds to approximately one third of the initial power that enters the snow layer [14,30].
3.4. Microwave Co-Polarization Ratio () and Dual-Frequency Ratios ()
The transmissivity and reflectivity influence the observed Ku-, X- and C-band and depending on polarization and , with the VV-polarized waves exhibiting greater transmissivity than HH-polarized waves, and HH-polarized waves exhibiting greater reflectivity. The co-polarization ratio or co-pol ratio () (in dB) is used to quantify this polarization-based difference in linear backscatter at the same frequency. For e.g., Ku-band is given by
With contrast in dielectric mismatch between the air/snow, within-snow and snow/sea ice interfaces, transmissivity and reflectivity of VV- and HH-polarized waves differ, modeled after Fresnel reflection coefficients [31]. Moreover, salinity gradients within all three snow covers are high and different, which in turn can modify the snow dielectrics at Ku-, X- and C-bands. This introduces substantial frequency-dependent polarization diversity between and , which in turn modifies , from all three snow cover cases. Previous studies used employing a single-frequency approach (C-band), for discriminating snow covered FYI properties based on dielectric effects [10,12,15,32].
The dual-frequency ratio () (in dB) is the innovative parameter introduced in this study, and is the difference in the radar backscatter between any two frequencies at the same polarization. For example,
For X- and C-bands, ( and ); and for Ku- and C-bands, ( and ) are also calculated. is used in addition to , in order to investigate frequency-sensitive differences in and and also to understand the dominant behavior of a particular frequency with changes in snow electro-thermophysical properties for the three different snow cover cases.
3.5. Multilayer Snow and Ice Backscatter (MSIB) Model
A first-order multilayer snow and ice backscatter (MSIB) model is used to calculate surface scattering [32] and volume scattering [15] contributions of/within each snow layer, from within all three snow covers, also accounting for reflection, refraction and attenuation. The MSIB model utilizes snow layer thickness (m; 0.02 m in our case), (ppt), (°C), (g/cm3), (mm) and surface roughness parameters (root-mean square interface roughness (m); 0.005 m and correlation length (m), 0.03 m) as model inputs. The MSIB model does not include backscatter contributions from large scale deformed FYI features such as ridges, as the study area in this research falls under relatively smooth FYI. Previous studies [10,11,13,14,30] have used the MSIB model (modified version of methods originally formulated by [28,33] for various snow cover on sea ice related studies.
The MSIB model simulates the surface scattering contribution under the scalar estimates of the Kirchhoff physical optics method, for relatively smooth surfaces described by a Gaussian distribution function. The volume scattering is modeled based on the number density of ice/brine inclusions within each snow layer and their backscatter cross-sections [33]. The structure and radii of snow brine inclusions are unknown; therefore, we assume that they have a structure similar to that of water inclusions. The radii of snow brine inclusions used in this study fall within the Rayleigh scattering region, sensitive to volume scattering at C-, X- and Ku-band frequencies. Although snow grain radius ≥1 mm causes Ku-band microwave scattering from these snow grains to fall in the Mie scattering region, it is anticipated that the dominant volume scattering mechanism originate from/within the brine inclusions, given their significantly higher and . At C- and X-band, both the brine inclusions and the snow grains fall within the Rayleigh scattering region. Therefore, a Rayleigh volume scattering model integrated into the MSIB model is justified in this study. Detailed description of the MSIB algorithm can be found in [30].
3.6. Analysis Structure
The measured Ku-, X- and C-band and and associated , and (hereby jointly referred altogether as “microwave parameters”) are compared between the 14 cm, 8 cm and 4 cm snow cover cases, at near-(21° ≤ ≤ 30°) (NR), mid-(33° ≤ ≤ 42°) (MR) and far-range (45° ≤ ≤ 60°) (FR) incidence angles. Snow dielectrics for the three different snow covers are calculated for each frequency, and used in conjunction with the in situ measured snow salinities. This is to provide an enhanced thermophysical perspective on how changes in these parameters at different snow thicknesses, affect changes in Ku-, X- and C-band microwave parameters. The modeled penetration depths provide theoretical insight into the potential propagation capability of all three microwave frequencies and polarizations for different snow thicknesses. MSIB modeled surface and volume scattering contributions, as a function of frequency and polarization, are simulated for each of three snow covers to support explanations of the variations in the individual scattering mechanisms at varying snow thermophysical conditions from the three different snow covers. These measures could contribute to a better understanding of the interaction between changing snow thermophysical properties and corresponding dielectric properties and surface-based Ku-, X- and C-band microwave backscatter.
4. Results
This section individually illustrates and analyzes the Ku-, X- and C-band microwave parameters, at NR, MR and FR, against the three different snow cover cases. Snow thermophysical properties, modeled snow dielectrics and penetration depths are utilized to support the frequency- and polarization-diversities with change in snow thickness.
4.1. Ku-, X- and C-Band and and Modeled Penetration Depths
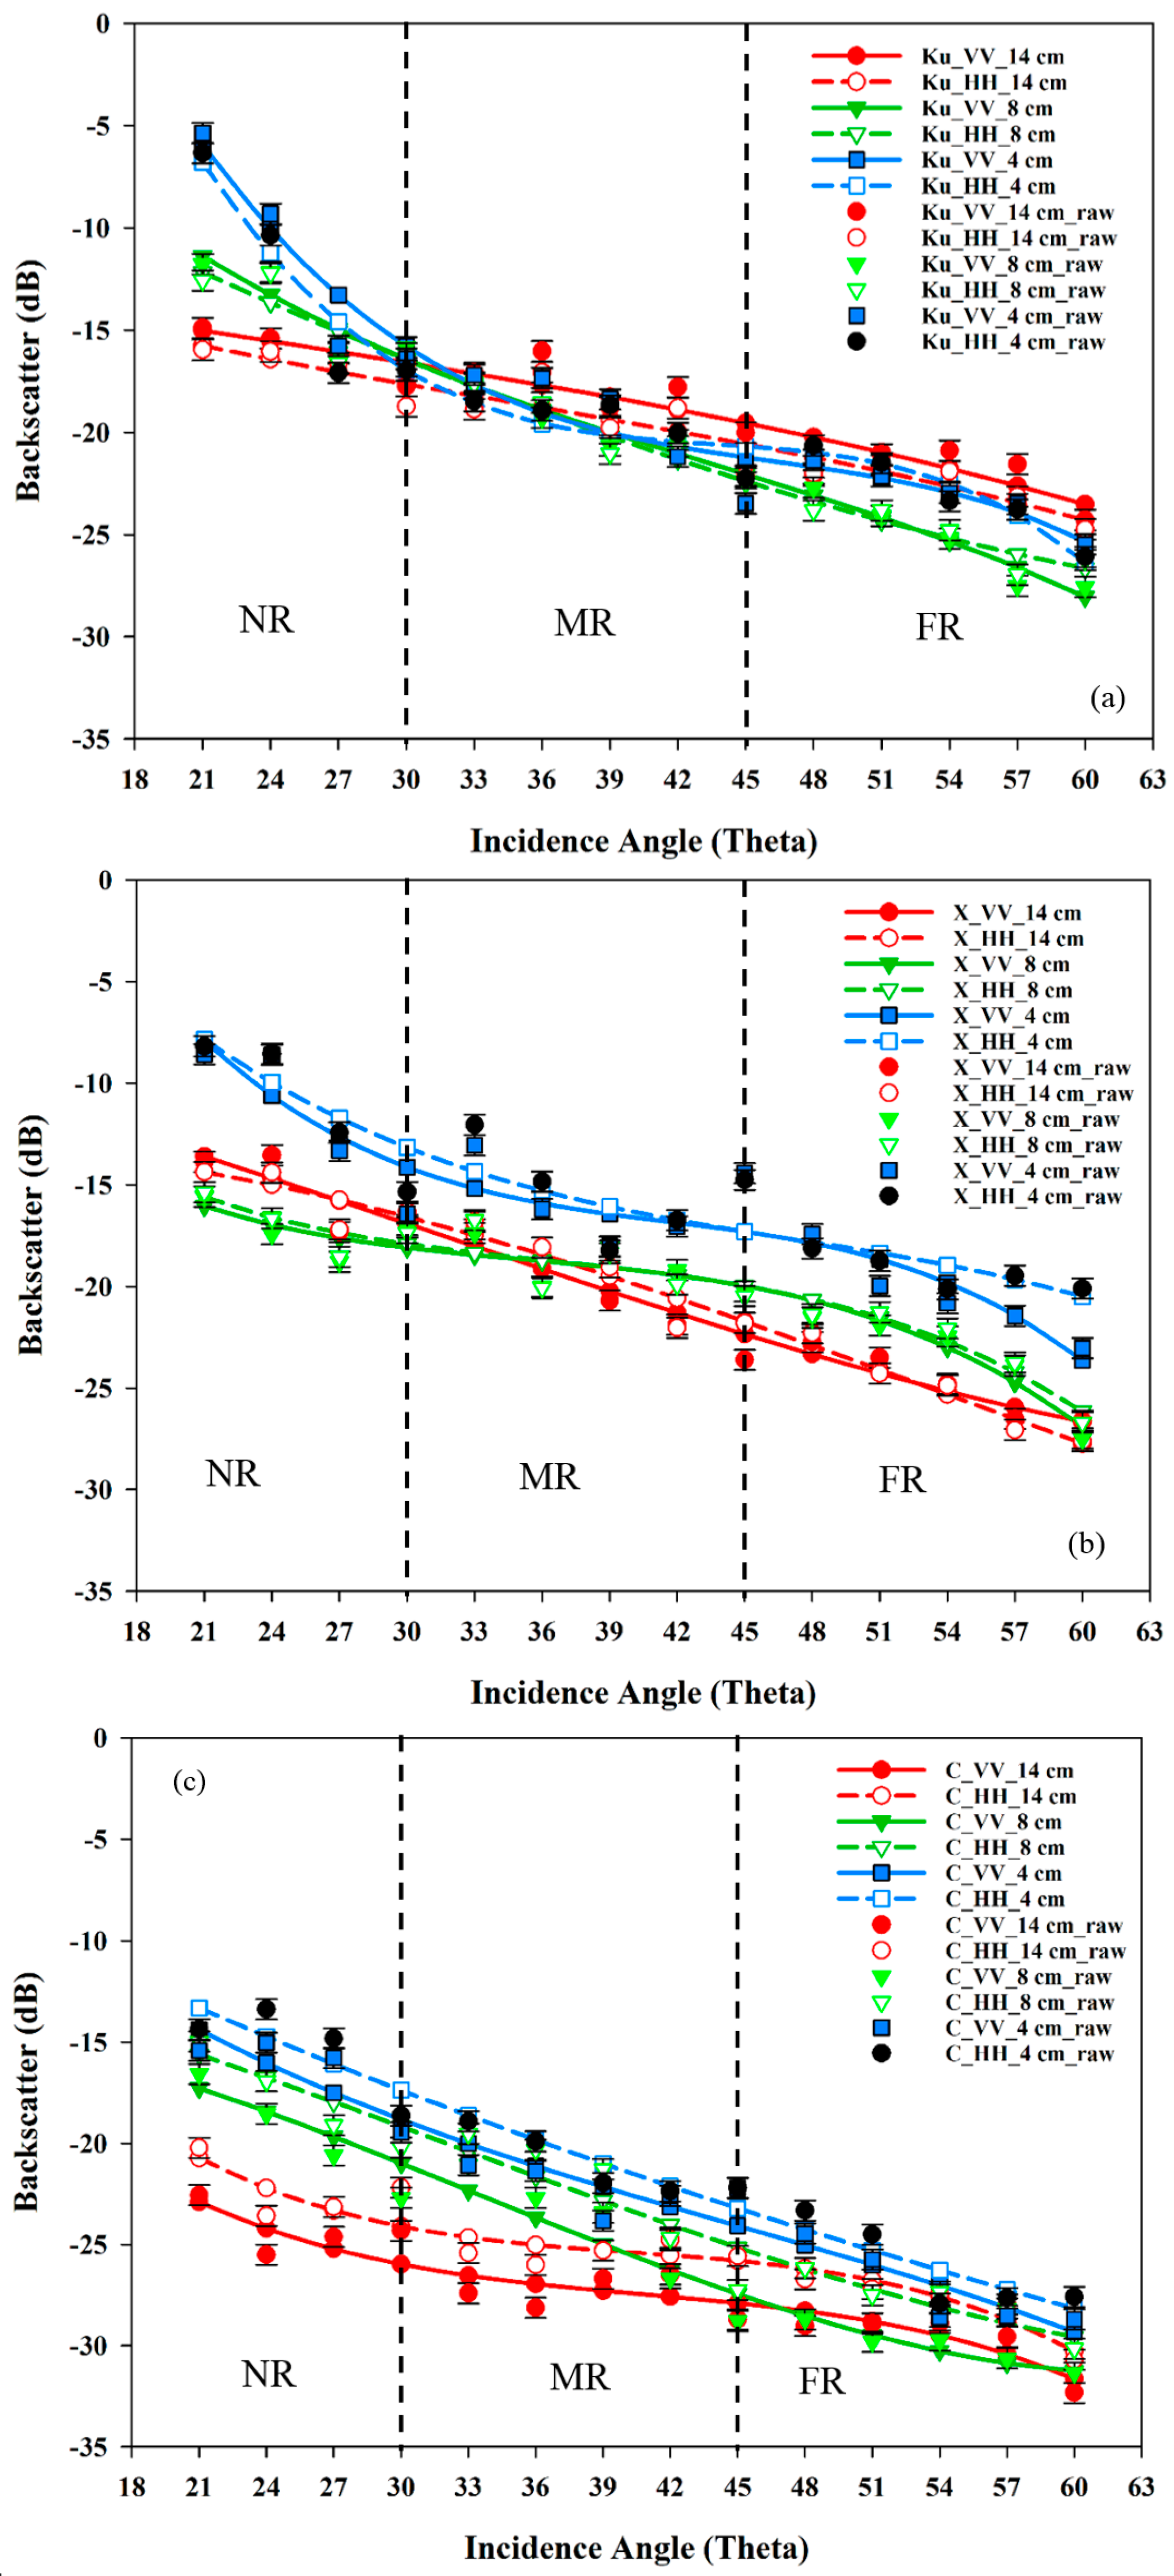
The observed Ku-, X-band and measured at NR for the 4 cm snow cover are ~5 dB and ~8 dB greater than for the 8 cm and 14 cm snow cover cases. (Figure 5a,b). Throughout all , Ku-band exhibits slightly greater than (~0.5 dB to 1.25 dB), for all three snow cover cases, when compared to X- and C-bands (Figure 5a). C-band consistently exhibits strong reflective behavior, with > by ~2.5 dB for all three snow cover cases (Figure 5c) [30,31], owing to its greater mismatch at the air/snow interface [10,11,12,14, when compared to X- and Ku-bands (Table 4). X-band on the other hand shows minimal polarization diversity throughout all , probably suggesting X-band’s sensitivity to surface roughness variations due to heterogeneous brine wicking (Figure 5b). This phenomenon has been observed in previous studies [14,33,34].
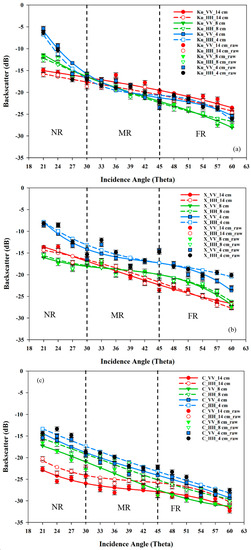
Figure 5.
Observed Ku-, X- and C-band backscatter ( and ), from 14 cm, 8 cm and 4 cm snow covers on FYI acquired on 19 May 2012: (a) Ku-band; (b) X-band; and (c) C-band. Scatterometer backscatter trend lines are cubic fits. Colored points represent measurement points with error bars indicating min-max deviation. Vertical black dotted lines partition near-range (NR), mid-range (MR) and far-range (FR) incidence angles.
Table 4.
Modeled multi-layer snow dielectric permittivity ( ) for the 14 cm, 8 cm and 4 cm snow covers on smooth FYI, for Ku-, X- and C-bands.
Modeled penetration depths show C-band exhibiting the maximum penetration depth of top 6 cm for the 14 cm snow cover, 4 cm (for the 8 cm snow cover) and 3 cm (for the 4 cm snow cover case) (Table 5). X-band penetrate only to the top 4 cm of the 14 cm snow cover, 3 cm in case of the 8 cm snow cover and 2 cm for the 4 cm snow cover case. On the other hand, Ku-band penetrate only to the top 1 cm and 2 cm, respectively, for all three snow covers (Table 5). All three frequencies are absorbed within the topmost snow layers due to the cumulative drop in microwave power while propagating through the lossy high brine volumes of the snow covers.
Table 5.
Modeled Ku-, X- and C-band penetration depths (from air/snow interface) (Equation (4)) from the 14 cm, 8 cm and 4 cm snow covers on FYI, acquired on 19 May 2012.
4.2. Ku-, X- and C-Band Co-Pol Ratio ()
The Ku-, X- and C-band demonstrate frequency separation, with prominent variability of with from all three different snow cover cases (Figure 6). For the 14 cm and 8 cm snow covers, Ku-band clearly shows greater than , especially in NR and MR, suggesting dominant volume scattering from the top most decomposed and fragmented precipitation particles ( ~0.8 mm; Table 1 and Table 2) (Figure 6a,b). X-band exhibits increasing reflective behavior with decreasing snow thickness, suggesting greater sensitivity of X-band HH-polarized waves to the increase in snow salinities and snow dielectrics (Table 4 and Table 6) (Figure 6a–c). C-band clearly exhibits greater than from all three snow covers, justifying strong reflective behavior of C-band HH-polarized microwaves (Figure 6a–c). Nevertheless, C-band microwaves do not exhibit characteristic variability of with , when compared to Ku- and X-bands, especially with the thicker 14 cm and 8 cm snow covers. The mechanisms responsible for this behavior are clear, as both 14 cm and 8 cm snow covers exhibit almost similar thermophysical (Table 1, Table 2 and Table 3) and dielectric properties (Table 4 and Table 6).
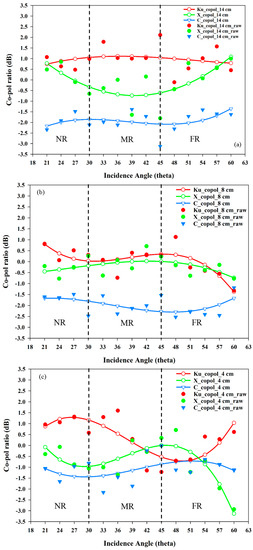
Figure 6.
Calculated Ku-, X- and C-band co-pol ratios () from 14 cm, 8 cm and 4 cm snow covers on FYI: (a) Ku-band; (b) X-band; and (c) C-band. Co-pol ratio trend lines are cubic fits. Colored points represent measurement points. Vertical black dotted lines partition near-range (NR), mid-range (MR) and far-range (FR) incidence angles.
Table 6.
Modeled multi-layer snow dielectric loss ( ) for the 14 cm, 8 cm and 4 cm snow covers on smooth FYI, for Ku-, X- and C-bands.
4.3. Ku-, X- and C-Band Dual-Frequency Ratios ()
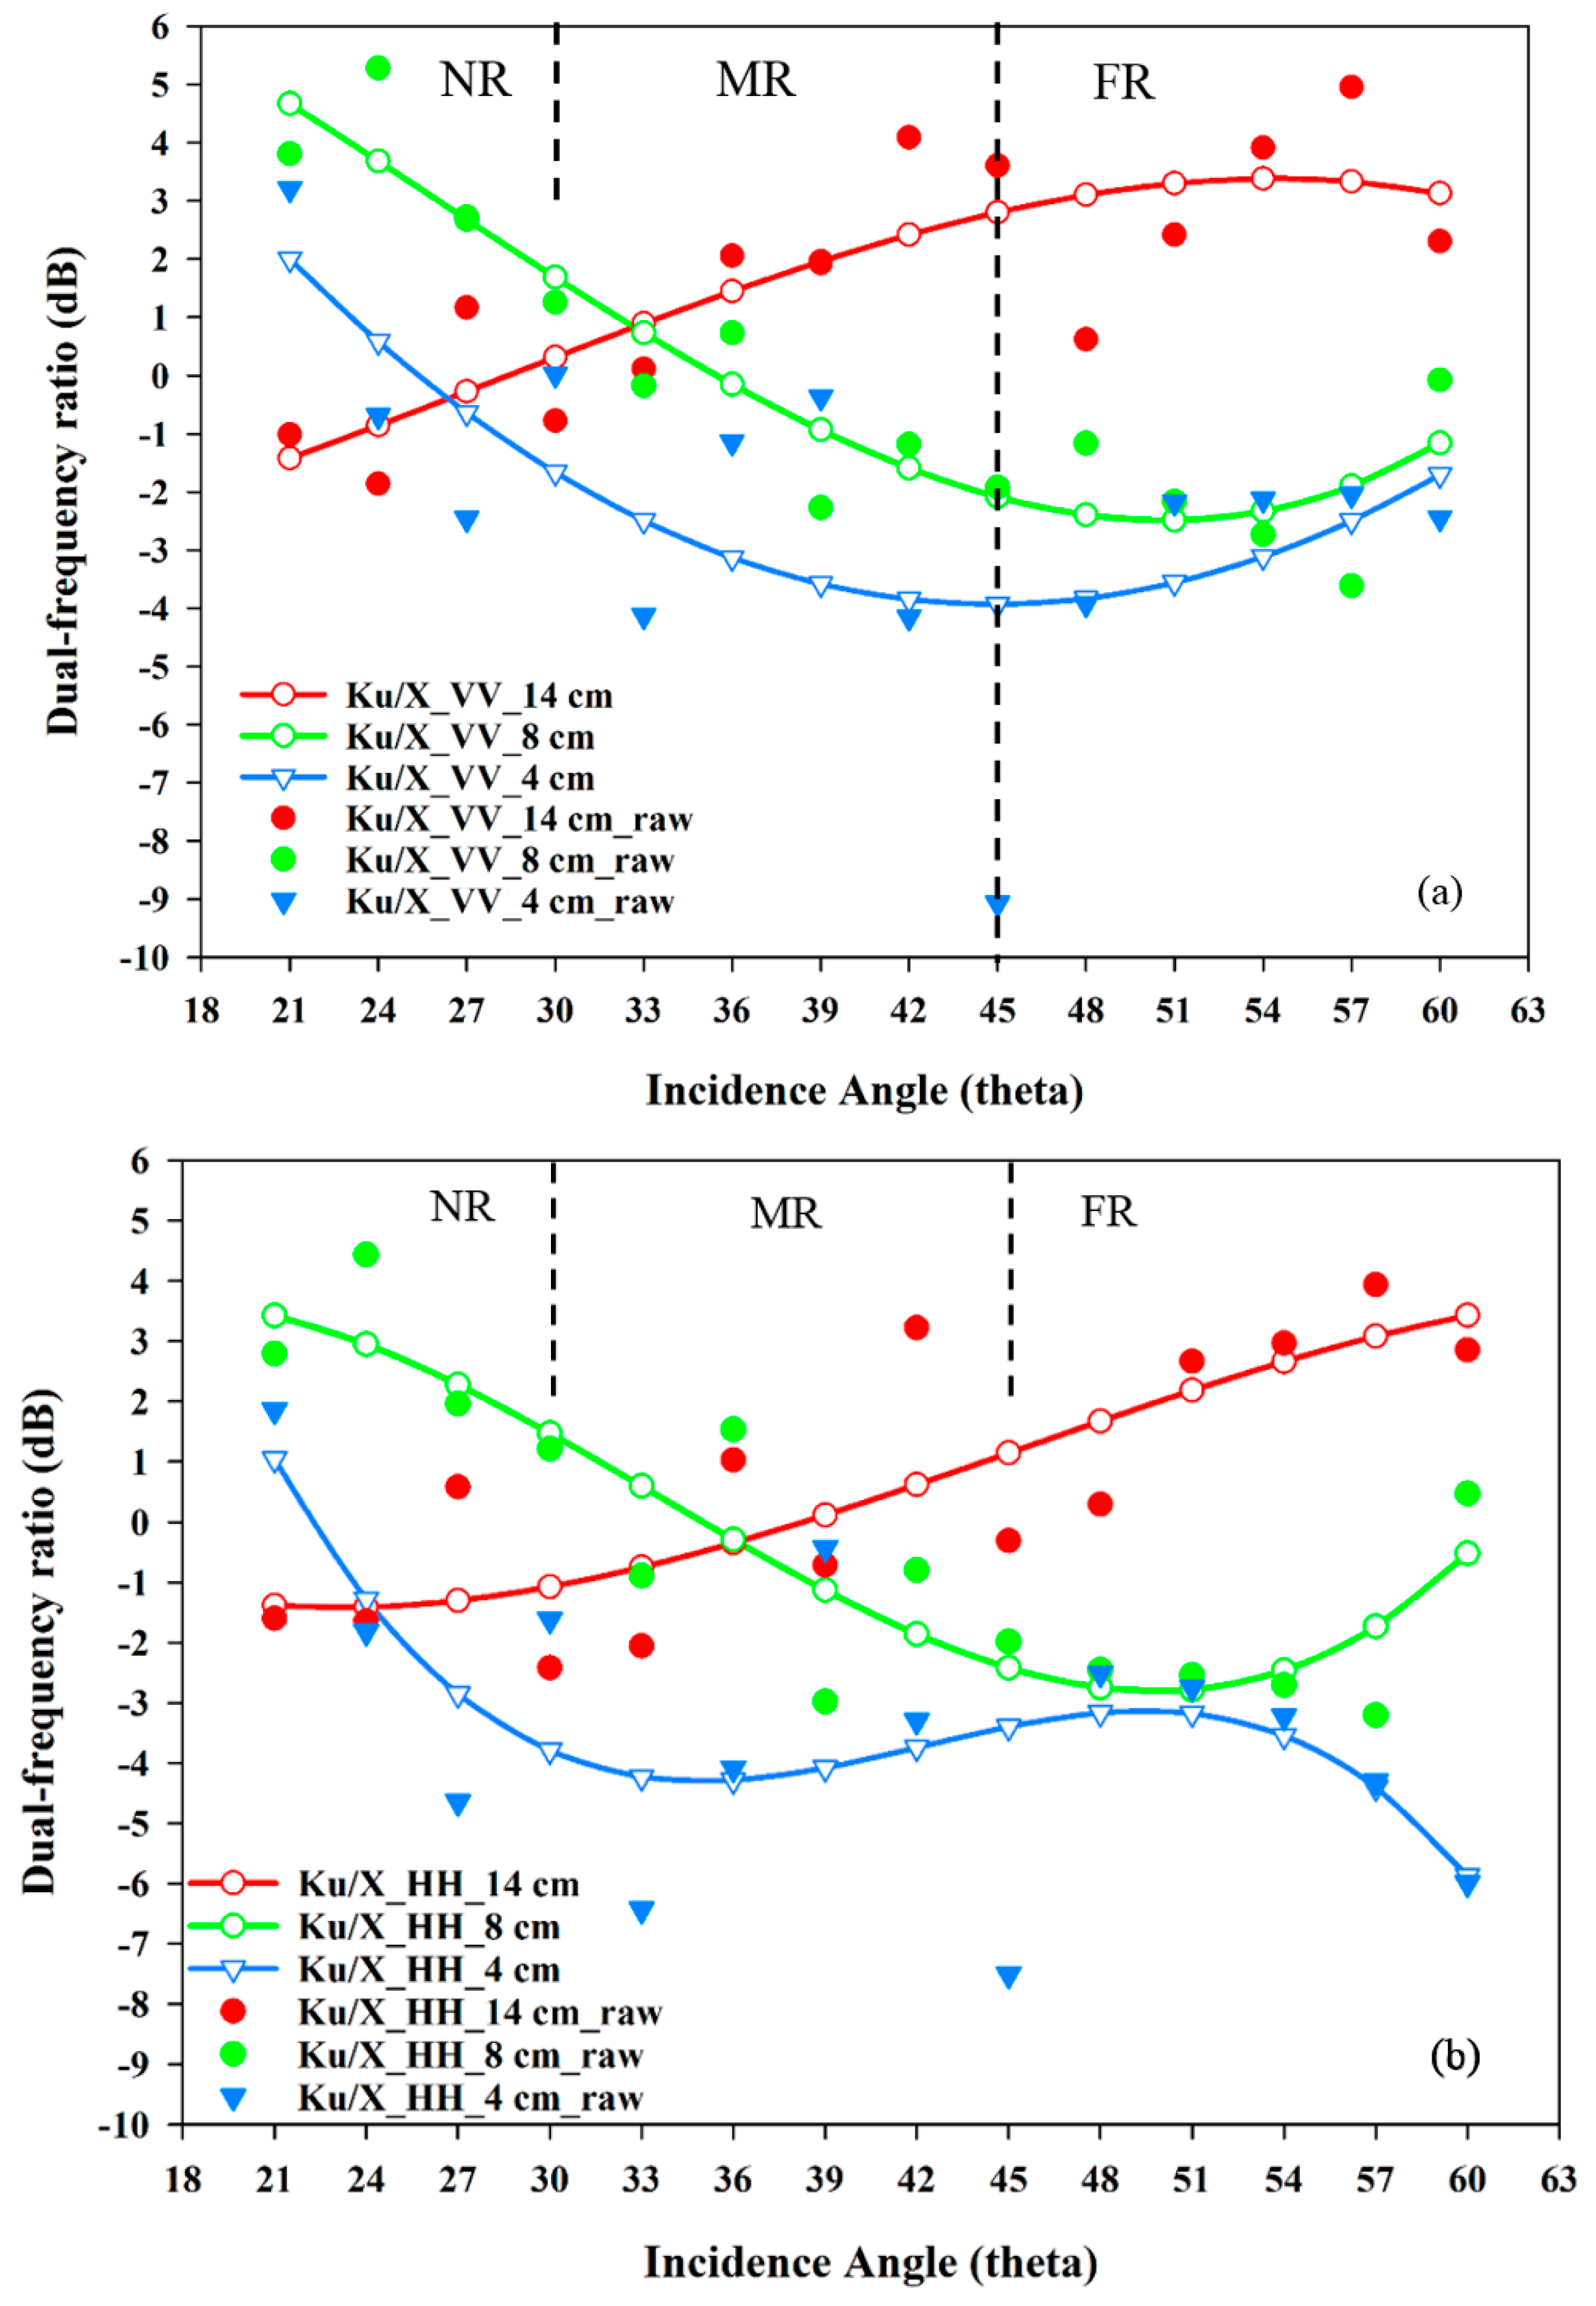
For the 14 cm snow cover case, the and increases with at Ku-band than at X-band by ~4 dB to 5 dB, clearly depicted by and (Figure 7a,b). This suggests the greater sensitivity of Ku-band microwaves to snow grain size, especially from the topmost decomposed and fragmented layers. This is clearly observed from MR to FR, where Ku-band separates X-band by crossing each other and exhibits asymptotic increase in Ku-band backscatter at these . However, in the case of 8 cm and 4 cm snow covers, and shows a steep decrease by ~7 dB, especially at NR, suggesting lesser sensitivity of Ku-band VV- and HH-polarized waves to thermophysical changes in thinner snow covers, when compared to X-band microwaves. Greater snow salinity gradients in the upper layers of the 8 cm and 4 cm snow covers (Table 2 and Table 3) lead to greater X-band and (Table 4 and Table 6). This results in increased X-band backscatter, which can be considered to be the dominant factor causing this frequency shift from thicker to thinner saline snow cover cases.

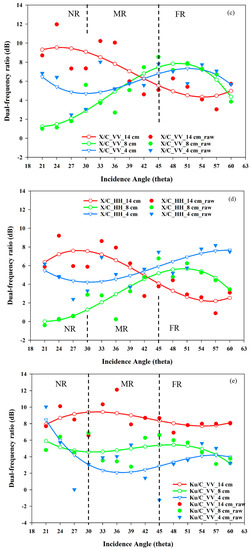
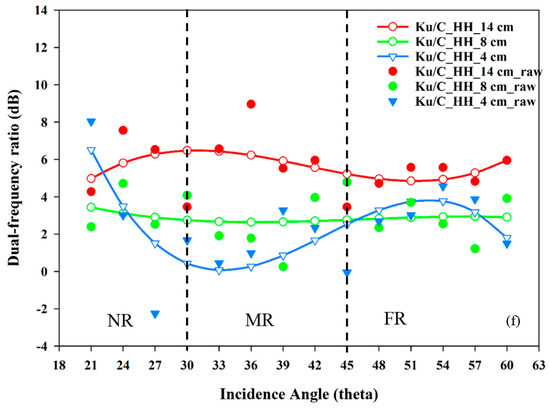
Figure 7.
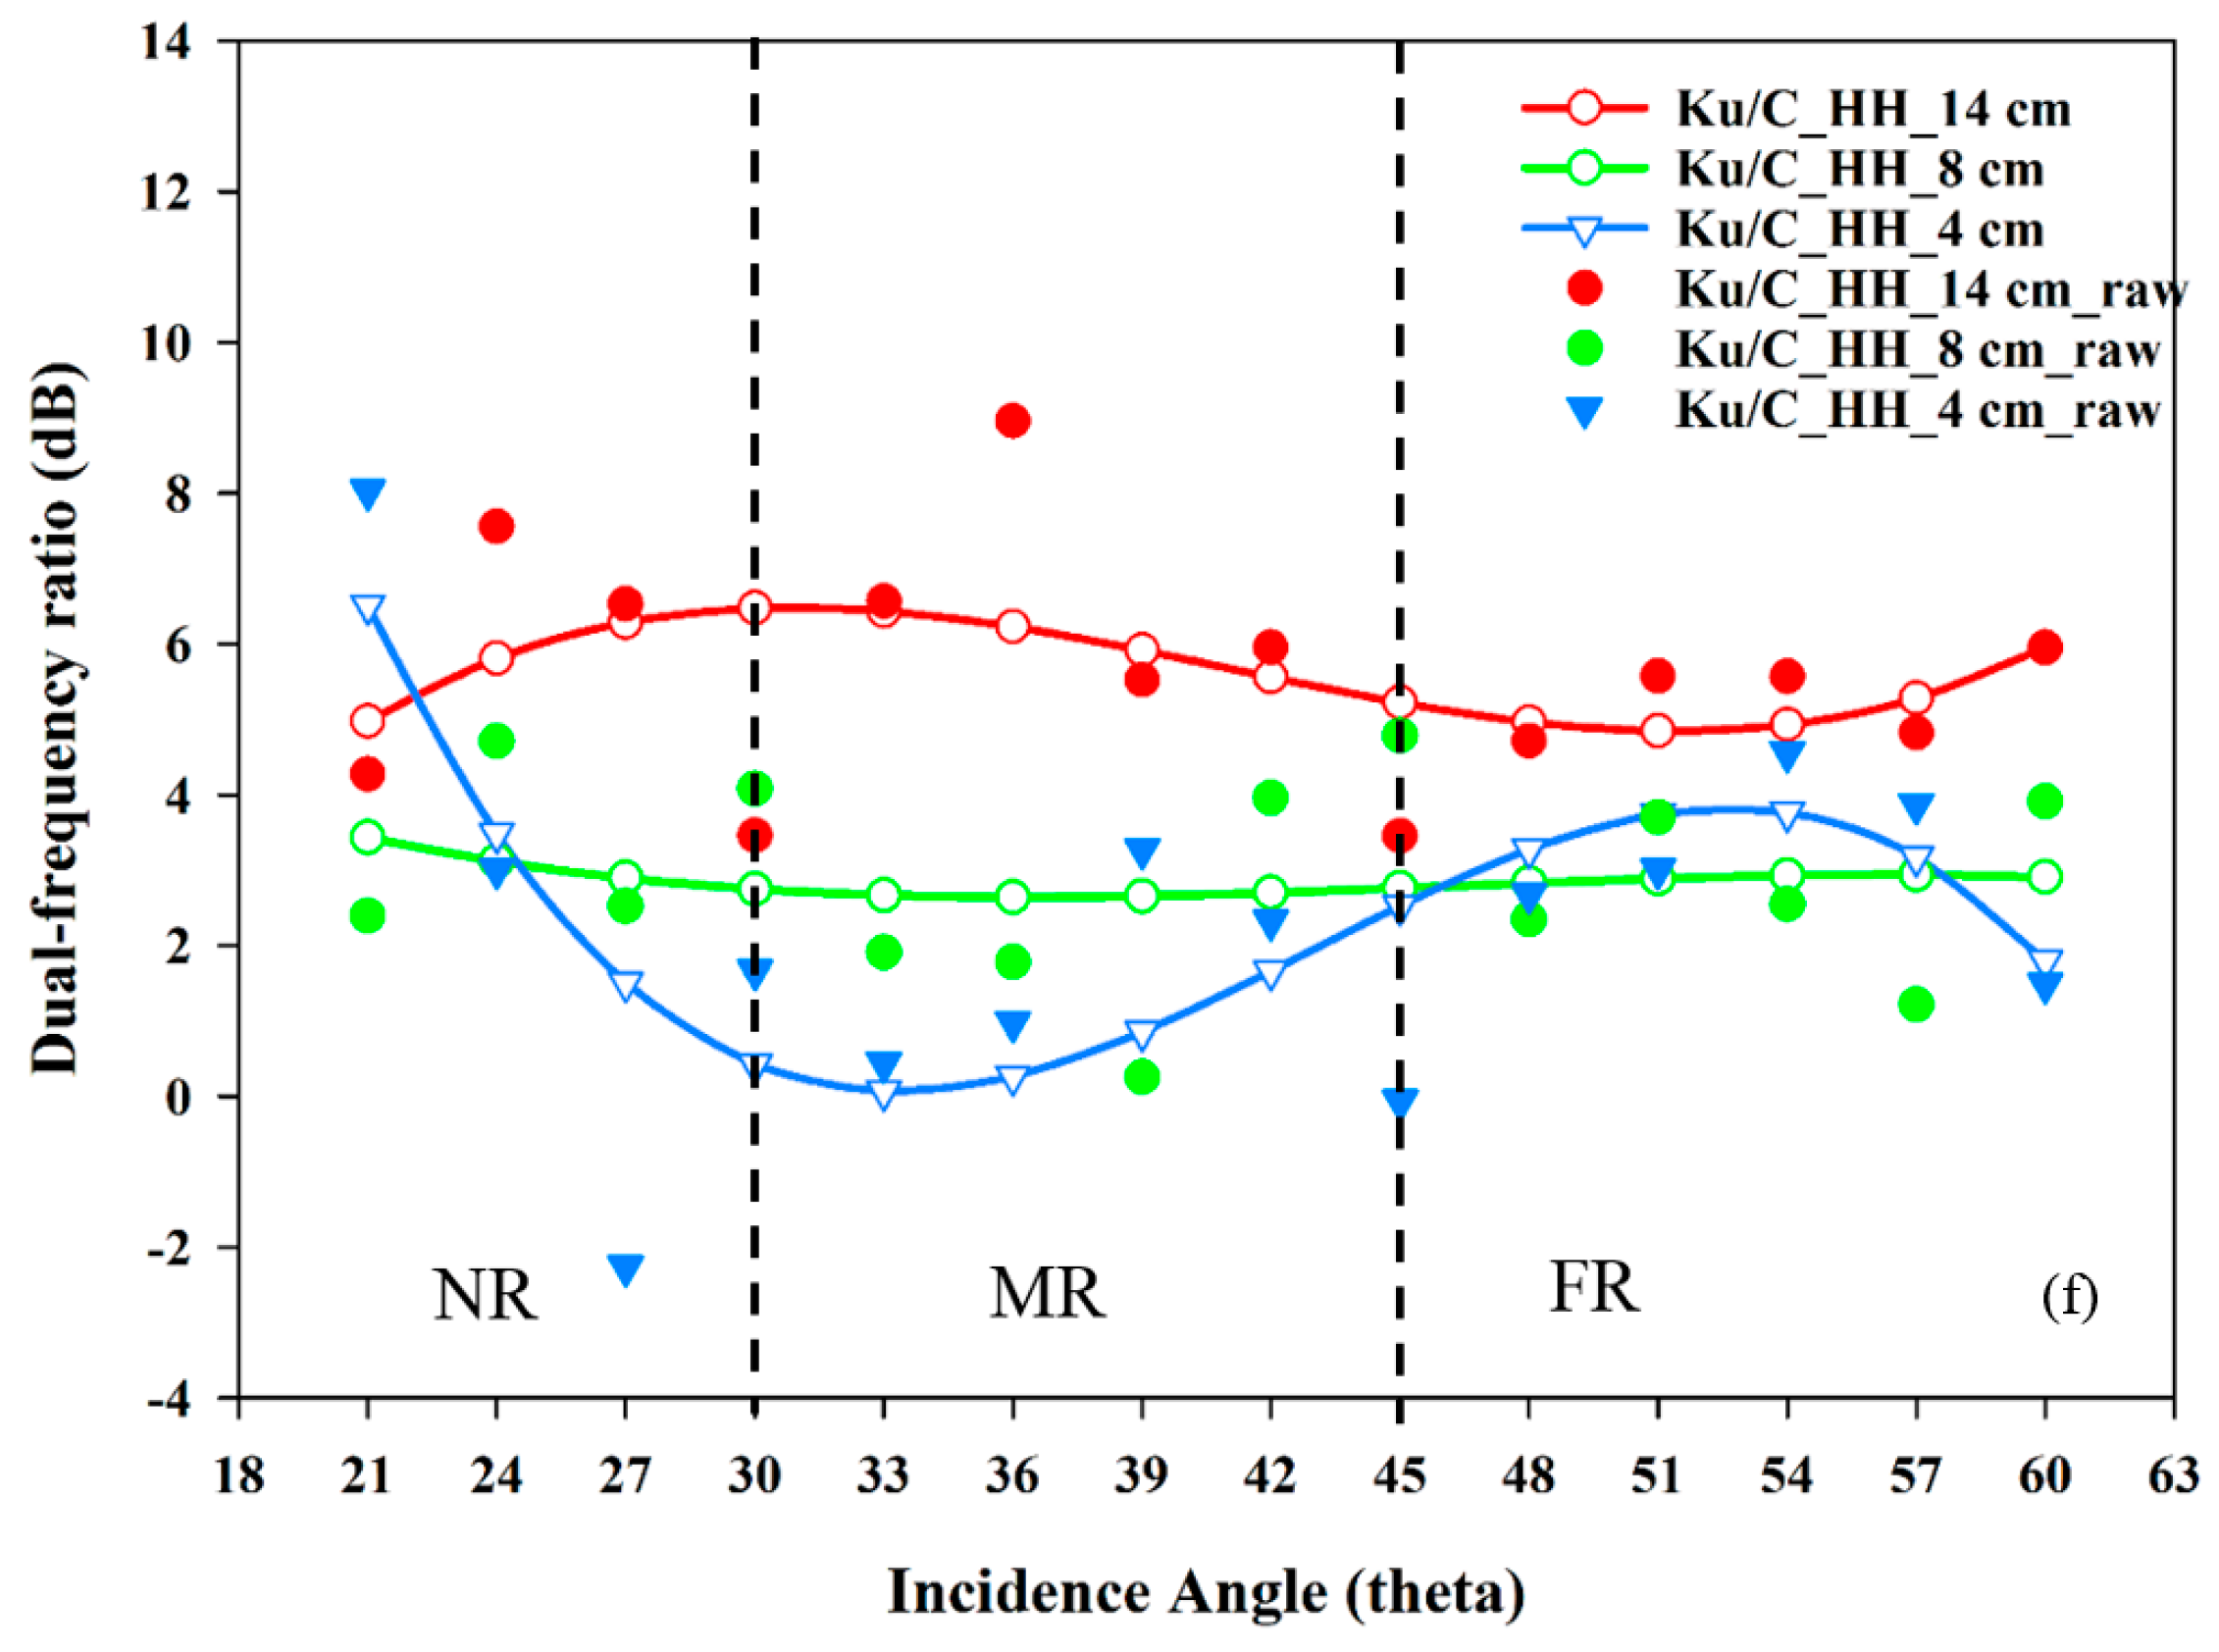
Derived (Ku-, X-), (X-, C-) and (Ku-, C-) VV and HH dual-frequency ratios () from 14 cm, 8 cm and 4 cm snow covers on FYI: (a,b) Ku- and X-band VV and HH ; (c,d) X- and C-band VV and HH ; and (e,f) Ku- and C-band VV and HH . Dual-frequency ratio trend lines are cubic fits. Colored points represent dual-frequency ratios from measurement points. Vertical black dotted lines partition near-range (NR), mid-range (MR) and far-range (FR) incidence angles.
Notable changes are also observed in and at FR for the 4 cm snow cover, where X-band increases by ~4 dB, while Ku-band illustrates an increasing trend, suggesting the importance of snow grain size affecting both Ku- and X-band total backscatter (Figure 7a,b). for the 8 cm and the 4 cm snow cover cases exhibit strong divergence towards Ku-band, thereby demonstrating the dominance of snow grain size affecting microwave backscatter especially at higher frequencies for thicker snow covers (Figure 7b).
The X- and C-band and shows strong sensitivity of X-band over C-band microwaves, throughout all , however fluctuating for different snow covers (Figure 7c,d). For the 14 cm snow cover, both and exhibit greater X-band magnitude at NR, when compared to C-band microwaves. This may be caused by X-band’s greater sensitivity to scale-dependent variations in surface roughness. It could also be due to the fact that, spatial variations in reduce the mean absorption, allowing greater X-band surface scattering from within-upper snow layer interfaces, when compared to C-band. This characteristic has been previously reported in several studies using the 14 cm snow cover case (e.g., [14,33,34]). As snow thickness decreases, polarization-dependent frequency separation reduces at MR, and both frequencies exhibit minimal frequency diversity. For example, as the snow thickness changes from 14 cm to 8 cm to 4 cm, separation between X- and C-band and reduces from ~9.5 dB for 14 cm to ~6.5 dB for 8 cm, to ~2.5 dB for 4 cm (Figure 7c,d). As increases from MR to FR, and from the 4 cm snow cover show a notable steep increase, suggesting possible X-band volume scattering contributions from the upper snow layer snow grains, along with surface scattering from the air/brine-wetted snow interface (Figure 7c,d). However, and drop off at the end of FR and continue to decrease, tending towards minimal frequency diversity.
The Ku- and C-band and show dominant Ku-band sensitivity over C-band throughout all , especially for the 14 cm thick snow cover case (Figure 7e,f). This suggests the predominance of higher frequency Ku-band microwaves and its strong sensitivity to snow grain size over lower frequency C-band microwaves. The effect of snow grain size is also visible for 8 cm; however, snow salinities in the upper layers of the snow cover (Table 1) contributes to strong surface scattering, thereby causing a decrease in the frequency separation between Ku- and C-bands. Snow salinities show its strongest effect for the 4 cm snow cover, where and clearly show a strong angular drop off in the NR, separating C-band from Ku-band. This drop-off is steeper in , justifying the greater sensitivity of C-band HH-polarized waves to changes in snow salinities, when compared to Ku-band HH-polarized waves (Figure 7f). As increases from NR to MR, volume scattering contributions from the depth hoar rounded grains dominates causing both and to gradually increase. However, at FR, shows a decreasing trend, suggesting greater sensitivity of HH-polarized waves to snow salinities over snow grain microstructure. However, further study is required in this aspect.
5. Discussions
5.1. Ku-, X- and C-Band and and Modeled Penetration Depths
Ku-band exhibits the highest of all three frequencies from all three snow cover cases. This is attributed to greater sensitivity of Ku-band VV-polarized waves to volume scattering [14] originating from the uppermost dense brine-wetted decomposed and fragmented precipitation particles of the 14 cm and 8 cm snow covers (Figure 5a), and also from rounded depth hoar crystals in the 4 cm snow cover. These snow grains act as effective scattering centers at Ku-band, leading to greater . Moreover, at higher microwave frequencies such as Ku-band, the influence of snow grains on microwave backscatter increases, leading to greater potential volume scattering estimates [14,15]. Moreover, MSIB model employing first-order Rayleigh scattering assumptions has shown its inability to simulate accurate microwave backscatter estimates at higher frequencies such as Ku-band [14,30], and warrants further research. Detailed description of sensitivity of higher microwave frequencies to snow microstructure can be found in [30].
Greater salinities in the topmost layer of the 4 cm snow cover (~6.9 ppt) (Table 3) results in the dielectric loss to be the strongest (Table 6), when compared to 3.6 ppt and 3 ppt observed for the topmost layer of the 8 cm and the 14 cm snow covers, respectively (Table 1 and Table 2). This results in the strongest surface scattering at the air/snow interface for the 4 cm snow cover, resulting in greater and for all three frequencies, followed by its relative from 8 cm and 14 cm snow covers. MSIB model shows ~80% to ~90% of the total backscatter to be surface scattering for all three frequencies.
Overall, the dominant factor controlling the penetration depth from all three brine-wetted snow covers is the dielectric loss (Table 6) associated with high salinity throughout the snow covers, with greatest effect on from the 4 cm snow cover, followed by 8 cm and 14 cm snow covers, respectively. Greater effect of snow salinity on HH-polarized waves is attributed to the greater surface scattering contributions originating from the dielectrically mismatched air/snow interface and/or within-snow interfaces, resulting in greater reflectivity of HH-polarized waves
5.2. Ku-, X- and C-Band Co-Pol Ratio ()
In the case of the 4 cm snow cover, Ku-band microwaves exhibit strong characteristic variability of with from NR to FR, when compared to the 14 cm and 8 cm snow covers. (Figure 6c). For the 4 cm snow cover, Ku-band exhibits greater volume scattering from the larger depth hoar rounded grains ( ~1.5 mm; Table 3), overpowering the surface scattering contributions from the air/snow interface. This is attributed to the greater sensitivity of higher frequency microwaves such as Ku-band to snow grain size. Previous studies and theory has demonstrated that Ku-band backscatter cross-section from larger snow grains and/or brine inclusions in snow depend on the 6th power of the grain radius, and is inversely proportional to the 4th power of microwave wavelength [15].
X-band microwaves exhibit a “U-shaped” signature from the 14 cm snow cover, from NR to FR, suggesting a combined effect of surface and volume scattering contributions from the topmost snow layers (Figure 6a). However, as snow salinity increases in 8 cm and 4 cm, the characteristic variability of with drastically increases (Figure 6b,c), overpowered by greater due to stronger (Table 2 and Table 3), with correspondingly higher and gradients in the 4 cm snow cover (Table 4 and Table 6), when compared to the 14 cm and 8 cm snow cover cases. increases substantially in the case of 4 cm snow cover, and fluctuates especially from MR to FR (Figure 6b). This suggests X-band’s greater sensitivity to micro-scale surface roughness variations, when compared to Ku-band [32].
However, C-band exhibits slight difference between the 14 cm and 8 cm snow covers at NR, with the 8 cm snow cover exhibiting slightly greater than (~1 dB), when compared to the 14 cm snow cover, indicating the from the 8 cm snow cover to be more isotropic at steeper . Even though C-band exhibits dominant , as snow thickness decreases, the magnitude of decreases slightly by 0.5 dB at MR and FR. This could result from volume scattering contributions from the depth hoar snow grains, especially from the 4 cm snow cover (Table 3) which has entirely different thermophysical structure when compared to the 14 cm and 8 cm snow covers (Table 1 and Table 2).
Overall, the salinity of the upper snow layers from all three snow covers is the primary source of greater sensitivity of X- and C-band HH-polarized waves over VV-polarized waves with change in snow thickness. When compared to C-band, X-band shows greater sensitivity to changes in snow salinity from the upper layers. Ku-band microwaves show fluctuating polarization diversity as snow thickness decreases, however the magnitude of fluctuations are less, when compared to X-band microwaves. This could be due to greater sensitivity of Ku-band microwaves to snow grain size and/or presence of brine inclusions in snow.
5.3. Ku-, X- and C-Band Dual-Frequency Ratios ()
This study also investigates how different combinations behave for a single snow cover. In the case of 14 cm snow cover, and shows the strongest frequency diversity (Figure 7e,f), followed by and (Figure 7c,d); and and (Figure 7a,b). Snow grain size shows a stronger effect from the relatively thick 14 cm snow cover, with greater sensitivity from Ku-band microwaves. In the case of 8 cm snow cover, the Ku- and C-band shows consistent greater Ku-band sensitivity to C-band (~5.5 dB) throughout all . X- and C-band and Ku- and X-band shows increasing and decreasing trends, respectively, with increasing , suggesting strong X-band sensitivity, followed by Ku- and C-band. In the case of 4 cm snow cover, all three combinations show clear separability between frequencies, with the strongest consistent separation (~7 dB) between Ku- and X-band and Ku- and C-band , throughout all . X- and C-band falls in between the other two combinations.
Overall, the different combinations from the three different snow covers demonstrate its utility to be classified as a new “polarimetric parameter” to provide new information, on the sensitivity of polarization- and frequency-dependent microwave backscatter, to changes in snow thickness with corresponding fluctuations in snow thermophysical properties. The (based on multi-frequency approach) also provides additional information, when compared to (based on single-frequency approach). Therefore, helps in separating dominant polarization-dependent frequencies, sensitive to changes in snow thermophysical properties
6. Conclusions
The research evaluated an observational multi-frequency polarimetric microwave dataset to investigate Ku-, X- and C-band microwave co-polarized backscatter and modeled microwave penetration depths, acquired from three different saline snow covers (14 cm, 8 cm and 4 cm) overlying smooth land-fast first-year sea ice. We compared and investigated differences in co-polarized backscatter observations ( and ) and co-pol ratios , as a function of incidence angle (), for all three frequencies from all three different snow cover cases. The newly-introduced polarization-dependent dual-frequency ratios illustrated distinctive separability of frequencies and polarizations from all three snow cover cases.
Scatterometer observations, supported by in-situ snow thermophysical parameters, modeled snow dielectrics and penetration depths, demonstrate differences in Ku-, X- and C-band and for all three snow cover cases. As expected, the completely brine-wetted 4 cm snow cover (bulk snow salinity of 7.5 ppt) demonstrated increased and , when compared to its relative backscatter from 8 cm and 14 cm snow cover cases. C-band achieved the maximum penetration with 6 cm penetration for the 14 cm snow cover, while 4 cm for the 8 cm snow cover, and 3 cm for 4 cm snow cover (Table 5). Overall, the dominant factor controlling the penetration depth from all three brine-wetted snow covers is the dielectric loss associated with high salinity throughout the snow covers, with greatest effect on HH-polarized waves from the 4 cm snow cover, followed by 8 cm and 14 cm snow covers, respectively.
The calculated co-pol ratios () clearly showed fluctuations as a function of frequency and polarizations from all three snow covers. X-band showed the greatest sensitivity to changes in snow thickness with greater observable polarization-dependent backscatter separation for the three different snow covers, as a function of incidence angle. This could possibly be due to greater sensitivity of X-band microwaves to plot-scale surface roughness variations and dielectric loss. Snow salinity measurements at higher resolution, to quantify micro-scale variability of snow dielectrics, are recommended in this regard. Ku-band showed minimal polarization diversity for a single snow cover, however differs with variation in VV-backscatter magnitude with change in snow thickness. Variability in snow grain microstructure variability is a factor for fluctuations within the dominant VV polarization. Even though the topmost snow layers showed substantial changes in snow salinities, C-band showed almost negligible polarization diversity between the three snow cover cases. C-band HH-polarized waves showed a comparatively greater backscatter than VV-polarized waves, justifying the strong reflective behavior of C-band microwaves, due to strong salinities throughout the snow covers, resulting in dielectric mismatches between air/brine-wetted snow interface and/or within-upper snow layer interfaces. This could suggest a lower sensitivity of C-band to changes in snow salinities. Further study is recommended in this regard.
The newly introduced dual-frequency ratios () provided a combinational metric approach to provide enhanced understanding on how multiple microwave frequencies interact with varying snow thicknesses on FYI. In general, all three dual-frequency ratios show strong sensitivity to changes in snow thickness, dependent on the incidence angles. Ku- and X-band show strong Ku-band sensitivity to snow grain microstructure for thicker snow covers at near-range incidence angles, while X-band microwaves dominated as snow thickness reduced from 14 cm to 4 cm, possibly owing to X-band’s strong sensitivity to changes in snow salinity. Interestingly, HH-polarized waves generally showed greater sensitivity over VV-polarized waves at far-range incidence angles, with increasing snow thicknesses, reminding the importance of snow grain microstructure affecting the backscatter, even under saline snow conditions. X- and C-band showed notable frequency separation between the three snow covers, at near-range incidence angles, possibly suggesting strong surface scattering effects with increase in snow salinities as snow thicknesses decreased. The Ku- and C-band showed strong sensitivity between Ku- and C-bands at 14 cm and 8 cm snow covers, with differences indicating changes in snow grain microstructure as a dominant factor affecting backscatter. Overall, the innovative dual-frequency ratio demonstrated its ability to determine dominant polarizations and frequencies, sensitive to changes in snow thicknesses with corresponding changes in snow thermophysical properties. From an application point of view, the dual-frequency ratio can added as a new polarimetric parameter to currently existing polarimetric parameters, when microwave backscatter from multiple polarizations and frequencies are available from any operational SAR system.
Our results using co-pol ratios and dual-frequency ratios suggest the potential to utilize the multi-frequency microwave approach to characterize frequency-, incidence angle- and polarization-dependent changes in microwave backscatter from different snow cover types on smooth FYI. Further research should investigate exploiting the dual-frequency ratios on a satellite-scale approach over basin- and regional-scales to investigate snow covers on different FYI types. Moreover, our approach should also be tested under colder atmospheric and snow geophysical conditions for different snow covers, in order to investigate variations in penetration depths between frequencies, frequency and polarization diversity under changing atmospheric and snow geophysical conditions. Results from these plot-scale studies using the multi-frequency approach can be further upscaled to regional and hemispherical scale “snow on sea ice” applications such as estimation of snow thickness and snow water equivalent (SWE), using the recent, currently and upcoming space-borne SAR missions TerraSAR-X, RADARSAT Constellation Mission and NISAR (C-band); and ALOS-2 PALSAR-2 (L-band).
Acknowledgments
The authors would like to thank ProSensing, Inc. for providing UW-Scat system to obtain scatterometer data; Jack Landy, Randall Scharien, and Megan Shields at the Center for Earth Observation Science (CEOS), University of Manitoba for their logistical and technical assistance; and NSERC Discovery, NRS Research and PCSP grants for project funding.
Author Contributions
Vishnu Nandan, Torsten Geldsetzer and John Yackel designed the experiment. Vishnu Nandan formulated the research methodology and wrote the manuscript. Mallik Mahmud provided all high-resolution figures and graphs, along with proofreading. Saroat Ramjan contributed with additional inputs during proofreading.
Conflicts of Interest
The authors declare no conflict of interest.
References
- Stroeve, J.C.; Serreze, M.C.; Holland, M.M.; Holland, M.M.; Kay, J.E.; Malanik, J.; Barett, A.P. The Arctic’s rapidly shrinking sea ice cover: A research synthesis. Clim. Chang. 2012, 110, 1005–1027. [Google Scholar] [CrossRef]
- Maslanik, J.A.; Fowler, C.; Stroeve, J.; Drobot, S.; Zwally, S.; Yi, D.; Emery, W. A younger, thinner Arctic ice cover: Increased potential for rapid, extensive sea-ice loss. Geophys. Res. Lett. 2007, 34, L24501. [Google Scholar] [CrossRef]
- Webster, M.A.; Rigor, I.G.; Nghiem, S.V.; Kurtz, N.T.; Farrell, S.L.; Perovich, D.K.; Strum, M. Interdecadal changes in snow depth on Arctic sea ice. J. Geophys. Res. Oceans 2014, 119, 5395–5406. [Google Scholar] [CrossRef]
- Comiso, J.C. Large Decadal Decline of the Arctic Multiyear Ice Cover. J. Clim. 2012, 25, 1176–1193. [Google Scholar] [CrossRef]
- Blanchard-Wrigglesworth, E.; Farrell, S.L.; Newman, T.; Bitz, C.M. Snow cover on Arctic sea ice in observations and an Earth System Model. Geophys. Res. Lett. 2015, 42, 10342–10348. [Google Scholar] [CrossRef]
- Iacozza, J.; Barber, D.G. An examination of snow redistribution over smooth land-fast sea ice. Hydrol. Process. 2010, 24, 850–865. [Google Scholar] [CrossRef]
- Curry, J.A.; Schramm, J.L.; Ebert, E.E. Sea Ice-Albedo Climate Feedback Mechanism. J. Clim. 1995, 8, 240–247. [Google Scholar] [CrossRef]
- Barber, D.G.; Fung, A.K.; Grenfell, T.C.; Nghiem, S.V.; Onstott, R.G.; Lytle, V.L.; Perovich, D.K.; Gow, A.J. The Role of Snow on Microwave Emission and Scattering over First-Year Sea Ice. IEEE Trans. Geosci. Remote Sens. 1998, 36, 1750–1763. [Google Scholar] [CrossRef]
- Yackel, J.J.; Barber, D.G.; Papakyriakou, T.N.; Breneman, C. First-year sea ice spring melt transitions in the Canadian Arctic Archipelago from time-series synthetic aperture radar data, 1992–2002. Hyrdol. Process. 2007, 21, 253–265. [Google Scholar] [CrossRef]
- Scharien, R.K.; Geldsetzer, T.; Barber, D.G.; Yackel, J.J. Physical, dielectric, and C band microwave scattering properties of first-year sea ice during advanced melt. J. Geophys. Res. 2010, 115, 1–16. [Google Scholar] [CrossRef]
- Fuller, M.C.; Geldsetzer, T.; Gill, J.P.S.; Yackel, J.J.; Derksen, C. C-band backscatter from a complexly-layered snow cover on first-year sea ice. Hydrol. Process. 2014, 28, 4614–4625. [Google Scholar] [CrossRef]
- Gill, J.P.S.; Yackel, J.J.; Geldsetzer, T.; Fuller, M.C. Sensitivity of C-band synthetic aperture radar polarimetric parameters to snow thickness over landfast smooth first-year sea ice. Remote Sens. Environ. 2015, 166, 34–49. [Google Scholar] [CrossRef]
- Fuller, M.C.; Geldsetzer, T.; Yackel, J.J.; Gill, J.P.S. Comparison of a coupled snow thermodynamic and radiative transfer model with in situ active microwave signatures of snow-covered smooth first-year sea ice. Cryosphere 2015, 9, 2149–2161. [Google Scholar] [CrossRef]
- Nandan, V.; Geldsetzer, T.; Islam, T.; Yackel, J.J.; Gill, J.P.S.; Fuller, M.C.; Gunn, G.; Duguay, C. Ku-, X- and C-band measured and modeled microwave backscatter from a highly saline snow cover on first-year sea ice. Remote Sens. Environ. 2016, 187C, 62–75. [Google Scholar] [CrossRef]
- Drinkwater, M.R. LIMEX ′87 ice surface characteristics: Implications for C-band SAR backscatter signatures. IEEE Trans. Geosci. Remote Sens. 1989, 27, 501–513. [Google Scholar] [CrossRef]
- Barber, D.G.; Reddan, S.P.; LeDrew, E.F. Statistical characterization of the geophysical and electrical properties of snow on landfast first-year sea ice. J. Geophys. Res. 1995, 100, 2673–2686. [Google Scholar] [CrossRef]
- Onstott, R.G.; Moore, R.K.; Weeks, W.F. Surface-Based Scatterometer Results of Arctic Sea Ice. IEEE Trans. Geosci. Electron. 1979, GE-17, 78–85. [Google Scholar] [CrossRef]
- Geldsetzer, T.; Mead, J.B.; Yackel, J.J.; Scharien, R.K.; Howell, S.E.L. Surface-Based Polarimetric C-Band Scatterometer for Field Measurements of Sea Ice. IEEE Trans. Geosci. Remote Sens. 2007, 45, 3405–3416. [Google Scholar] [CrossRef]
- Yueh, S.; Dinardo, S.; Akgiray, A.; West, R.; Cline, D.; Elder, K. Airborne Ku-band polarimetric radar remote sensing of terrestrial snow cover. IEEE Trans. Geosci. Remote Sens. 2009, 47, 3347–3364. [Google Scholar] [CrossRef]
- Werner, C.; Wiesmann, A.; Strozzi, T.; Schneebeli, M.; Mätzler, C. The Snowscat Ground-Based Polarimetric Scatterometer: Calibration and Initial Measurements from Davos, Switzerland. In Proceedings of the 2010 IEEE International Geoscience and Remote Sensing Symposium (IGARSS), Honolulu, HI, USA, 25–30 July 2010; pp. 2363–2366. [Google Scholar]
- King, J.M.L.; Kelly, R.; Kasurak, A.; Duguay, D.; Gunn, G.; Mead, J. UW-Scat: A Ground-Based Dual-Frequency Scatterometer for Observation of Snow Properties. IEEE Geosci. Remote Sens. Lett. 2013, 10, 528–532. [Google Scholar] [CrossRef]
- International Hydrological Programme of the United Nations Educational, Scientific and Cultural Organization (UNESCO-IHP). The International Classification for Seasonal Snow on the Ground; IHP-VII Technical Documents in Hydrology N°83, IACS Contribution N°1; International Hydrological Programme of the United Nations Educational, Scientific and Cultural Organization (UNESCO-IHP): Paris, France, 2009. [Google Scholar]
- Drinkwater, M.R.; Crocker, G.B. Modeling changes in the dielectric and scattering properties of young snow covered sea ice at GHz frequencies. J. Glaciol. 1988, 34, 274–282. [Google Scholar] [CrossRef]
- Barber, D.G.; Nghiem, S.V. The role of snow on thermal dependence of microwave backscatter over sea ice. J. Geophys. Res. 1999, 104, 25789–25803. [Google Scholar] [CrossRef]
- Geldsetzer, T.; Langlois, A.; Yackel, J.J. Dielectric properties of brine-wetted snow on first-year sea ice. Cold Reg. Sci. Technol. 2009, 58, 47–56. [Google Scholar] [CrossRef]
- Stogryn, A.; Desargant, G.J. The dielectric properties of brine in sea ice at microwave frequencies. IEEE Trans. Antennas Propag. 1985, 33, 523–532. [Google Scholar] [CrossRef]
- Denoth, A. Snow dielectric measurements. Adv. Space Res. 1989, 9, 233–243. [Google Scholar] [CrossRef]
- Ulaby, F.T.; Stiles, H.W.; Abdelrazik, M. Snowcover influence on backscattering from terrain. IEEE Trans. Geosci. Remote Sens. 1984, GE-22, 126–133. [Google Scholar] [CrossRef]
- Winebrenner, D.P.; Bredow, J.; Fung, A.K.; Drinkwater, M.R.; Nghiem, S.; Gow, A.J.; Perovich, D.K.; Grenfell, T.C.; Han, H.C.; Kong, J.A.; et al. Microwave sea ice signature modeling. In Microwave Remote Sensing of Sea Ice; Carsey, F., Ed.; American Geophysical Union: Washington, DC, USA, 1992; pp. 137–175. [Google Scholar]
- Nandan, V.; Geldsetzer, T.; Yackel, J.J.; Islam, T.; Gill, J.P.; Mahmud, M. Multifrequency Microwave Backscatter from a Highly Saline Snow Cover on Smooth First-Year Sea Ice: First-Order Theoretical Modeling. IEEE Trans. Geosci. Remote Sens. 2017, 55, 2177–2190. [Google Scholar] [CrossRef]
- Lorrain, P.; Corson, D.R.; Lorrain, F. Electromagnetic Fields and Waves, 3rd ed.; W.H. Freeman & Company: New York, NY, USA, 1988; p. 754. [Google Scholar]
- Geldsetzer, T.; Yackel, J.J. Sea ice type and open water discrimination using dual co-polarized C-band SAR. Can. J. Remote Sens. 2009, 35, 73–84. [Google Scholar] [CrossRef]
- Fung, A.K. Microwave Scattering and Emission Models and Their Applications; Artech House: Norwood, MA, USA, 1994. [Google Scholar]
- Hallikainen, M.T.; Winebrenner, D.P. The physical basis for sea ice remote sensing. In Microwave Remote Sensing of Sea Ice; Carsey, F., Ed.; American Geophysical Union: Washington, DC, USA, 1992; pp. 29–46. [Google Scholar]


© 2017 by the authors. Licensee MDPI, Basel, Switzerland. This article is an open access article distributed under the terms and conditions of the Creative Commons Attribution (CC BY) license (http://creativecommons.org/licenses/by/4.0/).