1. Introduction
Testosterone (T) is the most important male sex hormone in men and plays key roles in reproductive and sexual functions [
1]. T is also involved in erythropoiesis, bone and muscle formation, the body composition, and iron metabolism. In mammals, >95% of T is synthesized by Leydig’s cells of the testes and is regulated through the hypothalamic-pituitary-testicular (HPT) axis [
2]. A small fraction of T is derived from the ovaries or the adrenal gland. It was hypothesized that adipose tissue-derived aromatase can convert T to estradiol, which in turn suppresses the release of gonadotropin-releasing hormone (GnRH)-luteinizing hormone (LH) from the hypothalamus [
3]. Once it enters the circulation, a large proportion (~66%) of T is tightly bound to sex hormone-binding globulin (SHBG) and approximately 33% of T is bound to albumin with lower binding affinities [
4]. Only l‒2% is unbound or free T [
4].
Several epidemiological studies demonstrated an inverse relationship between obesity and circulating total T concentrations [
5,
6,
7,
8]. Low circulating T levels are also associated with obesity-related cardiometabolic diseases such as metabolic syndrome (MetS) [
9], non-alcoholic fatty liver disease (NAFLD) [
10], and insulin resistance (IR) [
11,
12,
13]. A meta-analysis that examined 12 studies concluded that low T levels may be associated with increased risks of all-cause and cardiovascular disease-related death, but results also showed considerable between-study heterogeneity [
14]. The obesity‒hypogonadism relationship is thought to be bidirectional, and changes in adiposity seem to have greater effects on the HPT axis than hypogonadism has on adiposity or body weight [
6,
15]. Increased adipokines, such as leptin, and proinflammatory cytokines lead to suppression of the HPT axis [
15]. Although a wealth of observational studies showed an association between low T levels and IR [
11,
12,
13], the direction of the causal relationship remains undefined [
16]. Visceral fat or adipokines may act as important intermediates in the relationship between IR and hypogonadism. Insulin promotes fat storage and central obesity while sex hormones (e.g., T) stimulate lipolysis [
17]. It was shown that moderate obesity decreases total T, largely due to the IR-associated reduction in SHBG [
6,
18]. T is known to affect the body composition, and T supplementation improves the body composition by increasing the lean body mass and decreasing the fat mass [
19,
20]. Increased visceral fat mass may promote IR through modulating levels of the insulin sensitizer, adiponectin, and also suppress the HPT axis leading to lower circulating T and SHBG levels [
16].
Obesity also affects iron metabolism [
21], and iron dysregulation may further contribute to low circulating total T levels [
22,
23]. Hepcidin is a liver- and adipocyte-secreted hormone and is sensitive to signals of obesity-related inflammation (e.g., interleukin-6 and leptin). Under physiological circumstances, hepcidin controls iron homeostasis through regulating the iron absorption rate and intracellular iron efflux [
21]. Obesity-related inflammation triggers hepcidin overproduction, leading to a lower iron absorption rate and impaired tissue iron efflux. Hence, obese men are frequently associated with iron dysregulation (indicated by high hepcidin and tissue iron levels and normal/low levels of serum iron levels or transferrin saturation (TS)) [
21]. Increased hepatic iron concentrations are associated with moderate hypogonadotropic hypogonadism [
23]. Elevated serum ferritin (SF) predicts low total T levels in Chinese adults [
24] and young adolescent Taiwanese males [
22].
Accumulating evidence suggests a tight link between the nutritional status and male reproductive function, particularly the effects of calories or macronutrients on male sex hormone total T levels [
1]. A 10-day fast in obese men resulted in a significant fall in serum T levels, regardless of whether there was carbohydrate (CHO) supplementation (15 or 45 g/day), and T levels increased to normal during the re-feeding (1500 Kcal/day) period [
25]. Malnutrition (e.g., protein restriction or a protein-energy deficiency) was suggested to impair Leydig’s cell function and affect T biosynthesis [
26,
27]. Human and animal studies also showed that a high fat diet (HFD) is inversely associated with total T levels [
28,
29,
30]; however, conflicting data exist as to the types of fatty acids [
28,
30,
31]. CHO intake may also affect the male sex hormone. A low-CHO diet (<5% of total energy content) decreased plasma total T levels while circulating levels of adrenaline, noradrenaline, and growth hormone increased [
32]. An early study by Anderson et al. showed that a high-CHO diet increased circulating total T and SHBG levels, while a high-protein diet had reversed the effect [
33]. However, Mikulski et al. showed that both low (35% protein, 64% fat, 1% CHO) and high (4% protein, 1% fat, 95% CHO) CHO meals decreased serum T levels in physically active subjects [
34]. Although CHOs seem to be positively correlated with circulating total T and SHBG levels in men [
28], increased intake of refined CHO is associated with low serum SHBG levels in both men [
16] and women [
35]. A recent study showed no significant relationship between dietary intake of CHO and total and free T levels in healthy women [
36]. Overall, the effect of CHO intake on androgen may differ between genders.
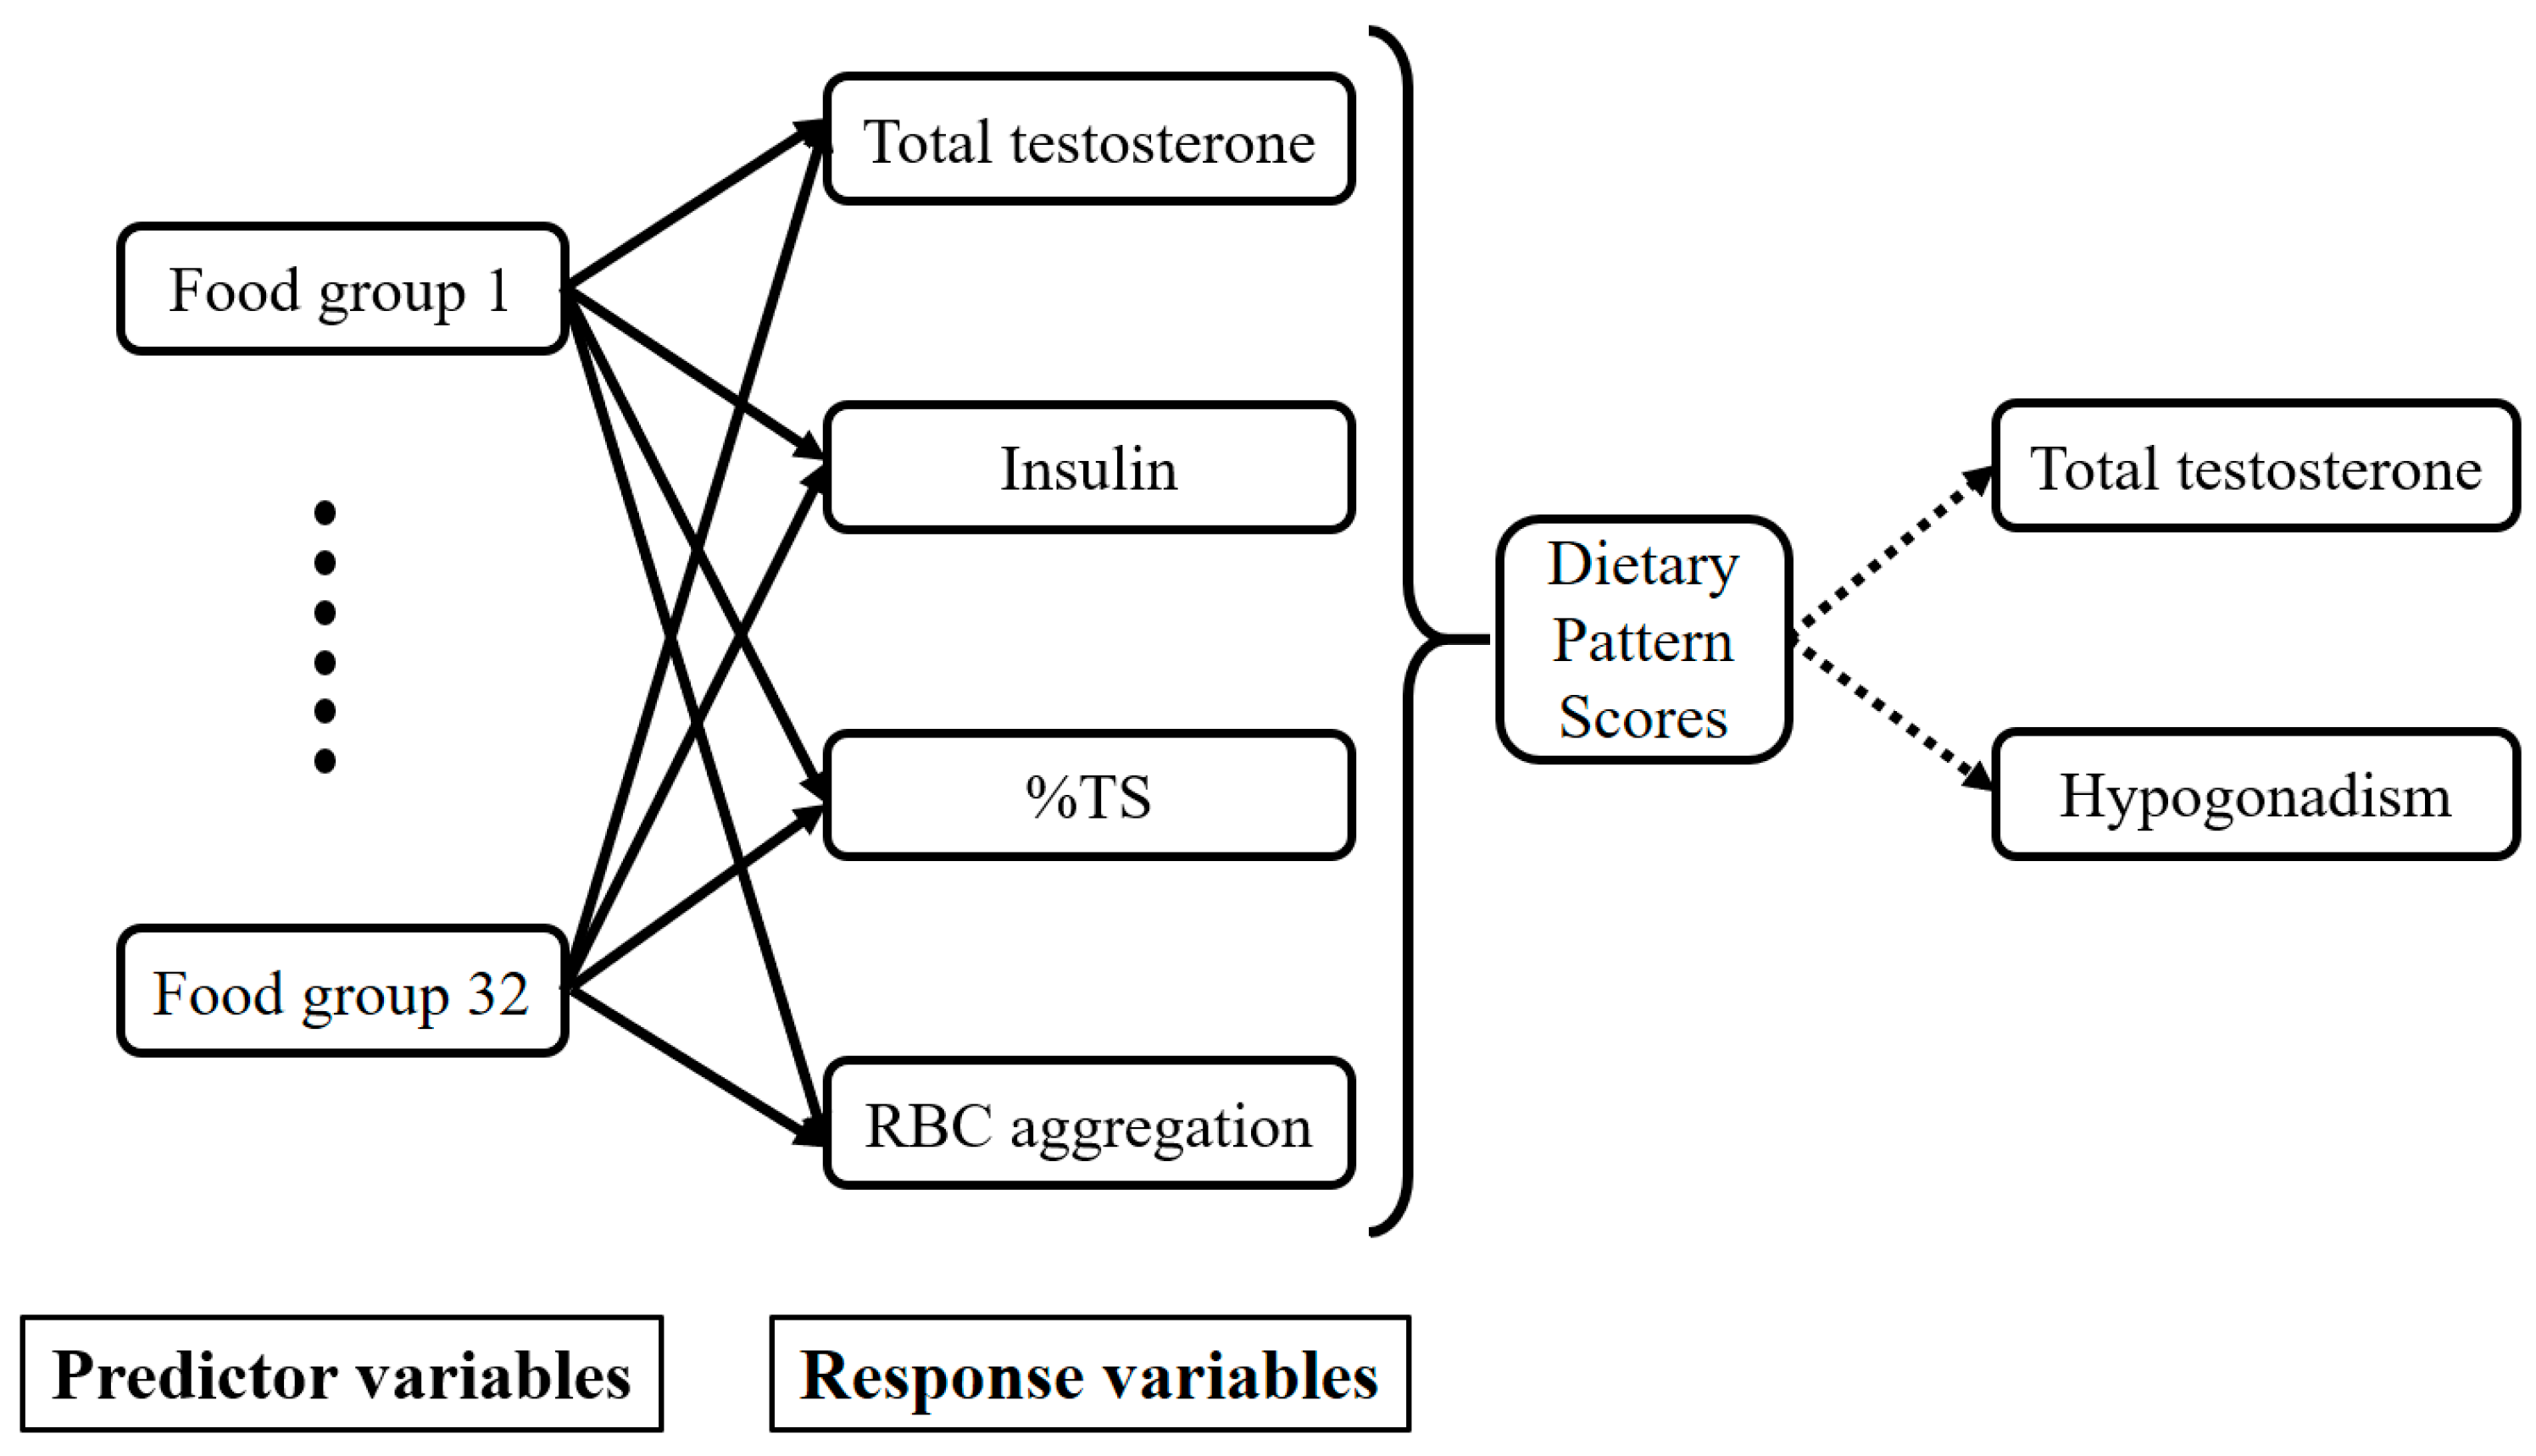
We hypothesized that obesity might affect not only the male sex hormone, T, but also nutrient metabolism (e.g., iron and glucose), and alterations in nutrient metabolism may contribute to the bidirectional relationship between obesity and the male sex hormone, T. Therefore, the broad aims of this study were to (1) investigate the relationship between serum nutrient biomarkers (e.g., iron and glucose) and total T levels and (2) identify dietary patters associated with circulating total T and its predictive effect on hypogonadism and body composition in 125 Taiwanese male adults.
4. Discussion
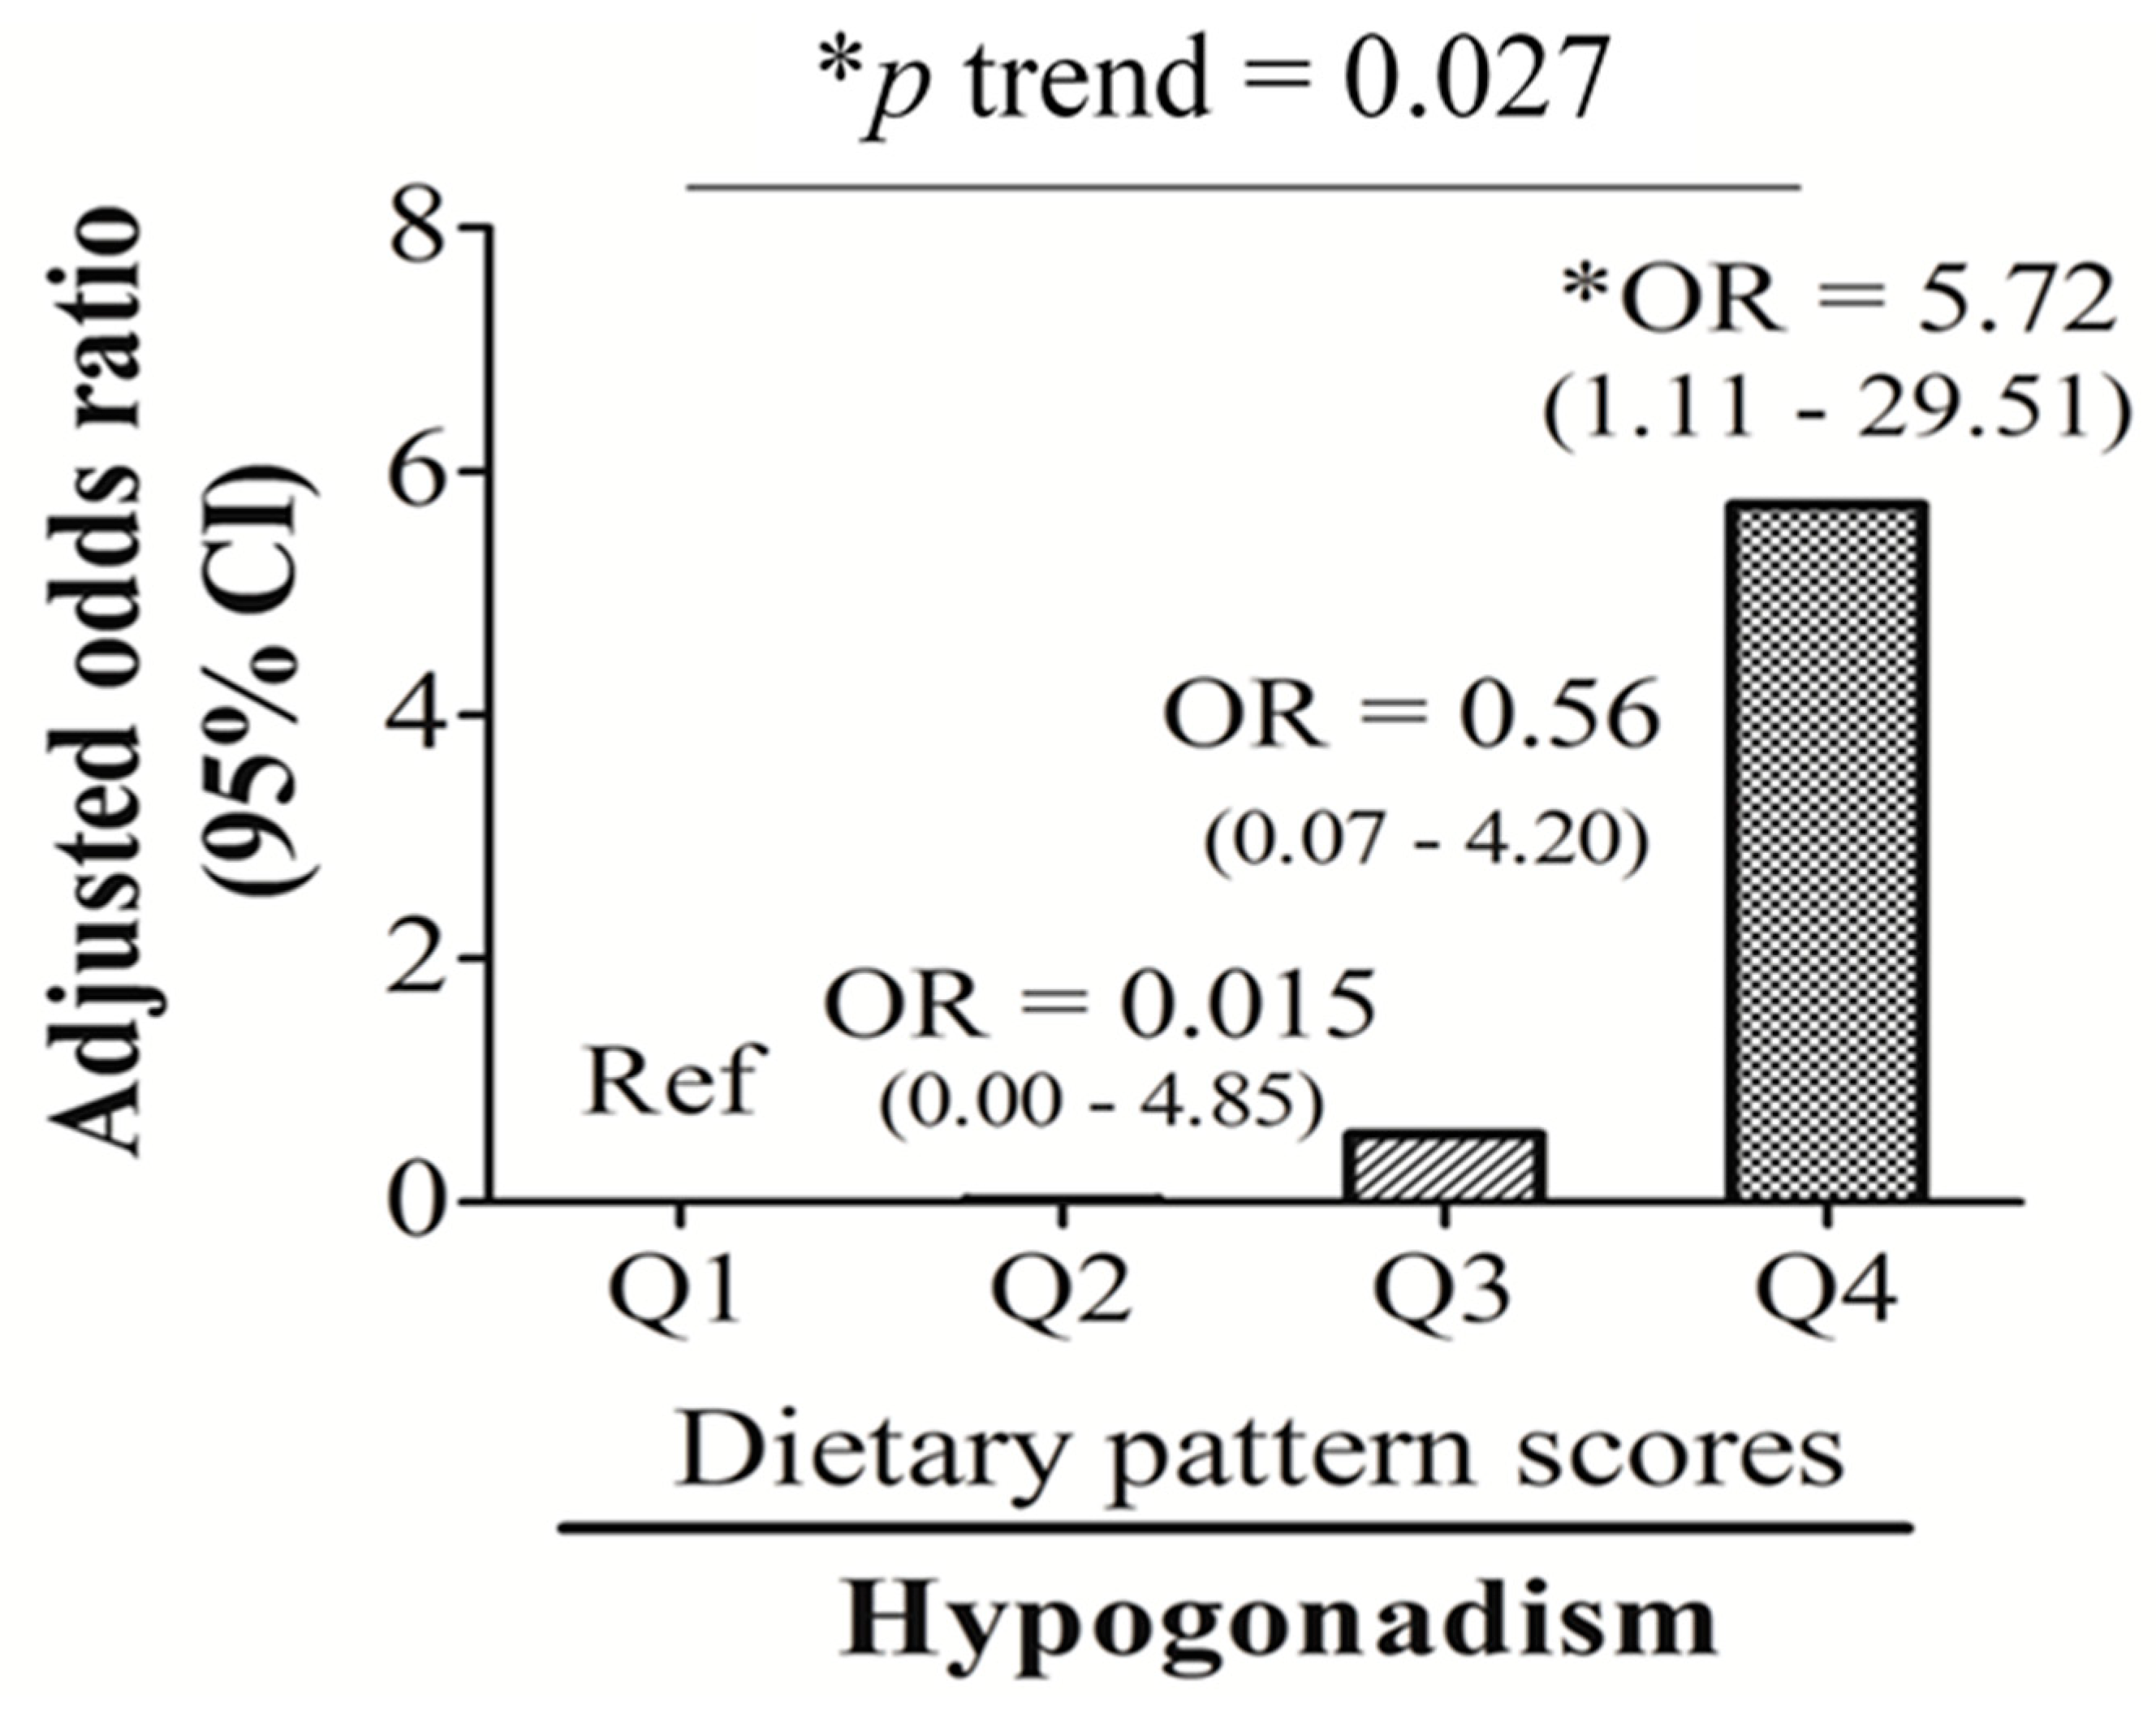
Our study found that the male sex hormone, total T, is closely linked to age and nutrition-related biomarkers (e.g., insulin, %TS, and RBC aggregation). Total T-associated dietary patterns, which were characterized by high-frequency consumption of bread and pastries, dairy products, and desserts, eating out, and low intake frequency of homemade foods, noodles, and dark green vegetables, were significantly associated with an unhealthy body composition (indicated as decreased skeletal muscle mass and increased visceral fat mass), low total T levels, and hypogonadism (OR: 5.72; 95% CI: 1.11~29.51, p < 0.05).
In the present study, homemade food and eating out contributed 31.2% and 6.2%, respectively, to explaining the variation in the RRR-derived total-T-associated dietary pattern. Foods that are not homemade (consumed when eating out) usually have a heavier taste than homemade food and tend to be Western food. In this study, the three food groups, bread and pastries, dairy products, and desserts, can be grouped as Western foods and were positively associated with eating out. Although noodles are refined CHOs, homemade noodles usually have a lighter taste (containing less fat and salt) than noodles consumed in restaurants. Our study also found that adult men who eat at home and prefer noodles as a staple food are also likely to consume dark green vegetables. Eating more dark green leafy vegetables is known to reduce the risk of type II diabetes. Insulin also contributes up to 28.2% of explaining the variation in the RRR-derived total-T-associated dietary pattern (data not shown), the highest among the various responses. Total T contributes 23.5% to explaining the variation in the RRR-derived total-T-associated dietary pattern (data not shown), the second highest among the responses. It is known that total T and insulin have an inverse relationship as they act like antagonists toward adipocytes [
17]. A study on adolescent male rats in 2015 reported that a Western-style diet increased fasting insulin levels and induced IR [
47]. Our results from
Table 4 show that total-T-associated dietary pattern scores had significant positive trends with the total body fat mass, insulin and HOMA-IR (all
p < 0.001). Increased adiposity or hyperinsulinemia may suppress total T levels [
6,
48]. T also plays a critical role in energy metabolism. Varlamov et al. suggested that T exerts positive effects on the skeletal muscle mass and local glucose uptake [
49]. Therefore, low T levels may cause obesity due to lower muscle energy expenditure.
We also verified the relationship between dietary pattern scores and the selected responses (total T, insulin, %TS, and RBC aggregation). A multivariate linear regression analysis was used to analyze the responses that were independently related to the RRR-derived dietary pattern. A univariate linear regression suggested that total T (β = −0.204; 95% CI: −0.294~−0.114, p < 0.001], log RBC aggregation CSS (β = 0.775; 95% CI: 0.208~1.341, p < 0.01), and insulin (β = 0.049; 95% CI: 0.029~0.069, p < 0.001) were significantly correlated with the first dietary pattern scores. After adjusting for covariates (age and BMI), only total T (β = −0.130; 95% CI: −0.230~−0.029, p < 0.05) and insulin (β = 0.037; 95% CI: 0.012~0.062, p < 0.01) remained significantly correlated with T-associated dietary pattern scores (data not shown). This suggests that although insulin, %TS, and RBC aggregation were independent predictors of circulating total T, the contributions of %TS and RBC aggregation to total T-associated dietary pattern were weaker and more likely to be influenced by obesity than insulin and total T.
In the current study, insulin, %TS, and RBC aggregation were identified as independent factors that predicted total T levels, with %TS being positively correlated, and insulin and RBC aggregation being negatively correlated. Accumulating evidence suggests that circulating T levels are inversely associated with IR [
11,
12,
13]; however, the mechanisms underlying this association are less well understood. An early study showed that Leydig’s cells expressed insulin and type I insulin growth factor (IGF) receptors and both insulin and IGF stimulate T production in primary Leydig’s cell culture [
50]. However, IR may impair the production of T by Leydig’s cells due to organ resistance to insulin’s actions [
51]. In our study, almost half of the middle-age men had central obesity but fewer than 10% had type 2 diabetes (8.7%). It is possible that adiposity-related factors may influence insulin’s effects on Leydig’s cell steroidogenesis. For example, leptin, an adipokine secreted by white adipose tissues, inhibits human chorionic gonadotrophin (hCG)-induced T synthesis in adults testes in vitro [
52]. Decreased circulating adiponectin levels in obese men may also lead to HPT axis dysfunction or Leydig’s cell resistance to insulin’s actions [
16]. Finally, obesity-related inflammation may directly trigger hypogonadism, but this effect is potentially reversible (e.g., >10% weight loss) [
15].
One of the novel findings of this study was the inverse relationship between RBC aggregation and male sex hormone total T levels. Dietary factors are known to affect RBC rheology. Our recent studies found that RBC rheology is strongly influenced by iron and an HFD [
53,
54]. An animal study found that HFD-fed obese rats had increased RBC aggregation, but iron supplementation reduced HFD-induced RBC aggregation [
54]. A human study [
53] found that individuals with the highest quartile levels of RBC aggregation had a 2.65-fold (1.054~6.638,
p < 0.05) highest risk of developing hyperlipidemia than those in the lowest quartile. In addition, RBC aggregation/iron-related dietary patterns independently predicted hyperlipidemia (OR: 2.927; 95% CI: 1.109~7.726,
p < 0.05) and MetS (OR: 3.904; 95% CI: 1.070~140,248,
p < 0.05) [
53]. Currently, how iron modulates RBC rheology remains unclear. It is likely that iron influences RBC function through modulating membrane fluidity or iron-containing antioxidative enzymes (e.g., superoxide dismutase). In this study, we also observed a positive relationship between RBC aggregation and insulin levels. Early studies found that patients with IR had increased RBC aggregation compared to controls [
55], and improved glycemic controls via lifestyle interventions (diet and exercise) decreased RBC aggregation in patients with type 2 diabetes [
56].
In spite of a strong correlation between total T and RBC aggregation (
r = −0.419,
p < 0.001), the regulatory pathways of RBC aggregation on T levels are still unknown. The literature shows that T supplementation caused erythrocytosis, an increase in the number of RBCs, via increased erythropoietin (EPO), but suppressed hepcidin synthesis, resulting in increased levels of hemoglobin and hematocrit [
57]. A retrospective study aiming to determine the rate of secondary polycythemia (hematocrit >50%) in 228 men treated with subcutaneously implanted T pellets found that estimated rates of polycythemia at six, 12, and 24 months were 10.4%, 17.3%, and 30.2%, respectively [
58]. On the other hand, T may increases RBC susceptibility to hemolysis possibly through osmotic and oxidative hemolysis [
59]. Overall, these data suggest that T and the nutritional status directly modulate RBC function, and whether RBC aggregation directly influences T biosynthesis remains unknown. It is likely that RBC functions (aggregation and deformability) may affect T levels through their ability to change shape and flow in microvessels while transporting oxygen and nutrients to Leydig’s cells of the testes.
This study has several limitations. First, the relatively small sample size (
n = 125) and cross-sectional design limited the study findings. This study was cross-sectional and only associations can be observed, therefore any inferences about causality cannot be made. Second, a bioelectrical impedance analysis device, and not dual-energy X-ray absorptiometry, was employed to determine the body composition because of budget constraints. Third, this study relied on the use of the FFQ for dietary assessment. The FFQ is a useful tool to assess relationships between diet and disease in general populations. However, the FFQ only represents the frequency of the participants’ food intake in the past three months. Thus, the intake of nutrients cannot be determined. Although potential confounders were considered and adjusted for in our study, there are still some potential factors that may influence the relationship between diet and total T levels, including adipokines, and genetic and socioeconomic factors. Fourth, differences in dietary patterns between age and ethnic groups were observed. In this study, >99% of the study participants were young middle-aged men (with a mean age of 41 ± 11.5 years) of Taiwanese nationality and Han Chinese origin. Hence, the identified dietary patterns may need to be verified in other age (e.g., >65 years) and racial (e.g., Caucasian) groups. In addition, the RRR is a method that relies on prior knowledge of biological relevance to select response variables. Hence, using different responses for the RRR analysis will yield different results. Finally, all blood samples were collected in the morning (09:00~12:00) in order to minimize the diurnal variation of sex hormone levels. The effects of circadian rhythms on sex hormone are well documented, and levels of total, free, and bioavailable T were higher in the morning (08:00) than levels measured in the mid- to late afternoon, which yielded average values 30%~35% higher than at 08:00 [
43].

 ,
, 


