Abstract
Background: Coffee and tea are among the most commonly consumed nonalcoholic beverages worldwide, but methodological differences in assessing intake often hamper comparisons across populations. We aimed to (i) describe coffee and tea intakes and (ii) assess their contribution to intakes of selected nutrients in adults across 10 European countries. Method: Between 1995 and 2000, a standardized 24-h dietary recall was conducted among 36,018 men and women from 27 European Prospective Investigation into Cancer and Nutrition (EPIC) study centres. Adjusted arithmetic means of intakes were estimated in grams (=volume) per day by sex and centre. Means of intake across centres were compared by sociodemographic characteristics and lifestyle factors. Results: In women, the mean daily intake of coffee ranged from 94 g/day (~0.6 cups) in Greece to 781 g/day (~4.4 cups) in Aarhus (Denmark), and tea from 14 g/day (~0.1 cups) in Navarra (Spain) to 788 g/day (~4.3 cups) in the UK general population. Similar geographical patterns for mean daily intakes of both coffee and tea were observed in men. Current smokers as compared with those who reported never smoking tended to drink on average up to 500 g/day more coffee and tea combined, but with substantial variation across centres. Other individuals’ characteristics such as educational attainment or age were less predictive. In all centres, coffee and tea contributed to less than 10% of the energy intake. The greatest contribution to total sugar intakes was observed in Southern European centres (up to ~20%). Conclusion: Coffee and tea intake and their contribution to energy and sugar intake differed greatly among European adults. Variation in consumption was mostly driven by geographical region.
1. Introduction
Coffee and tea are the most widely consumed nonalcoholic beverages across the world [1,2]. Both beverages contain various antioxidants and phenolic compounds such as flavonoids or caffeine, some of which have been shown to have anticancer properties in laboratory conditions [3,4,5,6].
According to the third expert report of the World Cancer Research Fund (WCRF) and the Continuous Update Project (CUP), the evidence on the associations between cancer and the intakes of tea, and for many cancer sites, of coffee, were too limited in amount, consistency, and/or quality to draw conclusions, except for a probable decreased risk for cancers of the liver and endometrium among regular coffee drinkers [3,7].
Several systematic reviews and meta-analyses conducted subsequently also reported inconsistent results for the potential association of coffee or tea on certain types of cancers such as prostate, lung, colorectal, oesophageal, renal, or breast cancers. Indeed, whilst some of the studies reported inverse associations for tea or coffee (e.g., coffee and liver or prostate cancers, tea and lung cancer) [8,9,10,11,12,13], others did not observe any significant adverse or potential protective effects of such beverages [14,15,16,17,18,19].
A monograph conducted by the International Agency for Research on Cancer (IARC) in 2016 evaluating the carcinogenicity of drinking coffee to humans concluded that it was unclassifiable as to its carcinogenicity to humans [20].
Differences in tea- and coffee-drinking habits (e.g., green tea, black tea, with caffeine, decaffeinated) as well as the preparation processes, amount consumed, and additions such as sugar/milk are likely to vary by population and countries and could contribute to the inconsistencies found between studies comparing tea and coffee consumption and the risk of chronic diseases. Furthermore, the use of different assessment methods, such as distinct food frequency questionnaires, different variable definitions (e.g., food classification, serving sizes), or levels of detail to describe foods, may impede comparisons between studies [21].
Our main objective was to describe coffee and tea intake in men and women across 27 centres in the European Prospective Investigation into Cancer and Nutrition (EPIC) study using standardized 24-h dietary recall (24-HDR) data. We also estimated variation in intake levels according to selected sociodemographic, lifestyle, and anthropometric characteristics of study participants, and assessed the relative contribution of coffee and tea to intakes of total energy and selected nutrients (total sugars, calcium, magnesium, phosphorus).
2. Materials and Methods
2.1. Setting and Subjects
EPIC is a multicentre prospective cohort study investigating the association between diet and cancer and other chronic diseases in 23 centres in ten countries: Denmark, France, Germany, Greece, Italy, the Netherlands, Norway, Spain, Sweden, and the UK [22,23]. EPIC participants were mostly recruited from the general population between 1992 and 1998 and included 521,330 men and women aged 35–70 years; exceptions were France (health insurance members), Utrecht (The Netherlands) and Florence (Italy) (participants of breast cancer screening), and some centres in Spain and Italy (mostly blood donors). In the UK, a cohort consisting predominantly of vegetarians (‘health-conscious’ in Oxford) was considered separately from a ‘general population’ group recruited by general practitioners in Cambridge and Oxford. Most centres recruited both men and women, except Norway, France, Utrecht, and Naples, where only women were recruited. Details of the methods of recruitment and study design have been published previously [22,24,25]. All participants provided written informed consent, and the project was approved by ethical review boards of the IARC and local participating centres. In the present study, the initial 23 EPIC centres were redefined into 27 regions according to a geographical south–north gradient and relevant to analyses of dietary consumption and patterns [23].
The calibration substudy nested within the EPIC cohort was undertaken between 1995 and 2000 with the aim to partially correct for attenuation in diet–disease associations due to measurement errors. This has been obtained by rescaling the country-specific individual dietary intakes against the same reference dietary measurement obtained using a highly standardized 24-h dietary recall (24-HDR) [26]. The calibration population sample consisted of 36,994 participants, representing a random sample (~8%) of the total EPIC cohort, stratified by age, sex, and centre. Details of the population characteristics of the calibration study have been published previously [23,27,28,29]. In brief, each participant completed a single 24-HDR during a face-to-face interview, except in Norway, where it was conducted through a validated phone interview alternative [30]. A computer-based interview programme, named EPIC-Soft (recently renamed GloboDiet; IARC, Lyon, France), was developed to conduct standardized 24-HDR interviews [31,32] with the same structure and interview procedure across countries. The interviews were conducted over different seasons and days of the week. For logistical constraint reasons, interviews recalling diet on Saturday were conducted on Monday (instead of Sunday) in most countries, whereas for all other days of the week, the interviews were conducted the following day. Time and place of consumption were also collected.
2.2. Dietary Variables
The common food group classification used in the EPIC-Soft software, which has been described previously [23], was used to divide the overall coffee and tea group into four different subgroups as follows: coffee, split into three subgroups regarding caffeine content (with caffeine, partially decaffeinated, decaffeinated); tea, either black or green; herbal tea; and chicory and substitutes. Anything added to these beverages, e.g., milk or milk substitutes, sugar, and honey, was also taken into consideration, in order to evaluate the overall contribution of coffee and tea with their added ingredients to total energy and selected nutrients’ intake (alcohol was a negligible ingredient to coffee in all cohorts). The beverages are expressed in grams per day as complete beverages (i.e., including the water for diluted beverages or reconstituted beverages from powder). The overall coffee and tea intake of individuals on the recall day was calculated by summing the amount of these four groups.
Places where coffee and tea could potentially be consumed were recorded as home, work, fast-food restaurant, bar, cafeteria, restaurant, friends’ home, school, street, car/boat/plane, and other. These options were common across centres. After considering their distribution, some of these categories were merged as follows: work, school, and cafeteria into ‘work’; other, street, and car/boat/ plane into ‘other’; and fast-food restaurant with restaurant. The resulting places of consumption were: home, work, bar, restaurant, friends’ place, and other place.
2.3. Nutrient Databases
Energy and nutrient intakes were estimated by means of standardized nutrient databases developed through the EPIC Nutrient DataBase (ENDB) project. Only relevant nutrients (sugar, calcium, magnesium, phosphorus) with regards to coffee and tea and their related added ingredients are reported. The rationale and procedures used to improve between-country comparability of the 26 nutrients included in this database are described elsewhere [33].
2.4. Nondietary Variables
Data on other lifestyle factors, including education (none or primary, secondary/technical, and university degree; completeness >98%), total physical activity (inactive, moderately inactive, moderately active, and active; completeness >86%) [34], and smoking status (never, former, current; completeness >98%), were collected at baseline through standardized questionnaires and clinical examinations and have been described elsewhere [22,23,35]. In most centres, age as well as body weight and height were self-reported by the participants during the 24-HDR interview. Individuals were classified according to age categories (35–44, 45–54, 55–64, 65–74 years) and body mass index (BMI; based on self-reported data) categories (BMI < 25 kg/m2, BMI 25 to <30 kg/m2, BMI ≥ 30 kg/m2; no missing data). The time interval between the baseline questionnaires and the 24-HDR interview varied by country, ranging from one day to three years [23].
2.5. Statistical Methods
Centre-specific arithmetic means of coffee and tea intakes and standard errors of the mean (SEM) were calculated using generalized linear models, stratified by EPIC centre and sex. Fully adjusted models were adjusted for age, total energy intake, height, and weight (except for analyses stratified on BMI) and were weighted by season and day of recall to control for different distributions of 24-HDR interviews across seasons and days of the week. Means were also calculated for each type of coffee and tea as well as for decaffeinated versus caffeinated (including partially decaffeinated) coffee. If fewer than 20 persons were represented in a cross-classification (for example, centre, sex, and age group), the least-square mean was not reported in the table.
In order to compare means of coffee and tea across centres by categories of age, education, BMI, physical activity, and smoking status, we fitted regression models that included an interaction term between centre and each of the potentially associated factors at a time, to test whether the association of coffee and tea consumption with these factors differed across centres. These analyses were adjusted for age, total energy intake, height, and weight and weighted by season and day of recall, separately for men and women. Participants with missing data were omitted. Type III statistics of the GENMOD procedure in SAS were used to examine the partial effect of each variable; that is, the significance of a variable with all the other variables in the model. Tests for trends were computed across categories by using a score variable (from 1 up to the number of categories of a given variable).
The relative contribution of coffee and tea intake (overall and by type) to total energy and selected nutrient intakes (sugar, calcium, magnesium, phosphorus) were calculated by centre as the mean percentage of intake, stratified by centre; adjusted for sex, height, and weight; and weighted by season and weekday.
All the analyses were performed using SAS (version 9.4, SAS Institute, Cary, NC, USA).
3. Results
A total of 36,018 subjects with 24-HDR data were included in this analysis, after exclusion of 958 subjects aged under 35 or over 74 years because of low participation in these age categories and of 18 subjects without lifestyle variable data.
3.1. Coffee and Tea Intakes
The adjusted mean daily intake of coffee and tea varied widely across centres, ranging from 174 g/day and 170 g/day for men and women, respectively, in Greece to 1468 g/day and 1321 g/day in the UK general population (Table 1 for men and Table 2 for women). Overall, Northern European countries tended to drink more coffee and tea compared to Southern European countries (see Supplemental Materials, Table S1).

Table 1.
Mean daily intake of coffee and tea (g/day) by type in the EPIC calibration study population based on 24-H Dietary Recall among men across EPIC centres ordered from south to north.
Table 2.
Mean daily intake of coffee and tea (g/day) by type in the EPIC calibration study population based on 24-H Dietary Recall among women across EPIC centres ordered from South to North.
When describing consumption for the four different coffee and tea groups, the adjusted mean daily intake of coffee ranged from 107 g/day in Greek men (which corresponded to 0.9 cups) to 1016 g/day for men living in Aarhus (Denmark) (which corresponded to 5.5 cups) (Table 1) and from 94 g/day for Greek women (which corresponded to 0.6 cups) to 781 g/day for women from Aarhus (Denmark) (which corresponded to 4.4 cups) (Table 2). Among men, tea intake ranged from 18 g/day in San Sebastian (Spain) (which corresponded to 0.1 cups) to 928 g/day in the UK general population (which corresponded to 4.9 cups), and among women from 14 g/day in Navarra (Spain) (which corresponded to 0.1 cups) to 788 g/day in the UK general population (which corresponded to 4.3 cups). Across centres, the lowest consumption of herbal tea was observed in Umeå (Sweden) (0 g/day and 7 g/day for men and women, respectively) and the highest one in Germany (128 g/day for men in Potsdam and 202 g/day for women in Heidelberg). For both men and women, the lowest consumption of chicory and substitutes was reported in Sweden and Denmark, and the highest in UK health-conscious individuals (Table 1 and Table 2).
Overall, in all centres but those in the UK, the amount of coffee consumed was higher than the amount of tea for both sexes.
3.2. Proportion of Consumers
In comparison with all centres, Greece had the highest proportion of individuals not consuming coffee nor tea over the previous day (27% and 31% for men and women, respectively), and Aarhus (Denmark) for men and Utrecht (The Netherlands) for women had the lowest proportion of nonconsumers (0.9% and 0.4%, respectively) (see Supplemental Materials, Figures S1 and S2). The proportion of men drinking only tea the previous day was the lowest in Ragusa (Italy) (0.6%) and the highest in the UK general population (23%). Women from Naples (Italy) and Navarra (Spain) had the lowest proportion of tea-only drinkers the previous day (0.7% in both cases) and the UK health-conscious population had the highest proportion (30%). The proportion of men and women drinking coffee only over the previous day was the lowest in the UK general population (10% and 12%, respectively) and the highest for both Italian men and women (Ragusa 87% and Naples 86%, respectively). Apart from in the UK, most of the men were coffee drinkers only. The same pattern was found for women in the UK as well as in The Netherlands.
Among coffee consumers from both sexes, the large majority of coffee consumed was coffee with caffeine (see Supplemental Materials, Figures S3 and S4). Overall, the mean percentage of decaffeinated coffee consumers slightly differed between sexes, with women tending to drink more decaffeinated coffee than men (8.8% vs. 6.0%). No south–north gradient was observed for the consumption of decaffeinated coffee. In Granada (Spain), men and women were the highest consumers of decaffeinated coffee (33% and 38%, respectively). In Malmö (Sweden), both men and women were the lowest consumers of decaffeinated coffee (0.3% and 0.6%, respectively).
3.3. Place of Consumption
When investigating the place of consumption, the large majority of coffee or tea consumed was consumed at home by both women and men. The percentage ranged from over 60% for both sexes in Denmark to almost 90% of all coffee and tea consumed in Italy (for men, the percentage ranged from 68% in Copenhagen (Denmark) to 88% in Florence (Italy), and for women, from 68% in Aarhus (Denmark) to 88% in Ragusa (Italy) (Figure 1 and Figure 2).
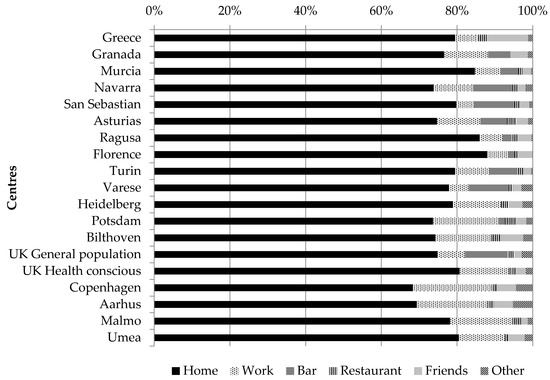
Figure 1.
Proportion of coffee and tea consumption at different places of consumption, among men across EPIC centres; fully adjusted models among consumers only; “friends” refers to friends’ place.
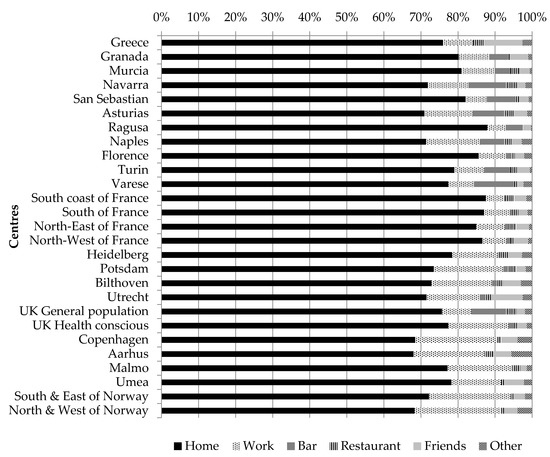
Figure 2.
Proportion of coffee and tea consumption at different places of consumption, among women across EPIC centres; fully adjusted models among consumers only; “friends” refers to friends’ place.
The second most important place of consumption was work, for which there was a south–north gradient as overall, for individuals living in the Northern part of Europe, coffee and tea were more frequently drunk at work compared to what was reported in the Southern part. The other important places of consumption were “bar” and “friends’ place”, for which a south–north gradient was observed. Indeed, for women living in the Northern part of Europe, coffee and tea were more frequently consumed at a friends’ place rather that at a bar. The opposite pattern was observed for women living in South Europe, except for Greek women and women living in the South of France. A similar pattern was observed among men.
3.4. Sociodemographic Factors
When studying the age trends, overall, coffee and tea intake was significantly associated with age (p < 0.0001 in both sexes). Stratified by centre, a linear trend between coffee and tea consumption and age was only significant among four out of the 23 centres (Table 3), which could be related to lack of power due to stratification. In Greece and Florence (Italy), older men tended to drink significantly more coffee and tea compared to the younger ones. On the contrary, younger men from Malmö (Sweden), as well as younger women from Navarra (Spain), drank significantly more coffee and tea than their older counterparts on the day of the recall.
Table 3.
Fully adjusted mean 1 daily intake of coffee and tea (g/day) by age group and sex in the EPIC calibration study population based on 24-H Dietary Recall across EPIC centres ordered from south to north.
Education across all centres was significantly associated with coffee and tea consumption among both men and women (p < 0.005 and p < 0.0001, respectively). Overall, the amount of coffee and tea consumed was higher with higher education. Yet, when stratified by centre, the linear trend between coffee and tea intake and education was significant only in men from the UK general population (the less educated tended to drink more coffee and tea), as opposed to women from the South of France, Copenhagen (Denmark), and Umeå and Malmö (Sweden), where the more educated tended to drink more coffee and tea on the day of the recall compared to the less educated women (Table 4).
Table 4.
Fully adjusted mean 1 daily intake of coffee and tea (g/day) by education level and sex in the EPIC calibration study population based on 24-H Dietary Recall across EPIC centres ordered from south to north.
3.5. Lifestyle Factors
Lifestyle factors such as smoking (p < 0.001 for men and women) and physical activity (p < 0.01 for men and p = 0.03 for women) were both associated with coffee and tea consumption. These two factors were still significant when considering coffee and tea separately in both men and women. Whilst there was a clear pattern for smoking, where current smokers drank more coffee and tea compared to “never” smokers, a similarly consistent pattern was not found for physical activity (see Supplemental Materials, Tables S2 and S3). Nevertheless, significant linear trends were found among men in Murcia (Spain, p = 0.02), Bilthoven (The Netherlands, p = 0.04), and Copenhagen (Denmark, p = 0.04), where active men tended to drink ~100 g/day less coffee and tea combined compared to inactive men. The opposite was observed for men from the UK general population (p < 0.05). Similar patterns were observed in women in these very same centres, although respective linear trends were statistically nonsignificant (all p > 0.13).
The overall association between BMI and coffee and tea consumption was not significant among women (p = 0.06), but was significant among men (p < 0.001), although with no clear pattern except for men from Potsdam (Germany), where normal-weight men tended to drink significantly more coffee and tea compared to obese men (Table S4).
3.6. Contribution to Energy and Micronutrients
The contribution of coffee and tea along with their added ingredients (i.e., milk, sugar, honey, etc.) to energy, sugar, calcium, magnesium, and phosphorus intakes was the lowest in Norway. The contribution of coffee and tea to energy intake ranged from 1.2% in the south and east of Norway to 8.2% in Asturias (Spain) (Table 5). The contribution to sugar intake ranged from 2.5% in the north and west of Norway to 23% in Varese (Italy). Coffee and tea contributed to more than one-fifth of sugar intake in five centres, all of them belonging to the southern centres (Granada, Navarra, Asturias, Naples, and Varese). The contribution of coffee and tea to calcium intake ranged from 3.3% in the north and west of Norway to 33% in Asturias (Spain). As for sugar, in Spain and in most Italian centres, coffee and tea contributed to more than one-fifth of calcium intake, reaching one-fourth and even one-third in some centres. The contribution of coffee and tea to magnesium intake ranged from 8.7% in Greece to 35% in France. Compared to other countries, in France, this contribution was higher and around 30%. The contribution of coffee and tea to phosphorus intake ranged from 1.6% in Norway to 19% in Murcia (Spain).
Table 5.
Total mean intake of energy and selected nutrients, amount of energy and selected nutrients from coffee and tea, and percentage contribution of coffee and tea to the total mean intake of energy and selected nutrients in the EPIC calibration study population based on 24-H Dietary Recall, by center ordered from south to north.
4. Discussion
This is one of the largest population-based studies comparing coffee and tea consumption using a common, detailed, and standardized 24-h dietary recall method across 10 European countries participating in the EPIC study.
The amount of coffee and tea consumed varied widely across countries/centres and according to the type of beverages consumed. Average tea consumption was highest in the UK and lowest in Greece and Spain, while coffee consumption was highest in Denmark and lowest in Greece.
Apart from Greece, the majority of coffee and tea intakes from the previous day was consumed at home. Most coffee drinkers consumed caffeinated coffee.
These results are consistent with studies that used long-term dietary assessment methods in the EPIC cohort [36,37,38]. For coffee, the observed geographical differences might be due to different consumption habits. For instance, in countries such as Denmark, people tend to drink more diluted coffee in larger amounts, whilst in other countries such as Greece or Italy, people tend to drink stronger coffee in smaller amounts (e.g., Turkish coffee or ristretto coffee). Indeed, in Italy, the mean cup of coffee weighed 55 g, whereas in Denmark, the mean cup of coffee weighed 182 g.
Coffee and tea consumption also varied to some extent by sex, age, and education, with the direction of the associations being different across centres. For example, coffee and tea consumption combined decreased with level of education in the UK general population by about 200–300 g/day, comparing the population subgroup with primary education to that with a university degree (Table 4); whereas an opposite trend was observed in the two centers in Sweden (Malmö, Umea) and in Copenhagen (Denmark). In the remaining countries/centers, differences across level of education were less pronounced, which suggests that coffee and tea consumption is driven by country-specific dietary habits rather than characteristics at the individual level. Other studies that have investigated relationships between sociodemographic factors and coffee consumption also reported mixed results. For instance, the National Health and Nutrition Examination Survey (NHANES) 2003–2012 in the US observed that the mean usual intakes of coffee were higher in men than in women, in older versus younger individuals, and in lower- versus higher-educated individuals [39]. Different results were reported from the Japan Collaborative Cohort Study for Evaluation of Cancer Risk (JACC study), in which both men and women with high coffee consumption were younger and better educated [40]. A cross-sectional population-based survey conducted in Poland reported that higher coffee consumers were more likely to be women, younger, and with a medium–higher education [41]. The same study also reported that higher tea consumers were more likely to be women. These mixed results emphasize the fact that coffee and tea consumption differs with the population under investigation and explain why no homogeneity was found across the different EPIC centres.
In the present study, current smokers compared to former/“never” smokers tended to drink more coffee and tea. Other studies conducted in the US, but focusing on coffee only, reported that lifestyle factors such as smoking were related to coffee consumption. Also, in the National Institute of Health-American Association of Retired Persons Diet and Health Study, coffee drinkers where more likely to smoke [2]. A more recent study, also conducted in the US but using the NHANES 2003–2012 data, reported that the mean intake of coffee was higher among smokers versus “never” smokers [39]. The same pattern was also observed in Japan [40], Singapore [42], and Brazil [43].
Overall, BMI was associated to coffee and tea consumption among men, but with no clear patterns, and was not associated with coffee and tea consumption among women. This result, albeit different from what is generally reported in the literature [37,41,44,45], was not unexpected, considering the cross-sectional design and the use of a single 24-h dietary recall, and that the development of overweightness or obesity is a life course process.
The contribution of coffee and tea to sugar and calcium intakes was higher in Italy and Spain compared to other countries, reflecting different consumption habits and suggesting that in Southern European countries, people tended to add (more) sugar and milk, which both contribute to total sugar intake, to their coffee and tea. In those two countries, coffee and tea, with their added ingredients, contributed to about 20% to the overall sugar intakes, whilst in Norway, coffee and tea contributed to less than 3%. Given these results, it is recommended to consider both coffee and tea as potential major sources of sugar intake (free/added sugars) in dietary monitoring and public health surveillance. There are health concerns regarding added/free sugar consumption, and compared to carbonated soft drinks, coffee and tea with their added ingredients receive less attention. In a more positive sense, this also applies to coffee and tea as a source of calcium, where the milk added is rarely considered as a source of calcium.
The present study was based on a single 24-HDR and therefore did not reflect usual intakes of individuals. Hence, the interpretation of nonconsumers should be performed with caution due to the day-to-day variability. Indeed, the prevalence of tea or coffee nonconsumers was higher compared to the same prevalence measured with the EPIC country-specific Food Frequency Questionnaire assessing food intakes over the past 12 months [46]. However, considering the large sample size, except in Ragusa, and the fact that individuals usually drink such beverages on a daily basis, the population mean consumption levels should have been reasonably well captured. Indeed, when comparing the results of the present calibration study to the EPIC long-term consumption data, similar patterns were found [36,37,38]. Moreover, the standard error of the mean should be interpreted with caution because it is most likely overestimated due the day-to-day variation in consumption levels.
Data for the current study were collected in the mid to late 1990s, and coffee and tea intakes may have changed over time. Compared to more recent surveys conducted between 2003 and 2011 in Germany, Denmark, Spain, the UK, Italy, The Netherlands, and Sweden, where a similar dietary assessment method was used, i.e., 24-h dietary recalls, coffee intake in our study was lower, whilst tea intake was higher [47]. Such comparisons indicate that our study may serve as a common benchmark to evaluate trends in coffee and tea consumption over time in these countries.
However, some caution is warranted because the EPIC study populations were not necessarily representative of the corresponding national populations, and in several countries, they tended to be more “health-conscious”.
Although the information about coffee was detailed, as individuals were asked to specify whether coffee was with caffeine or decaffeinated, the EPIC Nutrient DataBase does not contain information on caffeine content. Hence, for instance, one cup of coffee in Italy—where a 60-mL cup of espresso contains approximatively 80 mg of caffeine [48]—cannot be strictly compared with one cup of coffee in Denmark, where a 200-mL cup of filter coffee contains approximatively 90 mg of caffeine [48]. However, caffeine intake across Europe, as reported in the European Food Safety Authority’s fact sheets on caffeine [48], roughly confirm our findings based on consumed quantity of the beverages. For example, the estimated caffeine intakes in Greece (~30 mg/day) and Spain (67 mg/day) were lower as compared to Denmark (~320 mg/day) or Germany (~238 mg/day) [48]. The same reasoning applies for tea, as the different types of tea (green, white, black) differ in caffeine content [49]. The assessment of caffeine intake is of importance and therefore there is a need for collecting more detailed data, to add caffeine content in food composition tables or to use biomarkers, such as the dimethylxanthines theophylline or paraxanthine, in order to enable a more objective assessment of caffeine intake [49]. Additionally, the brewing method might also be considered when collecting data because of the consequences on the content of diterpenes [50] that have an anticarcinogenic activity [6].
The health benefits of coffee and tea consumption are still controversial [15,17,19]. Therefore, the use of a standardized method such as the one used in the present study, but with repeated assessments, to collect comparable dietary data across countries is of interest as it might help to investigate better associations between coffee and tea consumption and health outcomes. Moreover, such a method provides data that is not only geographically comparable, but is also comparable over time.
5. Conclusions
Levels of coffee and tea intake, and their contribution to energy and sugar intake, differed greatly among European adults. Variation in consumption was mostly driven by geographical region and to a lesser extent by individuals’ characteristics.
Supplementary Materials
The following are available online at http://www.mdpi.com/2072-6643/10/6/725/s1. Figure S1: Percentages of consumers and nonconsumers of coffee and tea among men the day of the 24-h recall by centre; Figure S2: Percentages of consumers and nonconsumers of coffee and tea among women the day of the 24-h recall by centre; Figure S3: Percentage of consumers of coffee with caffeine and decaffeinated coffee among men who consumed coffee the day of the 24-h recall by centre; Figure S4: Percentage of consumers of coffee with caffeine and decaffeinated coffee among women who consumed coffee the day of the 24-h recall by centre; Table S1: Mean daily intake of coffee and tea (g/day) by type and country in the EPIC calibration study population based on 24-HDR among men and women; Table S2: Fully adjusted mean daily intake of coffee and tea (g/day) by smoking status and sex in the EPIC calibration study population based on 24-HDR across EPIC centres ordered from south to north; Table S3: Fully adjusted mean daily intake of coffee and tea (g/day) by physical activity level and sex in the EPIC calibration study population based on 24-HDR across EPIC centres ordered from south to north; Table S4: Fully adjusted mean daily intake of coffee and tea (g/day) by BMI group and sex in the EPIC calibration study population based on 24-HDR across EPIC centres ordered from south to north.
Author Contributions
N.S., H.F., and I.H. initiated the study; N.S. and G.N. took responsibility for dietary intake data and their interpretation; A.M. (Aurélie Moskal) and E.L. performed the statistical analyses; H.F. supervised the statistical analyses; E.L., A.M. (Aurélie Moskal), A.M. (Amy Mullee), G.N., I.H., M.J.G., and H.F. interpreted the results; E.L. wrote the manuscript taking into account comments from all co-authors; H.F., A.M. (Aurélie Moskal), I.H., M.J.G. and A.M. (Amy Mullee) contributed to the drafting of the manuscript; H.F. had primary responsibility for the final content. All other coauthors were local EPIC investigators involved in the collection of dietary data and other data. All authors critically revised the manuscript for intellectual content and approved the final version of the manuscript.
Acknowledgments
The EPIC study was supported by grants from the ‘Europe Against Cancer’ programme of the European Commission (SANCO); Ligue contre le Cancer (France); Société 3M (France); Mutuelle Générale de l’Education Nationale Institut National de la Santé et de la Recherche Médicale (INSERM); German Cancer Aid; German Cancer Research Center; German Federal Ministry of Education and Research; Danish Cancer Society; Health Research Fund (FIS) of the Spanish Ministry of Health; the participating regional governments and institutions of Spain; Cancer Research UK; Medical Research Council, UK; the Stroke Association, UK; British Heart Foundation; Department of Health, UK; Food Standards Agency, UK; the Wellcome Trust, UK; Greek Ministry of Health; Greek Ministry of Education; a fellowship honouring Vasilios and Nafsika Tricha (Greece); the Hellenic Health Foundation; Italian Association for Research on Cancer; Dutch Ministry of Health, Welfare and Sports; Dutch Ministry of Health; Dutch Prevention Funds; LK Research Funds; Dutch ZON (Zorg Onderzoek Nederland); World Cancer Research Fund (WCRF); Swedish Cancer Society; Swedish Scientific Council; Regional Government of Skane, Sweden; Catalan Institute of Oncology, Barcelona, Spain; Public Health Institute, Navarra, Spain; Andalusian School of Public Health, Granada, Spain; Public Health Department of Gipuzkoa, Health Department of the Basque Country, Donostia-San Sebastian, Spain; Murcia Health Council, Murcia, Spain; Health and Health Services Council, Principality of Asturias, Spain. This study was also supported by contracts from the US NCI (N02-PC-25023) and the EC (Contract No. SPC 2002332 for the EPIC and EuroFIR NoE Contract No. 513944). In addition, we wish to thank all study participants for their cooperation and all interviewers who participated in the fieldwork studies in each EPIC centre. The contribution of A.M. (Amy Mullee), to the work reported in this paper was undertaken during the tenure of an IARC-Ireland Postdoctoral Fellowship from the International Agency for Research on Cancer, funded by the Irish Cancer Society. We also acknowledge the Northern Sweden Diet Database and the funds supporting it, including the Swedish Research Council (VR), the Swedish Research Council for Health, Working Life and Welfare (FORTE), and the Västerbotten County Council.
Conflicts of Interest
The authors declare no conflict of interest.
References
- Graham, H.N. Green tea composition, consumption, and polyphenol chemistry. Prev. Med. 1992, 21, 334–350. [Google Scholar] [CrossRef]
- Freedman, N.D.; Park, Y.; Abnet, C.C.; Hollenbeck, A.R.; Sinha, R. Association of Coffee Drinking with Total and Cause-Specific Mortality. New Engl. J. Med. 2012, 366, 1891–1904. [Google Scholar] [CrossRef] [PubMed]
- World Cancer Research Fund/American Institute for Cancer Research. Diet, Nutrition, Physical Activity, and Cancer: A Global Perspective. Continuous Update Project Expert Report 2018. Available online: Dietandcancerreport.org (accessed on 29 May 2018).
- Lin, J.K. Mechanisms of cancer chemoprevention by tea and tea polyphenols. In Tea and Tea Products Chemistry and Health-Promoting Properties; Ho, C.T., Lin, J.K., Shahidi, F., Eds.; CRC Press: Boca Raton, FL, USA, 2009; pp. 161–176. [Google Scholar]
- Yang, C.S.; Wang, H.; Li, G.X.; Yang, Z.; Guan, F.; Jin, H. Cancer prevention by tea: Evidence from laboratory studies. Pharmacol. Res. 2011, 64, 113–122. [Google Scholar] [CrossRef] [PubMed]
- Cavin, C.; Holzhaeuser, D.; Scharf, G.; Constable, A.; Huber, W.W.; Schilter, B. Cafestol and kahweol, two coffee specific diterpenes with anticarcinogenic activity. Food Chem. Toxicol. 2002, 40, 1155–1163. [Google Scholar] [CrossRef]
- Norat, T.; Aune, D.; Navarro, D.; Abar, L. The Associations between Food, Nutrition and Physical Activity and the Risk of Liver Cancer; World Cancer Research Fund International: London, UK, 2015. [Google Scholar]
- Cao, S.; Liu, L.; Yin, X.; Wang, Y.; Liu, J.; Lu, Z. Coffee consumption and risk of prostate cancer: A meta-analysis of prospective cohort studies. Carcinogenesis 2014, 35, 256–261. [Google Scholar] [CrossRef] [PubMed]
- Gunter, M.J.; Murphy, N.; Cross, A.J.; Dossus, L.; Dartois, L.; Fagherazzi, G.; Kaaks, R.; Kühn, T.; Boeing, H.; Aleksandrova, K.; et al. Coffee drinking and mortality in 10 european countries: A multinational cohort study. Ann. Intern. Med. 2017, 167, 236–247. [Google Scholar] [CrossRef] [PubMed]
- Lu, Y.; Zhai, L.; Zeng, J.; Peng, Q.; Wang, J.; Deng, Y.; Xie, L.; Mo, C.; Yang, S.; Li, S.; et al. Coffee consumption and prostate cancer risk: An updated meta-analysis. Cancer Causes Control 2014, 25, 591–604. [Google Scholar] [CrossRef] [PubMed]
- Sang, L.X.; Chang, B.; Li, X.H.; Jiang, M. Consumption of coffee associated with reduced risk of liver cancer: A meta-analysis. BMC Gastroenterol. 2013, 13, 34. [Google Scholar] [CrossRef] [PubMed]
- Tang, J.; Zheng, J.-S.; Fang, L.; Jin, Y.; Cai, W.; Li, D. Tea consumption and mortality of all cancers, CVD and all causes: A meta-analysis of eighteen prospective cohort studies. Br. J. Nutr. 2015, 114, 673–683. [Google Scholar] [CrossRef] [PubMed]
- Wang, L.; Zhang, X.; Liu, J.; Shen, L.; Li, Z. Tea consumption and lung cancer risk: A meta-analysis of case-control and cohort studies. Nutrition 2014, 30, 1122–1127. [Google Scholar] [CrossRef] [PubMed]
- Je, Y.; Liu, W.; Giovannucci, E. Coffee consumption and risk of colorectal cancer: A systematic review and meta-analysis of prospective cohort studies. Int. J. Cancer 2009, 124, 1662–1668. [Google Scholar] [CrossRef] [PubMed]
- Zheng, P.; Zheng, H.M.; Deng, X.M.; Zhang, Y.D. Green tea consumption and risk of esophageal cancer: A meta-analysis of epidemiologic studies. BMC Gastroenterol. 2012, 12, 165. [Google Scholar] [CrossRef] [PubMed]
- Hu, Z.H.; Lin, Y.W.; Xu, X.; Chen, H.; Mao, Y.Q.; Wu, J.; Xu, X.L.; Zhu, Y.; Li, S.Q.; Zheng, X.Y.; et al. No association between tea consumption and risk of renal cell carcinoma: A meta-analysis of epidemiological studies. Asian Pac. J. Cancer Prev. 2013, 14, 1691–1695. [Google Scholar] [CrossRef] [PubMed]
- Li, X.J.; Ren, Z.J.; Qin, J.W.; Zhao, J.H.; Tang, J.H.; Ji, M.H.; Wu, J.Z. Coffee consumption and risk of breast cancer: An up-to-date meta-analysis. PLoS ONE 2013, 8, e52681. [Google Scholar] [CrossRef] [PubMed]
- Sang, L.X.; Chang, B.; Li, X.H.; Jiang, M. Green tea consumption and risk of esophageal cancer: A meta-analysis of published epidemiological studies. Nutr. Cancer 2013, 65, 802–812. [Google Scholar] [CrossRef] [PubMed]
- Crippa, A.; Discacciati, A.; Larsson, S.C.; Wolk, A.; Orsini, N. Coffee Consumption and Mortality from All Causes, Cardiovascular Disease, and Cancer: A Dose-Response Meta-Analysis. Am. J. Epidemiol. 2014, 180, 763–775. [Google Scholar] [CrossRef] [PubMed]
- Loomis, D.; Guyton, K.Z.; Grosse, Y.; Lauby-Secretan, B.; El Ghissassi, F.; Bouvard, V.; Benbrahim-Tallaa, L.; Guha, N.; Mattock, H.; Straif, K.; et al. Carcinogenicity of drinking coffee, mate, and very hot beverages. Lancet Oncol. 2016, 17, 877–878. [Google Scholar] [CrossRef]
- Bingham, S.A. Limitations of the various methods for collecting dietary intake data. Ann. Nutr. Metab. 1991, 35, 117–127. [Google Scholar] [CrossRef] [PubMed]
- Riboli, E.; Hunt, K.J.; Slimani, N.; Ferrari, P.; Norat, T.; Fahey, M.; Charrondière, U.R.; Hémon, B.; Casagrande, C.; Vignat, J.; et al. European Prospective Investigation into Cancer and Nutrition (EPIC): Study populations and data collection. Public Health Nutr. 2002, 5, 1113–1124. [Google Scholar] [CrossRef] [PubMed]
- Slimani, N.; Kaaks, R.; Ferrari, P.; Casagrande, C.; Clavel-Chapelon, F.; Lotze, G.; Kroke, A.; Trichopoulos, D.; Trichopoulou, A.; Lauria, C.; et al. European Prospective Investigation into Cancer and Nutrition (EPIC) calibration study: Rationale, design and population characteristics. Public Health Nutr. 2002, 5, 1125–1145. [Google Scholar] [CrossRef] [PubMed]
- Riboli, E.; Kaaks, R. The EPIC Project: Rationale and study design. European Prospective Investigation into Cancer and Nutrition. Int. J. Epidemiol. 1997, 26 (Suppl. 1), S6–S14. [Google Scholar] [CrossRef] [PubMed]
- Bingham, S.; Riboli, E. Diet and cancer—the European Prospective Investigation into Cancer and Nutrition. Nat. Rev. Cancer 2004, 4, 206–215. [Google Scholar] [CrossRef] [PubMed]
- Ferrari, P.; Kaaks, R.; Fahey, M.T.; Slimani, N.; Day, N.E.; Pera, G.; Boshuizen, H.C.; Roddam, A.; Boeing, H.; Nagel, G.; et al. Within- and between-cohort variation in measured macronutrient intakes, taking account of measurement errors, in the European Prospective Investigation into Cancer and Nutrition study. Am. J. Epidemiol. 2004, 160, 814–822. [Google Scholar] [CrossRef] [PubMed]
- Ferrari, P.; Day, N.E.; Boshuizen, H.C.; Roddam, A.; Hoffmann, K.; Thiebaut, A.; Pera, G.; Overvad, K.; Lund, E.; Trichopoulou, A.; et al. The evaluation of the diet/disease relation in the EPIC study: Considerations for the calibration and the disease models. Int. J. Epidemiol. 2008, 37, 368–378. [Google Scholar] [CrossRef] [PubMed]
- Kaaks, R.; Plummer, M.; Riboli, E.; Esteve, J.; van Staveren, W. Adjustment for bias due to errors in exposure assessments in multicenter cohort studies on diet and cancer: A calibration approach. Am. J. Clin. Nutr. 1994, 59, 245S–250S. [Google Scholar] [CrossRef] [PubMed]
- Kaaks, R.; Riboli, E.; van Staveren, W. Calibration of dietary intake measurements in prospective cohort studies. Am. J. Epidemiol. 1995, 142, 548–556. [Google Scholar] [CrossRef] [PubMed]
- Brustad, M.; Skeie, G.; Braaten, T.; Slimani, N.; Lund, E. Comparison of telephone vs face-to-face interviews in the assessment of dietary intake by the 24 h recall EPIC SOFT program--the Norwegian calibration study. Eur. J. Clin. Nutr. 2003, 57, 107–113. [Google Scholar] [CrossRef] [PubMed]
- Slimani, N.; Deharveng, G.; Charrondiere, R.U.; van Kappel, A.L.; Ocke, M.C.; Welch, A.; Lagiou, A.; van Liere, M.; Agudo, A.; Pala, V.; et al. Structure of the standardized computerized 24-h diet recall interview used as reference method in the 22 centers participating in the EPIC project. European Prospective Investigation into Cancer and Nutrition. Comput. Methods Program Biomed. 1999, 58, 251–266. [Google Scholar] [CrossRef]
- Slimani, N.; Ferrari, P.; Ocke, M.; Welch, A.; Boeing, H.; Liere, M.; Pala, V.; Amiano, P.; Lagiou, A.; Mattisson, I.; et al. Standardization of the 24-h diet recall calibration method used in the european prospective investigation into cancer and nutrition (EPIC): General concepts and preliminary results. Eur. J. Clin. Nutr. 2000, 54, 900–917. [Google Scholar] [CrossRef] [PubMed]
- Slimani, N.; Deharveng, G.; Unwin, I.; Southgate, D.A.; Vignat, J.; Skeie, G.; Salvini, S.; Parpinel, M.; Møller, A.; Ireland, J.; et al. The EPIC nutrient database project (ENDB): A first attempt to standardize nutrient databases across the 10 European countries participating in the EPIC study. Eur. J. Clin. Nutr. 2007, 61, 1037–1056. [Google Scholar] [CrossRef] [PubMed]
- Lahmann, P.H.; Friedenreich, C.; Schuit, A.J.; Salvini, S.; Allen, N.E.; Key, T.J.; Khaw, K.T.; Bingham, S.; Peeters, P.H.; Monninkhof, E.; et al. Physical activity and breast cancer risk: The European Prospective Investigation into Cancer and Nutrition. Cancer Epidemiol. Biomark. Prev. 2007, 16, 36–42. [Google Scholar] [CrossRef] [PubMed]
- Haftenberger, M.; Schuit, A.J.; Tormo, M.J.; Boeing, H.; Wareham, N.; Bueno-de-Mesquita, H.B.; Kumle, M.; Hjartåker, A.; Chirlaque, M.D.; Ardanaz, E.; et al. Physical activity of subjects aged 50-64 years involved in the European Prospective Investigation into Cancer and Nutrition (EPIC). Public Health Nutr. 2002, 5, 1163–1176. [Google Scholar] [CrossRef] [PubMed]
- Michaud, D.S.; Gallo, V.; Schlehofer, B.; Tjønneland, A.; Olsen, A.; Overvad, K.; Dahm, C.C.; Teucher, B.; Lukanova, A.; Boeing, H.; et al. Coffee and tea intake and risk of brain tumors in the European Prospective Investigation into Cancer and Nutrition (EPIC) cohort study. Am. J. Clin. Nutr. 2010, 92, 1145–1150. [Google Scholar] [CrossRef] [PubMed]
- Zamora-Ros, R.; Luján-Barroso, L.; Bueno-de-Mesquita, H.B.; Dik, V.K.; Boeing, H.; Steffen, A.; Tjønneland, A.; Olsen, A.; Bech, B.H.; Overvad, K.; et al. Tea and coffee consumption and risk of esophageal cancer: The European prospective investigation into cancer and nutrition study. Int. J. Cancer 2014, 135, 1470–1479. [Google Scholar] [CrossRef] [PubMed]
- Sanikini, H.; Dik, V.K.; Siersema, P.D.; Bhoo-Pathy, N.; Uiterwaal, C.S.P.M.; Peeters, P.H.M.; González, C.A.; Zamora-Ros, R.; Overvad, K.; Tjønneland, A.; et al. Total, caffeinated and decaffeinated coffee and tea intake and gastric cancer risk: Results from the EPIC cohort study. Int. J. Cancer 2015, 136, E720–E730. [Google Scholar] [CrossRef] [PubMed]
- Loftfield, E.; Freedman, N.D.; Dodd, K.W.; Vogtmann, E.; Xiao, Q.; Sinha, R.; Graubard, B.I. Coffee Drinking Is Widespread in the United States, but Usual Intake Varies by Key Demographic and Lifestyle Factors. J. Nutr. 2016, 146, 1762–1768. [Google Scholar] [CrossRef] [PubMed]
- Yamada, H.; Kawado, M.; Aoyama, N.; Hashimoto, S.; Suzuki, K.; Wakai, K.; Suzuki, S.; Watanabe, Y.; Tamakoshi, A.; The JACC Study Group. Coffee Consumption and Risk of Colorectal Cancer: The Japan Collaborative Cohort Study. J. Epidemiol. 2014, 24, 370–378. [Google Scholar] [CrossRef] [PubMed]
- Grosso, G.; Stepaniak, U.; Micek, A.; Topor-Mądry, R.; Pikhart, H.; Szafraniec, K.; Pająk, A. Association of daily coffee and tea consumption and metabolic syndrome: Results from the Polish arm of the HAPIEE study. Eur. J. Nutr. 2015, 54, 1129–1137. [Google Scholar] [CrossRef] [PubMed]
- Ainslie-Waldman, C.E.; Koh, W.-P.; Jin, A.; Yeoh, K.G.; Zhu, F.; Wang, R.; Yuan, J.M.; Butler, L.M. Coffee Intake and Gastric Cancer Risk: The Singapore Chinese Health Study. Cancer Epidemiol. Biomarkers Prev. 2014, 23, 638–647. [Google Scholar] [CrossRef] [PubMed]
- De Oliveira, R.A.M.; Araújo, L.F.; de Figueiredo, R.C.; Goulart, A.C.; Schmidt, M.I.; Barreto, S.M.; Ribeiro, A.L.P. Coffee Consumption and Heart Rate Variability: The Brazilian Longitudinal Study of Adult Health (ELSA-Brasil) Cohort Study. Nutrients 2017, 9, 741. [Google Scholar] [CrossRef] [PubMed]
- Kim, J.-H.; Park, Y.S. Light coffee consumption is protective against sarcopenia, but frequent coffee consumption is associated with obesity in Korean adults. Nutr. Res. 2017, 41, 97–102. [Google Scholar] [CrossRef] [PubMed]
- Vernarelli, J.A.; Lambert, J.D. Tea consumption is inversely associated with weight status and other markers for Metabolic Syndrome in U.S. adults. Eur. J. Nutr. 2013, 52, 1039–1048. [Google Scholar] [CrossRef] [PubMed]
- Caini, S.; Masala, G.; Saieva, C.; Kvaskoff, M.; Savoye, I.; Sacerdote, C.; Hemmingsson, O.; Hammer Bech, B.; Overvad, K.; Tjønneland, A.; et al. Coffee, tea and melanoma risk: Findings from the European Prospective Investigation into Cancer and Nutrition. Int. J. Cancer 2017, 140, 2246–2255. [Google Scholar] [CrossRef] [PubMed]
- EFSA. The EFSA Comprehensive European Food Consumption Database 2011. Available online: http://www.efsa.europa.eu/en/food-consumption/comprehensive-database (accessed on 18 August 2017).
- EFSA. Fact Sheets on Caffeine. 2015. Available online: http://www.efsa.europa.eu/en/corporate/pub/efsaexplainscaffeine150527 (accessed on 30 May 2018).
- Lang, R.; Dieminger, N.; Beusch, A.; Lee, Y.-M.; Dunkel, A.; Suess, B.; Skurk, T.; Wahl, A.; Hauner, H.; Hofmann, T. Bioappearance and pharmacokinetics of bioactives upon coffee consumption. Anal. Bioanal. Chem. 2013, 405, 8487–8503. [Google Scholar] [CrossRef] [PubMed]
- Urgert, R.; Katan, M.B. The cholesterol-raising factor from coffee beans. J. R. Soc. Med. 1996, 89, 618–623. [Google Scholar] [CrossRef] [PubMed]


© 2018 by the authors. Licensee MDPI, Basel, Switzerland. This article is an open access article distributed under the terms and conditions of the Creative Commons Attribution (CC BY) license (http://creativecommons.org/licenses/by/4.0/).