Antioxidant Peptides from Goat Milk Fermented by Lactobacillus casei L61: Preparation, Optimization, and Stability Evaluation in Simulated Gastrointestinal Fluid


Abstract
1. Introduction
2. Materials and Methods
2.1. Strain
2.2. Preparation of Fermented Goat Milk and Whey Fractions
2.3. Determination of Hydroxyl Free Radical Scavenging Rate
2.4. Determination of 1,1-diphenyl-2-picrylhydrazyl (DPPH) Radical Scavenging Rate
2.5. P–B Experimental Design
2.6. Steepest Ascent Experiment
2.7. B–B Design of RSM
2.8. Isolation and Purification of Antioxidant Peptides
2.9. Resistance to Simulated Gastric and Intestinal Fluids
2.10. Statistical Analysis of the Data
3. Results
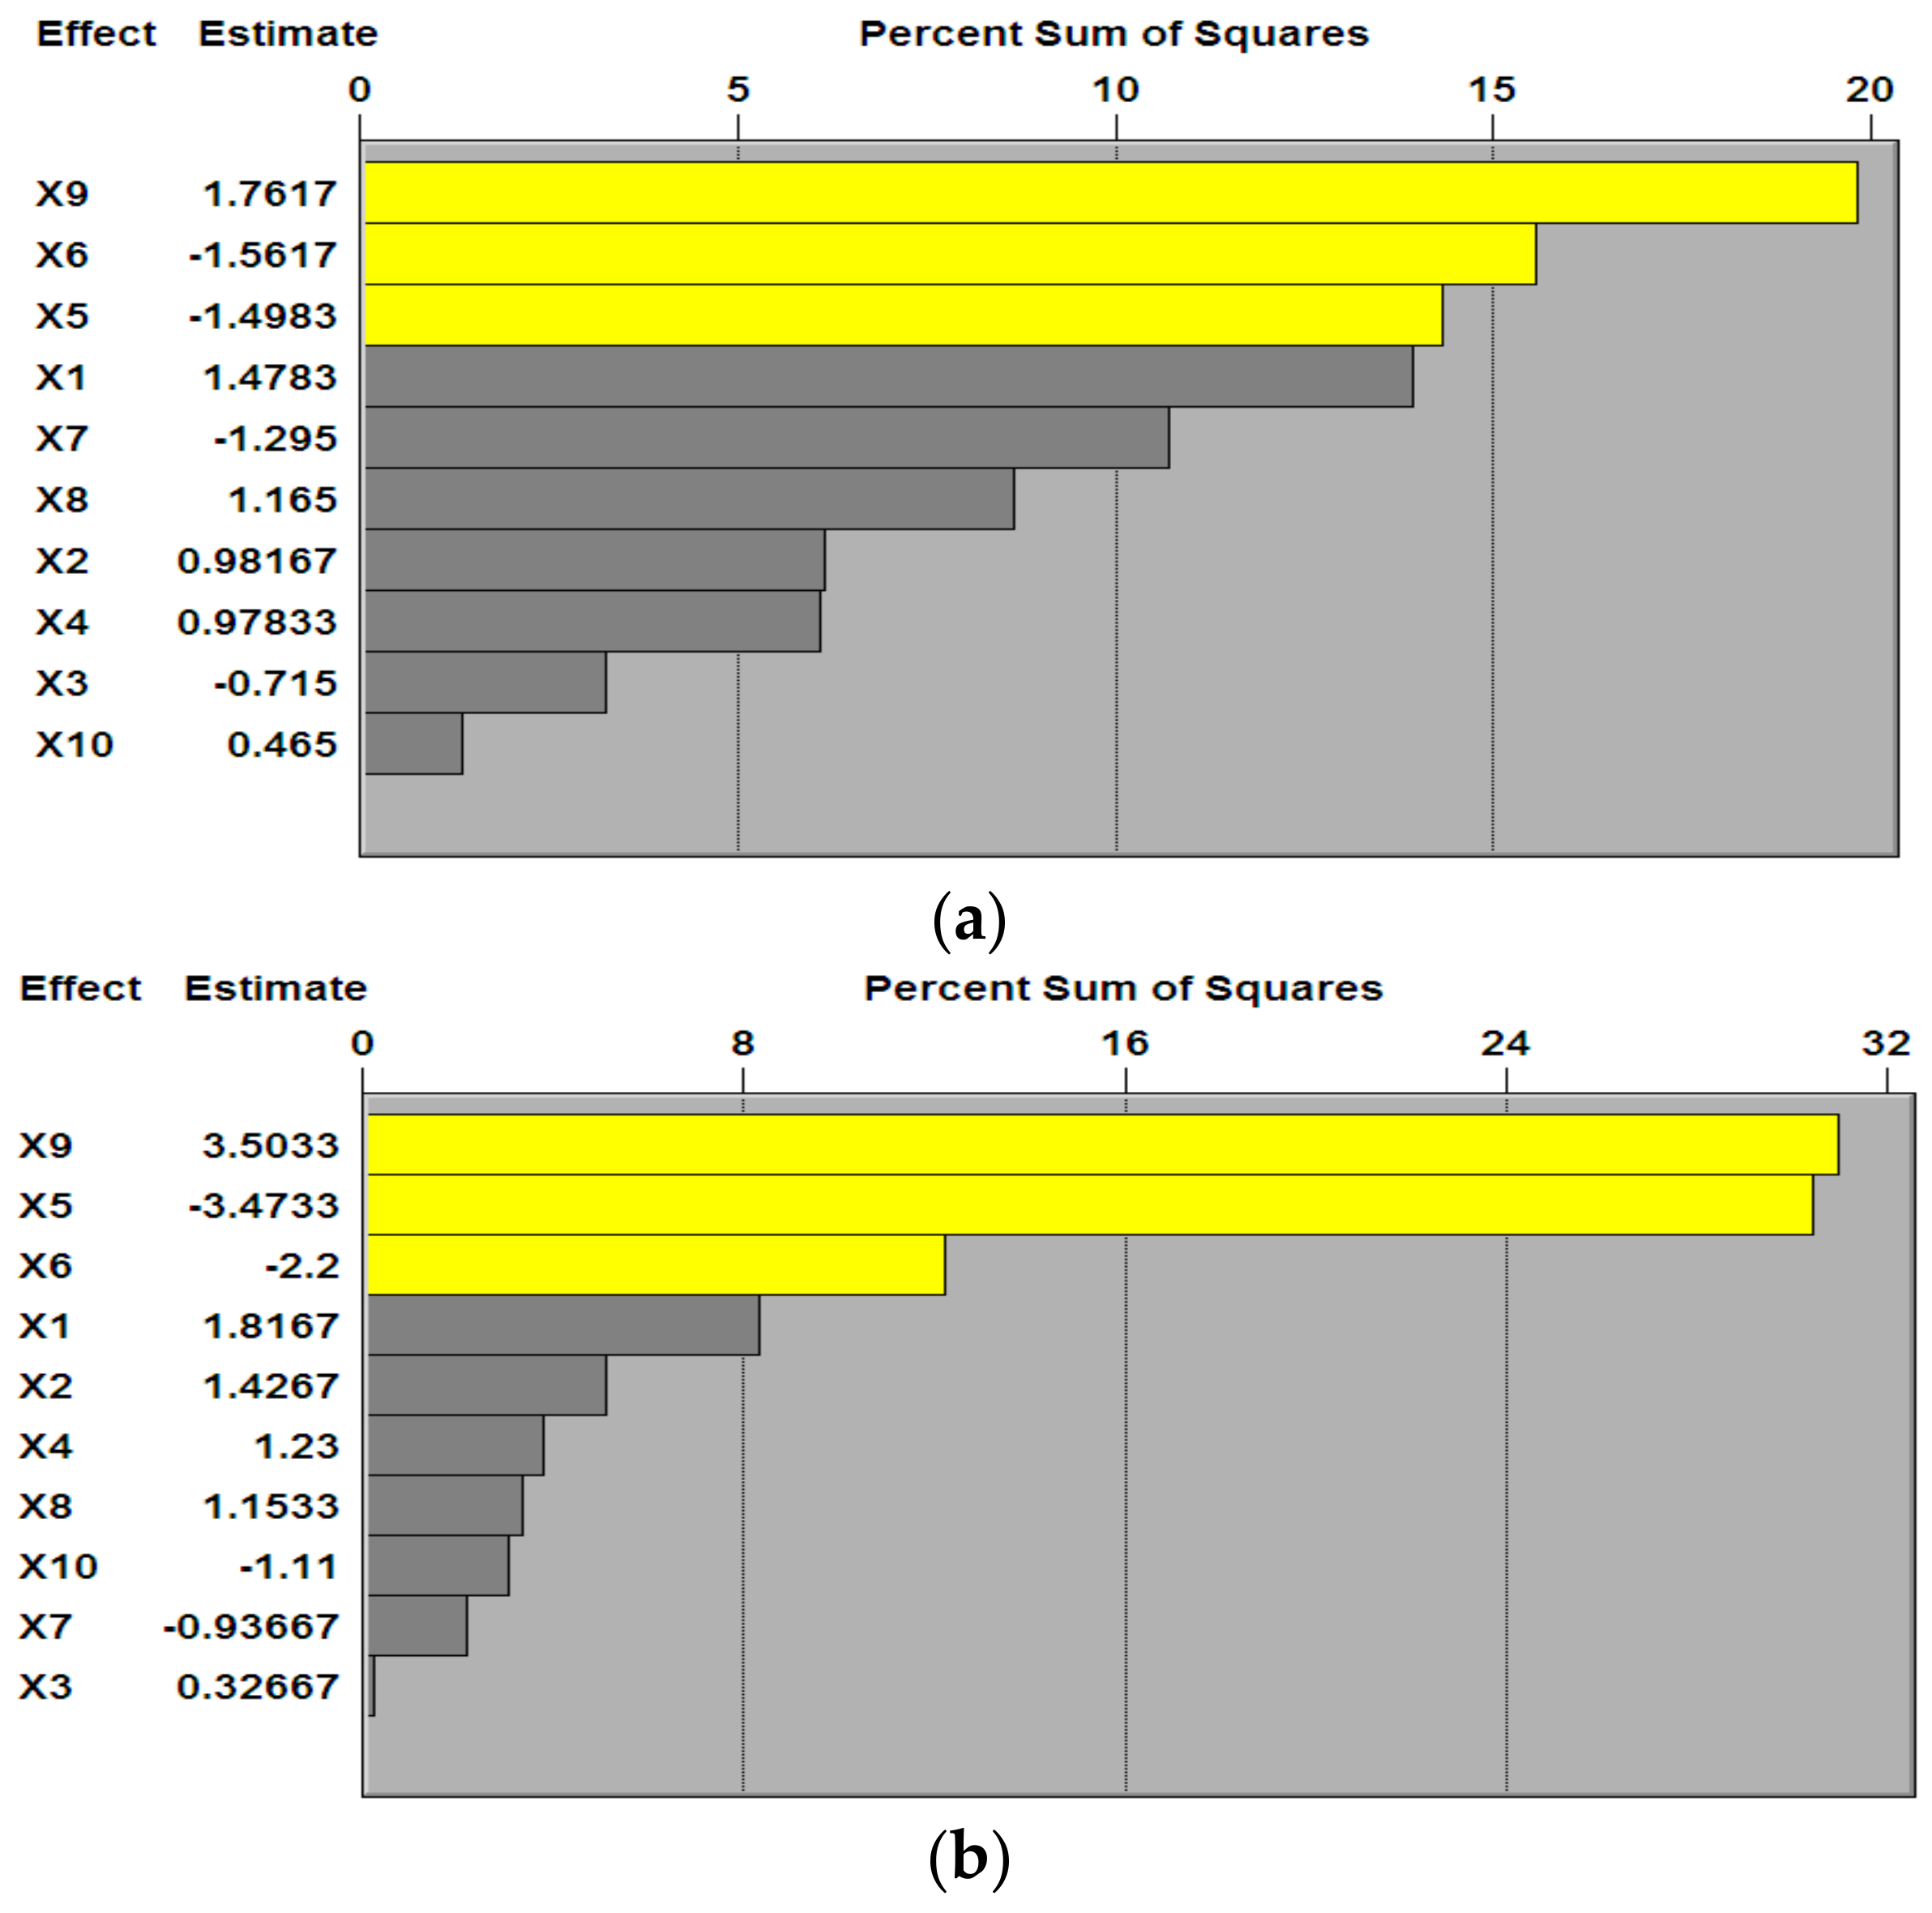
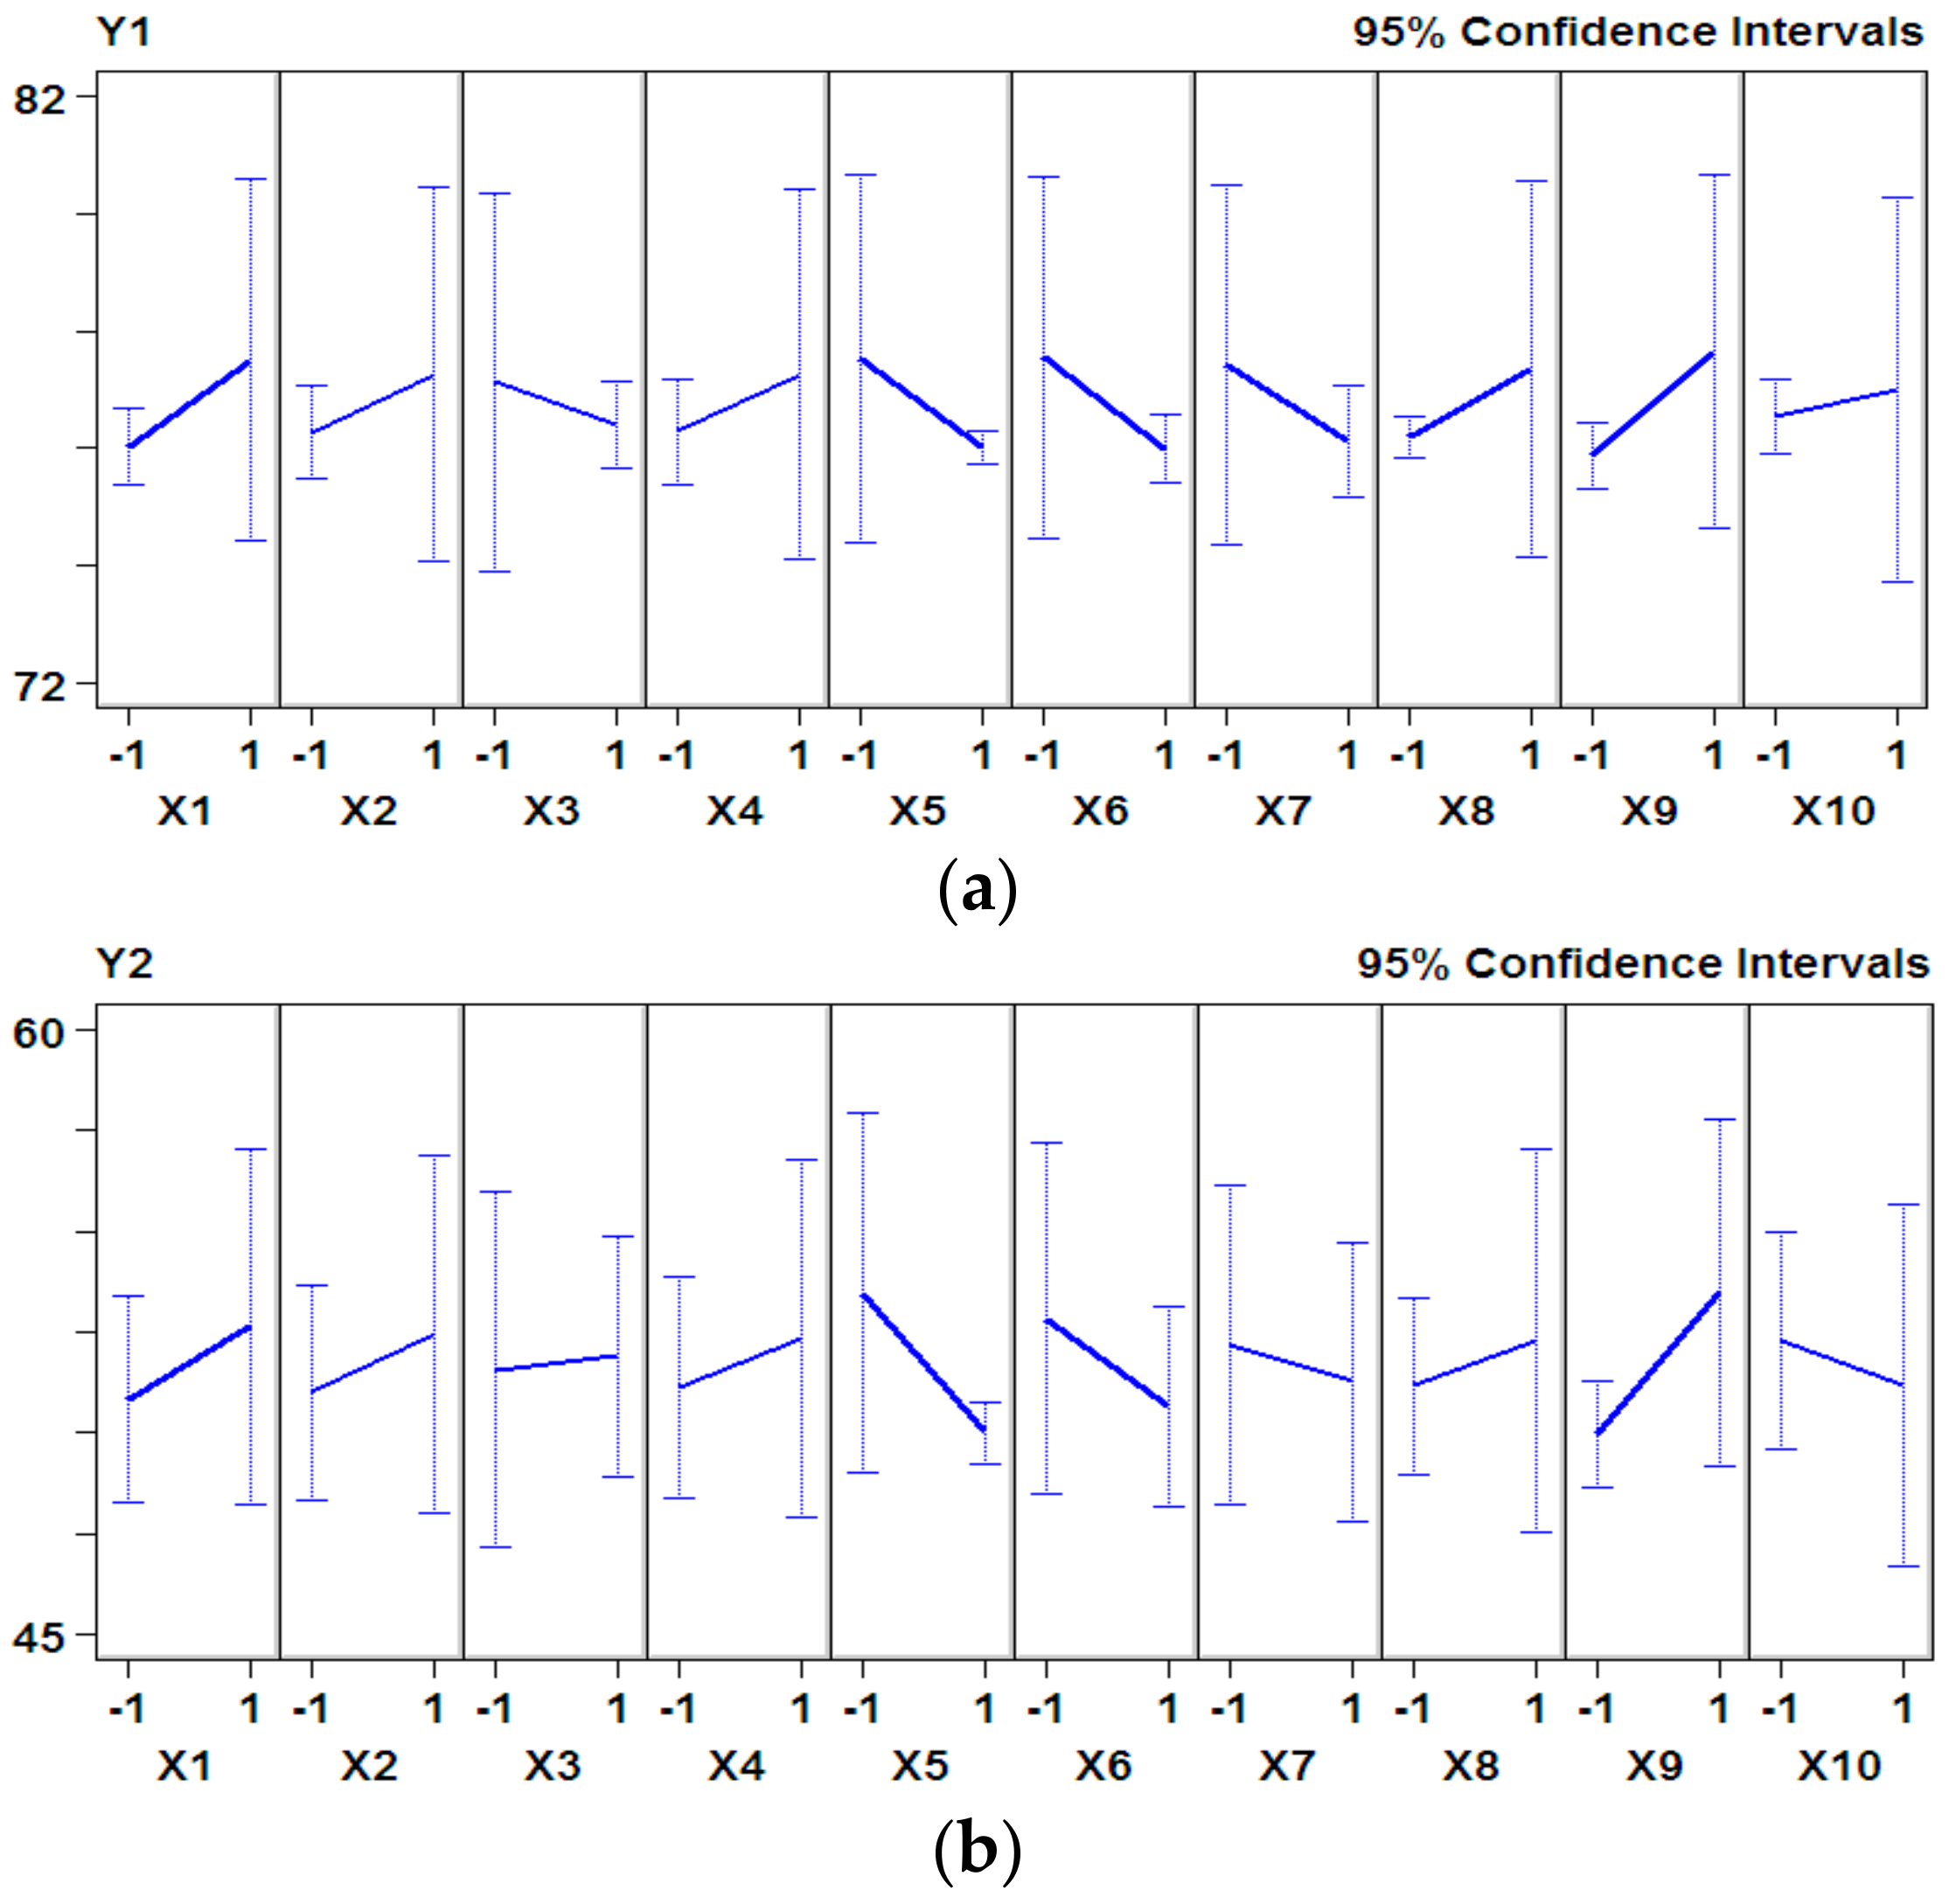
3.1. P–B Experimental Design and Results
3.2. The Experimental Design and Results of the Steepest Ascent Experiment
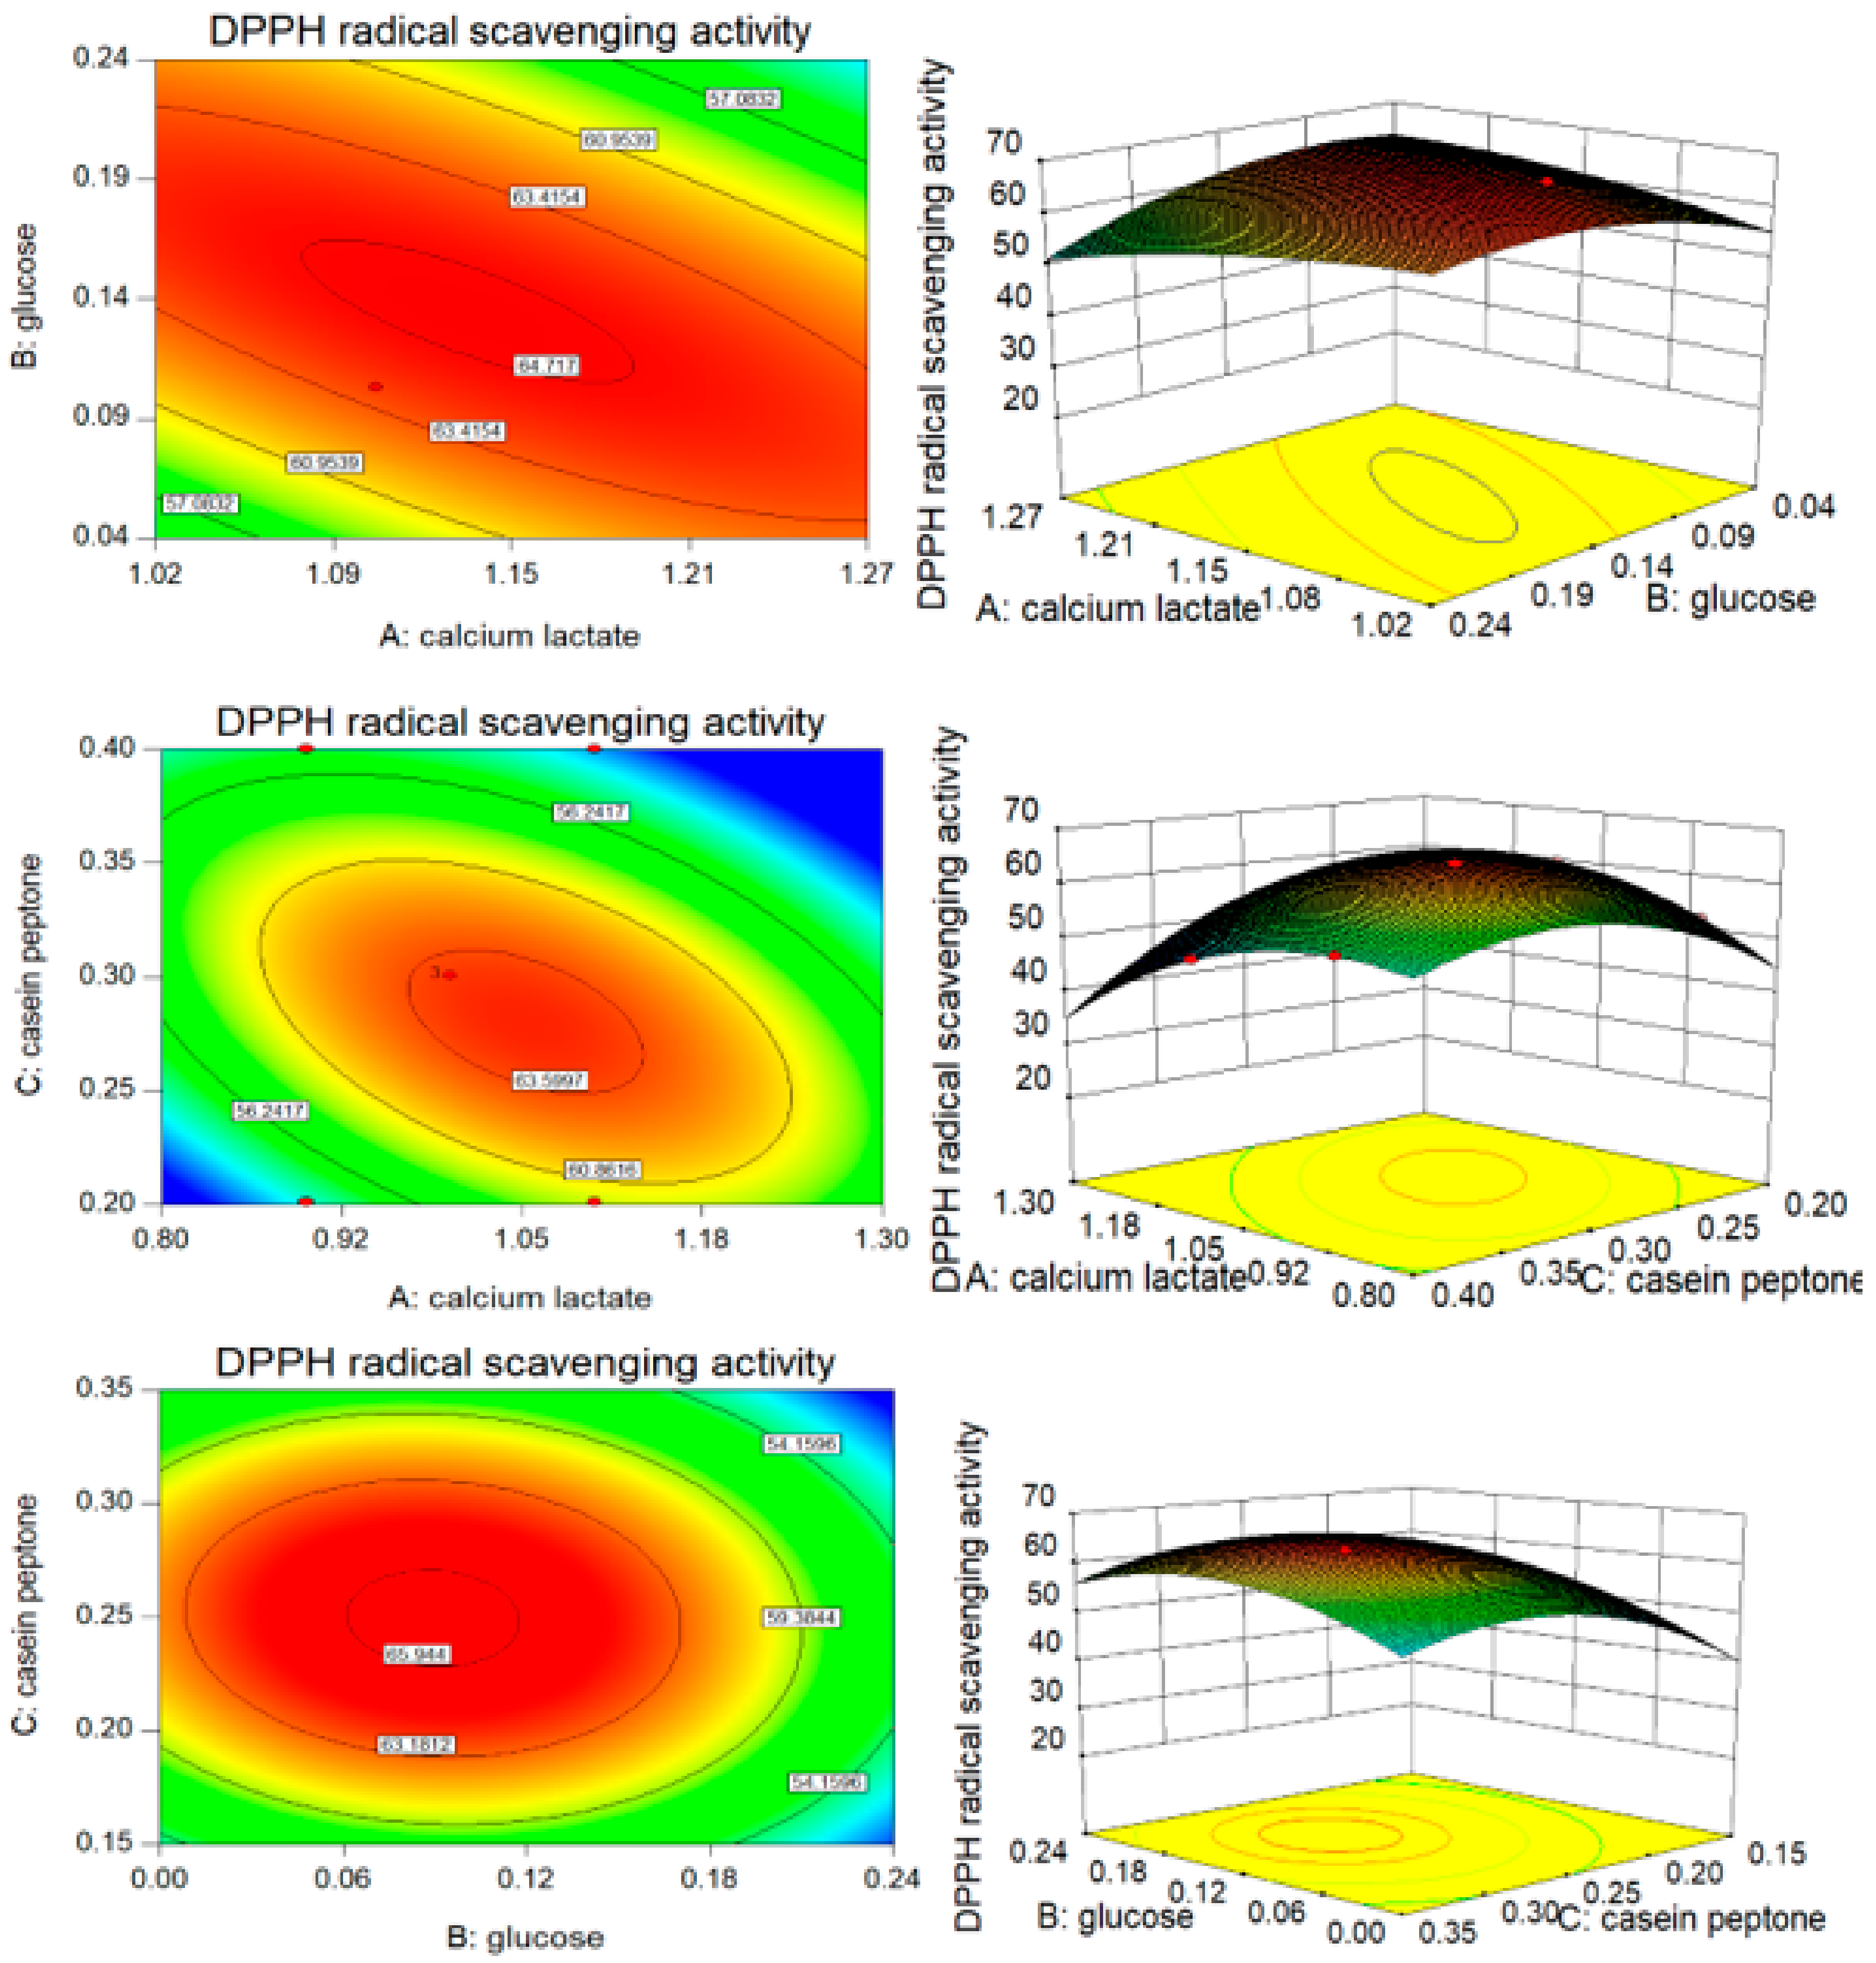
3.3. B–B Experimental Design and Results
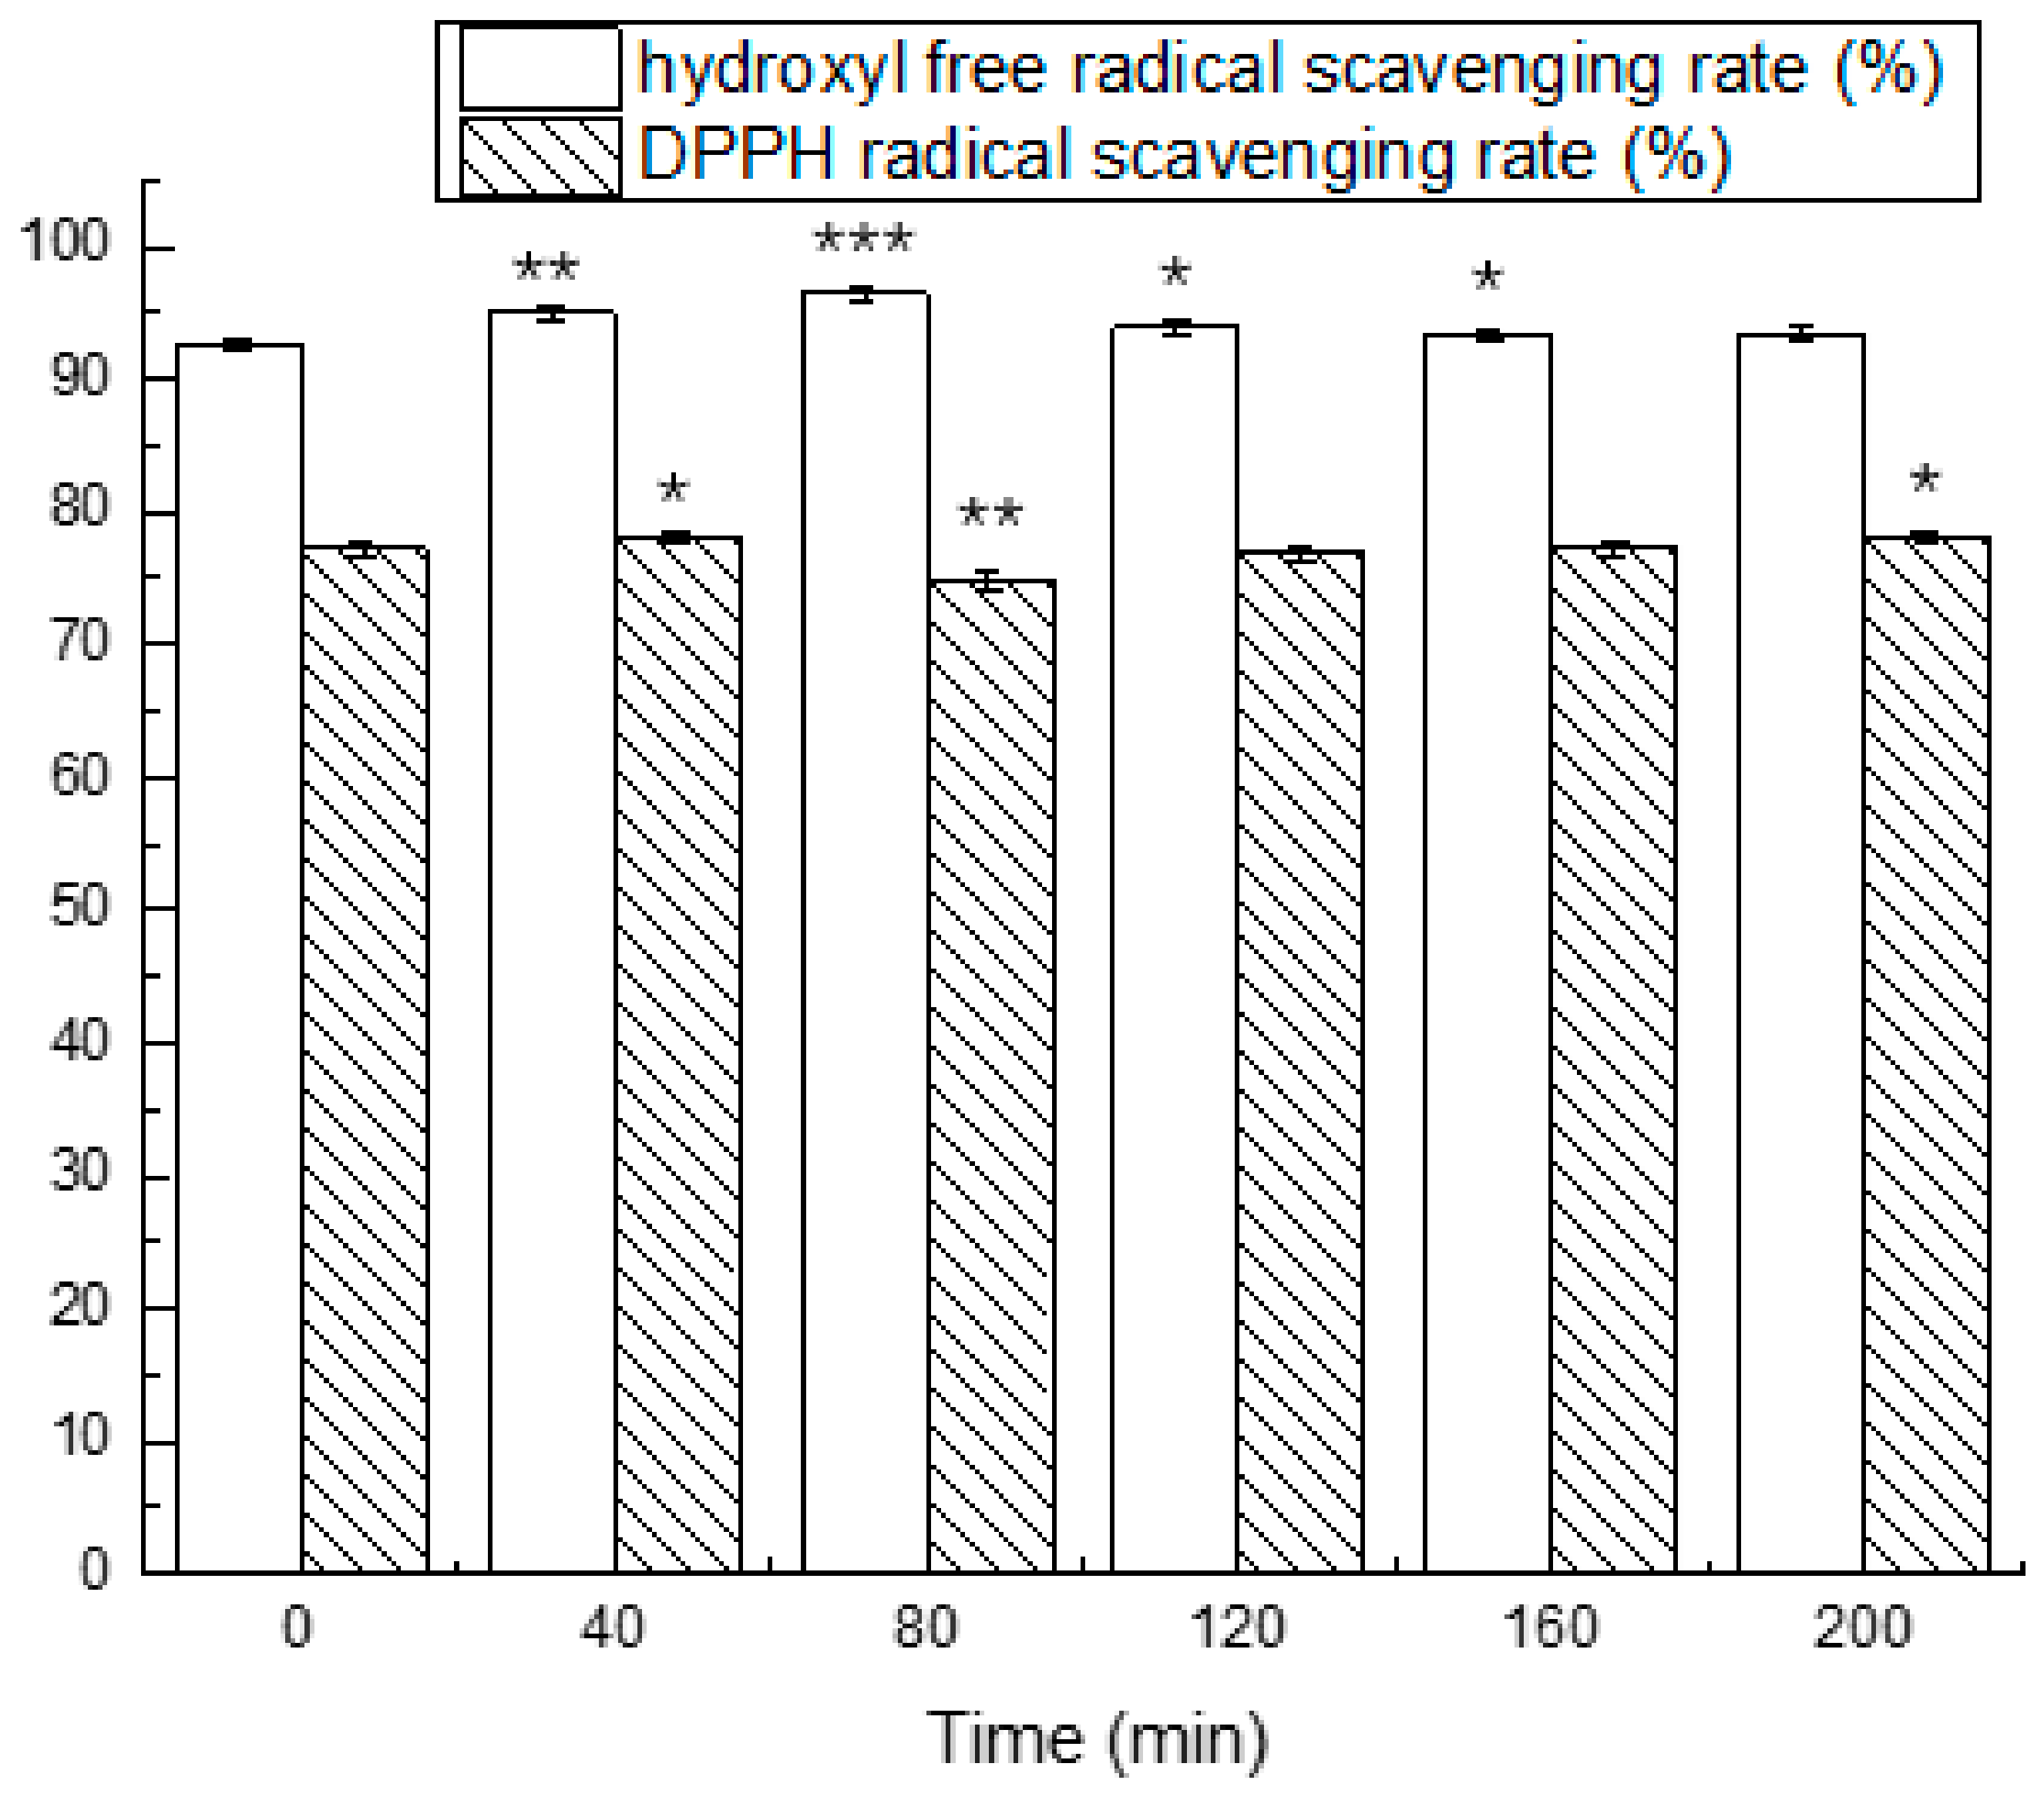
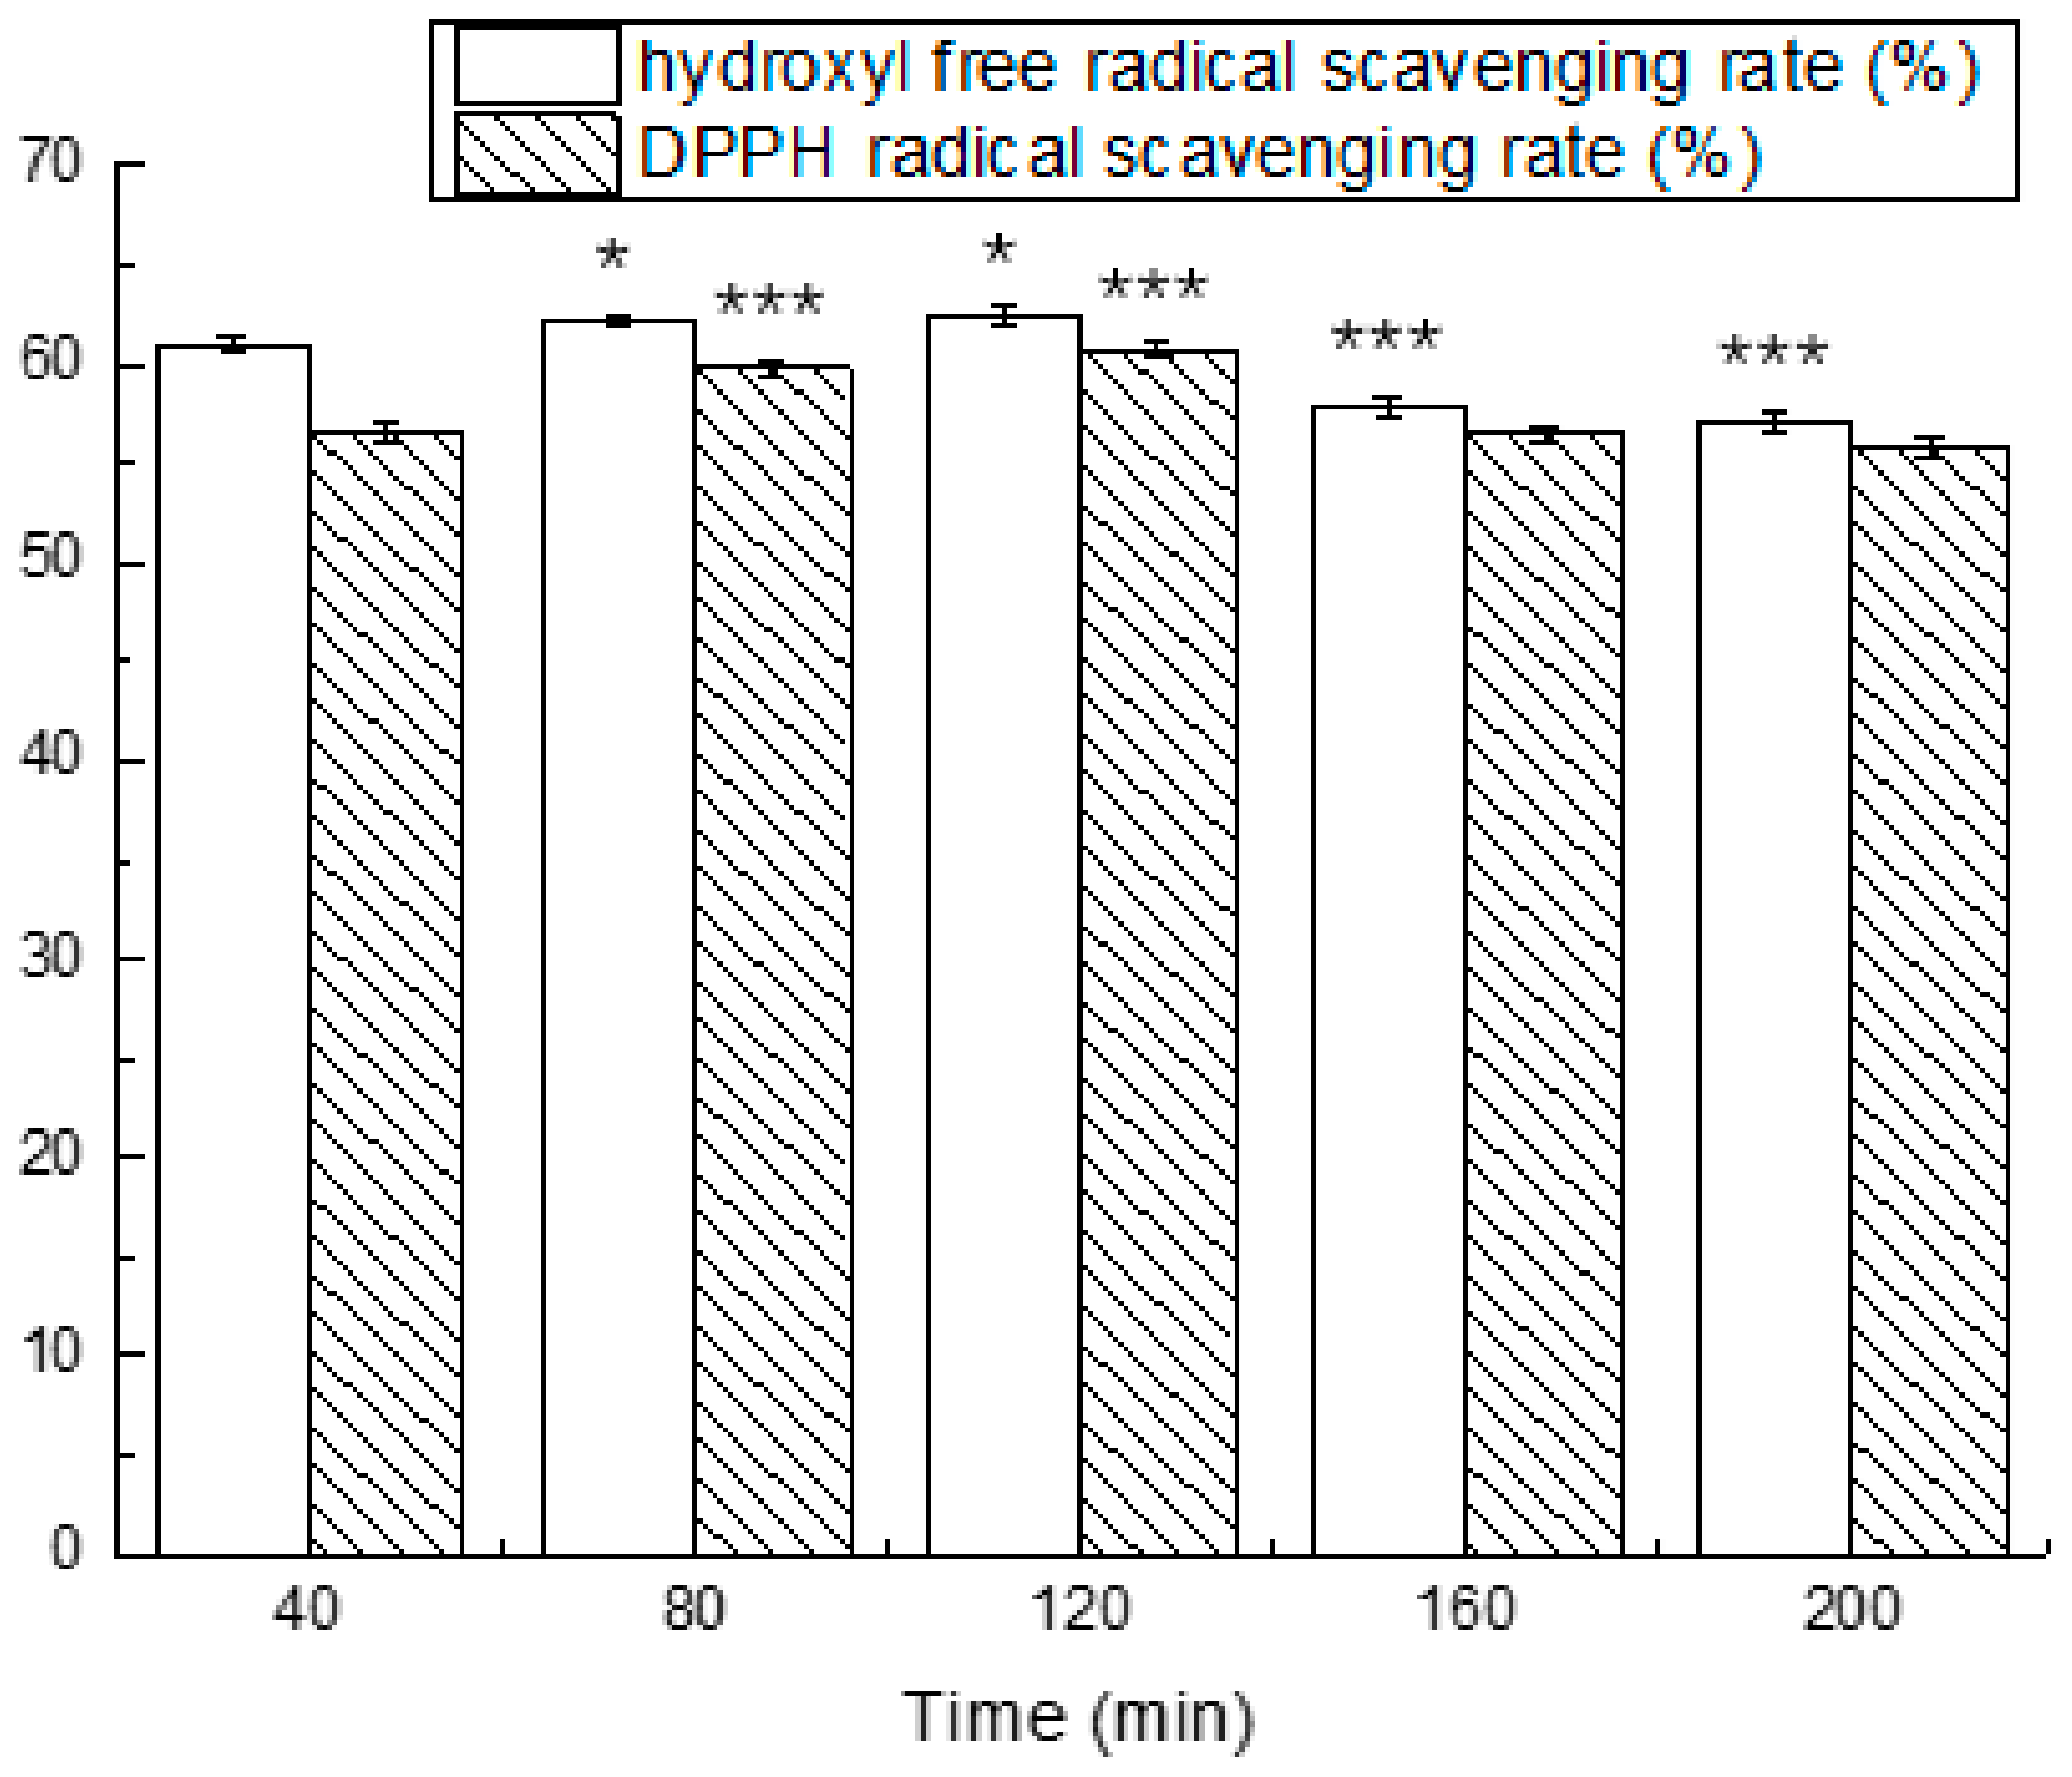
3.4. Simulated Gastrointestinal Digestion
4. Discussion
5. Conclusions
Author Contributions
Funding
Conflicts of Interest
References
- Zielińska, E.; Baraniak, B.; Karaś, M. Antioxidant and anti-inflammatory activities of hydrolysates and peptide fractions obtained by enzymatic hydrolysis of selected heat-treated edible insects. Nutrients 2017, 9, 970. [Google Scholar] [CrossRef] [PubMed]
- Nemzer, B.; Chang, T.; Xie, Z.; Pietrzkowski, Z.; Reyes, T.; Ou, B. Decrease of free radical concentrations in humans following consumption of a high antioxidant capacity natural product. Food Sci. Nutr. 2014, 2, 647–654. [Google Scholar] [CrossRef] [PubMed]
- Dröge, W. Free radicals in the physiological control of cell function. Physiol. Rev. 2002, 82, 47–95. [Google Scholar] [CrossRef] [PubMed]
- Girgih, A.T.; Alashi, A.M.; He, R.; Malomo, S.A.; Raj, P.; Netticadan, T.; Aluko, R.E. A novel hemp seed meal protein hydrolysate reduces oxidative stress factors in spontaneously hypertensive rats. Nutrients 2014, 6, 5652–5666. [Google Scholar] [CrossRef] [PubMed]
- Chamila, N.; Wu, J. Hen egg as an antioxidant food commodity: A review. Nutrients 2015, 7, 8274–8293. [Google Scholar] [CrossRef]
- Halliwell, B.; Whiteman, M. Measuring reactive species and oxidative damage in vivo and in cell culture: How should you do it and what do the results mean? Brit. J. Pharmacol. 2004, 142, 231–255. [Google Scholar] [CrossRef] [PubMed]
- Ianniello, R.G.; Ricciardi, A.; Parente, E.; Tramutola, A.; Reale, A.; Zotta, T. Aeration and supplementation with heme and menaquinone affect survival to stresses and antioxidant capability of lactobacillus casei strains. LWT-Food Sci. Technol. 2015, 60, 817–824. [Google Scholar] [CrossRef]
- Ahmed, A.S.; El-Bassiony, T.; Elmalt, L.M.; Ibrahim, H.R. Identification of potent antioxidant bioactive peptides from goat milk proteins. Food Res. Int. 2015, 74, 80–88. [Google Scholar] [CrossRef] [PubMed]
- Belewu, M.A.; Aiyegbusi, O.F. Comparison of the mineral content and apparent biological value of milk from human, cow and goat. J. Food Technol. Afr. 2002, 7, 9–11. [Google Scholar] [CrossRef]
- Park, Y.W.; Juárez, M.; Ramos, M.; Haenlein, G.F.W. Physico-chemical characteristics of goat and sheep milk. Small Rumin. Res. 2007, 68, 88–113. [Google Scholar] [CrossRef]
- Lópezaliaga, I.; Díazcastro, J.; Ma, J.M.A.; Barrionuevo, M.; Campos, M.S. A review of the nutritional and health aspects of goat milk in cases of intestinal resection. Dairy Sci. Technol. 2010, 90, 611–622. [Google Scholar] [CrossRef]
- Haenlein, G.F.W. Goat milk in human nutrition. Small Rumin. Res. 2004, 51, 155–163. [Google Scholar] [CrossRef]
- Sommerer, N.; Salles, C.; Promé, D.; Promé, J.C.; Quéré, J.L.L. Isolation of oligopeptides from the water-soluble extract of goat cheese and their identification by mass spectrometry. J. Agric. Food Chem. 2001, 49, 402–408. [Google Scholar] [CrossRef] [PubMed]
- Li, Z.; Jiang, A.; Yue, T.; Wang, J.; Wang, Y.; Su, J. Purification and identification of five novel antioxidant peptides from goat milk casein hydrolysates. J. Dairy Sci. 2013, 96, 4242–4251. [Google Scholar] [CrossRef] [PubMed]
- Gupta, A.; Mann, B.; Kumar, R.; Sangwan, R.B. Identification of antioxidant peptides in cheddar cheese made with adjunct culture Lactobacillus casei ssp. casei 300. Milchwiss. Milk Sci. Int. 2010, 65, 396–399. [Google Scholar]
- Kong, B.H.; Xiong, Y.L. Antioxidant activity of zein hydrolysates in a liposome system and the possible mode of action. Agric. Food Chem. 2006, 54, 6059–6068. [Google Scholar] [CrossRef] [PubMed]
- Kazuko, S.; Kuniko, F.; Keiko, Y.; Takashi, N. Antioxidative properties of xanthan on the autoxidation of soybean oil in cyclodextrin emulsion. J. Agric. Food Chem. 1992, 40, 945–948. [Google Scholar] [CrossRef]
- Cruzhuerta, E.; Garcíanebot, M.J.; Miralles, B.; Recio, I.; Amigo, L. Caseinophosphopeptides released after tryptic hydrolysis versus simulated gastrointestinal digestion of a casein-derived by-product. Food Chem. 2015, 168, 648–655. [Google Scholar] [CrossRef] [PubMed]
- Parrella, A.; Caterino, E.; Cangiano, M.; Criscuolo, E.; Russo, C.; Lavorgna, M.; Isidori, M. Antioxidant properties of different milk fermented with lactic acid bacteria and yeast. Int. J. Food Sci. Tech. 2012, 47, 2493–2502. [Google Scholar] [CrossRef]
- Zhang, S.; Liu, L.; Su, Y.; Li, H.; Sun, Q.; Liang, X.; Lv, J. Antioxidative activity of lactic acid bacteria in yogurt. Afr. J. Microbiol. Res. 2011, 5, 5194–5201. [Google Scholar] [CrossRef]
- Jain, S.; Yadav, H.; Sinha, P.R. Antioxidant and cholesterol assimilation activities of selected lactobacilli and lactococci cultures. J. Dairy Res. 2009, 76, 385–391. [Google Scholar] [CrossRef] [PubMed]
- Shu, G.; Wang, Z.; Chen, L.; Zhang, Q.; Xin, N. Enzymolysis technology optimization for production of antioxidant peptides from goat milk casein. Acta Univ. Cibiniensis. 2017, 21, 51–60. [Google Scholar] [CrossRef]
- Song, X.Y.; Gao, Y.X.; Fang, Y. Optimization of antioxidant peptide production from goat placenta powder using RSM. Food Sci. Technol. 2008, 33, 237–241. [Google Scholar]
- Chen, H.; Kou, J.; Hu, M.; Shu, G. Optimization of nitrogen source for Bifidobacterium bifidum using response surface methodology. Acta Univ. Cibiniensis 2016, 20, 53–64. [Google Scholar] [CrossRef]
- Gonzalez-Gonzalez, C.R.; Tuohy, K.M.; Jauregi, P. Production of angiotensin-i-converting enzyme (ACE) inhibitory activity in milk fermented with probiotic strains: effects of calcium, pH and peptides on the ACE-inhibitory activity. Int. Dairy J. 2011, 21, 615–622. [Google Scholar] [CrossRef]
- Shi, X.; Chen, H.; Meng, J.; Xin, N.; Ji, Z. Application of Plackett-Burman design in screening ACE inhibitory peptides-producing conditions and media for Lactobacillus bulgaricus LB6. Acta Sci. Pol. Technol. Aliment. 2018, in press. [Google Scholar] [CrossRef] [PubMed]
- Gu, F.L.; Jin, M.K.; Abbas, S.; Zhang, X.M.; Xia, S.Q.; Chen, Z.X. Structure and antioxidant activity of high molecular weight maillard reaction products from casein-glucose. Food Chem. 2010, 120, 505–511. [Google Scholar] [CrossRef]
- Oh, N.S.; Joung, J.Y.; Lee, J.Y.; Kim, Y.; Kim, S.H. Enhancement of antioxidative and intestinal anti-inflammatory activities of glycated milk casein after fermentation with Lactobacillus casei 4B15. J. Agric. Food Chem. 2017, 65, 4744–4754. [Google Scholar] [CrossRef] [PubMed]
- Skrzypczak, K.W.; Gustaw, W.Z.; Jabłońska-Ryś, E.D.; Michalak-Majewska, M.; Sławińska, A.; Radzki, W.P.; Gustaw, K.M.; Waśko, A.D. Antioxidative properties of milk protein preparations fermented by polish strains of Lactobacillus helveticus. Acta Sci. Pol. Technol. Aliment. 2017, 16, 199–207. [Google Scholar] [CrossRef] [PubMed]
- Miguel, M.; Contreras, M.M.; Recio, I.; Aleixandre, A. ACE-inhibitory and antihypertensive properties of a bovine casein hydrolysate. Food Chem. 2009, 112, 211–214. [Google Scholar] [CrossRef]
- Leclerc, P.L.; Gauthier, S.F.; Bachelard, H.; Santure, M.; Roy, D. Antihypertensive activity of casein-enriched milk fermented by Lactobacillus helveticus. Int. Dairy J. 2002, 12, 995–1004. [Google Scholar] [CrossRef]
- You, L.; Zhao, M.; Regenstein, J.M.; Ren, J. Changes in the antioxidant activity of loach (Misgurnus anguillicaudatus) protein hydrolysates during a simulated gastrointestinal digestion. Food Chem. 2010, 120, 810–816. [Google Scholar] [CrossRef]


| Factors | X1 | X5 | X6 | X7 | X8 | X9 | X10 |
|---|---|---|---|---|---|---|---|
| Variables | Casein | Casein Peptone | Glucose | Soybean Peptone | Inulin | Calcium Lactate | Cysteine |
| (%) | (%) | (%) | (%) | (%) | (%) | (%) | |
| 1 | 0.25 | 0.875 | 0.75 | 0.625 | 0.5 | 0.625 | 1.25 |
| −1 | 0.2 | 0.7 | 0.6 | 0.5 | 0.4 | 0.5 | 1 |
| Factors | A: Calcium Lactate (%) | B: Glucose (%) | C: Casein Peptone (%) |
|---|---|---|---|
| −1 | 0.9 | 0.1 | 0.2 |
| 0 | 1.0 | 0.2 | 0.3 |
| 1 | 1.1 | 0.3 | 0.4 |
| Factors | X1 | X2 | X3 | X4 | X5 | X6 | X7 | X8 | X9 | X10 | Y1 | Y2 |
|---|---|---|---|---|---|---|---|---|---|---|---|---|
| 1 | 1 | −1 | 1 | −1 | −1 | −1 | 1 | 1 | 1 | −1 | 77.66 | 55.82 |
| 2 | 1 | 1 | −1 | 1 | −1 | −1 | −1 | 1 | 1 | 1 | 83.34 | 62.79 |
| 3 | −1 | 1 | 1 | −1 | 1 | −1 | −1 | −1 | 1 | 1 | 76.26 | 50.63 |
| 4 | 1 | −1 | 1 | −1 | −1 | 1 | −1 | −1 | −1 | 1 | 71.91 | 50.02 |
| 5 | 1 | 1 | −1 | 1 | 1 | −1 | 1 | −1 | −1 | −1 | 71.91 | 50.02 |
| 6 | 1 | 1 | 1 | 1 | 1 | 1 | −1 | 1 | −1 | −1 | 76.36 | 50.82 |
| 7 | −1 | 1 | 1 | −1 | −1 | 1 | 1 | −1 | 1 | −1 | 76.66 | 55.12 |
| 8 | −1 | −1 | 1 | 1 | 1 | −1 | 1 | 1 | −1 | 1 | 75.61 | 48.96 |
| 9 | −1 | −1 | −1 | 1 | 1 | 1 | −1 | 1 | 1 | −1 | 76.11 | 50.17 |
| 10 | 1 | −1 | −1 | −1 | 1 | 1 | 1 | −1 | 1 | 1 | 75.86 | 49.37 |
| 11 | −1 | 1 | −1 | −1 | −1 | 1 | 1 | 1 | −1 | 1 | 75.02 | 48.29 |
| 12 | −1 | −1 | −1 | −1 | −1 | −1 | −1 | −1 | −1 | −1 | 76.51 | 51.77 |
| Step | Calcium Lactate (%) | Glucose (%) | Casein Peptone (%) | Y1 (%) | Y2 (%) |
|---|---|---|---|---|---|
| 1 | 0.6 | 0.6 | 0.7 | 79.65 ± 0.57% | 47.43 ± 0.39% |
| 2 | 0.7 | 0.5 | 0.6 | 80.55 ± 0.61% | 49.72 ± 0.48% |
| 3 | 0.8 | 0.4 | 0.5 | 79.69 ± 0.51% | 50.14 ± 0.36% |
| 4 | 0.9 | 0.3 | 0.4 | 80.78 ± 0.44% | 61.24 ± 0.35% |
| 5 | 1.0 | 0.2 | 0.3 | 85.43 ± 0.32% | 64.56 ± 0.62% |
| 6 | 1.1 | 0.1 | 0.2 | 81.48 ± 0.49% | 60.31 ± 0.37% |
| Runs | A | B | C | Y1 (%) | Y2 (%) | ||||
|---|---|---|---|---|---|---|---|---|---|
| Actual Value | Predicted Value | Residual | Actual Value | Predicted Value | Residual | ||||
| 1 | 0 | 1 | −1 | 86.84 | 86.67 | 0.07 | 52.92 | 51.68 | 1.24 |
| 2 | 1 | 0 | −1 | 85.42 | 85.00 | −0.42 | 59.59 | 59.74 | −0.15 |
| 3 | 0 | 0 | 0 | 87.86 | 88.14 | −0.28 | 64.51 | 63.89 | −0.62 |
| 4 | 1 | 1 | 0 | 83.56 | 84.15 | −0.59 | 51.9 | 52.99 | −1.09 |
| 5 | 1 | 0 | 1 | 78.23 | 78.52 | −0.29 | 50.08 | 49.91 | 0.17 |
| 6 | −1 | −1 | 0 | 85.72 | 85.14 | 0.58 | 55.72 | 54.63 | 1.09 |
| 7 | −1 | 1 | 0 | 85.38 | 85.83 | −0.45 | 58.3 | 59.37 | −1.07 |
| 8 | 1 | −1 | 0 | 82.12 | 81.67 | 0.45 | 64.92 | 63.86 | 1.06 |
| 9 | 0 | 0 | 0 | 87.86 | 88.14 | 0.66 | 63.67 | 63.89 | −0.22 |
| 10 | 0 | 0 | 0 | 88.69 | 88.14 | 0.55 | 63.5 | 63.89 | −0.39 |
| 11 | −1 | 0 | 1 | 84.92 | 85.34 | −0.42 | 54.71 | 54.57 | 0.14 |
| 12 | 0 | 1 | 1 | 85.73 | 84.86 | 0.87 | 47.12 | 46.20 | 0.95 |
| 13 | 0 | −1 | −1 | 84.64 | 85.51 | −0.87 | 52.08 | 53.00 | −0.92 |
| 14 | 0 | −1 | 1 | 82.69 | 82.86 | −0.17 | 49.76 | 51.00 | −1.24 |
| 15 | −1 | 0 | −1 | 83.61 | 83.33 | 0.28 | 52.04 | 52.22 | −0.18 |
| Source | Y1 | Y2 | |||||
|---|---|---|---|---|---|---|---|
| DF | MS | F | Pr > F | MS | F | Pr > F | |
| Model | 9 | 10.50 | 14.45 | 0.0045 ** | 54.11 | 26.73 | 0.0010 ** |
| A | 1 | 13.26 | 18.26 | 0.0079 ** | 4.09 | 2.02 | 0.2145 |
| B | 1 | 5.02 | 6.92 | 0.0465 * | 18.73 | 9.25 | 0.0287 * |
| C | 1 | 9.99 | 13.75 | 0.0139 * | 27.98 | 13.82 | 0.0138 * |
| AB | 1 | 0.79 | 1.09 | 0.3442 | 60.84 | 30.05 | 0.0028 ** |
| AC | 1 | 18.06 | 24.86 | 0.0042 ** | 37.09 | 18.32 | 0.0079 ** |
| BC | 1 | 0.18 | 0.24 | 0.6430 | 3.03 | 1.50 | 0.2759 |
| A2 | 1 | 31.82 | 43.81 | 0.0012 ** | 5.99 | 2.96 | 0.1459 |
| B2 | 1 | 3.74 | 5.14 | 0.0727 | 88.98 | 43.95 | 0.0012 ** |
| C2 | 1 | 17.16 | 23.62 | 0.0046 ** | 267.66 | 132.21 | <0.0001 *** |
| Residual | 5 | 0.73 | 2.02 | ||||
| Lack of fit | 3 | 1.06 | 4.61 | 0.1835 | 3.18 | 10.87 | 0.0854 |
| Pure error | 2 | 0.23 | 0.29 | ||||
| Cor Total | 14 | ||||||
© 2018 by the authors. Licensee MDPI, Basel, Switzerland. This article is an open access article distributed under the terms and conditions of the Creative Commons Attribution (CC BY) license (http://creativecommons.org/licenses/by/4.0/).
Share and Cite
Shu, G.; Shi, X.; Chen, L.; Kou, J.; Meng, J.; Chen, H. Antioxidant Peptides from Goat Milk Fermented by Lactobacillus casei L61: Preparation, Optimization, and Stability Evaluation in Simulated Gastrointestinal Fluid. Nutrients 2018, 10, 797. https://doi.org/10.3390/nu10060797
Shu G, Shi X, Chen L, Kou J, Meng J, Chen H. Antioxidant Peptides from Goat Milk Fermented by Lactobacillus casei L61: Preparation, Optimization, and Stability Evaluation in Simulated Gastrointestinal Fluid. Nutrients. 2018; 10(6):797. https://doi.org/10.3390/nu10060797
Chicago/Turabian StyleShu, Guowei, Xiaoyu Shi, Li Chen, Jianbo Kou, Jiangpeng Meng, and He Chen. 2018. "Antioxidant Peptides from Goat Milk Fermented by Lactobacillus casei L61: Preparation, Optimization, and Stability Evaluation in Simulated Gastrointestinal Fluid" Nutrients 10, no. 6: 797. https://doi.org/10.3390/nu10060797
APA StyleShu, G., Shi, X., Chen, L., Kou, J., Meng, J., & Chen, H. (2018). Antioxidant Peptides from Goat Milk Fermented by Lactobacillus casei L61: Preparation, Optimization, and Stability Evaluation in Simulated Gastrointestinal Fluid. Nutrients, 10(6), 797. https://doi.org/10.3390/nu10060797